Article

Enhancing Sustainability Through Quality Controlled Energy Data: The Horizon 2020 EnerMaps Project

by
Simon Pezzutto
,
Dario Bottino-Leone
* and
Eric John Wilczynski
Institute for Renewable Energy, European Academy of Bolzano (EURAC Research), Viale Druso 1, 39100 Bolzano, Italy
*
Author to whom correspondence should be addressed.
Sustainability 2025, 17(17), 7684; https://doi.org/10.3390/su17177684
Submission received: 20 June 2025 / Revised: 23 July 2025 / Accepted: 5 August 2025 / Published: 26 August 2025

Abstract

The Horizon 2020 EnerMaps project addresses the fragmentation and variable reliability of European energy datasets by developing a reproducible quality control (QC) framework aligned with FAIR principles. This research supports sustainability goals by enabling better decision making in energy management, resource optimization, and sustainable policy development. This study applies this framework to an initial inventory of 50 spatially referenced energy datasets, classifying them into three assessment levels and subjecting each level to progressively deeper checks: expert consultation, metadata verification against a customized “DataCite/schema.org” schema, documentation review, completeness analysis, consistency testing via simple linear regressions, comparative descriptive statistics, and community feedback preparation. The results show that all datasets are findable and accessible, yet critical FAIR attributes remain weak: 68% lack explicit licenses and 96% omit terms-of-use statements; methodology descriptions are present in 77% of cases, while quantitative accuracy information appears in only 43%. Completeness screening reveals that more than half of the datasets exhibit over 20% missing values in one or more key dimensions. Consistency analyses nevertheless indicate statistically significant correlations (p < 0.05) for the majority of paired comparisons, supporting basic reliability. By improving the FAIRness (Findable, Accessible, Interoperable, Reusable) of energy data, this study directly contributes to more effective sustainability assessments and interventions. The proposed QC workflow therefore provides a scalable route to improve the transparency, comparability, and reusability of heterogeneous energy data, and its adoption could accelerate open energy modelling and policy analysis across Europe.

1. Introduction

The energy research community often relies on open data to perform analyses in fields such as academia, business, and the public sector [1]. Data being open and freely available to everyone is important, because it improves the quality of science, leads to a more effective collaboration, increases productivity, and fosters public engagement in scientific issues [2]. However, data openness alone does not guarantee data usability. In many cases, the availability of detailed methodological documentation enhances the transparency and reliability of datasets, both for measured data and for datasets derived from simulation studies [3]. Therefore, it is essential that more data is released as open and that this open data meets a certain quality so that its users can confidently use, reuse, and trust the data. For this reason, the FAIR Guiding Principles were introduced [4]. The FAIR Guiding Principles are a set of principles developed to improve data standards by making data more findable, accessible, interoperable, and reusable (FAIR) for humans and machines. Findable in this context means that data should have unique and persistent identifiers, be described with rich metadata, and be registered or indexed in a searchable resource. Accessibility implies data being retrievable by their identifiers using standard protocols and having clear and accessible information about their access conditions and licenses. Data being interoperable includes using formal, accessible, shared, and broadly applicable languages, vocabularies, and standards and providing qualified references to other data and metadata. Reusing data requires them to have clear and accurate provenance, meeting domain-relevant community standards and having sufficient information for reuse [5]. The FAIR Guiding Principles have shown how much data reuse and scientific progress can be affected by low-quality data curation [6]. Without FAIRifying data, the existing research data would be a wasted gold mine, also regarding the application of artificial intelligence (AI) methods [7]. Consequently, it is crucial to not only make sure that future data are FAIR but also to try to FAIRify already existing data wherever possible. Assessing data, performing different types of quality control, changing and improving (meta)data, and harmonizing data to be able to bring it together and merging it in databases is essential for any database, regardless of the datatype or subject area. Gotzens et al. [8] (2019) developed an open-source toolset called “power plant matching” (PPM), which standardizes and combines different power plant datasets into a final database and checks their quality, including plausibility checks and comparison with statistics and a proprietary database. Similarly, as part of the Horizon 2020 (H2020) Hotmaps project, data for the space heating (SH) and domestic hot water (DHW) market for the European Union (EU) was collected and elaborated to develop an open-source toolbox. In the course of this reliability assessment, plausibility checks and statistical checks like calculating the standard deviation and coefficient of variation for different datasets have been carried out [9]. Moreover, in the development of the Buildings Performance Database (BPD), the primary focus of effort was on standardizing and cleaning data. This process involved quality control measures, including statistical checks, inconsistency checks, and manual inspections [10]. Very similar approaches to the quality control of data have developed in different sectors. In specific cases, a part of the quality control consists of manual or automatic checks for outliers and other inconsistencies. For example, the quality control of the CARINA (CARbon IN the Atlantic) database [11] was performed in two steps: the primary and the secondary quality control. During the primary quality control, outliers and obvious errors were identified, while the secondary quality control mainly consisted in a crossover analysis and also a multiple regression analysis [12]. Furthermore, it is a quite straightforward but useful instrument to include experts in the data quality control process, especially when performing the previously mentioned process of finding and dealing with outliers and other inconsistencies. Forstinger et al. (2021) [13] included visual checks of experts in their harmonized data quality control of solar radiation ground datasets, concluding that this quality control approach can improve the quality of the datasets. In addition, having a reference dataset available to compare it to the data to be quality controlled can be helpful, especially when implementing an accuracy or consistency analysis of the data: Gao et al. (2020) [14] performed a consistency analysis on different global land cover products, comparing land cover types and spatial distributions among them, and an accuracy assessment using field observations and harmonizing data to calculate accuracy measures, including comparisons with the LUCAS (Land Use/Cover Area frame statistical Survey) dataset [15] as a reference. Also, Tsendbazar et al. [16] (2015), before integrating different global land cover maps and reference datasets, to obtain an improved land cover map, performed a spatial accuracy assessment of the land cover maps including modelling the spatial correspondence between the latter and the reference datasets. Coming back to the already mentioned importance of FAIRifying data, it is also important to look into how to implement it through (meta)data quality control. To enable FAIR data, the Australian National Computational Infrastructure (NCI) developed a data quality strategy for high-performance data analysis, which contains four components: consistency of data structure, quality control verifying the adherence with recognized community standards, benchmarking performance, and quality assurance applying accessibility and functionality tests [17]. Not to be forgotten, however, is also the relevance of the FAIR Principles in connection with metadata. Wierling et al. [18] (2021) reviewed and tested metadata standards for low-carbon energy research and concluded that FAIR and high-quality metadata standards are much needed in the energy domain to facilitate the sharing and reusing of data. This shows that metadata quality control and assurance and eventually the development of a metadata quality strategy should not be neglected. Kubler et al. [19] (2018) developed an open data portal quality framework for comparing the metadata quality in open data portals using the Analytic Hierarchy Process (AHP). This approach makes it possible to assess and rank open data portals according to their metadata quality and individual preferences. They used five metadata quality dimensions according to the DCAT (Data Catalog Vocabulary) [20] metadata standard by Neumaier et al. (2016) [21]: existence, conformance, retrievability, accuracy, and open data. The purpose of this paper is to provide a framework for establishing a quality control process for data to answer the following questions:
  • How can energy data be made more FAIR?
  • How can energy data be assessed for its overall quality in terms of FAIR principles?
This paper provides insight into both questions by applying a proposed framework to a case study. The investigation identified the various ways data can be more “FAIR”, for example, through increased use of standard procedures and improved transparency in documentation. The steps are as follows: (i) designing a reproducible multi-step QC framework aligned with FAIR principles; (ii) applying the framework to a diverse dataset inventory; and (iii) deriving actionable insights and gaps from the results.

2. Materials and Methods

The following section details the materials and methods used in this paper. The steps taken to carry out the quality control are as follows:
  • Establish a standard for high-quality data;
  • Consultation with external experts;
  • Documentation review;
  • Consistency analysis;
  • Statistical comparative assessment;
  • Community feedback.

2.1. Case Study: EnerMaps

2.1.1. Project

EnerMaps is a H2020 Coordination and Support Action (CSA) project that focuses on energy data management. Due to its geographically specific nature, the energy data is collected and provided by different governments and projects from different countries. This data in particular suffers from fragmentation and being distributed in separate repositories, which can have adverse financial and temporal consequences for a project using this data. The goal of the EnerMaps project is to create a quality controlled database of essential energy data, which entails several datasets, presented in a user-friendly visualization tool, using standards and practices to improve the findability, accessibility, interoperability, and reusability (of FAIRness) of energy data.
One of the main outputs of the EnerMaps project is the EnerMaps Data Management Tool (EDMT). The EDMT is a web-based data visualization application that offers users of all types an accessible and intuitive graphical user interface (GUI), allowing them to browse, display, and analyze spatial energy data from their browser [22]. The EDMT contains an initial set of important quality checked datasets that underwent the quality control (QC) process described in this paper.

2.1.2. EnerMaps Initial Dataset Inventory

For EnerMaps, the purpose of the QC process was to assess the overall accuracy and quality of the initial dataset inventory, which is comprised of 50 energy-related datasets. To accomplish this, the selected datasets were classified into three groups, which determined their level of assessment. Figure 1 shows the distribution of the 50 assessed datasets across Levels 1, 2, and 3.
Table 1 shows the QC steps that each group level received. The dataset classification into three levels was based on the expected policy relevance, accessibility, and data richness, as well as on the degree of involvement of external stakeholders.
  • Level 1 datasets (n = 20) were selected through stakeholder consultation and included thematically relevant datasets that, however, lacked sufficient metadata or documentation to justify more in-depth checks.
  • Level 2 datasets (n = 20) were internally selected by the EnerMaps team based on criteria such as completeness, metadata structure, and their potential impact for policy or modelling.
  • Level 3 datasets (n = 10) were prioritized for their analytical depth, reliability, and relevance for comparative assessments. These underwent the most extensive QC, including statistical accuracy and consistency checks.
This stratification allowed us to balance the effort and depth of quality control while maximizing the diversity and representativeness of the dataset inventory. The QC process for Level 3 datasets differs from Level 2 datasets in that these datasets underwent an additional statistical analysis.

2.2. Research Steps

2.2.1. Establish a Standard for High-Quality Data

The fundamental step in data quality control is the establishment of a standard for high-quality data. This standard, which represents the expectation of what a high-quality dataset should entail, will act as a baseline when performing the subsequent steps in the quality control process. Standards may vary from project to project. However, the minimum level of quality of a dataset should be that the dataset
  • Follows FAIR principles;
  • Contains relevant metadata;
  • Includes transparent documentation describing dataset creation;
  • Meets QC indicators.
The QC indicators can be broken down into qualitative and quantitative categories. Below is a breakdown of the indicators by category:
Qualitative QC indicators
  • Quality and completeness of dataset metadata;
  • What’s behind the data? Quality of documentation describing the methodology and accuracy of the data.
Quantitative QC indicators
  • Dataset completeness;
  • Dataset consistency.
It is up to the individual researcher whether an assessment criteria threshold is designed and implemented to prevent datasets that do not meet a certain standard from being included in a project or platform. For the EnerMaps case study, only criteria directly related to FAIR data principles were required to be passed.

2.2.2. Consultation with External Experts

External experts in energy research were asked to provide feedback on the dataset selection and quality control processes by answering the following questionnaire:
  • How familiar are you with the selected datasets? (For example, have you used any of the datasets or do you know/trust any of the data providers?)
  • What are your thoughts on the selected datasets with regards to your own work? (For example, do they cover important areas of analysis in your field?)
  • Quality control proves a basis for assessing the accuracy, completeness, and consistency of the datasets. Do you feel more confident in the accuracy and quality of the selected datasets since they underwent this process?
  • If possible, please provide a user story from your perspective so that we may better identify ways EnerMaps can provide value to energy research and analysis.

2.2.3. Existence of Relevant Metadata

The metadata assessment involves checking the metadata associated with a dataset to ensure it meets the minimum standard set out in Section 2.2.1.
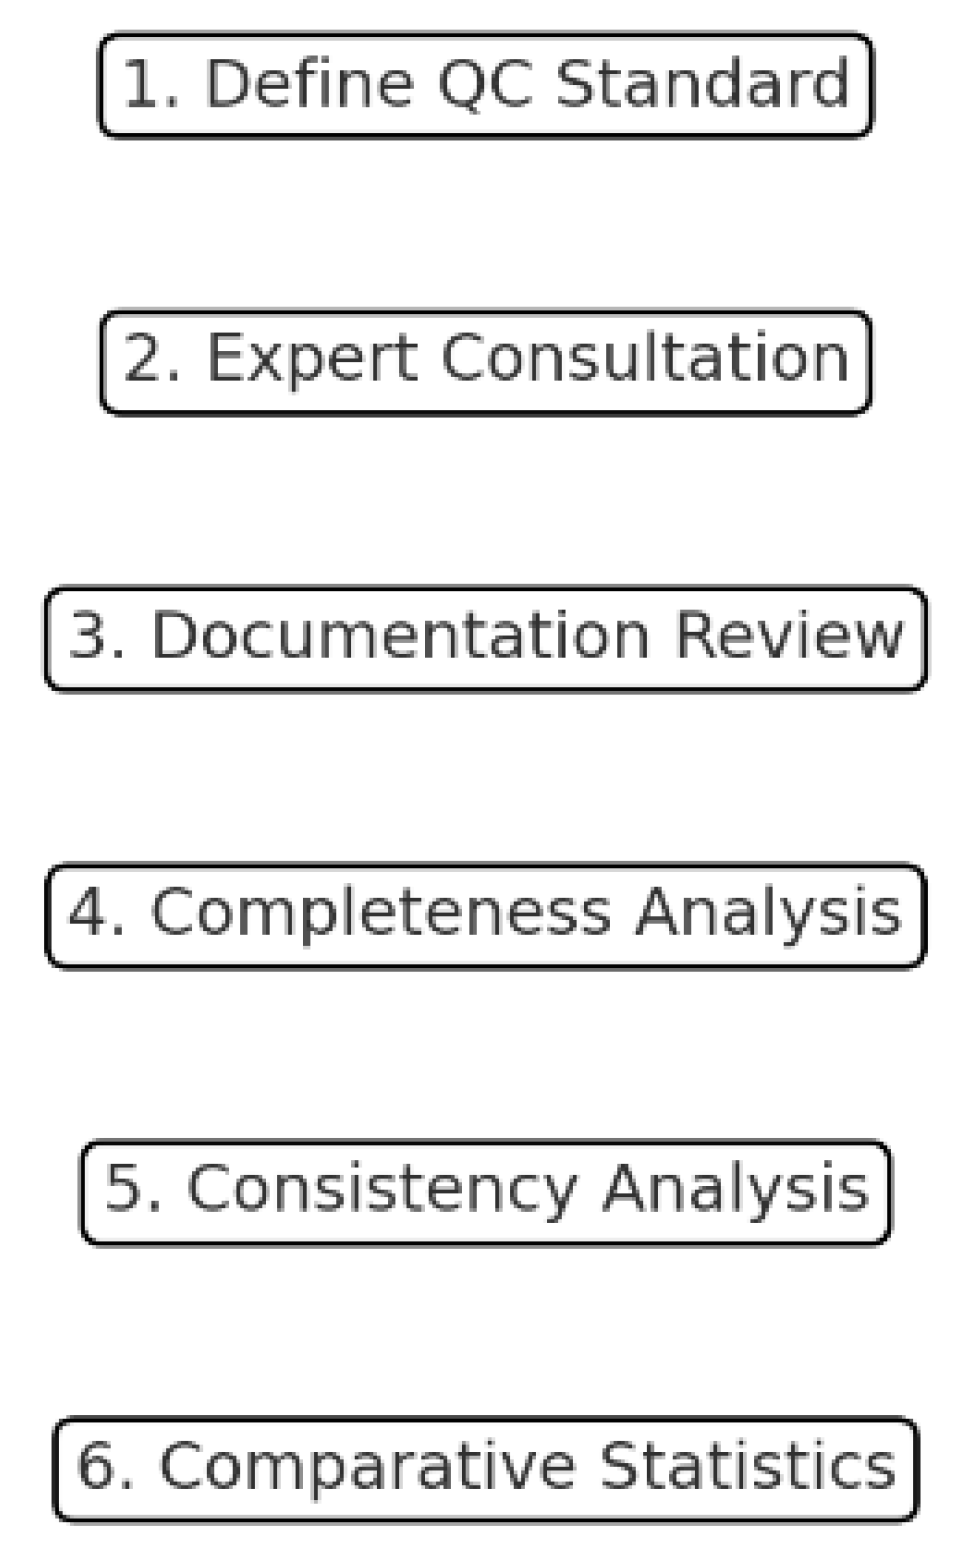
The main criterion for EnerMaps data was a focus on European spatial energy data. As such, the necessary metadata reflected these criteria. A list of the included metadata fields along with descriptions and defining each field can be found in Table 2. As per Table 1, the metadata check was performed for all 50 datasets. To ensure a standard metadata for the EnerMaps database, standard metadata schemas were consulted, principally those created by DataCite [23] and schema.org [24]. The fields gathered from these standards were modified after being further scrutinized with the expert review described in Section 2.1.2. For the EnerMaps case study, the list of metadata fields and descriptions is collected in Table 2, while the overview of the EnerMaps quality control (QC) workflow is resumed in Figure 2.

2.2.4. Documentation Review

Methodology check: The methodology check involved reviewing documentation that was associated with each dataset that might describe the methodology used to generate/construct the dataset. This documentation could take many forms, including an explanatory section in the metadata, a published article in a scientific journal, a document (e.g., PDF) bundled with the dataset, or an “About” page on the repository or project website where the dataset is found. The presence of a description of methodology indicates a level of transparency associated with high-quality data.
Statistical accuracy check: Similar to the methodology check, the statistical accuracy check also involved examining any available dataset documentation for possible notes from the data creators on the overall statistical accuracy of the data. If the dataset was statically assessed by the authors and described in documentation for the dataset, then the dataset achieves further approval for quality.

2.2.5. Completeness Analysis

The completeness analysis compares the amount of complete versus missing data within the dataset, thereby calculating the extent of missing data present in the dataset. To accomplish this, the dataset should be analyzed to check for the presence of blank or null values. For tabular datasets (including vector files with data tables), this can be performed by searching the data table for missing value indicators present throughout the dataset. For vector files (such as satellite imagery), missing data may take the form of image sensor malfunctions. The pixels for missing data in this case may appear black, the extent of which can be identified with several types of geographic information system (GIS) software (https://lab.idiap.ch/enermaps/) that can perform pixel classifications. For the EnerMaps case study, all datasets that underwent this step were tabular data files, allowing a standard spreadsheet software (i.e., Microsoft Excel) to be used. Cells were considered missing if they had blank/null values. In these cases, the cells had either “empty” cells (e.g., no data) or contained a value that was defined to be a representation for missing data (e.g., “na” or “nan” or a symbol indicating missing data such as a dash, colon, or the letter “m”). After counting the amount of missing data, the extent of the dataset that is missing can then be calculated as a percentage of the entire dataset. In addition to an analysis of the actual dataset, a documentation review should be conducted to find any indication of gaps in the dataset that were resolved by the data creators, and the method used in resolving these gaps should be noted.

2.2.6. Consistency Analysis

The goal of the consistency analysis was to test the internal coherence of the datasets by comparing them with related datasets that measure either the same variable or a strongly associated indicator. The selection of reference datasets was based on thematic alignment, the availability of shared spatial and temporal coverage, and recognized reliability (e.g., produced by authoritative institutions such as Eurostat or the World Bank). For each pair, the datasets were aligned along common reference units (such as countries and years), and a simple linear regression was used to evaluate the strength of their statistical relationship. The analysis was intended as a robustness check to identify inconsistencies, not as a causal model. A statistically significant correlation (p < 0.05) was interpreted as supportive evidence of data coherence, while weak or non-significant results flagged potential anomalies for further scrutiny. A summary of this approach is as follows:
  • A related dataset was selected that is linearly correlated with the dataset of interest.
  • In order to conduct a simple analysis, the datasets were subsetted to reduce data dimensionality so that both the dataset of interest and the related datasets were comparable. This usually took the form of subsetting a panel dataset to create a longitudinal or temporal subset (e.g., one year across multiple locations or one location over numerous years).
  • A simple linear regression was conducted with the dataset of interest set as the independent variable. The correlation between the variables (i.e., datasets) was then assessed by performing a hypothesis test (with 95% significance level) that tests whether or not a correlation exists. A significance level equal to less than 5% suggests certain evidence of correlation between the two subsetted datasets.
Since this analysis assumes the relationship between all assessed dataset pairs are linear, a result that supports this assumption would also suggest that the assessed datasets are consistent (at least in relation to an independent but related dataset).

2.2.7. Statistical Comparative Assessment

The statistical comparative assessment was conducted by comparing the summary statistics of three datasets. Analyses were performed using Python v3.9. A subset of each dataset was extracted so that a common variable, time (i.e., year), and location (i.e., countries) were assessed for all datasets. If necessary, unit conversions were made prior to processing/analyzing the data so that a common unit of measure was used. Community feedback was collected through the Kialo platform, a collaborative discussion tool where participants could vote, comment, and rank arguments on the clarity, accessibility, and perceived reliability of specific datasets. A total of 34 participants, including researchers, data practitioners, and policy analysts, contributed comments on 12 datasets. The EnerMaps team synthesized the most relevant feedback and used it to (i) identify unclear or missing metadata fields, (ii) revise dataset descriptions within the EnerMaps platform, and (iii) inform future metadata template improvements. While not all suggestions could be implemented directly—especially when original data sources were fixed—the process enriched the QC assessment with user-centered insights.

3. Results

3.1. Results for the Establishment of a Standard for High-Quality Data

Establishing a standard for high-quality data is important to both structure the priorities one has for their data and research and also to structure how they approach the ensuing quality control process.

3.2. Check of the Existence of Relevant Metadata

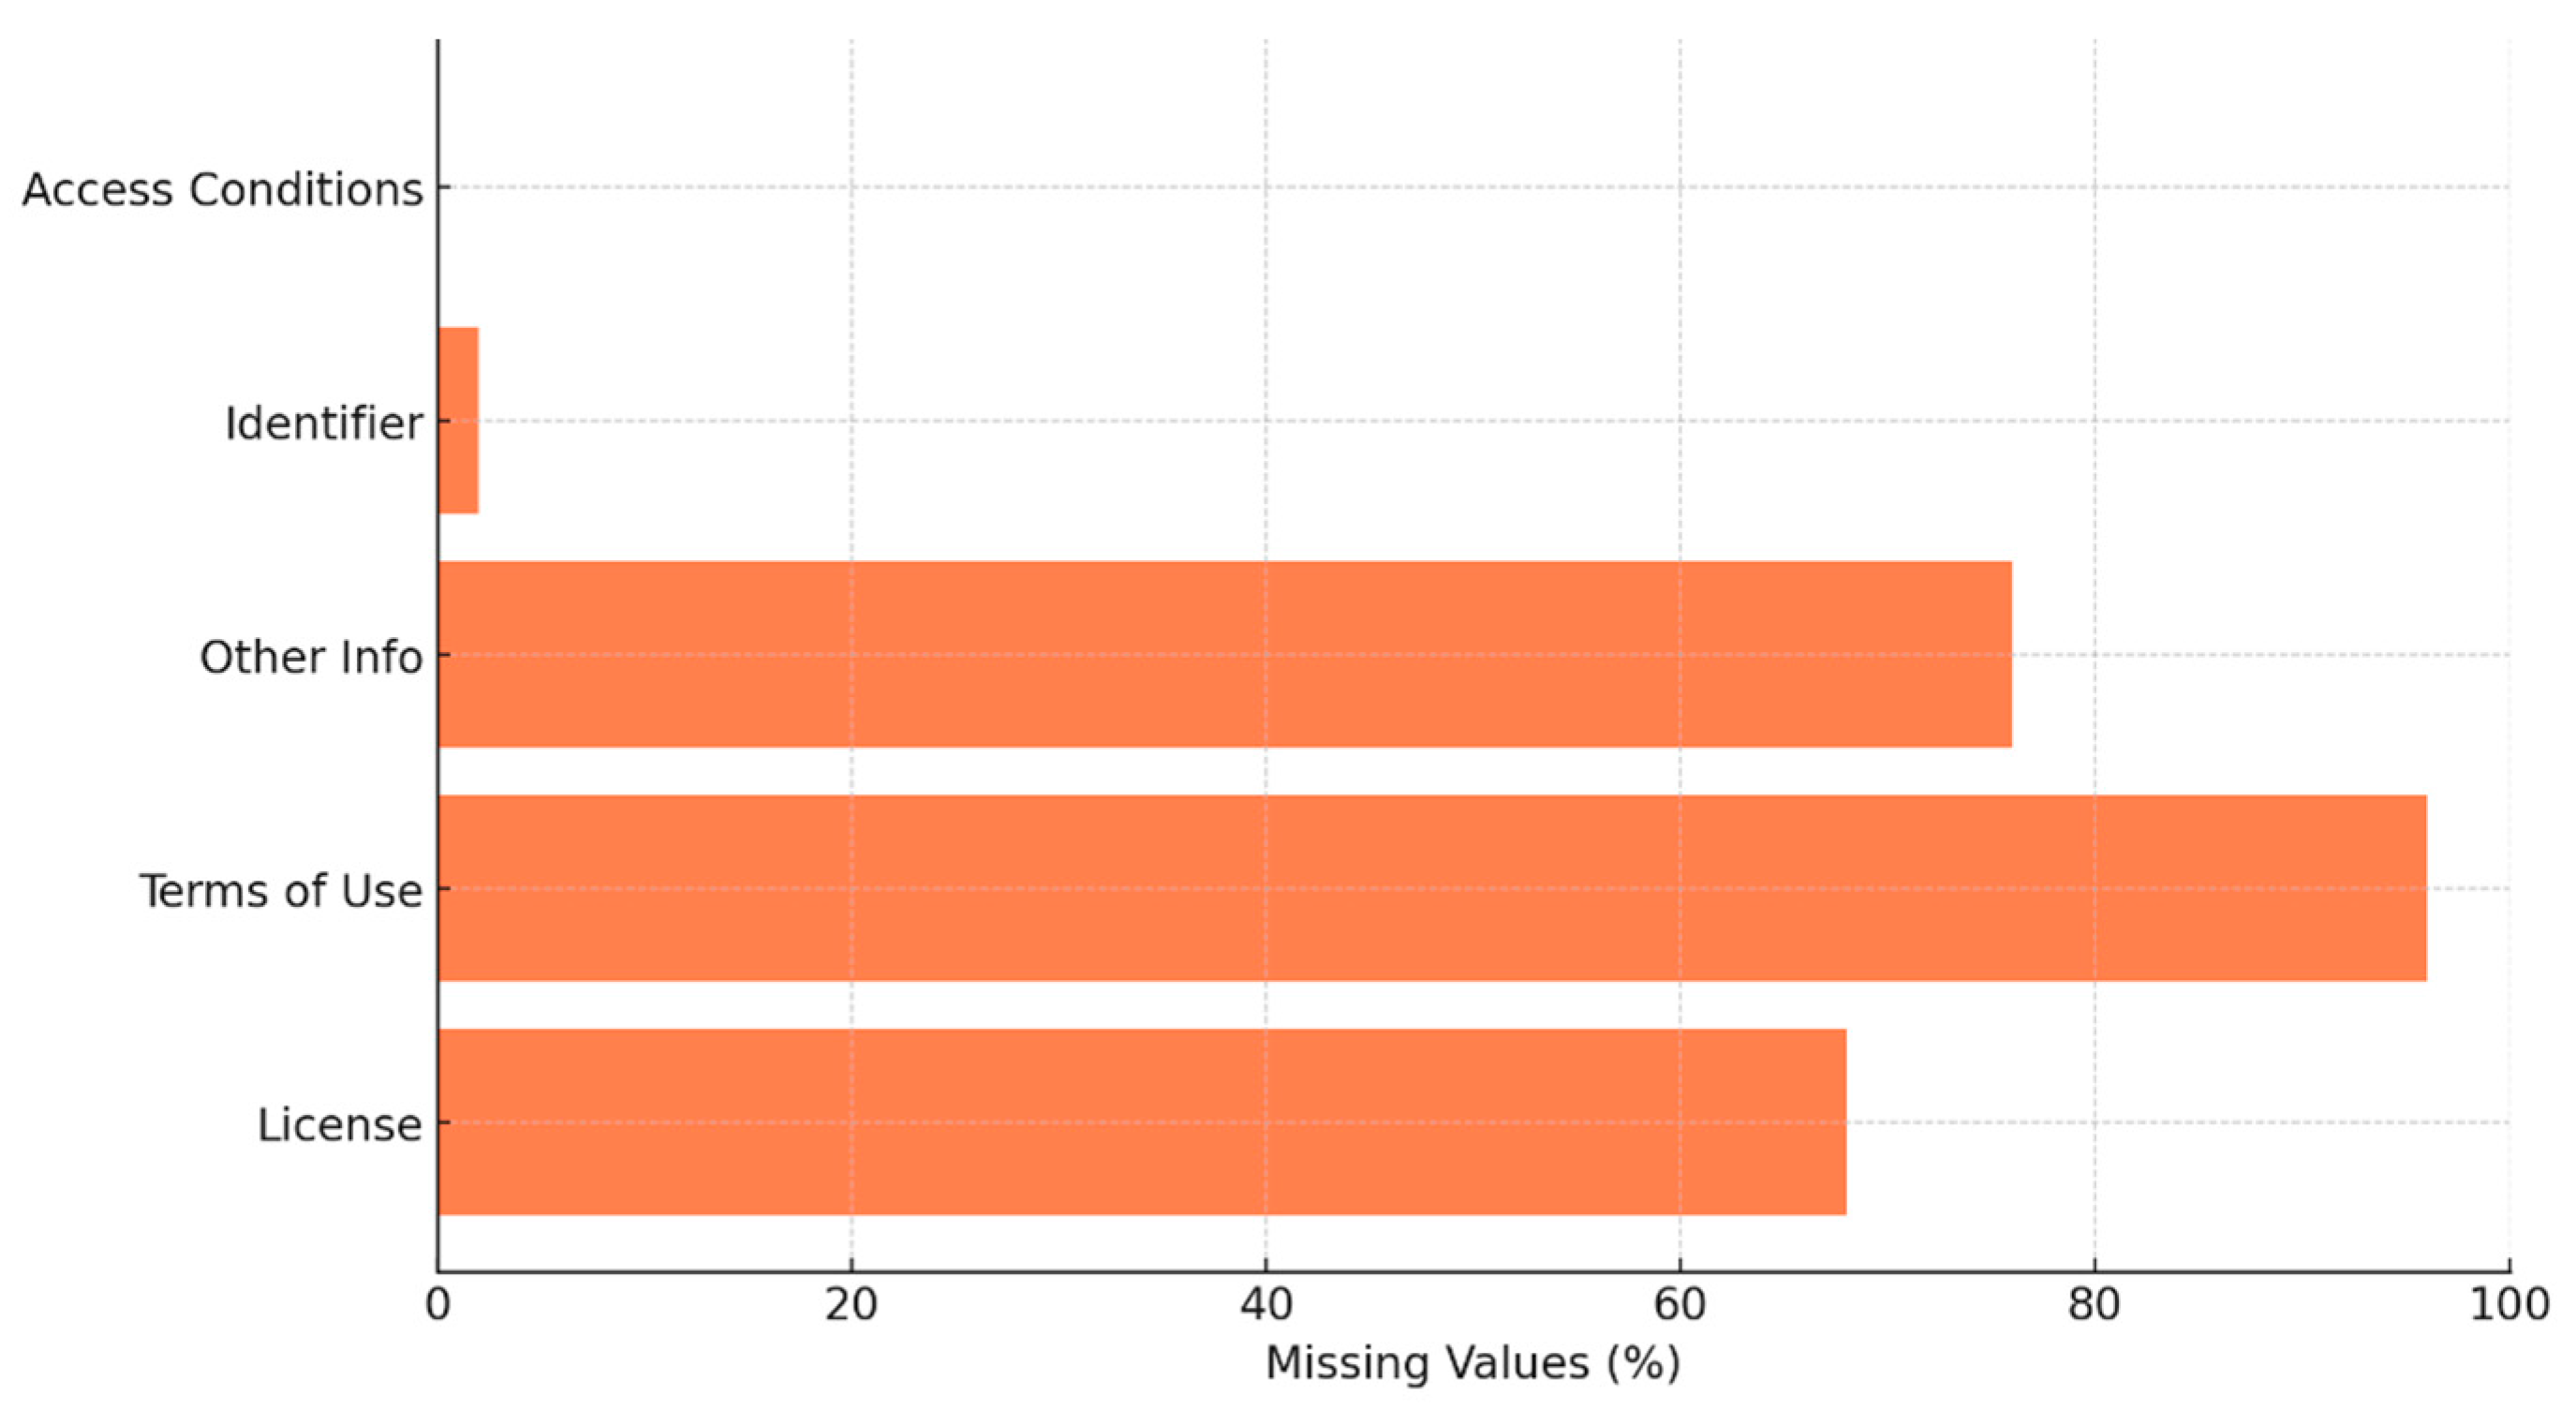
For this step, the presence of metadata was assessed—both in terms of the general existence of any metadata as well as a detailed check in whether the identified fields in Table 2 were present. Figure 3 shows the percentage of missing metadata fields advised across all datasets.
The results from the metadata check are summarized in Table 3, which shows the amount of missing data for each of the metadata fields of interest. Moreover, the Title (with hyperlink) and Creator of the final dataset inventory were recollected in Pezzutto et al. [25]. Among the 23 metadata fields examined, “License” and “Terms of Use” were the most frequently missing, absent in 68% and 96% of the datasets, respectively. “Other relevant information” was also missing in over 75% of cases, suggesting a general lack of auxiliary descriptors. By contrast, fields such as “Creator”, “Content”, and “Access conditions” were consistently provided.

3.3. Results of the Documentation Review

Of the 30 datasets reviewed, 23 included at least some form of methodological documentation, while only 13 explicitly addressed statistical accuracy. The most common sources were embedded metadata, public project deliverables, and linked scientific articles. However, the absence of persistent links and standardized documentation formats remains a critical gap.

3.3.1. Methodology Check

The documentation review resulted in explanations in the dataset methodology for 23 of 30 assessed datasets. The full results for the methodology check can be found in Pezzutto et al. [25].

3.3.2. Statistical Accuracy Check

The statistical accuracy check portion of the documentation review resulted in details on statistical accuracy for 13 of the 30 reviewed datasets. The full results can be found in Pezzutto et al. [25].

3.4. Results of the Completeness Analysis

The absolute majority (82%) of the assessed datasets had missing data, with a number (27%) having missing data for more than 50% of the dataset dimensions. The full completeness analysis results can be found in Pezzutto et al. [25].

3.5. Results of the Consistency Analysis

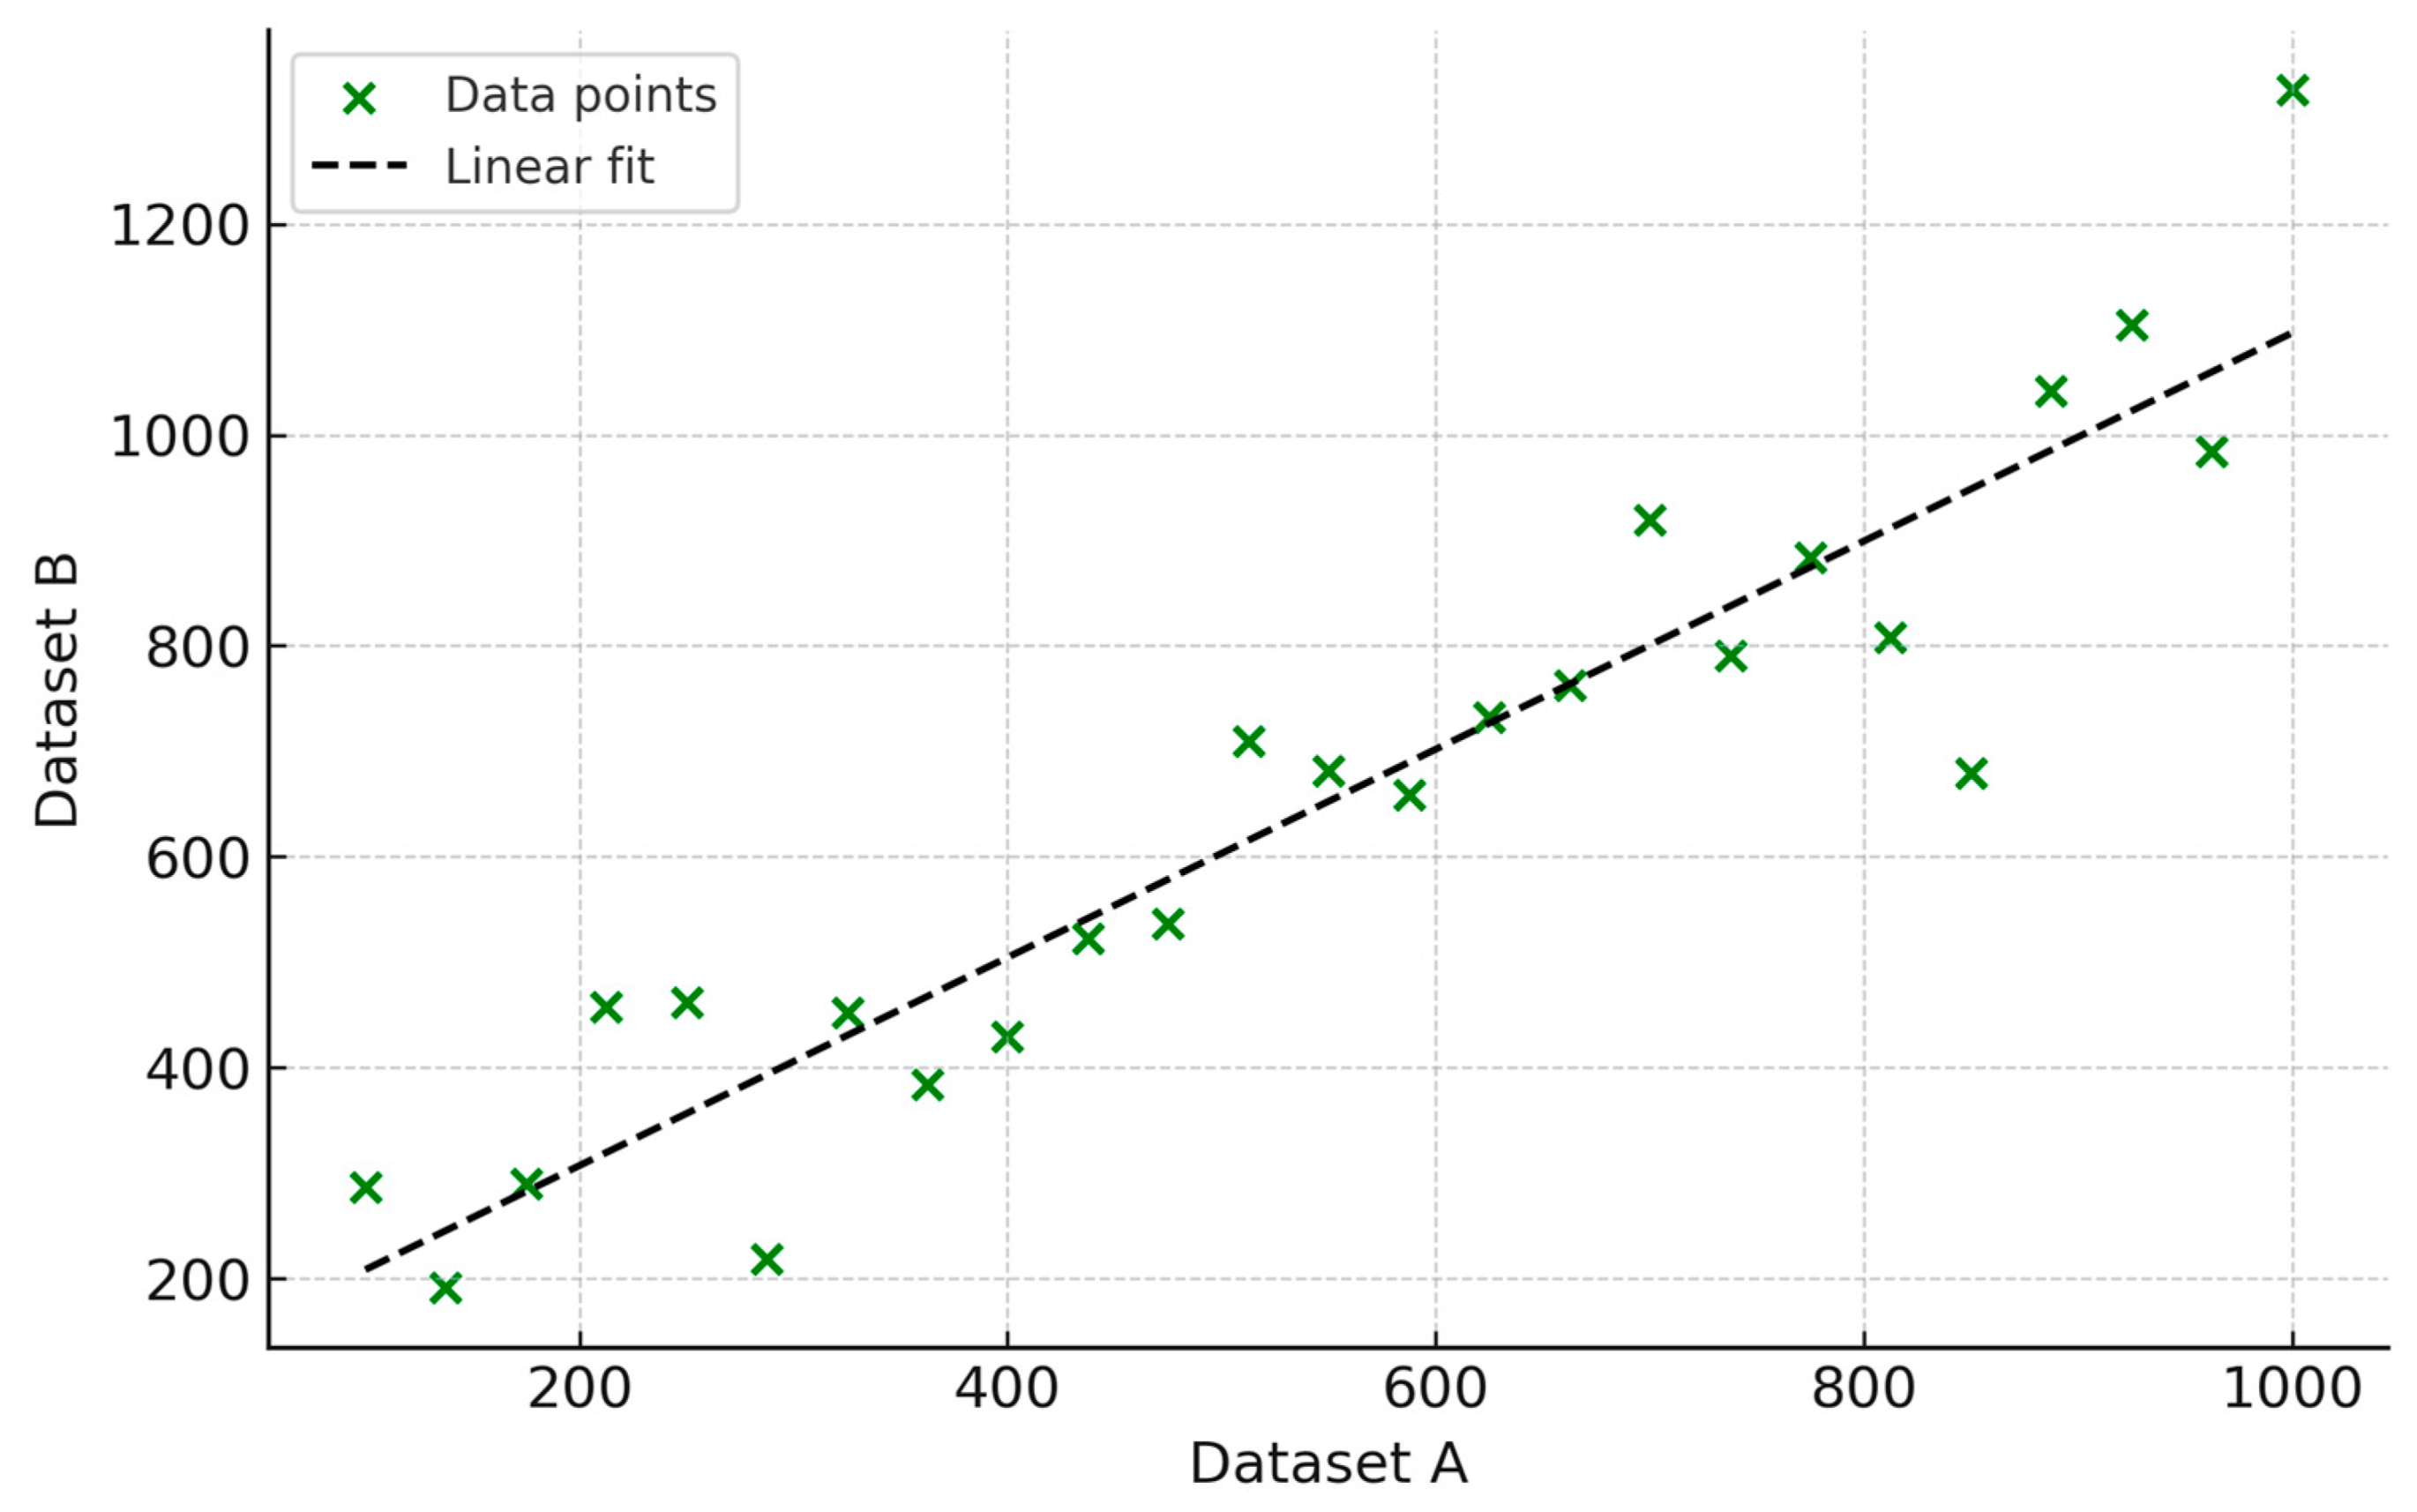
The consistency analysis led to mixed results, but overall, the majority of the assessed datasets had satisfactory performance (determined by the p-value resulting from the Student’s t-test). Figure 4 reports a representative example from the consistency analysis, with a scatter plot and fitted linear regression. However, a report of the full results can be found in Pezzutto et al. [25].

3.6. Results of the Statistical Comparative Assessment

The Python code (https://www.python.org/) developed is reported in Pezzutto et al. [25]. The results include a five-point summary comparison of the groups of three compared datasets along with boxplots. Moreover, the results for the statistical comparative assessment are displayed in the respective tables in Pezzutto et al. [25]. Each comparison is presented in three parts: (i) a statistical synopsis, (ii) a box-and-whisker diagram, and (iii) a concise note explaining the subset used. The statistical synopsis lists the sample size, arithmetic mean, standard deviation, extreme values (minimum and maximum), and the first (25%), second (median, 50%), and third (75%) quartiles. The box-and-whisker plot then offers a compact visual depiction of this distribution. Variations observed across the three datasets for any given analysis can usually be traced to differences in data collection protocols or in the extrapolation techniques employed. Examining the statistical indicators enables researchers to judge which dataset they regard as the most trustworthy. For instance, if one dataset’s mean and variance deviate markedly from two otherwise similar datasets—as with dataset 6 in comparison to datasets 28 and 29—its representativeness may reasonably be called into doubt. When discrepancies between datasets are identified through statistical comparisons, users should first consult associated documentation to evaluate whether the differences stem from variations in scope, units of measurement, extrapolation methods, or temporal/spatial resolution. Discrepancies do not necessarily indicate errors but may reflect legitimate methodological divergence. It is therefore critical that data providers accompany datasets with clear explanations of assumptions, definitions, and applied data transformations. In cases of substantial divergence, users are advised to triangulate with a third dataset or perform sensitivity analyses before drawing policy-relevant conclusions.

4. Discussion

Metadata is essential in describing data. Standards on metadata do exist, and so it is possible to create a standard for each assessed dataset and scrutinize the quality of its metadata based on the presence of specific metadata fields. For the EnerMaps case study, certain metadata fields of interest were often not found explicitly in the dataset metadata. However, the values for these fields could be inferred from other descriptors of the dataset, including the webpage where the dataset was being stored or within the dataset file itself. While the metadata fields will vary based on the individual needs of the researcher, it is crucial that the metadata for a dataset describes its terms of use, as well as any associated licenses. Only if a dataset has an explicitly open license can it be considered FAIR (in terms of accessibility) and reused by others and integrated into other platforms. To address the identified gaps in licensing and terms of use, dataset providers are encouraged to adopt standardized and machine-readable license templates such as those provided by Creative Commons or Open Data Commons. These licenses not only clarify reusability conditions but also ensure compliance with FAIR principles of accessibility and reusability. Moreover, metadata schemas should include dedicated fields for license type, access restrictions, and usage permissions, ideally validated through automated completeness checks before publication. Community-driven infrastructures such as OpenAIRE and re3data offer additional guidance and templates for implementing these standards in open data repositories. Therefore, the best practice for dataset creators is that this information is clearly visible, preferably in the accompanying metadata of the dataset. Documentation review was an important aspect of the QC process. Documentation can take a number of forms, including an accompanying PDF, readme file, or dedicated section in the metadata. A best practice is to include the documentation so that it can be accessed with a persistent link that is associated directly with the dataset and included in the dataset metadata. A documentation review was necessary for two steps in the QC process described in this paper: the methodology check and the check for statistical accuracy. While the absence of this information in a dataset’s documentation may not necessarily indicate a low-quality dataset, it means the dataset creators were less transparent about the dataset’s creation and that users interested in using the dataset must trust the dataset’s quality at face value. For the methodology check, the quality of results varied for datasets that had a form of documentation describing their methodology. While a standard for a methodology description does not exist, it should be considered as a best practice to include a sort of explanation in the dataset documentation (or even a link to a research paper describing how the dataset was generated). Describing the methodology allows researchers to determine whether the dataset is of an adequate quality for their purposes, which improves the reliability of the data. The check for statistical accuracy also led to varied results, but this check was again seen as an edifying step to enhance the reliability of the dataset. For documentation that commented on the statistical accuracy of the associated dataset, most results were either a simple numerical comparison with similar datasets or a brief comment on the overall statistical accuracy. However, provided the low presence and high variation in the reporting of dataset statistical accuracy, this step should not be a required field for approving a dataset’s quality. The completeness analysis is an important step to assess the extent of missing data in a dataset. Different data providers represent missing data in different ways. Oftentimes the data is simply missing (for example, the cell is blank for tabular datasets). Other times, a symbol, such as a colon, is used. A number of datasets used zero values to represent missing data, which is not an ideal way to represent missing data for quantitative data due to possible confusion as to whether the value is missing or, indeed, equal to zero. After assessing the completeness of a dataset, researchers may elect to fill in missing data through means of extrapolation or simply to remove missing data altogether. In any case, being aware of the extent of missing data in a dataset is valuable for researchers to understand whether a dataset contains enough values that are useful for their analysis. The statistical accuracy of a dataset is often conducted by researchers who are not the original creators of the dataset. There are numerous ways to compare datasets, and the QC process in this paper describes two basic ways: via the consistency analysis and a statistical comparison with similar datasets. The EnerMaps QC approach aligns with and complements several prior efforts developed within European or international contexts. For instance, the HotMaps project implemented plausibility checks, completeness assessments, and expert validation in the context of municipal energy planning [26]. Similarly, the PowerPlant Matching (PPM) tool developed by Gotzens et al. [8] applies record-matching and validation algorithms to cross-reference multiple datasets of power plants. In the U.S., the Buildings Performance Database (BPD) [27] developed by the U.S. Department of Energy uses statistical harmonization routines to improve the comparability of building energy datasets. Compared to these, the EnerMaps workflow offers a modular and scalable structure that explicitly incorporates FAIR principles and can be adapted to different levels of assessment depending on data availability and quality. Data is generated and collected in a variety of approaches. Conducting consistency and accuracy checks can ensure the data is reliable and has a reduced likelihood of having erroneous discrepancies because of the dataset creation. The statistical comparison with similar datasets utilized a high-level overview of how the dataset of interest is compared with related datasets. The results from this step showed several large discrepancies in the values between certain datasets. There are a number of reasons why this may have been the case, including differences in the scopes of the assessed datasets, as well as differences in the measurement and statistical extrapolation methods. As such, it is difficult to say whether a threshold on the extent of these discrepancies should be included. Rather, it is more useful to instead communicate these discrepancies to users so that they can make their own assumptions of the data. Although the QC workflow was developed in the context of energy-related datasets, its core structure can be generalized to other domains that rely on heterogeneous open data. The modular steps—ranging from expert validation to metadata interrogation and statistical coherence—are conceptually applicable to sectors such as climate research, urban mobility, or public health, where data completeness, transparency, and harmonization are also recurring challenges. The workflow’s reliance on broadly accepted principles such as FAIR, combined with its scalable design, facilitates its adaptation to context-specific data ecosystems, provided that appropriate domain-relevant metadata fields and QC indicators are defined. Despite its modular structure and broad applicability, the proposed QC workflow has several limitations. First, expert feedback is inherently subjective and may vary depending on disciplinary background and familiarity with the datasets. Second, the use of simple linear regression for consistency testing captures only bivariate linear associations and may overlook multivariate or nonlinear discrepancies. Third, the workflow relies heavily on the presence of structured metadata, which may lead to biased evaluations in favor of datasets that are well-documented but not necessarily more accurate. Finally, the current workflow does not implement automated quality scoring or advanced anomaly detection techniques, which could improve scalability and objectivity in future applications.

5. Conclusions

The EnerMaps case study demonstrates the feasibility of applying a structured, multi-step quality control (QC) workflow to heterogeneous energy-related datasets. The main conclusions are summarized below:
  • The proposed QC framework, aligned with the FAIR principles, was successfully applied to 50 spatially referenced datasets with varying structure and completeness.
  • All datasets satisfied the FAIR dimensions of findability and accessibility, confirming that these criteria can be met with relatively limited effort.
  • Major gaps remain in transparency and reusability: 68% of the datasets lacked an explicit license, 96% omitted terms-of-use statements, and 23% did not include methodology documentation.
  • The completeness analysis revealed that more than 80% of the assessed datasets contained missing values, with over one-quarter missing more than 50% of key fields.
  • Consistency checks based on linear regression indicated statistically significant correlations (p < 0.05) for most dataset pairs, supporting the internal coherence of the data.
  • The workflow provides a replicable and scalable model for other domains or platforms, allowing the calibration of QC thresholds based on specific risk tolerance or analytical objectives.
  • There is a clear need for standardized metadata templates and documentation protocols to improve data transparency, provenance, and reuse.
Future work should explore comparative assessments with alternative QC frameworks, integrate more advanced statistical validation methods, and investigate mechanisms to incorporate community-based feedback in the QC process.

Author Contributions

Conceptualization, S.P., D.B.-L., and E.J.W.; methodology, S.P.; software, E.J.W.; validation, S.P., D.B.-L., and E.J.W.; formal analysis, S.P., D.B.-L., and E.J.W.; investigation, S.P., D.B.-L., and E.J.W.; resources, S.P. and E.J.W.; data curation, E.J.W.; writing—original draft preparation, S.P., D.B.-L., and E.J.W.; writing—review and editing, S.P., D.B.-L., and E.J.W.; visualization, S.P., D.B.-L., and E.J.W.; supervision, S.P.; project administration, S.P.; funding acquisition, S.P. All authors have read and agreed to the published version of the manuscript.

Funding

This research was funded by the Horizon 2020 EnerMaps project (Grant Agreement No. 884161).

Institutional Review Board Statement

Not applicable.

Informed Consent Statement

Not applicable.

Data Availability Statement

The data presented in this study are available on request from the corresponding author.

Acknowledgments

The authors thank the Department of Innovation, Research and University of the Autonomous Province of Bozen/Bolzano for covering the Open Access publication costs.

Conflicts of Interest

The authors declare no conflicts of interest.

References

  1. Balest, J.; Pezzutto, S.; Giacovelli, G.; Wilczynski, E. Engaging Stakeholders for Designing a FAIR Energy Data Management Tool: The Horizon 2020 EnerMaps Project. Sustainability 2022, 14, 11392. [Google Scholar] [CrossRef]
  2. Pfenninger, S.; DeCarolis, J.; Hirth, L.; Quoilin, S.; Staffell, I. The Importance of Open Data and Software: Is Energy Research Lagging Behind? Energy Policy 2017, 101, 211–215. [Google Scholar] [CrossRef]
  3. Panico, S.; Larcher, M.; Troi, A.; Codreanu, I.; Baglivo, C.; Congedo, P.M. Hygrothermal analysis of a wall isolated from the inside: The potential of dynamic hygrothermal simulation. IOP Conf. Ser. Earth Environ. Sci. 2021, 863, 012053. [Google Scholar] [CrossRef]
  4. GO FAIR. FAIR Principles. Available online: https://www.go-fair.org/fair-principles/ (accessed on 5 June 2025).
  5. Wilkinson, M.D.; Dumontier, M.; Aalbersberg, I.J.J.; Appleton, G.; Axton, M.; Baak, A.; Blomberg, N.; Boiten, J.-W.; da Silva Santos, L.B.; Bourne, P.E.; et al. The FAIR Guiding Principles for Scientific Data Management and Stewardship. Sci. Data 2016, 3, 160018. [Google Scholar] [CrossRef] [PubMed]
  6. Bahim, C.; Casorrán-Amilburu, C.; Dekkers, M.; Herczog, E.; Loozen, N.; Repanas, K.; Russell, K.; Stall, S. The FAIR Data Maturity Model: An Approach to Harmonise FAIR Assessments. Data Sci. J. 2020, 19, 41. [Google Scholar] [CrossRef]
  7. Scheffler, M.; Aeschlimann, M.; Albrecht, M.; Bereau, T.; Bungartz, H.-J.; Felser, C.; Greiner, M.; Groß, A.; Koch, C.T.; Kremer, K.; et al. FAIR Data Enabling New Horizons for Materials Research. Nature 2022, 604, 635–642. [Google Scholar] [CrossRef] [PubMed]
  8. Gotzens, F.; Heinrichs, H.; Hörsch, J.; Hofmann, F. Performing Energy Modelling Exercises in a Transparent Way—The Issue of Data Quality in Power Plant Databases. Energy Strategy Rev. 2019, 23, 1–12. [Google Scholar] [CrossRef]
  9. Pezzutto, S.; Croce, S.; Zambotti, S.; Kranzl, L.; Novelli, A.; Zambelli, P. Assessment of the Space Heating and Domestic Hot Water Market in Europe—Open Data and Results. Energies 2019, 12, 1760. [Google Scholar] [CrossRef]
  10. Mathew, P.A.; Dunn, L.N.; Sohn, M.D.; Mercado, A.; Custudio, C.; Walter, T. Big-Data for Building Energy Performance: Lessons from Assembling a Very Large National Database of Building Energy Use. Appl. Energy 2015, 140, 85–93. [Google Scholar] [CrossRef]
  11. The CARINA Group. The CARbon Dioxide IN the Atlantic Ocean (CARINA) Database (Version 1.1, 2010) Data Set; NOAA National Centers for Environmental Information: Asheville, NC, USA, 2013. [CrossRef][Green Version]
  12. Tanhua, T.; Olsen, A.; Hoppema, M.; Jutterström, S.; Schirnick, C.; van Heuven, S.M.A.C.; Velo, A.; Lin, X. Carbon Dioxide Information Analysis Center (CDIAC) Datasets. 2009. Available online: https://www.ncei.noaa.gov/access/ocean-carbon-acidification-data-system/oceans/CARINA/about_carina.html (accessed on 4 August 2025).[Green Version]
  13. Forstinger, A.; Wilbert, S.; Jensen, A.R.; Kraas, B.; Fernández Peruchena, C.; Gueymard, C.A.; Ronzio, D.; Yang, D.; Collino, E.; Martinez, J.P.; et al. Expert Quality Control of Solar Radiation Ground Data Sets. In Proceedings of the SWC 2021: ISES Solar World Congress, Virtual Conference, 25–29 October 2021; pp. 1–12. [Google Scholar] [CrossRef]
  14. Gao, Y.; Liu, L.; Zhang, X.; Chen, X.; Mi, J.; Xie, S. Consistency Analysis and Accuracy Assessment of Three Global 30-m Land-Cover Products over the European Union Using the LUCAS Dataset. Remote Sens. 2020, 12, 3479. [Google Scholar] [CrossRef]
  15. d’Andrimont, R.; Verhegghen, A.; Meroni, M.; Lemoine, G.; Strobl, P.; Eiselt, B.; Yordanov, M.; Martinez-Sanchez, L.; van der Velde, M. LUCAS Copernicus 2018: Earth-Observation-Relevant In Situ Data on Land Cover and Use throughout the European Union. Earth Syst. Sci. Data 2021, 13, 1119–1133. [Google Scholar] [CrossRef]
  16. Tsendbazar, N.-E.; de Bruin, S.; Fritz, S.; Herold, M. Spatial Accuracy Assessment and Integration of Global Land Cover Datasets. Remote Sens. 2015, 7, 15804–15821. [Google Scholar] [CrossRef]
  17. Evans, B.; Druken, K.; Wang, J.; Yang, R.; Richards, C.; Wyborn, L. A Data Quality Strategy to Enable FAIR, Programmatic Access across Large, Diverse Data Collections for High Performance Data Analysis. Informatics 2017, 4, 45. [Google Scholar] [CrossRef]
  18. Wierling, A.; Schwanitz, V.J.; Altinci, S.; Bałazińska, M.; Barber, M.J.; Biresselioglu, M.E.; Burger-Scheidlin, C.; Celino, M.; Demir, M.H.; Dennis, R.; et al. FAIR Metadata Standards for Low Carbon Energy Research—A Review of Practices and How to Advance. Energies 2021, 14, 6692. [Google Scholar] [CrossRef]
  19. Kubler, S.; Robert, J.; Neumaier, S.; Umbrich, J.; Le Traon, Y. Comparison of Metadata Quality in Open Data Portals Using the Analytic Hierarchy Process. Gov. Inf. Q. 2018, 35, 13–29. [Google Scholar] [CrossRef]
  20. World Wide Web Consortium (W3C). Data Catalog Vocabulary (DCAT): Version 3 (W3C Recommendation). Available online: https://www.w3.org/TR/vocab-dcat-3/ (accessed on 4 August 2024).
  21. Neumaier, S.; Umbrich, J.; Polleres, A. Automated Quality Assessment of Metadata across Open Data Portals. J. Data Inf. Qual. 2016, 8, 1–29. [Google Scholar] [CrossRef]
  22. Rager, J.; von Gunten, D.; Wilczynski, E.; Pezzutto, S. EnerMaps Project: A New Open Energy Data Tool to Accelerate the Energy Transition. Euroheat Power 2021, 1, 19–22. [Google Scholar]
  23. DataCite Metadata Working Group. DataCite Metadata Schema Documentation for the Publication and Citation of Research Data. Version 4.3. DataCite e.V. 2019. Available online: https://schema.datacite.org/meta/kernel-4.3/ (accessed on 19 June 2025).
  24. Schema.org. Dataset. Available online: https://schema.org/Dataset (accessed on 5 June 2025).
  25. Wilczynski, E.; Pezzutto, S. Quality-Check Process Results Report (Deliverable D1.6). EnerMaps. 2021. Available online: https://www.researchgate.net/publication/350278152_EnerMaps_D16_Quality-check_process_results_report (accessed on 19 June 2025).
  26. Pezzutto, S.; Zambotti, S.; Croce, S.; Zambelli, P.; Garegnani, G.; Scaramuzzino, C.; Pascuas, R.P.; Haas, F.; Exner, D.; Lucchi, E.; et al. Deliverable 2.3—WP2 Report—Open Data Set for the EU28. HotMaps Project, H2020. Available online: https://www.google.com/url?sa=t&source=web&rct=j&opi=89978449&url=https://www.hotmaps-project.eu/wp-content/uploads/2018/03/D2.3-Hotmaps_for-upload_revised-final_.pdf&ved=2ahUKEwjAvo7omqaPAxWLh_0HHe0bHwgQFnoECBcQAQ&usg=AOvVaw3_LIgfRoQO0rJaaVc-gZNc (accessed on 19 June 2025).
  27. U.S. Department of Energy. Buildings Performance Database (BPD): Technical Documentation. 2021. Available online: https://bpd.lbl.gov (accessed on 19 June 2025).
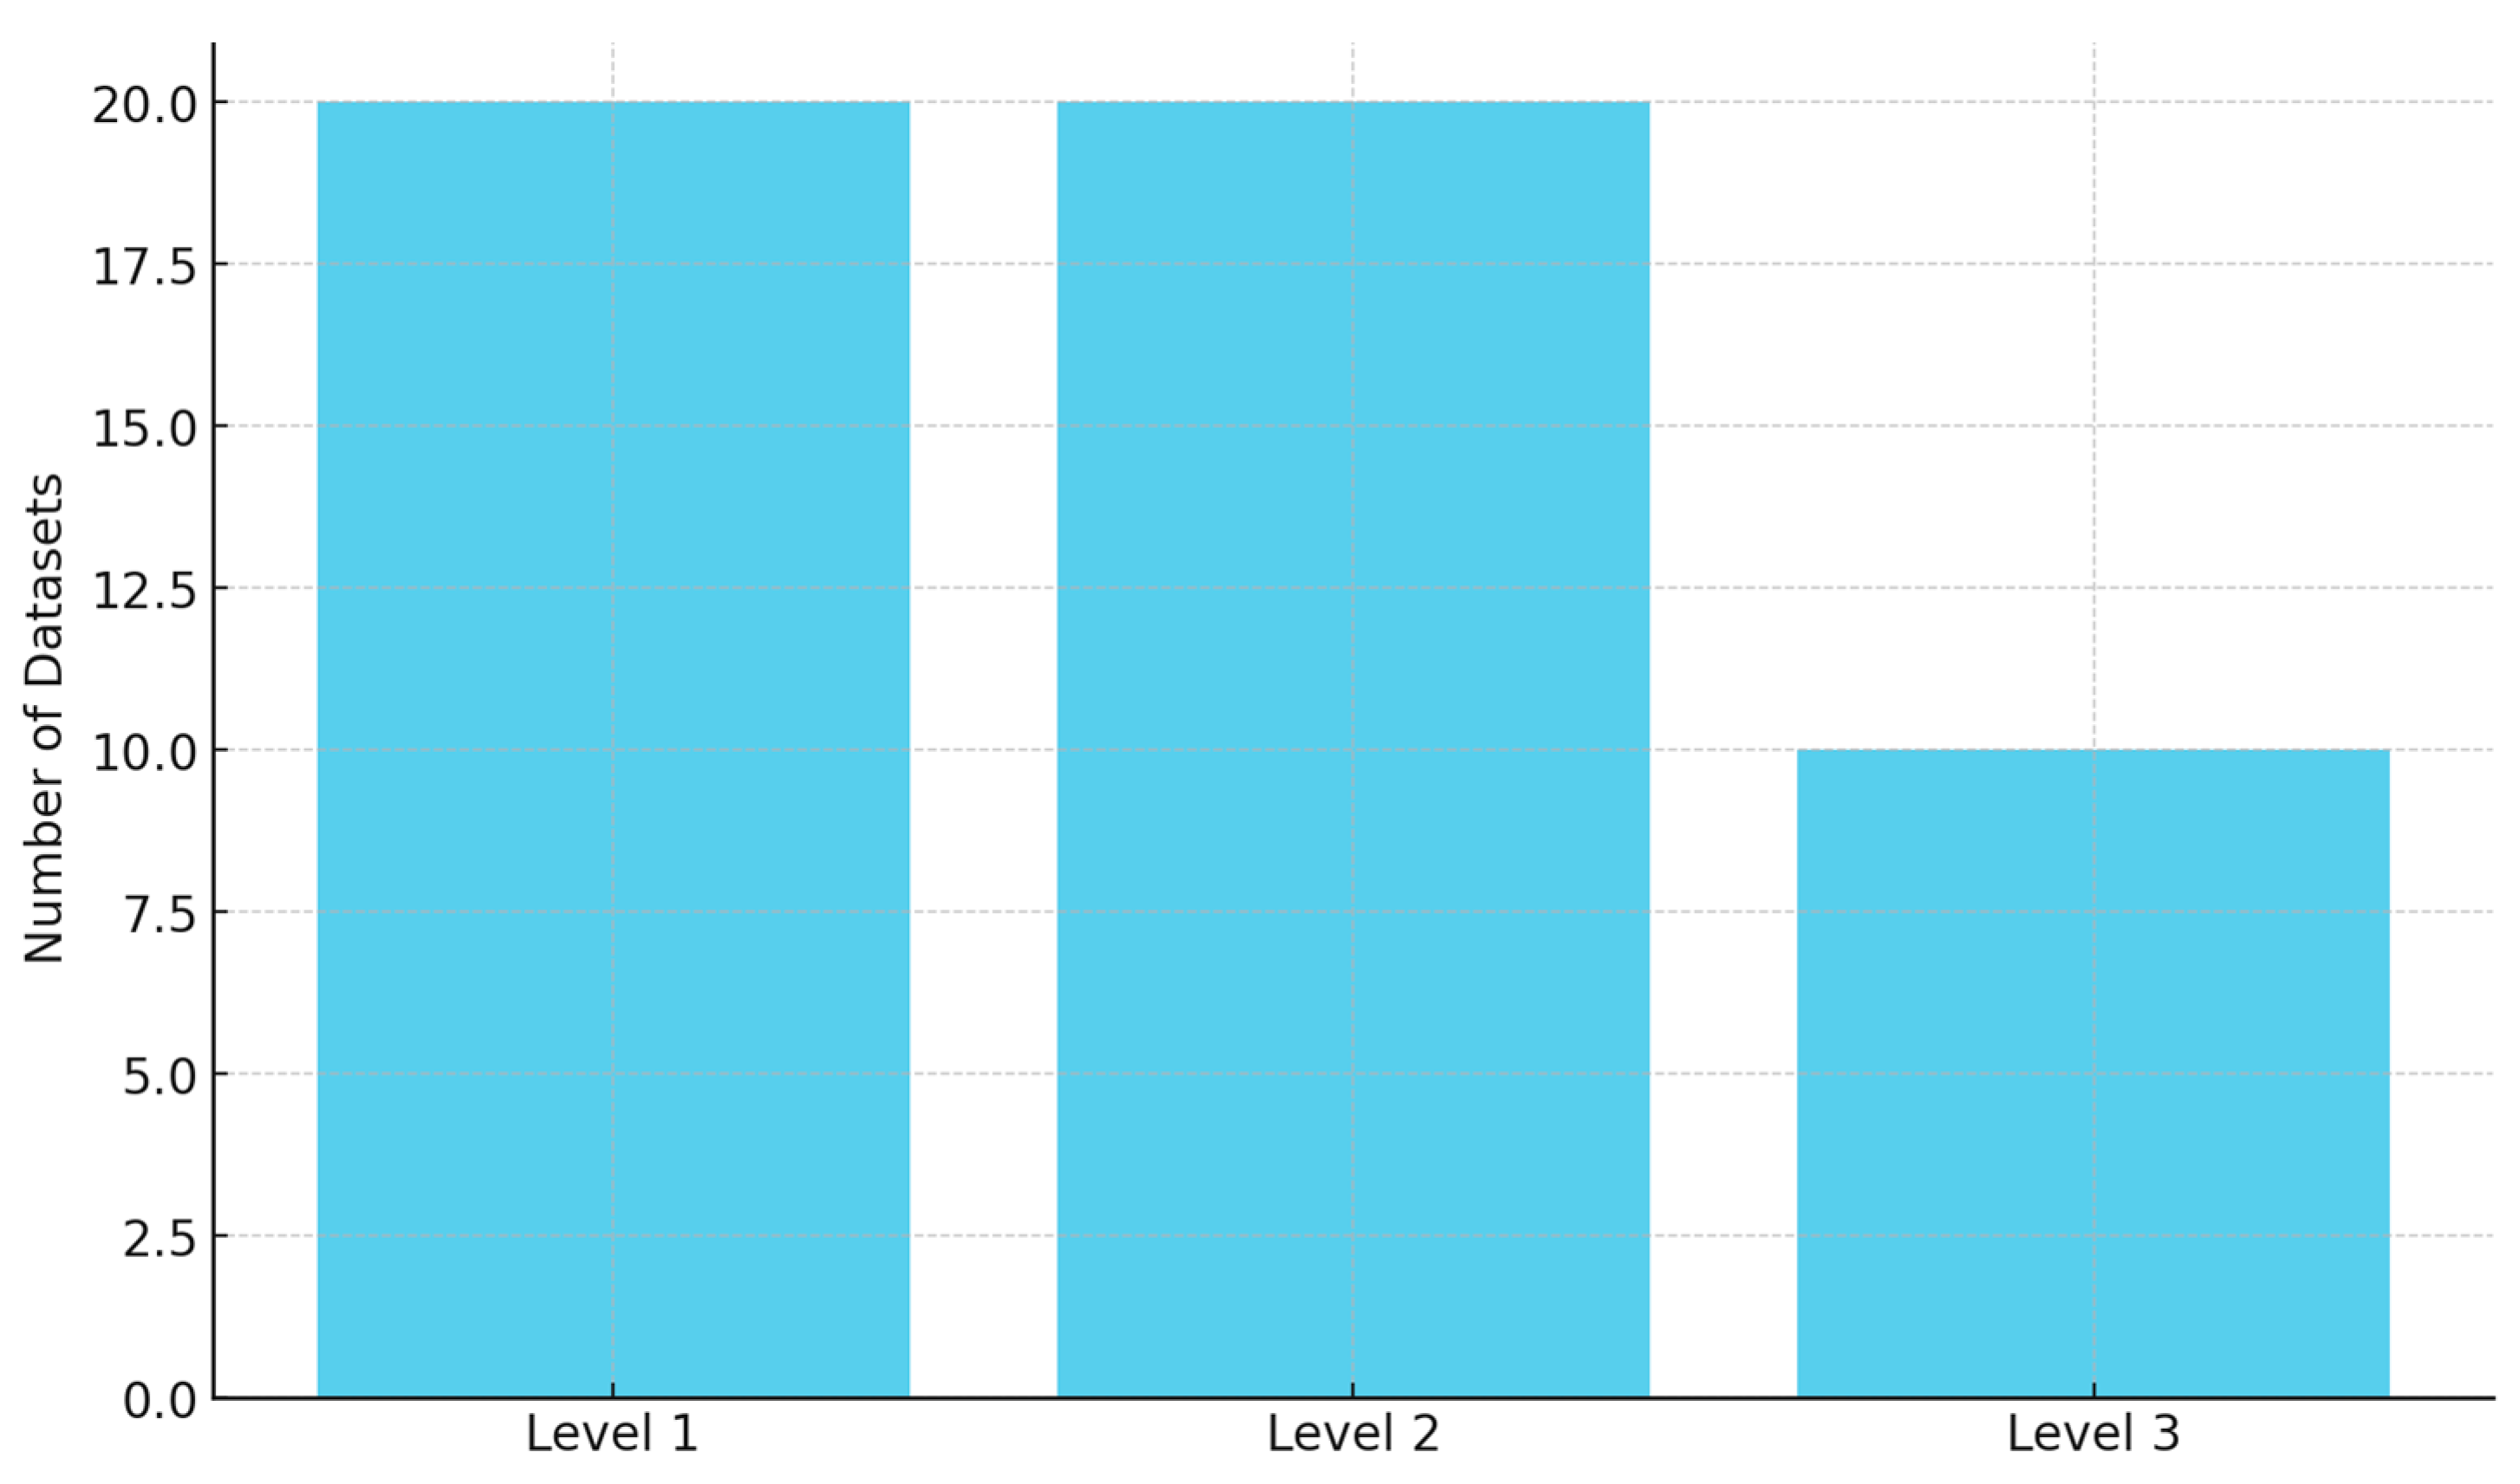
Figure 1. Distribution of the 50 assessed datasets across Levels 1, 2, and 3.
Sustainability 17 07684 g001
Figure 2. Overview of the EnerMaps quality control (QC) workflow. The diagram illustrates the six QC steps and their application across dataset levels.
Sustainability 17 07684 g002
Figure 3. Percentage of missing metadata fields across all datasets.
Sustainability 17 07684 g003
Figure 4. Representative example from the consistency analysis: scatter plot with fitted linear regression (p < 0.05).
Sustainability 17 07684 g004
Table 1. Data levels applied to each EnerMaps quality control process step.
Stage Within the Quality Assurance WorkflowFirst LevelSecond LevelThird Level
Gathering input from subject-matter expertsXXX
Availability of user feedback on the Kialo platformXXX
Verification that pertinent metadata are present XX
Review of the methodology applied to the datasets XX
Assessment of dataset completeness XX
Evaluation of statistical accuracy XX
Examination of intra- and cross-dataset consistency XX
Benchmarking against comparable datasets X
Table 2. List of metadata fields and descriptions.
Metadata ElementDescription
Processing stageGeographic focus of the dataset.
Spatial resolution/granularitySpatial resolution represented (e.g., the minimum spatial unit).
Internal identifierPersistent identifier or locator that uniquely resolves to the dataset.
Identifier type/schemeIdentifier scheme/type used in the “Identifier” field.
Data creator/authorEntity responsible for data production (organization and/or individuals).
Described object (subject)Title shown on the dataset’s landing page.
Issuing body (publisher)Repository/organization that hosts and disseminates the data.
Date of publicationPublication date (day–month–year): if multiple updates exist, record the most recent; if only a partial date is provided, retain the available granularity (e.g., month–year or year only).
Year of publicationPublication year.
Temporal resolutionTemporal resolution of the dataset.
Time references (coverage markers)Temporal coverage (dates/years) referenced by the dataset; a range for longitudinal series or a single year for cross-sectional data.
URLs (external links)URL for the dataset or its landing page.
Content descriptors (keywords)Keywords describing the dataset’s content.
Origin/provenanceProvenance/source initiative (e.g., the project that generated the dataset).
Geographic coverage/extentGeographic extent/zone covered (distinct from the “Level” field only for raster products).
CRS/map projectionProjected coordinate reference system employed (applicable to projected data).
Access conditionsStatement on openness and download availability.
Licensing informationLicense specifying permitted uses and conditions.
Terms of useConcise notes on terms of use.
AvailabilityWhere the dataset can be accessed (for publicly available resources).
Resource category/typeResource type (e.g., “dataset”).
Data/file formatFile format.
File size (bytes/MB)File size of the downloaded dataset (and of any compressed archive, if relevant).
Other pertinent informationAdditional pertinent notes (e.g., login required for access).
Table 3. List of metadata elements and share of missing entries.
Metadata ElementShare of Missing Entries (%)
Processing stage0
Spatial resolution/granularity0
Internal identifier2
Identifier type/scheme2
Data creator/author0
Described object (subject)2
Issuing body (publisher)0
Date of publication2
Year of publication2
Temporal resolution2
Time references (coverage markers)2
URLs (external links)2
Content descriptors (keywords)0
Origin/provenance0
Geographic coverage/extent0
CRS/map projection2
Access conditions0
Licensing information68
Terms of use96
Availability0
Resource category/type0
Data/file format0
File size (bytes/MB)0
Other pertinent information76
Disclaimer/Publisher’s Note: The statements, opinions and data contained in all publications are solely those of the individual author(s) and contributor(s) and not of MDPI and/or the editor(s). MDPI and/or the editor(s) disclaim responsibility for any injury to people or property resulting from any ideas, methods, instructions or products referred to in the content.