Article

Ecological Zoning in Mountainous Areas Based on Ecosystem Service Trade-Offs and Landscape Ecological Risk: A Case Study of the Hengduan Mountain Region

by
Xiaoyu Zhao
1,
Erfu Dai
2,
Kangning Kong
3,
Yuan Tian
3,
Yong Yang
3,
Zhuo Li
1,
Jiachen Liu
1,
Baolei Zhang
1 and
Le Yin
1,*
1
College of Geography and Environment, Shandong Normal University, Jinan 250014, China
2
Institute of Geographic Sciences and Natural Resources Research, Chinese Academy of Sciences, Beijing 100101, China
3
Shandong Provincial Territorial Spatial Ecological Restoration Center, Jinan 250010, China
*
Author to whom correspondence should be addressed.
Sustainability 2025, 17(17), 7630; https://doi.org/10.3390/su17177630
Submission received: 17 June 2025 / Revised: 16 July 2025 / Accepted: 21 August 2025 / Published: 24 August 2025

Abstract

Ecological zoning is a key approach to promoting regional ecological protection and sustainable development. At present, landscape ecological risk (LER), driven by both natural and anthropogenic factors, continues to intensify, thereby disrupting ecosystem functions and weakening their service capacity. Although ecosystem services (ESs) and LER have been increasingly integrated into ecological management and policy-making in recent years, the interactive relationship between them remains insufficiently explored, particularly in the context of ecological zoning based on their coupled characteristics. Therefore, this study focuses on the Hengduan Mountain region from 2000 to 2020, analyzing the relationship between ES trade-offs and LER, constructing ecological zones, and proposing targeted management strategies. The results show that: (1) ESs in the region are primarily characterized by concave trade-offs, with decreasing trade-off intensity over time. The overall LER level has decreased, exhibiting a spatial pattern of higher risk in the south and lower risk in the north. (2) Bivariate spatial autocorrelation analysis reveals that LER is positively correlated with the trade-offs of carbon storage and soil conservation, shifts from a negative to a positive correlation with carbon storage and water yield, and shifts from a positive to a negative correlation with soil conservation and water yield. (3) Based on overlay zoning, the region is divided into protection, warning, and restoration zones, each with corresponding management measures. This study takes ecological zoning as a starting point to deeply analyze the relationship between ES trade-offs and LER, providing a scientific basis for sustainable development of mountain ecosystems.

1. Introduction

Ecological zoning, a key tool in ecosystem management, helps mitigate natural and human-induced disturbances, supporting ecological sustainability and functioning [1]. Currently, there is no unified methodological framework for ecological regionalization, and existing studies mostly rely on single or multidimensional indicators for classification [2]. In contrast to approaches based on single indicators, methods that incorporate multiple ecological factors can better reflect the spatial heterogeneity of complex ecosystems [3,4]. In recent years, global climate change, coupled with increasingly intensive human activities, is altering terrestrial ecological patterns [5]. Particularly under the rapid urbanization and ecological conservation policies, large-scale land use/land cover change (LUCC) has intensified issues such as landscape fragmentation and habitat degradation, significantly weakening ecosystem service functions and its capacity for risk regulation [6]. Therefore, coordinating ecosystem services and landscape ecological risk has become a critical issue for achieving regional sustainable governance.
Ecological zoning has been a helpful approach to synchronizing ecological risk avoidance and ecosystem service management, and it became more popular in regional ecological conservation and spatial government [7,8]. Foreign countries initiated relatively early, exploring functional zoning at country-wide or eco-regional scales, emphasizing systematic and scientific approaches, and promoting practical applications in resource management and policy making [9,10]. Although ecological zoning research in China started later, the advancement of institutional frameworks has facilitated the development of zoning systems that balance ecological function prioritization and ecological security [11,12]. In general, current ecological zoning methods can be categorized into two main types: qualitative and quantitative approaches [13]. The qualitative approach typically relies mainly on expert knowledge, assessment of ecological sensitivity, and policy recommendation, which are more subjective in nature. The quantitative approach, in contrast, relies upon measuring ecological indicators, remote sensor data, and geographic information systems (GIS), while often utilizing overlay analysis and other spatial techniques to create plans with a focus upon regional heterogeneity and scientific reproducibility. Ecosystem services and ecological risk are two key dimensions of ecological security assessment. However, single search factor studies often fail to fully capture their complexity and interactions. Ecological zoning offers an effective approach to integrate both positive and negative ecological attributes of ecosystem services and ecological risk, enabling a comprehensive assessment of regional ecological conditions from both environmental and human well-being perspectives. And it supports decision-makers in formulating more accurate strategies and better zoning control programs. Most current studies construct ecological zoning based on ecosystem service assessment and ecological risk [14], or based on ecosystem service values and landscape ecological risk [15]. Fewer studies have combined ecosystem service trade-offs with landscape ecological risk for ecological zoning construction. On this basis, this research establishes a comprehensive ecological zoning scheme by superimposing ecosystem services and landscape ecological risk to offer scientific assistance for regional ecological conservation and sustainable development [7,16,17].
Ecosystem service (ES) is the benefit that natural ecosystems provide directly or indirectly to humans by maintaining and promoting the functioning of natural ecosystems and plays a key role in connecting natural ecosystems with the human social system [18,19]. As a crucial interface between natural processes and human activities, ESs are crucial for optimizing nature and promoting regional sustainability [20]. Therefore, addressing ESs has become one of the core issues in today’s socio-economic development and environmental protection. There are complex interactions among ESs, which are usually characterized by trade-off or synergy: trade-off means that enhancing one service weakens others, while synergy means that enhancing one service simultaneously enhances others [21,22]. Trade-offs and synergies are temporally dynamic and spatially heterogeneous, not static [23]. Ecosystem trade-offs not only significantly affect the ecosystem itself, but also intensify ecological and environmental challenges both within and beyond the region, thereby constraining sustainable regional development [24]. The issue of ES trade-offs has become a hot interest for researchers. Spearman’s correlation coefficient [25], Pearson’s correlation coefficient [26], Root Mean Square Deviation (RMSD) [27], and bias correlation [28] are frequently employed to assess ES trade-offs in the current study. The production possibility frontier (PPF) is a concept in economics that denotes the combination of the maximum amount of goods that an economy and society can produce given limited resources and technology [29]. PPF has been demonstrated to be applicable in the field of ESs, particularly in the analysis of nonlinear trade-off relationships. In ecosystems, PPF refers to a landscape configuration that achieves efficient provisioning of ES based on the Pareto principle, which can be optimized to enhance multiple services and achieve win-win situations [30]. It provides an integrated assessment of environmental system benefits, taking into consideration a number of factors, including geographic conditions and management practices [31]. The PPF curve’s points indicate the ideal configuration, where multiple ESs simultaneously achieve the highest efficiency [32]. The PPF approach describes quantitative relationships between ESs through curve shapes, providing a visual and integrated method for exploring trade-offs between ESs. It also allows for the assessment of how changes in one service affect others, thus supporting multi-objective decision-making. Sanon et al. developed a hypothetical trade-off analysis based on Pareto efficiency [33]. Ager et al. explored the trade-offs of different restoration scenarios through a spatial optimization approach and assessed them quantitatively using PPF [34].
Landscape ecological risk (LER) assessment integrates multi-source risk, synthesizes landscape structure and ecological processes, and investigates ecological risk impacts and dynamic trends induced by LUCC [35,36]. LER describes ecological risks’ spatial-temporal heterogeneity more precisely than the conventional ecological risk assessment and excels in spatial expressions and visualization of synthetic risks [37]. The ecosystem can be said to be in a state of safety when its function and structure are in a healthy condition while its risk level falls within a low level or acceptable threshold while offering ecological benefits to humans [38]. Present studies explore LER at a variety of different scales [3,4,39]. Mostly studies aim to identify the spatiotemporal evolution of LER and its driving factors [40] and to analyze its relationship with ES supply-demand dynamics [41] or ES value [2]. However, fewer studies investigate ES trade-offs in relation to LER. ESs are essential in linking people’s well-being with ecological processes and must be mainstreamed into landscape risk assessment as key endpoints [14,42]. Combining ESs and LER into one assessment framework can greatly contribute to bettering ecosystem management and risk avoidance. However, this integration remains limited, and translating this integration into actionable plans and policy remains a daunting undertaking, especially for regions experiencing severe environmental pressures and fragmented ecological processes.
The natural degradation trend is particularly pronounced in mountain ecosystems, where unique topographic barriers are the basis for multiple ESs [43]. The Hengduan Mountain region, situated in the southeastern part of the Qinghai-Tibetan Plateau, functions as an ecological barrier for the Yangtze River Economic Belt; it plays a pivotal role in biodiversity conservation in China [44,45]. The region is home to multiple ethnic groups in China and remains relatively underdeveloped in terms of socio-economic conditions. However, this area confronts serious ecological problems, including soil erosion, pressures from population, deforestation, and overgrazing [46]. Its complex topography, where there are mountains with sharp heights, deep valleys, and geological fragmentations, further increases environmental vulnerability [47]. This work seeks to develop a conceptual ecological zoning scheme by synthesizing ES trade-offs and LER, supporting local ecological protection efforts, and promoting sustainable regional progress. This study aims to: (1) develop an ecological zoning framework by integrating ES trade-offs and LER; (2) identify the spatiotemporal dynamics of trade-offs and LER and analyze the interrelationship between the two; and (3) construct an ecological zoning scheme based on the integration of trade-offs and LER.

2. Materials and Methods

2.1. Study Area

The Hengduan Mountain Region (97°10′–104°25′ E, 24°29′–33°43′ N) represents China’s most extensive and elongated north–south-oriented mountain system, located in southwestern China, spanning Sichuan, Yunnan, and Tibet, with a geographical area approximating 45 × 104 km2 (Figure 1). It lies within the transition zone between the first and second steps of China’s terrain, featuring complex topography, deep valleys, and steep mountains. The region is also the confluence of the three major geographical units of East Asia, South Asia, and the Tibetan Plateau [45]. Its general topography shows a tendency towards higher altitudes in the northwest and south and low altitudes in the southeast, with large elevation fluctuations, from a lowest elevation point of 302 m to a highest point of 7143 m. The southwestern part of this forest area ranks second among China’s forests. The Hengduan Mountain region, being a major part of this area, plays a major carbon sink function. The region’s total area is about 97% forestland and 41% grassland. The study area is one of China’s most affected by erosion [48]. Being the upstream area for a number of China’s major rivers and Southeast Asia’s rivers, the area boasts a well-established water network, rich water flow, and rich water resources [49]. Severe river erosion has shaped numerous river valley landscapes, further exacerbated by diverse climatic conditions and uneven precipitation [50].
The Hengduan Mountain region is an important carbon sink area in China, with dense water systems, uneven spatial distribution of precipitation, and prominent soil erosion problems. Therefore, this study selects net primary productivity (NPP), soil conservation (SC), and water yield (WY) as key indicators. NPP is a key indicator of regional carbon sequestration capacity and production potential, which can reflect the stability and carrying capacity of ecosystems [51]. SC plays a central role in preventing and controlling soil erosion, curbing land degradation, and maintaining regional ecological security, and it is an important function of ecosystems to support sustainable development [52]. WY represents the ecosystem’s function of regulating and supplying water resources, which supports other ecological processes [53]. The three indicators are based on the dimensions of carbon storage, soil and water conservation, and water supply, respectively, w enabling a multifaceted analysis of ecological characteristics and spatial heterogeneity.

2.2. Data Sources

Data on land use, vegetation type, soil, NDVI, and geomorphic type were acquired via the Resource and Environment Science and Data Center (RESDC), primarily based on Landsat imagery, and are provided as annual products. Land use data were categorized into seven classes and used in ESs and LER assessments. Vegetation type data supported parameterization of the CASA model, land cover classification in InVEST, and C-factor estimation in RUSLE. Soil data, including physical properties and texture, were used to estimate the K-factor in RUSLE and soil water availability in InVEST. NDVI, derived from annual maximum values based on Landsat 5/8, was used to evaluate vegetation productivity and cover. Geomorphic data, consisting of seven terrain types, supported the analysis of spatial variation in ESs and soil erosion. Meteorological data such as yearly mean temperature and total precipitation were retrieved from the National Meteorological Information Center for use in water yield modeling and rainfall erosivity calculation. Potential evapotranspiration was retrieved from the National Earth System Science Data Center. DEM data from the Shuttle Radar Topography Mission (SRTM), accessed via the Geospatial Data Cloud, were employed to derive slope-related variables and support hydrological modeling. Sub-watershed boundaries were extracted from the Geonetwork Opensource database.
All datasets were acquired from authoritative national data sources (Table 1). To ensure spatial consistency, 30 m resolution data were resampled to 1 km using bilinear interpolation. Preprocessing steps included cropping, projection transformation, resolution unification, and parameter calibration. The dataset spans from 2000 to 2020, offering consistent and long-term observations for spatiotemporal analysis of ESs and LER.

2.3. Methods

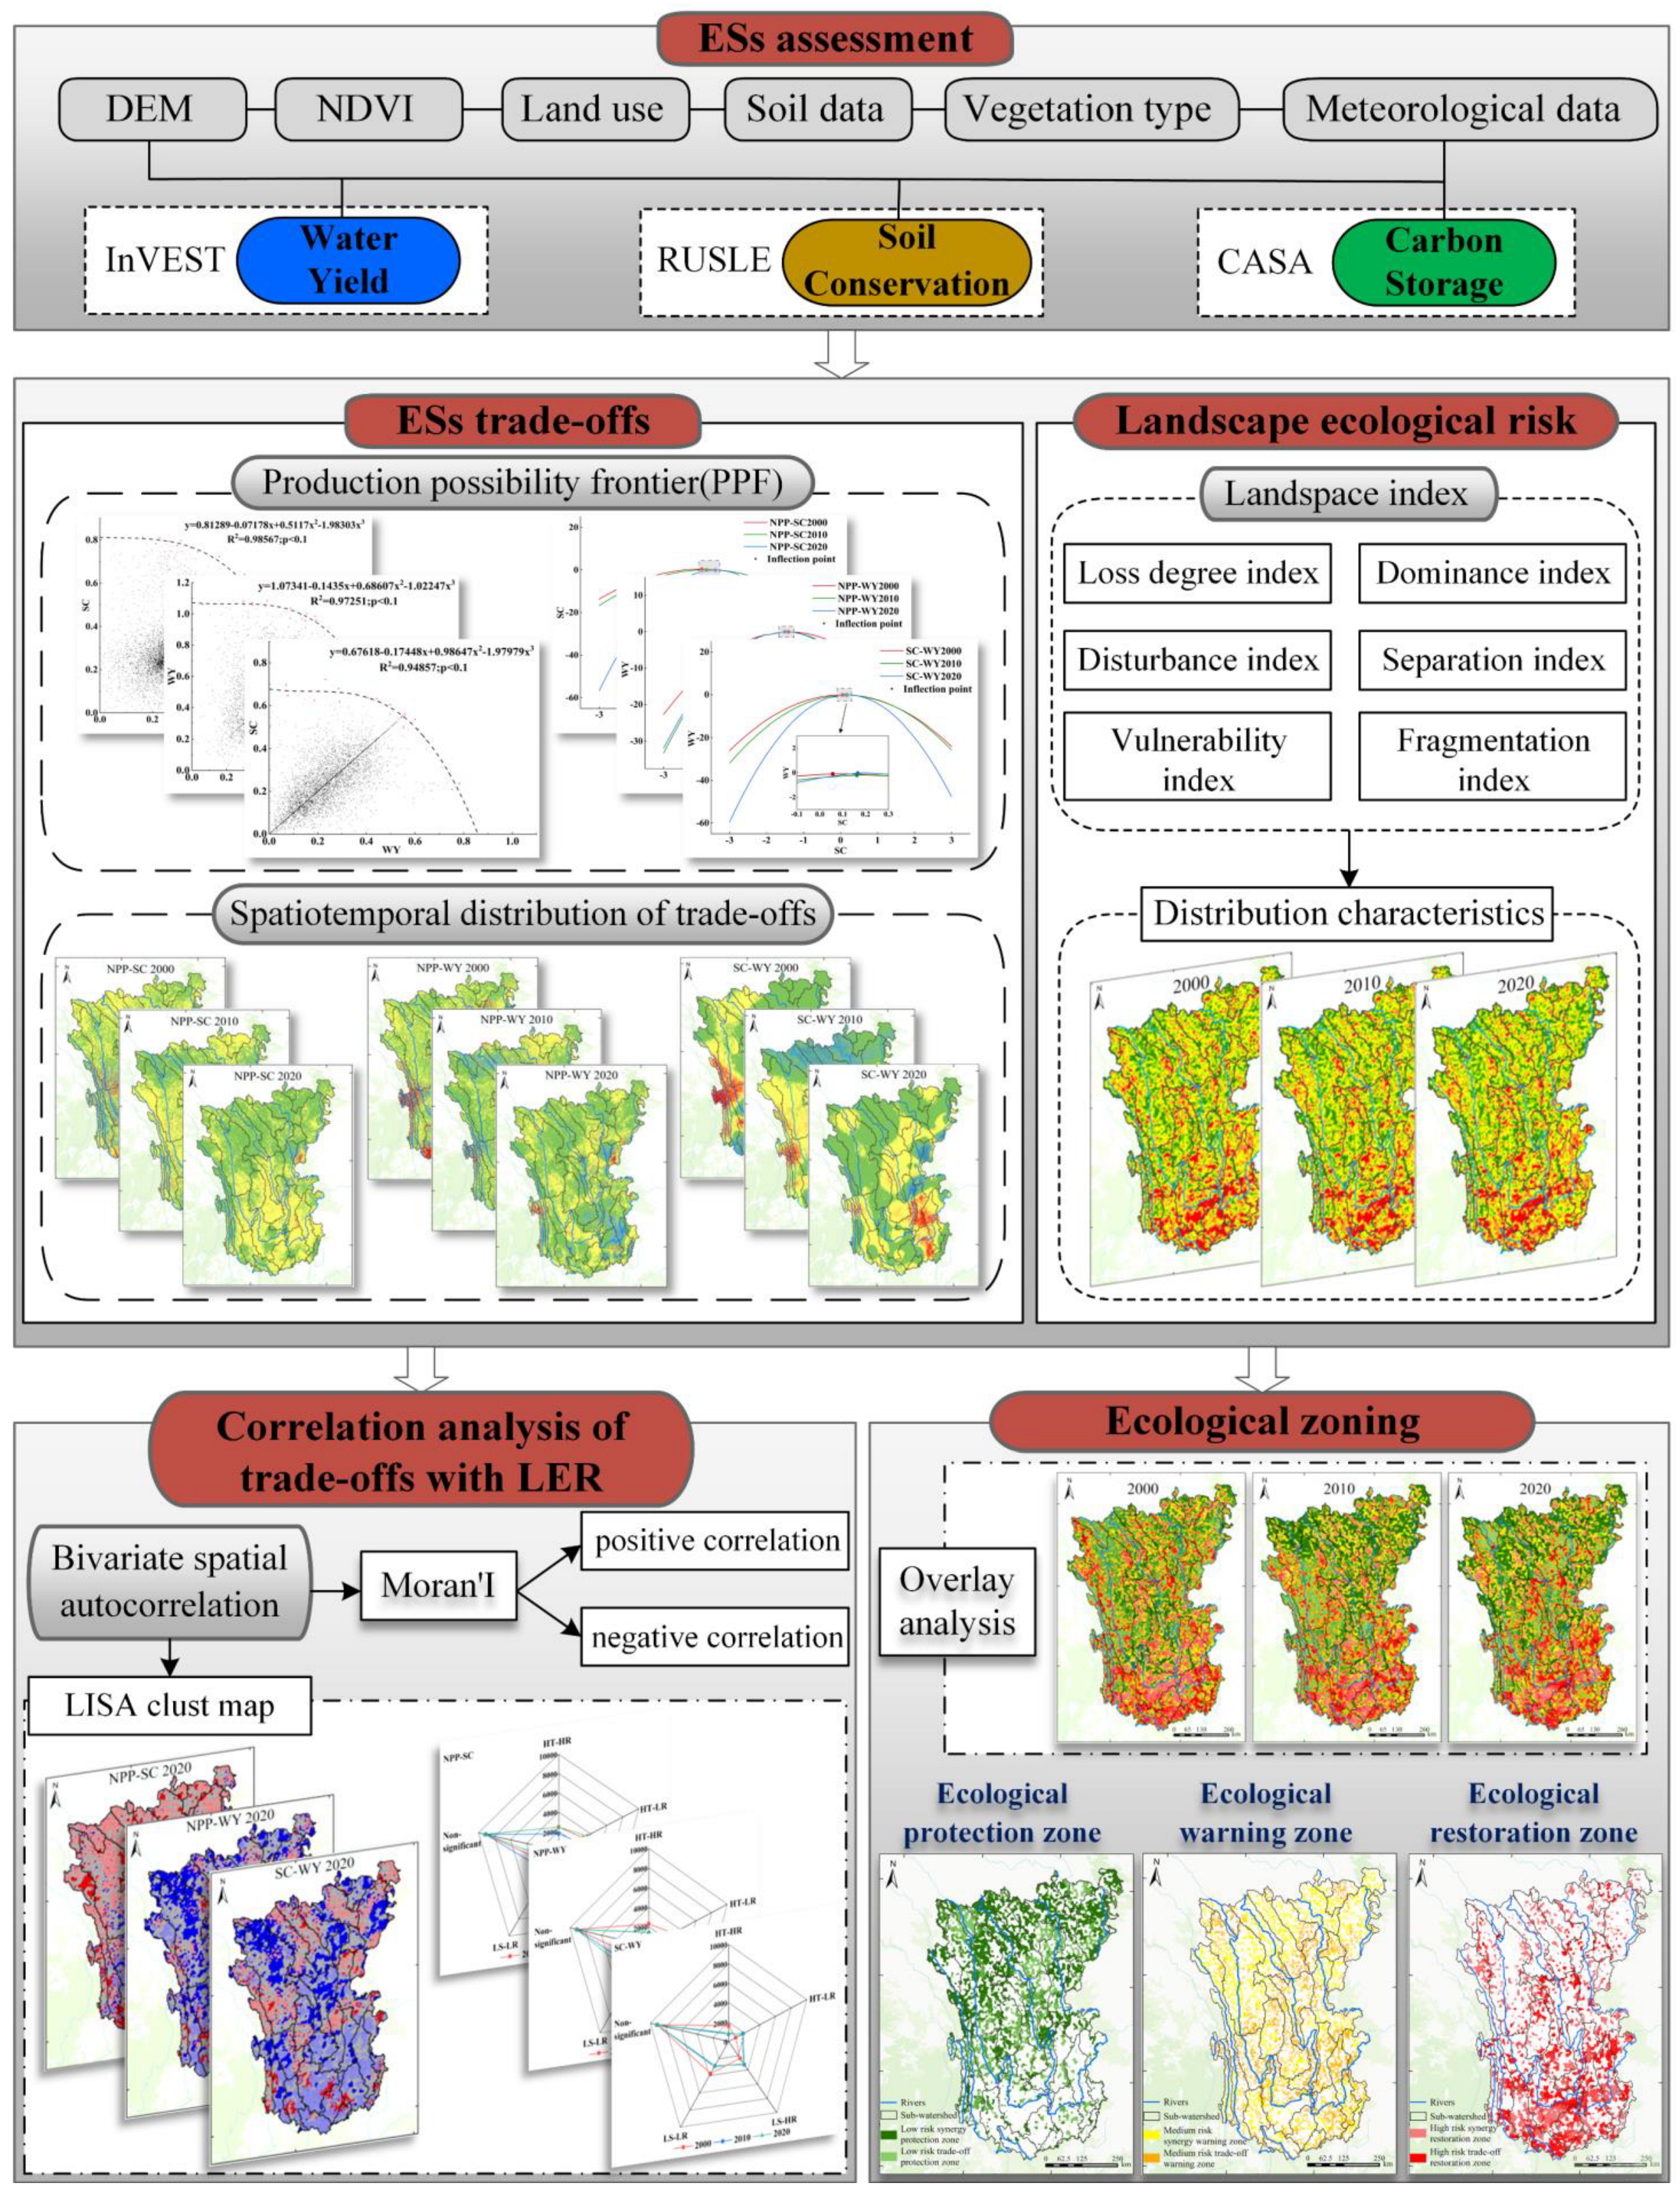
The assessment of ES is the basis for identifying the trade-off relationships of multiple services. For this study, we assessed WY, SC, and NPP based on the InVEST, RUSLE, and CASA models (Table A1), plotted the PPF curves for the three ES combinations using Origin 2022 software, and employed the difference comparison method to explore how trade-offs varied across both space and time. Then the ecological risk was assessed in combination with the landscape pattern. Spatial autocorrelation analysis was then used to reveal the correlation between the trade-offs and LER, and finally ecological zoning was delineated through superposition analysis, and corresponding management measures were proposed (Figure 2).

2.3.1. Ecological Zoning Method

Critical or sensitive areas can be identified based on an overlay zoning method, thereby guiding targeted management policies for regional sustainability [14]. This study constructs ecological zones using a zoning method based on spatial overlay. Grounded in a spatial analysis framework, this method integrates multiple ecological factors to delineate spatial units with specific ecological functions or management needs, thereby providing technical support for refined ecological management [7]. Before assessing ES trade-offs and LER, the input raster data were standardized using the maximum difference normalization method (Equation (1)) to eliminate dimensional differences and improve the consistency of model outputs. The raster calculator and overlay analysis tools in ArcGIS Pro 3.0.1 were then used to perform spatial overlay of ES trade-offs/synergies and LER levels, resulting in the ecological management zoning map.
Z i = Z i Z m i n Z m a x Z m i n
where, Z i represents the normalized value, Z i denotes the original value of the indicator, Z m i n and Z m a x refer to the minimum and maximum values of the indicator, respectively.
The weights for overlay analysis were determined using the Analytic Hierarchy Process (AHP), a multi-criteria decision-making method that systematically decomposes complex problems into hierarchical levels for comprehensive qualitative and quantitative evaluation [54]. AHP derives relative weights from a judgment matrix through eigenvector normalization [55]. The formula is:
E = i = 1 n W i · Z i
where, E denotes the ecological factor evaluation value, W i denotes the weight of the i t h factor, and Z i the standardized value of the i t h ecological factor. The weights of ES trade-off and LER were obtained as 0.5 and 0.5 based on AHP. The raster calculator and overlay analysis tools in ArcGIS Pro 3.0.1 were then used to perform spatial overlay of ES trade-offs/synergies and LER levels, resulting in the ecological management zoning map.

2.3.2. Production Possibility Frontier

PPF represents how various products or services interact in terms of trade-offs, assuming optimal utilization of available resources [56]. Any point on the PPF curve is a combination that cannot be further optimized without growing the cost of other services and is known as the Pareto efficient point [57]. The shape of the PPF curve varies depending on how different ESs are represented, taking forms such as concave, exponential decay, or other complex patterns, reflecting the complex relationships among services [58]. The opportunity cost of the ES represented by the vertical coordinate is thought to be the first-order derivative of the PPF. It reflects the amount by which the service represented by the vertical coordinate decreases for each unit increase in the ES represented by the horizontal coordinate. The inflection point represents the region where the PPF is relatively stable. The formula is:
E S i ( R ) E S i ( R ) i 1,2 E S j R > E S j R j 1,2
where, E S i and E S j represent the functions for the i t h and j t h objectives, respectively, which are the decision schemes for optimal R , and R is the other decision scheme. When comparing R and R , the value of all objectives E S i is not less than the value of R on R , and the value of at least one objective E S j is strictly larger than the value of R on R . In this way, R is a valid decision scheme under the premise of the Pareto principle.
It is assumed that the ultimate goal of the trade-off is to realize the equilibrium state of the optimal combination formed by the two systems. Under the given conditions, only one PPF curve can be obtained, indicating that the equilibrium state is unique [59]. The shortest distance between the PPF curve and the point corresponding to the mean value of the two ESs can be used, based on these assumptions, to express the trade-off strength. The formula is:
D m i n = m i n P x 0 , y 0 Q x , f x = m i n x 0 x 2 + y 0 y 2
where, P x 0 , y 0 denotes the coordinates of the mean value of the two ESs. Q x , f x denotes any point on the curve. D m i n denotes the shortest distance between point P and point Q , which is the trade-off strength. The trade-off strength increases with the value of D m i n .

2.3.3. Measuring the Trade-Offs of ESs

For analyzing trade-offs and synergies among ESs, it has been shown previously that a useful instrument for this purpose is the difference comparison approach [60]. The formula is:
A = E i , t 1 E i , t 2 × E j , t 1 E j , t 2
where, A presents the product value between two ESs of E i and E j within the time interval t 1 t 2 . A synergistic relationship holds among ESs if a product value from change is >0, while a trade-off relationship holds if a product value from change is <0.

2.3.4. LER Assessment

Land use not only serves to be a driving force behind ES change but also one of the major sources of risks in LER studies [61,62]. The interconnection between regional LER and landscape pattern makes the two indissoluble [8]. The formulas are:
L E R i = i = 1 m A k i A k L i
L i = S i × F i
S i = a C i + b N i + c D i
where, L E R i denotes the LER of landscape i , A k i represents the spatial area of landscape i within the k t h study unit, while A k corresponds to the total area of the k t h study unit. L i indicates the loss degree index, and m refers to the number of landscape types. S i denotes the landscape disturbance index, whereas F i represents the landscape vulnerability index, which is determined by various land use types. C i , N i , and D i indicate the landscape fragmentation, separation, and dominance indices, respectively. The weight factors of the three landscape indices are denoted by a , b and c , where a + b + c = 1 . The coefficients a, b, and c are given respective values of 0.5, 0.3, and 0.2 [3,63].

2.3.5. Bivariate Spatial Autocorrelation Model

Spatial autocorrelation analysis serves as a tool to quantify clustering patterns and the correlation degree of specific variables within a given spatial context [64]. In this study, a bivariate spatial analysis model was applied to examine the spatial relationships and disparities between LER and trade-off interactions in the Hengduan Mountain region. Additionally, local spatial correlation indicator clusters (LISA) and Moran’I were employed to reflect the spatial management structures and spatial correlations among different regions. The formula is:
I = i = 1 n j = 1 n w i j x i , u x u ¯ x i , r x r ¯ σ u σ r i = 1 n j = 1 n w i j
where, the coefficient I represents the bivariate spatial autocorrelation index for the trade-off and LER. The ES trade-off index for the i t h assessment unit is denoted as x i , u , while the LER index is represented as x i , r . The weight matrix w i j captures the spatial dependency between units i and j , whereas σ u and σ r indicate the corresponding variances.

3. Results

3.1. Ecosystem Services Assessment

3.1.1. Spatial and Temporal Analysis of ESs

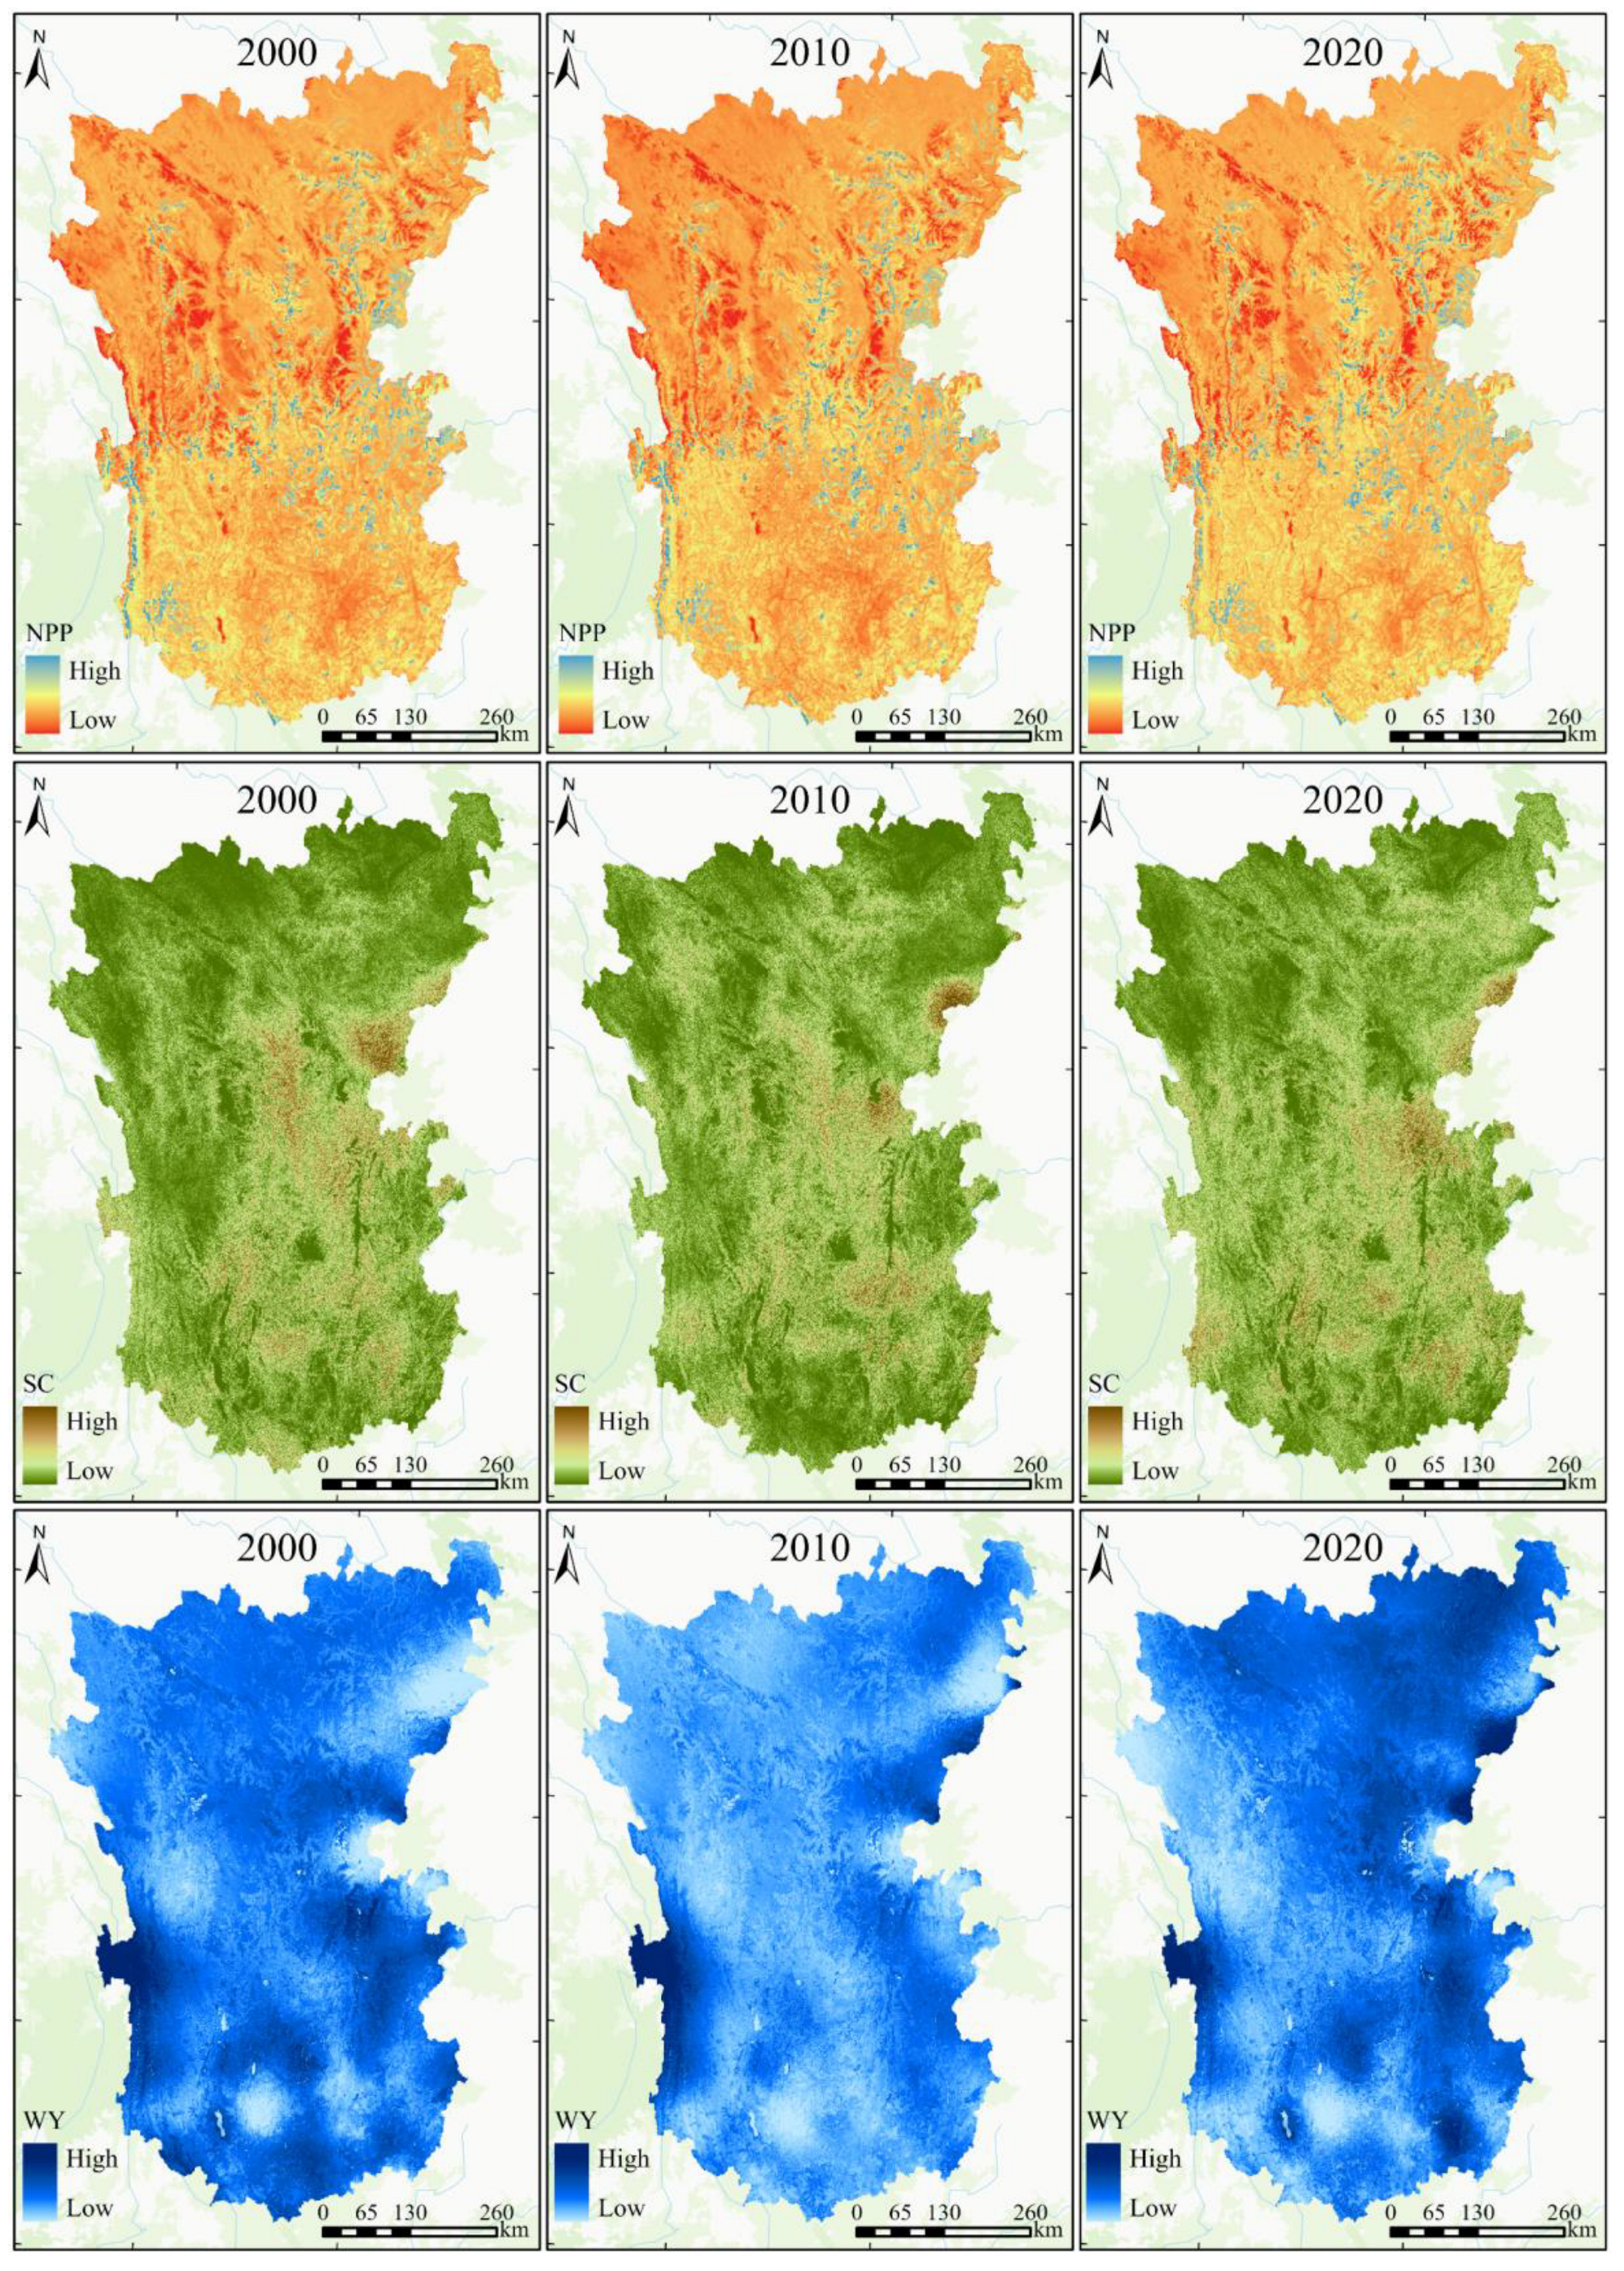
NPP, SC, and WY exhibited pronounced spatial heterogeneity and regional differentiation across the Hengduan Mountain region (Figure 3). NPP generally followed a spatial pattern of high values in the south and lower values in the north, with elevated values primarily distributed along river corridors. In 2020, the average NPP was 0.26. It slightly increased during 2000–2010 but declined thereafter. SC showed a spatial pattern of high values in the east and low values in the west, predominantly in areas with significant topographic variation. Its average value decreased initially and then rose, reaching 0.08 in 2020. WY presented a distinct pattern, with higher values around the periphery and lower values in central regions, particularly in the western border areas. Its mean value also reduced and then rose, reaching 0.23 by 2020.

3.1.2. Correlation Analysis of ESs

The Moran’I of NPP, SC, and WY were obtained by spatial autocorrelation analysis over the 2000–2020 period (Table 2). The three ESs’ Moran’I were all positive and between 0.45 and 0.85, indicating significant positive spatial correlation. The associated z-values scores exceeded 1000 for all three ESs, reflecting strong spatial clustering with high statistical significance. Among them, the spatial correlation of WY was the strongest, the correlation of SC was weaker, and the spatial aggregation of NPP was more stable but slightly dropped.

3.2. ES Trade-Offs Assessment

3.2.1. Assessment of Overall ES Trade-Offs

NPP-SC, NPP-WY, and SC-WY in the Hengduan Mountain region mainly exhibit concave trade-offs (Figure 4). According to the concave trade-off, other ESs must be sacrificed in order to increase one ES. The PPF curves of NPP-SC were steeper in 2000 than in other years. Before the inflection point, the growth in NPP was accompanied by a synchronized rise in SC, which exhibited synergy. After surpassing the inflection point, the expansion in NPP triggered a notable reduction in SC, indicating a clear trade-off that reflects the intense pressure of land development and significant ES conflicts during that period. In 2010, the curve flattened out, while in 2020 the curve significantly shrunk inward. The PPF curve of NPP-WY exhibited both convex and concave trade-off properties. Before the inflection point, the trade-off was convex, which means that a smaller loss in WY was exchanged for a rise in NPP. This pattern indicates that while NPP rises with warmer temperatures and extended growing seasons, the accompanying rise in evapotranspiration reduces WY, leading to a trade-off characterized by productivity gains at the expense of water resources. After the inflection point, it changed into a concave trade-off, which means that a larger loss in WY was needed to realize a growth in NPP. The curve significantly shrunk and was steeper in 2010. The SC-WY PPF curve was flatter in 2000 and 2010, showing a gradual decline in SC as WY showed an upward trend, and in 2020 the curve significantly contracted inward, which was related to the slope and land cover changes in the study area.
The first-order derivative of NPP-SC was steeper in 2020 than in other years. A rise in NPP before the inflection point was accompanied by a significant increase in SC, and a fall in NPP after the inflection point led to a significant fall in SC. The inflection point of the first-order derivative of NPP-SC showed an overall rightward trend. The minimum opportunity cost of SC was 0.07 when NPP was used as a measure, and the minimum opportunity cost of NPP was 0.09 when SC was used as a measure. The difference in the first-order derivatives of NPP-WY was small, and the curves of the derivatives of 2010 and 2020 almost overlap, while the inflection point of NPP-WY showed a trend of shifting to the left as a whole. The minimum opportunity cost of WY was 0.003 when NPP was used as a measure and 0.21 when WY was used as a measure. The first-order derivatives of SC-WY were steeper in 2020, and the inflection point showed a smaller difference in the overall rightward trend. The minimum opportunity cost of WY was 0.04 when SC was used as a measure and 0.06 when WY was used as a measure. The trade-off strength was determined using the minimal distance from the average point to the PPF curve (Table 3). The trade-off strengths of NPP-SC, NPP-WY, and SC-WY all showed a downward trend. NPP-SC declined by 11%, NPP-WY by 14%, and SC-WY by 40%. SC-WY had the highest trade-off intensity of 0.71 in 2000, and NPP-SC had the lowest trade-off intensity of 0.42 in 2020.

3.2.2. Assessment of Overall ES Trade-Offs

In the Hengduan Mountain region, there was notable spatial heterogeneity in the distribution of ES trade-offs (Figure 5). The NPP-SC high trade-off was located between the middle reaches of the Jinsha River and lower Yalong River, whereas regions of high synergy appeared between the middle Jinsha River and lower Lancang River in 2000. The NPP-WY high trade-off was mainly found in the Nujiang and Dadu River basins, the middle Jinsha River, and the study area’s southern boundary, while high synergy occurred primarily in the middle Yalong River, the lower Jinsha River, and the Yalong River’s confluence. The SC-WY high trade-off was concentrated in the Nujiang River basin and near the middle Lancang River, whereas high synergy was distributed in the middle Jinsha River and along the southwest edge of the region. By 2010, the NPP-SC high trade-off was concentrated in the lower Jinsha River. Both the NPP-WY high trade-off and high synergy declined significantly and sporadically appeared in the upper Nujiang River and the lower Yalong River. The SC-WY high trade-off prevailed primarily within the upper Nujiang River, middle Lancang River, and lower Yalong River, whereas high synergy prevailed mainly between the Yalong and upper Dadu Rivers. The NPP-SC high trade-off prevailed in 2020 across the east Dadu River basin and lower Yalong River. The NPP-WY high trade-off prevailed within the upper Nujiang River and lower Dadu River, whereas high synergy prevailed in the lower Jinsha and Dadu Rivers. The SC-WY high trade-off prevailed in the lower Yalong and Jinsha Rivers, whereas high synergy prevailed within the middle Yalong River and lower Dadu River. NPP-SC trade-off zones are mainly concentrated in areas with broken topography, high landscape fragmentation, frequent human activities, and significant conflicts between services; synergistic zones are mainly distributed in the lower reaches of the Lancang River, where ecological restoration efforts such as returning farmland to forests were implemented earlier, resulting in a clear synergistic effect. NPP-WY trade-off zones are mostly located in regions with fragile hydrological regulation and abundant but unstable precipitation; the lower reaches of the Yalong River mainly show synergy due to abundant water-sourcing and nutrient-conserving forest land resources. The SC-WY trade-off was mainly distributed in the watershed’s central zone, marked by a large slope, highly dissected landforms, and serious soil erosion; the synergy zone is concentrated in areas with extensive ecological engineering and well-established protection measures, where water source regulation has created a positive feedback on the soil retention capacity. The area of NPP-SC and NPP-WY trade-off exhibited a decreasing trend from 2000 to 2020, whereas the area of SC-WY trade-off exhibited a rising trend. NPP-SC and NPP-WY were controlled by a change from a low trade-off to a low synergy area, whereas SC-WY was controlled by a change from a low synergy to a low trade-off area. The NPP-SC area of high trade-off mainly changed to low trade-off, and the NPP-WY area of high trade-off mainly changed to low synergy, whereas the SC-WY area of high trade-off mainly changed to medium trade-off. The area of high trade-off and high synergy for the three ESs dropped between 2000 and 2010. The high synergy area of the three groups of ESs continued to weaken, with the high trade-off area of NPP-SC and NPP-WY falling and the high trade-off area of SC-WY increasing between 2010 and 2020.

3.3. Spatiotemporal Evolution of LER

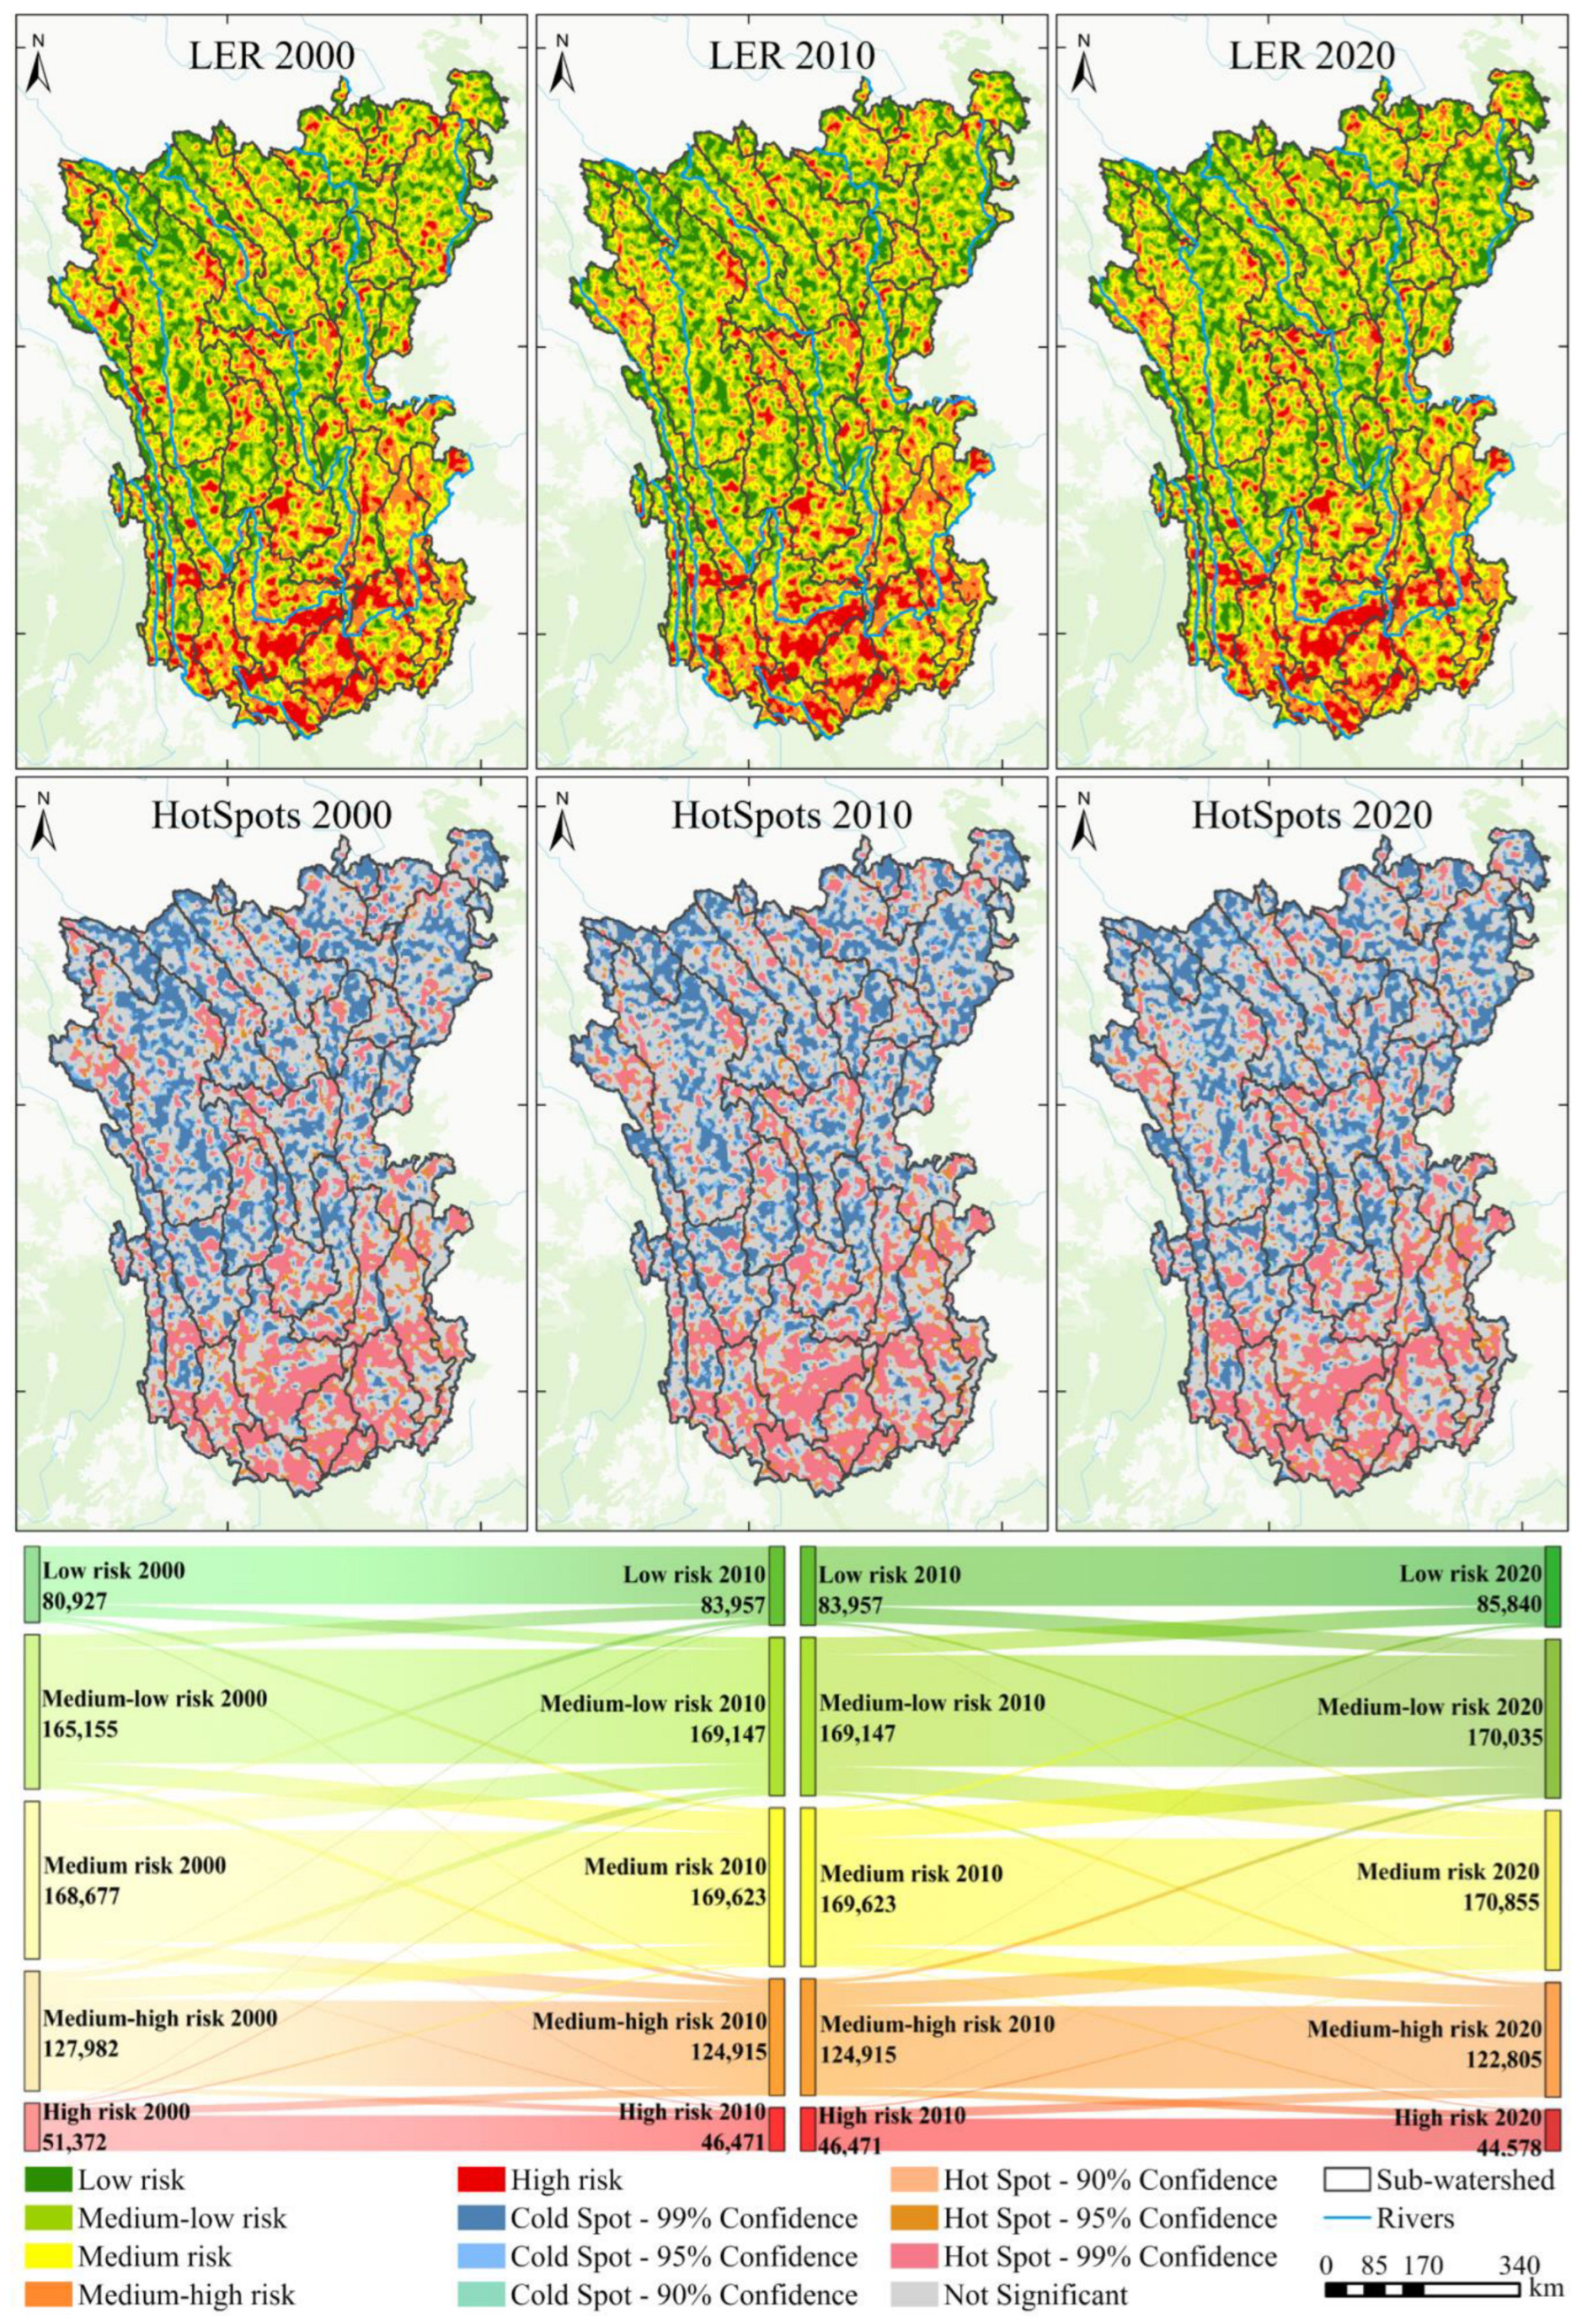
The average value of LER in the Hengduan Mountain region decreased from 0.92 in 2000 to 0.91 in 2010 and further decreased to 0.90 in 2020, indicating a general downward trend. In this study, based on the natural breakpoint method using 2020 as the reference year, the LER values were automatically divided into five classes with the help of ArcGIS Pro 3.0.1: low risk (0.04 ≤ LER < 0.69), medium-low risk (0.69 ≤ LER < 0.87), medium risk (0.87 ≤ LER < 1.04), medium-high risk (1.04 ≤ LER < 1.26), and high risk (1.26 ≤ LER). The LER in the study area displayed a spatial pattern of “high in the south and low in the north” with regard to spatial distribution (Figure 6). Low-risk and medium-low-risk zones were primarily located in central and northern regions, with low-risk areas mainly concentrated in major river headwaters. The medium-risk zone, which served as a transition zone, was mostly situated on the periphery of the medium-high- and high-risk zones. In contrast, the southern part of the study area was primarily home to the high-risk and medium-high-risk zones, which exhibited a trend of gradual contraction toward the southeast. The high-risk zone was primarily situated in the area surrounded by the middle Jinsha River, lower Lancang River, and Lishe River. In 2020, the medium-risk area made up 29.48% of the total, followed by low risk, and medium-low-risk areas at 43.07%, and high-risk and medium-high-risk areas together made up 27.45%. While the medium-risk, medium-low-risk and low-risk zones increased from 2000 to 2020, high-risk and medium-high-risk areas declined. Medium-risk areas dominated the LER area conversion, and the overall level of LER showed a declining tendency. The transfer patterns of risk areas remained the same during 2000–2010 and 2010–2020. The medium-risk area consisted of medium-high and medium-low risk, while the high-risk area primarily shifted to the medium-high-risk area and the low-risk area primarily shifted to the medium-low-risk area.
The Getis-Ord Gi* statistic was used to detect spatial clusters of LER hot and cold spots in the Hengduan Mountain region during 2000–2020 (Figure 6). These identified clusters were categorized into cold spots, hot spots, and non-significant areas, where hot spots represent regions with higher LER values. In 2020, cold spots and hot spots accounted for 28.59% and 24.64% of the LER region, respectively. The hot spots were mainly concentrated in the south of the study area, especially in the lower reaches of the Jinsha River, while the cold spots were mainly located in the upper reaches of the major rivers in the central and northern parts.

3.4. Correlation Analysis of ES Trade-Offs with LER

The correlation between ES trade-offs and LER in the study area was investigated using bivariate global spatial autocorrelation analysis, and the Moran’I was calculated (Table 4). A positive Moran’I indicates a negative relationship in relation to the trade-off and LER, while a negative Moran’I indicates a positive correlation. The finding of the analysis revealed that from 2000 to 2010, the correlation between LER and NPP-SC trade-off with Moran’I was negative and reduced, the correlation between LER and NPP-WY trade-off with Moran’I decreased and increased, and the correlation between LER and SC-WY trade-off with Moran’I changed from negative to positive. Therefore, NPP-SC plays an inhibitory role in the rise of LER, while NPP-WY and SC-WY have a promotional role in the rise of LER. Among them, NPP-SC dominated and thus dropped the LER. From 2010 to 2020, the LER and NPP-SC trade-off were positively correlated, and the correlation rose; the Moran’I of NPP-WY shifted from a positive to a negative correlation, thus showing synergy; SC-WY was positively correlated, and the correlation showed a downward trend. The inhibitory effect of NPP-SC on LER was weakened and no longer dominant, while NPP-WY and SC-WY together inhibited the rise of LER.
Bivariate local spatial autocorrelation analysis generated LISA aggregation maps for the Hengduan Mountain region, revealing spatial relationships between ES trade-offs and LER (Figure 7). HT indicates that ESs exhibit trade-off relationships, while LS indicates synergy relationships. The types of association scenarios included synergy-high risk (LS-HR), synergy-low risk (LS-LR), trade-off-high risk (HT-HR), trade-off-low risk (HT-LR), and non-significant. The correlation between the three groups of ES trade-off and LER varied significantly. From 2000 to 2010, the NPP-SC was dominated by an increase in LS-LR area and a decrease in HT-HR area. In the northern study area, the LS-LR area rose while the HT-LR area diminished near the upper Jinsha River. The southern area was dominated by HT-HR, with LS-HR climbing significantly on the southern side of the lower Jinsha River in 2010. LS-LR in NPP-WY grew significantly, and HT-HR and HT-LR fell significantly. In 2010, LS-HR dominated the lower Jinsha River in the south, while LS-LR prevailed in the upper Jinsha River. HT-HR and LS-LR in SC-WY declined significantly. HT-LR in the north and LS-HR in the south expanded significantly, while HT-HR was scattered in the central and southern regions. The overall reduction in HT-HR across all three ES groups negatively affected the intensity in LER. From 2010 to 2020, HT-LR heightened while LS-LR decreased in NPP-SC. In 2020, HT-LR dominated the upper reaches of the major rivers in the north, while HT-HR was mainly distributed in the upper reaches of the Lancang River and the south side of the middle reaches of the Jinsha River. There was a notable increase in the LS–LR area for NPP–WY, primarily located across the middle and upper Jinsha River and the upper Yalong River. The area share of HT-HR was slightly increased, which was concentrated near the lower Jinsha River. SC-WY mainly showed a slight go-up in the area of HT-HR and LS-LR. Among them, HT-HR was mainly located in the lower Jinsha and Yalong Rivers, while LS-HR remained dominant in the middle and lower reaches of both rivers. The upper Jinsha River shifted from HT-LR to LS-LR. Although the HT-HR grew across all three ES groups, LS-LR in NPP-WY and SC-WY rose, and the HT-LR area of NPP-SC climbed, which suppressed the increase in LER.

3.5. Spatiotemporal Pattern of Ecological Zoning

This study constructed an ecological zoning system for the Hengduan Mountain region by integrating the combined trade-offs of three groups of ESs from 2000 to 2020 with LER through overlay analysis (Figure 8). The overlay analysis identified six ecological zones: low-risk synergy protection zone, low-risk trade-off protection zone, medium-risk synergy warning zone, medium-risk trade-off warning zone, high-risk synergy restoration zone, and high-risk trade-off restoration zone. The low-risk area in the study region increased significantly from 2000 to 2020, primarily in the northern part and along both sides of the main rivers. Specifically, the low-risk synergy protection area increased by 21.40%, while the low-risk trade-off protection area reduced by 16.56%. In 2020, the low-risk synergy protection zone was mainly found in the upstream of the Jinsha and Dadu Rivers and the midstream of the Lancang River and the Minjiang River basin, whereas the low-risk trade-off protection zone was concentrated in the midstream of the Yalong and Dadu Rivers. Similar to the trend in the low-risk zone, medium risk showed an upward trend. The medium-risk synergy warning area increased by 6.84%, while the medium-risk trade-off warning area decreased by 5.63%. Medium-risk areas were largely situated around the outer boundaries of low-risk areas. In 2020, the medium-risk trade-off warning zone was sporadically distributed in the middle and upper reaches of various rivers, while the medium-risk synergy warning zone was concentrated along the central course of the Yalong River and the middle-to-lower sections of the Jinsha River. The high-risk area was reduced, mainly in the southern region. Among them, the synergy restoration area within the high risk shrank by 10.07%, and the high-risk trade-off restoration area contracted by 2.04%. In 2020, the high-risk trade-off restoration zone was primarily located in the Lishe River basin, the middle Yalong River, and the confluence of the Jinsha and Yalong Rivers, while the high-risk synergy restoration zone was found along the south-central and lower sections of the Jinsha River.

4. Discussion

4.1. Adaptive Management for Ecological Zoning

Developing management strategies based on ecological zoning enhances ecosystem precision management [3]. Six categories were classified from the ecological zoning in this study (Figure 8) and were further categorized into three types of management zones: ecological protection zone, ecological warning zone, and ecological restoration zone (Figure 9). The specific management measures are described below:
(1)
Ecological protection zone: Includes low-risk synergy protection zone and low-risk trade-off protection zone. Mainly in high-elevation areas, dominated by forest and grassland. These regions should be incorporated into the national or local ecological conservation redline, with key conservation areas clearly delineated to enhance ecosystem integrity and stability. It is recommended to strictly implement the Natural Forest Protection and Restoration Program, prevent illegal logging and deforestation, avoid anthropogenic interference, and maintain ecological balance. With high-relief mountains and hills, the region requires soil erosion control to maintain long-term ecological stability [65]. In accordance with the Soil and Water Conservation Law, efforts should be made to minimize surface disturbance and vegetation damage in critical areas to prevent further degradation. Forest cover can be increased through artificial afforestation and other means to enhance carbon storage and water conservation capacity [8].
(2)
Ecological warning zone: Includes medium-risk synergy warning zone and medium-risk trade-off warning zone. Primarily in the middle elevation areas, with grassland and cultivated land dominance. It is recommended to implement rotational grazing and grazing ban systems, promote grassland sealing techniques, and plant efficient grass species to increase carbon storage and reduce the erosion risk. The region has a complex topography, including low-relief mountains, medium-relief mountains, and extreme high-relief mountains, and soil and water conservation should be strengthened, and the project of returning farmland to forest and grassland to farmland should be promoted to expand the ecological green space [66]. In alignment with the Grassland Law and the grassland ecological subsidy and reward policy, governments are encouraged to subsidize programs for restoring degraded grasslands. Horizontal ecological compensation mechanisms and watershed-based compensation systems should be introduced, delineating high ecological value grasslands and arable land to facilitate coordinated intergovernmental governance. Due to the serious landscape fragmentation, landscape connectivity can be improved through the construction of ecological corridors to optimize the biohabitat environment in the region and enhance ecological mobility [7].
(3)
Ecological restoration zone: Includes high-risk synergy restoration zone and high-risk trade-off restoration zone. Largely in low elevation areas, characterized by cultivated and urban lands. In accordance with the Outline of the National Territorial Spatial Master Plan, it is necessary to optimize production-life-ecology space, relieve human activity pressure, and limit land development [67]. With plains, terraces, and medium-relief mountains, the region should integrate urbanization and arable land protection, strengthen basic farmland management, and improve soil and water resource efficiency [68]. The focus should be on restoring ecologically fragile areas such as dry and hot river valleys, enhancing ecological supervision of watersheds, and prioritizing the restoration of functions in ecologically sensitive areas [69]. In addition, the land use structure should be optimized to achieve coordination between ecological protection and economic development [70]. Economic compensation mechanisms should be implemented to support key ecological function zones where development is restricted or prohibited due to environmental conservation efforts, thus offsetting the economic losses incurred from limited development opportunities.

4.2. Targeted Management of Priority Ecological Restoration Zones

Ecological restoration refers to restoring degraded or damaged ecosystems through rehabilitation and reconstruction to restore ecological functions and enhance ESs while providing economic and environmental benefits [71]. The UN recognized the Decade on Ecosystem Restoration between 2021 and 2030 to address global environmental damage and ecological challenges [72]. This study focused on the restoration of the high-risk trade-off region in the Hengduan Mountain region, which was analyzed by overlaying it with three ES trade-offs in 2020 to obtain the priority restoration zones in the study area (Figure 10). The three groups of ES trade-off regions (Zone Ⅰ) accounted for 5.84%, mainly in the middle Jinsha River and the lower Dadu River. Zone Ⅰ faces a synergistic degradation of soil erosion and carbon sink functions, which should be prioritized for comprehensive restoration and the implementation of the integrated management system of terraced forests and grasses and vegetation [73]. The NPP-SC and NPP-WY trade-off regions (Zone Ⅱ) are mainly in the middle-lower Jinsha River and lower Lishe River. Zone II should be optimized in terms of vegetation structure and implement strip thinning with supplemental planting of deep-rooted shrubs due to the prominent contradiction between vegetation transpiration water consumption and carbon sequestration [74]. NPP-SC and SC-WY trade-off regions (Zone III) accounted for the highest proportion of 39.45%, which is found in the lower Lancang River and the lower Yalong River. In Zone III, runoff scouring and carbon loss are significant, which should be centered on improving soil erosion resistance while promoting vegetation contour planting [75]. The NPP-WY and SC-WY trade-off regions (Zone Ⅳ) are more dispersed in their distribution, mainly located in the upper Nujiang, Lishe, and Minjiang Rivers, at the confluence of the Jinsha River and the Yalong River, as well as in the middle Dadu River. Zone Ⅳ faces challenges of declining water production function and imbalanced soil and water conservation, which should be aimed at the reconstruction of water source function, the strengthening of intelligent control of water sources, and the implementation of water-saving irrigation technology [76]. The results of the three groups of ES trade-offs overlaid with the high-risk trade-off, respectively, showed a decentralized spatial distribution. The NPP-SC zone should optimize soil structure and focus on promoting conservation tillage systems. The NPP-WY zone should aim for the efficient use of water and optimize the vegetation configuration structure. With the largest percentage of 2.88%, the SC-WY zone needs to focus on the synergistic regulation of soil and water and rationally develop and utilize soil and water resources.

4.3. Limitations and Future Perspectives

LUCC in this Hengduan Mountain region promotes trade-off intensity between ecosystems by altering ecosystem structure and function. In line with previous research [77], the ES trade-off between NPP, SC, and WY was spatially heterogeneous in this area. This study demonstrated trade-off intensity between those ESs declined gradually, in line with those observed by Wang et al. [78] and Lin et al. [79], and further pointed out NPP, SC, and WY mainly showed synergies. In this current work, ESs, NPP, WY, and SC were mainly considered while excluding other ESs such as biodiversity and cultural services. Exclusion of these ESs can generate ES trade-off limitations, as well as synergetic relations. Humans also have multiple complex impacts on ecosystems, especially in spatial autocorrelation analysis with trade-offs. Additional ESs may be incorporated in subsequent research to enable a more comprehensive evaluation of trade-offs.
The environmental condition in mountainous areas is vulnerable because of steep slopes and erosion-prone lands, whereas ecological hazards such as erosion and degradation are confronting them [2]. Through the ecological conservation red line, the boundary of city expansion, mountains, water, forests, fields, lakes, and grasses’ holistic conservation project [77,80], the overall LER in this area indicates a decreasing trend; this finding complies with Yang et al. [81]. The abundant forests and grasslands in the northern study area constitute a key ecological barrier [82] and enhance the stability of the ecosystem through water conservation [83]. The arid river valleys in the south are experiencing strong burning wind effects, which make them among China’s most fragile ecosystems [84]. The high landscape fragmentation intensifies human-land conflicts [78]. Therefore, LER levels are higher in the southern region than in the north (Figure 6). The current assessment uses LUCC as the primary proxy for landscape ecological risk. However, ecological risk is a multidimensional concept, and excluding factors such as climate change or environmental pollution may result in an incomplete risk evaluation [14]. Especially at the scale of ecological regionalization, land use patterns, human pressures, and ecological responses show high spatial variability. The current framework may not fully capture these dynamics, which could reduce the adaptability and accuracy of the zoning outcomes. Future studies should consider incorporating ecological risk factors such as climate change, pollution, and invasive species, along with the use of established frameworks like the Driver–Pressure–State–Impact–Response (DPSIR) for ecological risk assessment.
The dominant ESs differ from year to year, while changes in LER cannot be judged solely by changes in the relevance of a single ES portfolio, and ecosystem interactions collectively influence trends in LER. Therefore, joint management of ES trade-offs and LER is particularly necessary [85,86]. In addition, the use of decadal intervals in this study may also constrain the understanding of the nonlinear, long-term, and nonstationary relationships between ESs and ecological risk. Future research should consider using longer time series or finer temporal resolution to better analyze these dynamics [87]. Additionally, data resolution is critical, and higher-resolution datasets will be considered in future evaluations. Finally, the ecological status of the Hengduan Mountain region can be analyzed more systematically by integrating multiple ecological factors, such as ecological health and ecological security, thus providing a more scientific basis for regional ecological conservation and sustainable growth.

5. Conclusions

This study quantifies key ES trade-offs in the Hengduan Mountain region using the PPF and difference comparison method, examines the spatiotemporal evolution of LER, reveals the relationship between LER and ES trade-offs through bivariate spatial autocorrelation analysis, and formulates ecological zoning and puts forward management strategies. The main conclusions are: (1) The study area mainly exhibits concave trade-offs, with trade-off strength gradually decreasing. The NPP-SC trade-off area shrank, with high trade-off areas sporadically distributed in the Dadu and Yalong River basins. The NPP-WY trade-off area declined, with high trade-off mainly concentrated in the Nujiang River upstream and along the eastern border. The SC-WY trade-off area increased and moved eastward from the western region. (2) The overall LER level dropped annually, with higher risks in the south and lower risks in the north. The medium-risk area accounted for 29.48% of the total; the low-risk and medium-low-risk areas together made up 43.07%, and the high-risk and medium-high-risk areas together made up 27.45%. (3) Using bivariate spatial autocorrelation analysis, LER showed a positive correlation with NPP-SC, shifting from negative to positive with NPP-WY and from positive to negative with SC-WY. The HT-HR area for NPP-SC, NPP-WY, and SC-WY first reduced, then rose, but showed an overall decrease. (4) Based on the superimposed zoning results, the area of low risk-synergy and medium risk-synergy grew; the area of low risk-trade-off, medium risk-trade-off, high risk-synergy, and high risk-trade-off fell. Therefore, three management zones were established: the ecological protection zone, the ecological warning zone, and the ecological restoration zone. The ecological protection zone should prioritize ecological integrity and prevent environmental destruction; the ecological warning zone should focus on optimizing the land management and improving the ecological stability and risk warning capacity; and the ecological restoration zone should focus on reducing human interference and restoring the ecologically fragile areas.
Overall, this study proposes a multidimensional ecological zoning framework that integrates ES trade-offs and LER. PPF was introduced to assess changes in trade-off intensities among key ESs at the regional scale, while the difference comparison method was used to capture the spatial heterogeneity of trade-offs at the raster scale, thereby achieving a multi-scale integration of trade-off assessment. LER was evaluated based on LUCC to identify spatiotemporal dynamics. On this basis, AHP weights were used to divide the ecological zones by the overlay method. The results provide a scientific basis for delineating ecological conservation redlines, designing ecological compensation mechanisms, and optimizing land-use zoning in the Hengduan Mountain region. The proposed framework and management zoning strategy can also serve as a reference for ES assessment and ecological management in other mountainous ecosystems.

Author Contributions

Conceptualization, L.Y. and X.Z.; methodology, E.D.; software, K.K. and Y.T.; validation, Y.Y.; formal analysis, Z.L.; data curation, J.L.; writing—original draft preparation, X.Z.; project administration, L.Y.; funding acquisition, L.Y. and B.Z. All authors have read and agreed to the published version of the manuscript.

Funding

This research was supported by the National Natural Science Foundation of China (42201308), Taishan Scholar Foundation of Shandong Province (tsqnz20231207), Natural Science Foundation of Shandong Province, China (ZR2021QD127, ZR2021ME203), Shandong Philosophy and Social Sciences Youth Talent Team (2024-QNRC-02), Shandong Normal University Experimental Teaching Reform Research Project (2024MS18), Shandong Province Graduate Teaching Reform Project (SDYJSJGC2024068), Shandong Province Undergraduate Teaching Reform Project (Z20220004) and the Jinan City-School Integration Project (JNSX2023036).

Institutional Review Board Statement

Not applicable.

Informed Consent Statement

Not applicable.

Data Availability Statement

The original contributions presented in this study are included in the article. Further inquiries can be directed to the corresponding author.

Conflicts of Interest

The authors declare that they have no known competing financial interests or personal relationships that could have appeared to influence the work reported in this paper.

Appendix A

Analysis of ES Trade-Off and LER Relationship Within Priority Areas

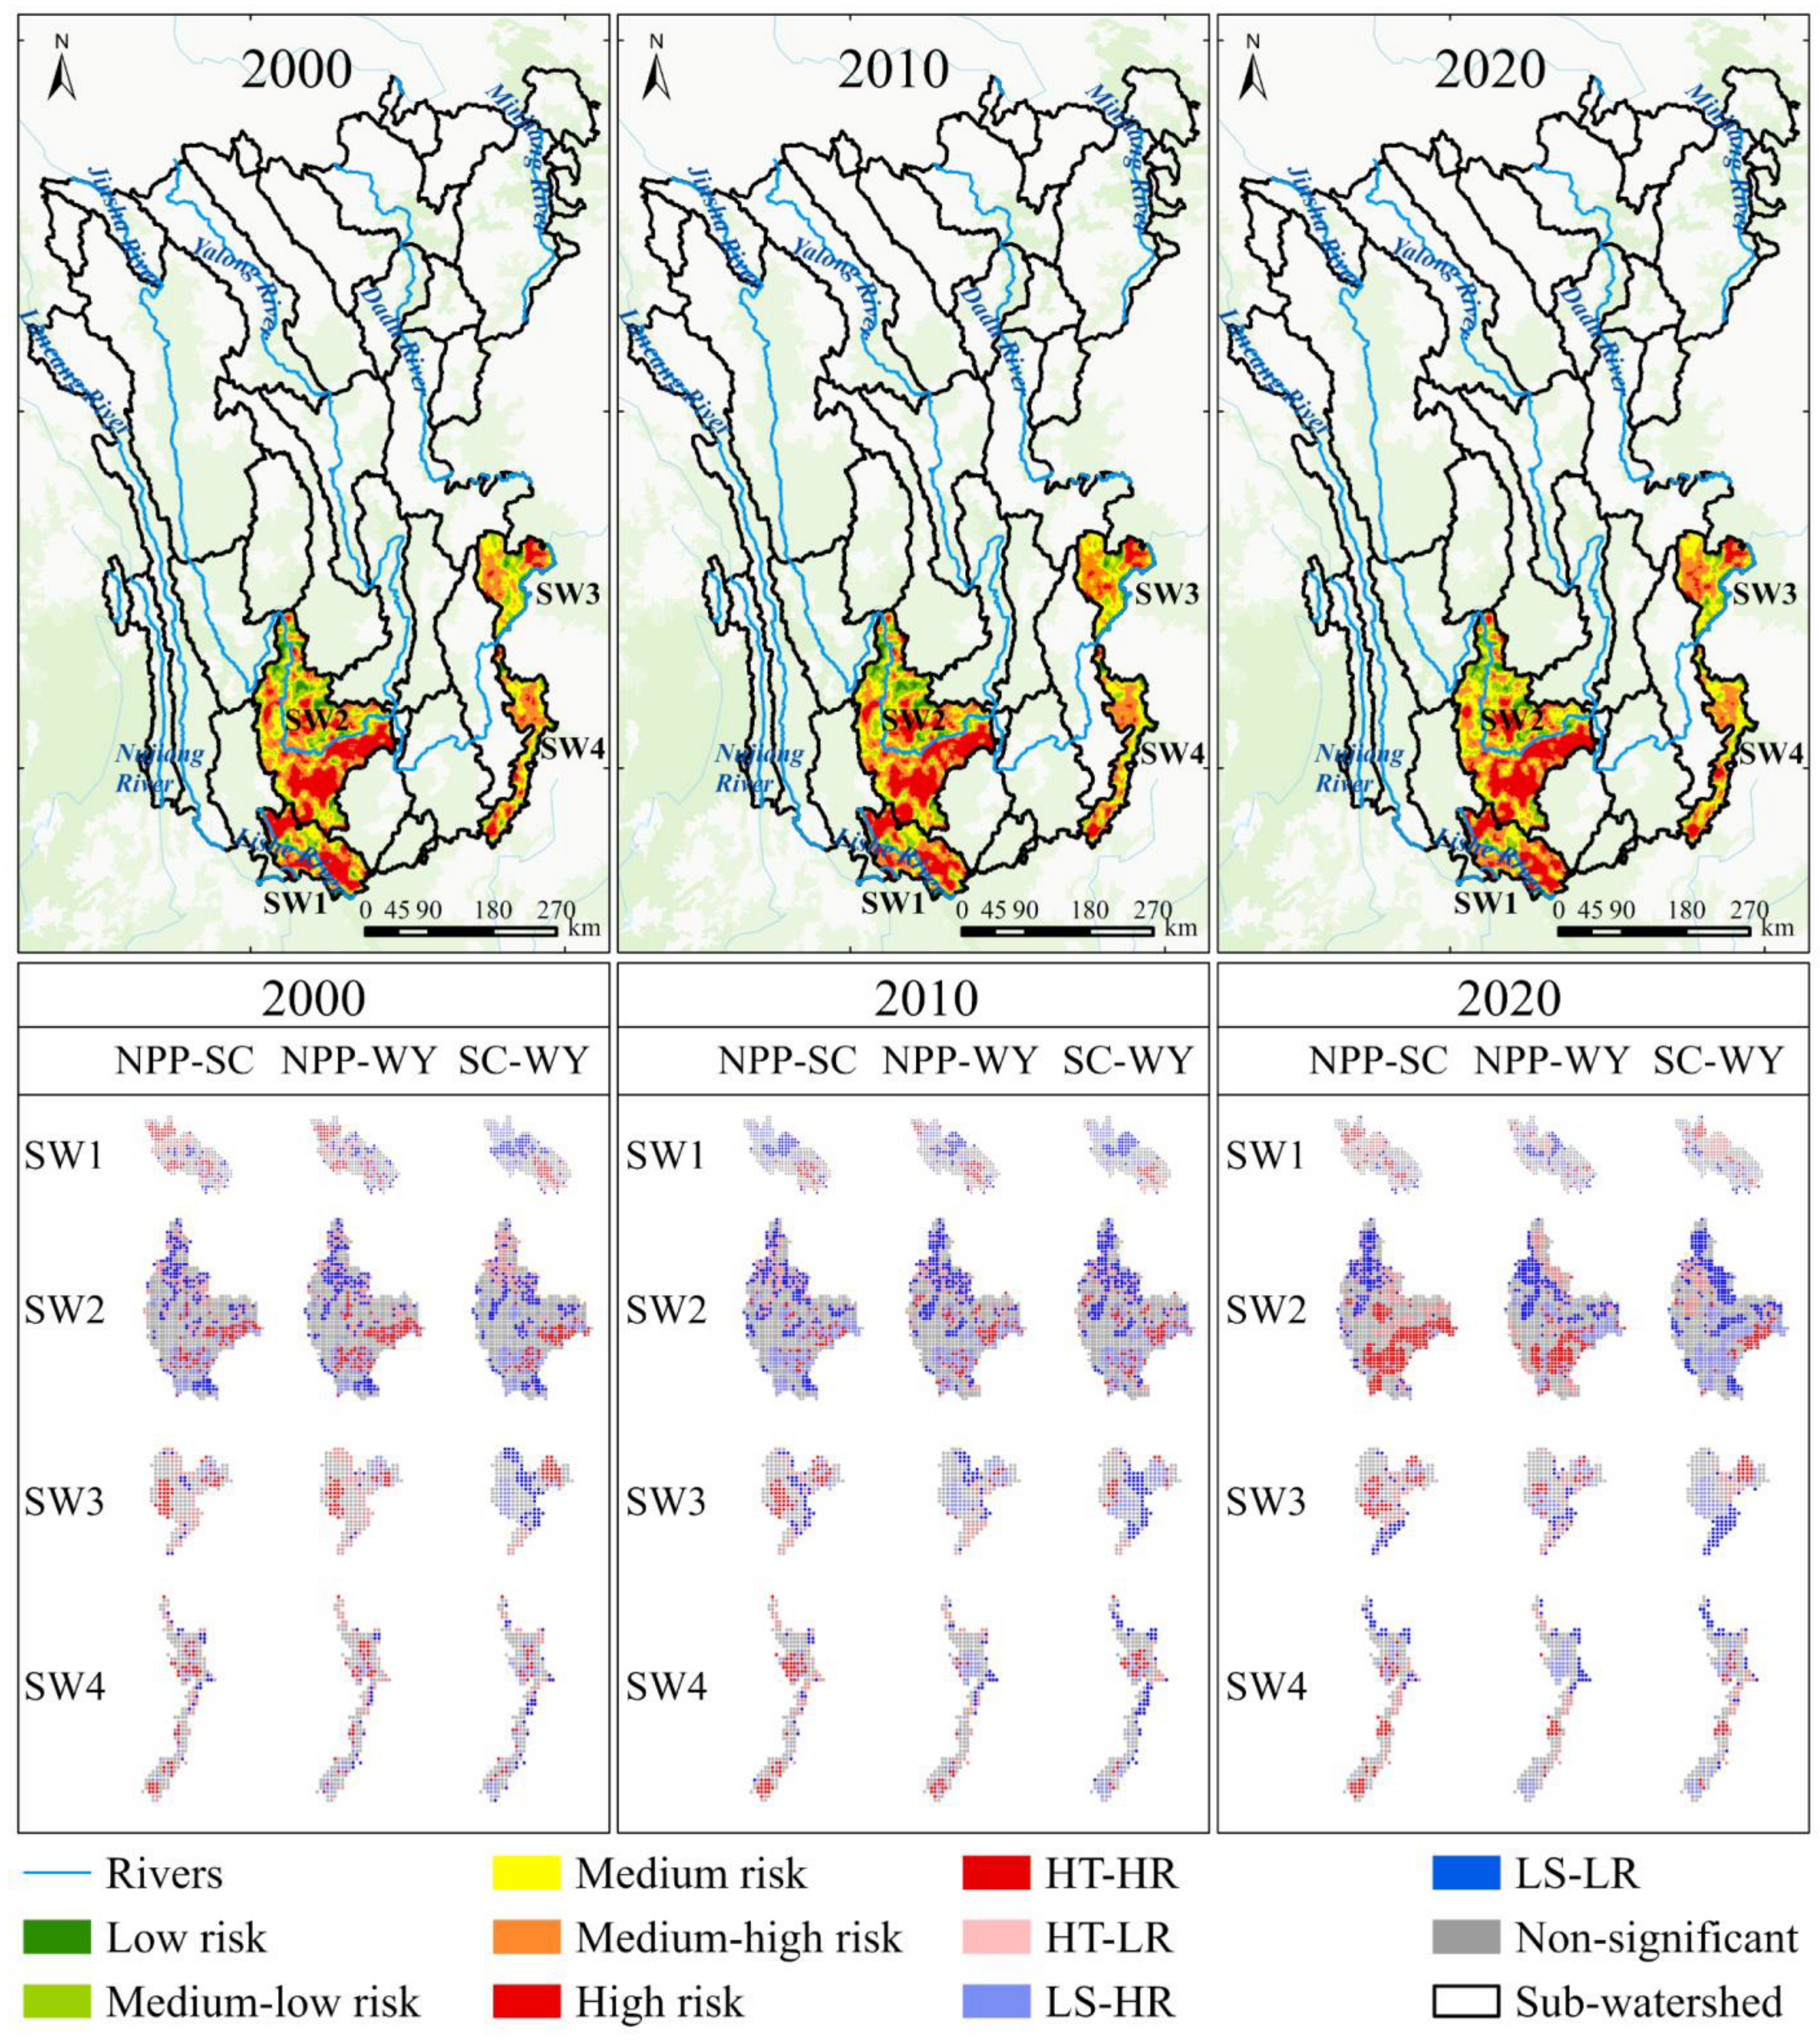
To further explore the relationship between trade-offs and LER, the four highest risk regions (SW1-SW4) in the Hengduan Mountain region were selected for analysis (Figure A1). The LER values of the SW1-SW4 regions in 2020 were 1.1414, 1.0958, 1.0244 and 0.9953, respectively.
Table A1. Calculation of NPP, SC and WY.
ESMethodEquationDescription
NPPCASA N P P i , t = A P A R i , t × ε i , t N P P ( i , t ) represents the net primary productivity of grid i at time t ,   A P A R ( i , t ) denotes the photosynthetically active radiation absorbed by vegetation in grid i at time t   ( M J · m 2 ) ,   and   ε ( i , t ) refers to the actual light use efficiency ( g · M J 1 ).
SCRUSLE S P = R × K × L S
S A = R × K × L S × C × P
S C i = S P S A
S C i represents the soil conservation in grid i   ( t · h a 1 · y r 1 ) ,   S P denotes the potential soil loss ( t · h a 1 · y r 1 ) ,   S A denotes the actual soil loss ( t · h a 1 · y r 1 ). R is the rainfall erosivity factor ( M J · m m · h a 1 · h 1 · y r 1 ) ,   K is the soil erodibility factor ( t · h · M J 1 · m m 1 ) ,   L S is the topographic factor, C is the vegetation cover factor, and P is the support practice factor related to soil conservation measures.
WYInVEST Y i = 1 A E T i / P i × P i Y ( i ) represents the annual water yield ( m m ) for grid i ,   A E T ( i ) is the actual annual evapotranspiration ( m m ) , and P ( i ) denotes the annual precipitation ( m m ) .
The SW1 region is located at the southern boundary of the study region and is predominantly drained by the Lishe River (Figure A1). The LER fluctuated, first decreasing and then increasing, with an overall upward trend (Figure A2). From 2000 to 2020, the trade-off area of the SW1 region declined before rising. This trend corresponded to the LER trend, indicating a positive association. Meanwhile, the Moran’I of NPP-SC, NPP-WY, and SC-WY all reduced, shifting from positive to negative values in 2010. Although all three groups of ESs showed a positive correlation in 2010, which had a contributing effect on the rise of LER, the growth in LER in SW1 was mitigated by a significant reduction in NPP-SC and NPP-WY trade-off areas, particularly in high trade-off regions. In 2020, even though the NPP-WY trade-offs diminished, the Moran’I of the three groups of ESs continued to weaken, and the NPP-SC and SC-WY trade-offs increased; thus, the ecological risk showed an upward trend. This showed that the NPP-SC trade-off dominated the LER change process in SW1.
SW2 is situated in the central and downstream section of the Jinsha River (Figure A1). The LER showed a small increase (Figure A2). From 2000 to 2020, the total trade-off area in the SW2 region rose, consistent with the LER trend. Among them, the NPP-SC trade-off area fell and then rose, and NPP-WY continued to go up, while SC-WY rose and then fell. The Moran’I of NPP-SC and NPP-WY reduced before climbing, while the Moran’I of SC-WY grew and then decline. In 2010, although the HT-HR area of the three groups of ESs decreased and SC-WY showed a negative correlation, which suppressed the rise of LER; however, the SC-WY trade-off area extended significantly, and Moran’I of both NPP-SC and NPP-WY showed diminishing trends, which contributed to the rise of LER. In 2020, even though the NPP-SC and NPP-WY Moran’I intensified and showed a negative correlation, which slowed down the rising rate of LER, the HT-HR area of NPP-SC and NPP-WY increased; thus, the LER still showed a rising trend. This indicated that the change of LER in the SW2 region was mainly consistent with the change in NPP-WY trade-off.
Figure A1. Spatiotemporal distribution of LER and bivariate spatial autocorrelation in the SW1–SW4 regions from 2000 to 2020.
Sustainability 17 07630 g0a1
SW3 lies within the downstream section of the Jinsha River (Figure A1). LER demonstrated an upward trend (Figure A2). Between 2000 and 2020, the total trade-off area of the SW3 region increased before declining and generally showed an increase. Specifically, the NPP-SC trade-off area rose and then fell, the NPP-WY fell and then rose, and the SC-WY continued to rise. In 2010, the NPP-SC, SC-WY, and LER showed a negative correlation, while the NPP-WY showed a positive correlation. However, the NPP-SC and SC-WY trade-off area rose; thus, the LER showed a climbing trend. In 2020, the NPP-SC Moran’I reduced, and the NPP-WY and SC-WY Moran’I rose. Although both NPP-SC and SC-WY showed a negative correlation, the strength of these correlations dropped, and the HT-HR area of all three groups of ESs increased. Thus contributing to the growth in regional ecological risk. This showed that changes in LER in SW3 were dominated by the SC-WY trade-off.
SW4 lies on the southeast edge of the Hengduan Mountain region, with the Niulan River as its main river (Figure A1). The LER first decreased and then increased, though it exhibited a downward trend overall (Figure A2). The overall trade-off area in the SW4 region weakened during 2000–2020. The trade-offs of NPP-SC and NPP-WY declined, with Moran’s I initially decreasing and later rising. In contrast, the SC-WY trade-off rose before declining, and the Moran’I grew and then showed a downward trend. In 2010, NPP-SC and NPP-WY showed a positive correlation and then a declining correlation, while SC-WY showed a negative correlation and then a climbing correlation, thus contributing to the reduction in LER. In 2020, NPP-SC showed a negative correlation, while NPP-WY and SC-WY showed a positive correlation. Even though the trade-off areas of all three groups of ESs showed a reducing trend, the LS-HR area rose, thus contributing to the increase in LER. This showed that the change of LER in the SW4 region was also influenced by SC-WY.
Figure A2. Trends in LER and Moran’I in SW1-SW4 from 2000 to 2020.
Sustainability 17 07630 g0a2

References

  1. Chi, Y.; Zhang, Z.; Wang, J.; Xie, Z.; Gao, J. Island protected area zoning based on ecological importance and tenacity. Ecol. Indic. 2020, 112, 106139. [Google Scholar] [CrossRef]
  2. Li, J.; Hu, D.; Wang, Y.; Chu, J.; Yin, H.; Ma, M. Study of identification and simulation of ecological zoning through integration of landscape ecological risk and ecosystem service value. Sustain. Cities Soc. 2024, 107, 105442. [Google Scholar] [CrossRef]
  3. Liu, H.; Tang, D. Ecological zoning and ecosystem management based on landscape ecological risk and ecosystem services: A case study in the Wuling Mountain Area. Ecol. Indic. 2024, 166, 112421. [Google Scholar] [CrossRef]
  4. Zhang, D.; Jing, P.; Sun, P.; Ren, H.; Ai, Z. The non-significant correlation between landscape ecological risk and ecosystem services in Xi’an Metropolitan Area, China. Ecol. Indic. 2022, 141, 109118. [Google Scholar] [CrossRef]
  5. Nan, B.; Zhai, Y.; Wang, M.; Wang, H.; Cui, B. Ecological Security Assessment, Prediction, and Zoning Management: An Integrated Analytical Framework. Engineering 2024, 49, 238–250. [Google Scholar] [CrossRef]
  6. Li, W.; Kang, J.; Wang, Y. Spatiotemporal changes and driving forces of ecological security in the Chengdu-Chongqing urban agglomeration, China: Quantification using health-services-risk framework. J. Clean. Prod. 2023, 389, 136135. [Google Scholar] [CrossRef]
  7. Wang, S.; Chen, Y.; Jin, H.; Li, Y. Ecological management zoning based on the causation between ecological risk and ecosystem services in the Gaoligong Mountain. Ecol. Indic. 2024, 167, 112673. [Google Scholar] [CrossRef]
  8. Zhang, Y.; Hu, X.; Wei, B.; Zhang, X.; Tang, L.; Chen, C.; Wang, Y.; Yang, X. Spatiotemporal exploration of ecosystem service value, landscape ecological risk, and their interactive relationship in Hunan Province, Central-South China, over the past 30 years. Ecol. Indic. 2023, 156, 111066. [Google Scholar] [CrossRef]
  9. Herbertson, A.J. The major natural regions: An essay in systematic geography. Geogr. J. 1905, 25, 300–310. [Google Scholar] [CrossRef]
  10. Omernik, J.M. Ecoregions of the conterminous United States. Ann. Assoc. Am. Geogr. 1987, 77, 118–125. [Google Scholar] [CrossRef]
  11. Wang, Z.; Li, W.; Li, Y.; Qin, C.; Lv, C.; Liu, Y. The “three lines one permit” policy: An integrated environmental regulation in China. Resour. Conserv. Recycl. 2020, 163, 105101. [Google Scholar] [CrossRef]
  12. Fu, B.; Liu, G.; Chen, L.; Ma, K.; Li, J. Scheme of ecological regionalization in China. Acta Ecol. Sin. 2001, 21, 1–6. [Google Scholar]
  13. Wang, Z.; Wang, B.; Zhang, Y.; Sa, R.; Zhang, Q.; Hao, S. Ecological zone construction and multi-scenario simulation in Western China combining landscape ecological risk and ecosystem service value. Sci. Rep. 2025, 15, 11297. [Google Scholar] [CrossRef]
  14. Gong, J.; Cao, E.; Xie, Y.; Xu, C.; Li, H.; Yan, L. Integrating ecosystem services and landscape ecological risk into adaptive management: Insights from a western mountain-basin area, China. J. Environ. Manag. 2020, 281, 111817. [Google Scholar] [CrossRef]
  15. Li, H.; Zhu, Y.; Tang, Y.; Song, M. Ecological Zoning Based on Value–Risk in the Wuling Mountains Area of Hunan Province. Sustainability 2024, 16, 1397. [Google Scholar] [CrossRef]
  16. Kang, P.; Chen, W.; Hou, Y.; Li, Y. Linking ecosystem services and ecosystem health to ecological risk assessment: A case study of the Beijing-Tianjin-Hebei urban agglomeration. Sci. Total Environ. 2018, 636, 1442–1454. [Google Scholar] [CrossRef]
  17. Xing, L.; Hu, M.; Wang, Y. Integrating ecosystem services value and uncertainty into regional ecological risk assessment: A case study of Hubei Province, Central China. Sci. Total Environ. 2020, 740, 140126. [Google Scholar] [CrossRef] [PubMed]
  18. Costanza, R.; d’Arge, R.; De Groot, R.; Farber, S.; Grasso, M.; Hannon, B.; Limburg, K.; Naeem, S.; O’neill, R.V.; Paruelo, J. The value of the world’s ecosystem services and natural capital. Nature 1997, 387, 253–260. [Google Scholar] [CrossRef]
  19. Daily, G.C. Nature’s services: Societal dependence on natural ecosystems (1997). In The Future of Nature; Yale University Press: New Haven, CT, USA, 2013; pp. 454–464. [Google Scholar]
  20. Peng, J.; Hu, X.; Zhao, M.; Liu, Y.; Tian, L. Research progress on ecosystem service trade-offs: From cognition to decision-making. Acta Geogr. Sin. 2017, 72, 960–973. [Google Scholar]
  21. Charles, P.; Anantha, D.; Anne, L.; Harold, M. The biodiversity and ecosystem services science-policy interface. Science 2011, 331, 1139–1140. [Google Scholar] [CrossRef]
  22. Bradford, J.B.; D’Amato, A.W. Recognizing trade-offs in multi-objective land management. Front. Ecol. Environ. 2012, 10, 210–216. [Google Scholar] [CrossRef]
  23. Rodríguez, J.P.; Beard, T.D., Jr.; Bennett, E.M.; Cumming, G.S.; Cork, S.J.; Agard, J.; Dobson, A.P.; Peterson, G.D. Trade-offs across Space, Time, and Ecosystem Services. Ecol. Soc. 2006, 11, 28. [Google Scholar] [CrossRef]
  24. Ruijs, A.; Wossink, A.; Kortelainen, M.; Alkemade, R.; Schulp, C.J.E. Trade-off analysis of ecosystem services in Eastern Europe. Ecosyst. Serv. 2013, 4, 82–94. [Google Scholar] [CrossRef]
  25. Zhang, J.; Wang, Y.; Sun, J.; Zhang, Y.; Wang, D.; Chen, J.; Liang, E. Trade-offs and synergies of ecosystem services and their threshold effects in the largest tableland of the Loess Plateau. Glob. Ecol. Conserv. 2023, 48, e02706. [Google Scholar] [CrossRef]
  26. Wang, J.; Wu, W.; Yang, M.; Gao, Y.; Shao, J.; Yang, W.; Ma, G.; Yu, F.; Yao, N.; Jiang, H. Exploring the complex trade-offs and synergies of global ecosystem services. Environ. Sci. Ecotechnol. 2024, 21, 100391. [Google Scholar] [CrossRef] [PubMed]
  27. Zhao, D.; Bi, H.; Wang, N.; Liu, Z.; Hou, G.; Huang, J.; Song, Y. Does increasing forest age lead to greater trade-offs in ecosystem services? A study of a Robinia pseudoacacia artificial forest on the Loess Plateau, China. Sci. Total Environ. 2024, 926, 171737. [Google Scholar] [CrossRef] [PubMed]
  28. Li, Q.; Bao, Y.; Wang, Z.; Chen, X.; Lin, X. Trade-offs and synergies of ecosystem services in karst multi-mountainous cities. Ecol. Indic. 2024, 159, 111637. [Google Scholar] [CrossRef]
  29. Wu, J.; Jin, X.; Feng, Z.; Chen, T.; Wang, C.; Feng, D.; Lv, J. Relationship of Ecosystem Services in the Beijing–Tianjin–Hebei Region Based on the Production Possibility Frontier. Land 2021, 10, 881. [Google Scholar] [CrossRef]
  30. Lester, S.E.; Costello, C.; Halpern, B.S.; Gaines, S.D.; White, C.; Barth, J.A. Evaluating tradeoffs among ecosystem services to inform marine spatial planning. Mar. Policy 2013, 38, 80–89. [Google Scholar] [CrossRef]
  31. Yang, Y.; Zhang, S.; Xia, F.; Yang, Y.; Li, D.; Sun, W.; Wang, Y.; Xie, Y. A comprehensive perspective for exploring the trade-offs and synergies between carbon sequestration and grain supply in China based on the production possibility frontier. J. Clean. Prod. 2022, 354, 131725. [Google Scholar] [CrossRef]
  32. Peng, J.; Wang, X.; Zheng, H.; Xu, Z. Applying production-possibility frontier based ecosystem services trade-off to identify optimal scenarios of Grain-for-Green Program. Landsc. Urban Plan. 2024, 242, 104956. [Google Scholar] [CrossRef]
  33. Sanon, S.; Hein, T.; Douven, W.; Winkler, P. Quantifying ecosystem service trade-offs: The case of an urban floodplain in Vienna, Austria. J. Environ. Manag. 2012, 111, 159–172. [Google Scholar] [CrossRef] [PubMed]
  34. Ager, A.A.; Vogler, K.C.; Day, M.A.; Bailey, J.D. Economic Opportunities and Trade-Offs in Collaborative Forest Landscape Restoration. Ecol. Econ. 2017, 136, 226–239. [Google Scholar] [CrossRef]
  35. Cao, Q.; Zhang, X.; Lei, D.; Guo, L.; Sun, X.; Kong, F.E.; Wu, J. Multi-scenario simulation of landscape ecological risk probability to facilitate different decision-making preferences. J. Clean. Prod. 2019, 227, 325–335. [Google Scholar] [CrossRef]
  36. Wang, K.; Zheng, H.; Zhao, X.; Sang, Z.; Yan, W.; Cai, Z.; Xu, Y.; Zhang, F. Landscape ecological risk assessment of the Hailar River basin based on ecosystem services in China. Ecol. Indic. 2023, 147, 109795. [Google Scholar] [CrossRef]
  37. Peng, J.; Dang, W.; Liu, Y.; Zong, M.; Hu, X. Review on landscape ecological risk assessment. Acta Geogr. Sin. 2015, 70, 664–677. [Google Scholar]
  38. Pan, N.; Du, Q.; Guan, Q.; Tan, Z.; Sun, Y.; Wang, Q. Ecological security assessment and pattern construction in arid and semi-arid areas: A case study of the Hexi Region, NW China. Ecol. Indic. 2022, 138, 108797. [Google Scholar] [CrossRef]
  39. Li, M.; Abuduwailia, J.; Liu, W.; Feng, S.; Saparov, G.; Ma, L. Application of geographical detector and geographically weighted regression for assessing landscape ecological risk in the Irtysh River Basin, Central Asia. Ecol. Indic. 2024, 158, 111540. [Google Scholar] [CrossRef]
  40. Wang, W.; Wang, H.; Zhou, X. Ecological risk assessment of watershed economic zones on the landscape scale: A case study of the Yangtze River Economic Belt in China. Reg. Environ. Change 2023, 23, 105. [Google Scholar] [CrossRef]
  41. Liu, Y.; Zhao, M. Linking ecosystem service supply and demand to landscape ecological risk for adaptive management: The Qinghai-Tibet Plateau case. Ecol. Indic. 2023, 146, 109796. [Google Scholar] [CrossRef]
  42. Cao, Q.; Zhang, X.; Ma, H.; Wu, J. Review of landscape ecological risk an assessment framework based on ecological services: ESRIS. Acta Geogr. Sin. 2018, 73, 843–855. [Google Scholar]
  43. Wang, Y.; Dai, E.; Yin, L.; Ma, L. Land use/land cover change and the effects on ecosystem services in the Hengduan Mountain region, China. Ecosyst. Serv. 2018, 34, 55–67. [Google Scholar] [CrossRef]
  44. Myers, N.; Mittermeier, R.A.; Mittermeier, C.G.; Da Fonseca, G.A.; Kent, J. Biodiversity hotspots for conservation priorities. Nature 2000, 403, 853–858. [Google Scholar] [CrossRef]
  45. Shi, Z.; Deng, W.; Zhang, S. Spatio-temporal pattern changes of land space in Hengduan Mountains during 1990–2015. J. Geogr. Sci. 2018, 28, 529–542. [Google Scholar] [CrossRef]
  46. Ao, S.; Chih, C.M.; Li, X.; Tan, L.; Cai, Q.; Ye, L. Watershed farmland area and instream water quality co-determine the stream primary producer in the central Hengduan Mountains, southwestern China. Sci. Total Environ. 2021, 770, 145267. [Google Scholar] [CrossRef]
  47. Sun, J.; Zhou, L.; Zong, H. Landscape pattern vulnerability of the eastern Hengduan Mountains, China and response to elevation and artificial disturbance. Land 2022, 11, 1110. [Google Scholar] [CrossRef]
  48. Yin, L.; Dai, E.; Xie, G.; Zhang, B. Effects of Land-Use Intensity and Land Management Policies on Evolution of Regional Land System: A Case Study in the Hengduan Mountain Region. Land 2021, 10, 528. [Google Scholar] [CrossRef]
  49. Dai, E.; Wang, Y. Spatial heterogeneity and driving mechanisms of water yield service in the Hengduan Mountain region. Acta Geogr. Sin. 2020, 75, 607–619. [Google Scholar]
  50. Dong, Y.; Xiong, D.; Su, Z.A.; Li, J.; Yang, D.; Shi, L.; Liu, G. The distribution of and factors influencing the vegetation in a gully in the Dry-hot Valley of southwest China. Catena 2014, 116, 60–67. [Google Scholar] [CrossRef]
  51. Field, C.B.; Behrenfeld, M.J.; Randerson, J.T.; Falkowski, P. Primary production of the biosphere: Integrating terrestrial and oceanic components. Science 1998, 281, 237–240. [Google Scholar] [CrossRef]
  52. Xiao, Q.; Hu, D.; Xiao, Y. Assessing changes in soil conservation ecosystem services and causal factors in the Three Gorges Reservoir region of China. J. Clean. Prod. 2016, 163, S172–S180. [Google Scholar] [CrossRef]
  53. Jiang, C.; Zhang, H.; Zhang, Z. Spatially explicit assessment of ecosystem services in China’s Loess Plateau: Patterns, interactions, drivers, and implications. Glob. Planet. Change 2018, 161, 41–52. [Google Scholar] [CrossRef]
  54. Santos, P.H.D.; Neves, S.M.; Sant’Anna, D.O.; De Oliveira, C.H.; Carvalho, H.D. The analytic hierarchy process supporting decision making for sustainable development: An overview of applications. J. Clean. Prod. 2019, 212, 119–138. [Google Scholar] [CrossRef]
  55. Saaty, T.L. How to make a decision: The analytic hierarchy process. Eur. J. Oper. Res. 1990, 48, 9–26. [Google Scholar] [CrossRef]
  56. Cord, A.F.; Bartkowski, B.; Beckmann, M.; Dittrich, A.; Hermans-Neumann, K.; Kaim, A.; Lienhoop, N.; Locher-Krause, K.; Priess, J.; Schröter-Schlaack, C.; et al. Towards systematic analyses of ecosystem service trade-offs and synergies: Main concepts, methods and the road ahead. Ecosyst. Serv. 2017, 28, 264–272. [Google Scholar] [CrossRef]
  57. King, E.; Bares, J.C.; Balvanera, P.; Mwampamba, T.H.; Polasky, S. Trade-offs in ecosystem services and varying stakeholder preferences: Evaluating conflicts, obstacles, and opportunities. Ecol. Soc. 2015, 20, 25. [Google Scholar] [CrossRef]
  58. Koch, E.W.; Barbier, E.B.; Silliman, B.R.; Reed, D.J.; Perillo, G.M.; Hacker, S.D.; Granek, E.F.; Primavera, J.H.; Nyawira, M.; Stephen, P. Non-linearity in ecosystem services: Temporal and spatial variability in coastal protection. Front. Ecol. Environ. 2009, 7, 29–37. [Google Scholar] [CrossRef]
  59. Yang, W.; Jin, Y.; Sun, T.; Yang, Z.; Cai, Y.; Yi, Y. Trade-offs among ecosystem services in coastal wetlands under the effects of reclamation activities. Ecol. Indic. 2018, 92, 354–366. [Google Scholar] [CrossRef]
  60. Zhang, Z.; Liu, Y.; Wang, Y.; Liu, Y.; Zhang, Y.; Zhang, Y. What factors affect the synergy and tradeoff between ecosystem services, and how, from a geospatial perspective? J. Clean. Prod. 2020, 257, 120454. [Google Scholar] [CrossRef]
  61. Bateman, I.J.; Harwood, A.R.; Mace, G.M.; Watson, R.T.; Abson, D.J.; Andrews, B.; Binner, A.; Crowe, A.; Day, B.H.; Dugdale, S.; et al. Bringing Ecosystem Services into Economic Decision-Making: Land Use in the United Kingdom. Science 2013, 341, 45–50. [Google Scholar] [CrossRef]
  62. Fürst, C.; Helming, K.; Lorz, C.; Müller, F.; Verburg, P.H. Integrated land use and regional resource management—A cross-disciplinary dialogue on future perspectives for a sustainable development of regional resources. J. Environ. Manag. 2013, 127, S1–S5. [Google Scholar] [CrossRef]
  63. Lin, Y.; Hu, X.; Zheng, X.; Hou, X.; Zhang, Z.; Zhou, X.; Qiu, R.; Lin, J. Spatial variations in the relationships between road network and landscape ecological risks in the highest forest coverage region of China. Ecol. Indic. 2019, 96, 392–403. [Google Scholar] [CrossRef]
  64. Chen, W.; Zeng, J.; Zhong, M.; Pan, S. Coupling Analysis of Ecosystem Services Value and Economic Development in the Yangtze River Economic Belt: A Case Study in Hunan Province, China. Remote Sens. 2021, 13, 1552. [Google Scholar] [CrossRef]
  65. Jiang, H.; Peng, J.; Zhao, Y.; Xu, D.; Dong, J. Zoning for ecosystem restoration based on ecological network in mountainous region. Ecol. Indic. 2022, 142, 109138. [Google Scholar] [CrossRef]
  66. Ran, Y.; Zhao, X.; Ye, X.; Wang, X.; Pu, J.; Huang, P.; Zhou, Y.; Tao, J.; Wu, B.; Dong, W.; et al. A framework for territorial spatial ecological restoration zoning integrating “Carbon neutrality” and “Human-geology-ecology”: Theory and application. Sustain. Cities Soc. 2024, 115, 105824. [Google Scholar] [CrossRef]
  67. Lyu, R.; Clarke, K.C.; Tian, X.; Zhao, W.; Pang, J.; Zhang, J. Land Use Zoning Management to Coordinate the Supply–Demand Imbalance of Ecosystem Services: A Case Study in the City Belt Along the Yellow River in Ningxia, China. Front. Environ. Sci. 2022, 10, 911190. [Google Scholar] [CrossRef]
  68. Xu, Z.; Peng, J.; Dong, J.; Liu, Y.; Liu, Q.; Lyu, D.; Qiao, R.; Zhang, Z. Spatial correlation between the changes of ecosystem service supply and demand: An ecological zoning approach. Landsc. Urban Plan. 2022, 217, 104258. [Google Scholar] [CrossRef]
  69. Zhang, Y.; Lin, F. Study on comprehensive zoning of landscape ecological risk and ecosystem service value of tourist scenic spots with high landscape value. Hum. Ecol. Risk Assess. Int. J. 2024, 30, 58–76. [Google Scholar] [CrossRef]
  70. Ji, Z.; Xu, Y.; Sun, M.; Zhang, P.; Qi, Y.; Sun, D.; Koomen, E.; Lun, F.; Liu, T. Linking the assessment of ecological engineering construction with zoning management in the typical agro-pastoral area of China: A perspective from quantity, quality and function. J. Environ. Manag. 2024, 366, 121635. [Google Scholar] [CrossRef]
  71. Fischer, J.; Riechers, M.; Loos, J.; Martin-Lopez, B.; Temperton, V.M. Making the UN Decade on Ecosystem Restoration a Social-Ecological Endeavour. Trends Ecol. Evol. 2020, 36, 20–28. [Google Scholar] [CrossRef] [PubMed]
  72. UN. General Assembly. United Nations Decade on Ecosystem Restoration (2021–2030); UN. General Assembly: New York City, NY, USA, 2019. [Google Scholar]
  73. Ouyang, L.; Wu, J.; Zhao, P.; Zhu, L.; Ni, G. Stand age rather than soil moisture gradient mainly regulates the compromise between plant growth and water use of Eucalyptus urophylla in hilly South China. Land Degrad. Dev. 2021, 32, 2423–2436. [Google Scholar] [CrossRef]
  74. Repo, A.; Albrich, K.; Jantunen, A.; Aalto, J.; Lehtonen, I.; Honkaniemi, J. Contrasting forest management strategies: Impacts on biodiversity and ecosystem services under changing climate and disturbance regimes. J. Environ. Manag. 2024, 371, 123124. [Google Scholar] [CrossRef]
  75. Lu, S.; Zhang, Z.; Li, R.; Wu, F.; Zhang, N.; Yang, J. Effects of contour tillage on soil erosion process in different slope. J. Soil Water Conserv. 2023, 37, 37–44. [Google Scholar]
  76. Tan, M.; Cui, N.; Jiang, S.; Xing, L.; Wen, S.; Liu, Q.; Li, W.; Yan, S.; Wang, Y.; Jin, H.; et al. Effect of practicing water-saving irrigation on greenhouse gas emissions and crop productivity: A global meta-analysis. Agric. Water Manag. 2025, 308, 109300. [Google Scholar] [CrossRef]
  77. Dai, E.; Wang, Y. Identifying driving factors of ecosystem service trade-offs in mountainous region of southwestern China across geomorphic and climatic types. Ecol. Indic. 2024, 158, 111520. [Google Scholar] [CrossRef]
  78. Wang, Y.; Dai, E. Spatial-temporal changes in ecosystem services and the trade-off relationship in mountain regions: A case study of Hengduan Mountain region in Southwest China. J. Clean. Prod. 2020, 264, 121573. [Google Scholar] [CrossRef]
  79. Lin, S.; Wu, R.; Yang, F.; Wang, J.; Wu, W. Spatial trade-offs and synergies among ecosystem services within a global biodiversity hotspot. Ecol. Indic. 2018, 84, 371–381. [Google Scholar] [CrossRef]
  80. Zhao, M.; He, Z.; Du, J.; Chen, L.; Lin, P.; Fang, S. Assessing the effects of ecological engineering on carbon storage by linking the CA-Markov and InVEST models. Ecol. Indic. 2019, 98, 29–38. [Google Scholar] [CrossRef]
  81. Yang, J.; Duan, H.; Song, F.; Wang, J.; Ren, Z.; Jiang, Z.; Chen, Y. Spatiotemporal evolution of landscape ecological risk in the Gaoligong Mountain, 2000–2020. J. Southwest For. Univ. 2024, 44, 54–63. [Google Scholar]
  82. Lyu, R.; Zhang, J.; Xu, M.; Li, J. Impacts of urbanization on ecosystem services and their temporal relations: A case study in Northern Ningxia, China. Land Use Policy 2018, 77, 163–173. [Google Scholar] [CrossRef]
  83. Zhang, X.; Zhang, G.; Long, X.; Zhang, Q.; Liu, D.; Wu, H.; Li, S. Identifying the drivers of water yield ecosystem service: A case study in the Yangtze River Basin, China. Ecol. Indic. 2021, 132 (Suppl. C), 108304. [Google Scholar] [CrossRef]
  84. Guo, Q.; Wang, A.; Qin, W.; Shan, Z.; Gong, J.; Wang, D.; Ding, L. Changes in the characteristics of flood discharge and sediment yield in a typical watershed in the Hengduan Mountain Region, Southwest China, under extreme precipitation events. Ecol. Indic. 2022, 145, 109600. [Google Scholar] [CrossRef]
  85. Goldstein, J.H.; Caldarone, G.; Duarte, T.K.; Ennaanay, D.; Hannahs, N.; Mendoza, G.; Polasky, S.; Wolny, S.; Daily, G.C. Integrating ecosystem-service tradeoffs into land-use decisions. Proc. Natl. Acad. Sci. USA 2012, 109, 7565–7570. [Google Scholar] [CrossRef]
  86. Wong, C.P.; Jiang, B.; Kinzig, A.P.; Lee, K.N.; Ouyang, Z. Linking ecosystem characteristics to final ecosystem services for public policy. Ecol. Lett. 2015, 18, 108–118. [Google Scholar] [CrossRef] [PubMed]
  87. Yang, X.; Yu, S.; Luo, Z.; Luo, S.; Nie, X. Interaction and zoning management of landscape ecological risk and ecosystem services around poyang lake from multi-scale perspective. Environ. Sci. 2025, 1–18. [Google Scholar] [CrossRef]
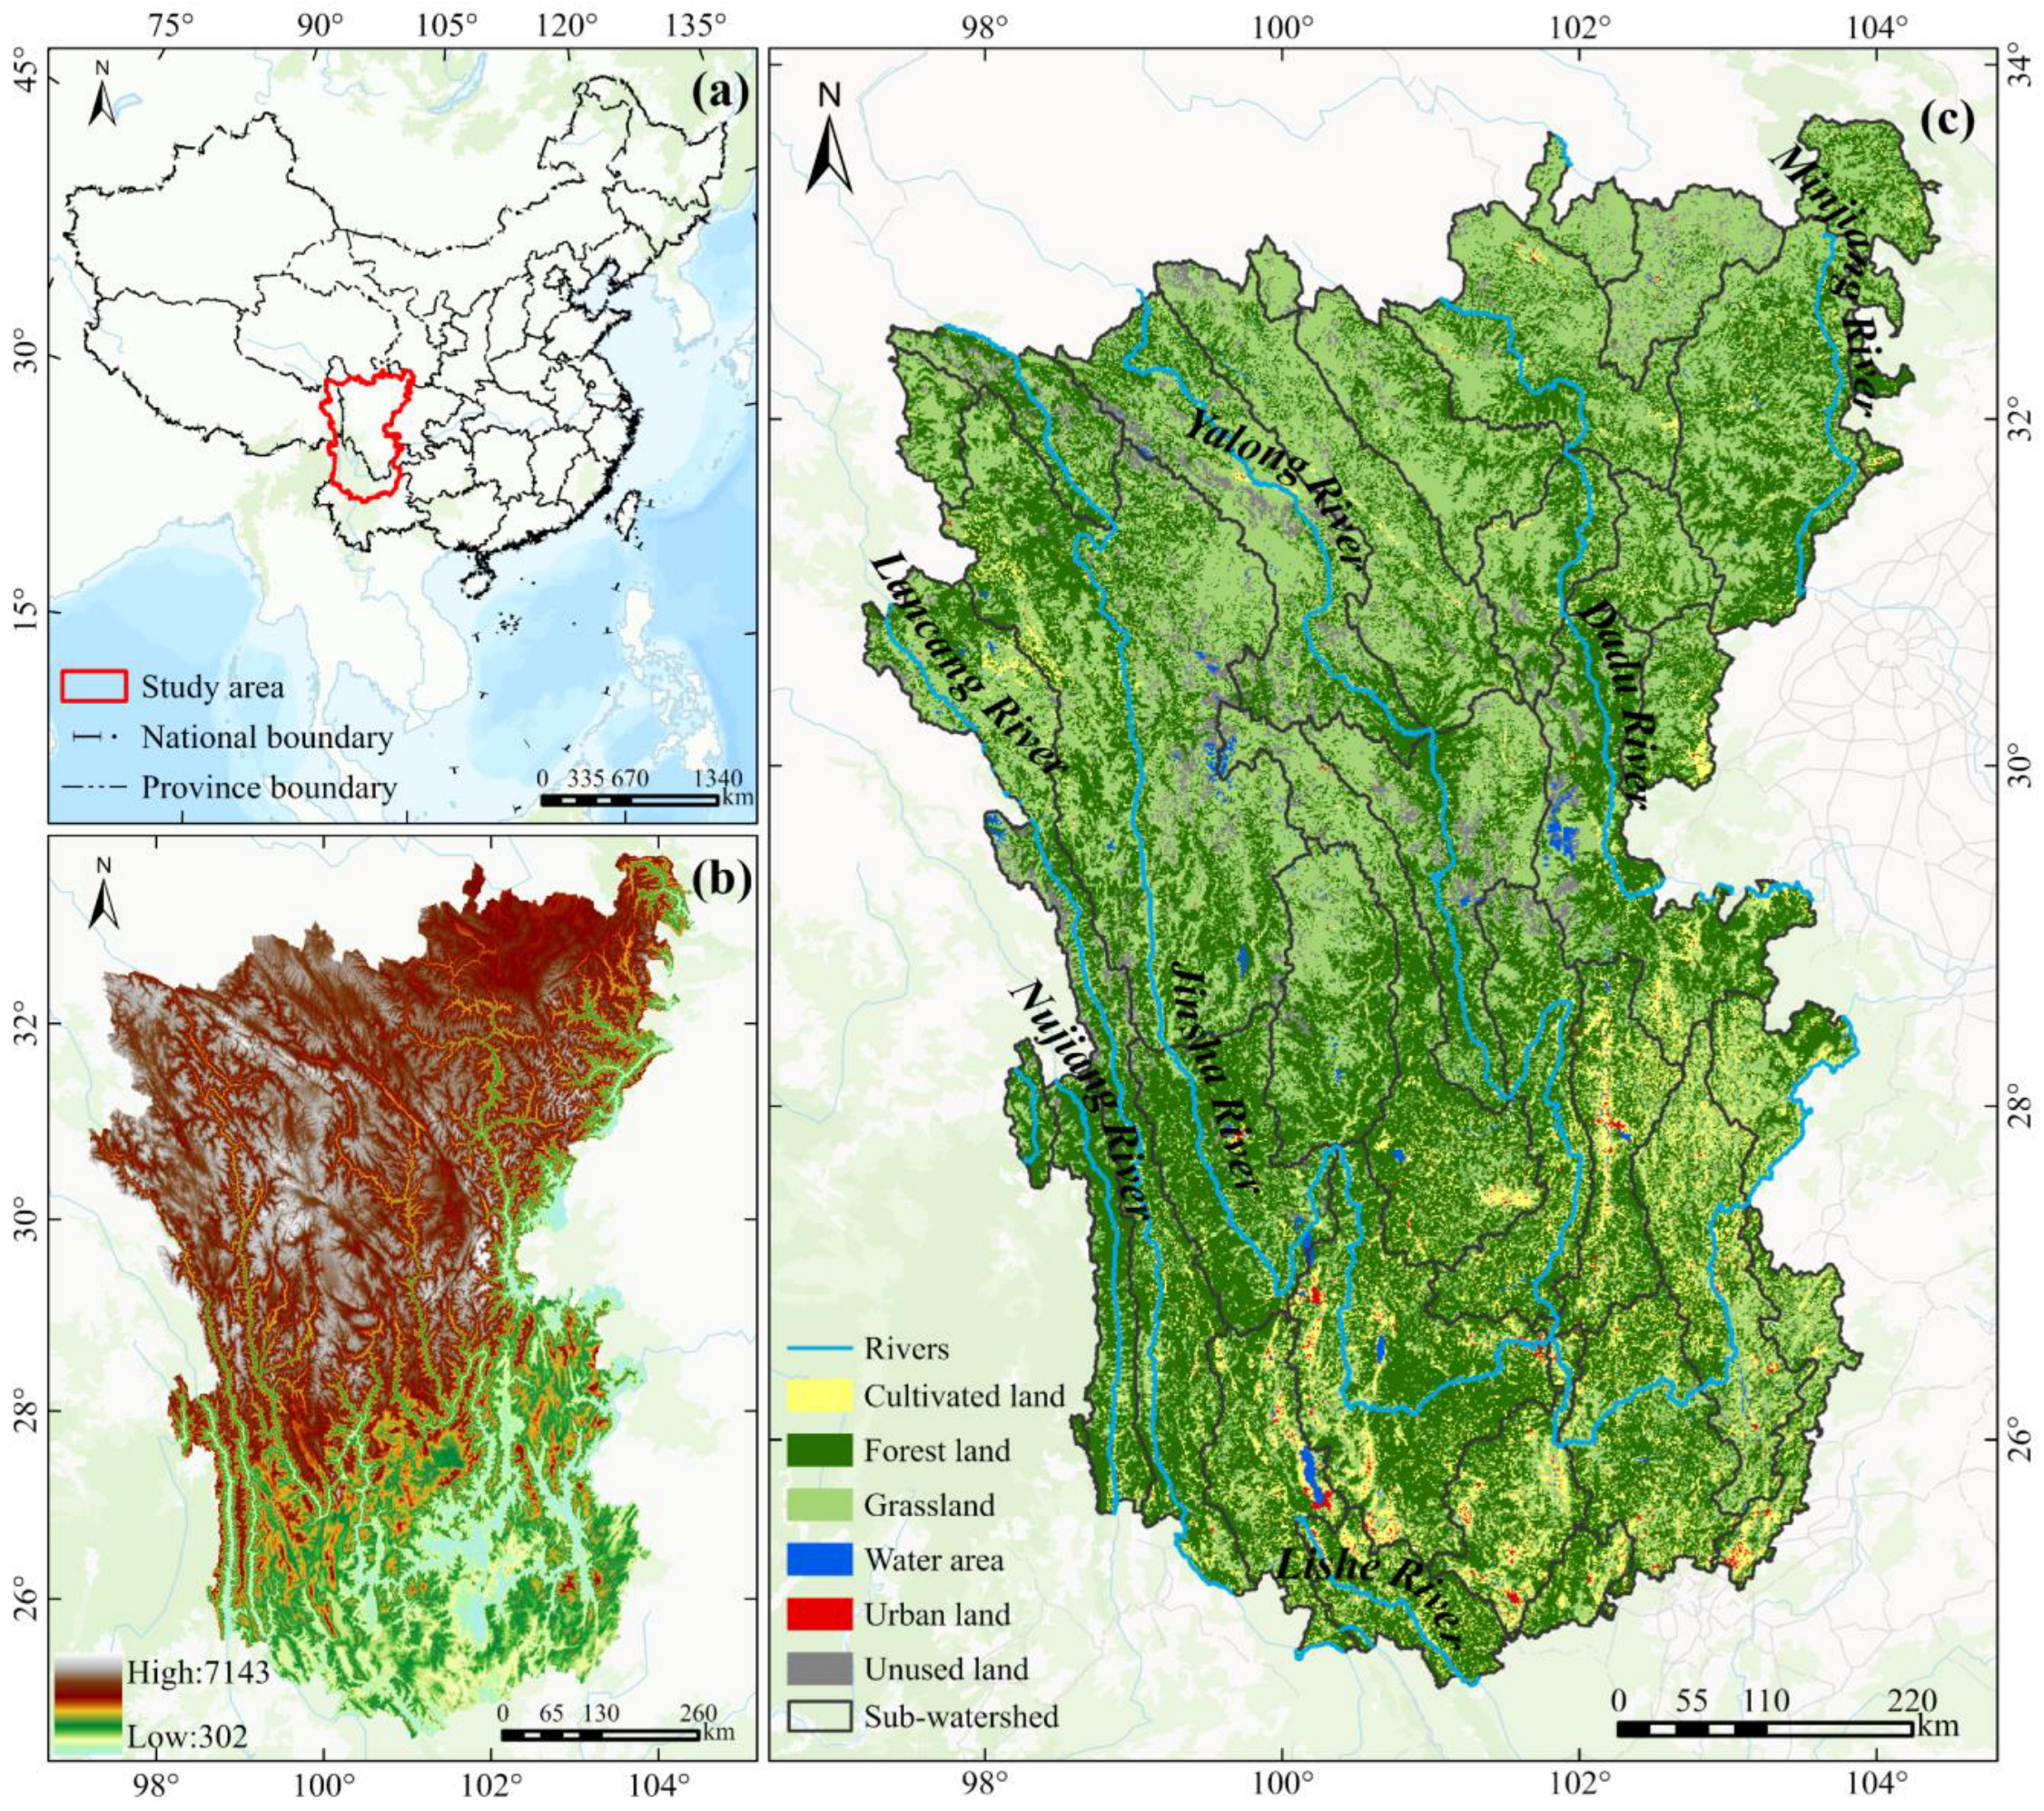
Figure 1. Hengduan Mountain region map. (a) Geographical location of the study area, (b) DEM, (c) Land use types in 2020.
Sustainability 17 07630 g001
Figure 2. Research framework of this study.
Sustainability 17 07630 g002
Figure 3. Spatiotemporal patterns of NPP, SC and WY in the Hengduan Mountain region from 2000 to 2020.
Sustainability 17 07630 g003
Figure 4. PPFs and their first-order derivatives of NPP-SC, NPP-WY, and SC-WY from 2000 to 2020.
Sustainability 17 07630 g004
Figure 5. Spatial patterns and area transfers among NPP-SC, NPP-WY, and SC-WY trade-offs from 2000 to 2020.
Sustainability 17 07630 g005
Figure 6. Spatial-temporal evolution and area change of LER, spatial distribution of cold hotspots from 2000 to 2020.
Sustainability 17 07630 g006
Figure 7. Spatial distribution and quantitative statistics of bivariate local spatial autocorrelation between LER and the trade-offs of NPP–SC, NPP–WY, and SC–WY from 2000 to 2020.
Sustainability 17 07630 g007
Figure 8. ES trade-offs and LER overlay ecological zoning from 2000 to 2020.
Sustainability 17 07630 g008
Figure 9. Ecological zone distribution in 2020. (a) Geomorphic type, (b) Ecological protection zone, (c) Ecological warning zone, (d) Ecological restoration zone.
Sustainability 17 07630 g009
Figure 10. Spatial distribution of priority restoration zones and their focus areas in 2020. Zone I: joint impacts of all three ES trade-offs; Zone II: joint impacts of NPP–SC and NPP–WY; Zone III: joint impacts of NPP–SC and SC–WY; Zone IV: joint impacts of NPP–WY and SC–WY. Other zones are affected by individual ES trade-offs.
Sustainability 17 07630 g010
Table 1. Data sources in the study.
Data TypeFormatsSourcesDescription
Land use dataGrid/30 mResource and Environment Science and Data Center
(http://www.resdc.cn/, accessed on 3 June 2024)
Classified into seven land categories for ESs and LER assessment.
Vegetation type
data
Grid/30 mhttp://www.resdc.cn/, accessed on 3 June 2024Used in CASA, InVEST, and RUSLE to represent vegetation types.
Soil dataGrids/30 mhttp://www.resdc.cn/, accessed on 3 June 2024Provides soil texture and properties for RUSLE and InVEST models.
Normalized difference vegetation index
(NDVI)
Grids/30 mhttp://www.resdc.cn/, accessed on 3 June 2024Reflects vegetation cover for CASA and RUSLE parameterization.
Geomorphic typeGrids/1 kmhttp://www.resdc.cn/, accessed on 3 June 2024Categorizes landforms for ESs and SC analysis.
Meteorological informationGrids/1 kmNational Meteorological Information Center
(http://data.cma.cn/, accessed on 5 June 2024)
Provides precipitation and temperature for RUSLE and WY estimation.
Potential evapotranspirationGrids/1 kmNational Earth System Science Data Center
(http://www.geodata.cn/, accessed on 5 June 2024)
Used to estimate actual evapotranspiration in InVEST.
Digital elevation model data (DEM)Grids/90 mGeospatial Data Cloud
(https://www.gscloud.cn/, accessed on 28 February 2024)
Offers elevation data for slope, length, steepness factor, and hydrological modeling.
Sub-watershed dataVectorGeonetwork Opensource
(https://www.geonetwork-opensource.org/, accessed on 4 July 2024)
Defines watershed boundaries for spatial unit analysis.
Table 2. Changes in Moran’I for NPP, SC, and WY from 2000 to 2020.
ESsNPPSCWY
200020102020200020102020200020102020
Moran’I0.740.750.720.450.420.380.800.840.83
z-value1171.111176.481127.532211.652061.901890.343968.284166.974133.17
p-value0.001, significant relation
Table 3. Inflection points of first-order derivatives, mean points, and trade-off strengths of NPP-SC, NPP-WY, and SC-WY from 2000 to 2020.
ESsYearInflection
Point
Mean
Point
Trade-Off Strength
NPP-SC2000(−0.27, 0.38)(0.28, 0.28)0.48
2010(−0.15, 0.07)(0.28, 0.28)0.46
2020(0.09, −0.07)(0.26, 0.27)0.42
NPP-WY2000(0.31, −0.03)(0.49, 0.49)0.58
2010(0.21, 0.002)(0.43, 0.42)0.51
2020(0.22, 0.01)(0.48, 0.48)0.50
SC-WY2000(0.06, −0.09)(0.26, 0.26)0.71
2010(0.16, −0.20)(0.19, 0.19)0.64
2020(0.17, −0.04)(0.24, 0.24)0.43
Table 4. Changes in the Moran’I for LER and the trade-offs of NPP–SC, NPP–WY, and SC–WY from 2000 to 2020.
ESsNPP-SCNPP-WYSC-WY
200020102020200020102020200020102020
Moran’I−0.01−0.004−0.04−0.02−0.020.040.10−0.10−0.06
z-value−3.02−1.31−11.39−5.34−7.6714.1931.70−32.22−21.25
p-value0.001, significant relation
Disclaimer/Publisher’s Note: The statements, opinions and data contained in all publications are solely those of the individual author(s) and contributor(s) and not of MDPI and/or the editor(s). MDPI and/or the editor(s) disclaim responsibility for any injury to people or property resulting from any ideas, methods, instructions or products referred to in the content.