Review

Reconstructing the VOC–Ozone Research Framework Through a Systematic Review of Observation and Modeling

1
College of Chemical Engineering and Environment, China University of Petroleum, Beijing 102249, China
2
Karamay Ecological Environment Monitoring Station, Karamay 834000, China
3
College of Engineering, China University of Petroleum (Beijing) at Karamay, Karamay 834000, China
4
Karamay Ecological Environment Bureau, Karamay 834000, China
5
Institute of Remote Sensing Satellite, China Academy of Space Technology, Beijing 100094, China
6
Aerospace Information Research Institute, Chinese Academy of Sciences, Beijing 100094, China
7
School of Geography, Development and Environment, The University of Arizona, Tucson, AZ 85719, USA
*
Author to whom correspondence should be addressed.
These authors contributed equally to this work.
Sustainability 2025, 17(16), 7512; https://doi.org/10.3390/su17167512
Submission received: 23 June 2025 / Revised: 11 August 2025 / Accepted: 12 August 2025 / Published: 20 August 2025

Abstract

Tropospheric ozone (O3), a secondary pollutant of mounting global concern, emerges from complex, nonlinear photochemical reactions involving nitrogen oxides (NOx) and volatile organic compounds (VOCs) under dynamically evolving meteorological conditions. Accurately characterizing and effectively regulating O3 formation necessitates not only precise and multi-dimensional precursor observations but also modeling frameworks that are structurally coherent, chemically interpretable, and sensitive to regime variability. Despite significant technological progress, current research remains markedly fragmented: observational platforms often operate in isolation with limited vertical and spatial interoperability, while modeling paradigms—ranging from mechanistic chemical transport models (CTMs) to data-driven machine learning approaches—frequently trade interpretability for predictive performance and struggle to capture regime transitions across heterogeneous environments. This review provides a dual-perspective synthesis of recent advances and enduring challenges in the VOC–O3 research landscape. We first establish a typology of ground-based, airborne, and satellite-based VOC monitoring systems, evaluating their capabilities, limitations, and roles within a vertically structured sensing architecture. We then examine the evolution of O3 modeling strategies, from empirical and semi-mechanistic models to hybrid frameworks that integrate physical knowledge with algorithmic flexibility. By diagnosing the structural decoupling between observation and inference, we identify key methodological bottlenecks and advocate for a system-level redesign of the VOC–O3 research paradigm. Finally, we propose a forward-looking framework for next-generation atmospheric governance—one that fuses cross-platform sensing, regime-aware modeling, and policy-relevant diagnostics into an integrated, adaptive, and chemically robust decision-support system.

1. Introduction

Tropospheric ozone (O3) remains one of the most complex and policy-relevant secondary air pollutants, emerging not from direct emission but from intricate nonlinear interactions among nitrogen oxides (NOx), volatile organic compounds (VOCs), and meteorological variables under the modulation of solar radiation. Unlike primary pollutants, the formation and spatiotemporal evolution of ozone are governed by region-specific photochemical regimes, sensitive to precursor ratios, local emission profiles, and atmospheric dynamics. Among these precursors, VOCs—together with NOx—are key agents of photochemical reactivity, but VOCs pose particular challenges due to their chemical diversity and observational complexity. They exhibit high chemical diversity, heterogeneous reactivity, and substantial spatiotemporal variability, complicating both their measurement and mechanistic representation [1,2].
Despite decades of research, the dual challenge of observing and modeling VOC–O3 interactions remains unresolved. While conventional air quality assessments often track indicators such as NO2 and O3, VOCs have remained comparatively under-observed in both spatial resolution and chemical speciation. Observationally, advances in satellite remote sensing, ground-based monitoring, and airborne sampling have expanded the capacity to capture VOC-related indicators such as formaldehyde (HCHO); yet, inconsistencies in resolution, coverage, and chemical specificity persist [3,4]. More critically, these platforms often operate in isolation, lacking structural integration across vertical and spatial scales, and failing to deliver the regime-resolving information necessary for predictive modeling. On the modeling side, traditional approaches—such as observation-based models (OBMs) and chemical transport models (CTMs)—have achieved impressive chemical completeness, yet suffer from coarse spatial resolution, latency in emission updates, and limited regime adaptability [5,6]. The emergence of data-driven algorithms, particularly machine learning models, has brought new momentum to the field, but many of these methods prioritize accuracy over interpretability and often lack sensitivity awareness or chemical transparency [3].
These gaps are not merely technical—they point to a deeper fragmentation in the VOC–O3 research landscape. Observation strategies, modeling paradigms, and regulatory frameworks have often evolved in silos, each advancing rapidly but seldom converging. As a result, current systems remain diagnostic rather than responsive and descriptive rather than functional. The consequence is a growing disconnect between scientific capacity and governance needs, especially in transitional regions where O3 formation is highly sensitive to both precursor dynamics and meteorological anomalies [7].
In light of these challenges, this review seeks to provide a system-oriented synthesis of recent progress and enduring limitations in VOC–O3 research [8]. We adopt a dual-structured perspective: first, tracing the evolution and classification of observational platforms used to monitor VOCs and related precursors, including ground-based, airborne, and satellite-based systems; second, examining the methodological advances and structural bottlenecks in O3 modeling, spanning from mechanistic CTMs to structure-informed AI algorithms. Rather than treating these domains in isolation, we focus on the coupling logic between observation and inference—how platform capabilities influence model fidelity and how modeling demands shape the future of VOC measurement—ideally forming a recursive sensing loop, where models not only consume observations but also help prioritize what, where, and when to observe [9,10].
Ultimately, this review aims to move beyond cataloging techniques toward envisioning a cohesive research architecture for VOC–O3 interaction: one that aligns observational granularity with chemical regime inference, integrates physical mechanisms into learning systems, and bridges scientific understanding with real-time governance. In doing so, we seek to clarify not only where the field stands, but also what kind of system it must become.

2. Mapping Methods and Knowledge Evolution in VOC–O3 Studies

2.1. Methodology

2.1.1. Data Sources

To construct a comprehensive and methodologically stratified overview of VOCs (volatile organic compounds) observation across multiple platforms, a systematic literature search was conducted in the Web of Science (WOS) Core Collection. The strategy was structured around seven platform categories: (1) ground-based monitoring stations, (2) mobile monitoring systems, (3) tower-based vertical observations, (4) industrial site monitoring, (5) chamber-based calibration experiments, (6) airborne platforms (manned aircraft and UAVs), and (7) satellite-based remote sensing.
To operationalize this search, we developed a series of Boolean query strings for each platform category, intersecting three key dimensions:
(1)
VOC species terms: e.g., “VOCs”, “NMHCs”, “BTEX”, “isoprene”, and “formaldehyde”;
(2)
Observation descriptors: e.g., “in-situ measurement”, “real-time analysis”, “profiling”, “remote sensing”, and “continuous sampling”;
(3)
Platform-specific identifiers: e.g., “air monitoring site”, “mobile laboratory,”, “Sentinel-5P”, and “drone-based VOC sampling”.
To avoid semantic overlap and ensure mutual exclusivity across platforms, we incorporated negative filters (e.g., NOT TS = (“satellite” OR “ground station”)) in each query to exclude non-targeted observation types. For example, satellite retrievals excluded UAVs and towers, and UAV queries excluded aircraft or surface stations. This approach enforced platform orthogonality and minimized redundant hits across categories.
Additionally, a targeted title-based inclusion list was appended to the tower-based search to recover high-impact benchmark studies that lacked full platform descriptors in their abstracts. This hybrid approach—combining structured topic-field queries with expert-curated recall—helped ensure comprehensive coverage while maintaining domain specificity.
The combined platform-resolved search, limited to SCI-indexed journal articles and covering all years through early 2025, returned 823 records. After removing 38 duplicates, a manual screening of 785 titles and abstracts was conducted. Records were excluded if they (i) lacked VOC measurement specificity, (ii) failed to indicate observation platform context, or (iii) focused solely on meteorological processes, vegetation studies, or climate modeling without pollutant metrics. This screening yielded a final dataset of 436 articles, which were retained for full-text analysis.
Although a formal PRISMA diagram is not included, the search logic, exclusion criteria, and semantic structure of the screening process are made transparent through both narrative documentation and the visual schematic provided in Figure 1.

2.1.2. Tools

This study employs a combined methodology of bibliometric analysis and knowledge mapping to systematically examine research on VOC observation across ground-based, aerial, and satellite platforms, as well as ozone modeling and inversion using artificial intelligence techniques. Bibliometric analysis enables a structured evaluation of publication trends, platform typologies, observational strategies, and modeling frameworks. The process involves literature filtering, metadata standardization, and the application of quantitative indicators to assess platform coverage, target pollutants, modeling methods, and citation impact, ensuring thematic alignment with atmospheric pollution monitoring and data-driven environmental assessment. All bibliographic records were retrieved from the Web of Science Core Collection. Visual analytics were performed using VOSviewer (v1.6.16) and CiteSpace (v6.3.R1). VOSviewer was applied to conduct co-occurrence and clustering analysis of research keywords, helping uncover key themes such as ground-based VOC detection, satellite remote sensing of precursors (e.g., HCHO and NO2), and machine learning applications in ozone simulation. CiteSpace was used to identify citation bursts, track the temporal evolution of VOC-related observation technologies, and map collaboration networks across institutions and countries. Additionally, graph-theoretical metrics such as degree centrality, betweenness centrality, and Citation Half-Life were computed to quantify the structural dynamics of platform integration and computational modeling trends within the VOC–O3 research landscape.
(1) Degree centrality
Degree centrality reflects how many direct connections a given node (e.g., a country or institution) holds within the collaboration network. A higher value signifies broader participation and more extensive direct cooperation. The formal definition is:
C D v = d e g ( v )
where d e g ( v ) denotes the total number of edges directly linked to node v .
(2) Betweenness centrality
This metric assesses the intermediary importance of a node by measuring how frequently it lies on the shortest paths connecting other nodes. Nodes with high betweenness serve as bridges or brokers in the information flow. It is calculated as:
C B v = s v t σ s t ( v ) σ s t
where σ s t is the total number of shortest paths from node s to node t, and σ s t v is the count of those paths that pass through node v .
(3) Citation Half-Life (HL)
Citation Half-Life describes the temporal persistence of a node’s impact by measuring the median age of citations. For a series of citations C over years t1, t2,…, tn, HL marks the point where half of the cumulative citations have been accrued. It is defined as:
H L = m i n t k | i = 1 k C i 1 2 i = 1 n C i
where Ci represents the number of citations in year ti.
Together, these indicators provide a multi-dimensional perspective on collaboration dynamics—revealing not only who contributes most, but also how structural influence is established and sustained. Within the context of this study, they help map the evolving architecture of global research efforts in VOC monitoring and ozone prediction.

2.2. Knowledge Structure and Research Dynamics in the VOC–O3 Domain

2.2.1. The Changing Landscape of VOCs and Ozone Research

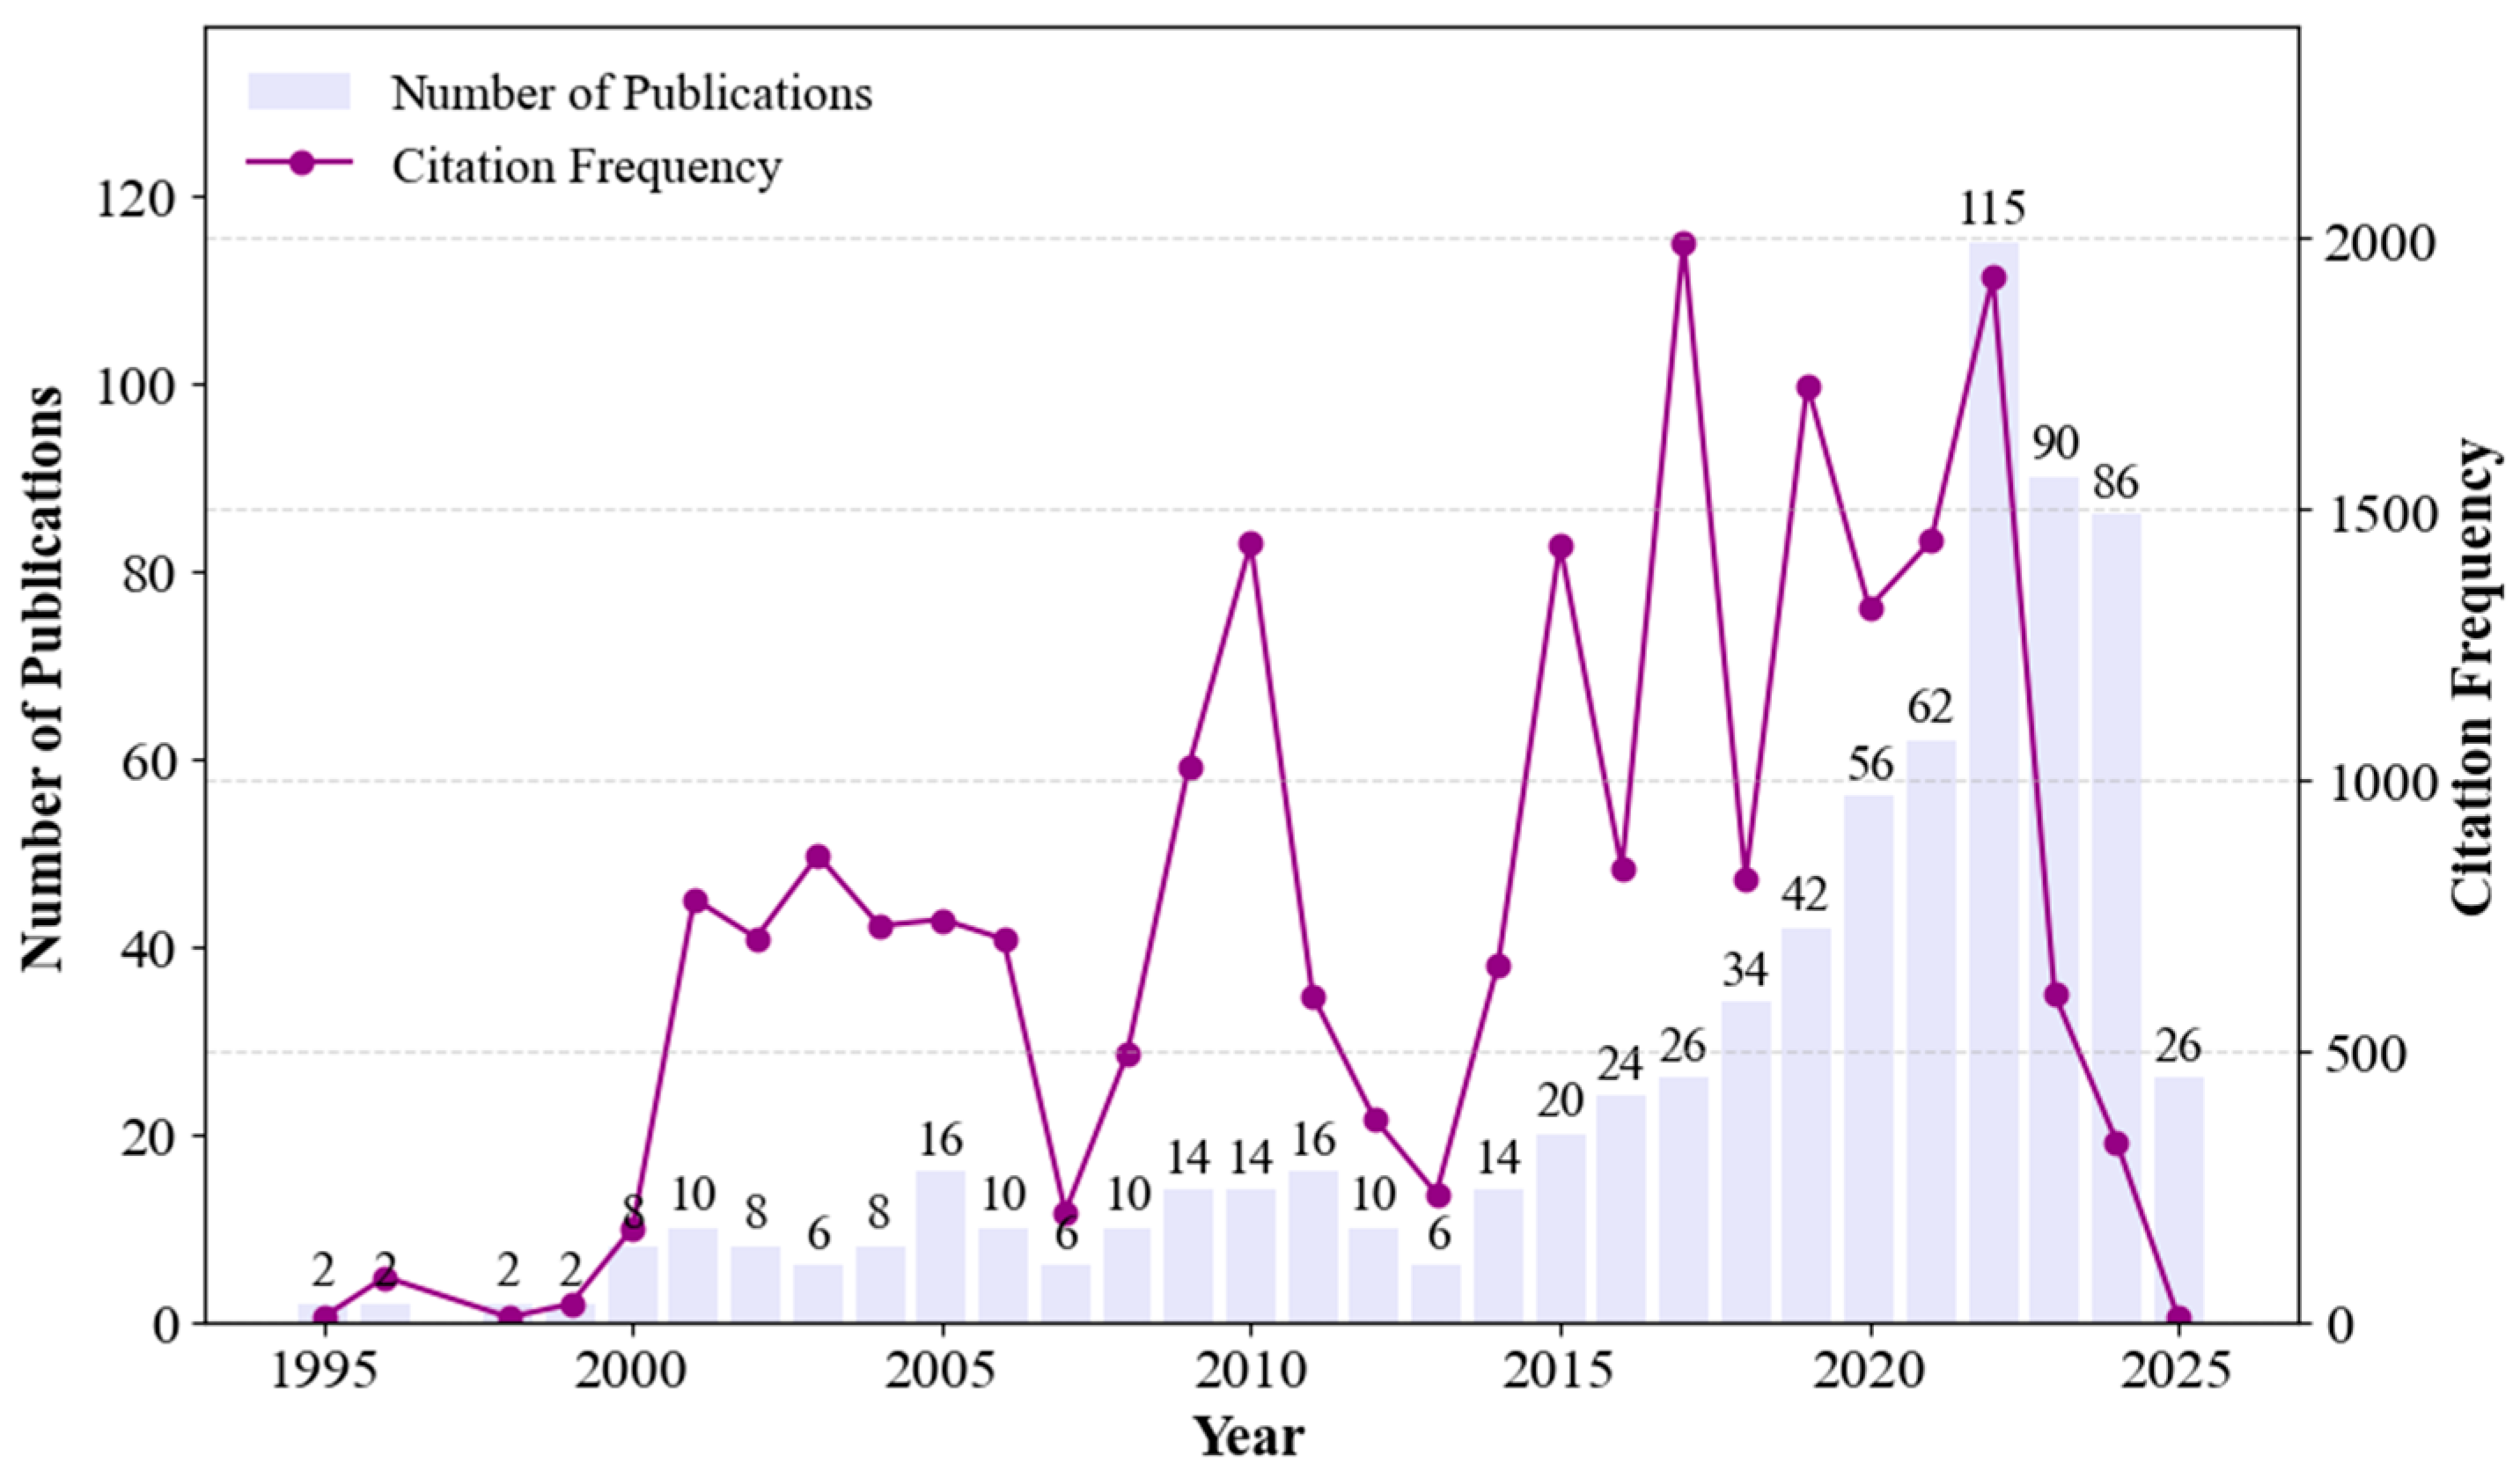
Research on platform-based VOC observation and ozone modeling has progressed notably over the past three decades, following a distinct temporal trajectory shaped by technological advancement and scientific demand. Prior to 2005, the number of annual publications remained negligible, reflecting a nascent stage characterized by isolated site measurements and limited analytical resolution. Between 2005 and 2014, the field entered a slow-growth phase, with annual outputs fluctuating below ten and minimal citation impact—most efforts were confined to descriptive analyses of VOC concentrations or ozone levels near fixed monitoring stations, with few methodological innovations. A marked inflection point emerged after 2015, driven by the urgent demand for higher spatiotemporal resolution and the concurrent maturation of sensing technologies. Publication volume increased steadily, rising from 13 articles in 2016 to a peak of 51 in 2022, representing nearly a fourfold expansion within six years. This quantitative surge coincided with the increasing adoption of high-resolution ground-based flux towers, mobile monitoring systems, and atmospheric simulation chambers, alongside a parallel rise in artificial intelligence techniques for precursor source apportionment and ozone forecasting. Although citation frequencies peaked around 2020 and subsequently stabilized, they broadly mirrored the field’s growing academic visibility and practical relevance. Collectively, these trends mark a decisive transition from exploratory, single-node measurements to a multi-platform, computationally enriched paradigm that defines the contemporary VOC–O3 research landscape (Figure 2).
(1) Ground-Based Foundations and the Rise of Urban VOC Characterization (2000–2008)
The early stage of VOC and ozone research was predominantly rooted in fixed-site observations within urban and industrial areas, where stationary gas chromatography systems and passive sampling techniques were the primary tools. Studies during this period concentrated on characterizing the chemical composition and temporal dynamics of VOC groups such as alkanes, alkenes, and aromatics, thereby establishing a foundational understanding of anthropogenic emissions and their photochemical reactivity. These efforts provided the basis for initial assessments of ozone formation potential and preliminary source attribution, albeit with limited spatial resolution and methodological depth (e.g., Volatile organic compounds in urban and industrial atmospheres in Rio de Janeiro, 2003).
(2) Vertical Expansion and the Emergence of Multiscale Modeling (2009–2015)
This phase witnessed a methodological evolution, as VOC observation expanded beyond surface-level monitoring to incorporate vertical and spatially distributed perspectives. Satellite-based instruments such as OMI and SCIAMACHY began delivering column-integrated retrievals of key ozone precursors such as formaldehyde (HCHO) and nitrogen dioxide (NO2), complementing an increasingly diversified ground-based monitoring network that included rural and background stations. The integration of photochemical indicators—most notably the HCHO/NO2 ratio—enabled the first widespread classification of ozone formation regimes. Concurrently, the uptake of chemical transport models (e.g., GEOS-Chem and CMAQ) initiated a shift toward mechanistic simulations, embedding observational data within predictive, process-resolved atmospheric frameworks (e.g., Satellite-derived formaldehyde as an indicator of VOC emissions, 2012).
(3) Cross-Platform Fusion and the Era of Precision Atmospheric Modeling (2016–2020)
A notable hallmark of this period was the fusion of diverse observational platforms into cohesive, multiscale monitoring systems. Ground-based superstations, airborne sensors, and satellite remote sensing products were integrated using data assimilation and inverse modeling approaches, enabling high-resolution quantification of precursor emissions and real-time characterization of photochemical regimes. The instrumentation landscape broadened considerably with the incorporation of technologies such as proton-transfer-reaction mass spectrometry (PTR-MS), differential optical absorption spectroscopy (DOAS), and flight-mounted LIDAR systems. This technological convergence facilitated more consistent cross-platform comparisons and laid the methodological foundation for high-precision, dynamic simulation of VOC–O3 interactions under complex meteorological scenarios.
(4) Intelligent Sensing and Predictive Atmospheric Analytics (2021–present)
The most recent phase marks a paradigm shift toward computationally intelligent atmospheric diagnostics. Artificial intelligence methods—including convolutional neural networks (CNNs), long short-term memory (LSTM) models, and gradient-boosted ensemble trees—are increasingly employed to reconstruct ozone concentrations, infer spatiotemporal emission patterns, and predict photochemical behaviors under diverse environmental conditions. These data-driven approaches are often coupled with input streams from unmanned aerial vehicles (UAVs), mobile laboratories, and cost-effective IoT sensor arrays, forming adaptive frameworks capable of near-real-time monitoring and decision support. By fusing domain knowledge with algorithmic generalization, such systems have enabled robust, scalable solutions for VOC–O3 mapping across geographies and seasons, advancing both scientific insight and policy relevance (e.g., Machine learning approach for ozone prediction based on VOC indicators, 2022; Spatiotemporal mapping of VOCs using drone-based sensor arrays, 2023).
From isolated manual sampling to intelligent, multi-platform sensing ecosystems, the evolution of VOCs and ozone research reflects an accelerating convergence of atmospheric science, sensor technology, and machine learning. As observational granularity deepens and computational tools mature, the field is increasingly positioned at the forefront of data-driven air quality governance and climate–chemistry interaction analysis.

2.2.2. National Research Profiles and Structural Influence

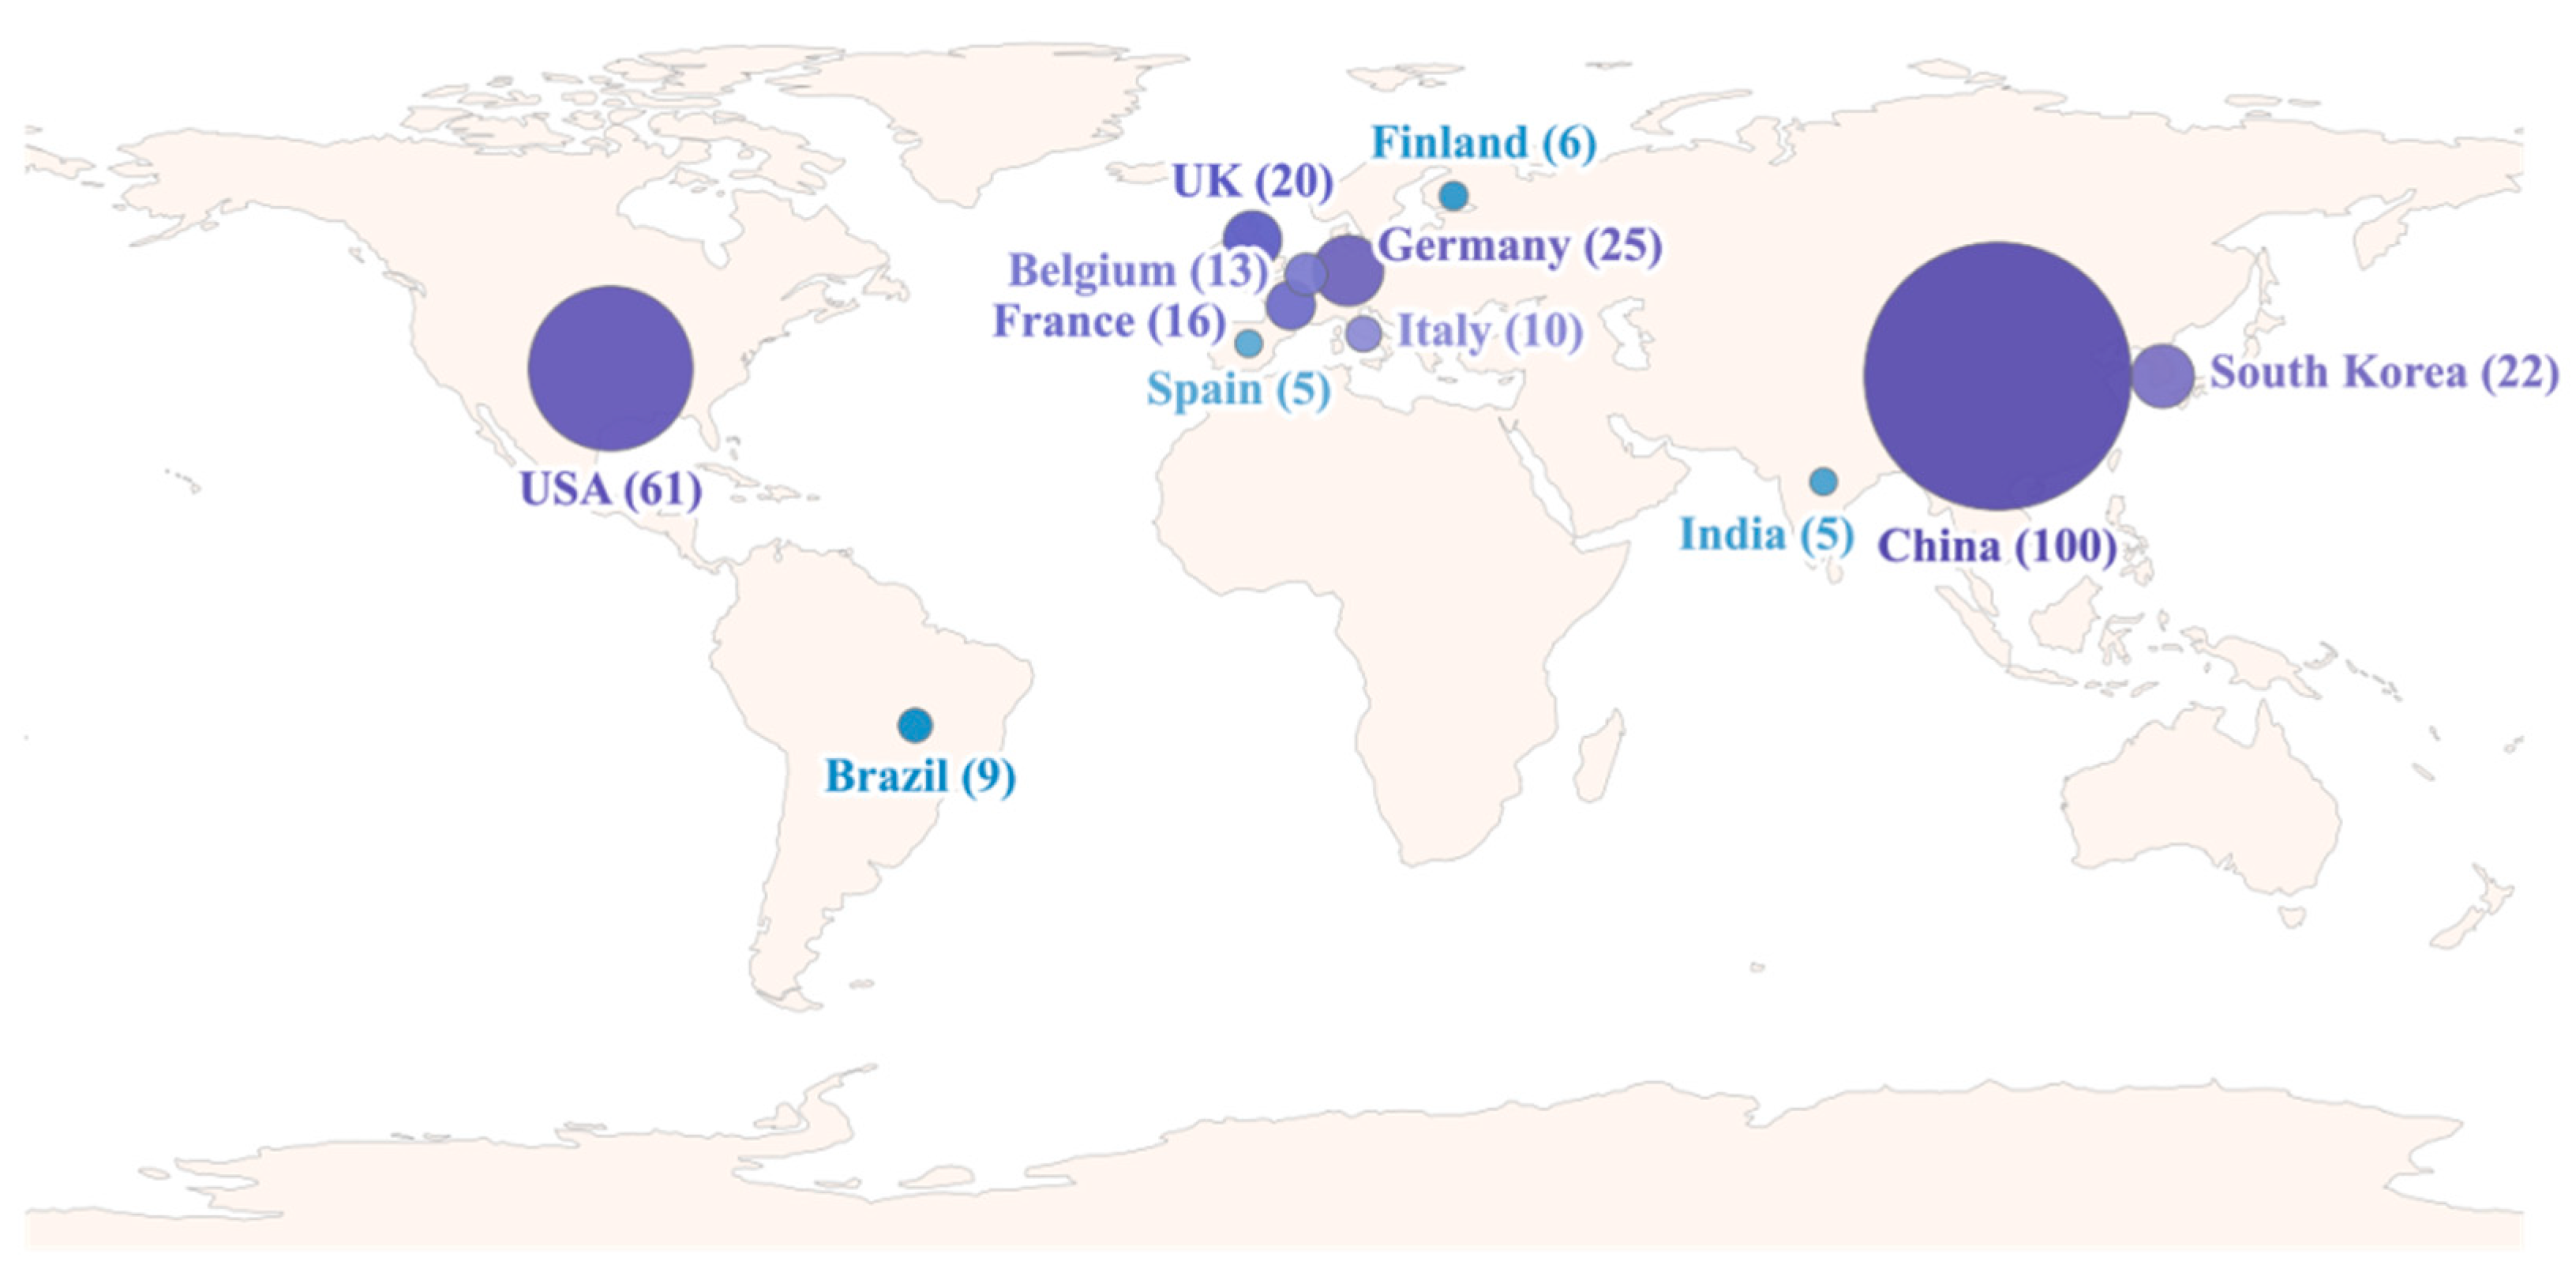
The global research landscape on VOC observation and ozone modeling exhibits pronounced asymmetries in both quantitative output and spatial distribution. As shown in Figure 3, China and the United States dominate scholarly production, with 100 and 61 publications, respectively, jointly accounting for over half of all identified literature. This prominence reflects sustained investment in atmospheric monitoring infrastructure and the early incorporation of modeling frameworks in national environmental agendas. Following these two leaders, countries such as Germany, South Korea, and the United Kingdom (20–25 publications) form a transregional core linking Europe and East Asia, often serving as hubs for algorithm development and platform integration.
In contrast, countries such as France, Belgium, and Italy (10–16 publications) maintain a moderate research presence, frequently participating in collaborative campaigns or contributing to precursor regime classification. Nations such as Brazil, Finland, Spain, and India (fewer than 10 publications) show more emergent or peripheral engagement, shaped by either nascent scientific infrastructure or limited integration into global research consortia. This geographical heterogeneity sets the stage for more nuanced evaluations of how countries participate in—and shape—the evolution of VOC–O3 research beyond publication metrics alone.
Beyond publication volume, structural indicators offer deeper insights into the roles countries play within the global research network. As detailed in Table 1, the United States, while second in publication count, leads in degree centrality (19) and betweenness centrality (0.41)—a clear indication of its dual role as both a prolific contributor and a key intermediary across collaborative pathways. In contrast, China, despite producing the highest number of publications, exhibits only moderate structural connectivity (degree: 13) and a lower bridging role (betweenness: 0.22), suggesting a more internally cohesive or regionally concentrated network of collaborations.
Germany, South Korea, and France occupy intermediate positions, combining solid output with structural connectivity. South Korea is particularly notable for its high betweenness centrality (0.36) relative to output, underscoring its role as a regional bridge between East Asian and Western research institutions. Meanwhile, countries such as Brazil, Finland, and Spain contribute to the literature but exhibit limited structural influence, with low centrality scores and marginal network positioning. These disparities between productivity and structural centrality illustrate the importance of international positioning—not merely output volume—in shaping influence and research integration within the VOC–O3 domain.
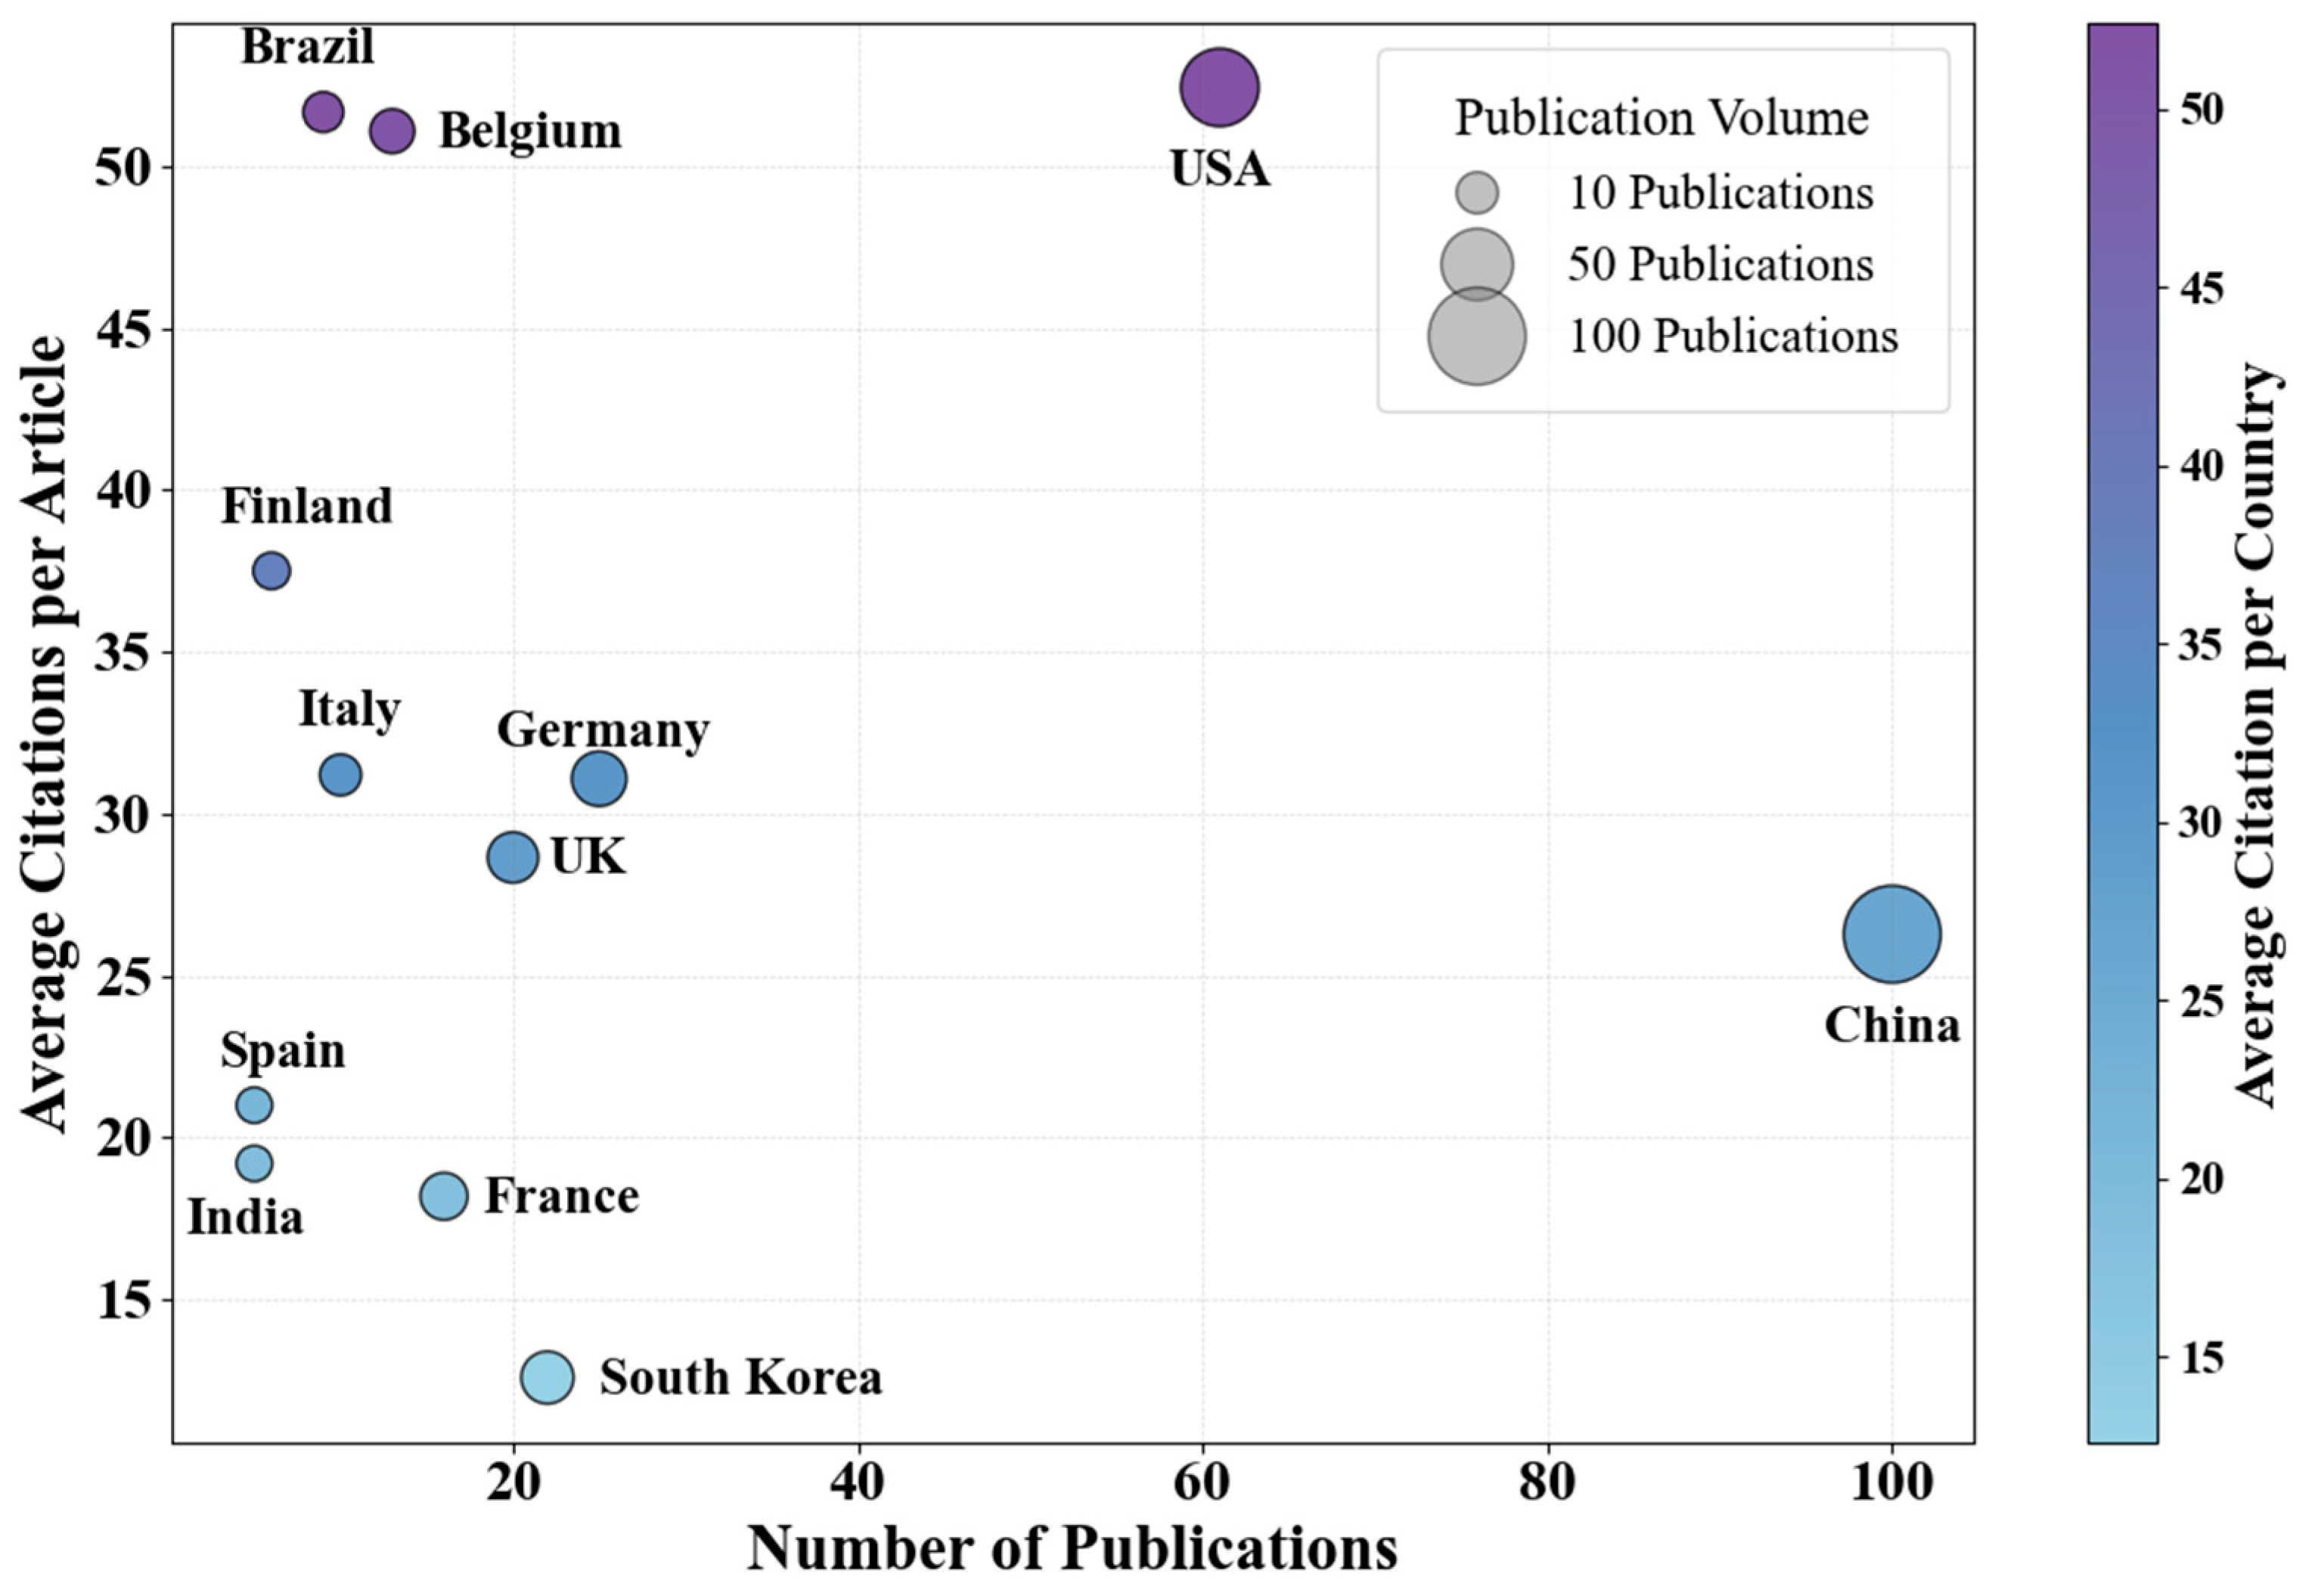
Finally, citation-based indicators offer a third analytical dimension—illuminating the efficiency and scholarly resonance of national outputs. As visualized in Figure 4, countries such as the United States (52.43), Belgium (51.08), and Brazil (51.67) achieve exceptionally high average citations per article, indicating disproportionate academic impact despite moderate or low publication volumes. Similarly, Finland and Italy (37.5 and 31.2) reflect efficient research strategies with relatively high per-publication influence.
In contrast, high-output countries such as China (100 publications, 26.28 citations/article) exhibit moderate citation efficiency—likely reflecting a broad yet heterogeneous portfolio with variable international reach. South Korea and France also display subdued impact relative to output, suggesting potential limitations in journal visibility, language accessibility, or thematic generalizability. These asymmetries point to a partial decoupling between productivity and influence, wherein smaller, more strategically aligned research efforts may achieve greater global resonance.
Together, these multi-dimensional indicators—encompassing spatial output patterns, structural network positions, and citation efficiencies—offer a holistic characterization of national roles in VOC–O3 research. They collectively highlight that advancing this field requires not only increasing output but also fostering global integration, thematic precision, and interdisciplinary innovation.
Despite these asymmetries, expanding the geographical and institutional base of VOC–O3 research is both feasible and necessary. For emerging research communities outside the current dominant clusters, we offer the following suggestions. First, leverage open-access remote sensing platforms (e.g., TROPOMI and OMI) and reanalysis products (e.g., ERA5 and MERRA-2), which provide high-resolution data for ozone precursors and meteorology without requiring dedicated local infrastructure. Second, prioritize low-cost sensor networks and urban pilot studies, particularly in heat-vulnerable megacities where VOC–O3 interactions are likely to be intensified by climate change. Third, engage with global collaborative programs—such as IGAC (International Global Atmospheric Chemistry) and WMO GAW (Global Atmosphere Watch)—to access technical resources, model toolkits, and cross-national co-authorship opportunities. Finally, explore regime-sensitive AI tools that can adapt to local conditions without requiring extensive historical data. These pathways not only democratize participation but also enhance the global representativeness and resilience of the ozone monitoring and modeling ecosystem.

2.2.3. Evolving Research Focus and Influential Contributions

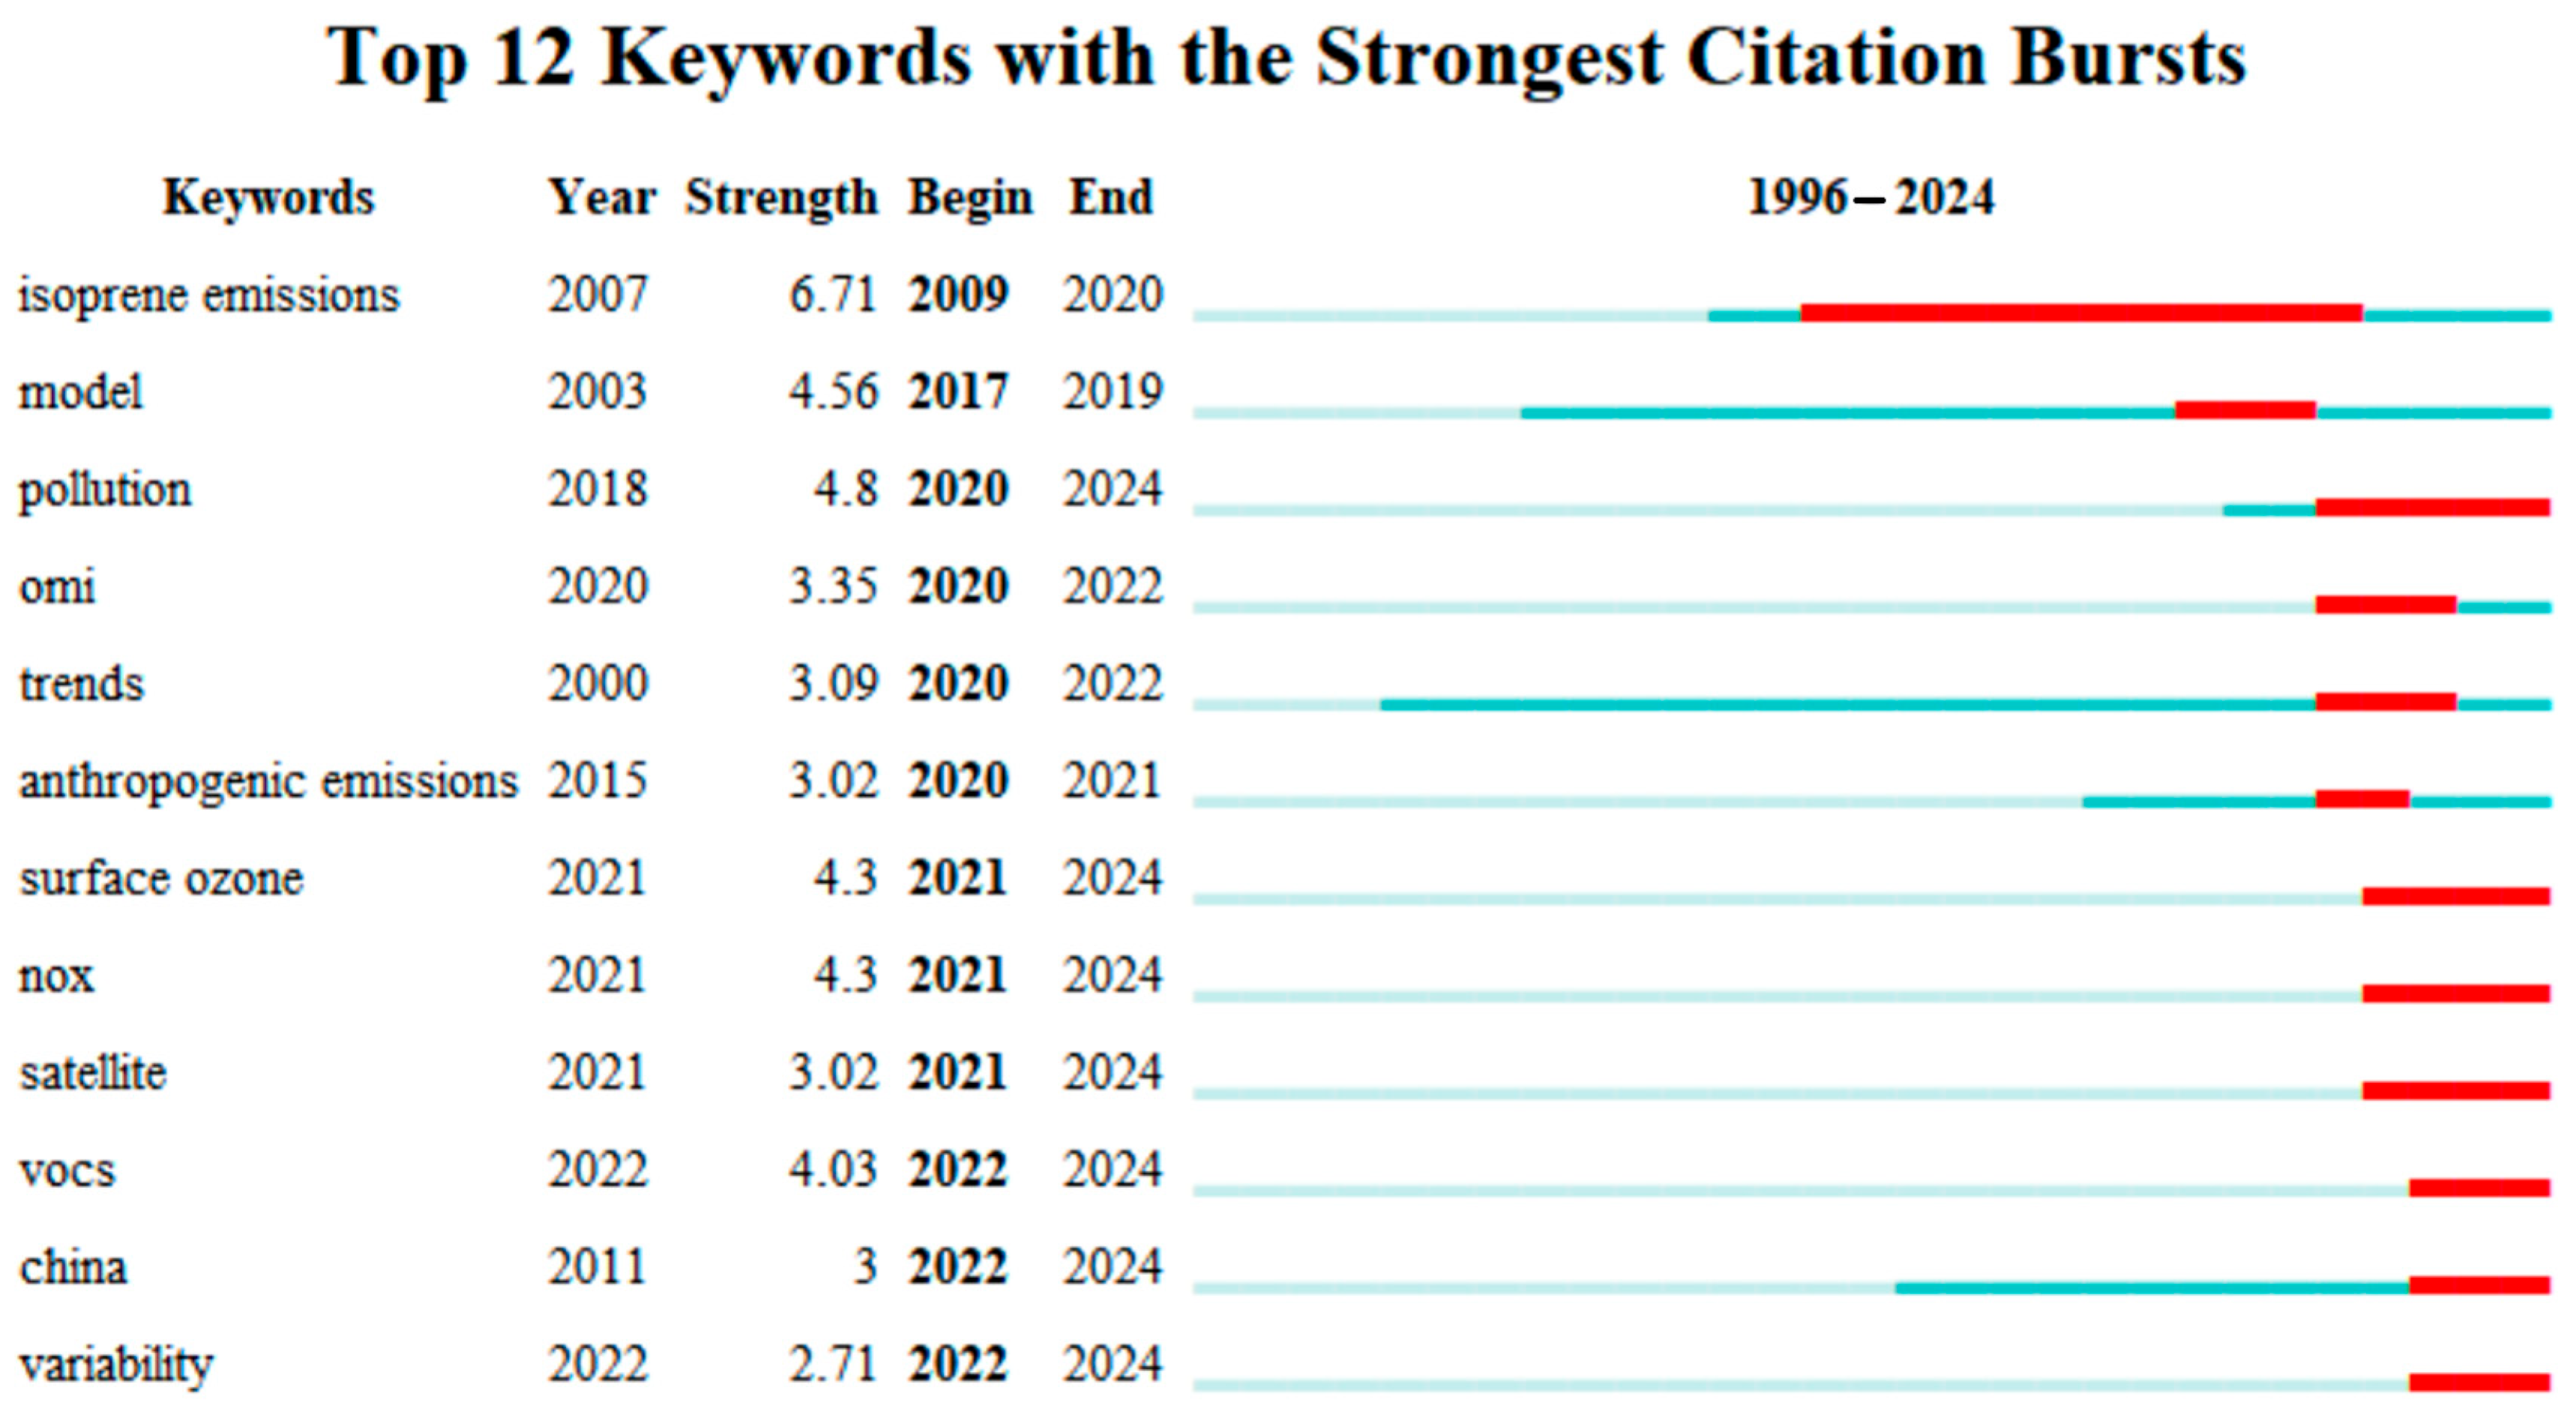
Figure 5 highlights the top 12 keywords with the strongest citation bursts in VOC–O3 studies between 1996 and 2024. Among them, “isoprene emissions” displays the most intense and sustained burst (2009–2020, strength = 6.71), reflecting its pivotal role in biogenic VOCs research and ozone formation. Meanwhile, “model” and “trend” stand out not only for their burst strength but also for the exceptionally long duration of their baseline presence—with “trend” exhibiting relevance from as early as 2000 and “model” maintaining consistent citations since 2003. This indicates their foundational status in structuring both observational and predictive frameworks.
In contrast, recent bursts such as “pollution”, “OMI”, “surface ozone”, and “satellite” (primarily 2020–2024) mark the rise of remote sensing diagnostics and policy-relevant air quality assessments [11,12]. Notably, keywords such as “VOCs”, “China”, and “variability” have emerged after 2022 and remain active, pointing to a thematic transition toward region-specific source complexity and uncertainty quantification in atmospheric modeling.
Collectively, these patterns reveal two layers of research focus: long-term conceptual scaffolding (e.g., trend and model) and recent methodological surges driven by technological advances and regulatory demand. The juxtaposition of persistent and emergent keywords underscores a maturing research field balancing theoretical grounding with applied innovation.

3. Hierarchical Platforms and the Recursive Architecture of VOCs Observability

3.1. Recursive Sensing and the Architecture of VOCs Observability

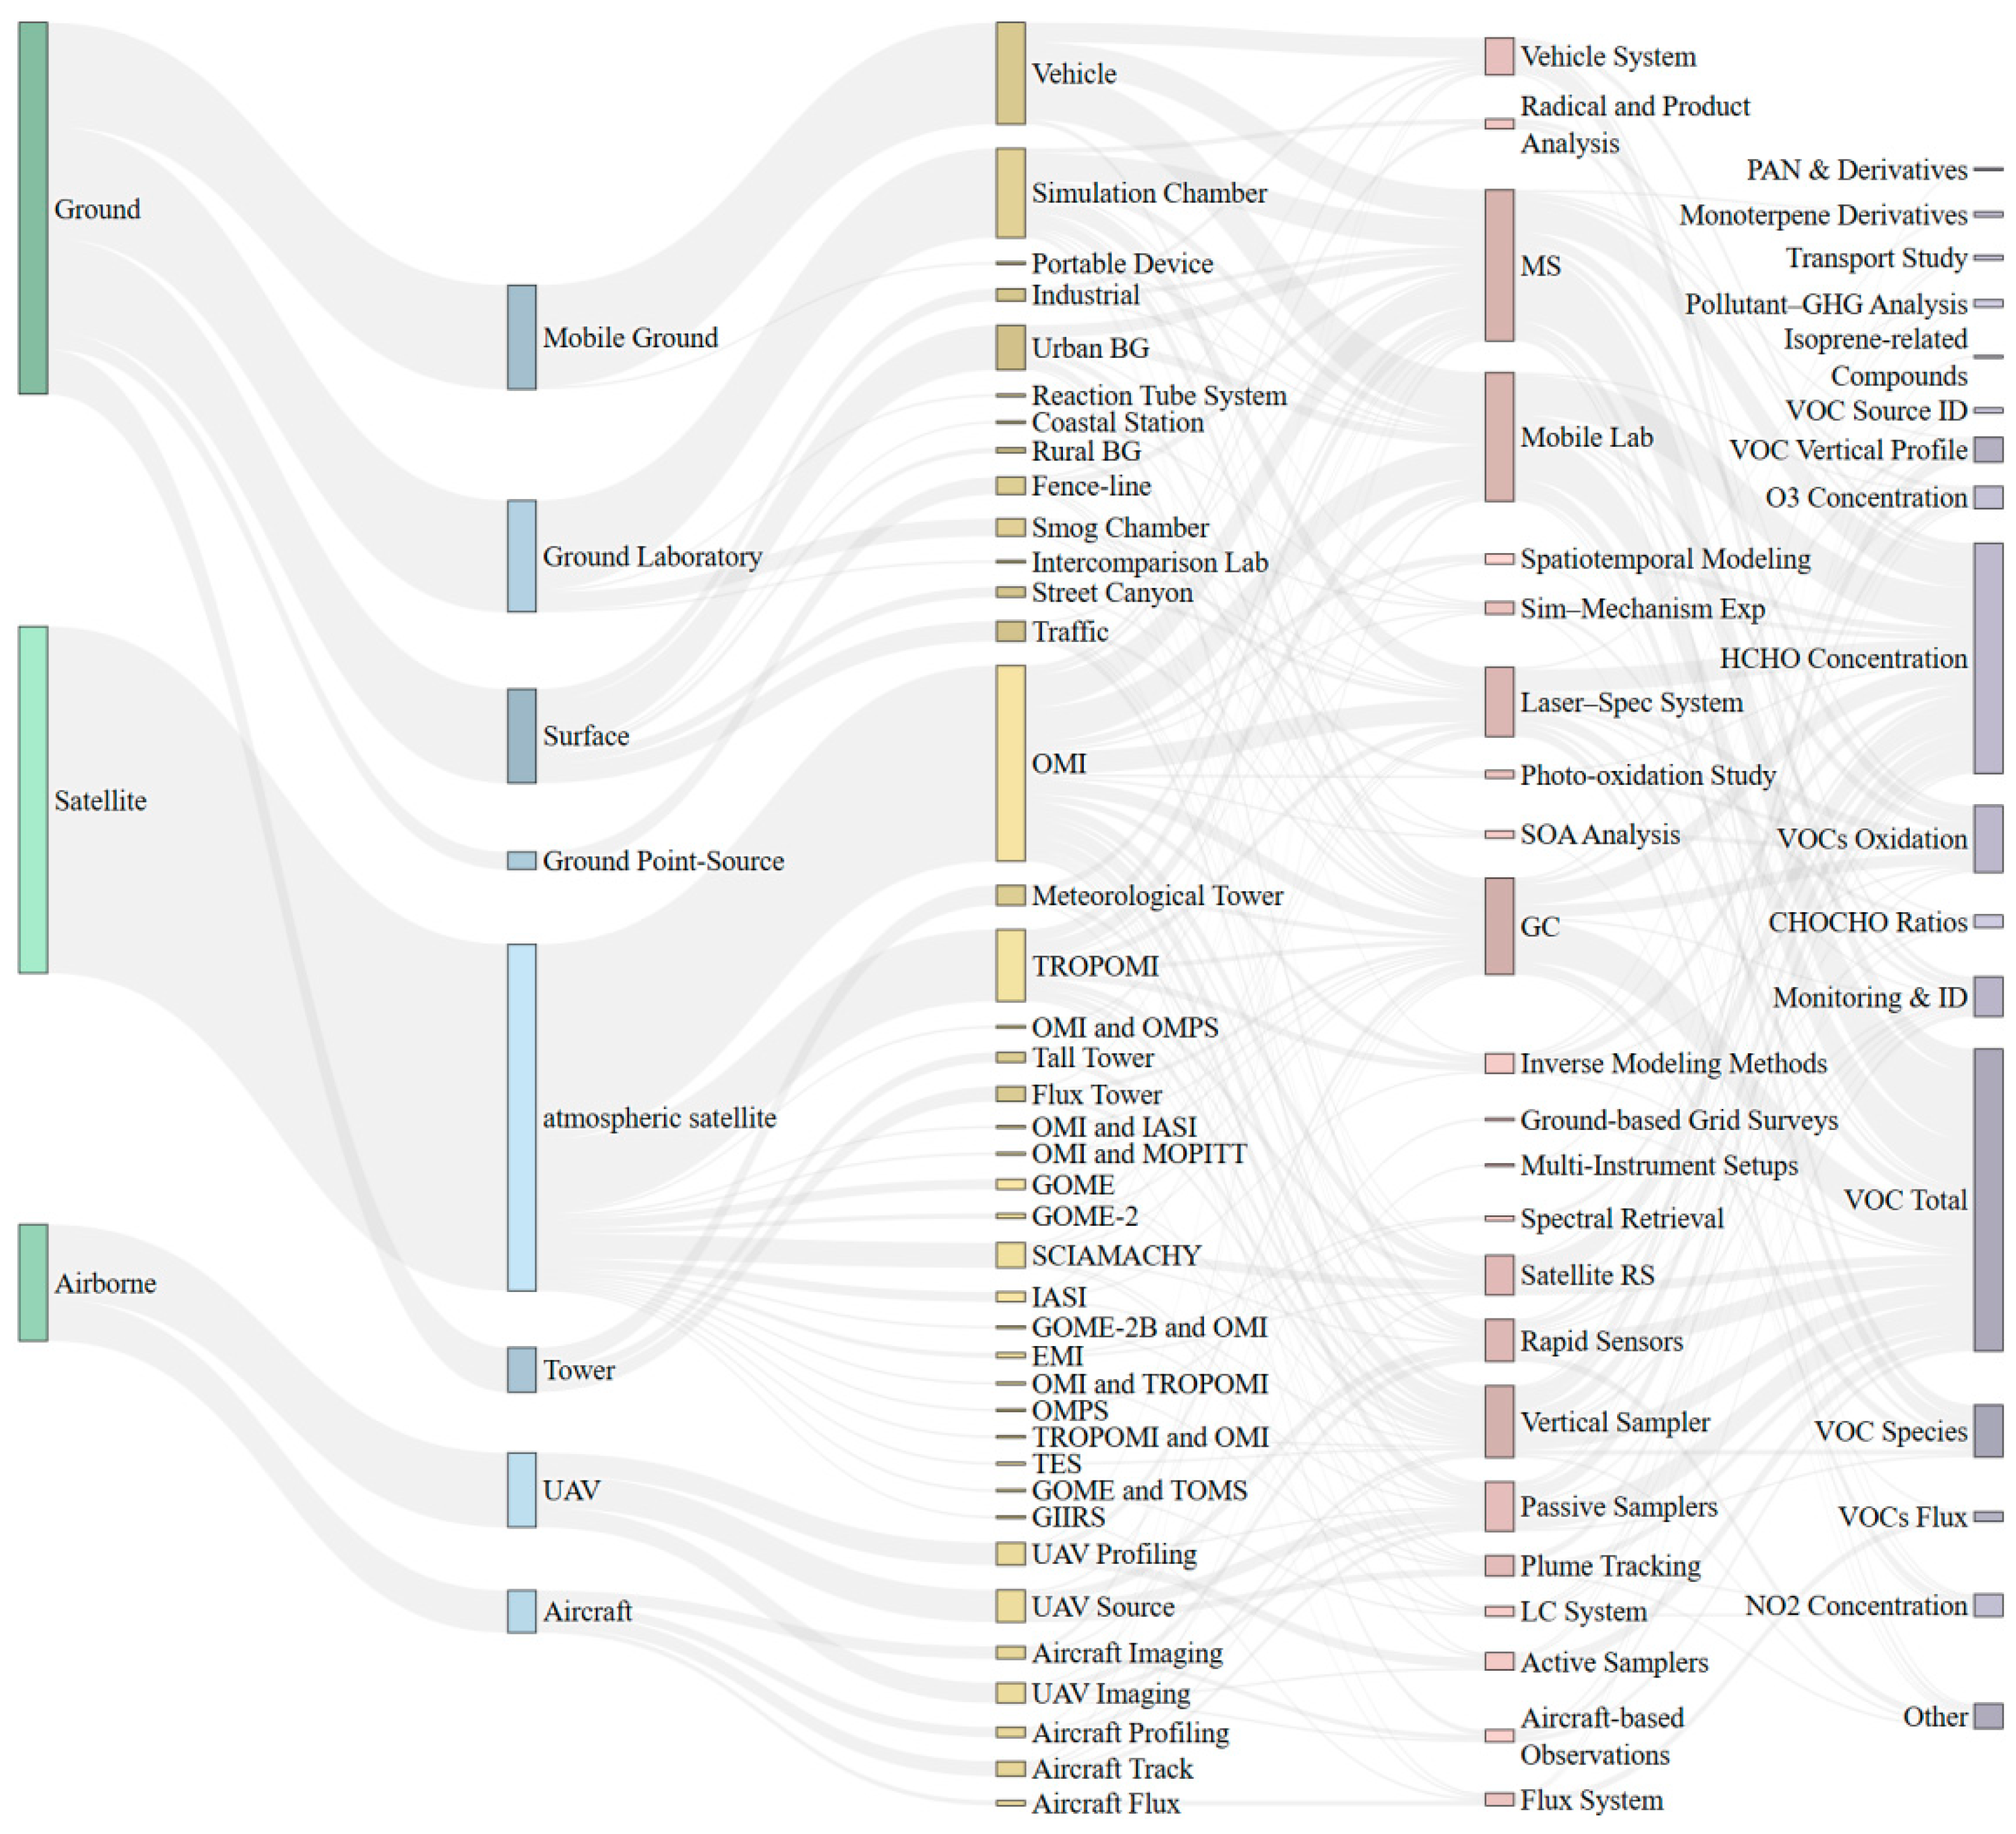
The challenge of observing VOCs lies less in detecting their presence than in resolving their spatiotemporal dynamics across chemically diverse, atmospherically coupled, and source-heterogeneous environments. This complexity demands not a single sensor but a vertically integrated system—one in which platforms function not as isolated instruments but as coordinated nodes within a structured observational logic. As shown in Figure 6, the taxonomy of VOCs monitoring—ground-based, airborne, and satellite-based—is not defined by hardware per se, but by how measurement intent maps onto atmospheric structure and process. Ground-level platforms, ranging from fixed stations to flux towers and simulation chambers, serve as the empirical foundation for source detection, reaction pathway validation, and near-field quantification. Airborne systems, especially UAVs and research aircraft, mediate between surface heterogeneity and orbital abstraction, enabling vertical profiling, flux estimation, and transport tracking. Satellite-based observations, in turn, offer synoptic-scale retrievals through instruments such as TROPOMI, OMI, and IASI, while specialized missions (e.g., TES and GIIRS) add vertical depth or spectral nuance, and legacy satellites (e.g., GOME and TOMS) anchor trend continuity.
What emerges is not a hierarchical cascade, but a recursive sensing architecture, where information flows bidirectionally—laboratory mechanisms inform model inversion; satellite retrievals are anchored in ground truth; and aircraft close the spatial and process gaps. The typology table and Sankey diagram (Table 2) together reflect this shift: platform categories no longer denote instrument classes but functional roles—initiators of detection, intermediaries of integration, and synthesizers of inference. The modern VOCs observation system is thus not a sum of devices, but a designed coherence—a methodological chain through which chemical variability, atmospheric reactivity, and policy-relevant accountability become measurable. This foundational layer of the sensing system, though often overlooked, anchors the vertical architecture of VOCs observability.

3.2. Ground-Based Platforms for VOCs Monitoring

Ground-based observation remains the empirical cornerstone of VOCs monitoring—not because it is closest to the source, but because it is closest to the science. It is here that measurements acquire chemical resolution, where data speak the language of reactivity, speciation, and mechanistic constraint. Unlike satellite retrievals, which must infer, or airborne systems, which often interpolate, ground-based platforms observe with intent—anchoring, validating retrievals, and illuminating processes [42,43].
Before delving into functional typologies and case-based analysis, it is instructive to consider the statistical landscape of ground-based VOCs monitoring platforms as reflected in the reviewed literature. As shown in Figure 7, five major categories dominate the domain: laboratory-based systems (45 studies), mobile ground platforms (42), fixed ground stations (38), tower-based flux and profiling structures (18), and point-source monitoring units deployed at factory fencelines or industrial boundaries (7). While differing in configuration and application, these platforms collectively embody the empirical foundation upon which VOCs observational science is built.
Over the past two decades, the typology of ground VOCs platforms has evolved from static monitoring nodes to a diversified, functionally adaptive architecture. This architecture is not defined by geography alone—urban, rural, or coastal—but by what it enables: trend interpretation, source attribution, regulatory validation, and mechanistic experimentation [44,45]. What follows is not a catalogue, but a storyline of how these platforms extend the reach of atmospheric insight—from fixed street corners to chemical reaction chambers.
We begin with the fixed monitoring station, long considered the spine of regulatory and trend-based VOCs networks. Figure 8a presents a modular station in peri-urban France, equipped with continuous GC-FID speciation and designed for unobstructed boundary-layer sampling [46]. Beyond its instrumentation, its placement matters—it stands at the interface of urban dynamics and regional background, enabling time-resolved analysis of BTEX and other ozone precursors [43]. Such stations have become diagnostic hubs in cities such as Hong Kong and Seoul, linking local emissions with ozone exceedances and enabling model–inventory reconciliation [47,48].
Yet cities breathe, and their emissions move. Hence the rise of mobile platforms—systems that chase sources rather than await them. Figure 8b depicts a ruggedized, vehicle-adapted mass spectrometer deployed for dynamic source tracking [49]. Its real-time sensitivity, compactness, and spatial mobility enable responsive monitoring in industrial corridors, port zones, and even emergency contexts. Mobile campaigns in Beijing and Mexico City have revealed discrepancies in inventories, identified fugitive industrial plumes, and trained machine learning algorithms to recognize source fingerprints in transit [50].
Still, some truths lie not across streets but along gradients. Figure 8c shows a 365-m flux and profiling tower near Shenzhen, which captured altitude-dependent NOx and O3 variations during the COVID-19 lockdown [23]. These towers act as structural interpolators—constructing vertical VOCs profiles, resolving inversion layers, and feeding satellite and CTM validation. Whether over urban basins or biogenic forests, such platforms reveal how VOC fluxes evolve with meteorology, mixing, and time of day [51].
Some sources, however, do not advertise their presence. Fenceline platforms, such as the one shown in Figure 8d at a synthetic rubber facility, are designed for exactly that—emissions that evade regulation but impact nearby populations. With dual passive/active sampling nodes and spatially resolved layouts, these systems uncover emission heterogeneity, detect carcinogenic hotspots, and guide mitigation strategies [21]. Their integration into community health monitoring and EPA methods marks a shift from passive surveillance to proactive accountability [52].
Lastly, VOCs science does not stop at detection—it interrogates. Figure 8e illustrates the SAPHIR-PLUS simulation facility in Germany, a hybrid platform that simulates both biogenic VOC emissions and their oxidative fate under controlled conditions [53]. Laboratory platforms like these are where abstract pathways become measurable, where PTR-TOFMS methods are cross-compared, and where model structures are either upheld or undone [54]. They are the epistemic laboratories of atmospheric chemistry—supporting campaign design, instrument calibration, and theoretical constraint.
Figure 8. Typology of ground-based VOCs monitoring platforms: from fixed nodes to mechanistic simulators. Visualized configurations of five core ground-based platform types: (a) fixed station [55], (b) mobile monitoring unit [49], (c) stratified tower [23], (d) fenceline source tracker [2], and (e) laboratory chamber system [53].
Sustainability 17 07512 g008
Far from constituting the lowest tier of an observational hierarchy, ground-based VOCs platforms act as both the empirical inception and the interpretive fulcrum of atmospheric sensing. They do not merely support other systems—they contextualize them. Satellites may extend scope, and UAVs may resolve gradients, but without the chemical granularity, experimental controllability, and regulatory proximity offered by ground platforms, these upper-tier systems risk floating untethered above the complexity they aim to resolve.
This is the epistemic leverage of ground-based observation: it renders atmospheric chemistry not just observable, but legible. It mediates between molecule and model, between emission and attribution. In the era of integrated, recursive observation chains, the ground is no longer a reference—it is a reality anchor. In addition, in VOCs research, it remains where measurement becomes meaning.
Nonetheless, the interpretive power of ground-based platforms is not without its geographic caveats. While chemically resolute and temporally rich, these platforms are disproportionately concentrated in urban and peri-urban locales, resulting in a spatial sampling bias that may skew broader assessments of ozone formation regimes. In particular, the underrepresentation of rural or transitional zones—where biogenic VOCs dominate and NOx levels fall below regulatory thresholds—poses challenges for extrapolating urban-derived insights to regional scales. This spatial asymmetry can distort regime classification, leading to overemphasis on VOC-limited dynamics while underdetecting NOx-limited transitions in downwind or forested environments. Bridging this observational gap requires not only the expansion of fixed networks into under-monitored areas but also the strategic deployment of mobile units and UAV-based samplers to trace rural plume evolution and assess background–source interactions.

3.3. Airborne Platforms and Multi-Altitude VOC Detection

Airborne platforms occupy a strategic tier in VOC monitoring, bridging the vertical and spatial resolution gaps between ground-based sites and satellite instruments. They enable researchers to track plumes in real-time, map altitudinal profiles of reactive species, and investigate atmospheric chemistry in regions where fixed stations are sparse or inapplicable—such as above forest canopies, over oceans, or during dynamic wildfire events. These platforms expand not only the physical reach of observation but also the temporal and chemical granularity at which VOC processes can be resolved.
Two main airborne systems—manned aircraft and unmanned aerial vehicles (UAVs)—form a complementary observational hierarchy. Manned aircraft offer unparalleled endurance, payload capacity, and vertical profiling, while UAVs provide agile, near-surface access at finer spatial resolutions. Rather than functioning in opposition, they occupy distinct ecological and technological niches within the VOC sensing landscape.
To clarify the operational contrasts and synergistic roles of these two platform types, Table 3 summarizes their respective capabilities, applications, and trade-offs across key dimensions such as altitude range, instrumentation payload, spatial resolution, and observational focus. This comparison lays the foundation for understanding how each system is deployed in real-world campaigns—and why both are indispensable to the atmospheric VOCs toolkit.
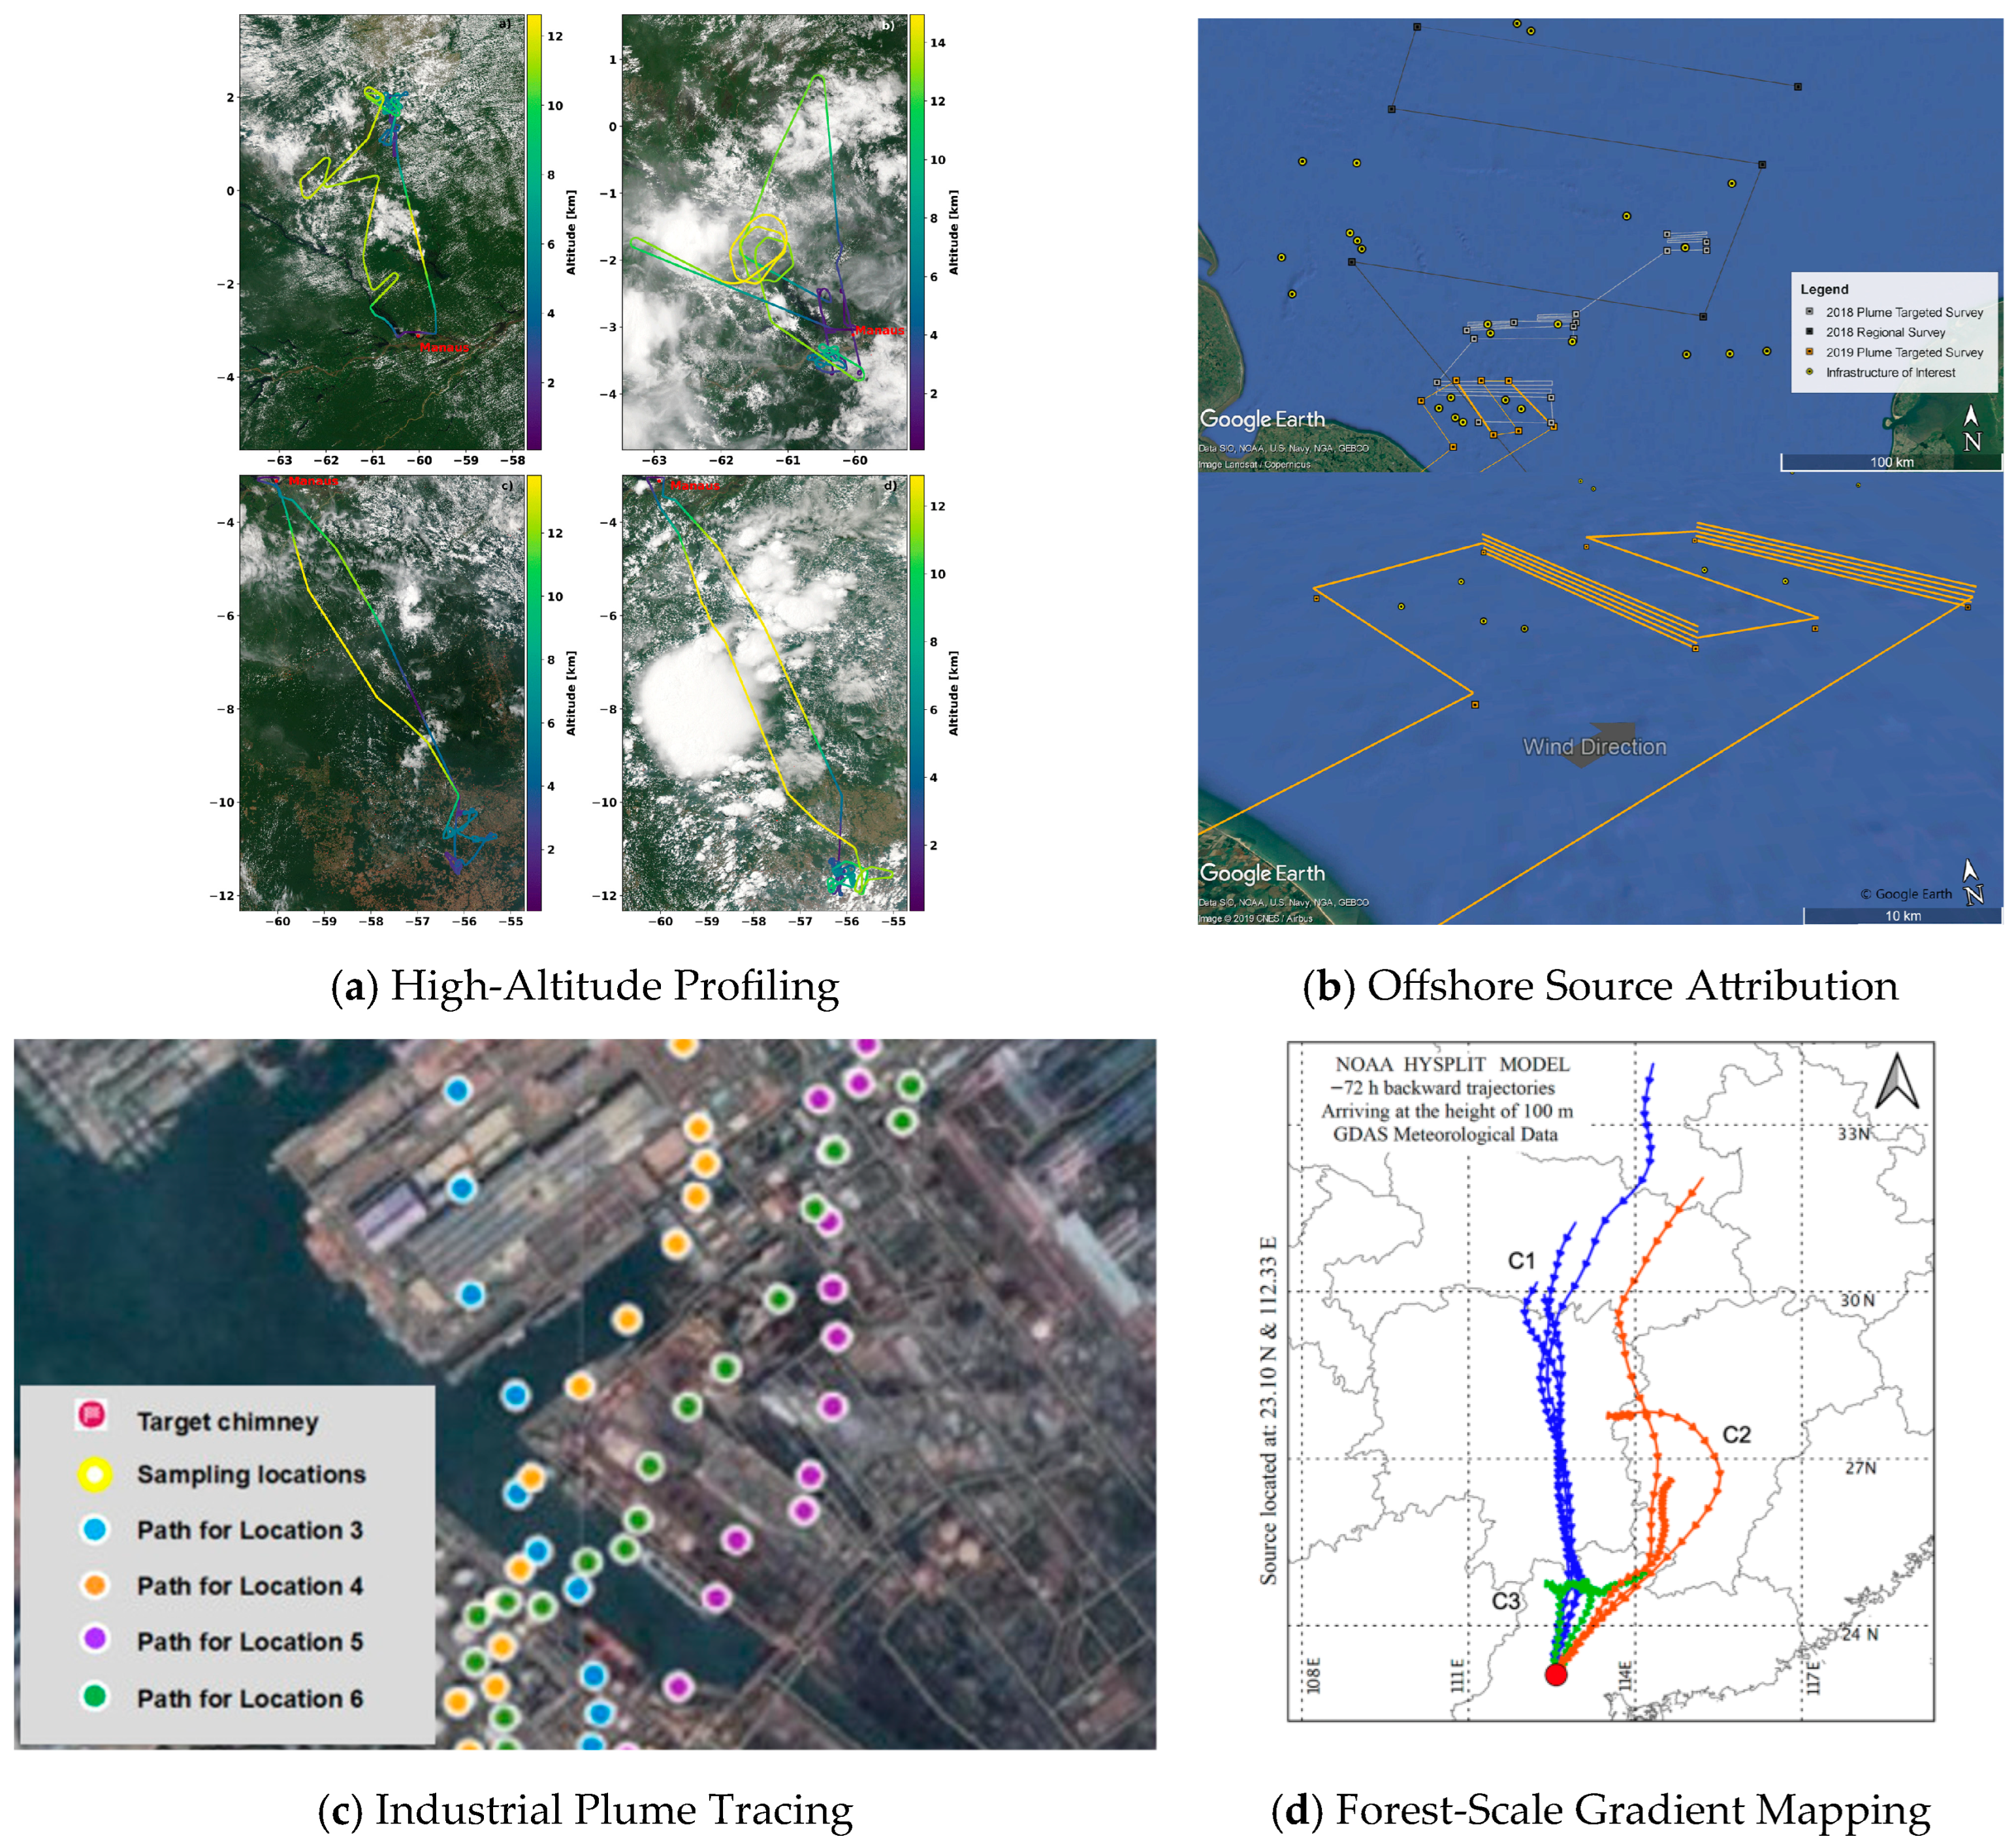
These complementary features are not just theoretical—they translate into mission-specific deployments across a wide array of environments. The following four case studies illustrate how manned and unmanned systems have been used to intercept biomass plumes, resolve industrial emissions, characterize forest canopy processes, and quantify offshore facility leakage. Each reflects the platform’s situational strengths and application logic within broader observational strategies [56]. These real-world deployments are visualized in Figure 9, which showcases representative configurations for high-altitude profiling, offshore attribution, industrial plume tracing, and forest-canopy gradient mapping across manned and unmanned airborne systems.
Nowhere is this interplay more evident than in tropical biomass burning regions, where reactive carbon is lofted, transformed, and transported across vast atmospheric layers. During the ACRIDICON-CHUVA campaign over the Amazon, manned aircraft performed stacked flight profiles above and around Manaus, tracing formaldehyde, glyoxal, and methylglyoxal across cloud layers and into the upper troposphere [31]. These measurements revealed not only the vertical complexity of OVOC emissions but also their systematic underrepresentation in inventories—a mismatch that only altitude-resolved, chemically detailed surveys could expose [59].
Yet not all emission sources rise to meet such aircraft. In coastal and offshore settings, for instance, plume dispersion occurs within shallow marine boundary layers, often below satellite detection limits and beyond the reach of land-based monitors. To address this, aircraft such as the Twin Otter were reconfigured for low-altitude transects across North Sea oil and gas platforms. Using isotopic tracers and mass-balance fluxes, these missions disentangled venting, flaring, and fugitive sources—resolving not just the magnitude of emissions but also their regulatory origin [56]. Here, manned aircraft did not survey passively; they isolated and attributed, bridging science with enforcement.
Where even small aircraft cannot go, UAVs extend the observational frontier. In Taiwan’s Linhai Industrial Complex, drone-mounted needle trap samplers were deployed along pre-modeled dispersion paths to trace VOC hotspots around petrochemical and wastewater facilities. Unlike broader aerial transects, these missions mapped spatial variability in real-time—detecting localized spikes in TEX compounds with a resolution unattainable by fixed stations. The drone was not an accessory; it was the only platform capable of operating at that proximity, in that context, with that degree of specificity [28].
Elsewhere, in subtropical forests of southern China, UAVs were dispatched to investigate vertical gradients of biogenic VOCs—particularly isoprene and α-pinene—across canopy layers. Measurements at 25 and 100 m revealed unexpected reversals in concentration patterns, prompting the use of transport modeling to explain eddy diffusion and slope-induced flow effects. The result was more than a novel finding; it was a correction to long-held assumptions in biogenic emission modeling, one achievable only by operating in the vertical interspace between forest towers and satellites [58].
In this way, airborne platforms do more than fill gaps in existing systems—they create new observational grammars. Manned aircraft translate regional chemistry into altitude-resolved narratives; UAVs resolve spatial heterogeneity into mechanistic constraints. Their combined choreography allows VOCs science to ask different questions, in different places, with different scales of accountability.
In VOCs research, air is not an inert transit zone—it is a chemically active theater. In addition, airborne platforms are how we learn to navigate it.
While ground- and airborne platforms provide high-resolution and chemically explicit insights at limited spatial scales, satellite platforms extend this observational framework to the planetary scale, enabling global diagnostics, emission tracking, and long-term trend analysis.

3.4. Satellite-Based VOCs Monitoring and Ozone Sensitivity Diagnostics

In the vertically structured VOCs observation system, satellite platforms occupy a singular and irreplaceable position—not by virtue of their chemical sensitivity, but through their unique capacity for spatial omnipresence and temporal continuity. Unlike ground-based networks that anchor chemical precision yet remain spatially constrained, or airborne platforms that offer vertical profiling but suffer from campaign intermittency, satellites provide uninterrupted and geographically extensive coverage. This fundamental advantage becomes increasingly critical as VOC–ozone interactions evolve into a central concern of atmospheric chemistry, air quality management, and climate-linked policy. While satellite retrievals often lack vertical resolution and species-level granularity, recent advances in spatial fidelity, multispectral design, and algorithmic inference have transformed these platforms from passive monitors into dynamic informers—capable of diagnosing chemical regimes, reconstructing emission sources, and tracing complex transport phenomena across scales unreachable by any other means.
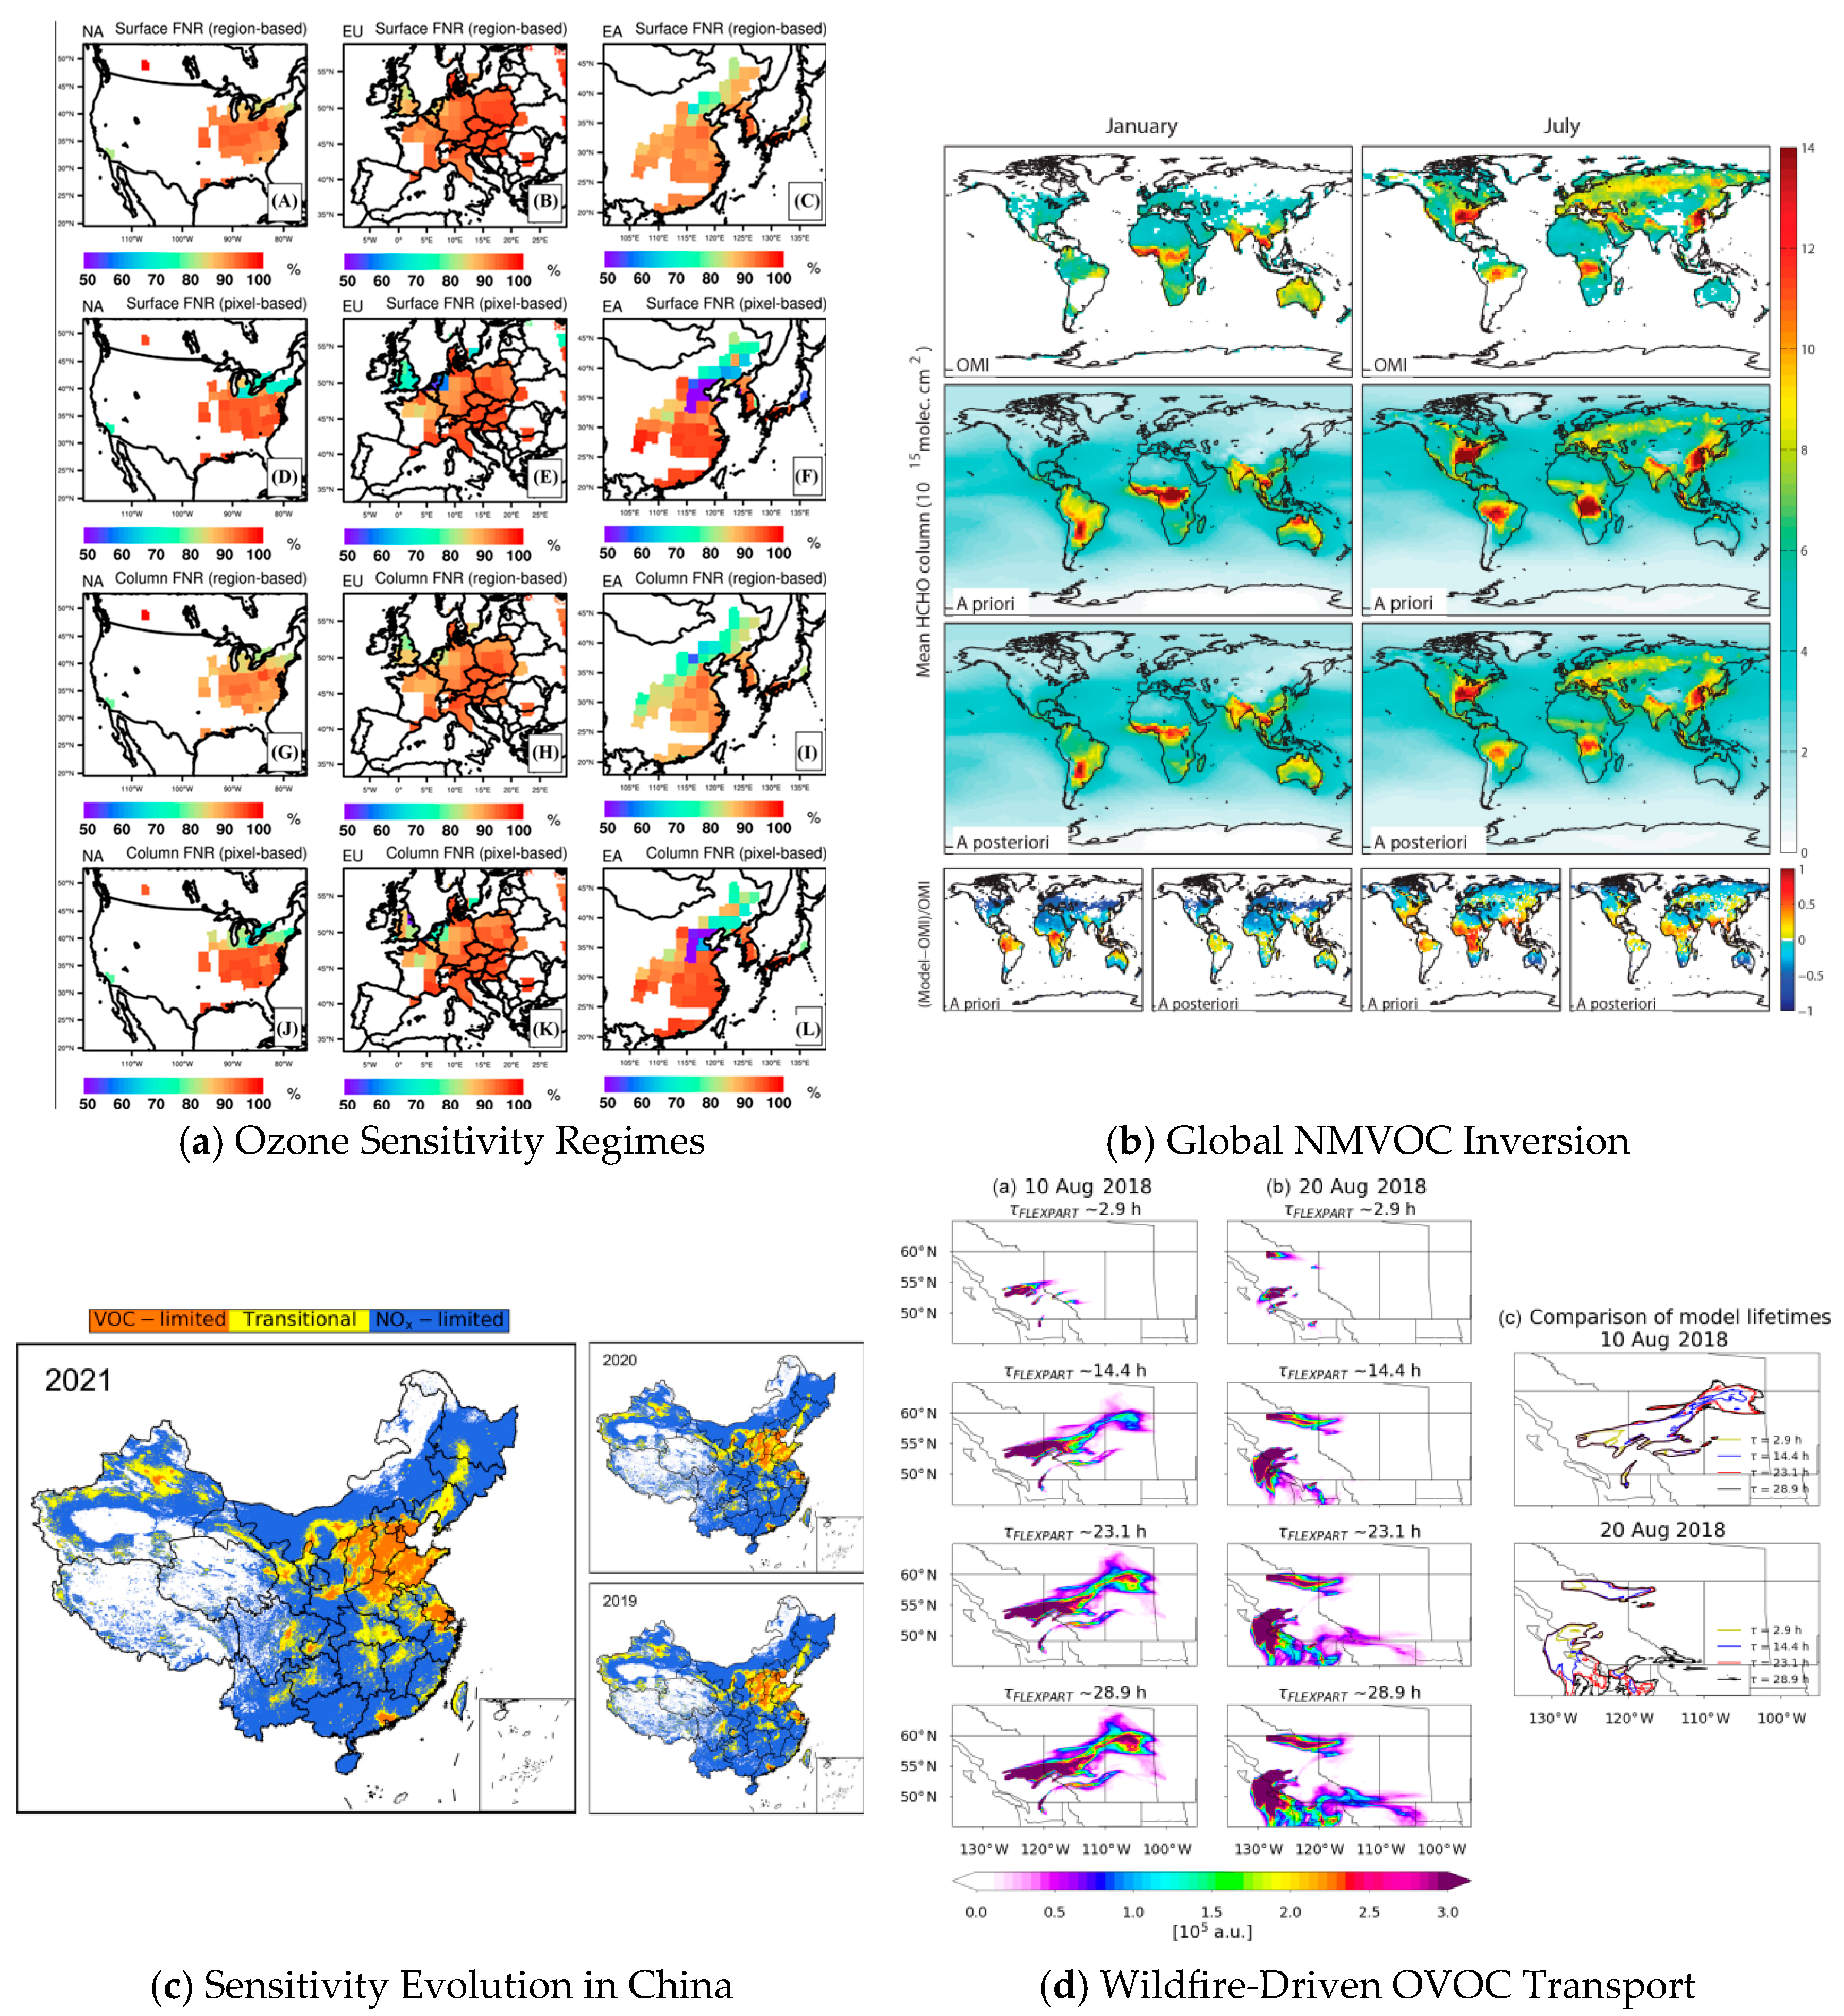
One of the most significant contributions of satellite-based observation lies in its diagnostic capacity. Jin et al. (2017) utilized long-term OMI retrievals to develop and evaluate the formaldehyde-to-NO2 ratio (FNR) as a satellite-derived proxy for surface ozone formation regimes [60]. Their study revealed that, with proper correction for vertical representativeness, satellite-derived FNR can closely mirror surface-level reactivity transitions and distinguish between VOC-limited and NOx-limited conditions across urban and regional domains [61]. Unlike isolated ground stations that provide point-based measurements, satellite data allowed for continental-scale regime mapping and seasonal trend analysis, uncovering early transitions toward NOx-limited chemistry in densely populated areas such as New York, London, and Seoul [62]. These findings underscore a unique attribute of satellites—not in resolving chemical intricacies, but in spatializing chemical dynamics into policy-relevant landscapes.
A second frontier emerges from the use of satellite retrievals to invert and constrain global VOC emissions. Bauwens et al. (2016) demonstrated how nine years of OMI-based HCHO column observations, when combined with adjoint modeling via IMAGESv2, could reconstruct global NMVOC fluxes with unprecedented granularity [63]. Their inversion revealed substantial overestimations in standard bottom-up inventories, especially across equatorial forests and biomass burning zones. By adjusting pixel-level emissions to match observed formaldehyde patterns, they not only corrected static inventory biases but also captured interannual variability linked to ENSO cycles and land-use change [64]. This application highlights a distinctive strength of satellite platforms: not merely recording environmental states, but recalibrating global understanding where ground truth is inaccessible or systematically flawed [65].
The diagnostic and reconstructive capabilities of satellite platforms converge most clearly in national-scale policy evaluation. Ren et al. (2022) employed decade-long datasets from OMI and TROPOMI to assess the evolving ozone–precursor sensitivity across China during a period of aggressive NOx reduction [66]. While surface monitoring networks recorded declining NO2 levels, satellite-derived HCHO/NO2 ratios revealed the persistence and even expansion of VOC-limited regimes in multiple urban clusters. These results challenged prevailing assumptions that NOx controls alone would suffice for ozone mitigation and demonstrated that, in the absence of coordinated VOC abatement, regime shifts may amplify rather than reduce surface ozone concentrations. Satellites, by enabling consistent nationwide diagnostics, revealed a deeper asymmetry between emission policy and atmospheric response—an insight inaccessible via local measurements alone.
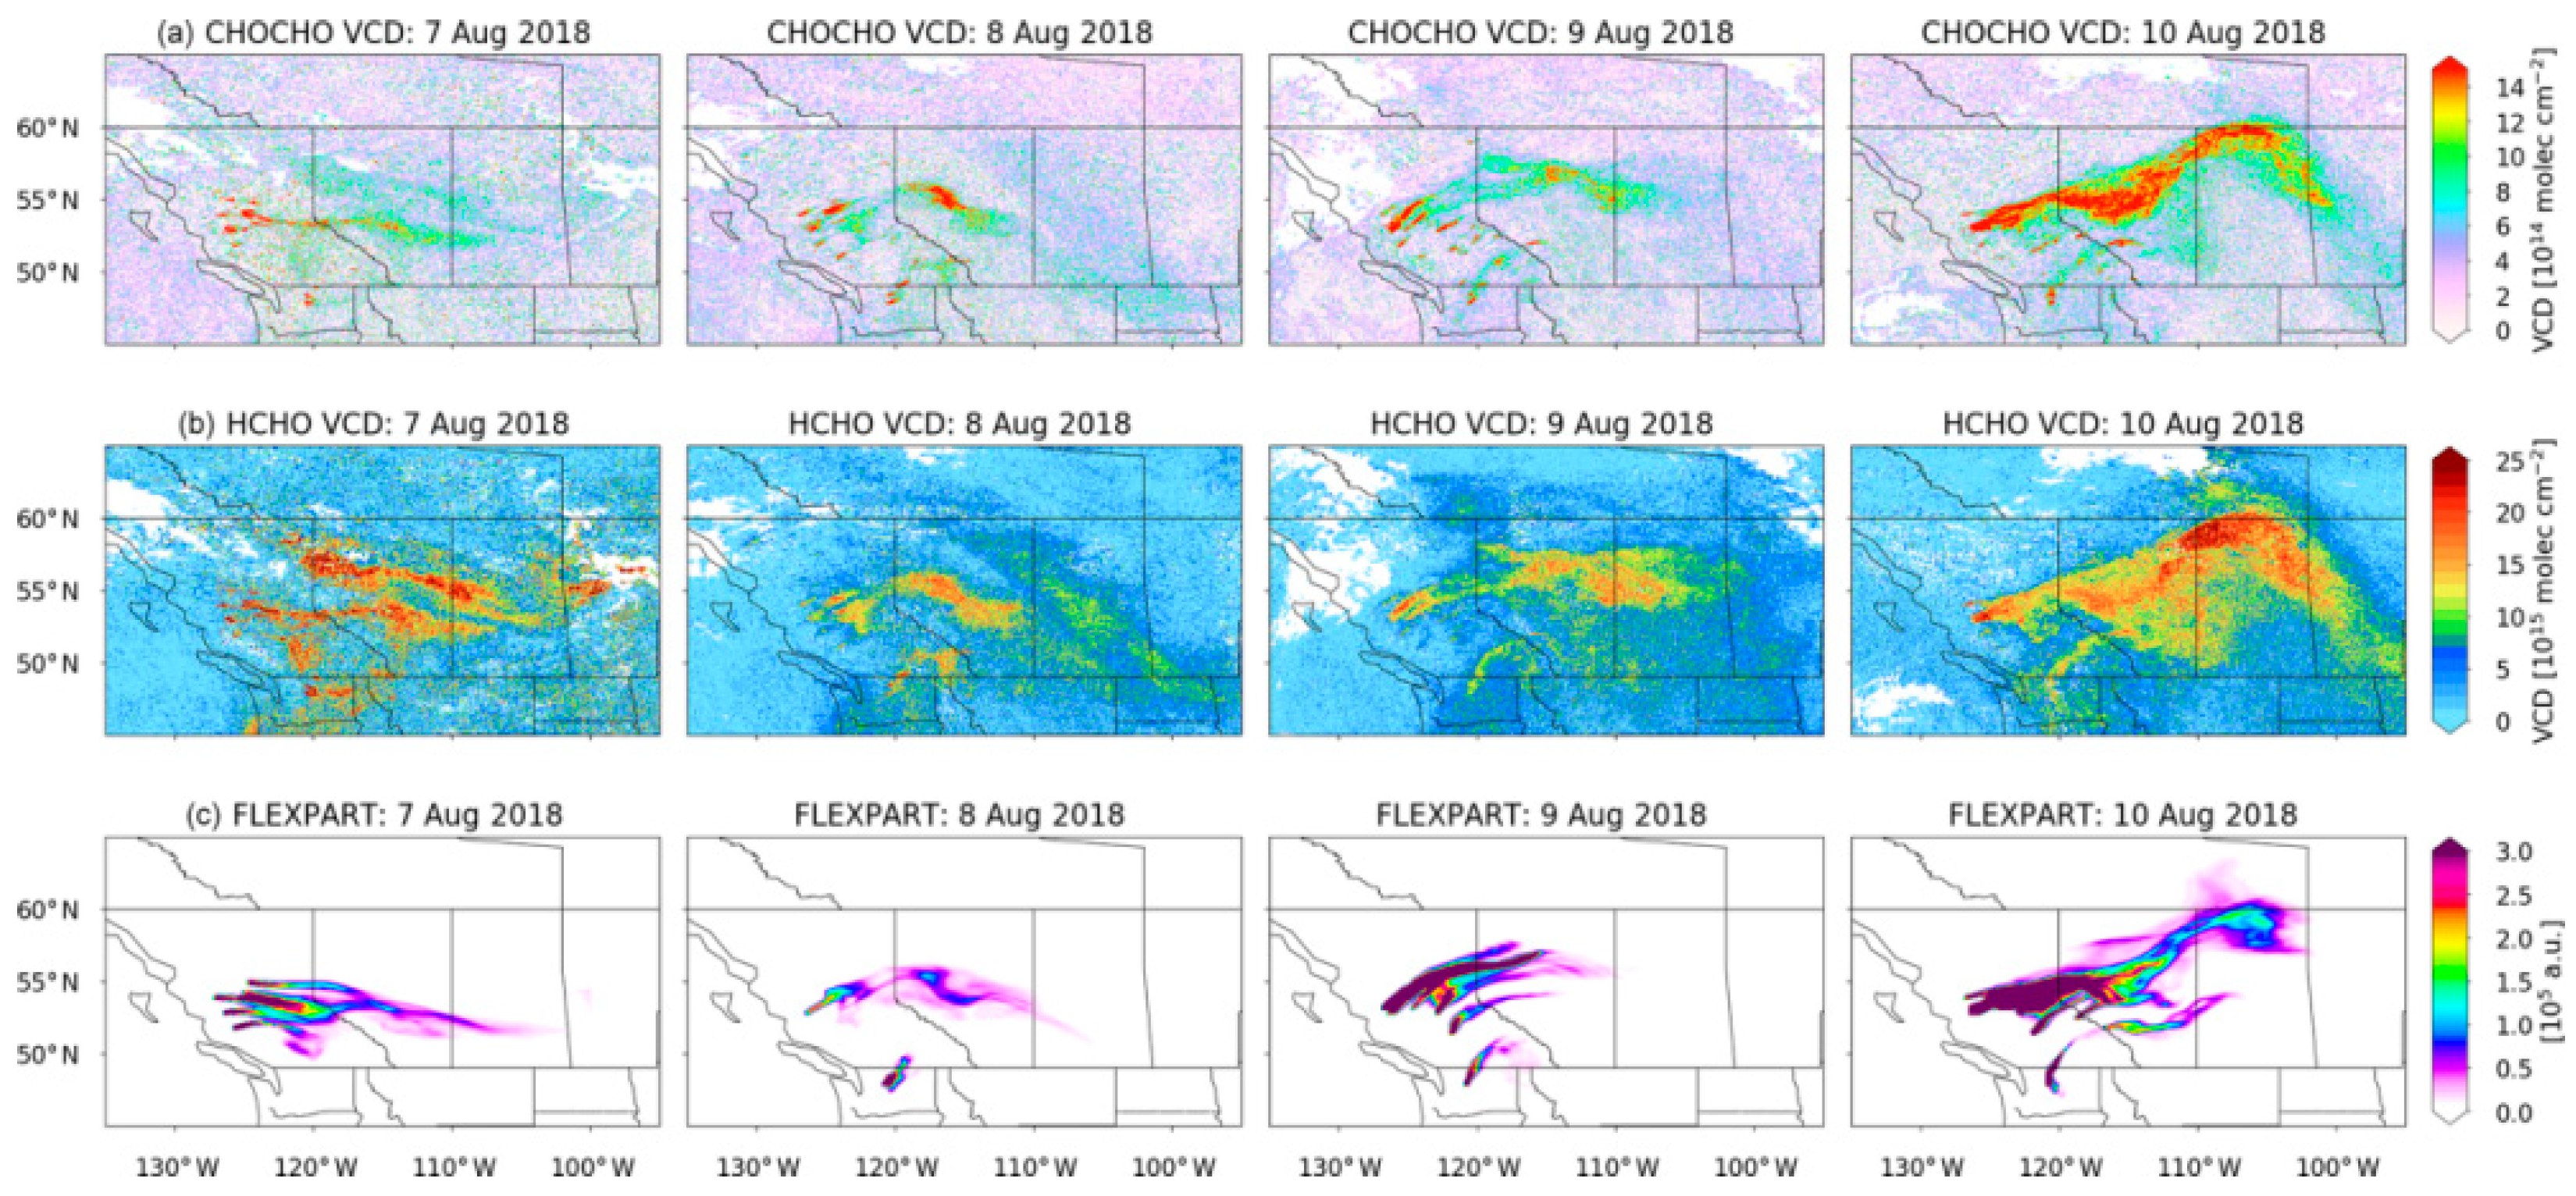
Beyond structured evaluation, satellite platforms also excel under conditions of environmental disruption. During the 2018 Canadian wildfires, Alvarado et al. (2020) leveraged Sentinel-5P TROPOMI data to monitor the long-range transport of glyoxal and formaldehyde, revealing coherent plumes that persisted over distances exceeding 1500 km [67]. Contrary to standard assumptions of short atmospheric lifetimes for oxygenated VOCs, dispersion modeling required extended decay constants to reproduce the spatial footprint observed by satellites. More importantly, the data suggested continuous in-plume production from precursor species—highlighting atmospheric recycling processes invisible to ground monitors and infeasible for aircraft to track in full spatial or temporal extent. In such extreme scenarios, satellites emerge not as complementary tools but as the sole observational mode capable of capturing both the chemistry and geography of large-scale perturbations [68].
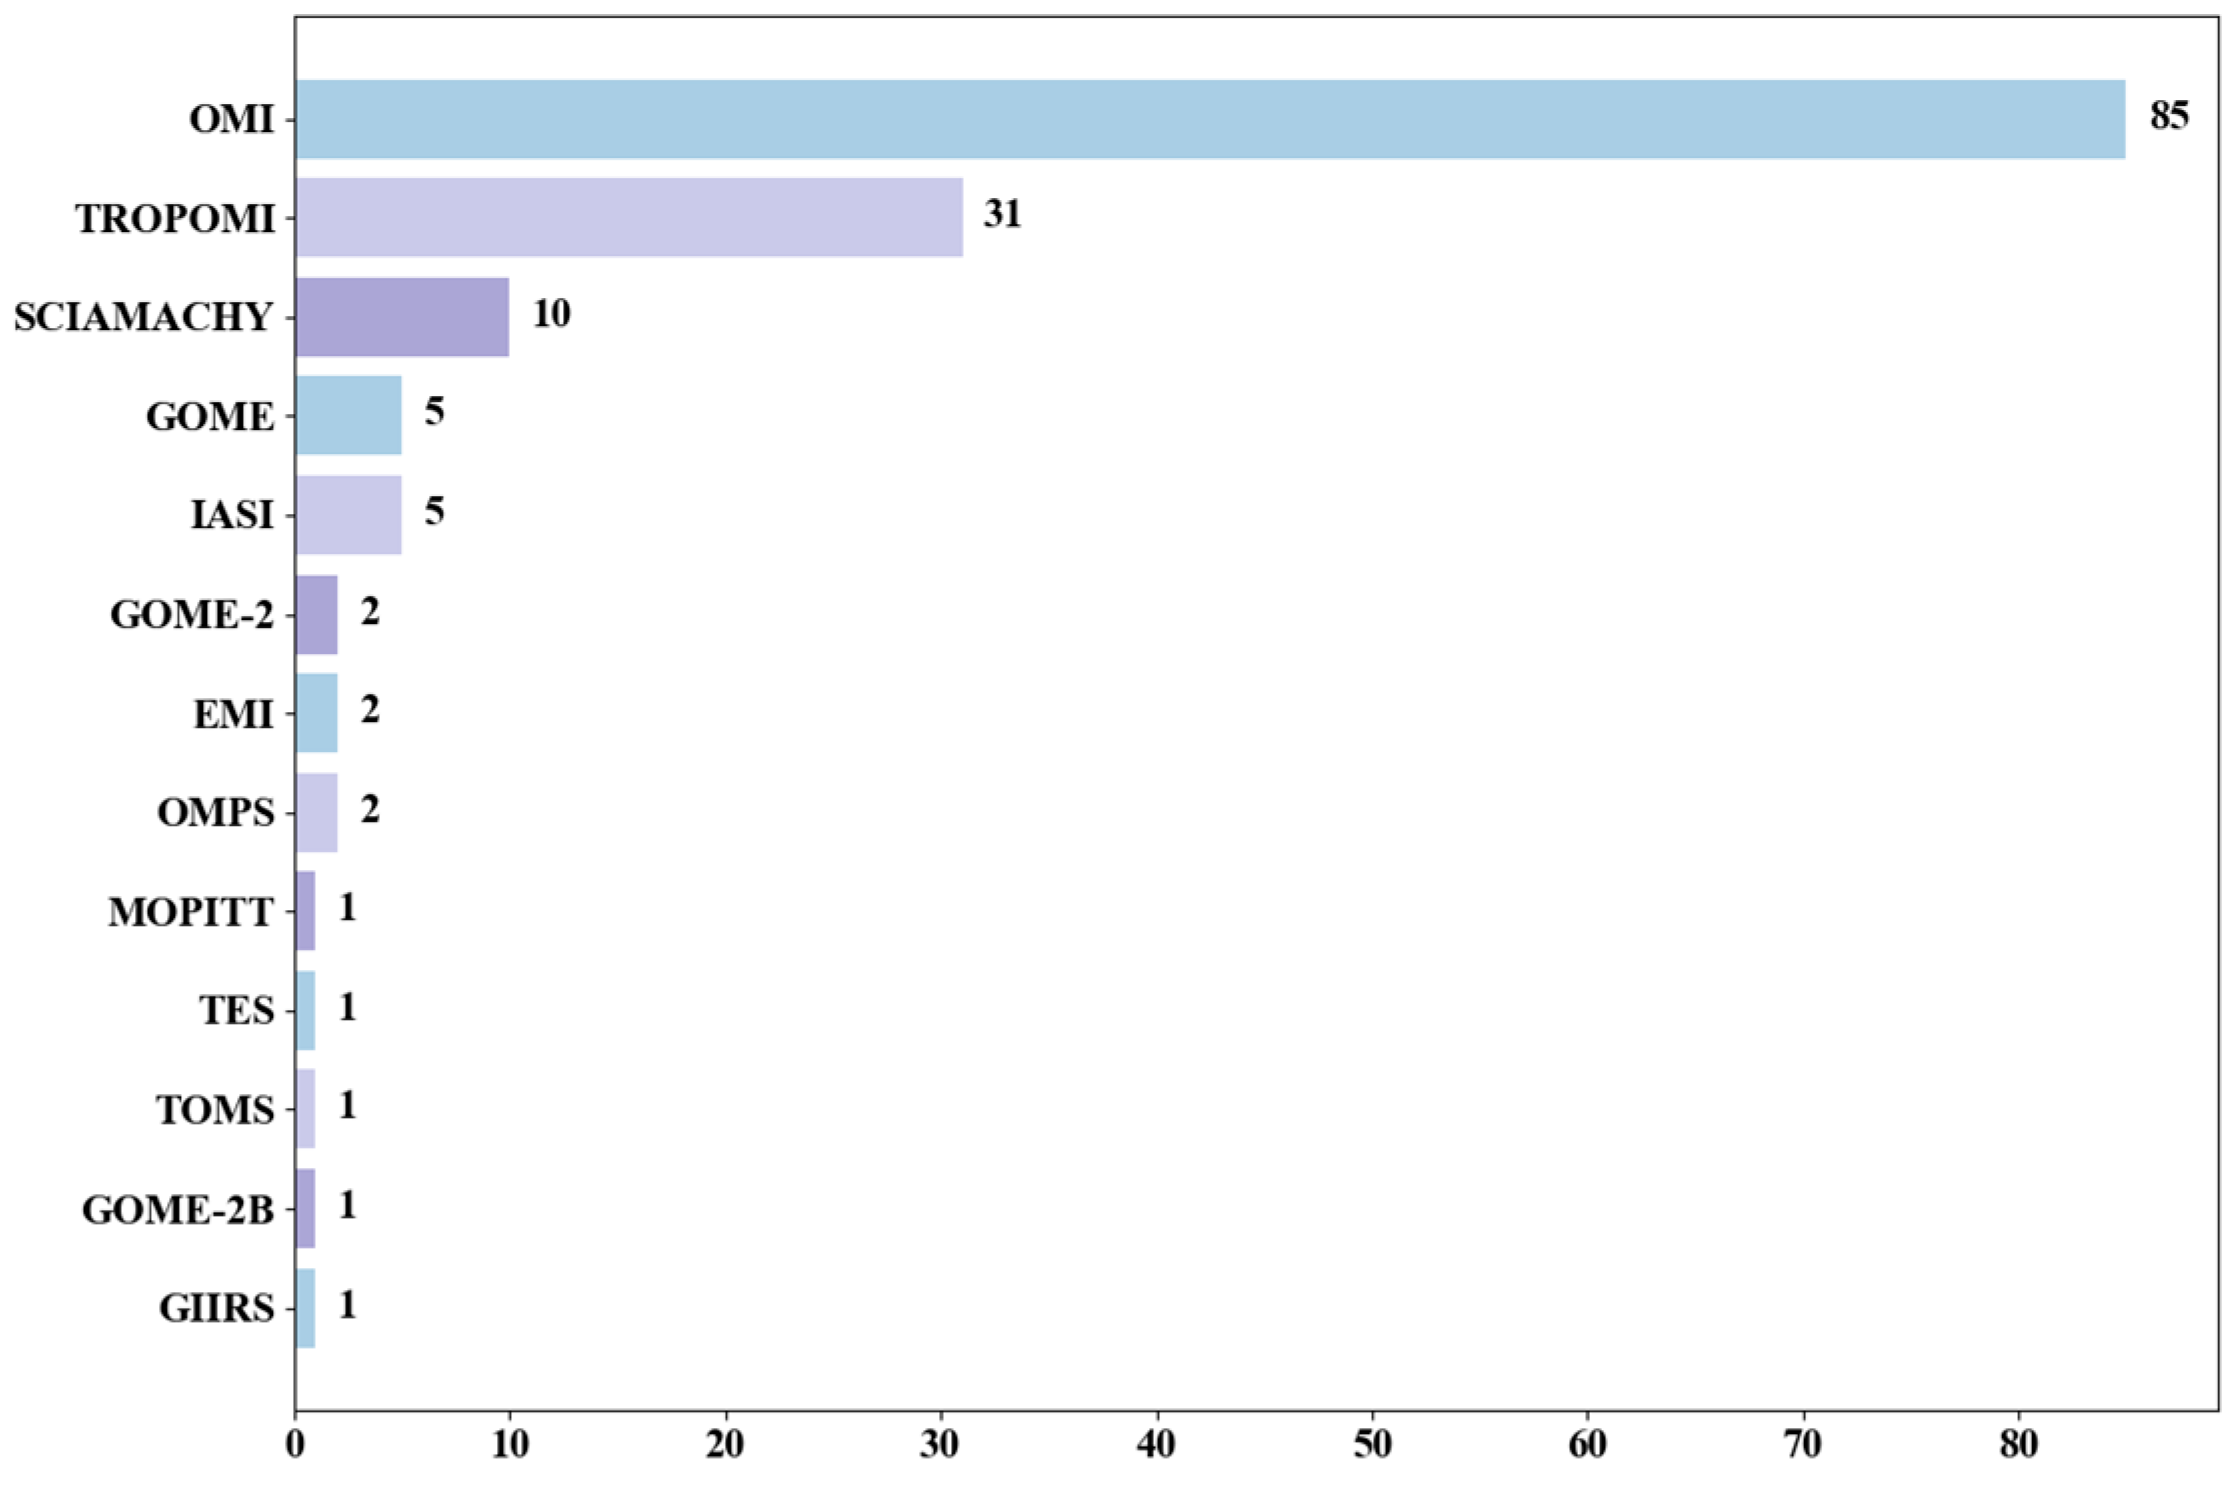
The cumulative evolution of satellite observation platforms is further evidenced in their deployment across VOC-focused literature. As shown in Figure 10, OMI remains the most widely utilized instrument, reflecting its long operational timeline and robust HCHO and NO2 retrievals. However, the rise of TROPOMI in recent years signals a methodological shift—toward higher spatial resolution, shorter revisit intervals, and enhanced multi-gas coverage [69]. Earlier missions such as SCIAMACHY and GOME laid foundational algorithms, while emerging platforms such as EMI and GIIRS reflect the increasing demand for finer spectral discrimination and greater regional targeting [70]. This instrumental evolution parallels the scientific shift from data collection to interpretation—satellites are no longer used solely to confirm chemical presence but to infer process, identify deviation, and quantify transformation.
Together, these advances recast satellite platforms not as replacements for terrestrial or aerial systems, but as structural complements that operate in the spaces between and beyond. They are not optimized for resolution or specificity, but for continuity and totality—for the ability to observe what no other system can see and to synthesize what no other configuration can measure. Their known limitations—cloud interference, vertical averaging, and species selectivity—are steadily mitigated by algorithmic refinement and synergistic fusion with ground and aircraft data. In the recursive architecture of VOC sensing, satellites serve as the closing and opening node: they provide the final spatial context within which all local observations must be interpreted and the first global frame from which atmospheric dynamics must be inferred.
As VOCs research transitions toward integrated environmental governance—spanning air quality, carbon policy, health exposure, and climate feedback—satellite-based observations will remain indispensable. Not only because they see the most, but because they allow others to see more clearly. This integrative role is further exemplified by recent representative studies (Figure 11), which demonstrate how satellite data enable regime diagnostics, emission inversion, sensitivity tracking, and cross-continental VOC transport modeling.

4. Technological Pathways for VOC Observation and Ozone Modeling

This section provides an integrated overview of the main technological approaches for diagnosing VOC–O3 interactions and modeling ozone formation. We outline a progression from semi-empirical sensitivity analysis to traditional observation-based and chemical transport models, followed by remote sensing inversions and emerging artificial intelligence frameworks. Each approach is presented with its theoretical foundation, methodological advances, and representative applications, highlighting how these models collectively inform both mechanistic understanding and regulatory strategies.

4.1. Nonlinear Mechanisms and Semi-Empirical Modeling of O3 Formation Sensitivity

Ozone (O3) formation is governed by highly nonlinear chemical reactions involving nitrogen oxides (NOx) and volatile organic compounds (VOCs). The sensitivity of O3 production to these precursors serves as a critical basis for air quality management strategies. Early empirical and modeling studies across major Chinese urban clusters such as Chengdu, the Pearl River Delta (PRD), and the Yangtze River Delta (YRD) have consistently revealed spatiotemporal shifts in O3 formation regimes. Notably, a diurnal transition between NOx-limited and VOC-limited conditions has been observed, especially under high-radiation or stagnation conditions [71]. This temporal dynamism has been confirmed in smog chamber experiments and box model simulations conducted in Beijing, Zibo, and Hefei, where radical ratios such as HO2/OH have emerged as more effective indicators than conventional photochemical markers such as P_H2O2/PHNO3 [72].
H O 2 O H   vs .   P H 2 O 2 P H N O 3
Beyond individual events, multi-year and multi-regional analyses—spanning the U.S., Hong Kong, and Shanghai—have illuminated a systematic shift in O3 sensitivity regimes as a response to prolonged NOx emission reductions. This evolution from VOC-limited to transition or NOx-limited regimes underlines the adaptive nature of the atmospheric chemical system. Landmark studies such as MOOSE and DISCOVER-AQ, as well as the “lockdown” scenario in Shanghai, further emphasize the dynamic feedback loop between policy interventions and chemical sensitivity landscapes. These insights have prompted the emergence of flexible control strategies centered on real-time precursor sensitivity rather than static reduction ratios.
To address the growing complexity in regime identification, researchers have advanced a range of modeling tools. Response Surface Models (RSMs) and enhanced polynomial variants such as Epf-RSM allow for efficient prediction of O3 concentrations in high-dimensional nonlinear response fields. Such models help avoid overfitting near transition boundaries and are now widely applied in regions such as the PRD [73,74,75].
y O 3 = β 1 x 1 + β 2 x 2 + + γ 1 x 1 2 + γ 2 x 2 2 + + δ 12 x 1 x 2 + δ 13 x 1 x 3 +
Modified CMAQ-DDM and OSAT modules have also introduced dynamic threshold-based indicators, improving interpretability in mixed or transitional regimes. In parallel, observable proxies such as HCHO/NO2 and H2O2/NO2—now routinely retrievable via OMI, SCIAMACHY, and Sentinel-5P—have become standard metrics for regime classification on regional to continental scales.
H C H O N O 2   or   H 2 O 2 N O 2
More recently, hybrid methods integrating RSMs with differential modeling (RSM-DM) or adopting machine learning tools such as random forests with VOC reactivity groupings have begun to bridge the gap between model accuracy and operational utility. These techniques enable both interpretability and speed in sensitivity diagnosis and have demonstrated promising performance in multi-city deployments.
Geographically, the sensitivity regime of O3 formation varies significantly across China’s urban and peri-urban areas. VOC-limited conditions dominate high-density eastern metropolises, whereas NOx-limited regimes prevail in central-western cities and coastal forests—an observation supported by both ground-based and satellite-derived NOx/VOC and HCHO/NO2 ratios. These spatial disparities are compounded by influences from biogenic VOCs, biomass burning, and meteorological transport, producing mosaic-like sensitivity landscapes even within a single metropolitan region.
V O C - limited :   H C H O N O 2 < 2
N O x - limited :   H C H O N O 2 > 4
Intra-city comparisons, such as Pudong vs. Jinshan in Shanghai or EP1 vs. EP2 in Beijing, further validate the need for fine-resolution classification systems capable of capturing microscale transitions [76]. These findings support the development of hierarchical diagnostic frameworks that can accommodate city-, district-, and neighborhood-level heterogeneity.
From a policy perspective, scenario-based simulations have proven instrumental in evaluating the implications of different NOx/VOC reduction ratios. Studies confirm that in VOC-limited or transitional regimes, NOx-only reduction can paradoxically exacerbate O3 pollution. Instead, targeting high-reactivity VOC species—such as alkenes and aromatics—yields more consistent benefits. In contrast, NOx-limited settings respond favorably to NOx mitigation alone. Industrialized urban regions such as Zibo and the Chengdu-Chongqing corridor demand tailored phase-wise strategies, with some studies recommending VOC:NOx control ratios of 3:1 or 2.4:1 to avoid sensitivity inversion.
High-temperature scenarios introduce another layer of complexity, often triggering a switch in regime type that undermines previously effective strategies. For instance, in Shanghai, heatwaves have been shown to shift sensitivity from VOC- to NOx-limited states. Emission sector attribution analyses further reveal that mobile sources and solvent-based industries dominate VOC emissions, although the latter alone cannot mitigate O3 peaks due to their limited spatial correlation with observed maxima. Recent modeling efforts also stress the need to correct for photochemically depleted VOCs, which, if ignored, may lead to systemic underestimation of NOx sensitivity and flawed policy guidance.
VOCeff = VOCobs + Δphotochem
Collectively, these insights mark a shift in paradigm: from rule-based interventions to chemically informed, region-specific, and temporally adaptive strategies for O3 management.

4.2. Traditional Modeling Paradigms: From Observation-Based Inference to Chemical Transport Simulation

Traditional modeling frameworks have long underpinned the scientific understanding of ozone (O3) formation, serving as essential tools for deciphering precursor contributions and informing air quality control strategies. Among these, Observation-Based Models (OBMs) and Chemical Transport Models (CTMs) represent two complementary approaches: the former emphasizes in situ photochemical diagnosis, while the latter integrates emissions, chemistry, and meteorology to simulate regional O3 dynamics. Over the past two decades, these models have advanced in structural integration, regional adaptability, and nonlinear sensitivity diagnosis [77,78].
CTMs provide a comprehensive, mechanistically grounded platform to simulate ozone formation and assess its response to precursors across spatial and temporal scales [79]. They typically couple chemical reaction mechanisms (e.g., SAPRC, CB05, and MCM), gridded emissions inventories (e.g., MEIC, NEI, and EDGAR), and meteorological drivers (e.g., WRF) to simulate pollutant production, transport, and deposition. Notable CTMs include GEOS-Chem, WRF-Chem, CMAQ, MATCH-MPIC, and TOMCAT. For instance, GEOS-Chem sensitivity analyses conducted during the ARCTAS campaign identified the aerosol uptake of HO2 radicals as a dominant uncertainty in Arctic ozone formation, with marked seasonal divergence in precursor response patterns [80]. Over the Tibetan Plateau, CTM simulations revealed systematic underestimations of O3 levels due to inadequate representation of NOx and OVOCs, particularly under background atmospheric conditions [81,82,83]. Additionally, grid resolution has emerged as a critical factor: model experiments showed that coarse grids (e.g., >120 km) tend to smooth NOx gradients, leading to substantial overestimations of tropospheric O3, particularly in complex emission settings [84,85].
In parallel, OBMs have been extensively used for site-level photochemical diagnosis, offering high temporal resolution insights into O3 formation regimes. These models typically ingest real-time concentrations of VOCs, NOx, O3, and radical intermediates into simplified chemical mechanisms (often derived from MCM or SAPRC) to estimate ozone production rates and identify sensitivity transitions. In coastal and urban settings such as Hong Kong and southeastern China, OBM-based trajectory and radical analyses have pinpointed dominant oxidation pathways and the role of specific precursors (e.g., HONO and CO) in driving local ozone peaks [6,86]. In Beijing, OBM simulations during autumn haze events revealed differing radical cycling mechanisms across compound pollution regimes, while studies across the Yangtze River Delta have documented dynamic transitions from VOC-limited to NOx-limited regimes as pollution episodes evolve [87].
Notably, hybrid OBM–CTM frameworks are gaining traction, particularly in regions with complex emission topographies. For example, integrated studies in Tongling, Jinan, and Wuhan have demonstrated that OBM can provide real-time diagnostics while CTM facilitates attribution and forecasting, together revealing acute sensitivities to reactive VOC species and nonlinear O3-precursor relationships. These synergies enable more reliable source apportionment and help inform spatiotemporally targeted emission control strategies [78,88].
Emerging innovations also aim to overcome the limitations of traditional modeling. Recent applications of deep learning algorithms have shown the ability to emulate CTM output while drastically reducing computational costs and improving representation of nonlinear atmospheric chemistry [78]. Meanwhile, comparative studies in cities such as Shanghai have attributed discrepancies between OBM and emission-based models (EBMs) to inconsistent assumptions about carbonyl compound speciation, NO2 accuracy, and spatial averaging effects, underlining the importance of input harmonization [89].
These developments underscore the unique strengths and persistent challenges of both modeling paradigms. OBMs excel at regime classification and local photochemical insight, while CTMs offer system-level simulations across policy-relevant scales. As shown in Table 4, high-impact studies leveraging these models have shaped current understanding of ozone production, regional transport, and precursor sensitivity. Their integration represents a critical pathway toward improved model realism and decision-making relevance, especially under the dual pressures of climate change and urban air quality degradation.

4.3. Remote Sensing-Based Inversion of Precursors and Modeling of Ozone Formation Mechanisms

The integration of satellite remote sensing with chemical transport modeling has revolutionized the diagnosis of ozone (O3) formation regimes, allowing a transition from station-bound empirical methods to spatially continuous, mechanism-driven analyses. Among the key breakthroughs is the utilization of tropospheric column densities of formaldehyde (HCHO) and nitrogen dioxide (NO2), which serve as proxies for volatile organic compounds (VOCs) and nitrogen oxides (NOx), respectively. Their ratio, ΣHCHO/ΣNO2—commonly referred to as the formaldehyde-to-NO2 ratio (FNR)—has become a satellite-accessible metric for delineating ozone formation sensitivity across VOC-limited, NOx-limited, and transitional regimes.
Initial efforts employed static FNR thresholds, often derived from model-based benchmarks over North America. However, the expansion of satellite platforms such as OMI, TROPOMI, and GOME-2, alongside the rise of data assimilation techniques, has enabled more nuanced applications. In particular, chemical transport models (CTMs) such as GEOS-Chem and CMAQ have been coupled with satellite-derived FNR data through adjoint sensitivity analysis and four-dimensional variational (4D-Var) inversion, supporting the dynamic reconstruction of precursor emissions and chemical response fields. Furthermore, the emergence of source-resolved indicators such as the glyoxal-to-formaldehyde ratio (RGF) and sector-tagged ozone formation potential (OFP) has enriched the attribution of ozone regimes to specific anthropogenic or biogenic sources [95]. These methodological advancements collectively support a shift toward emission-resolved, vertically stratified, and policy-relevant ozone regime assessment frameworks.
Three representative studies exemplify this methodological evolution from different perspectives:
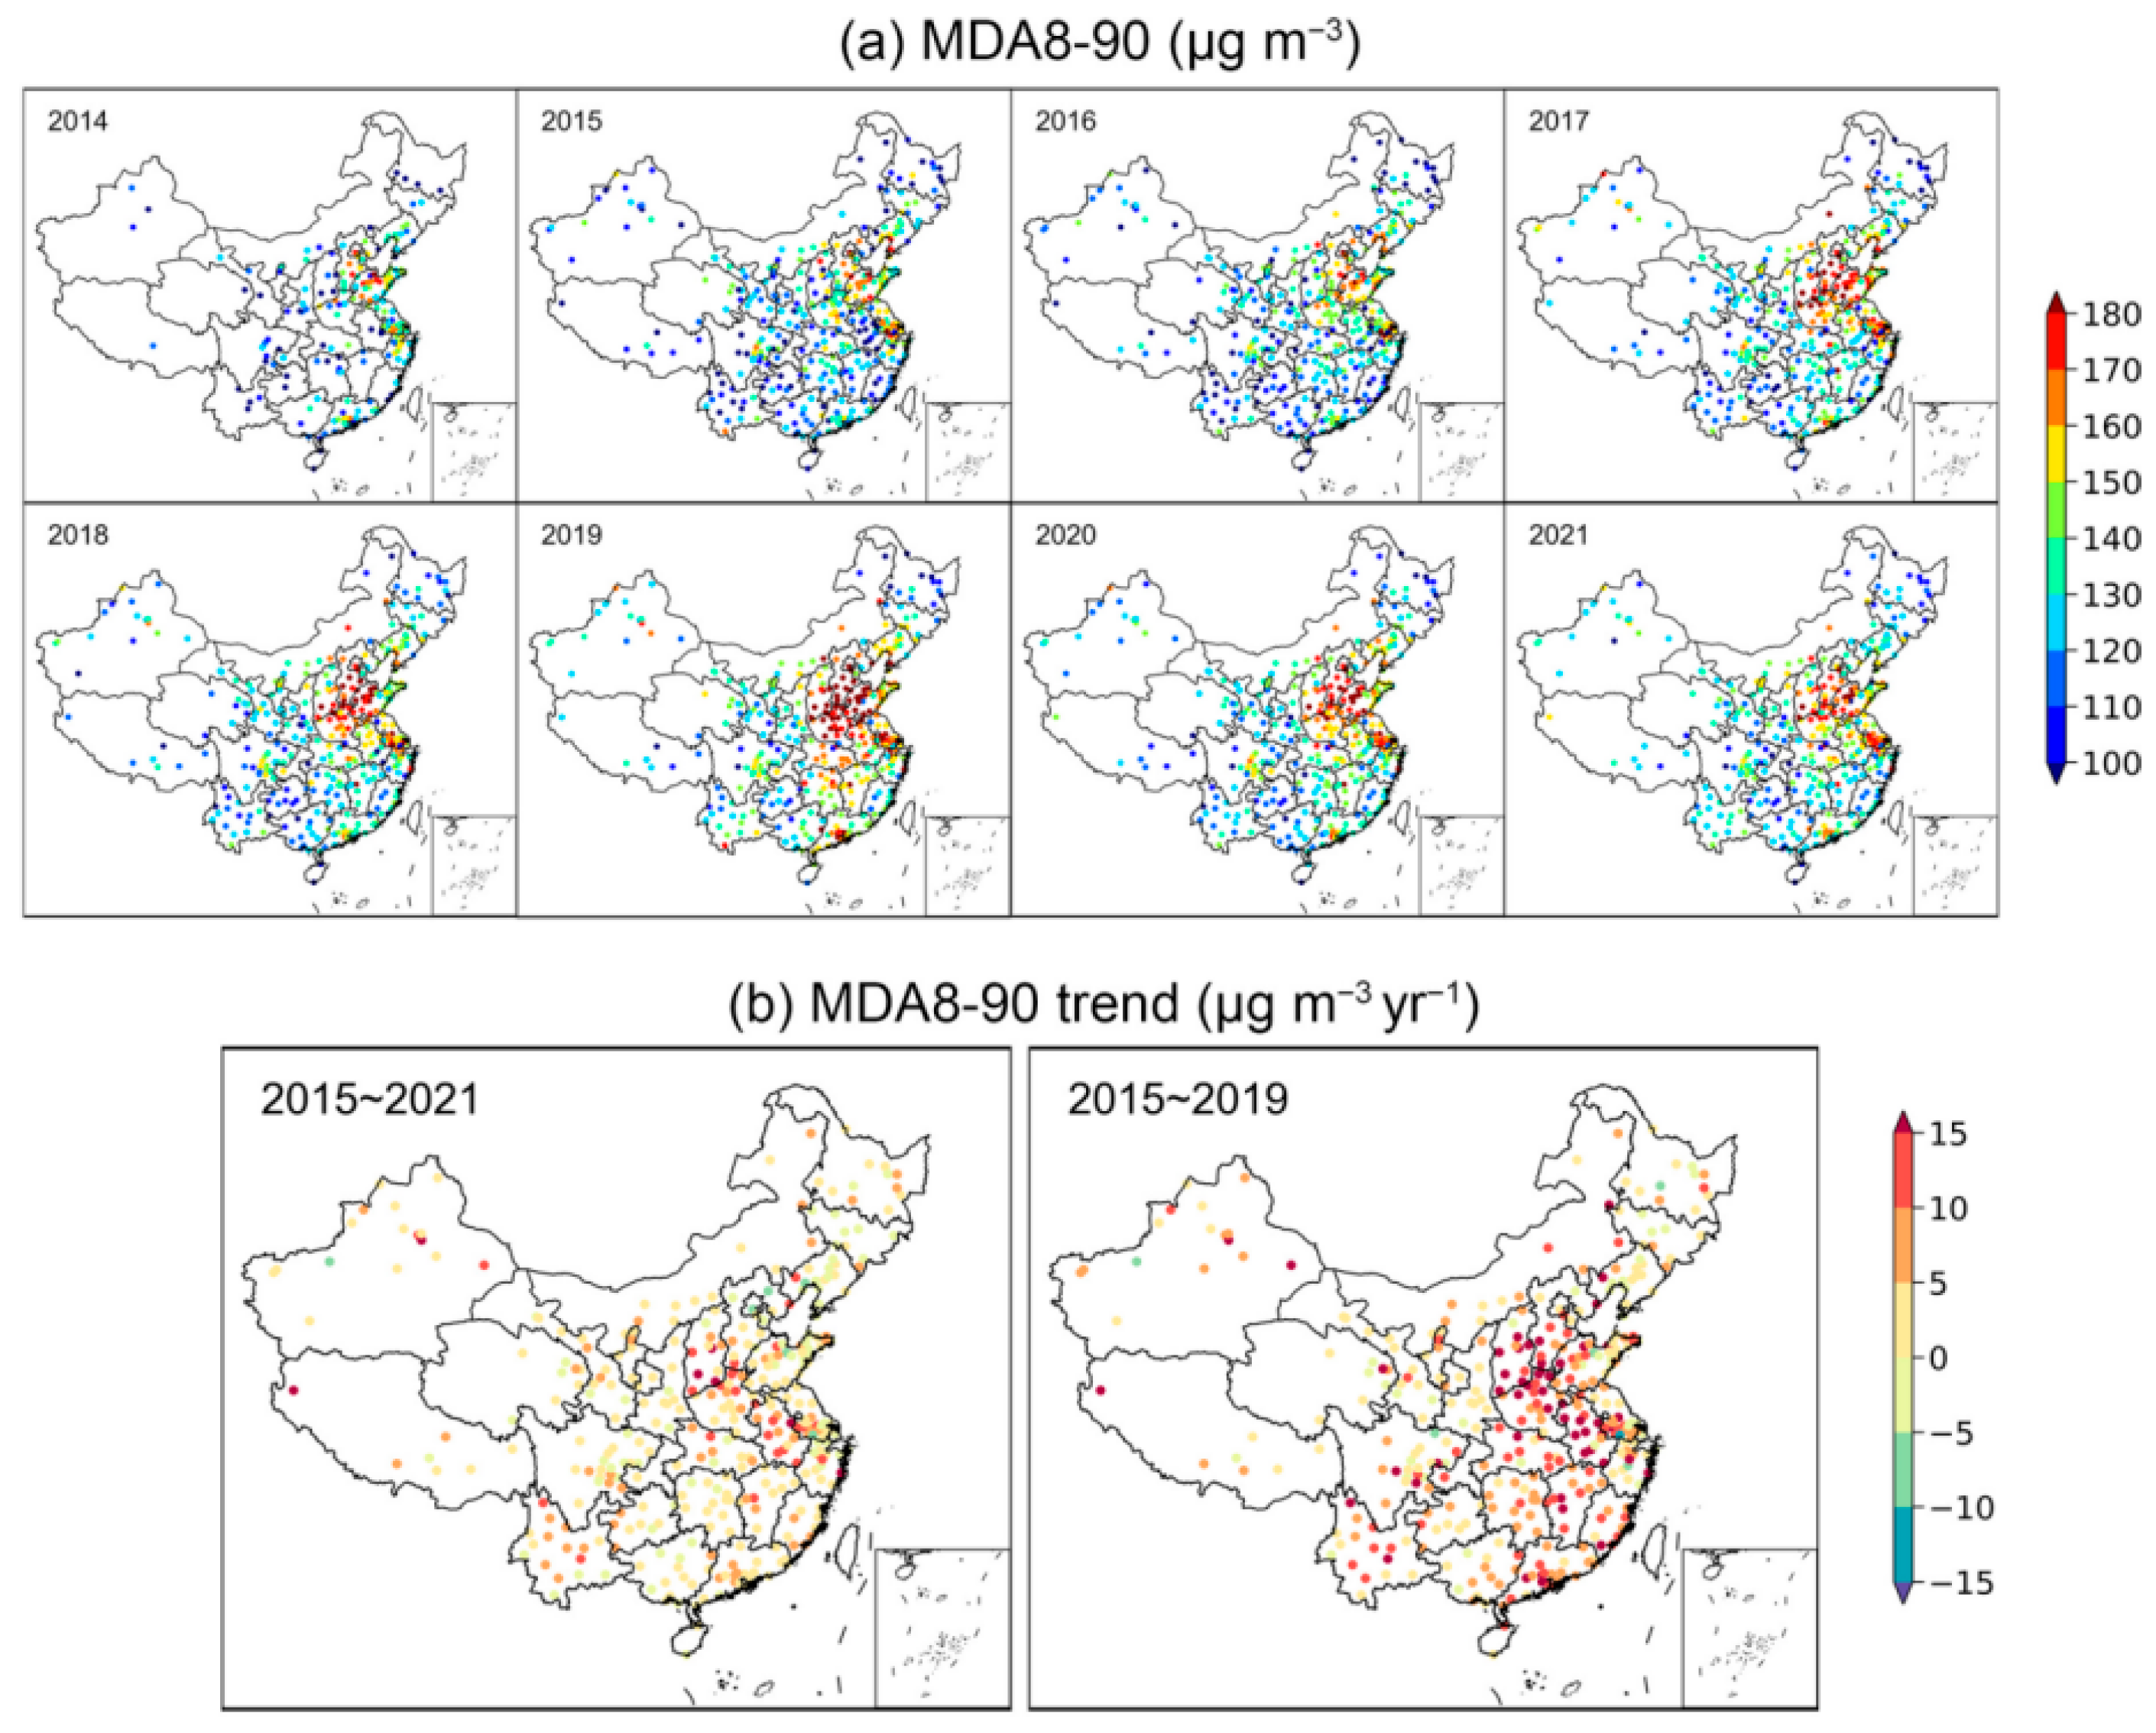
In a national-scale study of China’s ozone trends from 2013 to 2021, Ren et al. systematically derived region-specific FNR thresholds using high-resolution TROPOMI observations, validated against surface O3 measurements across over 1400 monitoring sites. Their results revealed a spatially heterogeneous distribution of O3 sensitivity: megacity clusters such as the North China Plain, Yangtze River Delta, and Chengdu–Chongqing Basin remained VOC-limited, while rural and western regions were predominantly NOx-limited. More importantly, they linked the failure to suppress VOC emissions to sustained or worsening ozone levels, despite notable NOx reductions under the Clean Air Action Plan. By quantitatively estimating the VOC/NOx reduction ratio required for effective ozone control in key cities, this work exemplifies the use of remote sensing to directly inform emission policy adjustment. These spatial patterns and multi-year dynamics are illustrated in Figure 12, which depicts the temporal evolution of high-percentile MDA8 ozone concentrations across major Chinese regions from 2014 to 2021.
Focusing on the 2018 Canadian wildfires, Alvarado et al. employed TROPOMI retrievals of HCHO and glyoxal (CHOCHO) to investigate the long-range transport and source identity of ozone precursors [96]. By coupling FLEXPART dispersion modeling with spectral decomposition, they inferred that CHOCHO and HCHO observed over distances exceeding 1500 km were not only primary fire emissions but also products of continuous oxidation of long-lived VOC precursors. The glyoxal-to-formaldehyde ratio (RGF) was utilized to distinguish pyrogenic sources from biogenic backgrounds. This approach expanded the diagnostic resolution of remote sensing from emission regime mapping to source differentiation and chemical aging in dynamic plumes. These spatiochemical insights are visually captured in Figure 13, which illustrates the co-distribution of CHOCHO, HCHO, and FLEXPART-modeled tracers across the wildfire-affected domain.
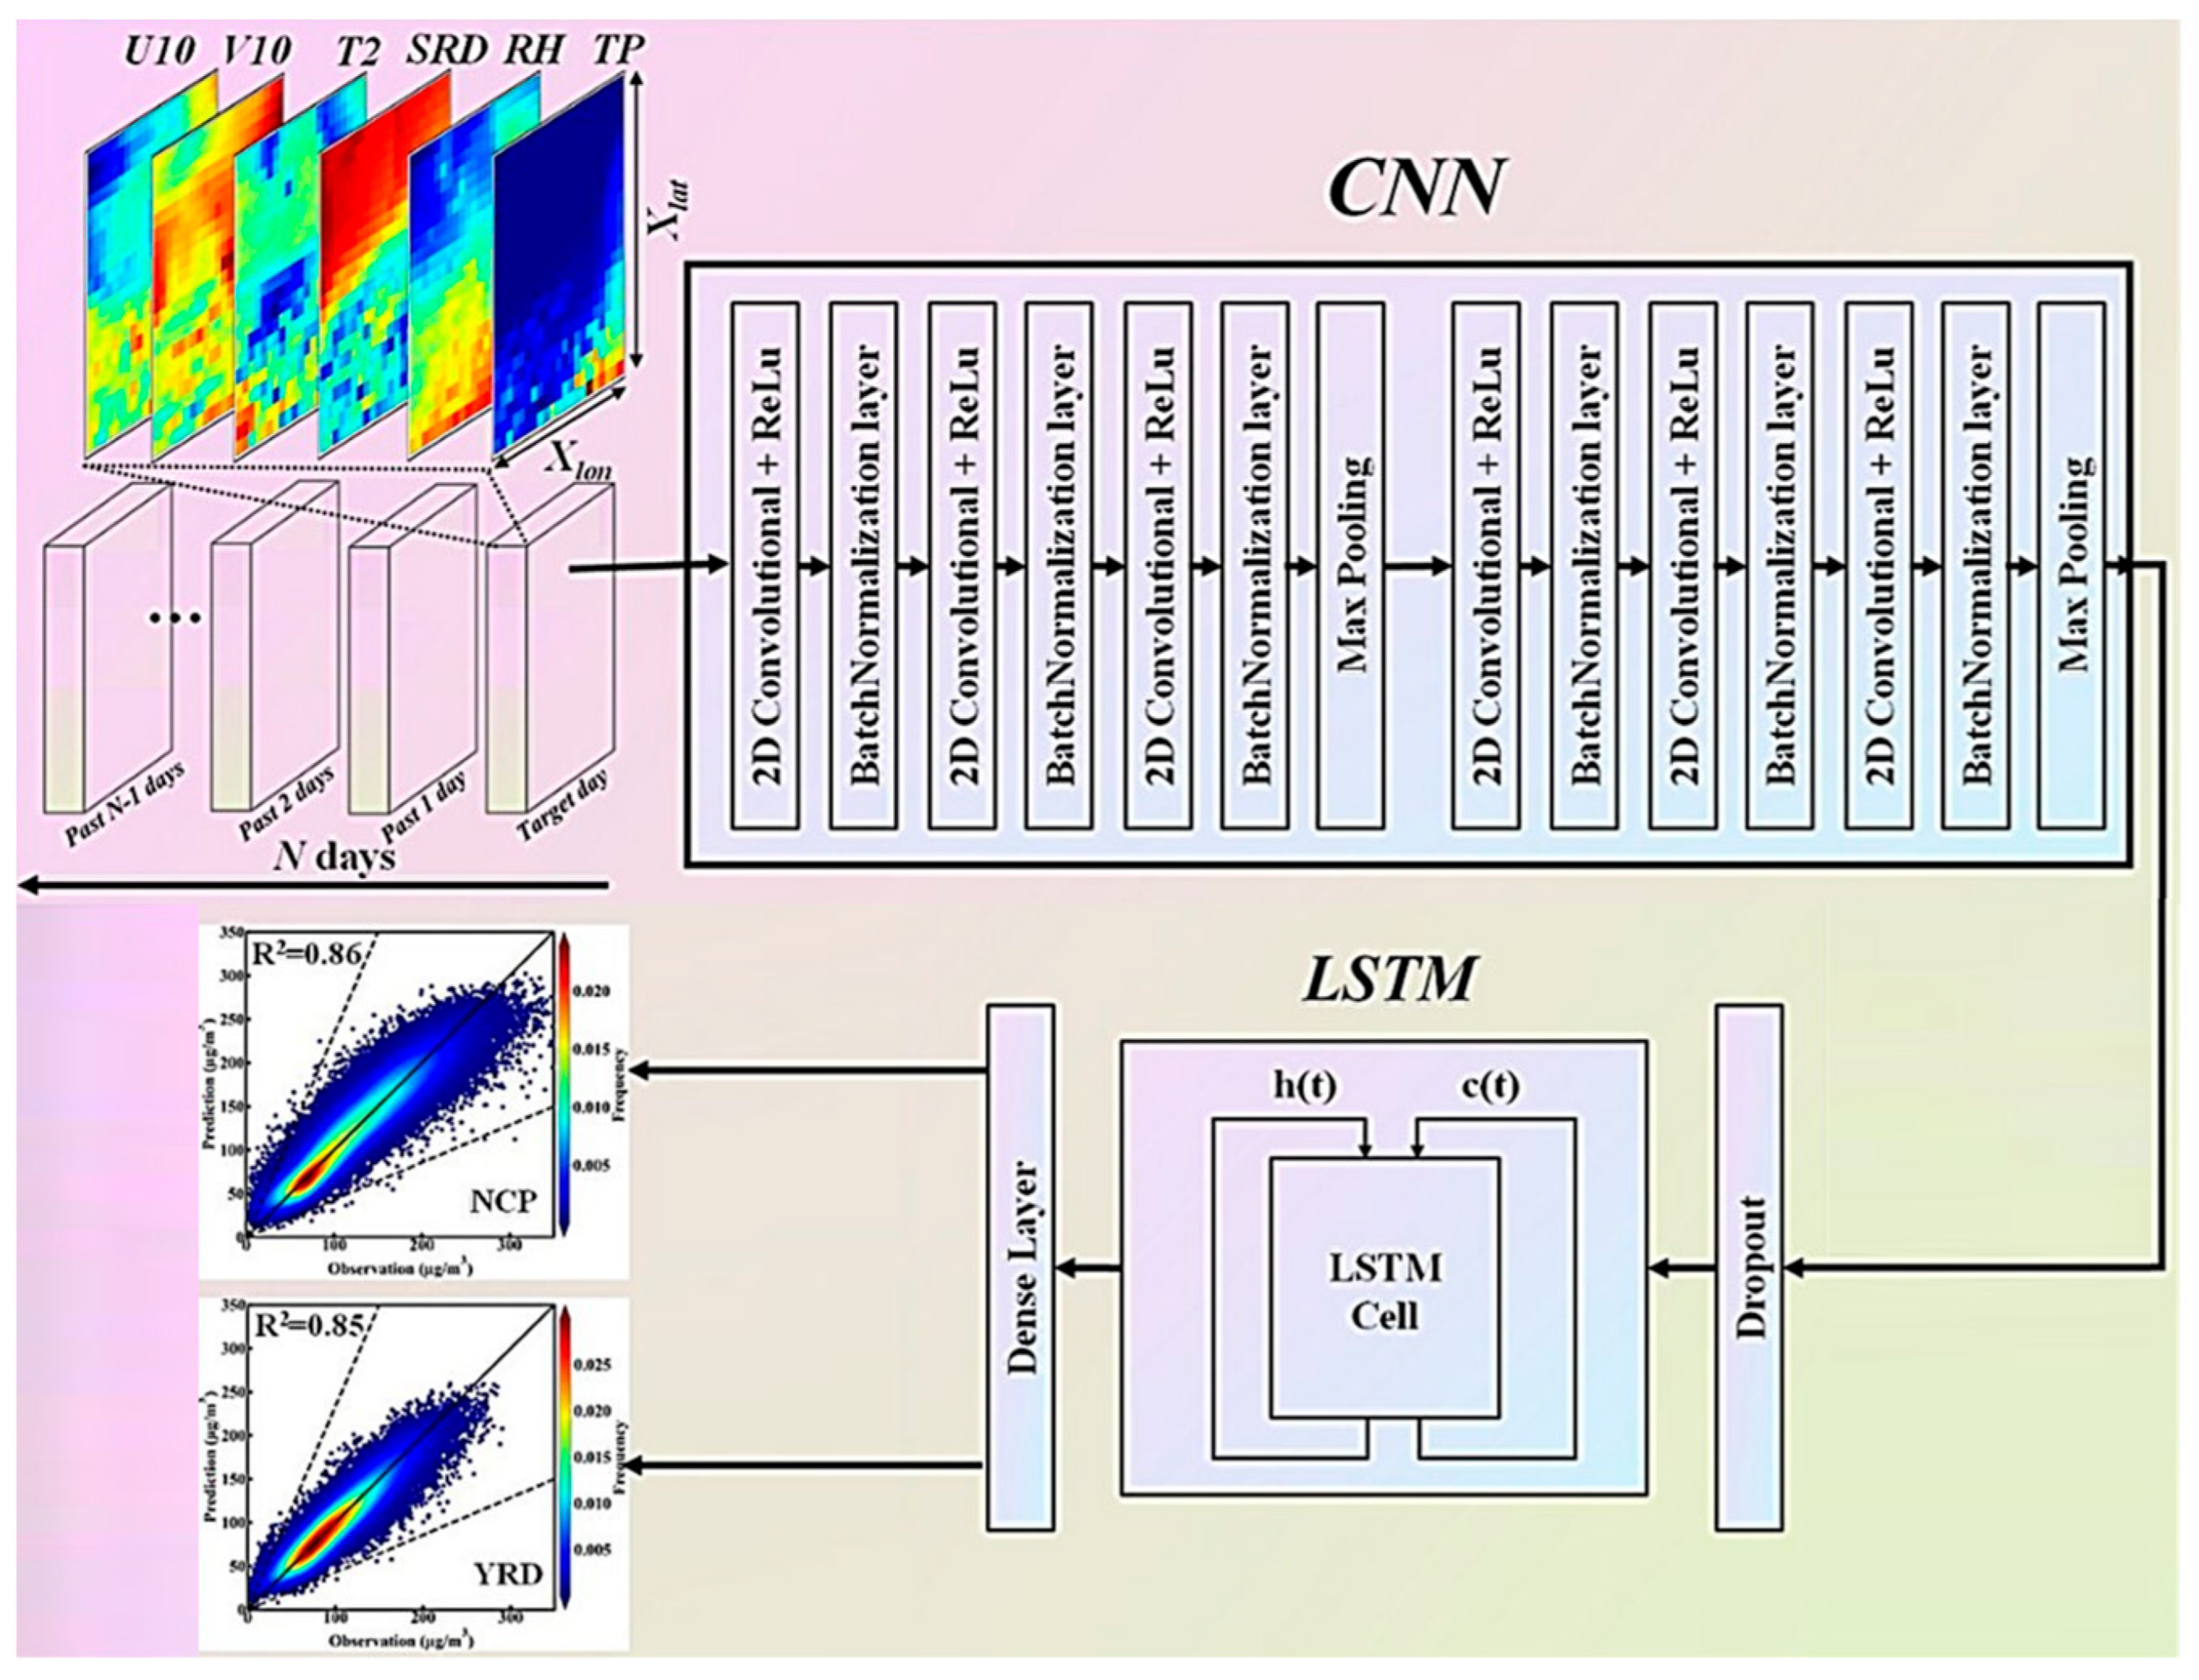
Coupling meteorological process dynamics with O3 prediction using STRMF-informed deep learning [97]. While not a conventional inversion model, Hu et al. demonstrated how meteorological forcing could be integrated into data-driven ozone prediction by using CNN-LSTM architectures informed by the spatiotemporal evolution of key variables such as temperature, humidity, solar radiation, and wind vectors. By encoding regional meteorological fields as “weather videos,” their model accurately predicted daily MDA8 ozone concentrations in the North China Plain and Yangtze River Delta, with over 85% explained variance. Although primarily a machine learning study, it reinforces the necessity of accounting for meteorology-induced variability when interpreting satellite-inferred ozone sensitivity and hints at future possibilities for hybrid physical-AI modeling paradigms. The underlying architecture of this STRMF-informed CNN–LSTM framework is shown in Figure 14, highlighting the sequential encoding of meteorological drivers into spatiotemporal ozone prediction.
Collectively, these studies demonstrate a convergence toward integrated remote sensing frameworks where vertical sensitivity analysis, emission tagging, and dynamic meteorological coupling enable refined diagnostics of ozone production. As satellite sensors continue to evolve in resolution and spectral fidelity, these methodological innovations offer a robust basis for predictive, regionally tailored, and source-resolved ozone control strategies.

4.4. Artificial Intelligence for Ozone Modeling: From Data-Driven Generalization to Mechanistic Inference

Over the past decade, artificial intelligence (AI)—especially deep learning (DL)—has profoundly reshaped the landscape of surface ozone (O3) modeling. Traditionally dominated by chemical transport models (CTMs) and satellite-driven statistical inversion techniques, the field has long grappled with computational inefficiencies, limited spatial resolution, and insufficient adaptability to complex, nonlinear atmospheric interactions. In contrast, AI-based approaches now offer a scalable and flexible alternative, capable of capturing intricate spatiotemporal dynamics, integrating heterogeneous data sources, and even quantifying uncertainty in policy-relevant scenarios.
At the core of this paradigm shift lies the ability of AI models to absorb multisource inputs—including satellite radiance, meteorological reanalysis, emission inventories, and land surface characteristics—and learn nonlinear mappings across space and time. Foundational architectures such as convolutional neural networks (CNNs), long short-term memory (LSTM) networks, and graph convolutional networks (GCNs) have laid the groundwork for more sophisticated hybrid models that integrate attention mechanisms, autoregressive dynamics, and probabilistic inference [98,99]. This trajectory has moved the field from mere data fitting toward mechanistic approximation and decision-support system development.
(1) From Single-Pollutant Estimation to Joint Inference
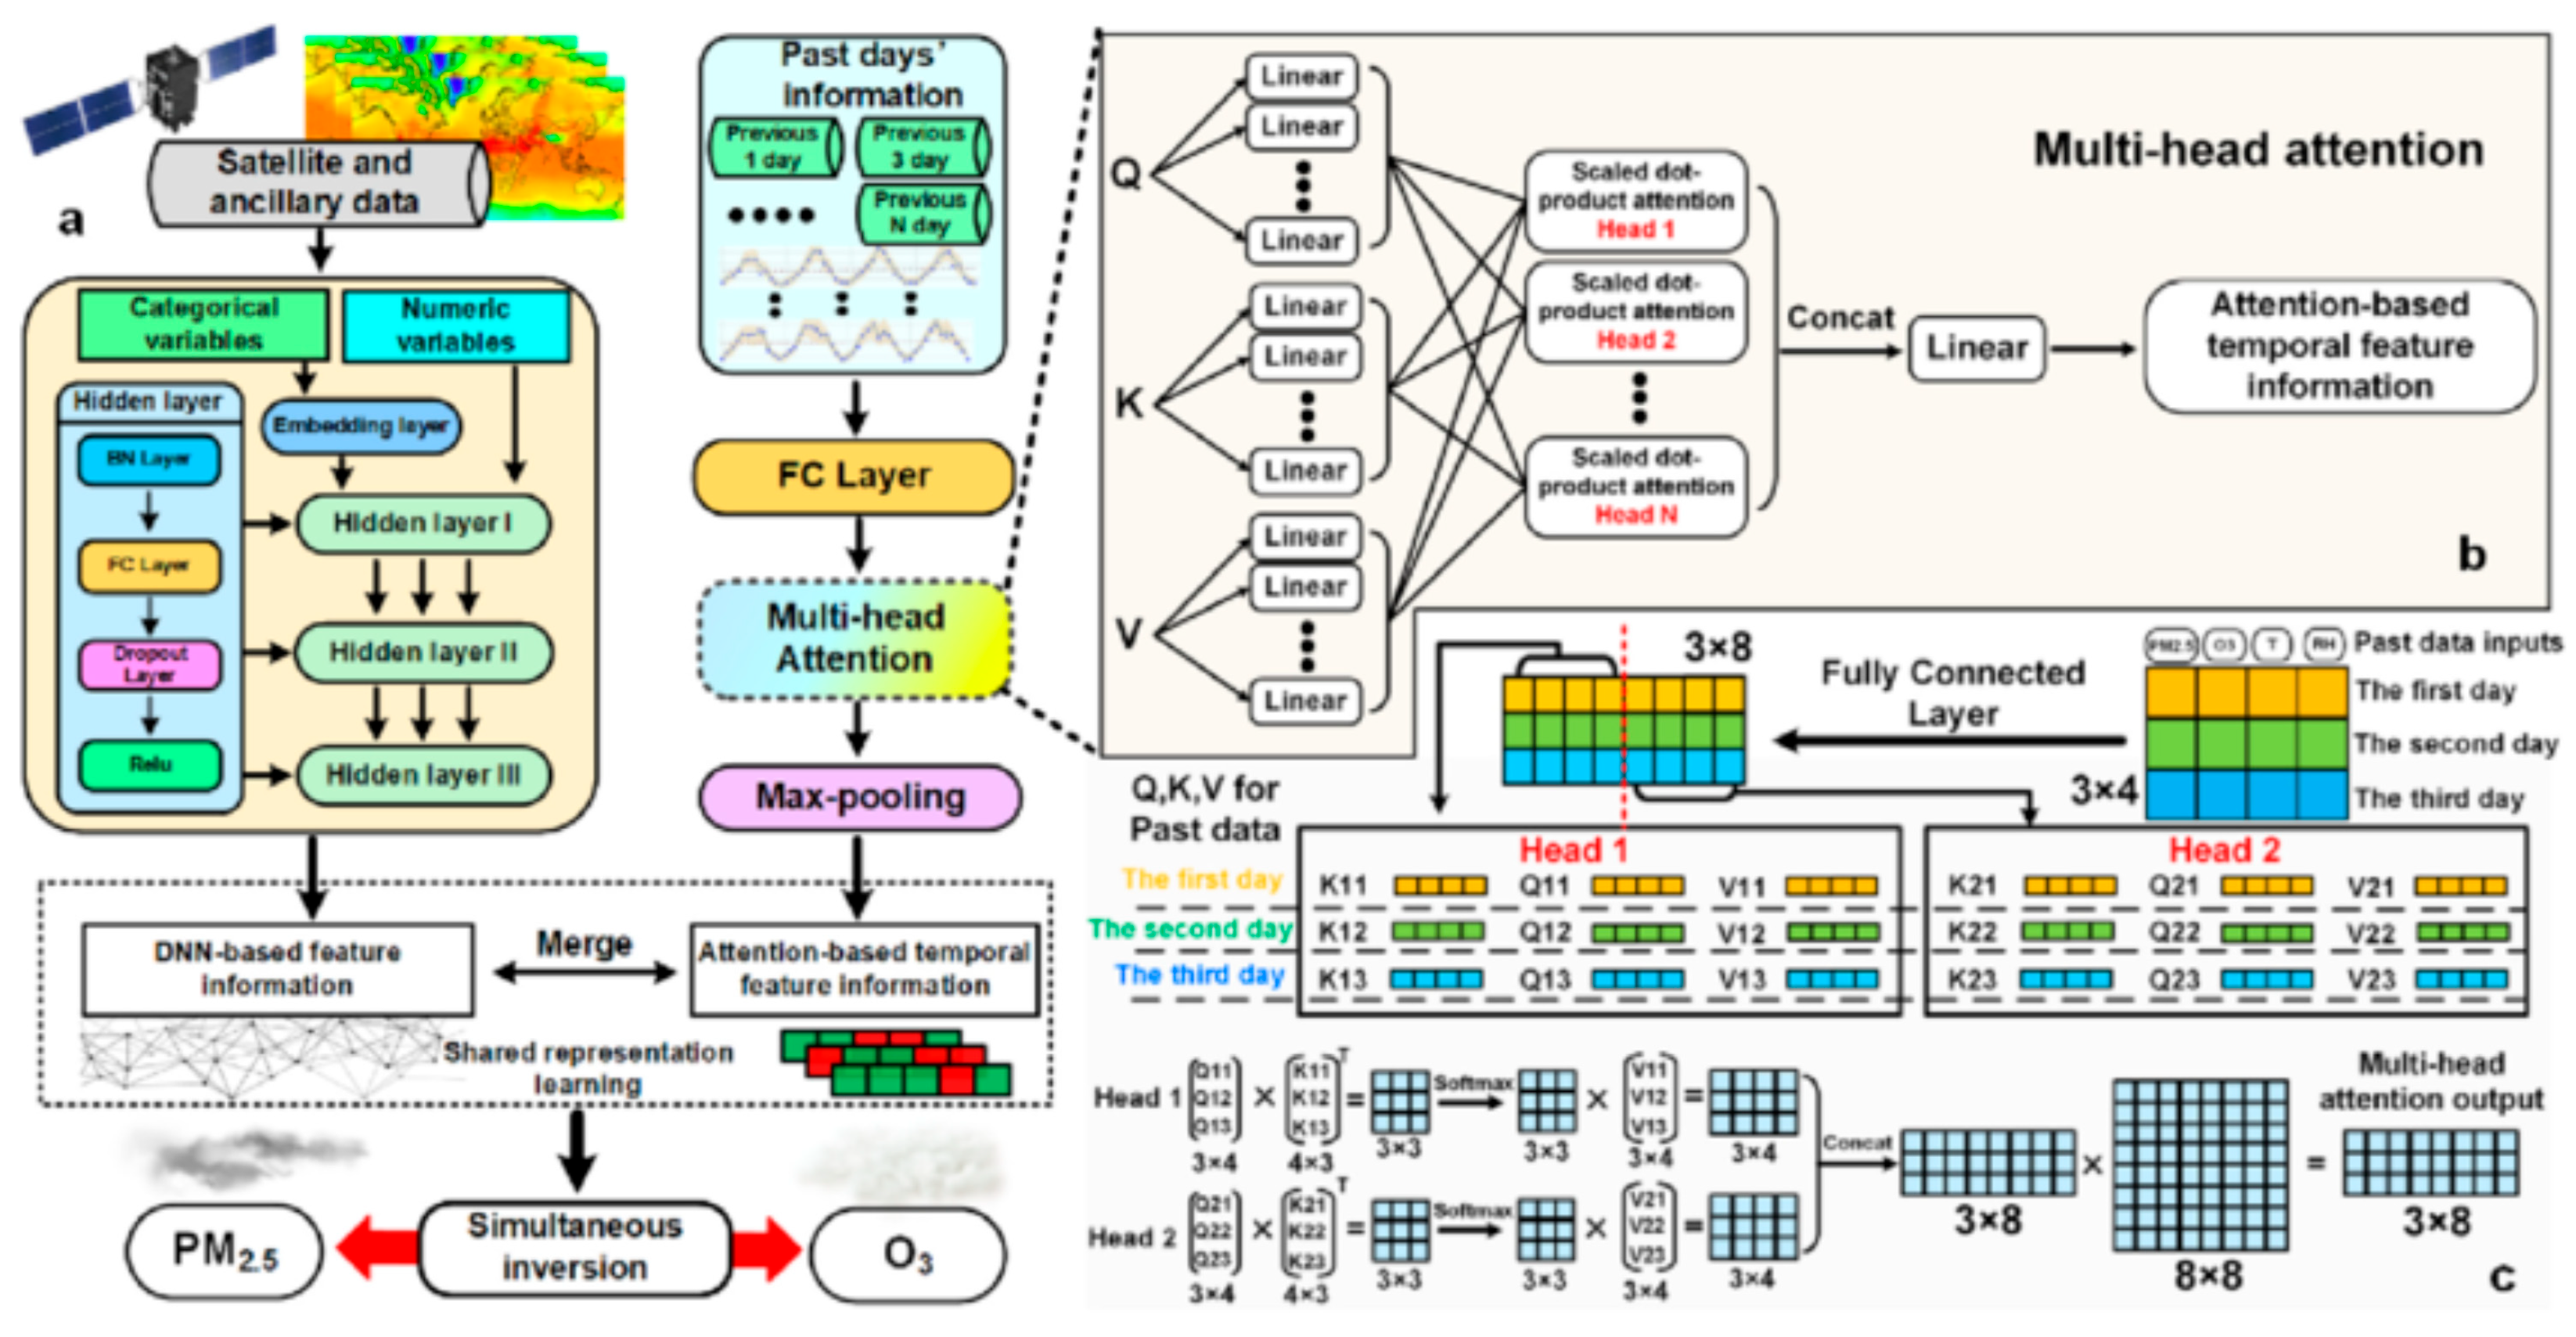
A key advancement has been the development of joint inversion frameworks that treat O3 not in isolation but as part of an interdependent pollutant system. The SOPiNet model exemplifies this shift by simultaneously retrieving PM2.5 and O3 concentrations from MODIS satellite observations, meteorological reanalysis, and CTM forecasts using a multi-head attention deep learning architecture. Unlike conventional LSTM models, SOPiNet dynamically prioritizes historical inputs across a 20-day window, achieving a 3.8% gain in temporal R2 for O3 and enabling accurate inference even in data-sparse regions. Moreover, by embedding spatial-temporal interaction features (e.g., province-month coupling) and allowing masked loss for missing labels, the model facilitates near-real-time, nationwide 5 km resolution mapping with robust generalization capabilities. The structural composition and operational workflow of the SOPiNet model are illustrated in Figure 15, including its multi-head attention module and temporal sequence extraction for pollutant inference.
(2) Scaling Up: Full-Coverage O3 Fields with Deep Spatiotemporal Convolutions
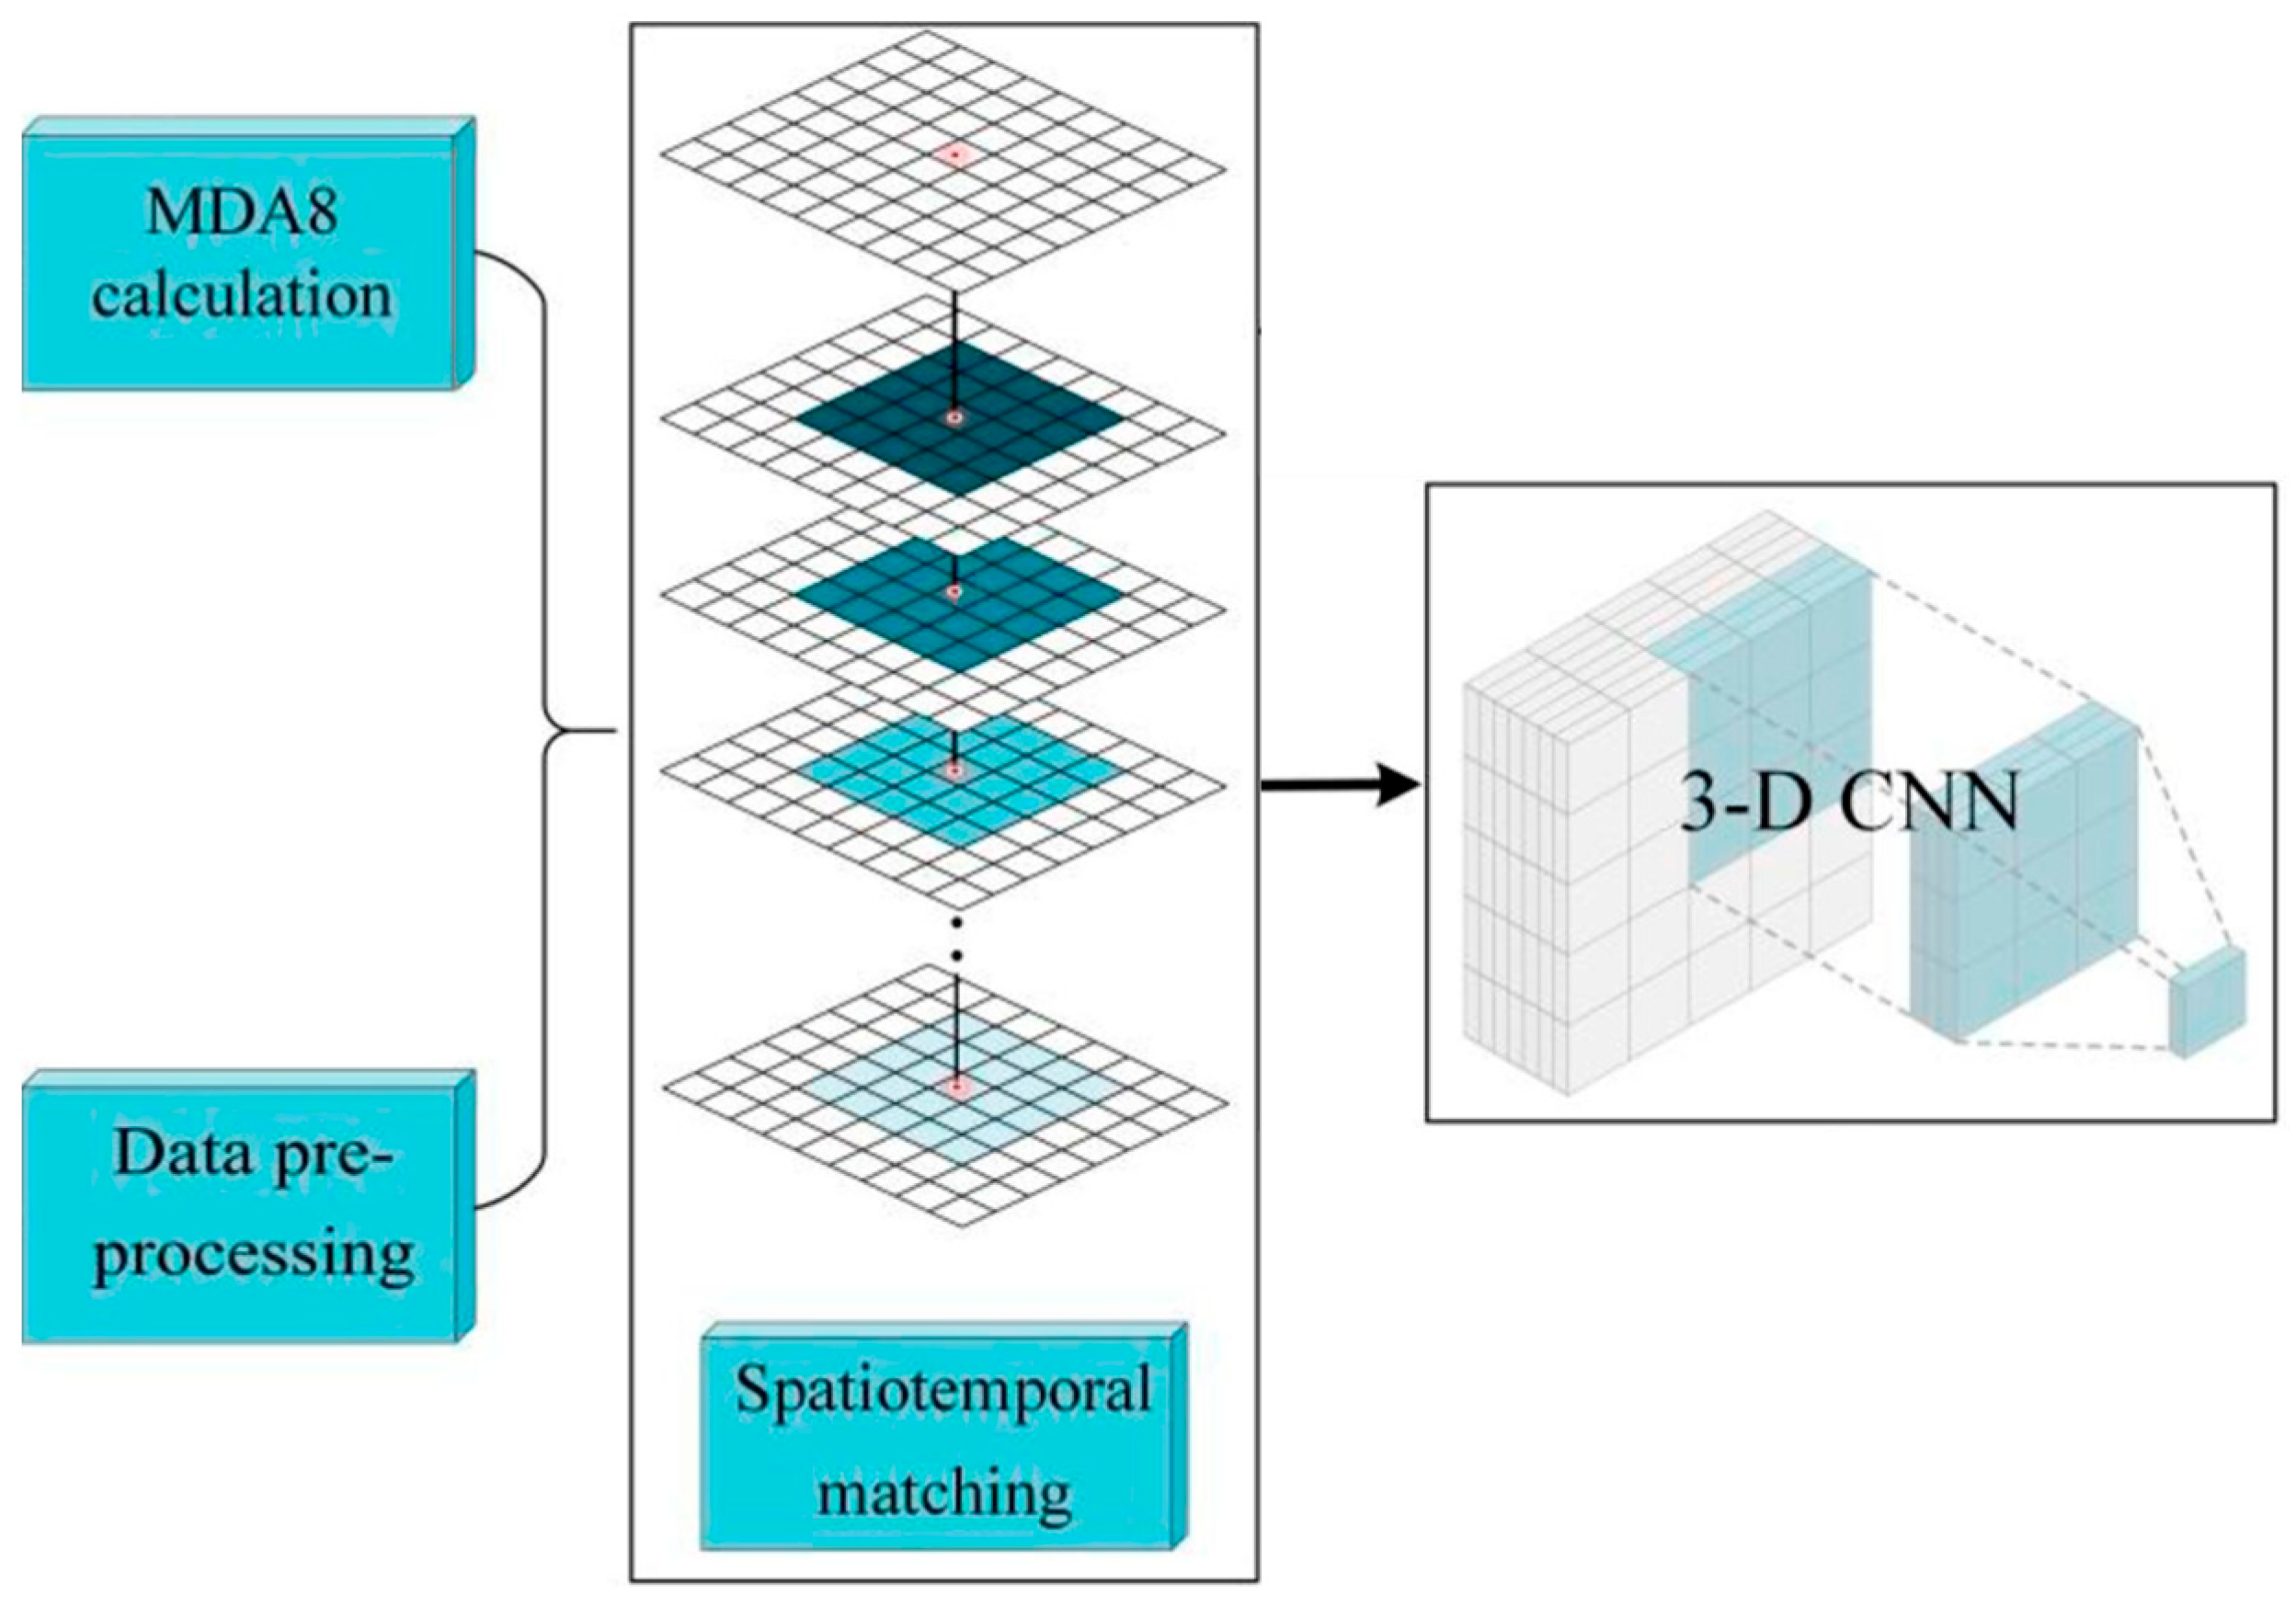
Another milestone is the construction of full-coverage, high-resolution O3 datasets using 3D convolutional neural networks (3D-CNNs) [101]. A notable study developed a pipeline that first imputes missing OMI-NO2 tropospheric column data via LightGBM, then feeds the completed dataset—together with ERA5 meteorology, NDVI, land cover, and population density—into a 3D-CNN architecture. The network captures both spatial proximity and temporal lag effects over a 7-day × 5 × 5 grid structure, producing a 0.1° daily MDA8 O3 dataset for China from 2016 to 2020. Compared with TAP and CHAP benchmark datasets, this model achieves lower RMSE (15.65 μg/m3) and exhibits minimal interpolation artifacts, making it a valuable tool for epidemiological risk assessments and national pollution control evaluation. Figure 16 illustrates the complete workflow of this 3D-CNN-based framework, including preprocessing, data integration, and spatiotemporal inference of surface ozone concentrations across China.
(3) Structural Learning and Model Explainability
Beyond accuracy, AI models are increasingly embedded with structural priors and interpretability modules to support regulatory and scientific applications. Res-GCN-BiLSTM, for instance, constructs topological representations of air quality monitoring networks and learns inter-site transport patterns using residual GCN layers, while capturing temporal autocorrelations through bidirectional LSTMs. Likewise, hybrid systems combining GCNs, multilayer perceptrons (MLPs), and Gaussian process regression (GPR) enable both high predictive fidelity and uncertainty quantification [103,104].
Explainable AI methods such as SHAP (SHapley Additive exPlanations) have further deepened the field’s interpretive capacity. PMF-SHAP frameworks have quantified nonlinear interactions between VOC emissions and meteorological modifiers, revealing, for example, a negative SHAP value of −2.96 for NOx-suppression zones and +1.38 for industrial ozone enhancements. Similarly, GraphSAGE-based spatiotemporal models have identified solar radiation as the leading 6-h predictor for Houston’s ozone levels (SHAP = 0.38), guiding targeted control interventions.
(4) Toward Real-Time Applications and Generalizable Frameworks
The frontier of AI in ozone modeling is rapidly extending toward real-time decision-making and operational deployment. Models such as SOPiNet and LightGBM-3DCNN not only produce spatially continuous fields but also outperform traditional models in speed and robustness. IoT-integrated platforms combining LSTM/RF pipelines enable predictive control of industrial emissions. Meta-learning systems employing stacked generalization strategies demonstrate superior forecasting for air quality indices (AQI) and air quality grades (AQG), achieving F1 scores exceeding 0.97 [105].
Moreover, algorithmic innovations such as genetic algorithm-tuned LSTMs and SHAP-integrated CatBoost regressors allow for adaptive optimization and transparent factor attribution, reducing overfitting and enhancing trustworthiness [106]. These frameworks signal a transition from isolated model-centric workflows to ecosystem-level AI architectures that interlace data assimilation, feature engineering, explainability, and stakeholder utility.
While recent AI architectures have made notable progress in modeling ozone dynamics, a critical frontier remains under-addressed: the explicit incorporation of extreme temperature events, such as urban heatwaves, into predictive frameworks. Temperature not only modulates VOC reaction rates and boundary-layer mixing but also interacts nonlinearly with humidity, solar radiation, and NOx availability to shift ozone formation regimes. However, many existing AI models rely on smoothed reanalysis inputs or historical climatology, which limits their responsiveness to short-term thermal anomalies. Moving forward, future frameworks should integrate heatwave indicators, diurnal temperature extremes, and land surface temperature (LST) anomalies as dynamic input features—ideally coupled with regime-aware modeling strategies that embed photochemical regime logic into model design, either through dynamic thresholding or chemically informed constraints, to better capture the thermodynamic thresholds of ozone sensitivity. Such enhancements are essential for ensuring model reliability under evolving climate extremes, especially in pollution-prone megacities where VOC abundance intersects with thermal stress.

5. Discussions

5.1. Platform Interoperability and the Observation–Model Divide

Although the VOC–ozone research community has witnessed remarkable progress in observational granularity and computational modeling, the architecture of the field remains structurally fragmented. At the observational level, the vertical stratification of platforms—ground-based, airborne, and satellite—has enabled coverage across scales but has yet to coalesce into a fully interoperable system. Each platform contributes data within its designed altitude, resolution, and sensing constraints, but mutual calibration and operational synergy remain limited. Satellite retrievals, while spatially extensive, often lack the vertical resolution and chemical specificity required to resolve boundary-layer VOC chemistry; yet these limitations are rarely compensated by concurrent airborne or ground-based profiles. Conversely, aircraft-based missions offer high-fidelity vertical snapshots but are campaign-bound and episodic, with limited capacity to anchor long-term trends. Ground stations provide rich chemical speciation and temporal continuity but remain geographically sparse and biased toward urban settings. Despite their conceptual complementarity, these platforms often operate in silos—linked more by retrospective validation than by real-time functional integration. As a result, the observational system functions less as a cohesive sensing network than as a collection of parallel instruments, each illuminating a portion of the atmospheric puzzle but seldom reconstructing the whole.
These platform-specific strengths and limitations are not merely observational constraints but critically shape how different data streams contribute to the broader VOC–ozone research architecture. In our synthesis, we explicitly accounted for such heterogeneities by aligning platform roles with their operational advantages: satellite data were primarily weighted in trend detection and spatial anomaly mapping, aircraft and UAV data in vertical structure reconstruction and episode diagnostics, and ground-based observations in chemical regime classification and precursor–O3 sensitivity analyses. This functional weighting ensures that platform data are interpreted not as interchangeable but as complementary inputs with domain-specific validity and epistemic roles.
Nevertheless, real-world efforts at platform integration often expose systemic interoperability gaps. For example, the assimilation of satellite-derived total-column HCHO into urban-scale CTMs frequently fails to constrain surface-level chemistry due to coarse pixel resolution and lack of vertical discrimination, especially in heterogeneous urban terrains. UAV-based campaigns, while offering low-altitude flexibility, are often limited in sensor payload and temporal coverage, making their datasets difficult to co-register with satellite overpasses or aircraft transects. Similarly, aircraft profiling missions rarely coincide with satellite or ground station windows, limiting their value for direct intercalibration. These mismatches are not isolated incidents but recurring structural failures that reflect the absence of synchronized deployment logic, common data standards, and platform-aware fusion frameworks.
This disjunction extends and indeed deepens when observations are interfaced with models. Whether mechanistic (e.g., CTMs and OBMs) or data-driven (e.g., CNNs and LSTMs), most modeling frameworks engage with observational data only intermittently and abstractly—often relying on preprocessed or downsampled proxies such as total-column HCHO, grid-averaged NO2, or reanalysis-based meteorology. The fine-scale heterogeneity, regime shifts, and source-specific behaviors captured by high-resolution measurements are frequently lost in this translation. In turn, models calibrated to these smoothed inputs may achieve statistical fidelity but fail in diagnostic robustness, particularly near sensitivity thresholds or under regime perturbation. This is acutely evident in rapidly evolving domains—such as the transition from VOC-limited to NOx-limited chemistry following emission control interventions—where modeling outputs diverge from observational indicators not due to data scarcity, but due to representational misalignment.
What is required, therefore, is a structural convergence—both across observational platforms and between observation and modeling systems. Internally, the sensing architecture must evolve toward recursive interoperability: satellite retrievals anchored by tower-derived gradients, aircraft profiling guided by real-time surface diagnostics, and ground campaigns designed to validate orbital anomalies rather than operate in isolation. Externally, models must cease to treat observations as static inputs and instead engage them as dynamic constraints—informing model initialization, sensitivity tuning, and predictive uncertainty quantification. In turn, observational strategies should be designed not merely for data collection but for modeling utility: prioritizing chemically informative tracers, temporally aligned deployments, and regime-sensitive indicators. Only through such recursive, task-aware coupling can the field transcend the current observation–model divide and achieve a genuinely integrated framework—one capable not only of describing the atmosphere but also of simulating its chemical evolution and supporting actionable intervention.

5.2. Spatial Mismatch, Sensitivity Drift, and the Fragility of Predictive Modeling

Even as models grow in complexity and accuracy, their operational reliability remains undermined by two persistent challenges: the mismatch between modeling and observational scales and the inherent instability of ozone precursor sensitivity regimes under shifting environmental baselines. Most state-of-the-art modeling frameworks—whether mechanistic or data-driven—operate at spatial resolutions that are coarse relative to the heterogeneity of emission sources and meteorological dynamics. While satellite retrievals and CTM outputs typically span 1–10 km grids, effective ozone control requires diagnostics at sub-kilometer scales, where the influence of roadways, industrial corridors, and topographical features becomes non-negligible. This disconnect is not merely one of resolution but of misalignment: key processes such as VOC speciation, chemical aging, and turbulent exchange occur on scales finer than most models resolve, leading to systematic dilution of gradients and blurring of sensitivity boundaries.
The implications of this mismatch become particularly acute near regime transition zones. In regions characterized by overlapping anthropogenic and biogenic emissions—such as peri-urban belts or monsoon-influenced basins—ozone formation can toggle between VOC-limited and NOx-limited states within hours, depending on insolation, temperature, and boundary-layer dynamics. Yet most models, especially AI-based predictors, tend to encode these dynamics as static or slowly varying features, leading to brittle predictions when underlying conditions shift. In policy evaluation scenarios, this can result in perverse outcomes: emission reductions that are forecasted to improve ozone levels may in fact exacerbate them, as the regime structure adjusts in ways the model fails to anticipate. The 2020–2022 episodes in several Chinese megacities—where post-lockdown NOx reductions coincided with unexpected ozone rebounds—serve as cautionary cases of this modeling fragility.
Adding to the complexity is the temporal instability of chemical sensitivity regimes in response to both anthropogenic control and climatic fluctuation. The progressive substitution of solvent-based VOC sources, the re-emergence of biomass burning plumes, and the intensification of extreme heat events all act to reshape the reactive balance of the lower atmosphere. Yet most models are calibrated to historic regimes and offer limited adaptivity to these emerging conditions. Even when observational data suggest a shift—such as rising HCHO/NO2 ratios or altered oxidant partitioning—models may continue to forecast responses based on outdated sensitivity fields. In effect, the atmosphere evolves faster than the models that seek to describe it.
Addressing these limitations requires a paradigm shift in both model architecture and deployment logic. Grid-based chemical models must move toward dynamically adaptive resolution, incorporating nested domains, localized emission perturbation tests, and real-time assimilation of sensitivity indicators. AI models, for their part, must embed regime-aware loss functions, temporal segmentation strategies, and structural priors that reflect known photochemical pathways. However, perhaps more fundamentally, predictive modeling must cease to be treated as a closed-loop system. It must instead function as a conditional scaffold—updated recursively by high-resolution measurements, stress-tested across extreme regimes, and continuously validated against the shifting boundaries of chemical sensitivity. Only under such a framework can ozone modeling transition from static forecast generation to dynamic, policy-relevant scenario testing.

5.3. Artificial Intelligence in VOC–O3 Modeling: Structural Capabilities, Functional Gaps, and Systemic Remedies

Artificial intelligence has emerged as a transformative force in surface ozone modeling, particularly under the pressure to generate high-resolution, scalable, and near-real-time predictions. Models based on convolutional neural networks, long short-term memory units, and spatiotemporal fusion architectures have shown great success in reproducing observed O3 concentrations, often outperforming traditional CTMs and OBMs in statistical accuracy. Yet despite their impressive numerical performance, AI-based models remain structurally under-equipped to address the specific demands of VOC–O3 interaction modeling. This mismatch stems not from algorithmic weakness per se, but from a deeper incongruity between the epistemology of AI systems and the atmospheric processes they seek to approximate.
The first and most fundamental limitation lies in the inability of current AI architectures to internalize the regime-sensitive nature of ozone formation. Unlike physical models that simulate the chain of VOC oxidation, radical cycling, and NOx photolysis, deep learning models operate as end-to-end regressors—mapping precursor fields, meteorological inputs, and land-use attributes directly to O3 concentrations without decomposing the underlying chemistry. As a result, they offer little traction on the most policy-relevant question: which precursor reductions will actually lower ozone under a given regime? This becomes critical in urban or peri-urban zones where regime transitions occur over short spatial or temporal scales and where model misclassification—e.g., interpreting a VOC-limited regime as NOx-limited—can lead to control policies that are not only ineffective but counterproductive. Such failures are not hypothetical: they have been documented in data-driven forecasts for cities such as Jinan, Suzhou, and Wuhan, where regime toggling across seasons or emission patterns caused pronounced divergence between model guidance and observed ozone outcomes.
A second structural deficiency concerns the representation of VOC sources and reactivities. While many AI models include satellite-retrieved HCHO columns or land-surface descriptors as proxy features, few distinguish between VOC classes or sources, and even fewer weight them by reactivity or yield. This abstraction limits the model’s ability to respond accurately when source composition changes—such as the rise of halogenated solvents, biofuel additives, or secondary oxygenated VOCs under high-radiation conditions. Furthermore, the spatial resolution of VOC inputs is often coarser than the scale of critical emission zones, such as industrial fence-line clusters or traffic corridors, leading to diluted source signatures and over-smoothed regime boundaries. Models trained under these constraints may perform well on global metrics but fail at source disambiguation, sector attribution, or high-variability scenarios.
In particular, the emergence of novel VOC sources—such as halogenated solvents, advanced biofuels, or thermally unstable additives—poses additional challenges for generalization, as these compounds are often underrepresented or entirely absent from historical training data. To address this, recent studies have begun incorporating proxy features such as source-tagged emission inventories, photochemical yield indices, or satellite-inferred reactivity gradients into model inputs. Transfer learning and domain adaptation techniques also offer a promising avenue for extending model validity to chemically evolving emission landscapes. While still in early stages, these approaches highlight the need for structural flexibility and continuous updating mechanisms in AI-based models if they are to remain policy-relevant under rapidly changing VOC profiles.
Third, AI models are inherently vulnerable to generalization failure under meteorological or emission perturbations that fall outside the training distribution. Ozone production is known to respond nonlinearly to extreme heat, stagnant air masses, biomass burning events, and shifts in VOC speciation induced by regulatory intervention. Yet in most AI workflows, such perturbations are not explicitly encoded or stress tested. Models trained on climatologically stationary datasets exhibit degraded performance under anomalous events, precisely when predictive insight is most needed. The 2022 heatwave episodes over Eastern China, for instance, exposed this fragility: multiple deep learning models underestimated the persistence of nocturnal O3 accumulation due to unmodeled inversion and radical trapping mechanisms—features that physical models could simulate, but AI systems failed to recognize due to feature blindness.
A fourth and often overlooked limitation lies in the model objectives and loss function design. AI-based ozone models are typically optimized for overall RMSE or R2 across broad spatial domains, but these metrics obscure performance at regime boundaries or near peak exceedance events. As a result, models may fail to penalize false negatives in VOC-limited zones or underestimate peak concentrations that are epidemiologically significant. Without loss structures tailored to regime fidelity, policy threshold detection, or precursor attribution accuracy, these models risk converging to high accuracy with low policy utility.
These limitations are not intrinsic to AI itself but to how it is currently implemented. Corrective pathways are increasingly being explored. On the input side, new models now incorporate precursor reactivity metrics, emission sector tags, and photochemical surrogate variables (e.g., Ox production efficiency) to encode mechanistic priors. On the architecture side, hybrid frameworks—such as physics-informed neural networks, CTM-AI fusion layers, or graph-based representations of monitoring networks—have shown promise in combining chemical interpretability with data-driven flexibility. On the output side, model explainability tools such as SHAP, LIME, and attention heatmaps are helping translate numerical predictions into chemically meaningful inference—allowing users to trace which inputs most strongly drive ozone forecasts under different conditions. However, these methods remain largely peripheral to model structure and are seldom deployed in operational pipelines.
The way forward lies in elevating these adaptations from post hoc augmentations to design principles. Future AI systems for ozone modeling must be constructed not simply to fit data but to solve chemically meaningful tasks—such as regime identification, sensitivity boundary detection, and source-contribution mapping. Their architectures must reflect the asymmetry and nonlinearity of atmospheric reactions; their training must prioritize sensitivity coherence over brute-force accuracy; their outputs must support policy evaluation, not just concentration reproduction. Most critically, they must function not as black boxes, but as intelligible intermediaries—integrating the vastness of observational data with the discipline of mechanistic constraints.
In the context of VOC–O3 research, such models will not replace physical simulation but will redefine its boundaries. They will absorb observational anomalies, resolve spatial discontinuities, flag regime instabilities, and provide adaptive counterfactuals in ways that traditional models cannot. However, to do so, they must be designed as atmospheric reasoning systems—not regressors. The transition from predictive power to atmospheric relevance is not a matter of scale but of structure.

5.4. Toward Systemic Integration: From Structural Correction to Functional Governance

The limitations of current VOC–O3 research frameworks—whether rooted in platform isolation, modeling misalignment, or algorithmic abstraction—ultimately converge upon a larger structural gap: the absence of a coherent, feedback-rich system linking observation, inference, and policy action. While each component—satellite sensing, airborne campaigns, ground-based monitoring, mechanistic modeling, and AI-based forecasting—has advanced substantially in isolation, they remain functionally fragmented. Observation feeds modeling, and modeling supports scenario evaluation, but rarely do these processes operate in synchrony, and even less frequently do they interact with real-time regulatory mechanisms. As a result, the system remains diagnostic rather than responsive, descriptive rather than adaptive.
This fragmentation is particularly problematic in the context of ozone governance, where regime transitions are nonlinear, emissions are rapidly evolving, and meteorological baselines are shifting under climate pressure. Policy effectiveness increasingly hinges on the ability not only to anticipate ozone exceedances but also to interpret their drivers and adjust mitigation pathways dynamically. Yet existing workflows—often built on static inventories, coarse-resolution simulations, and retrospective evaluation—lack the structural elasticity to support such responsive governance. Even where observational data are abundant, they are seldom assimilated into decision-making systems in a form that captures sensitivity structure, source attribution, or impact trajectories in near real-time.
What is needed is a paradigm shift—from modular advancement to systemic integration. At the core of this shift lies the construction of a recursive, task-oriented governance architecture in which sensing, simulation, and strategy are continuously interlinked. Observational data must no longer terminate at model boundaries but re-enter them through assimilation, regime validation, and anomaly detection. Models must cease to be passive forecasting engines and instead evolve into active scenario generators—flagging instability zones, simulating intervention outcomes, and quantifying the uncertainty range of precursor control options. Policy tools must likewise move beyond threshold triggers and embrace regime-informed logic, where emission reduction ratios are not fixed but dynamically allocated based on prevailing chemical sensitivity, meteorological context, and source profile evolution.
The foundational elements of such an integrated system are already emerging. Hybrid platforms that combine IoT-enabled VOC sensors with AI-based inference engines now allow sub-hourly updates on precursor distribution and regime hotspots. Machine-learning-driven control strategies, informed by real-time FNR maps and historical emission-responsiveness profiles, are being tested for adaptive traffic or solvent use restrictions. Regional atmospheric command systems—modeled loosely on carbon monitoring infrastructures—are being explored to link satellite-derived diagnostics with localized intervention protocols. However, these efforts remain embryonic, hindered not by lack of technology but by lack of system logic: an architecture that defines how observation and inference translate into coordinated action.
To build such logic, VOC–O3 governance must adopt a systems perspective. It must treat air quality not as a product of emissions alone, but as the emergent outcome of interacting observational, modeling, and regulatory subsystems. It must prioritize structural redundancy—overlapping sensor types, multi-model triangulation, and cross-scale sensitivity verification—so that no single point of failure skews policy judgment. In addition, it must redefine response not as static compliance, but as dynamic interaction: a system that learns from its own outcomes, adapts to new conditions, and iteratively refines its strategy in step with atmospheric evolution.
Only by reimagining the governance landscape in this way—where VOC monitoring, O3 modeling, and precursor control are co-designed and co-evolving—can the field move beyond descriptive diagnostics toward functional resilience. In this convergence lies not only the future of ozone mitigation but also the prototype for next-generation atmospheric governance more broadly.
While VOC–O3 interactions are often studied through the lens of regional air quality management, mounting evidence suggests that their impacts can aggregate and interact to produce global-scale atmospheric consequences. Transboundary transport of ozone precursors, hemispheric pollution corridors, and the amplification of photochemical reactions under climate-induced temperature extremes all point to a systemic vulnerability beyond individual regions. For instance, persistent ozone enhancements over continental outflow zones—such as the North Pacific or South Atlantic—are increasingly linked to cumulative precursor emissions from disparate sources, many of which originate from rapidly developing urban clusters. Similarly, climate-driven increases in biogenic VOC emissions, coupled with stagnant air masses, can elevate background ozone levels at a planetary scale. These phenomena are not merely additive but synergistic, revealing feedback loops between local emissions, regional chemistry, and global atmospheric composition. As such, VOC–O3 research must evolve to account for cross-scale propagation mechanisms and incorporate them into integrated governance strategies that transcend administrative boundaries. Only through such a perspective can mitigation policies achieve both local effectiveness and global relevance.

6. Conclusions

The atmospheric chemistry community stands at a critical turning point in understanding and managing ozone pollution. As volatile organic compounds (VOCs) continue to mediate the nonlinear formation of tropospheric ozone (O3), research efforts have increasingly shifted from isolated observations and static simulations toward integrated, chemically meaningful systems of analysis. This review has systematically mapped the evolution of VOC–O3 research across three interconnected dimensions—platform advancement, modeling innovation, and methodological rethinking—highlighting both the achievements made and the structural bottlenecks that persist.
On the observational side, diverse sensing platforms have enabled unprecedented access to VOC gradients and precursor dynamics, yet operational fragmentation remains widespread. Satellite, airborne, and ground-based platforms are rarely designed with cross-compatibility or model assimilation in mind, leading to missed opportunities in regime diagnosis and precursor attribution. Critical observational gaps persist in VOC speciation, near-surface vertical resolution, and suburban-scale temporal granularity, all of which undermine the fidelity of model inputs.
Modeling efforts—whether mechanistic or data-driven—have evolved rapidly, but they remain fundamentally constrained by their representational architecture. While CTMs offer chemical completeness, they often lag in responsiveness and localization. AI models, despite impressive statistical accuracy, tend to obscure mechanistic insight and falter under extrapolative stress. In particular, most models fail to internalize the regime-sensitive nature of ozone formation, producing outputs that are numerically precise yet chemically or policy-wise ambiguous. The challenge is not just accuracy, but interpretability, sensitivity, coherence, and operational relevance.
These limitations are not marginal—they reflect a systemic decoupling: observations remain disconnected from modeling inference, and models remain isolated from responsive policy action. Despite the proliferation of sensing platforms and algorithmic innovations, the field still lacks an integrated, feedback-oriented architecture wherein observational granularity informs model design, models adapt to regime shifts, and regulatory interventions align dynamically with evolving atmospheric sensitivities.
Yet within these limitations lies a clear opportunity. This review identifies not only the technical and conceptual gaps but also a converging pathway forward: intelligent sensing infrastructures, structure-informed neural networks, and chemically transparent regime modeling now collectively point toward a new operational paradigm. This paradigm is not merely analytical but decision-oriented—designed to support real-time diagnostics, scenario forecasting, and policy calibration within complex urban and regional contexts. Expanding participation from underrepresented regions—through open data, lightweight modeling approaches, and global collaborations—is essential to ensuring the generalizability and policy relevance of future VOC–O3 research.
Our proposed synthesis—linking vertically structured VOC monitoring with regime-aware modeling frameworks—offers a replicable conceptual model for integrated atmospheric governance. Beyond advancing ozone science, it presents a scalable blueprint for environmental reasoning systems that are interpretive, adaptive, and actionable across spatial, temporal, and institutional boundaries.

Author Contributions

X.Z. and H.W.: Methodology, software, and writing—original draft; conceptualization, writing—review and editing, project administration, and funding acquisition; Y.H.: Writing—review and editing, supervision, and project administration; D.Z. and S.L.: Investigation, data curation, and visualization; Z.Z.: Methodology, resources, and editing; Y.L.: Supervision, formal analysis, investigation, and data curation. All authors have read and agreed to the published version of the manuscript.

Funding

This research was funded by China University of Petroleum–Beijing at Karamay (No. XQZX20240025), the National Natural Science Foundation of China (No. 41830108), the Innovation Team of XPCC’s Key Area (No. 2018CB004), the Ministry of Education Humanities and Social Sciences Research Project (No. 23YJAZH086), and the Major Projects of High-Resolution Earth Observation (No. 30-H30C01-9004-19/21).

Institutional Review Board Statement

Not applicable for studies not involving humans or animals.

Informed Consent Statement

Not applicable for studies not involving humans.

Data Availability Statement

The data that support the findings of this study are available from the corresponding author upon reasonable request.

Conflicts of Interest

The authors declare no conflicts of interest.

References

  1. Iturrate-Garcia, M.; Salameh, T.; Schlauri, P.; Baldan, A.; Vollmer, M.; Stratigou, E.; Dusanter, S.; Li, J.; Persijn, S.; Claude, A.; et al. Towards a High-Quality in Situ Observation Network for Oxygenated Volatile Organic Compounds (OVOCs) in Europe: Transferring Metrological Traceability to the Field. Atmos. Meas. Tech. 2025, 18, 371–403. [Google Scholar] [CrossRef]
  2. Lee, H.E.; Lee, B.-W.; Kim, J.H. Investigating VOCs Speciation Characteristics at the Fenceline of Synthetic Rubber Manufacturing Industries via Active and Passive Monitoring Techniques. Atmosphere 2023, 14, 1119. [Google Scholar] [CrossRef]
  3. Feng, S.; Jiang, F.; Qian, T.; Wang, N.; Jia, M.; Zheng, S.; Chen, J.; Ying, F.; Ju, W. Constraining Non-Methane VOC Emissions with TROPOMI HCHO Observations: Impact on Summertime Ozone Simulation in August 2022 in China. Atmos. Chem. Phys. 2024, 24, 7481–7498. [Google Scholar] [CrossRef]
  4. Choi, W.N.; Hong, H.K.; Lee, Y.W.; Ryu, J.Y.; Park, J.S.; Lee, H.L. First-Time Estimation of HCHO Column over Asia Using Multiple Regression with OMI and MODIS Data. J. Environ. Inform. 2019, 34, 88–98. [Google Scholar] [CrossRef]
  5. Lu, Y.; Wu, Z.; Pang, X.; Wu, H.; Xing, B.; Li, J.; Xiang, Q.; Chen, J.; Shi, D. Temporal Characteristics of Ozone (O3) in the Representative City of the Yangtze River Delta: Explanatory Factors and Sensitivity Analysis. Int. J. Environ. Res. Public Health 2023, 20, 168. [Google Scholar] [CrossRef] [PubMed]
  6. Zhang, J.; Wang, T.; Chameides, W.L.; Cardelino, C.; Kwok, J.; Blake, D.R.; Ding, A.; So, K.L. Ozone Production and Hydrocarbon Reactivity in Hong Kong, Southern China. Atmos. Chem. Phys. 2007, 7, 557–573. [Google Scholar] [CrossRef]
  7. Morfopoulos, C.; Muller, J.-F.; Stavrakou, T.; Bauwens, M.; De Smedt, I.; Friedlingstein, P.; Prentice, I.C.; Regnier, P. Vegetation Responses to Climate Extremes Recorded by Remotely Sensed Atmospheric Formaldehyde. Glob. Change Biol. 2022, 28, 1809–1822. [Google Scholar] [CrossRef]
  8. Wang, D.; Pu, D.; De Smedt, I.; Zhu, L.; Yang, X.; Sun, W.; Xia, H.; Song, Z.; Li, X.; Li, J.; et al. Evolution of Global O3-NOx-VOCs Sensitivity before and after the COVID-19 from the Ratio of Formaldehyde to NO2 from Satellite Observations. J. Environ. Sci. 2025, 156, 102–113. [Google Scholar] [CrossRef]
  9. Franco, B.; Clarisse, L.; Stavrakou, T.; Mueller, J.-F.; Van Damme, M.; Whitburn, S.; Hadji-Lazaro, J.; Hurtmans, D.; Taraborrelli, D.; Clerbaux, C.; et al. A General Framework for Global Retrievals of Trace Gases From IASI: Application to Methanol, Formic Acid, and PAN. J. Geophys. Res.-Atmos. 2018, 123, 13963–13984. [Google Scholar] [CrossRef]
  10. Palmer, P.; Jacob, D.; Fiore, A.; Martin, R.; Chance, K.; Kurosu, T. Mapping Isoprene Emissions over North America Using Formaldehyde Column Observations from Space. J. Geophys. Res.-Atmos. 2003, 108. [Google Scholar] [CrossRef]
  11. Du, X.; Tang, W.; Cheng, M.; Zhang, Z.; Li, Y.; Li, Y.; Meng, F. Modeling of Spatial and Temporal Variations of Ozone-NOX-VOC Sensitivity Based on Photochemical Indicators in China. J. Environ. Sci. 2022, 114, 454–464. [Google Scholar] [CrossRef]
  12. Zhao, F.; Liu, C.; Cai, Z.; Liu, X.; Bak, J.; Kim, J.; Hu, Q.; Xia, C.; Zhang, C.; Sun, Y.; et al. Ozone Profile Retrievals from TROPOMI: Implication for the Variation of Tropospheric Ozone during the Outbreak of COVID-19 in China. Sci. Total Environ. 2021, 764, 142886. [Google Scholar] [CrossRef]
  13. Leung, P.; Harrison, R. Roadside and In-Vehicle Concentrations of Monoaromatic Hydrocarbons. Atmos. Environ. 1999, 33, 191–204. [Google Scholar] [CrossRef]
  14. Qin, Y.; Tonnesen, G.; Wang, Z. Weekend/Weekday Differences of Ozone, NOx, Co, VOCs, PM10 and the Light Scatter during Ozone Season in Southern California. Atmos. Environ. 2004, 38, 3069–3087. [Google Scholar] [CrossRef]
  15. Mukherjee, A.; Agrawal, S.B.; Agrawal, M. Intra-Urban Variability of Ozone in a Tropical City-Characterization of Local and Regional Sources and Major Influencing Factors. Air Qual. Atmos. Health 2018, 11, 965–977. [Google Scholar] [CrossRef]
  16. Navazo, M.; Durana, N.; Alonso, L.; García, J.; Ilardia, J.; Gómez, M.; Gangoiti, G. Volatile Organic Compounds in Urban and Industrial Atmospheres:: Measurement Techniques and Data Analysis. Int. J. Environ. Anal. Chem. 2003, 83, 199–217. [Google Scholar] [CrossRef]
  17. Carpenter, L.; Lewis, A.; Hopkins, J.; Read, K.; Longley, I.; Gallagher, M. Uptake of Methanol to the North Atlantic Ocean Surface. Glob. Biogeochem. Cycles 2004, 18. [Google Scholar] [CrossRef]
  18. Kaminsky, J.; Wylie, A. Vertical contaminant profiling of volatile organics in a deep fractured basalt aquifer. Ground Water Monit. Remediat. 1995, 15, 97–103. [Google Scholar] [CrossRef]
  19. Shuaibu, N.S.; Qin, C.; Chu, F.; Ismail, B.B.; Ibrahim, A.M.; Indabawa, M.G.; Abdalmohammed, S.A.A.; Zhao, G.; Wang, X. Traceability Tagging of Volatile Organic Compound Sources and Their Contributions to Ozone Formation in Suzhou Using Vehicle-Based Portable Single-Photon Ionization Mass Spectrometry. Environ. Sci. Eur. 2024, 36, 46. [Google Scholar] [CrossRef]
  20. Kim, J.-H.; Lee, H.E.; Yoon, S.J. Study on the Speciation of VOCs at Oil Refining Plant Fenceline through Active Sampling. Atmosphere 2023, 14, 485. [Google Scholar] [CrossRef]
  21. Kim, M.-G.; Kim, J.H.; Yoon, S.J.; Cho, S.H.; Yu, J.U.; Kang, C.W.; Moon, K.W.; Lee, H.E. Evaluating the Feasibility of Air Environment Management System for VOCs through ‘VOCs Specification’ of Petroleum Refining Industry. J. Air Waste Manag. Assoc. 2023, 73, 362–373. [Google Scholar] [CrossRef]
  22. Andreae, M.O.; Acevedo, O.C.; Araujo, A.; Artaxo, P.; Barbosa, C.G.G.; Barbosa, H.M.J.; Brito, J.; Carbone, S.; Chi, X.; Cintra, B.B.L.; et al. The Amazon Tall Tower Observatory (ATTO): Overview of Pilot Measurements on Ecosystem Ecology, Meteorology, Trace Gases, and Aerosols. Atmos. Chem. Phys. 2015, 15, 10723–10776. [Google Scholar] [CrossRef]
  23. Li, L.; Lu, C.; Chan, P.-W.; Lan, Z.; Zhang, W.; Yang, H.; Wang, H. Impact of the COVID-19 on the Vertical Distributions of Major Pollutants from a Tower in the Pearl River Delta. Atmos. Environ. 2022, 276, 119068. [Google Scholar] [CrossRef] [PubMed]
  24. Luo, H.; Li, G.; Chen, J.; Wang, Y.; An, T. Reactor Characterization and Primary Application of a State of Art Dual-Reactor Chamber in the Investigation of Atmospheric Photochemical Processes. J. Environ. Sci. 2020, 98, 161–168. [Google Scholar] [CrossRef] [PubMed]
  25. Wegener, R.; Brauers, T.; Koppmann, R.; Rodriguez Bares, S.; Rohrer, F.; Tillmann, R.; Wahner, A.; Hansel, A.; Wisthaler, A. Simulation Chamber Investigation of the Reactions of Ozone with Short-Chained Alkenes. J. Geophys. Res.-Atmos. 2007, 112. [Google Scholar] [CrossRef]
  26. Kaiser, J.; Li, X.; Tillmann, R.; Acir, I.; Holland, F.; Rohrer, F.; Wegener, R.; Keutsch, F.N. Intercomparison of Hantzsch and Fiber-Laser-Induced-Fluorescence Formaldehyde Measurements. Atmos. Meas. Tech. 2014, 7, 1571–1580. [Google Scholar] [CrossRef]
  27. Zogka, A.G.; Mellouki, A.; Romanias, M.N.; Bedjanian, Y.; Idir, M.; Grosselin, B.; Daele, V. Atmospheric Chemistry of 1-Methoxy 2-Propyl Acetate: UV Absorption Cross Sections, Rate Coefficients, and Products of Its Reactions with OH Radicals and CI Atoms. J. Phys. Chem. A 2016, 120, 9049–9062. [Google Scholar] [CrossRef]
  28. Pusfitasari, E.D.; Ruiz-Jimenez, J.; Tiusanen, A.; Suuronen, M.; Haataja, J.; Wu, Y.; Kangasluoma, J.; Luoma, K.; Petajae, T.; Jussila, M.; et al. Vertical Profiles of Volatile Organic Compounds and Fine Particles Inatmospheric Air by Using an Aerial Drone with Miniaturized Samplers Andportable Devices. Atmos. Chem. Phys. 2023, 23, 5885–5904. [Google Scholar] [CrossRef]
  29. Liang, C.-W.; Zheng, Z.-C.; Chen, T.-N. Monitoring Landfill Volatile Organic Compounds Emissions by an Uncrewed Aerial Vehicle Platform with Infrared and Visible-Light Cameras, Remote Monitoring, and Sampling Systems. J. Environ. Manag. 2024, 365, 121575. [Google Scholar] [CrossRef]
  30. Cheng, W.-H.; Yuan, C.-S. Identification of Emission Source Using a Micro Sampler Carried by a Drone. Drones 2022, 6, 116. [Google Scholar] [CrossRef]
  31. Kluge, F.; Hueneke, T.; Knecht, M.; Lichtenstern, M.; Rotermund, M.; Schlager, H.; Schreiner, B.; Pfeilsticker, K. Profiling of Formaldehyde, Glyoxal, Methylglyoxal, and CO over the Amazon: Normalized Excess Mixing Ratios and Related Emission Factors in Biomass Burning Plumes. Atmos. Chem. Phys. 2020, 20, 12363–12389. [Google Scholar] [CrossRef]
  32. Ashworth, K.; Bucci, S.; Gallimore, P.J.; Lee, J.; Nelson, B.S.; Sanchez-Marroquin, A.; Schimpf, M.B.; Smith, P.D.; Drysdale, W.S.; Hopkins, J.R.; et al. Megacity and Local Contributions to Regional Air Pollution: An Aircraft Case Study over London. Atmos. Chem. Phys. 2020, 20, 7193–7216. [Google Scholar] [CrossRef]
  33. Borbon, A.; Ruiz, M.; Bechara, J.; Aumont, B.; Chong, M.; Huntrieser, H.; Mari, C.; Reeves, C.E.; Scialom, G.; Hamburger, T.; et al. Transport and Chemistry of Formaldehyde by Mesoscale Convective Systems in West Africa during AMMA 2006. J. Geophys. Res.-Atmos. 2012, 117. [Google Scholar] [CrossRef]
  34. Yang, S.; Zhu, B.; Shi, S.; Jiang, Z.; Hou, X.; An, J.; Xia, L. Vertical Features of Volatile Organic Compounds and Their Potential Photochemical Reactivities in Boundary Layer Revealed by In-Situ Observations and Satellite Retrieval. Remote Sens. 2024, 16, 1403. [Google Scholar] [CrossRef]
  35. Surl, L.; Palmer, P.I.; Abad, G.G. Which Processes Drive Observed Variations of HCHO Columns over India? Atmos. Chem. Phys. 2018, 18, 4549–4566. [Google Scholar] [CrossRef]
  36. Franco, B.; Clarisse, L.; Van Damme, M.; Hadji-Lazaro, J.; Clerbaux, C.; Coheur, P. Satellite-Based Identification of Large Anthropogenic NMVOC Emission Sources. J. Geophys. Res.-Atmos. 2024, 129, e2024JD042047. [Google Scholar] [CrossRef]
  37. Zeng, Z.-C.; Franco, B.; Clarisse, L.; Lee, L.; Qi, C.; Lu, F. Observing a Volatile Organic Compound From a Geostationary Infrared Sounder: HCOOH From FengYun-4B/GIIRS. J. Geophys. Res.-Atmos. 2024, 129, e2024JD041352. [Google Scholar] [CrossRef]
  38. Tie, X.; Chandra, S.; Ziemke, J.R.; Granier, C.; Brasseur, G.P. Satellite Measurements of Tropospheric Column O3 and NO2 in Eastern and Southeastern Asia:: Comparison with a Global Model (MOZART-2). J. Atmos. Chem. 2007, 56, 105–125. [Google Scholar] [CrossRef]
  39. Chua, G.; Naik, V.; Horowitz, L.W. Exploring the Drivers of Tropospheric Hydroxyl Radical Trends in the Geophysical Fluid Dynamics Laboratory AM4.1 Atmospheric Chemistry-Climate Model. Atmos. Chem. Phys. 2023, 23, 4955–4975. [Google Scholar] [CrossRef]
  40. De Smedt, I.; Stavrakou, T.; Muller, J.-F.; van der A, R.J.; Van Roozendael, M. Trend Detection in Satellite Observations of Formaldehyde Tropospheric Columns. Geophys. Res. Lett. 2010, 37, 11217. [Google Scholar] [CrossRef]
  41. Vrekoussis, M.; Wittrock, F.; Richter, A.; Burrows, J.P. Temporal and Spatial Variability of Glyoxal as Observed from Space. Atmos. Chem. Phys. 2009, 9, 4485–4504. [Google Scholar] [CrossRef]
  42. Wallace, H.W.; Jobson, B.T.; Erickson, M.H.; McCoskey, J.K.; VanReken, T.M.; Lamb, B.K.; Vaughan, J.K.; Hardy, R.J.; Cole, J.L.; Strachan, S.M.; et al. Comparison of Wintertime CO to NOx Ratios to MOVES and MOBILE6.2 on-Road Emissions Inventories. Atmos. Environ. 2012, 63, 289–297. [Google Scholar] [CrossRef]
  43. Afshari, A.; Schuch, F.; Marpu, P. Estimation of the Traffic Related Anthropogenic Heat Release Using BTEX Measurements—A Case Study in Abu Dhabi. Urban Clim. 2018, 24, 311–325. [Google Scholar] [CrossRef]
  44. Kodymova, J.; Petrvalska, R. Modeling of air pollution from traffic and comparison with automated station of air pollution monitoring. Energy Clean Technol. 2015, 4, 961–968. [Google Scholar]
  45. Cheng, N.; Li, R.; Xu, C.; Chen, Z.; Chen, D.; Meng, F.; Cheng, B.; Ma, Z.; Zhuang, Y.; He, B.; et al. Ground Ozone Variations at an Urban and a Rural Station in Beijing from 2006 to 2017: Trend, Meteorological Influences and Formation Regimes. J. Clean. Prod. 2019, 235, 11–20. [Google Scholar] [CrossRef]
  46. Kang, S.; Kim, J.-A.; Lee, M.; Park, J.; Jeon, E.; Shim, M.; Shin, Y. An Analysis of the Temporal Variability in Volatile Organic Compounds (VOCs) within Megacity Seoul and an Identification of Their Sources. Atmos. Pollut. Res. 2022, 13, 101338. [Google Scholar] [CrossRef]
  47. Ho, K.; Lee, S. Identification of Atmospheric Volatile Organic Compounds (VOCs), Polycyclic Aromatic Hydrocarbons (PAHs) and Carbonyl Compounds in Hong Kong. Sci. Total Environ. 2002, 289, 145–158. [Google Scholar] [CrossRef]
  48. Khan, A.; Szulejko, J.E.; Kim, K.-H.; Brown, R.J.C. Airborne Volatile Aromatic Hydrocarbons at an Urban Monitoring Station in Korea from 2013 to 2015. J. Environ. Manag. 2018, 209, 525–538. [Google Scholar] [CrossRef] [PubMed]
  49. Wagner, R.L.; Farren, N.J.; Davison, J.; Young, S.; Hopkins, J.R.; Lewis, A.C.; Carslaw, D.C.; Shaw, M.D. Application of a Mobile Laboratory Using a Selected-Ion Flow-Tube Mass Spectrometer (SIFT-MS) for Characterisation of Volatile Organic Compounds and Atmospheric Trace Gases. Atmos. Meas. Tech. 2021, 14, 6083–6100. [Google Scholar] [CrossRef]
  50. Herndon, S.; Jayne, J.; Zahniser, M.; Worsnop, D.; Knighton, B.; Alwine, E.; Lamb, B.; Zavala, M.; Nelson, D.; McManus, J.; et al. Characterization of Urban Pollutant Emission Fluxes and Ambient Concentration Distributions Using a Mobile Laboratory with Rapid Response Instrumentation. Faraday Discuss. 2005, 130, 327–339. [Google Scholar] [CrossRef]
  51. Hu, L.; Millet, D.B.; Baasandorj, M.; Griffis, T.J.; Turner, P.; Helmig, D.; Curtis, A.J.; Hueber, J. Isoprene Emissions and Impacts over an Ecological Transition Region in the US Upper Midwest Inferred from Tall Tower Measurements. J. Geophys. Res.-Atmos. 2015, 120, 3553–3571. [Google Scholar] [CrossRef]
  52. Kim, M.-G.; Lee, J.Y.; Kim, J.H.; Lee, H.E.; Cho, S.H.; Yu, J.U.; Kang, C.W.; Moon, K.W. Study of Chemical Substances Emitted during Paint Manufacturing through VOC Speciation. Atmosphere 2022, 13, 1245. [Google Scholar] [CrossRef]
  53. Hohaus, T.; Kuhn, U.; Andres, S.; Kaminski, M.; Rohrer, F.; Tillmann, R.; Wahner, A.; Wegener, R.; Yu, Z.; Kiendler-Scharr, A. A New Plant Chamber Facility, PLUS, Coupled to the Atmosphere Simulation Chamber SAPHIR. Atmos. Meas. Tech. 2016, 9, 1247–1259. [Google Scholar] [CrossRef]
  54. Yi, H.; Meng, L.; Wu, T.; Lauraguais, A.; Coeur, C.; Tomas, A.; Fu, H.; Gao, X.; Chen, W. Absolute Determination of Chemical Kinetic Rate Constants by Optical Tracking the Reaction on the Second Timescale Using Cavity-Enhanced Absorption Spectroscopy. Phys. Chem. Chem. Phys. 2022, 24, 7396–7404. [Google Scholar] [CrossRef] [PubMed]
  55. Cai, M.; Ren, Y.; Gibilisco, R.G.; Grosselin, B.; McGillen, M.R.; Xue, C.; Mellouki, A.; Daele, V. Ambient BTEX Concentrations during the COVID-19 Lockdown in a Peri-Urban Environment (Orleans, France). Atmosphere 2022, 13, 10. [Google Scholar] [CrossRef]
  56. France, J.L.; Bateson, P.; Dominutti, P.; Alen, G.; Andrews, S.; Bauguitte, S.; Coleman, M.; Lachlan-Cope, T.; Fisher, R.E.; Huang, L.; et al. Facility Level Measurement of Offshore Oil and Gas Installations from a Medium-Sized Airborne Platform: Method Development for Quantification and Source Identification of Methane Emissions. Atmos. Meas. Tech. 2021, 14, 71–88. [Google Scholar] [CrossRef]
  57. Cheng, W.-H.; Lin, C.-H.; Yuan, C.-S. VOC Sampler on a Drone Assisting in Tracing the Potential Sources by a Dispersion Model-Case Study of Industrial Emissions. Aerosol Air Qual. Res. 2023, 23, 71–88. [Google Scholar] [CrossRef]
  58. Li, Y.; Liu, B.; Ye, J.; Jia, T.; Khuzestani, R.B.; Sun, J.Y.; Cheng, X.; Zheng, Y.; Li, X.; Wu, C.; et al. Unmanned Aerial Vehicle Measurements of Volatile Organic Compounds over a Subtropical Forest in China and Implications for Emission Heterogeneity. ACS Earth Space Chem. 2021, 5, 247–256. [Google Scholar] [CrossRef]
  59. Hopkins, J.R.; Boddy, R.K.; Hamilton, J.F.; Lee, J.D.; Lewis, A.C.; Purvis, R.M.; Watson, N.J. An Observational Case Study of Ozone and Precursors Inflow to South East England during an Anticyclone. J. Environ. Monit. 2006, 8, 1195–1202. [Google Scholar] [CrossRef]
  60. Jin, X.; Fiore, A.M.; Murray, L.T.; Valin, L.C.; Lamsal, L.N.; Duncan, B.; Folkert Boersma, K.; De Smedt, I.; Abad, G.G.; Chance, K.; et al. Evaluating a Space-Based Indicator of Surface Ozone-NOx-VOC Sensitivity Over Midlatitude Source Regions and Application to Decadal Trends. J. Geophys. Res.-Atmos. 2017, 122, 10231–10253. [Google Scholar] [CrossRef]
  61. Qi, H.; Duan, W.; Cheng, S.; Huang, Z.; Hou, X. Research on Regional Ozone Prevention and Control Strategies in Eastern China Based on Pollutant Transport Network and FNR. Sci. Total Environ. 2024, 918, 170486. [Google Scholar] [CrossRef]
  62. Chen, K.; Wei, W.; Zhou, C.; Chen, S.; Wang, X.; Cheng, S. Spatiotemporal Mapping of Atmospheric Aldehydes over Beijing in Summer during 2019-2021 via Their Source Apportionment Study. Atmos. Res. 2023, 288, 106723. [Google Scholar] [CrossRef]
  63. Bauwens, M.; Stavrakou, T.; Müller, J.; De Smedt, I.; Van Roozendael, M.; van der Werf, G.; Wiedinmyer, C.; Kaiser, J.; Sindelarova, K.; Guenther, A. Nine Years of Global Hydrocarbon Emissions Based on Source Inversion of OMI Formaldehyde Observations. Atmos. Chem. Phys. 2016, 16, 10133–10158. [Google Scholar] [CrossRef]
  64. Barrese, E.; Valentini, M.; Scarpelli, M.; Samele, P.; Malacaria, L.; D’Amico, F.; Lo Feudo, T. Assessment of Formaldehyde’s Impact on Indoor Environments and Human Health via the Integration of Satellite Tropospheric Total Columns and Outdoor Ground Sensors. Sustainability 2024, 16, 9669. [Google Scholar] [CrossRef]
  65. Barret, B.; Medina, P.; Brett, N.; Pohorsky, R.; Law, K.S.; Bekki, S.; Fochesatto, G.J.; Schmale, J.; Arnold, S.R.; Baccarini, A.; et al. Surface Distributions and Vertical Profiles of Trace Gases (CO, O3, NO, NO2) in the Arctic Wintertime Boundary Layer Using Low-Cost Sensors during ALPACA-2022. Atmos. Meas. Tech. 2025, 18, 1163–1184. [Google Scholar] [CrossRef]
  66. Ren, J.; Guo, F.; Xie, S. Diagnosing Ozone-NOx-VOC Sensitivity and Revealing Causes of Ozoneincreases in China Based on 2013-2021 Satellite Retrievals. Atmos. Chem. Phys. 2022, 22, 15035–15047. [Google Scholar] [CrossRef]
  67. Alvarado, L.M.A.; Richter, A.; Vrekoussis, M.; Hilboll, A.; Hedegaard, A.B.K.; Schneising, O.; Burrows, J.P. Unexpected Long-Range Transport of Glyoxal and Formaldehyde Observed from the Copernicus Sentinel-5 Precursor Satellite during the 2018 Canadian Wildfires. Atmos. Chem. Phys. 2020, 20, 2057–2072. [Google Scholar] [CrossRef]
  68. Moradi, A.; Abera, T.A.; Shayle, E.S.; Muhammed, M.A.; Zeuss, D. Modeling Long-Term Dynamics of Biogenic Volatile Organic Compounds (BVOCs) in Germany Based on Major Precursors. Environ. Sci. Technol. 2025, 59, 4587–4596. [Google Scholar] [CrossRef]
  69. Acdan, J.J.M.; Pierce, R.B.; Dickens, A.F.; Adelman, Z.; Nergui, T. Examining TROPOMI Formaldehyde to Nitrogen Dioxide Ratios in the Lake Michigan Region: Implications for Ozone Exceedances. Atmos. Chem. Phys. 2023, 23, 7867–7885. [Google Scholar] [CrossRef]
  70. Gomez-Amo, J.L.; Estelles, V.; Pedros, R.; Utrillas, M.P.; Sobrino, J.A.; Martinez-Lozano, J.A. Column Aerosol Characterization in a Semi-Arid Region around Marrakech during the WATERMED 2003 Campaign. Int. J. Remote Sens. 2008, 29, 5013–5027. [Google Scholar] [CrossRef]
  71. Wang, X.; Zhang, Y.; Hu, Y.; Zhou, W.; Lu, K.; Zhong, L.; Zeng, L.; Shao, M.; Hu, M.; Russell, A.G. Process Analysis and Sensitivity Study of Regional Ozone Formation over the Pearl River Delta, China, during the PRIDE-PRD2004 Campaign Using the Community Multiscale Air Quality Modeling System. Atmos. Chem. Phys. 2010, 10, 4423–4437. [Google Scholar] [CrossRef]
  72. Li, K.; Wang, X.; Li, L.; Wang, J.; Liu, Y.; Cheng, X.; Xu, B.; Wang, X.; Yan, P.; Li, S.; et al. Large Variability of O3-Precursor Relationship during Severe Ozone Polluted Period in an Industry-Driven Cluster City (Zibo) of North China Plain. J. Clean. Prod. 2021, 316, 128252. [Google Scholar] [CrossRef]
  73. Cheng, H.R.; Guo, H.; Saunders, S.M.; Lam, S.H.M.; Jiang, F.; Wang, X.M.; Simpson, I.J.; Blake, D.R.; Louie, P.K.K.; Wang, T.J. Assessing Photochemical Ozone Formation in the Pearl River Delta with a Photochemical Trajectory Model. Atmos. Environ. 2010, 44, 4199–4208. [Google Scholar] [CrossRef]
  74. Ling, Z.H.; Guo, H.; Cheng, H.R.; Yu, Y.F. Sources of Ambient Volatile Organic Compounds and Their Contributions to Photochemical Ozone Formation at a Site in the Pearl River Delta, Southern China. Environ. Pollut. 2011, 159, 2310–2319. [Google Scholar] [CrossRef]
  75. Zheng, J.; Shao, M.; Che, W.; Zhang, L.; Zhong, L.; Zhang, Y.; Streets, D. Speciated VOC Emission Inventory and Spatial Patterns of Ozone Formation Potential in the Pearl River Delta, China. Environ. Sci. Technol. 2009, 43, 8580–8586. [Google Scholar] [CrossRef] [PubMed]
  76. Tie, X.; Geng, F.; Guenther, A.; Cao, J.; Greenberg, J.; Zhang, R.; Apel, E.; Li, G.; Weinheimer, A.; Chen, J.; et al. Megacity Impacts on Regional Ozone Formation: Observations and WRF-Chem Modeling for the MIRAGE-Shanghai Field Campaign. Atmos. Chem. Phys. 2013, 13, 5655–5669. [Google Scholar] [CrossRef]
  77. Yin, M.; Zhang, X.; Li, Y.; Fan, K.; Li, H.; Gao, R.; Li, J. Ambient Ozone Pollution at a Coal Chemical Industry City in the Border of Loess Plateau and Mu Us Desert: Characteristics, Sensitivity Analysis and Control Strategies. PeerJ 2021, 9, e11322. [Google Scholar] [CrossRef] [PubMed]
  78. Xing, J.; Zheng, S.; Li, S.; Huang, L.; Wang, X.; Wang, S.; Liu, C.; Jang, C.; Zhu, Y.; Zhang, J.; et al. Mimicking Atmospheric Photochemical Modeling with a Deep Neural Network. Atmos. Res. 2022, 265, 105919. [Google Scholar] [CrossRef]
  79. Emmons, L.; Hess, P.; Klonecki, A.; Tie, X.; Horowitz, L.; Lamarque, J.; Kinnison, D.; Brasseur, G.; Atlas, E.; Browell, E.; et al. Budget of Tropospheric Ozone during TOPSE from Two Chemical Transport Models. J. Geophys. Res.-Atmos. 2003, 108. [Google Scholar] [CrossRef]
  80. Christian, K.E.; Brune, W.H.; Mao, J. Global Sensitivity Analysis of the GEOS-Chem Chemical Transport Model: Ozone and Hydrogen Oxides during ARCTAS (2008). Atmos. Chem. Phys. 2017, 17, 3769–3784. [Google Scholar] [CrossRef]
  81. Lu, X.; Cao, L.; Ding, H.; Gao, M.; Meng, X. The Relationship between the Altitude and the Simulations of Ozone and NO2 by WRF-Chem for the Tibetan Plateau. Atmos. Environ. 2022, 274, 118981. [Google Scholar] [CrossRef]
  82. Wang, J.; Wang, H.; Zhang, C.; Wang, Y.; Zhang, Y.; Zhou, J.; Xu, W.; Whalley, L.K.; Dyson, J.E.; Slater, E.J.; et al. Ozone Production Underestimation Over the Tibetan Plateau: The Role of NOx and OVOCs Modeling Uncertainties. J. Geophys. Res.-Atmos. 2025, 130, e2025JD043321. [Google Scholar] [CrossRef]
  83. Chou, Y.; Huang, Q.; Zhang, Y.; Luo, J.; Wang, M.; Liao, H.; Zhang, Y.; Bai, Z. Impacts of Deep Boundary Layer on Near-Surface Ozone Concentration over the Tibetan Plateau. Atmos. Environ. 2023, 294, 119532. [Google Scholar] [CrossRef]
  84. Wild, O.; Prather, M.J. Global Tropospheric Ozone Modeling: Quantifying Errors Due to Grid Resolution. J. Geophys. Res.-Atmos. 2006, 111. [Google Scholar] [CrossRef]
  85. Yu, K.; Jacob, D.J.; Fisher, J.A.; Kim, P.S.; Marais, E.A.; Miller, C.C.; Travis, K.R.; Zhu, L.; Yantosca, R.M.; Sulprizio, M.P.; et al. Sensitivity to Grid Resolution in the Ability of a Chemical Transport Model to Simulate Observed Oxidant Chemistry under High-Isoprene Conditions. Atmos. Chem. Phys. 2016, 16, 4369–4378. [Google Scholar] [CrossRef]
  86. Liu, T.; Hong, Y.; Li, M.; Xu, L.; Chen, J.; Bian, Y.; Yang, C.; Dan, Y.; Zhang, Y.; Xue, L.; et al. Atmospheric Oxidation Capacity and Ozone Pollution Mechanism in a Coastal City of Southeastern China: Analysis of a Typical Photochemical Episode by an Observation-Based Model. Atmos. Chem. Phys. 2022, 22, 2173–2190. [Google Scholar] [CrossRef]
  87. Zhu, S.; Poetzscher, J.; Shen, J.; Wang, S.; Wang, P.; Zhang, H. Comprehensive Insights Into O3 Changes During He COVID-19 From O3 Formation Regime and Atmospheric Oxidation Capacity. Geophys. Res. Lett. 2021, 48, e2021GL093668. [Google Scholar] [CrossRef] [PubMed]
  88. Li, Z.; Liu, T.; Zhang, H.; Wang, X.; Zhang, J.; Qin, Z.; Zhu, C. Sensitivity Analysis of Ozone Formation and Source Apportionment of VOCs in a Typical Industrial City in the Yangtze River Delta Region during Summer. Atmos. Pollut. Res. 2025, 16, 102424. [Google Scholar] [CrossRef]
  89. Xu, D.; Yuan, Z.; Wang, M.; Zhao, K.; Liu, X.; Duan, Y.; Fu, Q.; Wang, Q.; Jing, S.; Wang, H.; et al. Multi-Factor Reconciliation of Discrepancies in Ozone-Precursor Sensitivity Retrieved from Observation- and Emission-Based Models. Environ. Int. 2022, 158, 106952. [Google Scholar] [CrossRef]
  90. Labrador, L.; von Kuhlmann, R.; Lawrence, M. The Effects of Lightning-Produced NOx and Its Vertical Distribution on Atmospheric Chemistry:: Sensitivity Simulations with MATCH-MPIC. Atmos. Chem. Phys. 2005, 5, 1815–1834. [Google Scholar] [CrossRef]
  91. Ito, A.; Sillman, S.; Penner, J.E. Global Chemical Transport Model Study of Ozone Response to Changes in Chemical Kinetics and Biogenic Volatile Organic Compounds Emissions Due to Increasing Temperatures: Sensitivities to Isoprene Nitrate Chemistry and Grid Resolution. J. Geophys. Res.-Atmos. 2009, 114. [Google Scholar] [CrossRef]
  92. Lack, D.; Tie, X.; Bofinger, N.; Wiegand, A.; Madronich, S. Seasonal Variability of Secondary Organic Aerosol: A Global Modeling Study. J. Geophys. Res.-Atmos. 2004, 109. [Google Scholar] [CrossRef]
  93. Richards, N.A.D.; Arnold, S.R.; Chipperfield, M.P.; Miles, G.; Rap, A.; Siddans, R.; Monks, S.A.; Hollaway, M.J. The Mediterranean Summertime Ozone Maximum: Global Emission Sensitivities and Radiative Impacts. Atmos. Chem. Phys. 2013, 13, 2331–2345. [Google Scholar] [CrossRef]
  94. Stanier, C.O.; Donahue, N.M.; Pandis, S.N. Parameterization of Secondary Organic Aerosol Mass Fractions from Smog Chamber Data. Atmos. Environ. 2008, 42, 2276–2299. [Google Scholar] [CrossRef]
  95. Wu, R.; Xie, S. Spatial Distribution of Ozone Formation in China Derived from Emissions of Speciated Volatile Organic Compounds. Environ. Sci. Technol. 2017, 51, 2574–2583. [Google Scholar] [CrossRef]
  96. Rawat, P.; Naja, M.; Rajwar, M.C.; Irie, H.; Lerot, C.; Kumar, M.; Lal, S. Long-Term Observations of NO2, SO2, HCHO, and CHOCHO over the Himalayan Foothills: Insights from MAX-DOAS, TROPOMI, and GOME-2. Atmos. Environ. 2024, 336, 120746. [Google Scholar] [CrossRef]
  97. Hu, F.; Xie, P.; Xu, J.; Tian, X.; Zhang, Z.; Lv, Y.; Zhang, Q.; Li, Y.; Liu, W. Mapping Regional Meteorological Processes to Ozone Variability in the North China Plain and the Yangtze River Delta, China. Environ. Sci. Technol. 2025, 59, 9632–9643. [Google Scholar] [CrossRef] [PubMed]
  98. Rezaei, R.; Naderalvojoud, B.; Gullu, G. A Comparative Study of Deep Learning Models on Tropospheric Ozone Forecasting Using Feature Engineering Approach. Atmosphere 2023, 14, 239. [Google Scholar] [CrossRef]
  99. Wu, C.; He, H.; Song, R.; Zhu, X.-H.; Peng, Z.; Fu, Q.; Pan, J. A Hybrid Deep Learning Model for Regional O3 and NO2 Concentrations Prediction Based on Spatiotemporal Dependencies in Air Quality Monitoring Network. Environ. Pollut. 2023, 320, 121075. [Google Scholar] [CrossRef]
  100. Yan, X.; Zuo, C.; Li, Z.; Chen, H.W.; Jiang, Y.; He, B.; Liu, H.; Chen, J.; Shi, W. Cooperative Simultaneous Inversion of Satellite-Based Real-Time PM2.5 and Ozone Levels Using an Improved Deep Learning Model with Attention Mechanism. Environ. Pollut. 2023, 327, 121509. [Google Scholar] [CrossRef] [PubMed]
  101. Chen, Y.; Fung, J.C.H.; Yuan, D.; Chen, W.; Fung, T.; Lu, X. Development of an Integrated Machine-Learning and Data Assimilation Framework for NOx Emission Inversion. Sci. Total Environ. 2023, 871, 161951. [Google Scholar] [CrossRef] [PubMed]
  102. Mu, X.; Wang, S.; Jiang, P.; Wang, B.; Wu, Y.; Zhu, L. Full-Coverage Spatiotemporal Estimation of Surface Ozone over China Based on a High-Efficiency Deep Learning Model. Int. J. Appl. Earth Obs. Geoinf. 2023, 118, 103284. [Google Scholar] [CrossRef]
  103. Ehteram, M.; Ahmed, A.N.; Khozani, Z.S.; El-Shafie, A. Graph Convolutional Network-Long Short Term Memory Neural Network-Multi Layer Perceptron- Gaussian Progress Regression Model: A New Deep Learning Model for Predicting Ozone Concertation. Atmos. Pollut. Res. 2023, 14, 101766. [Google Scholar] [CrossRef]
  104. Latif, S.D.; Lai, V.; Hahzaman, F.H.; Ahmed, A.N.; Huang, Y.F.; Birima, A.H.; El-Shafie, A. Ozone Concentration Forecasting Utilizing Leveraging of Regression Machine Learnings: A Case Study at Klang Valley, Malaysia. Results Eng. 2024, 21, 101872. [Google Scholar] [CrossRef]
  105. Handhayani, T. An Integrated Analysis of Air Pollution and Meteorological Conditions in Jakarta. Sci. Rep. 2023, 13, 5798. [Google Scholar] [CrossRef]
  106. Niu, M.; Zhang, Y.; Ren, Z. Deep Learning-Based PM2.5 Long Time-Series Prediction by Fusing Multisource Data-A Case Study of Beijing. Atmosphere 2023, 14, 340. [Google Scholar] [CrossRef]
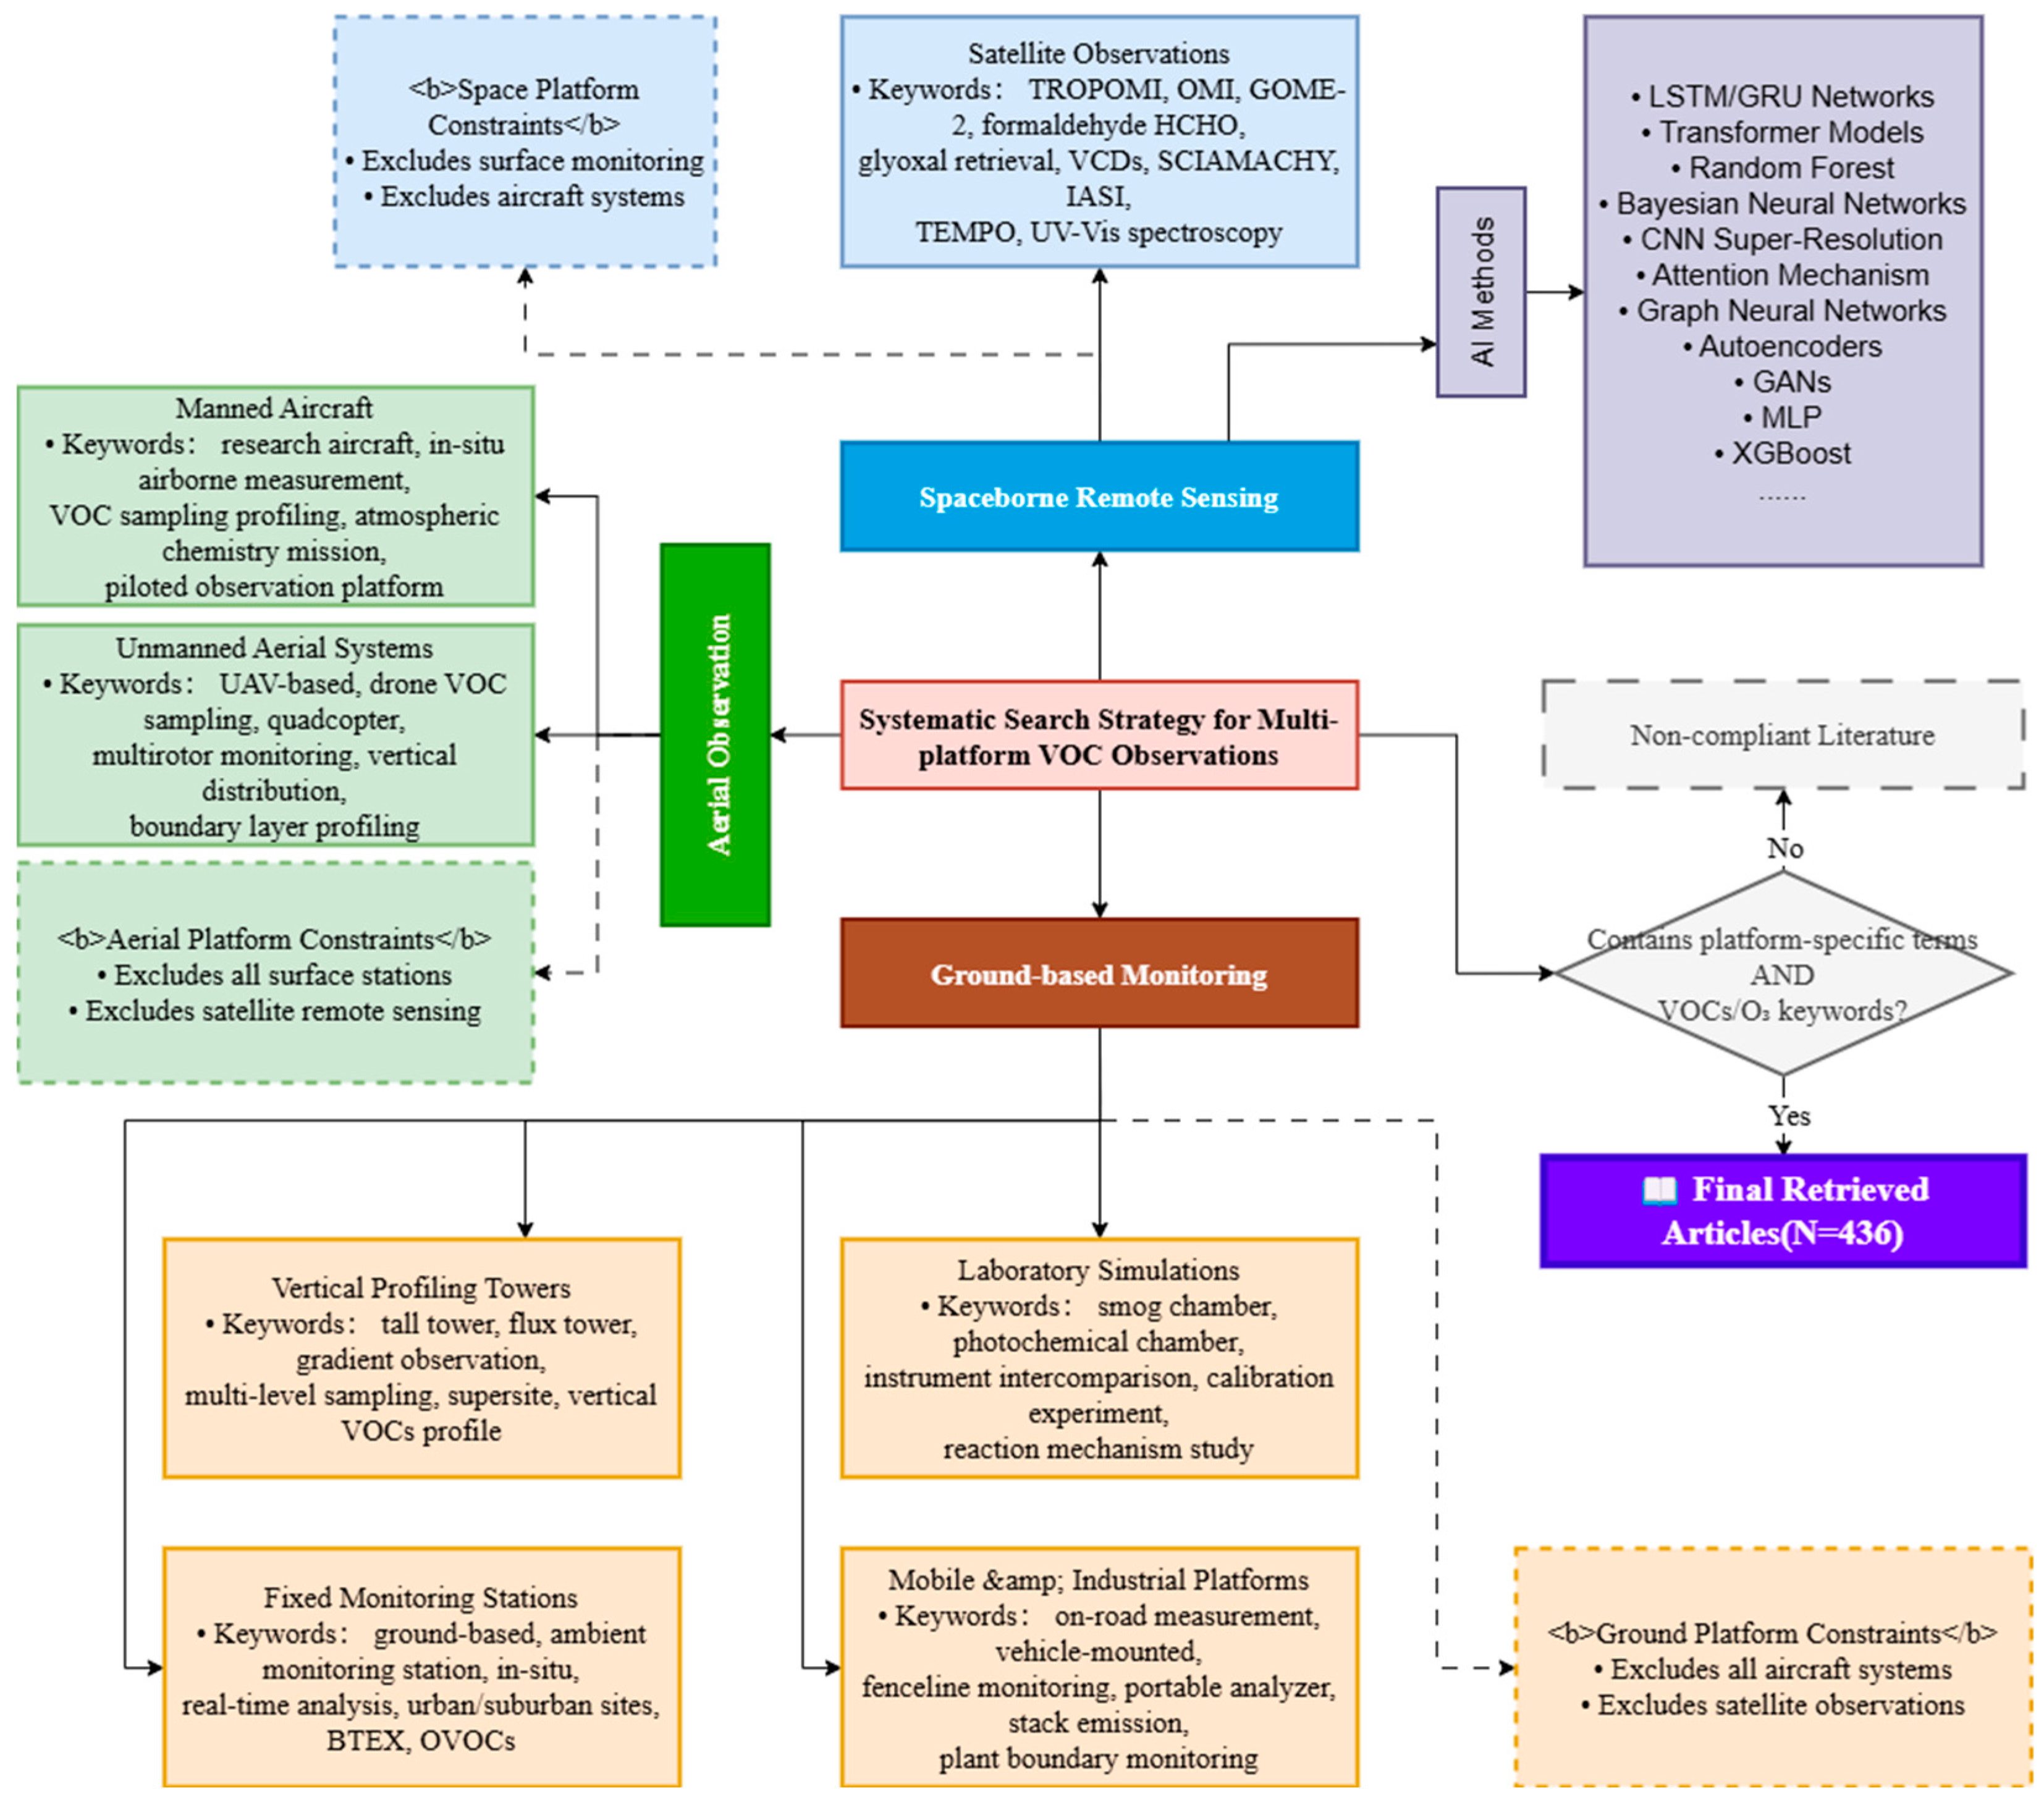
Figure 1. Platform-resolved literature search strategy targeting VOCs observations and O3 modeling studies. The solid lines represent direct connections between different platforms or methods, illustrating the flow of data or analysis processes, while the dashed lines indicate specific constraints or exclusions, defining the boundaries that each platform must adhere to during data collection and analysis within the search strategy.
Sustainability 17 07512 g001
Figure 2. Yearly evolution of publications and citations related to VOCs observation and ozone modeling.
Sustainability 17 07512 g002
Figure 3. Global distribution of research outputs on VOC observations and ozone modeling.
Sustainability 17 07512 g003
Figure 4. National distribution of publication volume and average citation impact in VOC–O3 research.
Sustainability 17 07512 g004
Figure 5. Keyword citation bursts reflecting temporal hotspots in VOC–O3 research from 1996–2024. The light blue bars represent the periods of citation bursts for each keyword, indicating significant research activity over time. The red segments highlight the peak years within those bursts, showing when the highest concentration of citations occurred, reflecting key moments of scholarly interest and focus.
Sustainability 17 07512 g005
Figure 6. Hierarchical mapping of VOCs observation modalities across ground, airborne, and satellite platforms.
Sustainability 17 07512 g006
Figure 7. Distribution of ground-based VOCs monitoring platforms by category in the reviewed literature.
Sustainability 17 07512 g007
Figure 9. Multi-Scale VOC sensing with manned aircraft and UAV platforms: (a) vertical profiling of OVOCs in biomass burning plumes [31]; (b) offshore source attribution via isotopic analysis [56]; (c) UAV-assisted industrial emission detection and dispersion modeling [57]; (d) UAV-based vertical and diurnal VOC gradient analysis in forest ecosystems, with air-mass origins classified as local/regional, medium-range, and long-range transport [58].
Sustainability 17 07512 g009
Figure 10. Frequency of satellite platforms appearing in the reviewed VOC-related literature.
Sustainability 17 07512 g010
Figure 11. Representative satellite-based studies illustrating VOC–O3 diagnostics, emission inversion, sensitivity evolution, and long-range transport: (a) Spatial regimes of ozone formation sensitivity from satellite-derived HCHO/NO2 ratios: (AF) surface FNR and (GL) column FNR under NOx-saturated/NOx-limited conditions, using regionally derived (first/third rows) and pixel-based (second/fourth rows) boundaries, over North America, Europe, and East Asia [60]; (b) top-down global NMVOC emission fluxes derived from nine-year inversion of OMI formaldehyde observations [63]; (c) temporal evolution of ozone–precursor sensitivity regimes in China during 2013–2021 from TROPOMI and OMI data [66]; (d) long-range atmospheric transport of OVOCs during the 2018 Canadian wildfires observed by Sentinel-5P TROPOMI [67].
Sustainability 17 07512 g011
Figure 12. Spatiotemporal variation and multi-year trends of high-percentile MDA8 ozone concentrations in China (2014–2021) [66].
Sustainability 17 07512 g012
Figure 13. Spatial distribution of glyoxal (CHOCHO), formaldehyde (HCHO), and FLEXPART-modeled transport tracers illustrating the long-range transport of VOC precursors during the 2018 Canadian wildfires [67].
Sustainability 17 07512 g013
Figure 14. Architecture of the sequential CNN-LSTM model for spatiotemporal ozone variability mapping [97].
Sustainability 17 07512 g014
Figure 15. Framework and core components of the SOPiNet model [100]. (a) Overall architecture for simultaneous PM2.5–O3 inversion; (b) multi-head attention mechanism; (c) example of temporal information extraction using historical pollutant data.
Sustainability 17 07512 g015
Figure 16. Workflow of the deep learning framework for full-coverage spatiotemporal estimation of surface ozone [102].
Sustainability 17 07512 g016
Table 1. Quantitative metrics of national contributions and collaboration in VOC–O3 research.
CountryFrequency of OccurrenceDegree (Collaboration)Betweenness CentralityCitation Half-Life (HL)
China100130.2220.5
USA61190.4121.5
Germany25150.2116.5
South Korea22160.3614.5
UK2080.1112.5
France16150.2513.5
Belgium13100.114.5
Italy1080.0811.5
Brazil94013.5
Finland61021.5
Spain570.0110.5
India580.1115.5
Table 2. Typological framework of VOCs observation platforms and their functional roles.
Observation TierPlatform CategorySpecific ConfigurationFunctional Role and Scientific Relevance
Ground-based PlatformFixed StationUrban background stationCaptures long-term urban-scale VOC trends, supporting pollution assessment and policy feedback [13].
Traffic stationEnables high-temporal-resolution analysis of vehicle emissions and their transient behavior [14].
Rural background stationRepresents regional transport background and secondary VOCs formation baselines [15].
Industrial site stationPrecisely identifies industrial sources and exposure zones, supporting emission verification [16].
Coastal stationReveals VOC flux and atmospheric transport dynamics at land–sea boundaries [17].
Mobile PlatformVehicle-based platformBuilds city-scale mobile monitoring networks for high-resolution spatial heterogeneity mapping [18].
Portable observation deviceProvides flexible and rapid monitoring tools for hotspot detection and point-source screening [19].
Point-Source MonitoringFactory fence-line monitoringEnables high-resolution monitoring of industrial boundary emissions for source strength estimation and accountability [20].
Chimney/stack emission sensorReal-time monitoring of stack outlets is essential for emission control and compliance auditing [21].
Source-oriented mobile surveyCombines mobile scanning with near-field detection to locate potential sources efficiently [2].
Flux/Gradient TowersFlux towerMeasures area VOC fluxes to support source–sink estimates and land–atmosphere exchange analysis [22].
Meteorological tower with gradient samplingConstructs vertical profiles to study VOC transport and dilution in the boundary layer [23].
Laboratory and Calibration PlatformPhotochemical smog chamberSimulates typical photochemical environments to study VOC oxidation chains and ozone formation [24].
Atmospheric simulation chamberControls initial conditions and reaction parameters to analyze secondary pollutant formation [25].
Instrument intercomparison laboratoryCompares monitoring methodologies to promote observational consistency and standardization [26].
Flow tube reactor/reaction cellUsed for single-pathway reactions and transient intermediate detection in mechanism validation [27].
Airborne PlatformUAV PlatformUAV vertical profilingCaptures VOC vertical distribution within the boundary layer, addressing near-surface observational gaps [28].
UAV remote sensing imagingProvides high-resolution areal data for dispersion modeling and spatial pattern recognition [29].
UAV source identificationRapidly detects concentration anomalies near sources, supporting emission tracing and incident response [30].
Manned Aircraft PlatformAircraft trajectory observationCollects high-frequency samples along flight paths to analyze long-range transport and evolution [31].
Aircraft flux observationMeasures VOC flux across transects to estimate regional budgets and boundary-layer dynamics [32].
Aircraft remote sensing imagingAcquires high-altitude wide-area imagery for model validation and pollution mapping [31].
Aircraft vertical profilingConstructs VOC profiles from the surface to mid-troposphere for model constraint and mechanism analysis [33].
Satellite-based PlatformSatellite PlatformCore Operational Satellites (e.g., TROPOMI, OMI, and IASI)Provide high-resolution global retrievals of VOC precursors (e.g., HCHO and NO2), forming the backbone for emission assessment, trend analysis, and atmospheric model assimilation [34,35,36].
Specialized Instruments (e.g., TES, GIIRS, EMI, MOPITT, and OMPS)Address advanced tasks such as vertical profiling, hyperspectral inversion, combustion source tracking, and supplementary column observations of trace gases [34,37,38,39].
Legacy Observation Missions (e.g., GOME, GOME-2, SCIAMACHY, and TOMS)Established foundational VOC and ozone remote sensing datasets, enabling cross-generational continuity and long-term atmospheric change analysis [40,41].
Table 3. Manned vs. UAV VOC observation platforms: comparative capabilities and applications.
DimensionManned AircraftUnmanned Aerial Vehicle (UAV)
Operational AltitudeUp to 15 km (troposphere)<500 m (near-surface, canopy level)
Typical Duration4–10 h (long-range campaigns)0.5–1 h (battery-limited)
Payload CapacityHigh (full-size GC–MS, PTR–MS, offline trays)Limited (mini samplers, sensors)
Spatial ResolutionModerate–high (regional plumes, stacked paths)Very high (local gradients, point sources)
Application FocusBiomass plumes, marine, regional transportIndustrial tracing, canopy fluxes, emergency response
StrengthsVertical profiling, long-distance coverageLow-altitude flexibility, near-field resolution
Table 4. Representative high-impact studies on OBM and CTM applications in tropospheric ozone research.
Article TitleYearAuthorsAffiliationsPublication
/Source Titles
Cited Reference CountContribution
Ozone production and hydrocarbon reactivity in Hong Kong, Southern China2007Zhang, J et al. [6].Hong Kong Polytechnic UniversityAtmospheric Chemistry and Physics129OBM trajectory analysis coupled with δCO/δNOy tracer diagnostics quantified that 50% of extreme O3 episodes (>100 ppbv) resulted from Guangdong-sourced precursors, while VOC-HONO constraints in the box model resolved 50–100% local photochemical amplification.
Global tropospheric ozone modeling: Quantifying errors due to grid resolution2006Wild, O et al. [84].Japan Agency for Marine-Earth Science and Technology (JAMSTEC)Journal of Geophysical Research: Atmospheres104CTM multi-resolution experiments (T21–T106) exposed artifactual O3 overproduction (up to +27% at 5.6°) from spatiotemporal smearing of NOx gradients, demanding sub-120 km grids for fidelity in nonlinear chemistry.
The effects of lightning-produced NOx and its vertical distribution on atmospheric chemistry: sensitivity simulations with MATCH-MPIC2005Labrador, LJ et al. [90].Max Planck SocietyAtmospheric Chemistry and Physics86MATCH-MPIC CTM parametrization established free-tropospheric lightning NOx injection (98%) as critical for accurate O3-OH-HNO3 covariance—elevating trans-Pacific NOy export by 24–43% versus convective schemes.
Atmospheric oxidation capacity and ozone pollution mechanism in a coastal city of southeastern China: analysis of a typical photochemical episode by an observation-based model2022Liu, TT et al. [86].Chinese Academy of SciencesAtmospheric Chemistry and Physics79OBM-MCM radical tracking decoupled daytime/nighttime AOC drivers (HONO: 33% ROx initiation), with CTM sensitivity runs confirming VOC-limited O3 suppression under suppressed NOx scenarios.
Global chemical transport model study of ozone response to changes in chemical kinetics and biogenic volatile organic compounds emissions due to increasing temperatures: Sensitivities to isoprene nitrate chemistry and grid resolution2009Ito, A et al. [91].Japan Agency for Marine-Earth Science and Technology (JAMSTEC)Journal of Geophysical Research: Atmospheres74CTM-simulated ΣANs-O3 correlations demonstrated that NOx recycling parametrization governs BVOC–O3 climate sensitivity as profoundly as grid resolution (+40 Tg burden uncertainty).
Seasonal variability of secondary organic aerosol: A global modeling study2004Lack, DA et al. [92].Queensland University of Technology (QUT)Journal of Geophysical Research: Atmospheres71CTM intercomparison (bulk-yield vs. partitioning algorithms) exposed oxidant-driven SOA biases over biomass-burning regions, reducing global flux uncertainty from 39% to mechanistically resolved regimes.
The Mediterranean summertime ozone maximum: global emission sensitivities and radiative impacts2013Richards, NAD et al. [93].University of LeedsAtmospheric Chemistry and Physics67TOMCAT CTM emission-tagging isolated near-surface O3 sensitivity to local NOx (9× > global sources) versus Asian-sourced UT O3 radiative dominance—reconciling TES/GOME-2 column discrepancies.
Parameterization of secondary organic aerosol mass fractions from smog chamber data2008Stanier, CO et al. [94].University of IowaAtmospheric Environment59Derived CTM-ready surrogate-VOC basis set with fixed saturation concentrations (C = 0.1–103 μg/m3), eliminating enthalpy-driven volatility uncertainties in aerosol modules.
Sensitivity to grid resolution in the ability of a chemical transport model to simulate observed oxidant chemistry under high-isoprene conditions2016Yu, KR et al. [85].Harvard UniversityAtmospheric Chemistry and Physics48GEOS-Chem 0.25° simulations resolved mesoscale NOx-isoprene segregation, suppressing high-NOx pathway errors by 5% and rectifying SEAC4RS HCHO validation failures.
Comprehensive Insights Into O3 Changes During he COVID-19 From O3 Formation Regime and Atmospheric Oxidation Capacity2021Zhu, SQ et al. [87].Fudan UniversityGeophysical Research Letters48Source attribution CTM decoupled lockdown O3 surges into AOC-enhanced local chemistry (60%) vs. imported pollution, triggering OBM-validated VOC→NOx-limited transition.
Disclaimer/Publisher’s Note: The statements, opinions and data contained in all publications are solely those of the individual author(s) and contributor(s) and not of MDPI and/or the editor(s). MDPI and/or the editor(s) disclaim responsibility for any injury to people or property resulting from any ideas, methods, instructions or products referred to in the content.