1. Introduction
By the end of 2030, the use of renewable energy sources is projected to grow at an annual rate of 7.6% in meeting the world’s energy needs [
1]. Studies on solar energy are crucial for meeting humanity’s future energy needs, both globally and in every area where technology can be applied.
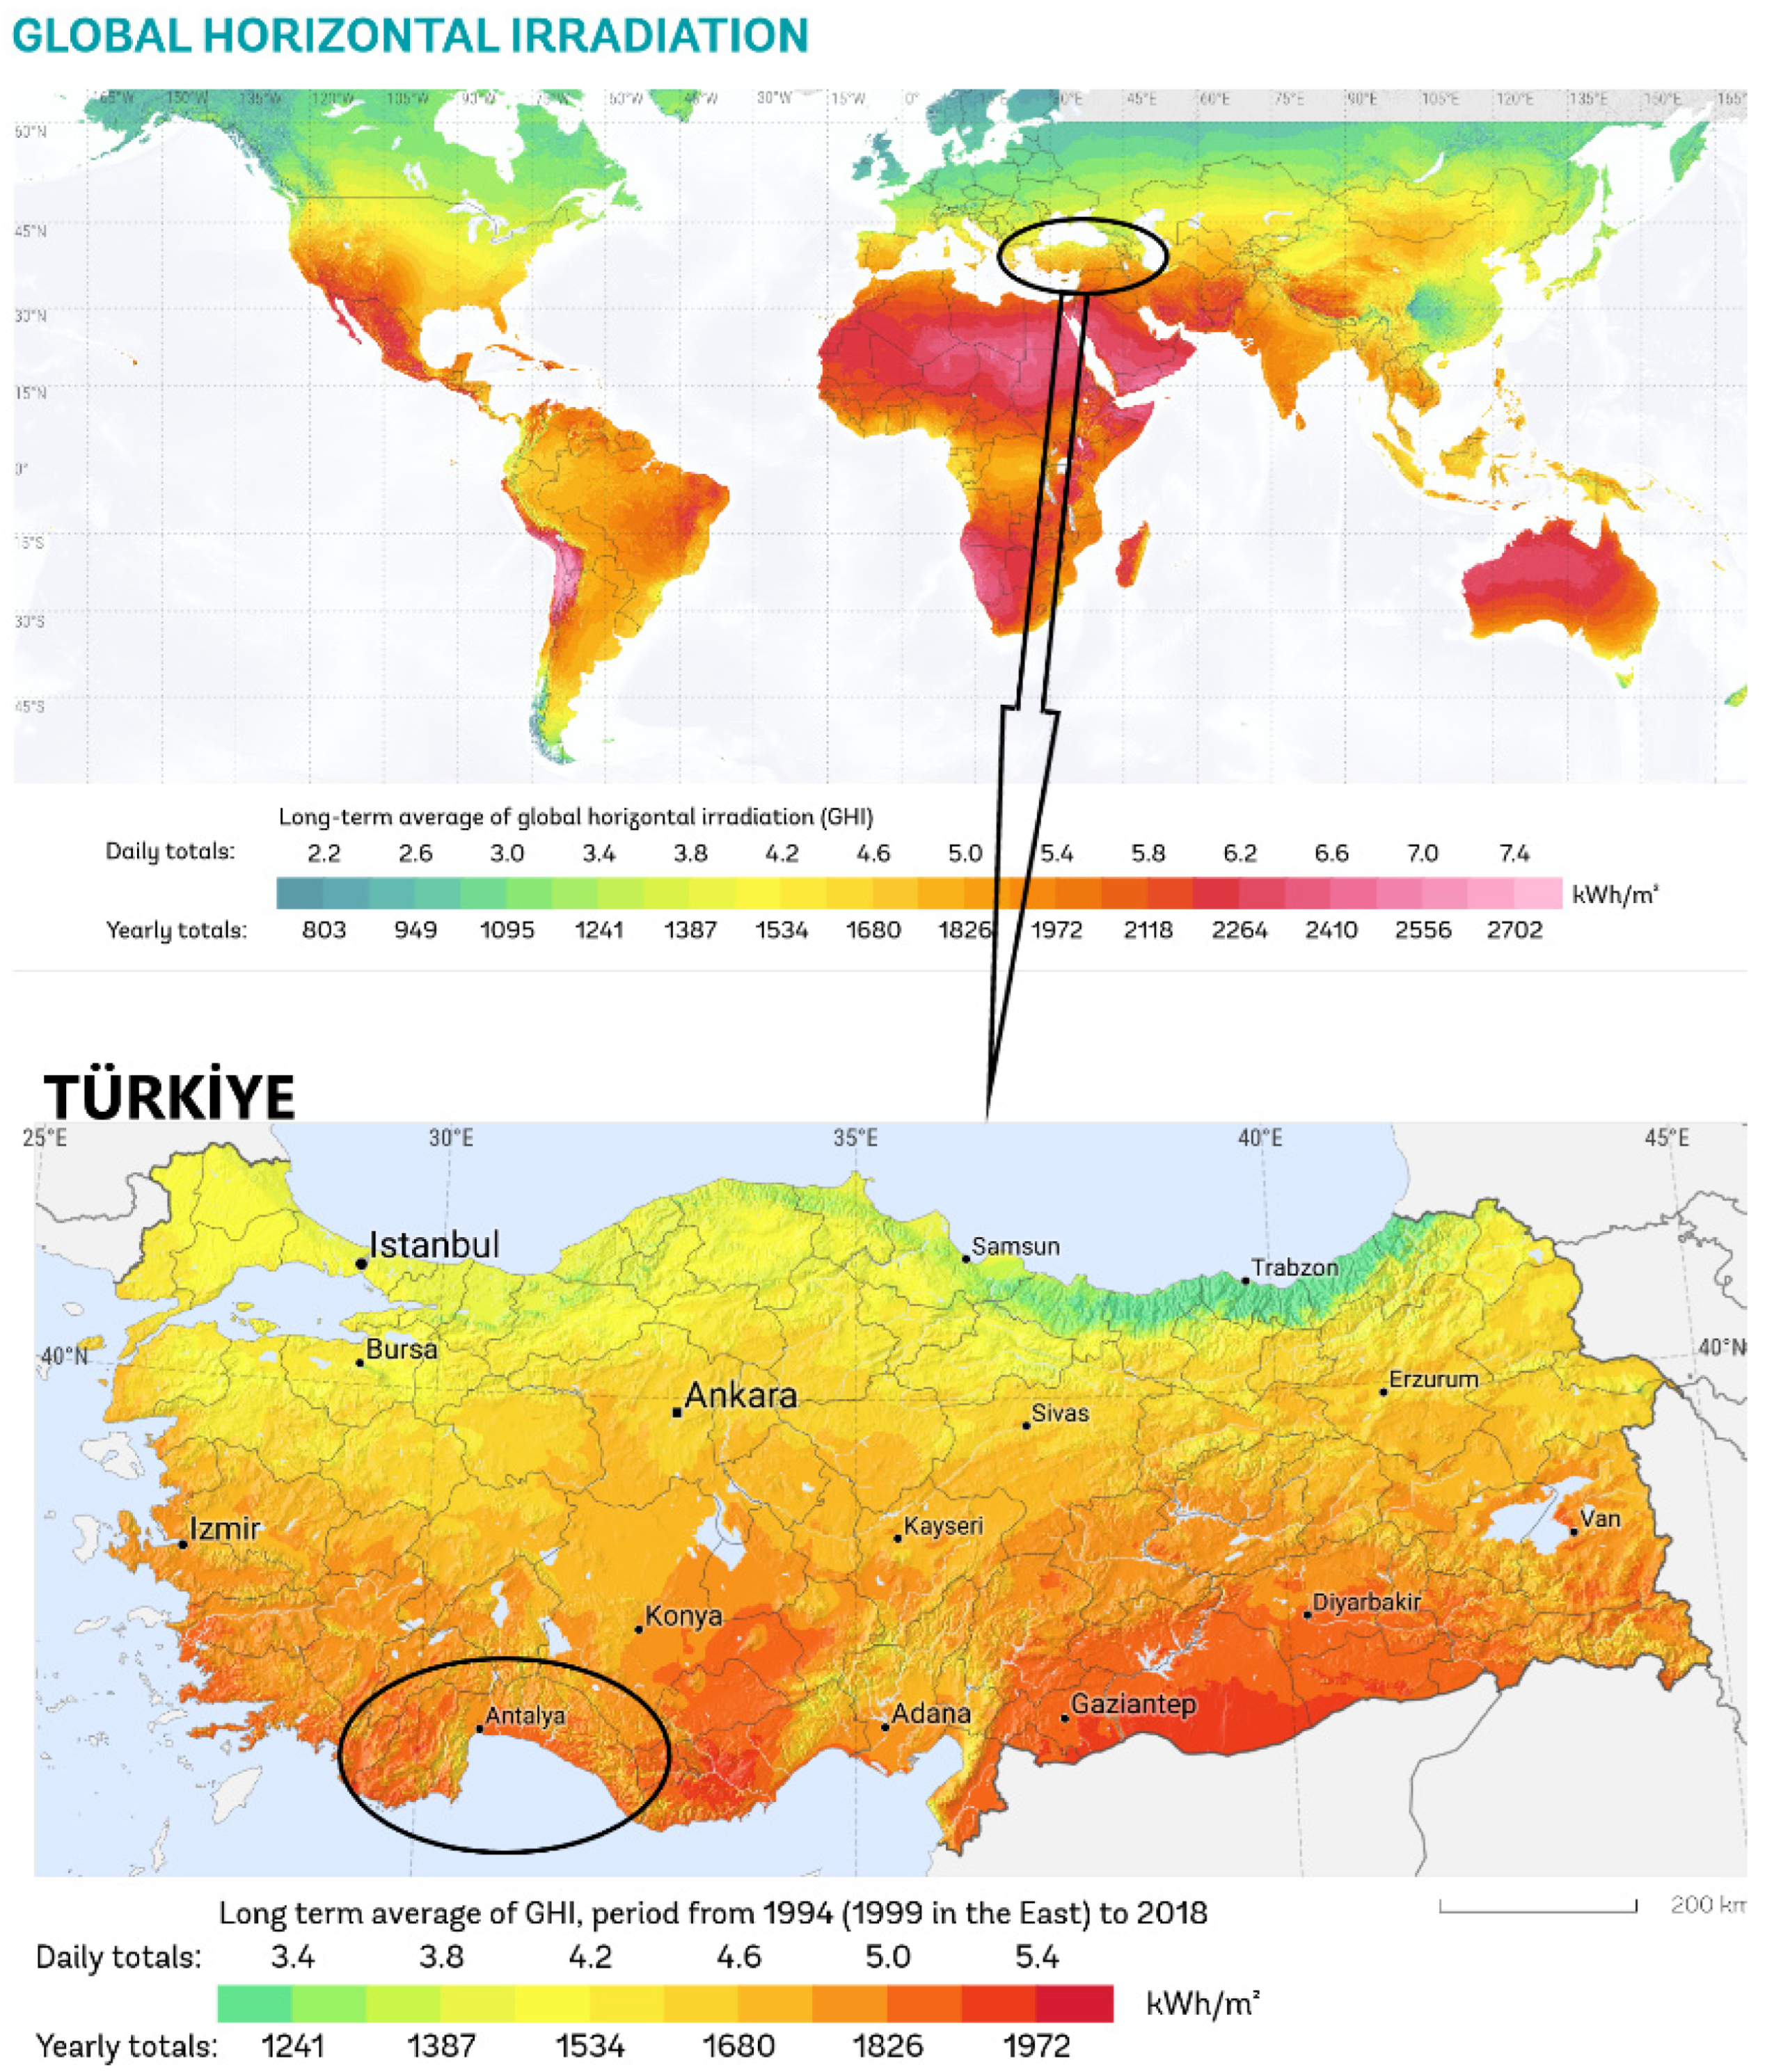
Figure 1 shows the most efficient regions in terms of the solar radiation potential provided by the sun to our world [
2]. Developed countries are investing heavily to capitalize on this potential. However, despite their great potential, investments in other regions such as Africa, South America, and Australia are lower [
3].
In recent years, the guiding influence of global climate policies has ensured that photovoltaic (PV) systems play a strategic role in the global energy transition. In particular, the decisions made at the COP26 Summit held in 2021 have accelerated the widespread adoption of PV technologies by reinforcing countries’ commitments to reduce greenhouse gas emissions and increase renewable energy use by 2030. The literature highlights that solar energy investments have accelerated following COP26, with PV systems emerging as a key solution for both energy security and carbon neutrality goals [
4,
5]. Additionally, financial incentives and policy frameworks facilitating the widespread adoption of PV technologies in developing countries have become more evident in the post-COP26 period [
6]. In this context, post-COP26 global policies underscore that PV systems are not limited to regional applications, such as those in Turkey, but are a fundamental building block of the global energy transition.
Türkiye is geographically located between 36° and 42° north latitudes and 26° and 45° east longitudes in the Northern Hemisphere, within the sunbelt, making it one of the best-positioned countries to harness the high energy potential of the sun due to its geographical structure. According to Türkiye’s solar energy potential, the annual average sunshine duration is 2741.07 h, and the average annual solar radiation value is 1527.46 kWh/m
2 [
7]. According to
Figure 1, the regions with the highest solar radiation values in Türkiye are the Southeastern Anatolia, Mediterranean, Eastern Anatolia, Central Anatolia, Aegean, Marmara, and Black Sea regions. These regions are geographically the best places to obtain the best results in terms of sunshine duration.
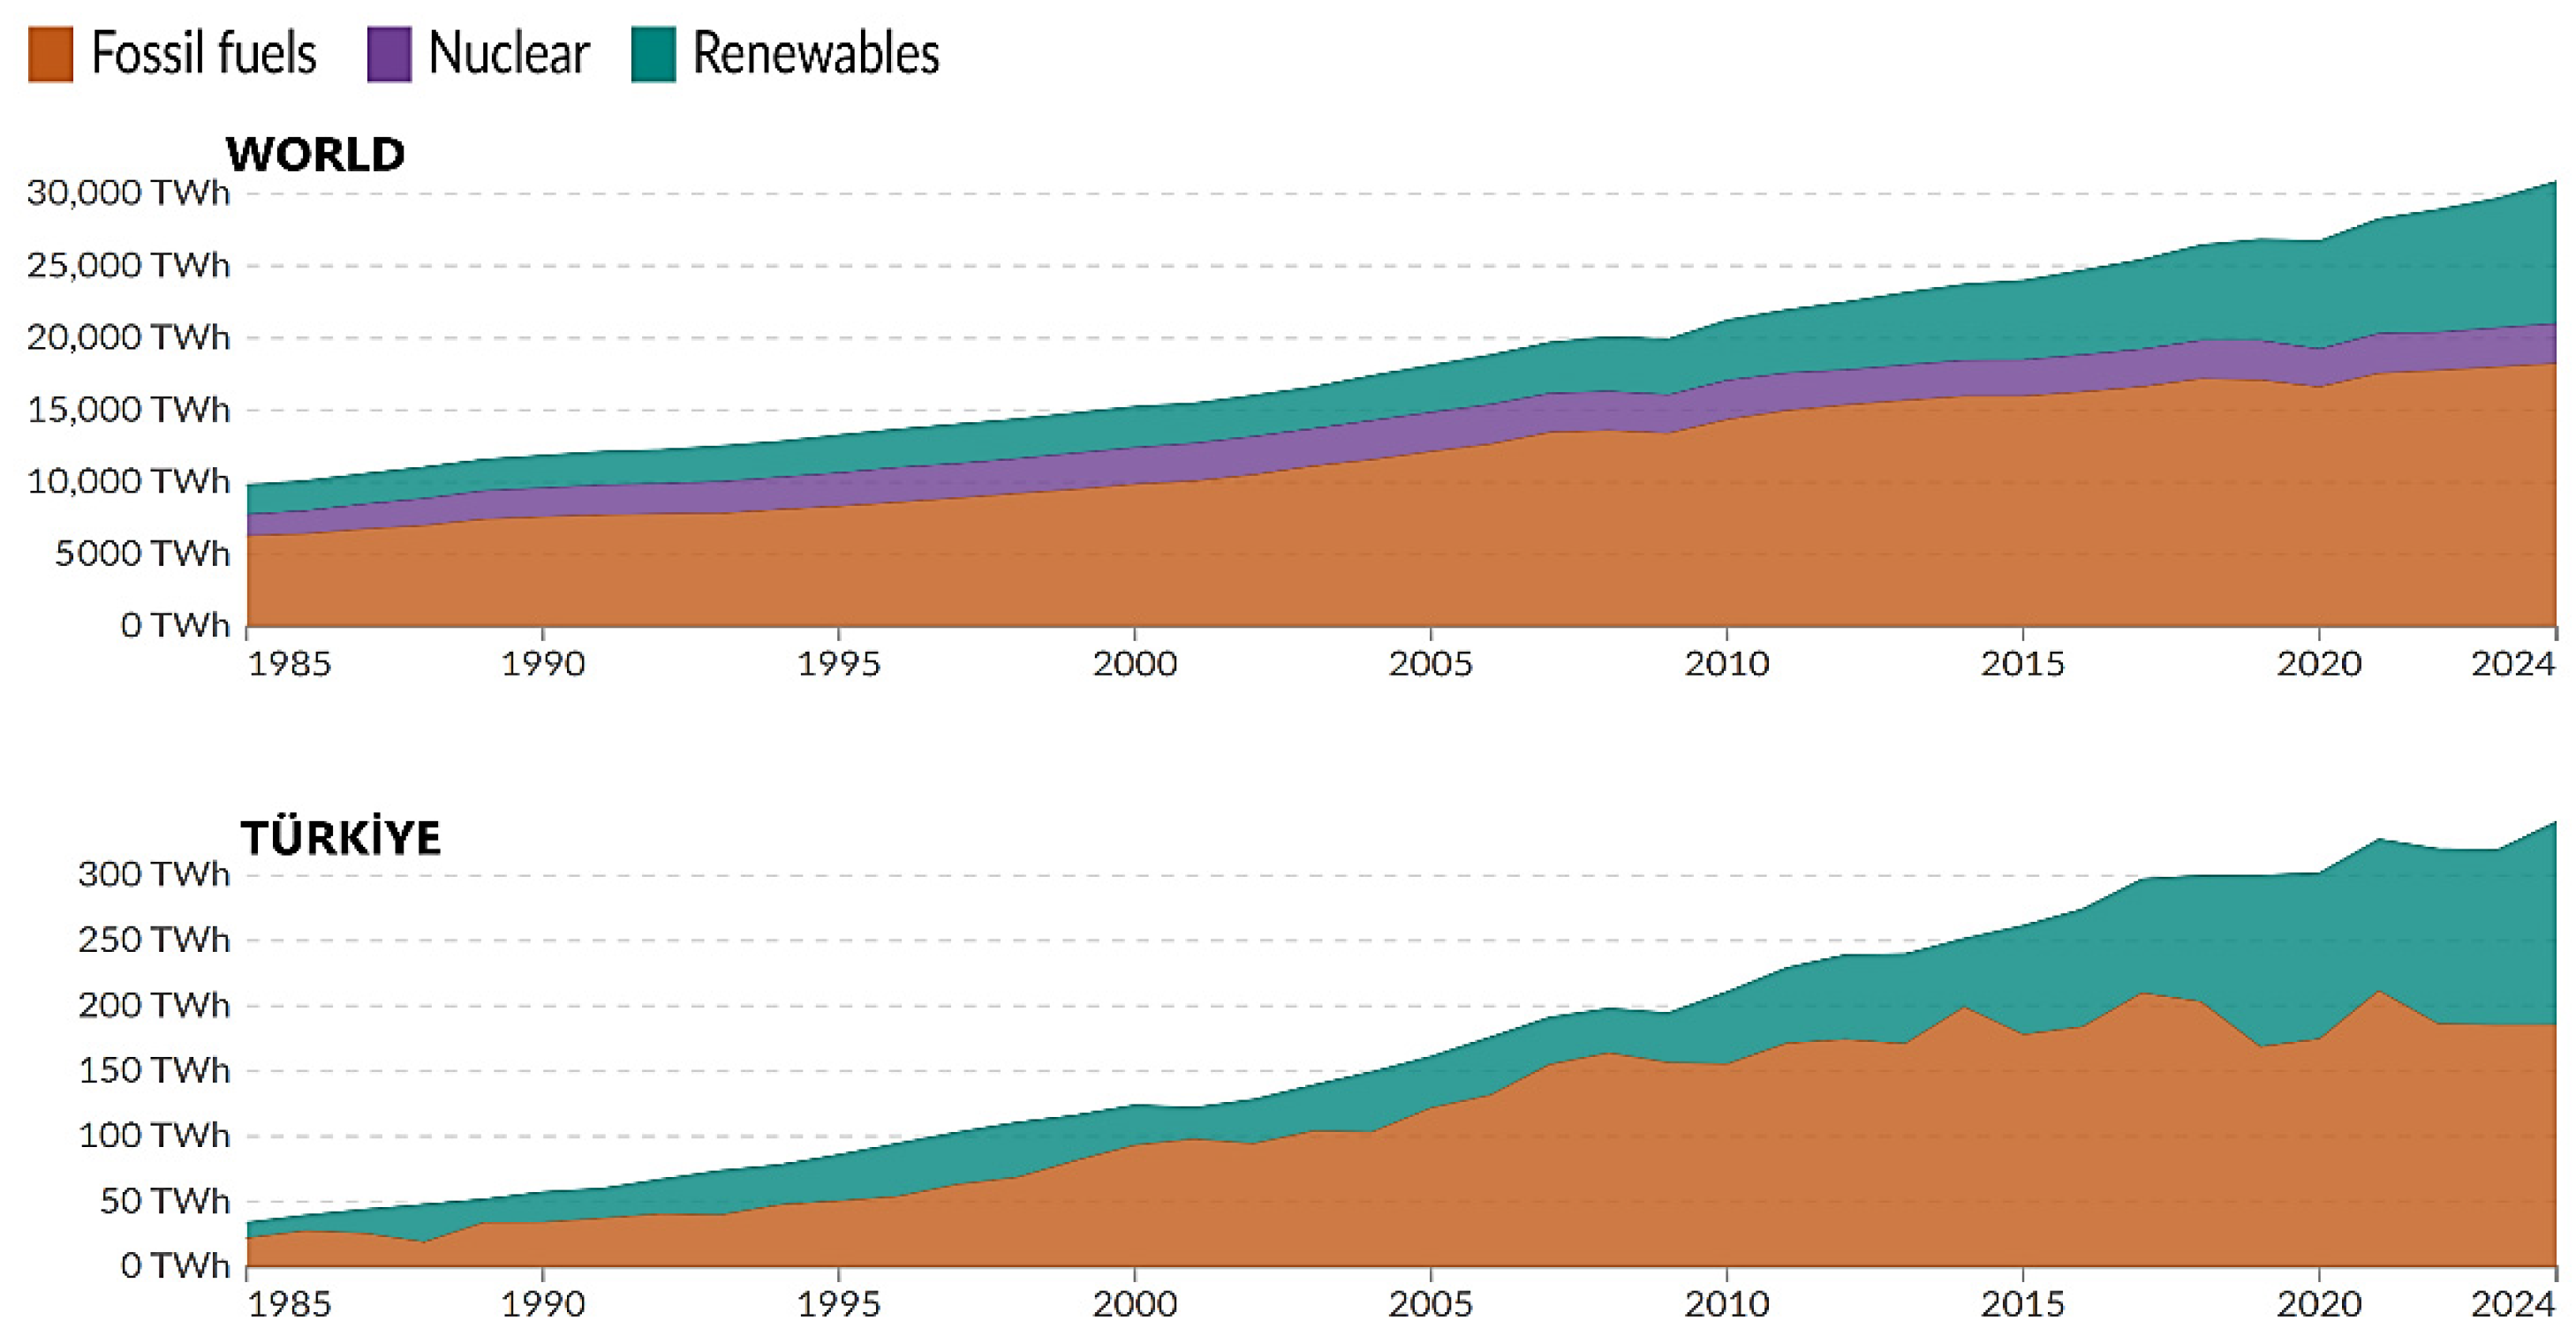
Figure 2 illustrates the sources of electricity demand worldwide and in Türkiye. Türkiye has a strategically advantageous geopolitical position in terms of solar energy. As of the end of July 2024, the distribution of Türkiye’s installed power capacity by source is as follows: 32.85% oil, 24.9% natural gas, 23.5% coal, 8.53% hydroelectric energy, 4.55% wind, 2.47% solar, and 2.8% other sources [
7]. The low share of solar energy in Türkiye’s current energy mix can be attributed to several factors, including its limited widespread use, high costs, long payback periods, and a lack of sufficient information among individuals regarding the performance and use of solar energy systems. Additionally, the rising costs of fossil fuel-based energy and the rapid advancement of renewable energy technologies are prompting people to turn to alternative energy sources. As a result, it is anticipated that the use of solar energy will continue to grow.
Flat-plate solar panels are the most commonly used type of solar energy system. Flat-plate solar panels (FSPs) are categorized into two groups: those that generate heat and those that generate electricity [
8]. Heat-generating FSPs are panels with air and water heaters. Heat-generating panels operate at average energy efficiency values ranging from 40% to 70%, depending on environmental conditions. Electricity-generating mono- or polycrystalline solar panels operate at an average efficiency of 15%. The most significant factors influencing FSP performance are the solar radiation value of the region where the panel is installed, the panel’s tilt angle, and environmental factors (temperature, relative humidity, and wind) [
9].
Türkiye’s solar radiation map (
Figure 1) shows that the average daily global solar radiation value in Trabzon province is 1210 kWh/m
2 per year, while in Antalya province, this value reaches 1840 kWh/m
2 per year. The solar radiation duration, radiation values, and the climatic conditions of the region where the solar panels are installed are important parameters that determine the thermal performance of the panels.
Several studies in the literature have investigated the effects of environmental parameters on the performance of various solar energy systems. Blal et al. investigated the effects of wind speed, relative humidity, ambient temperature, and solar radiation values on the performance of a PV panel in the Ardar province of Algeria. They obtained a model for the solar radiation value [
10]. Moghadasi et al. observed the energy performance of an SAH according to environmental parameters over seven days in Karaj, Iran. They selected air temperature, wind speed, relative humidity, and solar radiation values as environmental parameters [
11]. Ghodbane et al. investigated how the energy performance of a Fresnel solar reflector system changes with environmental temperature, wind speed, and radiation values [
12]. Keshtkar and colleagues investigated the effects of air temperature and solar radiation on the performance of a solar distillation system [
13]. Raj and Kirubakaran investigated the electrical energy performance of a photovoltaic thermal solar panel in Tamil Nadu, India, over 12 months. They investigated the effects of solar radiation on electrical energy [
14]. Zuo et al. investigated how wind speed affects the energy performance of a dish solar concentrator system in Beijing, China [
15]. Tuncer et al. designed a drying system using a photovoltaic thermal solar panel and investigated its energy performance by changing the roughness of the absorber plate. Additionally, they observed the effects of ambient temperature and solar radiation values on system performance [
16]. Keçebaş et al. investigated the energy performance of three different PV solar panels in both fixed and mobile designs, studying the effects of solar radiation on the panels’ energy performance [
17].
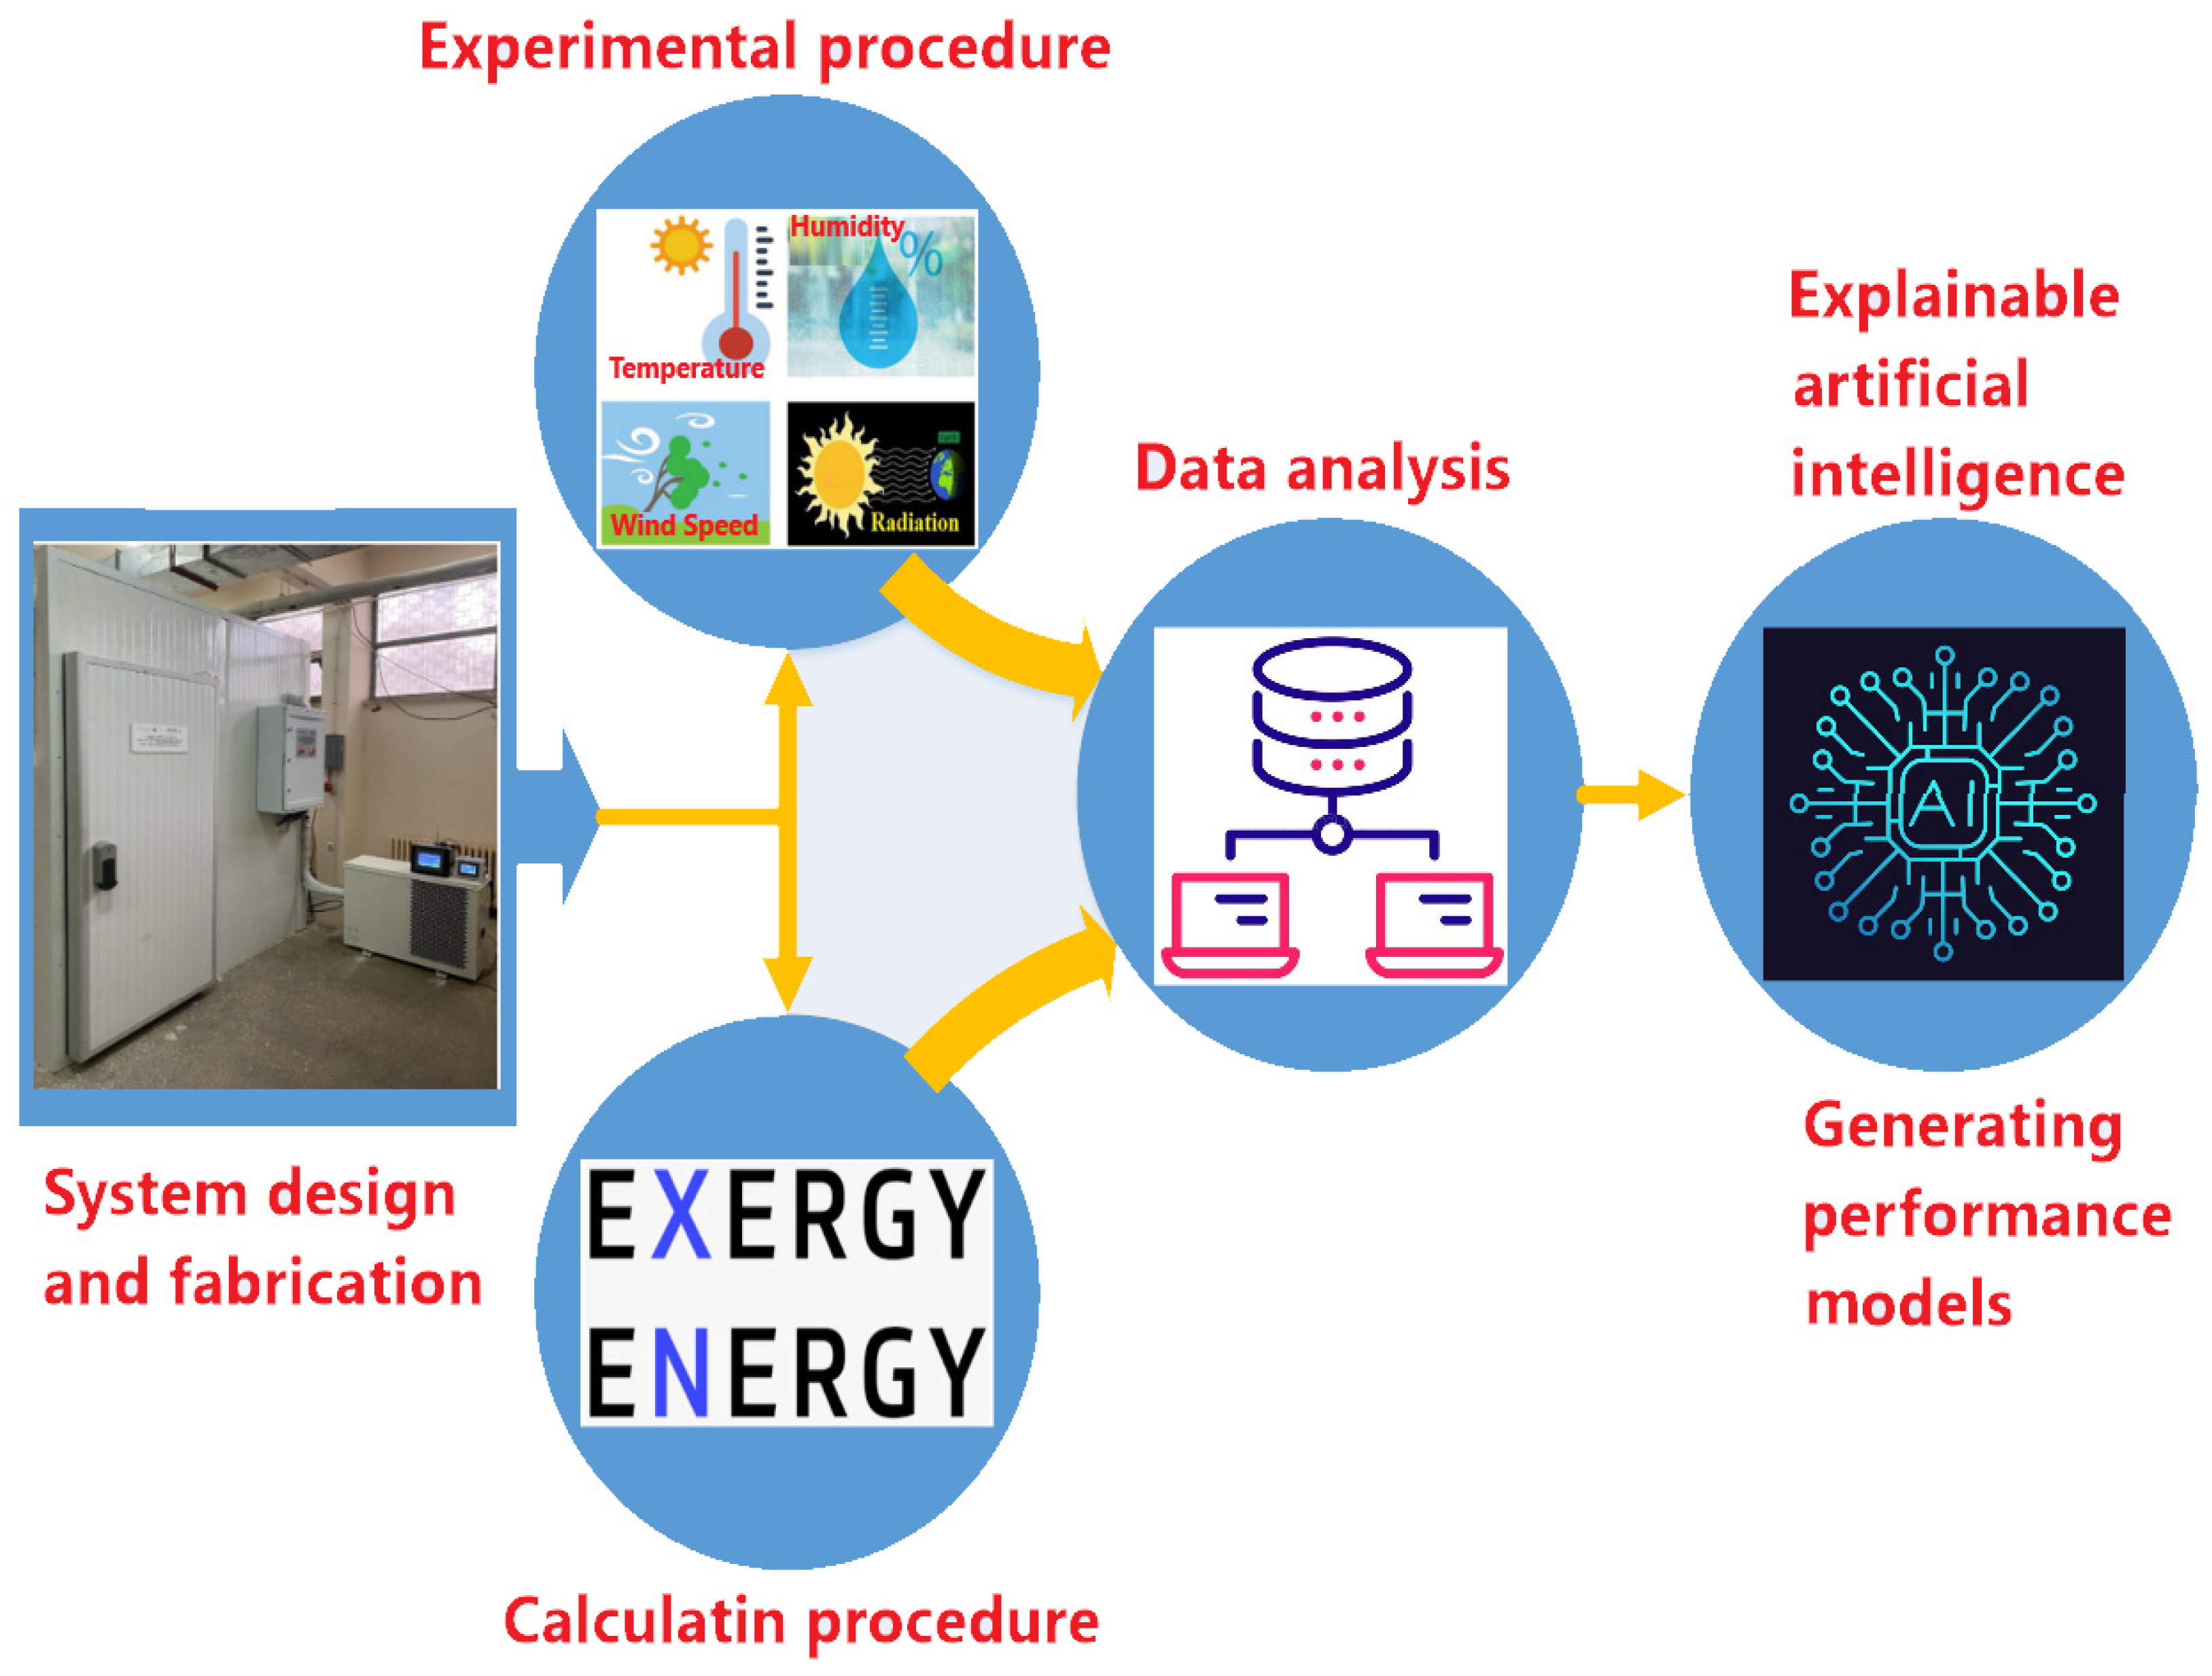
When studies related to FSPs are examined, it is observed that the energy performance value of solar panels is crucial in terms of panel usage and that research on the parameters affecting these performance values is vital for FSP usage. The design and production of a test chamber that allows for the observation of the performance of both air-cooled and PV solar panels under various climatic conditions has significantly enhanced the originality of this study. Within the scope of this study, a test chamber was designed and manufactured to obtain monthly average temperature, wind speed, relative humidity, and solar radiation values for different provinces in Antalya, Türkiye. The performance of PV and SAH systems was analyzed based on the climatic data obtained from this test chamber.
Various experiments were conducted in a laboratory environment to examine the performance of solar energy systems by obtaining different environmental parameters. In the literature, there are very few studies that have been conducted using a test chamber designed to provide different environmental conditions to examine the performance of solar energy systems. Generally, studies have been conducted using simulators for solar radiation values.
Ji et al. designed a test chamber to investigate the performance of a solar-assisted heat pump system under freezing conditions. They tested the system under various freezing conditions, with ambient temperatures ranging from 7 °C to −3 °C, relative humidity levels of 50%, 70%, and 90%, and solar radiation levels of 0 W/m
2 and 100 W/m
2. The climate control system used in the test chamber consisted of coolers, heaters, and a fixed fan that provided a controllable airflow. They used fixed halogen lamps as a solar simulator [
18]. Singh et al. developed a test system in a laboratory environment to investigate the thermohydraulic efficiency of two different air-cooled solar panels equipped with circular air jet arrays. To investigate the effect of ambient wind, they used a stationary fan and an air conditioner to maintain a constant ambient air temperature. They did not specify the temperature range over which the air conditioner varied the ambient air temperature. In the solar simulator, seven halogen tubes, each with a capacity of 500 W, were used. The simulator was positioned parallel to the panel’s surface [
19]. Sowmy et al. investigated the energy efficiency values of a wet flat-plate solar collector by obtaining different environmental conditions in a test chamber. The environmental conditions obtained in the test chamber were solar radiation, temperature, and air velocity. In the test chamber, they examined the performance of the solar collector using four different temperature values (20, 40, 60, 80 °C) obtained with heaters and three different air speed values (1, 2, 3 m/s) obtained with constant horizontal air blowers. Additionally, they used an electrically powered solar simulator to produce irradiance values ranging from 7 to 900 W/m
2 by ensuring that the irradiance values were directed perpendicular to the solar collector [
20]. Hosseini et al. investigated the effect of dew formation on the performance of two types of solar cells, monocrystalline silicon (mc-Si) and polycrystalline silicon (pc-Si), due to climatic conditions, in a portable test chamber designed on a laboratory scale. They simulated solar radiation using an LED-based simulator fixed in a stationary position, providing an irradiance range of 50 to 310 W/m
2. To replicate climatic conditions in the mini-test chamber, they utilized an ultrasonic humidifier, a water cooler, and an electric heater. They evaluated the performance of the solar cells under relative humidity levels of 45%, 60%, and 75% [
21]. Stanek and his colleagues utilized a solar simulator that enabled them to conduct tests under fixed and repeatable conditions, thereby studying the operation of a parabolic linear absorber in a parabolic concentrator solar system. The solar simulator they used consisted of 18 metal halide lamps, each with a nominal power of 575 W and capable of being dimmed up to 60%. These lamps could be moved up and down [
22]. Rghif et al. experimentally investigated heat and mass transfer in a salt gradient solar pool. The experimental setup used in the laboratory consisted of a solar simulator filled with saltwater and fixed in place, as well as a thermally insulated, parallel-sided tank exposed to an axial fan. The fan produced airflow in a constant direction. Four 300-watt Vitalux lamps were used for the solar simulator [
23]. Cüce et al. used a halogen lamp-based solar simulator capable of providing radiation in the range of 100–1000 W/m
2 to observe the effects of thermal insulation on the electrical power of PVs. The simulator they used consisted of 20 halogen projectors mounted on a fixed platform [
24]. Das et al. used a solar simulator capable of producing radiation values of 400, 600, and 800 W/m
2 to observe the effects of the sand-covered absorber plate within the FSP. They kept the angle of the FSP and the solar simulator lamp array at 45° [
25].
When studies examining the energy performance of flat-plate solar panels under various environmental conditions produced in a laboratory environment were reviewed, the following shortcomings were identified:
Studies have been conducted on dew formation affecting PV panel performance, but the effect of relative humidity on PV and SAH performance has not been investigated.
An air conditioning unit capable of simultaneously adjusting the prevailing wind direction and intensity was not used.
In solar simulators, positioning was not performed according to the sun’s orbit at the desired position and time values using a sun position algorithm.
Solar panels were not positioned according to the effective solar direction and tilt angle of any given position by moving them on two axes.
A planar solar panel performance test chamber that can be fully autonomously adjusted according to the actual environmental values corresponding to any specified position and time values was not used.
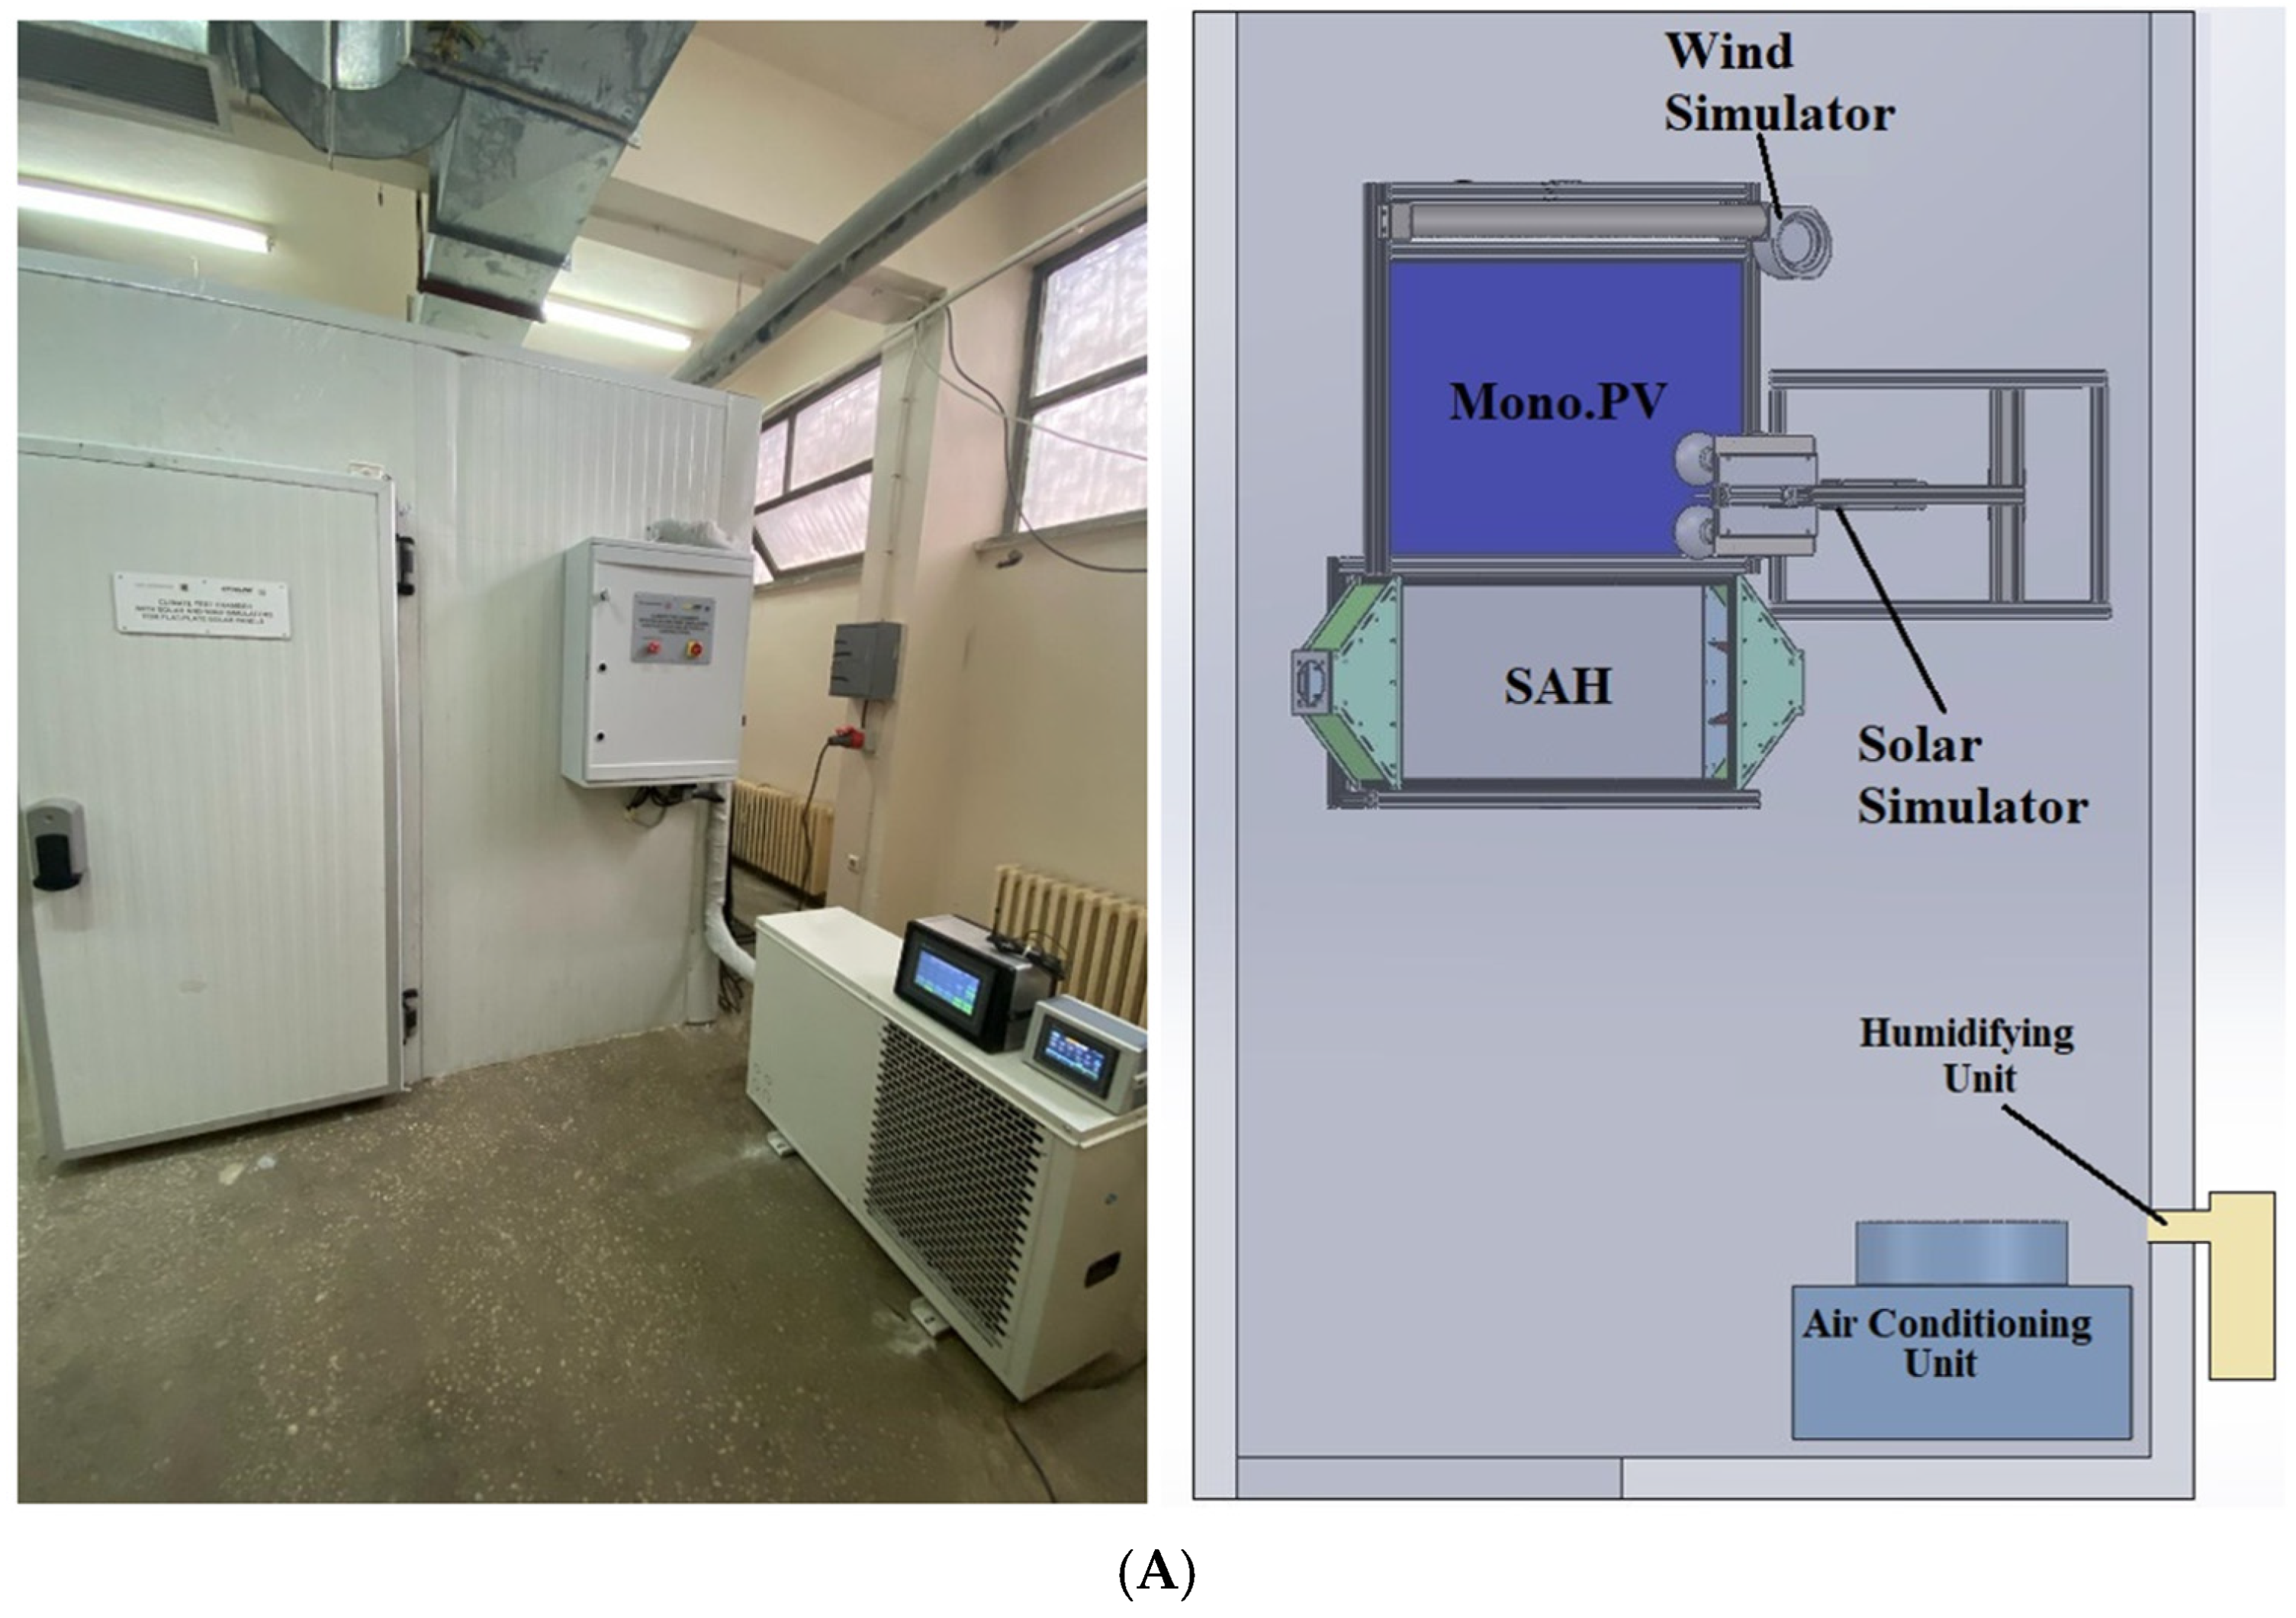
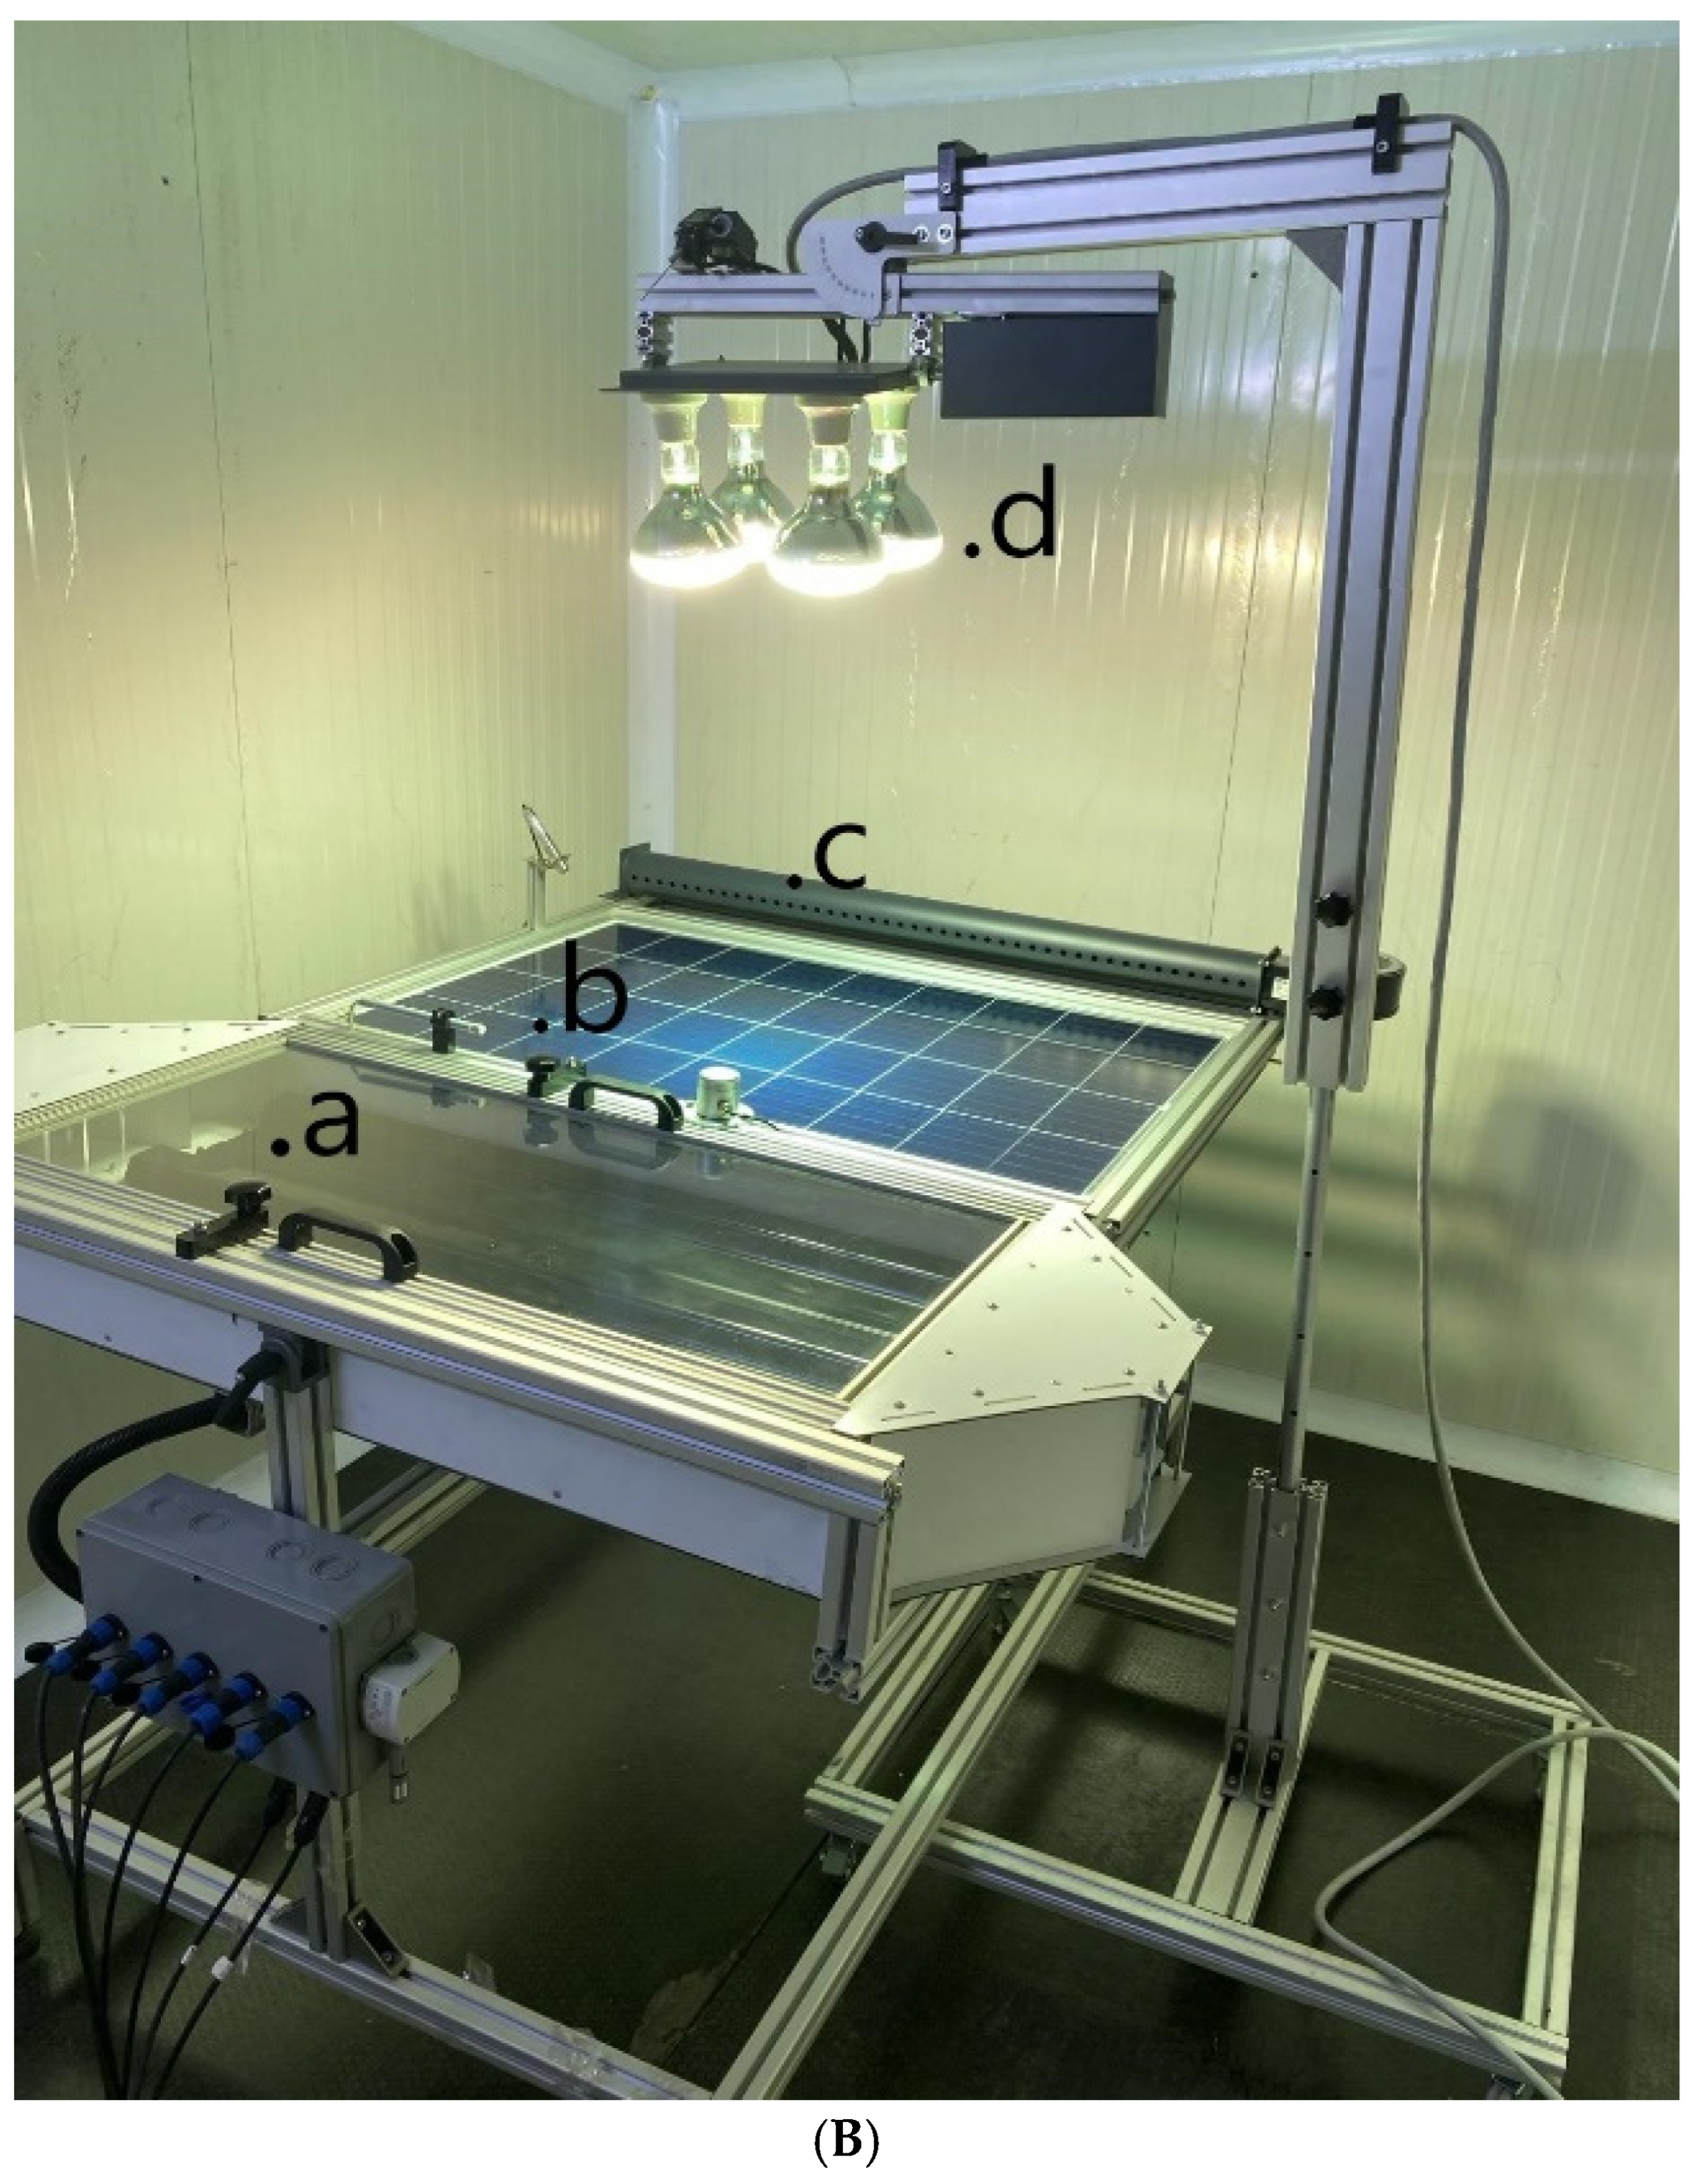
Within the scope of this study, a climate chamber was designed to test the performance of one SAH and one polycrystalline PV panel. The FSP performance test chamber was designed to fill the gaps in the literature mentioned above. The effects of air temperature, relative humidity, wind direction and speed, and irradiance values varying according to the sun’s position on the FSPs under real-time climatic conditions were autonomously investigated in the test chamber using feedback-controlled PLC control at the desired location and time. Additionally, explainable rules for the performance values of both panels were obtained using artificial intelligence methods.
Artificial intelligence methods are popular to process large amounts of data that are difficult to analyze. As with many other fields, these methods have also been used in flat-plate solar energy systems.
Table 1 presents a selection of studies modeling various parameters in solar panels using artificial intelligence methods.
When examining artificial intelligence studies on solar systems, prediction models have been obtained for various parameters. These models have only predicted a desired parameter in the existing system. In other words, the results consist solely of numerical data, and no methodological consistency rules have been established to express the parameter under investigation. Another original aspect of this study is that rules explaining the performance values of solar panels have been obtained by using new optimization-based explainable artificial intelligence models to fill this gap in the literature. Optimization-based explainable artificial intelligence methods are adapted to the problem under focus for the first time in this field.
The research question of this study is “Can a test chamber be designed to examine the effects of environmental parameters such as temperature, humidity, air velocity, and radiation on FSP performance, and can artificial intelligence models that express the performance values of solar panels be produced with the data obtained?” As a result of this question, the hypothesis of the study is “In the test chamber, under the climate conditions of different locations to be determined, explainable artificial intelligence-based rules can be produced that can express the performance of the panels with the datasets obtained as a result of the examination of the performance values of the FSP in the laboratory environment.”
The importance of this study lies in experimentally determining the performance parameters of panels under various climatic conditions and utilizing the resulting methodological explanatory rules to derive rules that explain panel performance values based on radiation, temperature, relative humidity, and wind speed parameters. Applicable rules regarding solar panel performance have been obtained using the artificial intelligence models developed.
The following points briefly summarize the originality of this study:
A fully autonomous test chamber equipped with a climate control unit capable of adjusting solar orbit and wind direction intensity to create different environmental conditions for observing the performance values of solar panels has been designed.
Using the datasets obtained in the test chamber, optimization-based explainable artificial intelligence methods were employed to determine how the performance values of solar panels change according to experimental conditions and to establish rules for achieving the optimal performance under specific conditions.
The experimental data obtained from the performance tests of the solar panels were used to develop the targeted optimization-based explainable artificial intelligence methods, which were applied for the first time in this field. In this way, the classification models were not black-box in nature; high performance was achieved in terms of classification metrics, and a transparent, explainable, and interpretable set of rules was obtained.
This study presents a novel approach that addresses gaps in the literature, both in experimental design and data processing. The fully automatic climate chamber, developed for Antalya’s climatic conditions, is integrated with a halogen projector-based solar simulator capable of replicating real environmental conditions, including solar orbit and wind direction/intensity, along with a two-axis solar tracking system. This system enables simultaneous testing of PV and SAH panels under different tilt angles and radiation scenarios. This system distinguishes itself from previous laboratory studies that used fixed angles, single-axis systems, or fixed radiation values. Additionally, 12 months of high-frequency experimental data have been converted into Explainable Artificial Intelligence (XAI) models using the CRb-SPEA2 algorithm, which employs a chaos-based rule extraction mechanism instead of classical regression. Thanks to these models, interpretable and transparent rules have been obtained, extending beyond numerical results, for the fundamental environmental parameters (radiation, temperature, relative humidity, and wind speed) that determine panel performance. This situation creates an explainable framework that directly guides engineering design decisions, unlike typical “black box” artificial intelligence models. Finally, since these rules derived from environmental parameters are applicable in regions with different climate profiles, this study offers a generalizable energy/exergy efficiency methodology.
3. Results
In this section, the experimental findings obtained and the decision rules derived from explainable artificial intelligence models are evaluated using a holistic approach. The results obtained regarding the energy and exergy efficiencies of planar solar panels (PV and SAH) tested under different climatic conditions are discussed by comparing them with similar studies in the literature; the effects of environmental parameters (temperature, relative humidity, radiation, and wind speed) on performance are analyzed in detail. Additionally, the rules obtained through explainable artificial intelligence methods are evaluated in terms of their applicability and reliability in decision-making processes.
The limitations of this study are evaluated from both experimental and numerical perspectives. Experimentally, only long-term average climate data from Antalya province were used in the test chamber, and short-term sudden climate fluctuations and multi-panel interactions were excluded. Additionally, the experiments were conducted using a single PV panel and a single SAH module, with wind simulation maintained at a constant average speed. Numerically, the artificial intelligence models developed using the CRb-SPEA2 algorithm were trained solely on the 12-month dataset obtained in this study and require additional datasets for generalization across different climate types. Furthermore, factors such as panel aging, shading, and maintenance conditions were not included in the model. These limitations are noted in the article, and it is recommended that the scope be expanded in future studies.
3.1. Experimental Results
Based on data provided by the General Directorate of Meteorology for the province of Antalya, experimental tests were conducted in a climatic test chamber. The environmental conditions (temperature, relative humidity, solar radiation, and wind speed) were adjusted within specific limits to evaluate the performance of solar panels.
Figure 5 shows the 12-month air temperature simulation values in the climatic test chamber for Antalya. As shown in
Figure 5, the monthly average air temperature values for Antalya were successfully obtained in the test chamber. The highest air temperature (Ta) was 39.7 °C in July, and similarly, the lowest air temperature was 9.46 °C in January. Additionally,
Figure 5 shows the monthly average solar radiation (SR) values for Antalya obtained using a solar simulator unit and halogen lamps in the test chamber. The lowest solar radiation value of 184.8 W/m
2 was recorded for December, while the highest solar radiation value of 1362.09 W/m
2 was recorded for July.
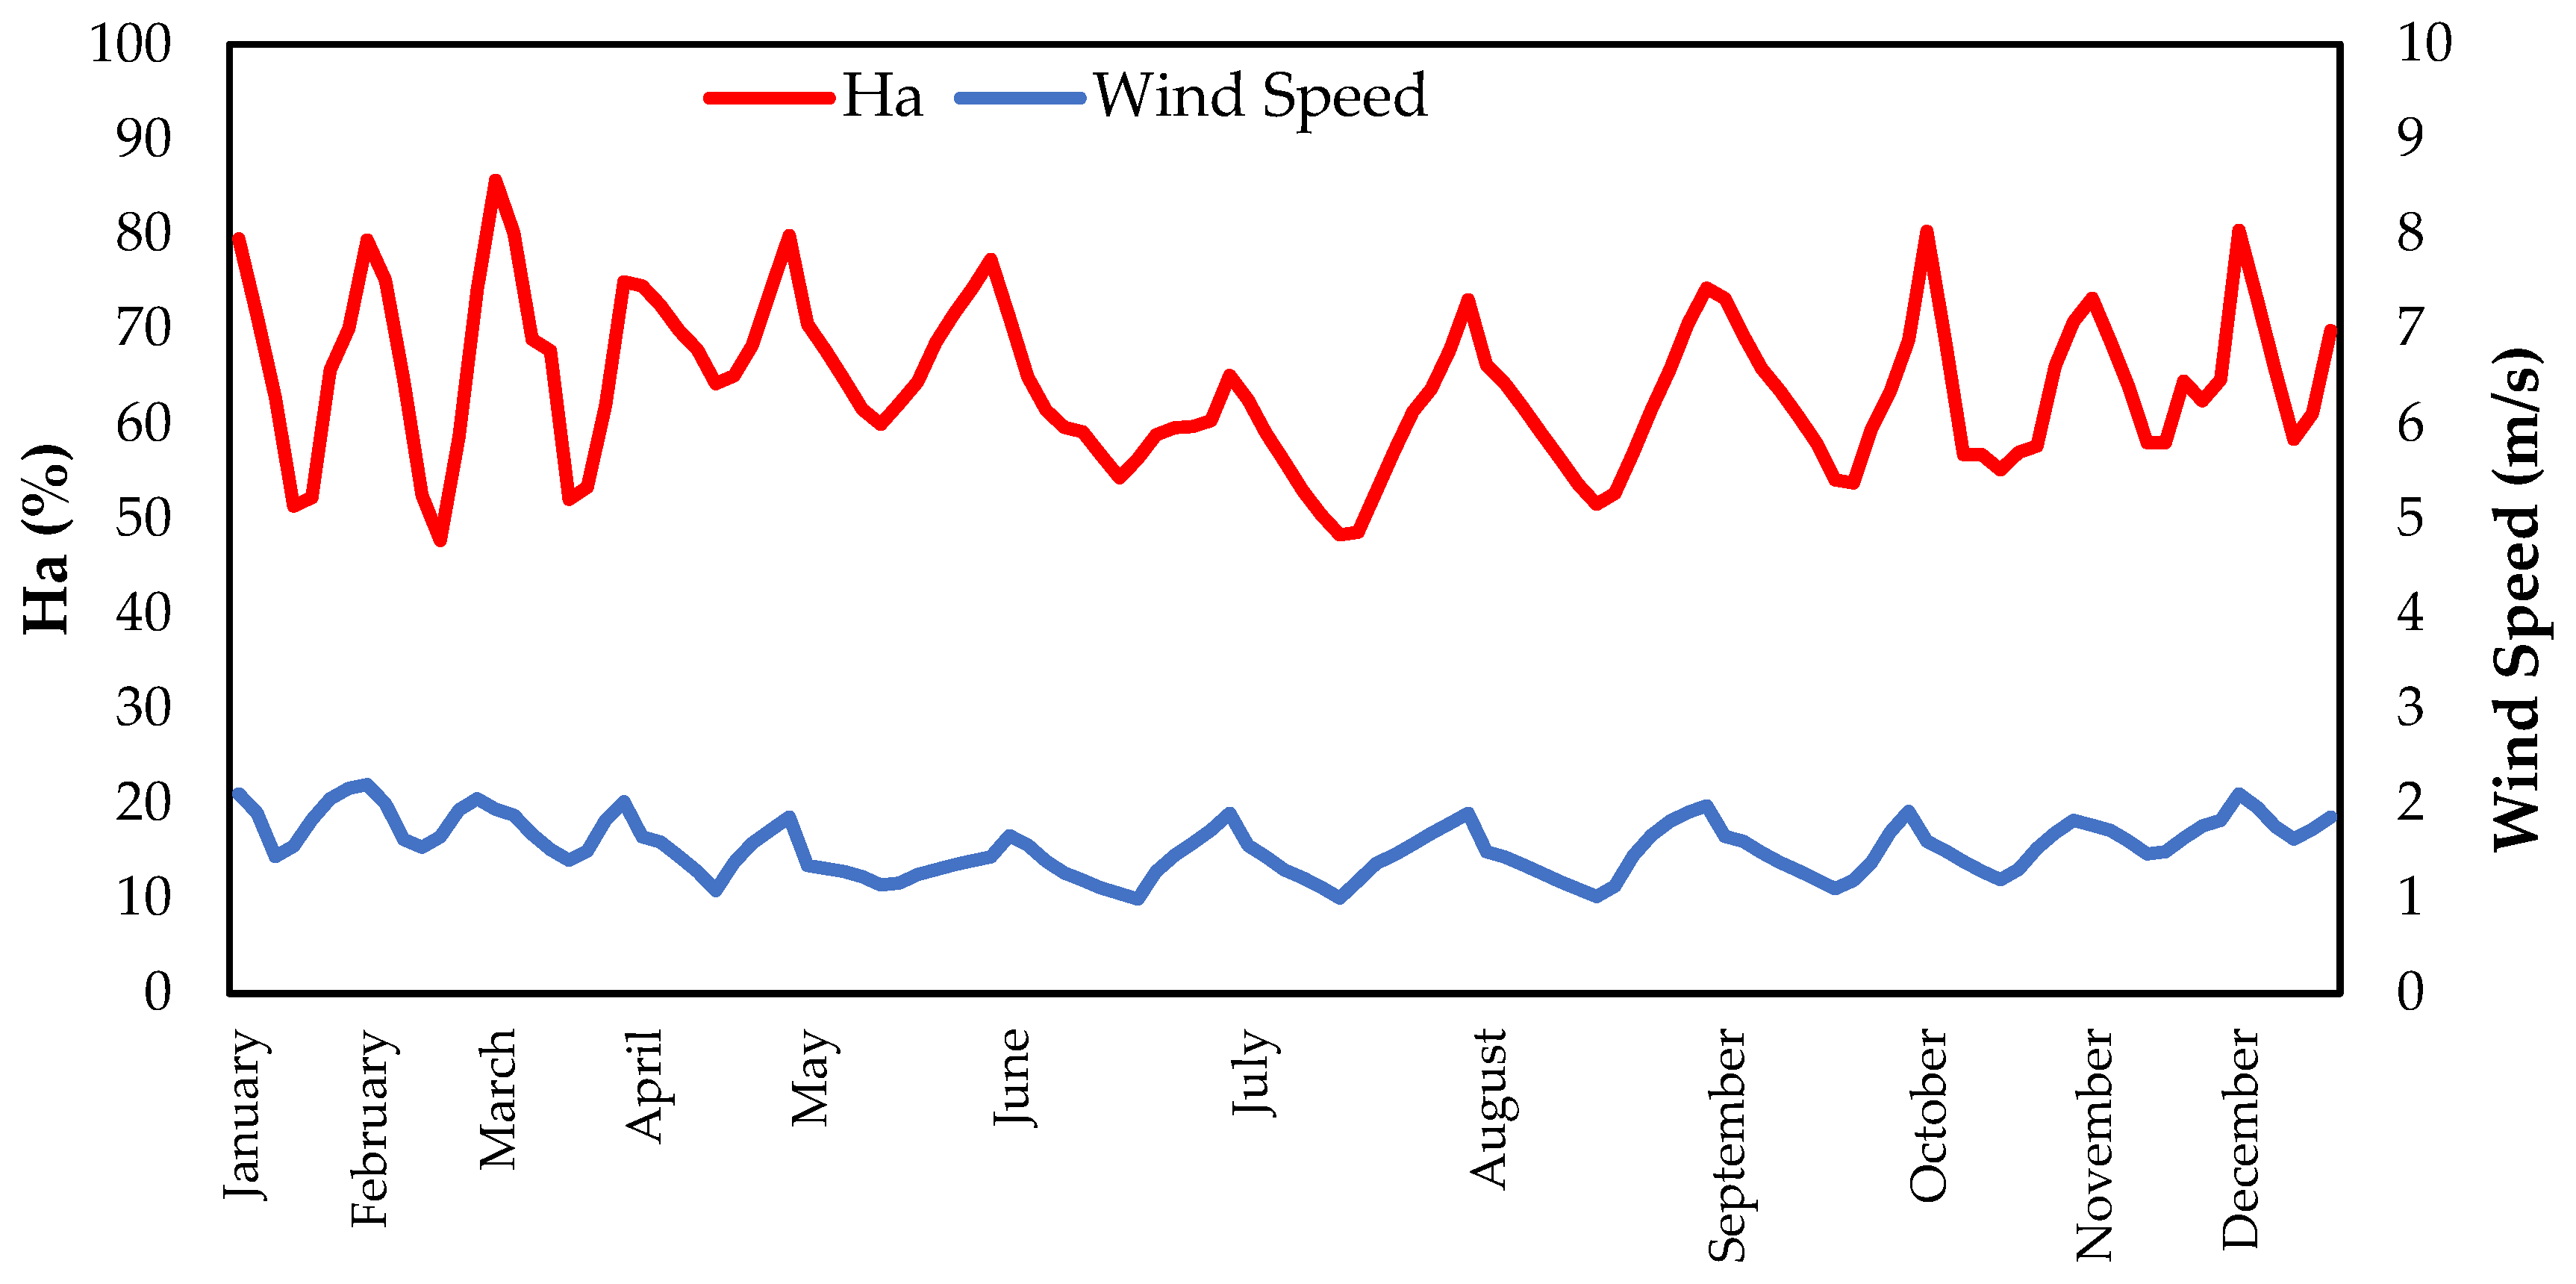
Relative humidity values close to the monthly average humidity values for Antalya province were obtained in the test chamber. The relative humidity (Ha) value was increased to above 70% by sending cold water vapor from outside using the humidification unit.
Figure 6 shows the monthly average relative humidity values obtained in the test chamber for Antalya province. The lowest relative humidity value, 39.2%, was recorded in June, while the highest relative humidity value, 85.7%, was recorded in March.
Figure 6 shows the wind data obtained in the test chamber for Antalya province. An average wind speed of 1.8 m/s was recorded throughout the year.
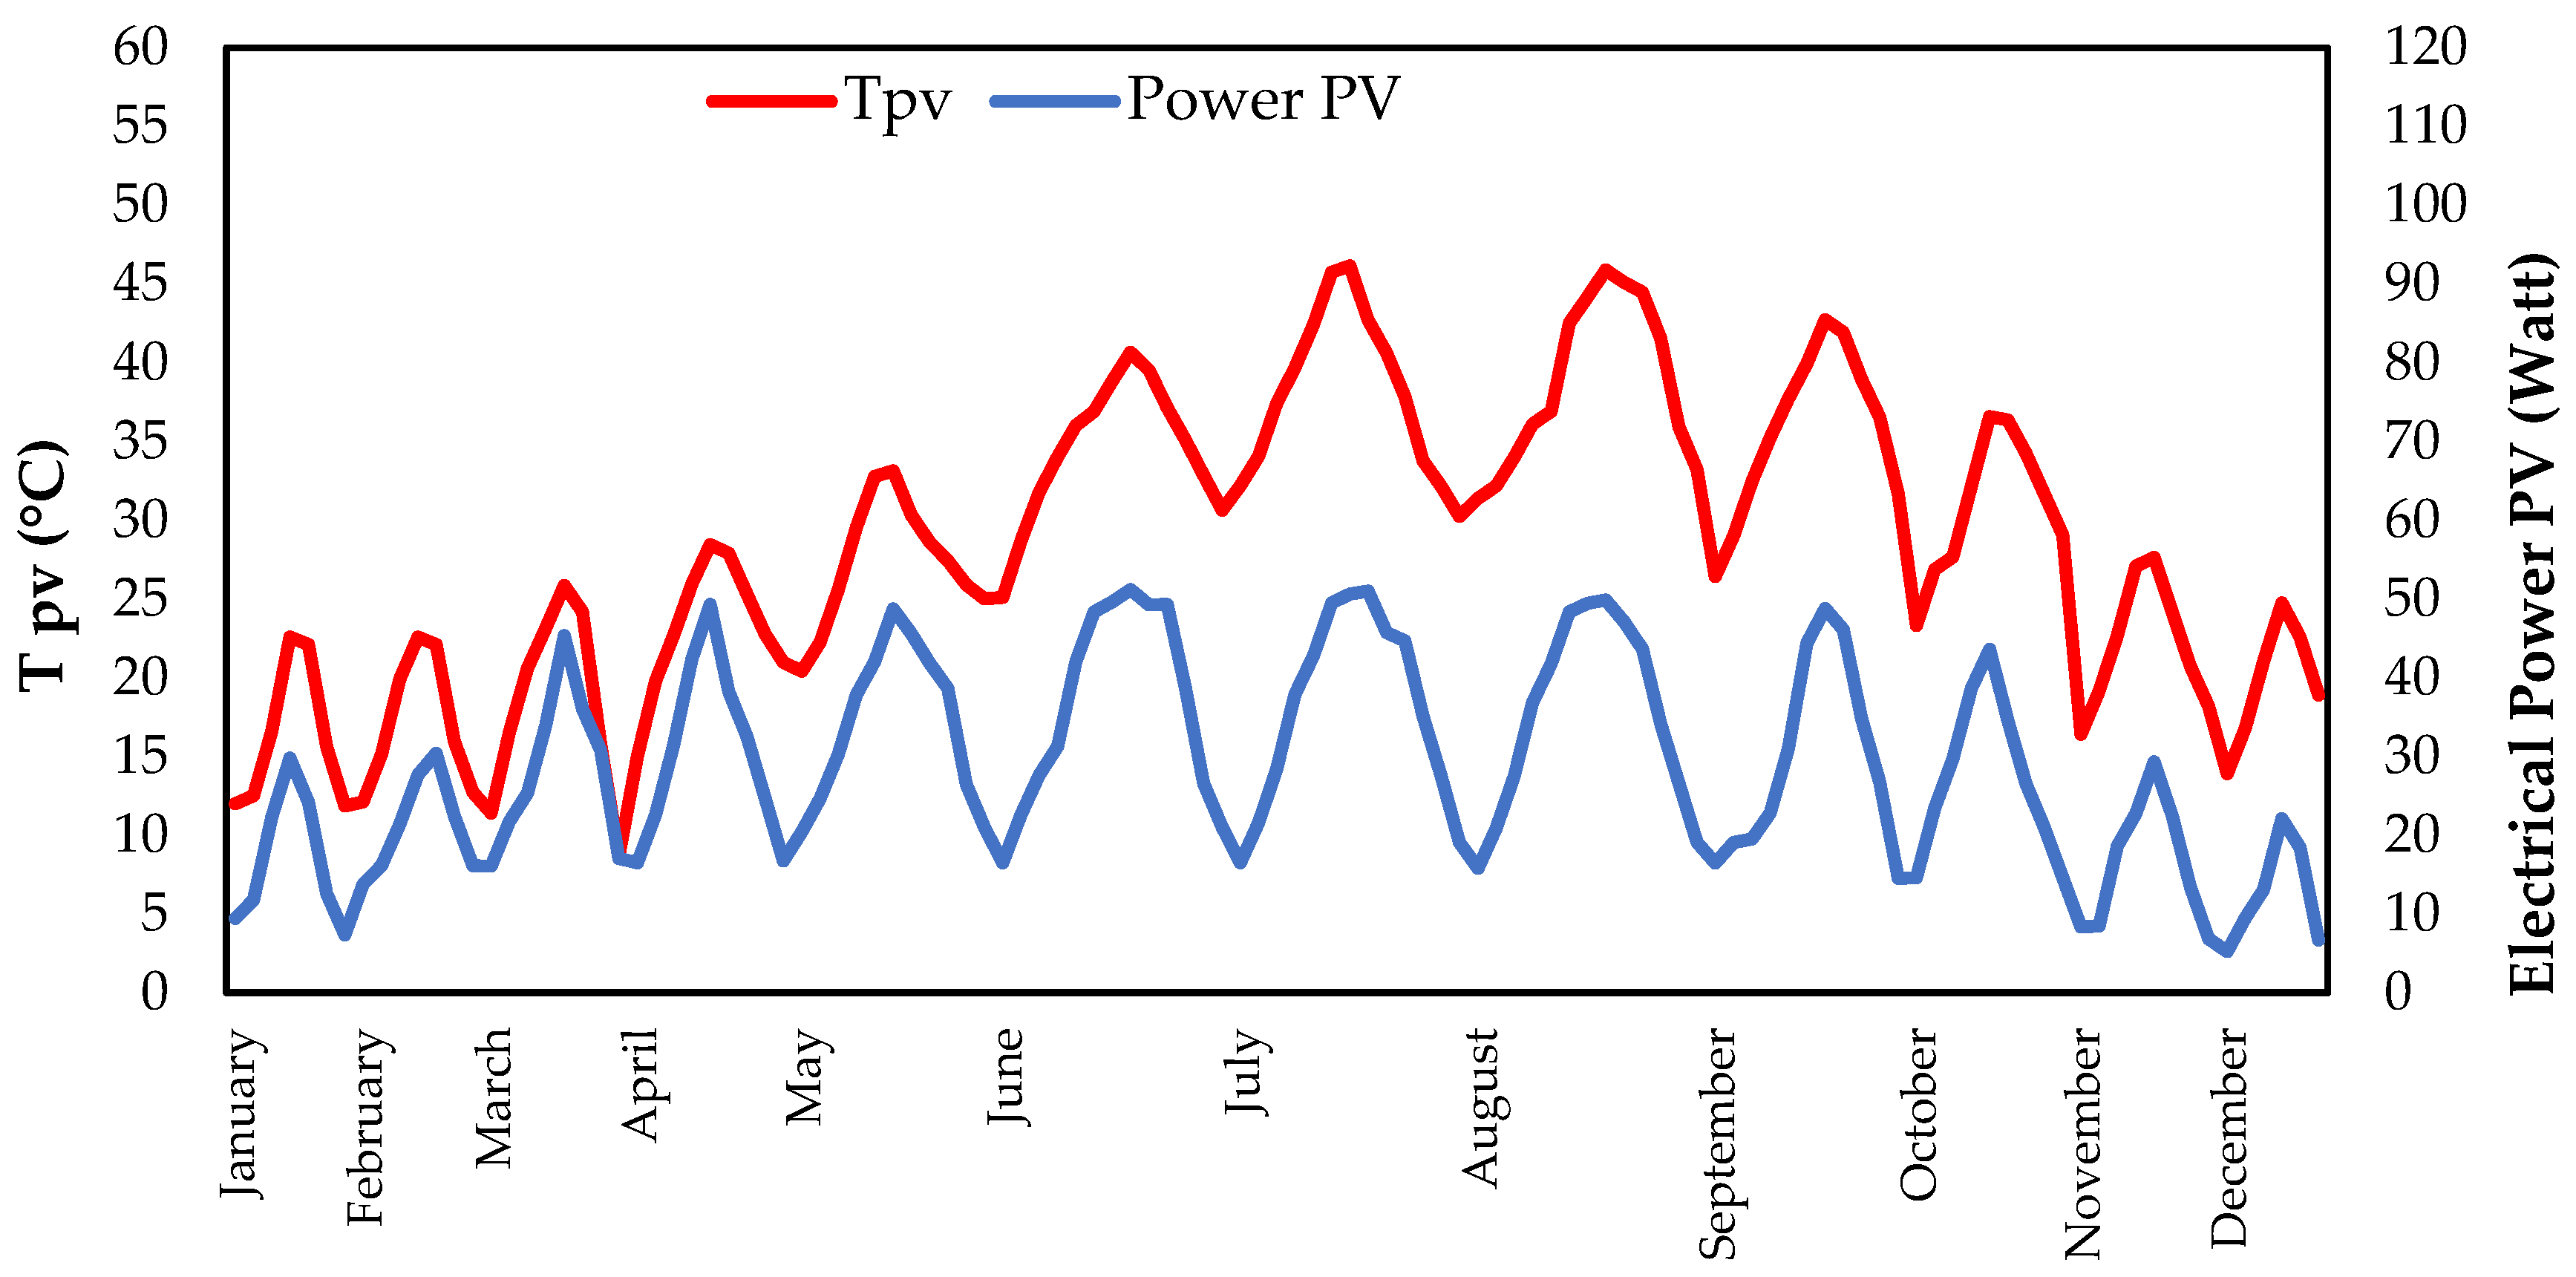
Performance tests were conducted in a test chamber simulating the climatic conditions of Antalya for PV panels and HGK. The tests were carried out over the monthly sunshine durations specified in
Table 3. The PV Watt value, representing the electrical power generated by the PV panel, is presented in
Figure 7 for each month, based on the sunshine duration. The lowest PV electrical power value of 5.22 W was obtained in December, while the highest electrical power value of 51.32 W was obtained in June. The surface temperature values of the PV panel obtained in the test chamber based on the 12-month climatic parameters of Antalya are presented in
Figure 7. The lowest PV surface temperature was 12.21 °C in January, while the highest PV surface temperature was 46.23 °C in July. Based on these data, the months with the highest PV surface temperatures were June, July, August, and September.
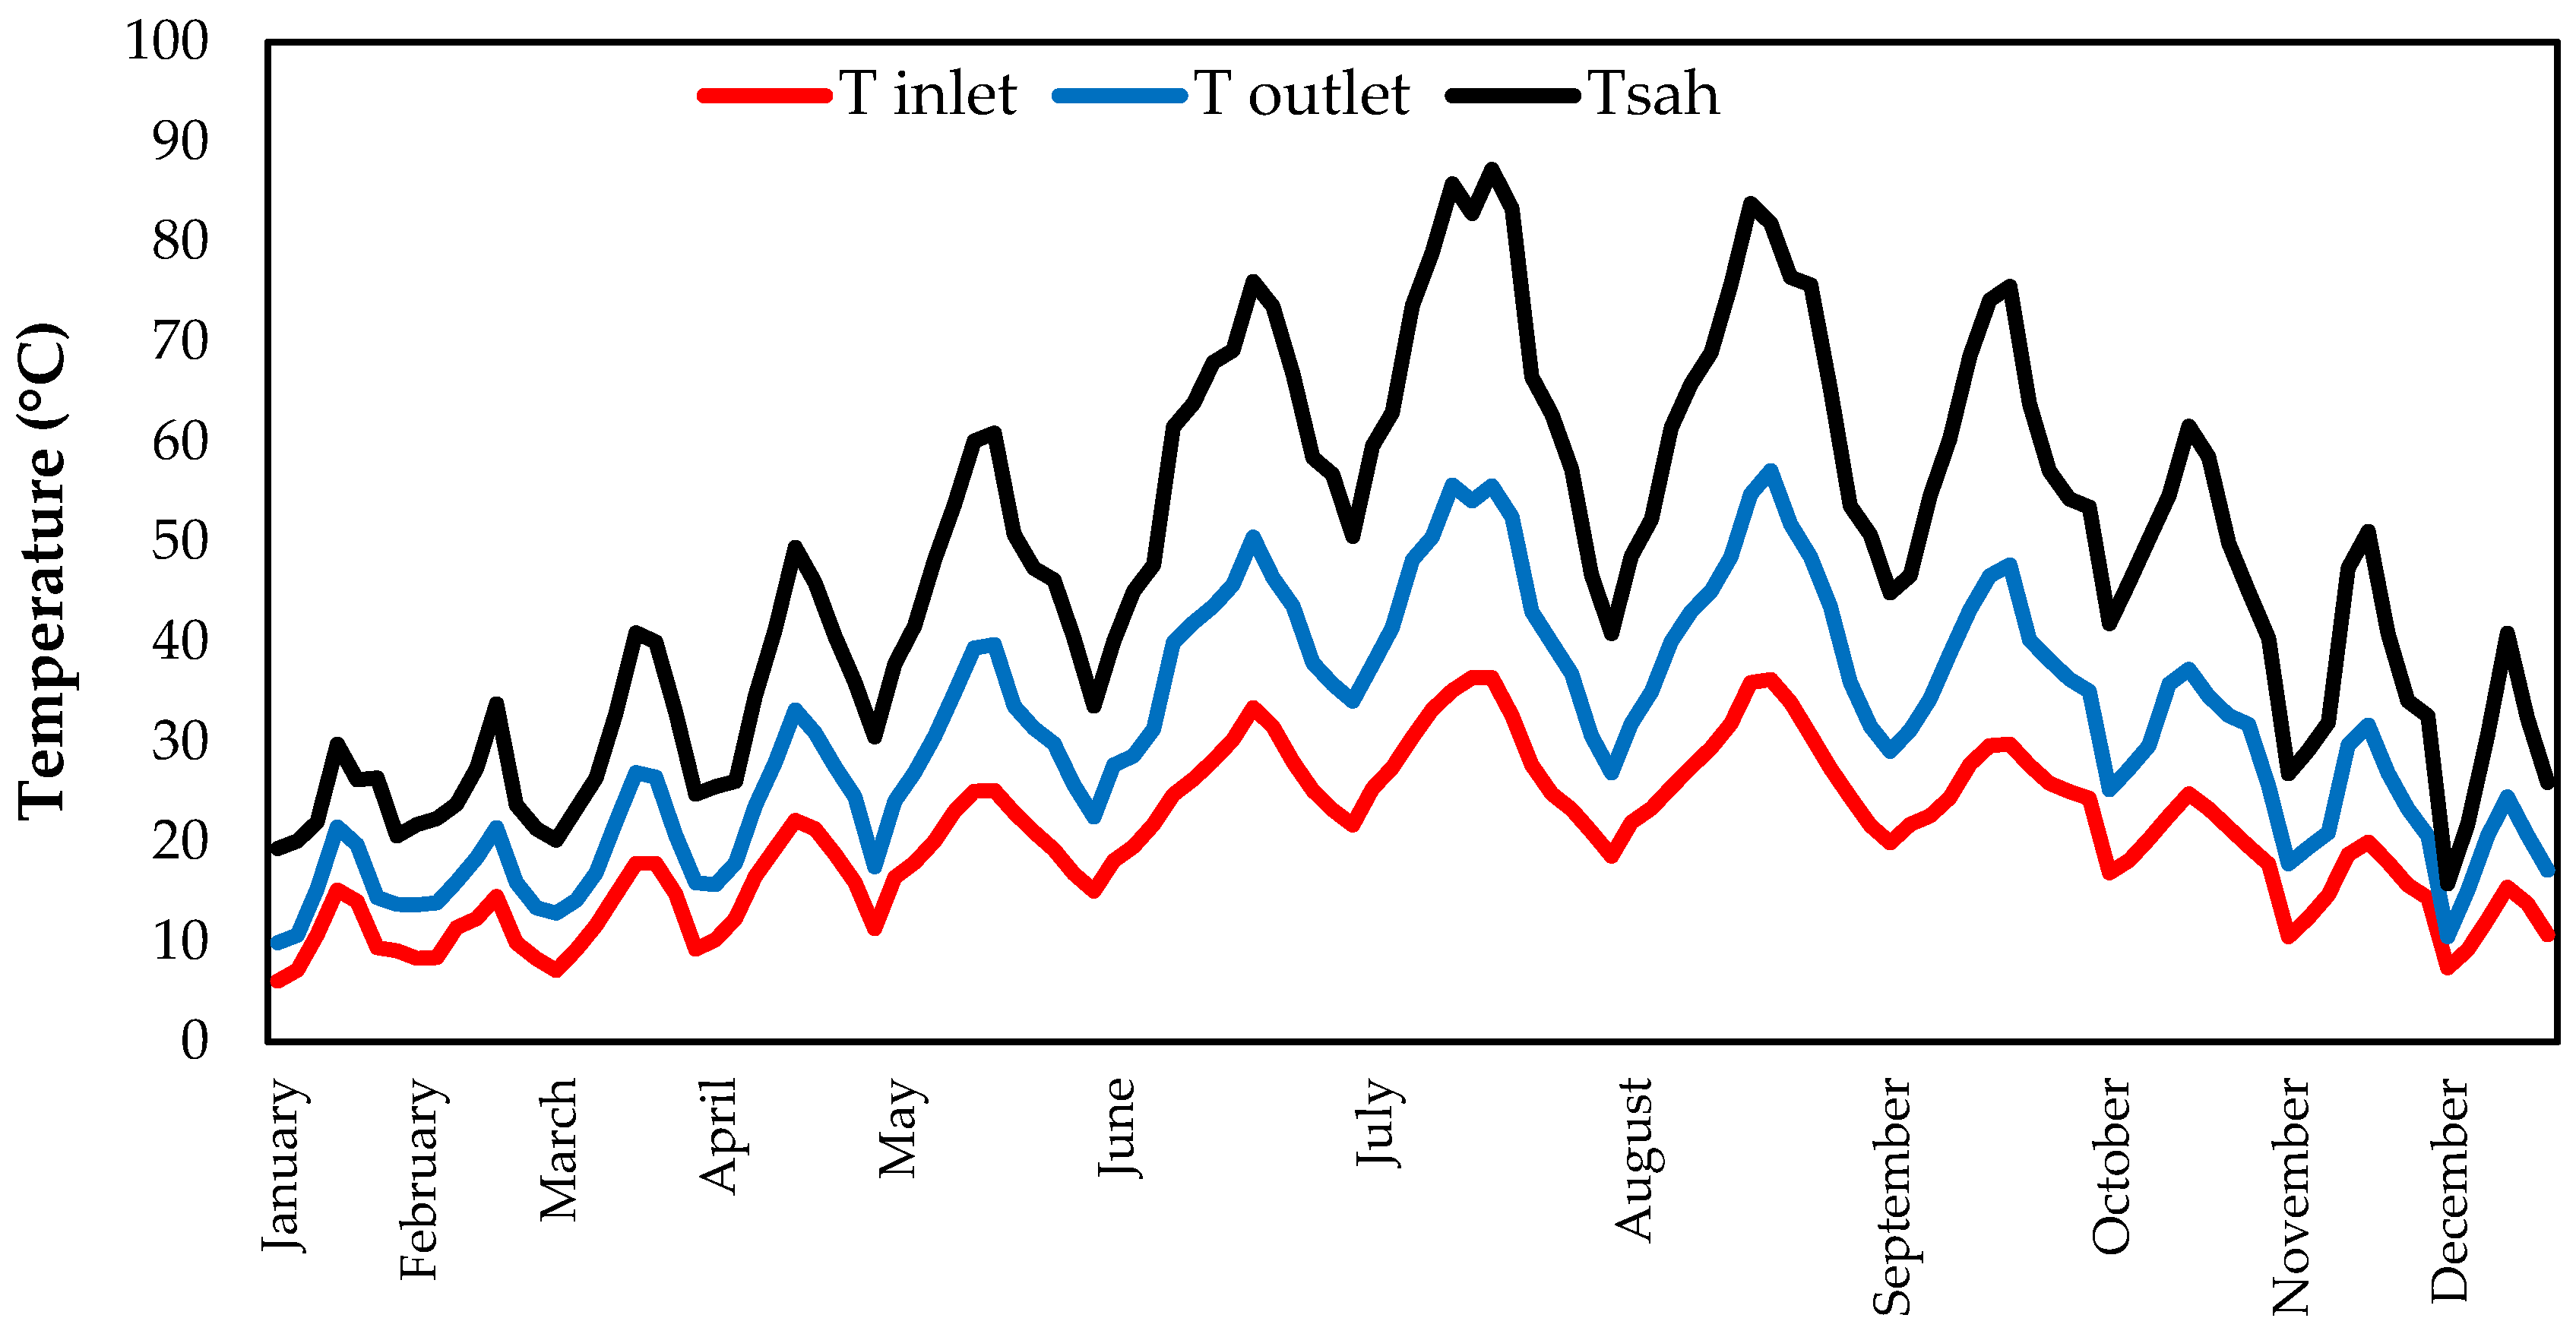
In the test chamber, experiments were conducted for each month of the year in Antalya based on the duration of sunshine.
Figure 8 illustrates the monthly average changes in SAH air inlet and outlet temperatures, as well as absorber surface temperatures (Tsah), throughout the year in a test chamber simulating Antalya’s climate conditions. In January, due to a low solar radiation (487 W/m
2) and ambient temperature (10 °C), the outlet air temperature dropped to 9.9 °C, while in July, with radiation increasing to 1398 W/m
2 and ambient temperature rising to 28.5 °C, the outlet air temperature reached 87.8 °C. Although increased radiation and high ambient temperatures during the summer months caused the absorber surface temperature to rise above 80 °C, thereby improving energy efficiency, the decrease in the temperature difference between the ambient and outlet air limited exergy efficiency. In contrast, during the spring and autumn months, ambient temperatures ranging from 16 to 21 °C and radiation levels between 800 and 1280 W/m
2 increase the temperature difference between the exhaust air and the ambient air, creating the most efficient conditions in terms of exergy. These results indicate that SAH operates more efficiently in terms of energy efficiency during summer and in terms of exergy efficiency during transitional seasons.
Figure 9 shows the monthly changes in the energy and exergy efficiency values of PV panels. The climatic parameter with the most significant effect on the energy (6.8–23.8%) and exergy (3.3–12.6%) efficiencies of PV panels was solar radiation. According to
Figure 5, solar radiation reached its peak in June (1352 W/m
2) and July (1362 W/m
2), and the energy efficiency of PV panels also reached its maximum during these months. In December (184.8 W/m
2) and January (204.1 W/m
2), when low radiation values were observed, the energy efficiency of the PV panel dropped to minimum levels. In terms of exergy efficiency, not only radiation but also the difference between the panel cell temperature and the ambient temperature is a determining factor. In July, the ambient temperature reached 39.7 °C, causing the panel’s surface temperature to rise. While this supported energy efficiency, it reduced the thermodynamic quality in terms of exergy. Excessive increases in PV cell temperature (46.2 °C) can reduce electron mobility and limit efficiency. The wind speed remaining constant at an average of 1.8 m/s throughout the year limited the panel’s cooling. This situation particularly caused an increase in surface temperature and, consequently, an exergy loss during the summer months. In conclusion, the energy efficiency of the PV panel is primarily determined by the amount of solar radiation it receives. In contrast, the exergy efficiency varies based on ambient temperature and the temperature difference across the panel. It is also affected by natural cooling from the wind.
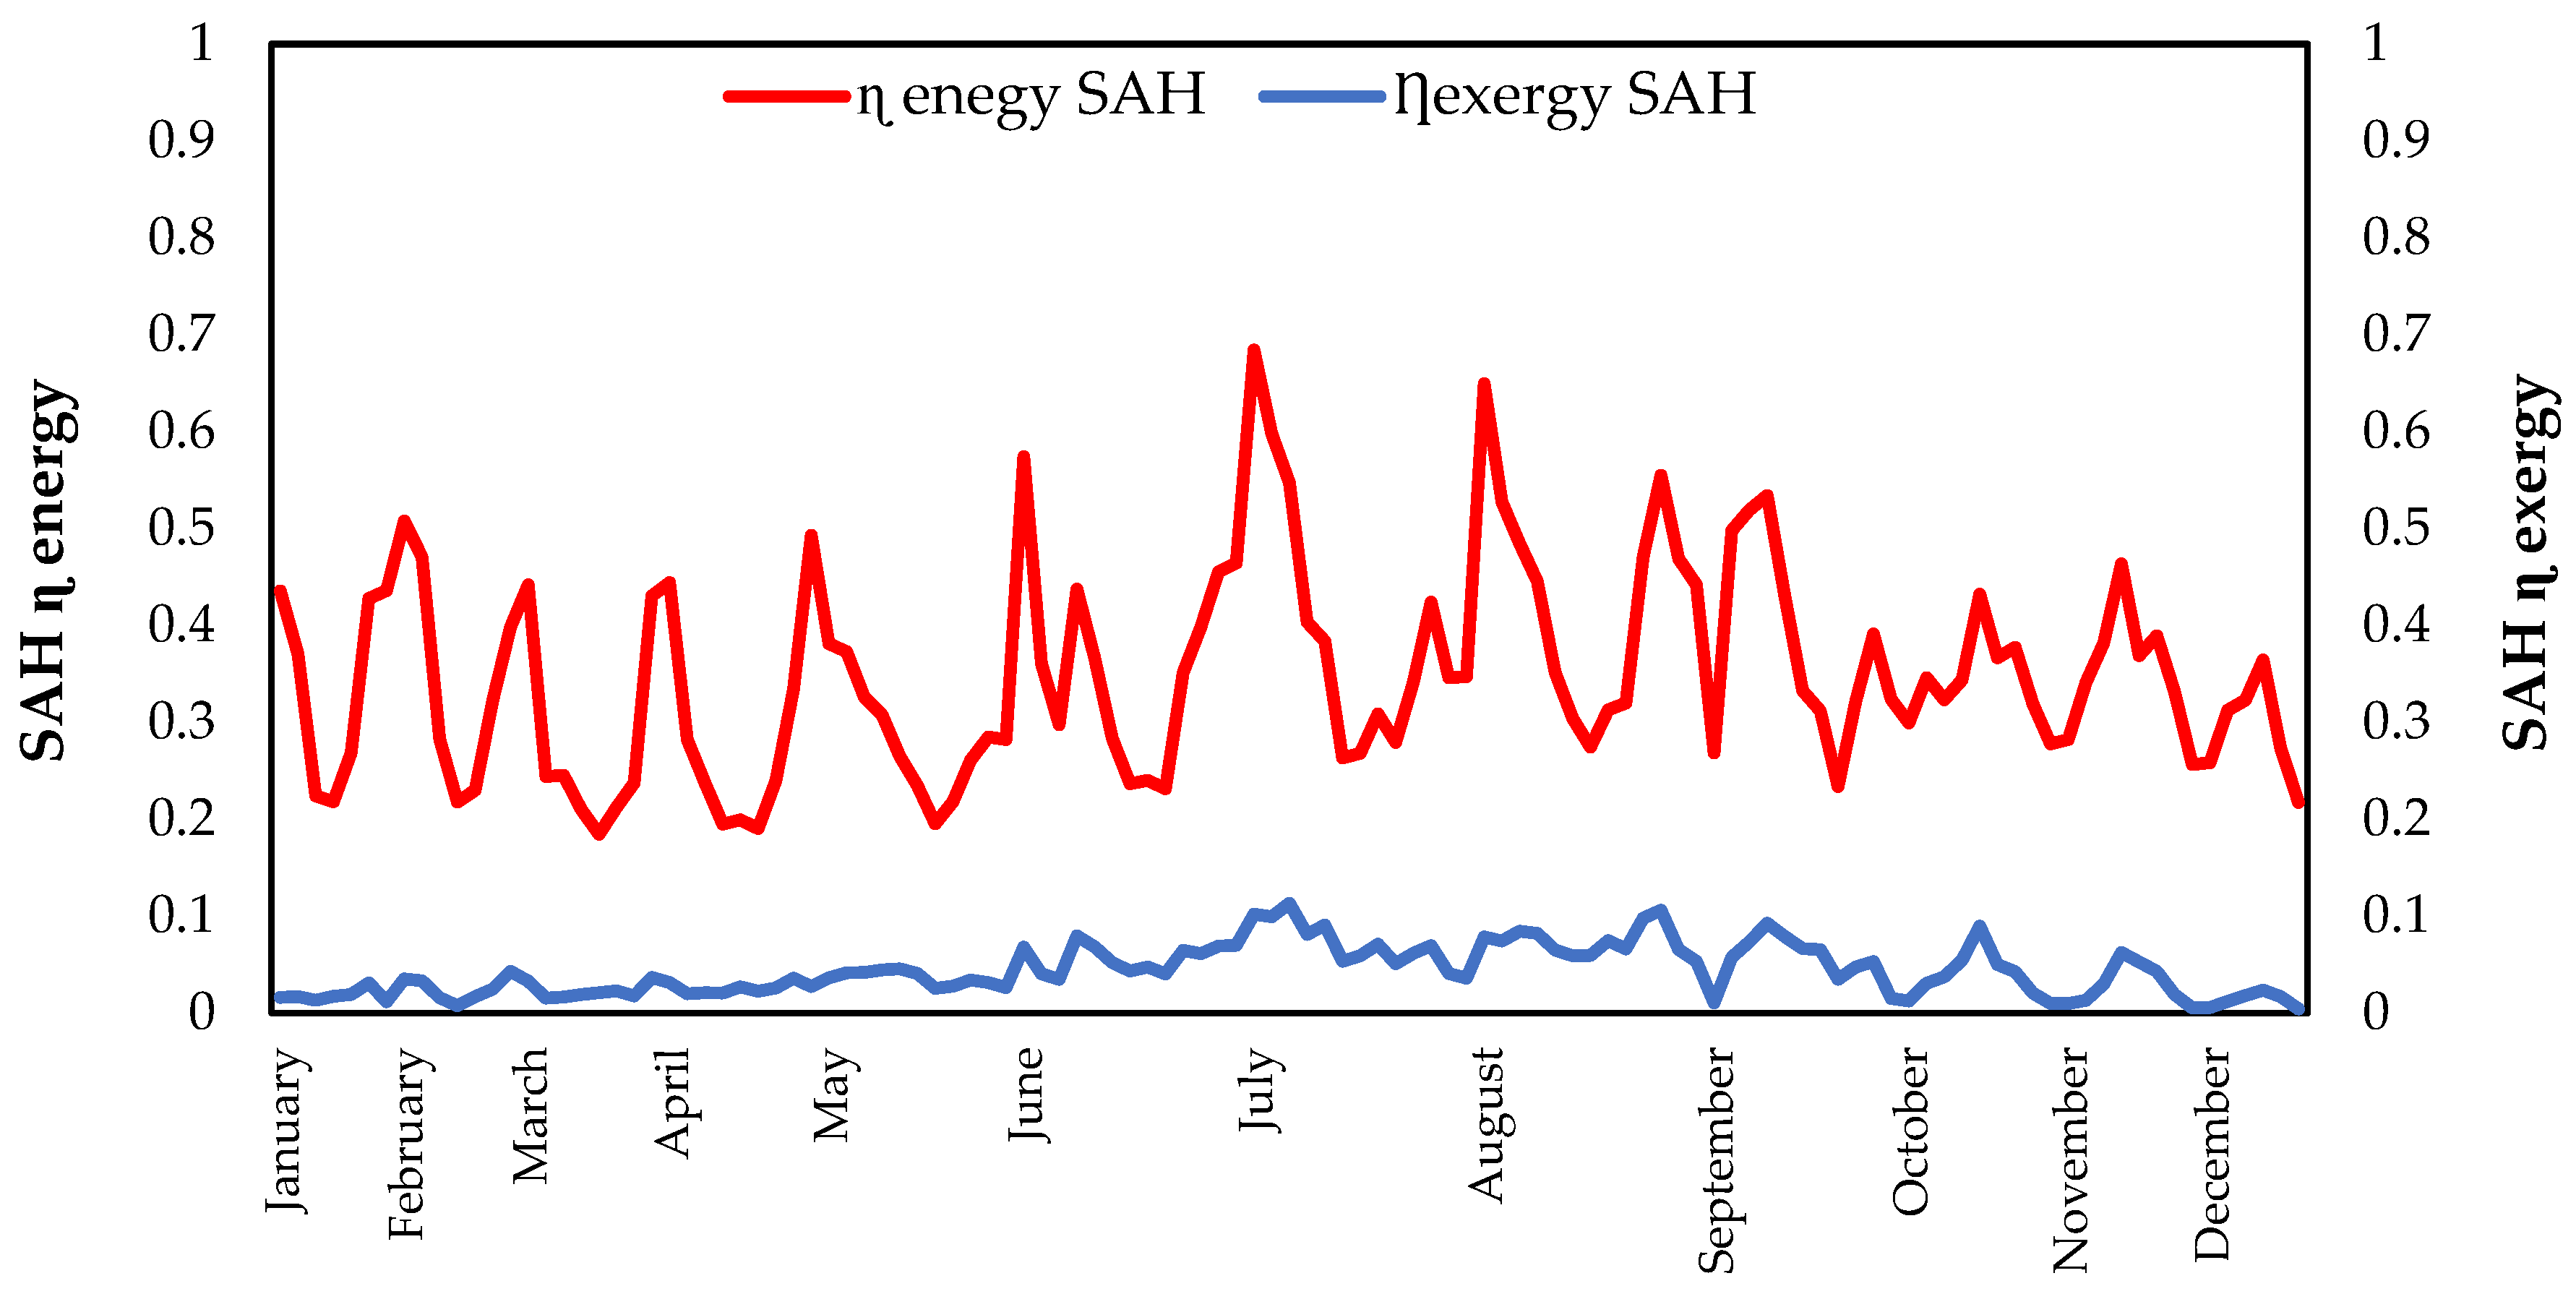
Figure 10 shows the changes in the monthly energy and exergy efficiency values of the SAH. The main climatic parameters affecting the energy efficiency (19–68%) and exergy efficiency (1–12%) of the SAH panel were ambient temperature, solar radiation, and panel surface temperature. The data in
Figure 5 show that both ambient temperature (39.7 °C) and irradiance (~1360 W/m
2) were very high in July and August. These conditions significantly increased the outlet air temperature of the SAH panel, resulting in maximum energy efficiency during these months. For example, in July, the air outlet temperature rose as high as 87.8 °C. However, a high ambient temperature is undesirable from an exergy efficiency perspective, as the thermodynamic quality of heat energy decreases as the difference between the ambient temperature and the outlet temperature decreases. Therefore, while energy efficiency was high, exergy efficiency remained relatively limited. The spring and autumn months are periods when ambient temperatures are lower, but radiation is still sufficient; these conditions enable higher exergy efficiency in SAH systems. The average wind speed of 1.8 m/s did not directly affect the SAH panel because the air speed in the test chamber was artificially controlled; however, these speeds could cause more cooling in the external environment, potentially reducing exergy efficiency. In conclusion, while the energy efficiency of SAH systems is primarily determined by radiation and ambient temperature, exergy efficiency is more advantageous during transitional months when ambient temperatures are low but radiation is sufficient.
3.2. Results Obtained from Artificial Intelligence Modeling
In this section, the energy and exergy performance of solar panels is detailed, with an explanation of how it is interpreted using explainable artificial intelligence (XAI) methods based on experimental data obtained in a test chamber. One of the unique aspects of this approach is that it goes beyond traditional black-box AI models to produce understandable and interpretable rule sets that describe the effects of environmental parameters (temperature, relative humidity, irradiance, air speed) on panel performance. These rules, created using the CRb-SPEA2-based multi-objective classification algorithm, are presented with decision structures corresponding to “high,” “medium,” and “low” efficiency classes for both panel types (PV and SAH) in terms of energy and exergy efficiencies. This analysis makes an important contribution not only in terms of numerical accuracy but also in producing explanatory models that ensure reliability in decision-making processes. Below, the conditions determined for each class are evaluated in detail.
Table 8 contains the rules obtained using an explainable artificial intelligence method to classify the energy efficiency values of PV panels. The rules define high (H), medium (M), and low (L) efficiency conditions based on environmental parameters.
Table 8 shows that Class H PV panels achieve high energy efficiency under conditions of moderate surface temperatures (25–32 °C), cool ambient temperatures (6–15 °C), and high solar radiation (sr > 330 W/m
2). These conditions represent the spring and autumn months when solar radiation is intense, but excessive heating does not occur. Moderate wind speeds (1.3–1.9 m/s) also contribute to the natural cooling of the panel.
Class M: Under medium energy efficiency conditions, the panel temperature ranges from 16 to 28 °C, radiation from 380 to 1570 W/m2, and ambient temperature varies over a broader range. This situation represents stable but suboptimal operating conditions that are frequently observed throughout the year. Wind speed is generally between 1.0 and 2.1 m/s; system performance is balanced but remains below peak levels.
Class L: Low efficiency has been observed during summer months when the PV panel overheats (>28 °C), ambient temperature increases (>25 °C), and wind speed is insufficient (<1.5 m/s). Under these conditions, the temperature of the panel cells rises significantly, leading to reduced electricity production; even with high irradiation, efficiency decreases.
Table 9 shows the explainable artificial intelligence rules obtained in terms of the exergy efficiency of the PV panel. These rules distinguish between high-, medium-, and low-performance scenarios by defining the environmental conditions that affect the thermodynamic efficiency of the panel.
Table 9 shows that Class H, characterized by high exergy efficiency, was achieved under conditions where the panel surface temperature was low (8–16 °C) and the ambient temperature was also cool (8–18 °C). At the same time, solar radiation was moderate to high (sr > 385 W/m
2). This scenario demonstrates that the PV system operates at maximum thermodynamic efficiency under sunny but cool conditions—such as early spring.
M Class: The medium-class rules cover a wide range of parameters. Panel temperature ranges from 16 to 49 °C, radiation from 240 to 2340 W/m2, and ambient temperature from 16 to 36 °C. These conditions represent transitional seasons or partly cloudy summer days when the system operates stably but below optimal conditions.
L Class: Low exergy efficiency is observed under conditions of a high panel temperature (>28 °C) and high ambient temperature (>21 °C). This situation is due to the panel heating up during summer months, reducing the temperature difference in the background and consequently lowering the quality of the energy produced.
Table 10 presents explainable artificial intelligence rules for classifying the energy efficiency of the SAH panel. Different efficiency levels resulting from environmental parameters are modeled with clear statements.
Table 10 shows that Class H, characterized by high energy efficiency, was achieved under conditions where the SAH surface temperature ranged from 59 to 83 °C and solar radiation was 836–1352 W/m
2. These temperature levels indicate the summer period when the absorber surface absorbs maximum heat. Wind speeds of 1.3–1.9 m/s prevent excessive cooling of the outer surface, thereby minimizing heat loss.
M Class: With medium energy efficiency, SAH surface temperatures range from 42 to 87 °C, while solar radiation is defined over a broader range (197–1288 W/m2). This class represents the spring and autumn months, during which the system operates adequately but not at its most efficient level. Wind speed remains moderate.
L Class: Low energy efficiency occurs under winter conditions where SAH surface temperatures are insufficient (15–54 °C) and ambient temperatures are low (15–23 °C). In this case, the duration of sunshine is short, and the environment is cold, so the energy carried by the outgoing air is low; consequently, efficiency decreases.
Table 11 presents the decision rules determined for the exergy efficiency of the SAH panel. These rules, which are significant in terms of thermodynamic efficiency, particularly emphasize the impact of the temperature difference between the ambient and panel temperatures on efficiency.
Table 11 shows that Class H was achieved with high exergy efficiency, high solar radiation (sr > 1300 W/m
2), a medium–high SAH surface temperature (TSAH: 50–67 °C), and a low ambient temperature (TA: 17–22 °C). These conditions create a significant temperature difference between the ambient and exhaust air, thereby enhancing the thermodynamic quality.
M Class: Defined by a wide range of SAH temperatures (44–87 °C) and solar radiation (471–2044 W/m2). Ambient temperature is also variable. These conditions correspond to spring–summer periods when the system typically operates stably but produces moderate levels of usable energy.
L Class: Low exergy efficiency occurs when the ambient temperature is high (>23 °C), and the difference between SAH surface temperature and ambient temperature decreases. Under these conditions, the system can produce energy; however, the output air is not significantly different from the ambient air, resulting in reduced usability of thermal energy (exergy).
3.3. Consistency of the Rules Obtained with the Literature
Table 8 presents the rules obtained for energy efficiency (η_energyPV), which model the effect of environmental parameters on PV efficiency and provide high, medium, and low classifications. This approach aligns with XAI-based PV energy prediction models, as supported by Shapley values in a study by Gomes et al. This study demonstrates the consistent effects of various inputs, including air temperature, radiation, and wind speed, on efficiency [
52]. Therefore, the rules obtained provide explainability and accuracy consistent with the existing literature.
The exergy efficiency (η_exergyPV) rules in Table 9 classify inputs based on the thermodynamic performance of the PV panel. Mitrentsis and Lens demonstrate that they have explained natural data relationships in PV power production estimation using SHAP-based XAI and obtained rule sets consistent with physical logic. In this regard, the η_exergyPV rule set presented in this study also provides transparent models that explain environmental relationships similarly [
53].
The energy efficiency rules in Table 10 are consistent with the parametric relationships observed in SAH models optimized using artificial neural networks and other XAI techniques. The meta-analysis conducted by Ghritlahre and colleagues indicates that environmental inputs such as temperature and flow rate are classified with high success in ANN-based models for SAH efficiency predictions and can be codified into rules. The rules presented in
Table 9 are also in strong agreement with this literature [
54].
The SAH exergy efficiency rules presented in
Table 11 are consistent with findings in the literature on SAH thermodynamics, which indicate that the wind speed and panel–surface temperature difference have a significant effect on efficiency. For example, Suman et al. emphasized that results in coarse-surface SAH models were obtained with high accuracy using neural networks that predict both thermal and exergy efficiency and that the temperature difference is a critical variable. In this context, the explanatory rules in
Table 10 support these fundamental effects reported in the literature [
55].
3.4. Effects of Climatic Parameters According to the Rules Obtained
3.4.1. Relative Humidity (ha) Effect
Relative humidity (ha) has both direct and indirect effects on energy and exergy efficiency in both PV and SAH systems.
Table 8 and
Table 9 show the ha parameter for PV panels under high (H), medium (M), and low (L) class conditions, indicating that relative humidity has a complex effect on efficiency. Moderate humidity can create a cooling effect on the panel surface through evaporation, thereby lowering the cell temperature and increasing energy efficiency. However, high relative humidity reduces energy and exergy efficiency by weakening radiation and causing contamination on the panel surface [
56]. Similarly, for SAH systems, the ha parameter is present in all classes in
Table 10 and
Table 11, with higher exergy efficiency observed under low relative humidity conditions. This situation occurs because high relative humidity increases air density, thereby limiting the fluid’s heat transfer capacity and reducing its thermodynamic quality [
57]. Therefore, it can be stated that the relative humidity parameter has positive effects up to a certain threshold and negative effects beyond this threshold in both PV and SAH systems; this situation is consistently reflected in rule-based modeling with multi-modal class distributions.
3.4.2. Ambient Temperature (ta) Effect
Ambient temperature (ta) is a critical environmental parameter that significantly influences the thermodynamic performance of both PV and SAH systems. According to
Table 8 and
Table 9, ta for PV panels typically falls within the low (L) and medium (M) temperature ranges, indicating that high ambient temperatures increase PV cell temperature, leading to efficiency losses. Skoplaki and Palyvos have reported that every 1 °C increase in PV cell temperature results in an average 0.45% decrease in efficiency [
58]. For SAH systems, ta is observed in both low and high classes, as shown in
Table 10 and
Table 11. High ambient temperatures can reduce exergy efficiency by decreasing the temperature difference between the collector and the surroundings. However, under very low ambient temperature conditions, heat losses increase due to the significant temperature difference with the environment, which can negatively affect energy efficiency [
59]. Therefore, avoiding very low and very high ambient temperatures is consistent with the rules established in this study and confirmed in the literature, which is crucial for ensuring the optimal performance in SAH systems.
3.4.3. Wind Speed (ws) Effect
Wind speed (ws) is an important environmental factor affecting the performance of PV and SAH systems.
Table 8 and
Table 9 show ws for PV panels under both high (H) and medium (M) class rules. These rules indicate that wind speed increases electrical efficiency by lowering the temperature on the PV surface. Polcovnicu et al. reported in their experimental study on different PV modules that a temperature drop of approximately 10 °C was observed at wind speeds of 5–7 m/s, resulting in an efficiency increase of up to 6% [
60]. Wind provides natural cooling from the back surface of the panel, reducing efficiency losses due to overheating. For SAH systems, the ws parameter is again observed in both H and L classes, as shown in
Table 10 and
Table 11. These rules also indicate that wind can increase heat losses around the collector, potentially reducing exergy efficiency. Hassan et al. emphasized that convective heat losses from external flow in SAH collectors significantly increase at high wind speeds, which can negatively affect energy efficiency, particularly in systems with low insulation [
61]. In conclusion, the ws parameter is generally positive for PV systems. It should be controlled for SAH systems, and this dual effect aligns with the multi-classifications in the rule-based modeling.
3.4.4. Solar Radiation (sr) Effect
Solar radiation (sr) is one of the most fundamental environmental parameters that directly affect the performance of both PV and solar air heating (SAH) systems. According to
Table 8 and
Table 9 in this study, solar radiation (sr) is predominantly found in the high (H) and medium (M) efficiency classes in PV systems, indicating that increased solar radiation directly increases electricity production. Abdul-Ganiyu et al. noted that an increase in solar radiation directly increases PV output power and efficiency, but this can also raise the panel temperature, thereby limiting efficiency [
62]. For SAH systems, sr again stands out in high-efficiency classes in
Table 10 and
Table 11. El-Sebaey et al. demonstrated in their experimental study that solar radiation is the primary factor determining SAH collector efficiency, with an increase in radiation from 300 W/m
2 to 1000 W/m
2 resulting in an over 25% increase in thermal efficiency [
63]. However, it has also been reported that excessive radiation can lead to temperature-related losses in both PV and SAH systems. In this context, the weight of the sr parameter in the model is highly consistent with both the operational logic of PV and SAH systems and the literature.
3.5. Comparison of the Rules Obtained with Different Machine Learning Methods
In
Table 12,
Table 13,
Table 14 and
Table 15 below, the classification accuracies of models created using artificial neural networks (MLP), SVM, k-NN, NB, and the proposed explainable artificial intelligence method (CRb-SPEA2) are compared. This comparison allows for the evaluation of both explainability and model performance.
An examination was conducted of the rule extraction and performance metrics belonging to the datasets Ƞenergy PV, Ƞexergy PV, Ƞexergy SAH, and Ƞexergy SAH. The data were then subjected to classification according to the H (High), M (Medium), and L (Low) ranges. The new application was coded in Python 3.1 and the WEKA 3.8.6. program was employed for the purpose of comparison with classical machine learning (ML) methods. The following classical machine learning methods were employed: MLP, SVM, IBk (k-NN), and NB. Upon examination of the comparison tables, it was found that no algorithm surpassed the performance of the proposed CRb-SPEA2 algorithm in terms of Acc values across all datasets. In the Nenergy PV dataset, the highest Acc and Pre values for class H were achieved by CRb-SPEA2, and the Rec value equaled that of the NB algorithm. For class M, the most successful Acc and Prec results were achieved with the CRb-SPEA2 algorithm, while the SVM algorithm demonstrated a superior performance in the Rec value. For class L, the Acc and Rec values once again attained the highest values with CRb-SPEA2, while the Pre value yielded superior results in SVM. In general, there was no algorithm that was able to be considered as dominant in relation to the CRb-SPEA2 algorithm.
An investigation was conducted into the values for the Ƞexergy PV dataset, and it was determined that classical ML methods were unable to exceed the CRb-SPEA2 algorithm in terms of Acc values. The preliminary value for all categories was also minimal in classical ML methodologies, and the Rec values likewise yielded the same outcome as CRb-SPEA2. Once more, the CRb-SPEA2 algorithm yielded optimal outcomes in this particular dataset.
An examination of the classification of the Ƞenegy SAH dataset reveals that the CRb-SPEA2 algorithm has demonstrated efficacy in the Acc value H and L classes, while the MLP algorithm has yielded the optimal result for the M class. It has been demonstrated that CRb-SPEA2 has also been successful for the Pre and Rec values in the H class. The MLP algorithm has demonstrated optimal performance for the Pre value, while the SVM algorithm has exhibited superior performance for the Rec value in the M class. In the L class, the CRb-SPEA2 algorithm has achieved the best result in conjunction with NB for the Pre and Rec values.
When the Ƞexergy SAH dataset is considered, the highest Acc value is achieved with the CRb-SPEA2 algorithm in all classes. The optimal Pre value is attained with the CRb-SPEA2 and MLP algorithms in the H class, and no classical ML algorithm has surpassed the CRb-SPEA2 algorithm in the M and L classes. When the Rec value is considered, the NB algorithm produced the optimal result in the H class, and the CRb-SPEA2 algorithm was successful in the other classes.
As shown in
Table 12,
Table 13,
Table 14 and
Table 15, CRb-SPEA2 generated non-dominated results in all data mining experiments. In addition to this high performance, the most effective feature of CRb-SPEA2 is its ability to inform the decision-maker of the attributes taken into account and the ranges in which they apply. Furthermore, as it uses a multi-objective mechanism, it provides different solutions with varying degrees of effectiveness, a feature not found in other studies. The metrics used here are those commonly employed in the field of data mining, specifically for rule extraction and classification. In this respect, obtaining automatically generated rule sets with a data mining approach using a metaheuristic search mechanism is one of the main differences that distinguish this study from other studies.
4. Conclusions
In this study, the energy and exergy efficiencies of PV and SAH panels tested in a climate-controlled chamber were experimentally investigated, and the obtained data were classified and evaluated using explainable artificial intelligence (XAI) methods. The monthly average energy efficiency of the PV panel ranged from 6.8% to 23.8%, while the exergy efficiency was observed at between 3.3% and 12.6%. The energy efficiency of the SAH system ranged from 19% to 68%, while the exergy efficiency ranged from 1% to 12%. These results indicate that the SAH system has a wider efficiency range compared to PV panels in thermal energy production. However, the PV system has a higher potential for producing higher-quality energy in terms of exergy.
When the rules obtained using explainable artificial intelligence were analyzed, it was found that the PV system achieved high energy efficiency under conditions where the panel temperature was generally between 25 and 32 °C, the ambient temperature was between 6 and 15 °C, solar radiation was above 330 W/m2, and wind speed was between 1.3 and 1.9 m/s. The high exergy efficiency of the PV system, on the other hand, was observed under cooler air conditions (ta: 8–18 °C) and panel temperatures ranging from 8 to 16 °C. On the other hand, high energy efficiency in the SAH system was observed under conditions where tsah: 59–83 °C, sr > 830 W/m2, and ws ≈ 1.5 m/s. The exergy efficiency of the SAH system increased under conditions of low ambient temperature, high irradiance, and SAH surface temperatures ranging from 50 °C to 67 °C.
In conclusion, while thermal accumulation must be controlled and the panel surface must not overheat for the PV panel to operate at optimal efficiency, the efficiency of the SAH system depends on the provision of thermal loads that create a high-temperature difference. The rules obtained through explainable artificial intelligence reveal the environmental parameters under which PV and SAH systems achieve maximum performance in various climatic conditions, providing valuable insights for future system optimization through intelligent control algorithms.
The first research question addressed in this study is “Can a test chamber be designed to investigate the effects of environmental parameters (temperature, relative humidity, wind speed, and radiation) on FSP performance, and can artificial intelligence models be developed to express the performance values of the panels using the obtained data?” Thanks to the fully automated climate chamber and halogen projector-based solar simulator (HPS) designed in this study, a 12-month dataset representative of the Antalya climate was created, and CRb-SPEA2-based explainable artificial intelligence models were successfully developed using this dataset. These models generated rules that reveal the basic climate parameters determining the energy and exergy efficiencies of the panels, thereby providing a positive answer to the research question in terms of both experimental design and artificial intelligence-supported analysis.
The second research question is “Can explainable artificial intelligence-based rules that express the performance of the panels be produced using datasets obtained by examining the performance of FSP in laboratory conditions under the climate conditions of different locations to be determined?” Although the CRb-SPEA2-based rules obtained in this study were created using only Antalya’s data, they have an environmental parameter-based structure. Therefore, they can be directly applied in other regions with similar climate profiles. Thus, the developed method provides an explainable and engineering-applicable framework for different geographies. In the future, the regional adaptability of the model will be further enhanced with the addition of datasets from various climate types.
