Abstract
In the framework of global efforts to mitigate climate change and in alignment with the “Dual Carbon” objectives, the construction sector, a fundamental cornerstone of the national economy, has garnered significant attention concerning its development and carbon emissions. This study collected data from the construction sector across 30 Chinese provinces (including autonomous regions and municipalities) to develop an evaluation index system for assessing high-quality development. The random forest algorithm was utilized to assess the levels of high-quality development, whereas the carbon emission factor approach was used to quantify emissions at the provincial level. Subsequently, a coupling coordination model was employed to analyze the interrelationship between development levels and carbon emissions. Key findings indicate the following: (1) China’s construction sector has shown sustained improvement in high-quality development; however, significant regional disparities persist, with eastern provinces (e.g., Beijing, Jiangsu) outperforming their central and western counterparts (e.g., Guangxi, Guizhou). (2) Carbon emissions from the construction sector exhibited an M-shaped fluctuation pattern, characterized by an increase from 2013 to 2014, followed by a decline in 2015, a subsequent recovery from 2016 to 2019, a transient decrease in 2020, and an eventual rebound in 2021 and 2022. Spatially, the developed coastal provinces of Jiangsu and Zhejiang exhibited significantly higher carbon emissions compared to regions such as Hainan and Ningxia. (3) The coupling coordination degree indicated a gradual increase from 0.50 to 0.55 (mean values); however, 78% of provinces remained at the “barely coordinated” level (0.5 ≤ D < 0.6), leading to a notable spatial distribution that is marked by elevated values in the eastern and southern regions, while exhibiting reduced values in the western and northern areas. Regional divergence was observed through four characteristic evolutionary trajectories: eastern China exhibited a U-shaped recovery, western China maintained linear growth, central China experienced inverted V-shaped fluctuations, and northeast China displayed W-shaped oscillations.
1. Introduction
In the context of global climate governance, carbon emissions have emerged as a critical issue in the sustainable development strategies of most countries. In recent decades, the construction sector has played a pivotal role in supporting China’s national economy., exerting a profound influence on national economic progress. Concurrent with the acceleration of urbanization, China’s construction industry has experienced remarkable development, with large-scale infrastructure projects acting as a primary catalyst for economic growth and job creation. However, the construction industry emissions spanning the full life cycle of buildings. Efforts to improve this situation carry significant implications for both environmental conservation and climate action.
The concept of sustainable development, emphasizing energy-saving, low-carbon emissions, and environmental protection, has acquired widespread acceptance. Consequently, the advancement of low-carbon development within the construction sector has emerged as an inescapable trend. While ensuring economic contributions and fulfilling construction tasks, the construction industry accentuates the synergistic improvement in resource utilization efficiency, environmental friendliness, and technological innovation. Regarding the development levels of the construction sector across various regions, Zhang Lixin posits that industrial scale, innovation drive, and environmentally sustainable practices are crucial determinants impeding the low-carbon progression of the industry [1]. Concurrently, Zhang Kai proposes that China has made substantial progress in several key areas, including green building policy guidance, development rates, standardization and assessment, technical completeness, and financing synergies. Nonetheless, he identifies significant challenges related to the promotion of popularization, technological innovation, regulatory systems, and public awareness, among other factors [2]. Within the framework of sustainable development, Zhou Xianghong puts forward that the requirements to facilitate low-carbon advancement within the construction sector extend beyond mere improvements in quality and efficiency. Instead, the emphasis should be placed on realizing objectives related to low-carbon emissions, environmental preservation, and sustainable development throughout the entire building process [3]. In this context, investigating the interrelationship between the two is of substantial theoretical and practical significance.
This research endeavor seeks to comprehensively examine the developmental stages of the construction sector across each province in China from 2013 to 2022, along with the associated carbon emission levels and their interrelationships. The construction industry is assessed using a scientifically sound and rational evaluation index system. This system assesses the developmental levels of the construction industry and quantifies the total carbon emissions generated by this sector in the provinces. The carbon emission factor approach is employed for relevant calculations. Accordingly, using the coupling coordination degree model, we calculate the extent of alignment between construction industry growth and carbon emissions. The principal innovations of this study are twofold: first, machine learning approaches were employed to enhance the objectivity and accuracy of the evaluation of construction sector development; second, we systematically investigate, for the first time, the coupling coordination characteristics between construction development and carbon emissions, thereby providing novel analytical perspectives and a scientific basis for formulating region-specific low-carbon development policies.
2. Literature Review
2.1. Development of the Construction Industry
As a foundational industry, the construction industry is posited by Wang D. to position its high-quality development as a vital strategic lever for promoting the national industrial upgrading [4]. Guided by a forward-thinking development philosophy, China’s construction industry has delivered a consistent growth trajectory, characterized by ongoing scale expansion, structural optimization, and strategic spatial reorganization. This sector plays an indispensable role in fostering economic expansion, catalyzing social progress, and enhancing human well-being. When analyzing the essence and features of high-quality development, most researchers rely on five concepts, “innovation, coordination, sustainability, openness, and shared growth”, to analyze its multidimensional framework [5,6,7]. Building on these concepts, scholars have systematically explored the evolution patterns of the construction sector, the design of assessment frameworks, the key determinants of high-quality growth, and sustainable construction practices through multi-disciplinary approaches. Specifically, as documented in prior research [1,2,3,8,9,10], the evolutionary trajectories and structural transformations within the construction sector have significantly influenced global economic systems [11] and societal frameworks through technological innovations and policy interventions. Sun and Wang highlight that technological advancements, intensifying ecological crises, and transformations in the global economic system have exacerbated systemic stressors within China’s construction sector [12,13]. However, most existing studies prioritize macro-level characterizations, the interplay between regulatory frameworks, and market-driven dynamics when determining what shapes the evolution of the construction sector. Liu and Wang emphasize the crucial role of technological innovation in driving the expansion within the construction industry [14,15]. Conversely, Agenbag posits that innovations may negatively impact the labor market within the construction sector [16]. Technological advancements in the construction sector may concurrently generate systemic challenges, including workforce displacement and occupational skill gaps, despite fostering industrial growth. Consequently, future research should focus on analyzing the effects of technological innovation within the construction sector on workforce dynamics and developing adaptive mitigation strategies. The incorporation of artificial intelligence (AI) within the construction sector has increasingly become a focal point of scholarly inquiry, reflecting its transformative potential in modern industrial practices. Regona, M. and Yousif, O.S. explored the potential applications of AI in the architectural development stages, emphasizing that the strategic integration of digitization in the construction industry may substantially boost operational efficiency and data-driven decision frameworks within construction management [17,18,19]. Feng and Ouyang [20,21] conducted multi-level analyses of energy management systems, demonstrating through governmental and provincial case studies that optimized governance mechanisms significantly enhance sustainable energy practices in construction sectors. In research concerning the sustainability of the building industry, Moshood, T.D., proposed evidence-based criteria for environmentally responsible projects [22]. Alfira, Hua, X., and Yang, Y. conducted in-depth studies on sustainable development paradigms through multi-scalar governance models, employing spatial econometric methods to establish strategic pathways for construction sector advancement at national, provincial, and municipal administrative tiers [23,24,25].
2.2. Carbon Emissions
Carbon emissions originating from the construction sector have emerged as a critical issue necessitating swift action. Researchers and policymakers have shown considerable interest in exploring potential strategies for reducing these emissions [26]. China’s construction industry aims to achieve the dual goal of green and low-carbon development [27]. The Chinese government has enacted a set of policies aimed at fostering energy efficiency and reducing carbon emissions within this sector [28,29]. When measuring carbon emissions, Li Xiaodong evaluated carbon quantification methodologies through a comparative analysis of prevalent emission calculation frameworks in building life cycle assessments [30]. Li, F. and Zheng, C. employed a multi-method approach to quantify carbon emissions in an identical industry [31,32]. Lu K. developed a comprehensive database, known as the Carbon Emission Factor (CEF) database, to delineate the temporal dynamics of carbon emissions [33]. In the field of carbon reduction technology, Rinne, R., Han, Q., and Erdogan, S. investigated innovative technologies and their feasibility in China [34,35,36]. Liao, B., Xinbo Xu, and Sun, S. et al. proposed a strategy to reduce carbon intensity per unit output in the construction sector by optimizing energy-efficient building practices and advancing modular construction technologies. They also examined the main distinctions between direct and indirect carbon emissions [37,38,39,40]. Zhang P. analyzed the dynamics of carbon emissions and identified substantial discrepancies in emission reduction capacity and motivation among Chinese provinces [41]. Moreover, Jiang, B. and Li, D. researched the carbon emissions determinants in the construction industry from three distinct perspectives: economic drivers, technological adoption rates, and regulatory frameworks in building projects [42,43,44]. Concurrently, Guo, X., Zheng, S., and Lu, N. conducted an investigation into the temporal and spatial dynamics of greenhouse gas emissions within the construction sector of China, revealing regional disparities and trends through geospatial analysis [45,46,47,48,49]. Du, Q. focused on carbon emission intensity [50], while Onat Nuri examined the carbon footprint of the construction industry [51]. Additionally, Ram L. and Chen J. analyzed the fluctuations in carbon emissions within the building industry during the COVID-19 pandemic. Their analysis included the discernible features and root causes of these fluctuations. The researchers evaluated the epidemic’s impact on the industry’s carbon emissions and proposed strategies for emission reduction during this unparalleled period [52,53].
2.3. Coupled Coordination Studies
To date, researchers have compiled a considerable volume of research concerning two critical themes: “construction industry development” and “carbon emissions in the construction industry”. In the cross-disciplinary research area, Zhang L., based on a spatial measurement model, reveals significant regional differences in China’s construction sector. His research indicates that the green energy-saving index exhibits explicit spatial differentiation patterns, and that financial expenditures, alongside a range of socio-economic and institutional factors, demonstrate pronounced spatial heterogeneity [54]. However, the primary focus of the study lies in illustrating regional disparities, with a lack of in-depth analysis regarding the formation mechanisms of these differences and their corresponding coping strategies. Li, Y. et al. carry out a meticulous review of the contemporary state of the construction sector, its most pressing challenges, and long-standing issues. They innovatively construct a “1 + 5 + N” development index system and proposed corresponding optimization pathways. The prior research underscores the importance of accelerating the transformation of the construction industry by reinforcing the policy framework and increasing investment in technological innovation [28]. Wang et al. incorporate the carbon emission index into the assessment framework for the construction sector. Their findings indicate that the technological level is the primary contributor to regional disparities. The study further confirms that the urbanization process and carbon emission constraint policies are the primary driving factors in the industry [55]. However, the study mainly concentrates on analyzing contributing elements and lacks a holistic assessment of the synergies among multiple factors. Recent scholarly attention has pivoted toward the synergistic development patterns between the construction industry and other economic sectors. Current research efforts have focused on investigating the interrelationships and coordination mechanisms among the various dimensions of the digital economy [56], regional economy [57], new urbanization [58], green economy [59], and the progress in the building sector. The findings of these studies furnish noteworthy theoretical foundations and methodological guidance, facilitating a deeper exploration into the collaborative growth dynamics between the construction industry and carbon emissions. However, the current literature has extensively concentrated on constructing theoretical frameworks, with a gap in empirical research addressing specific practical effects.
Building upon existing research, this study expands the investigation to a national scale by utilizing provincial panel data from 2013 to 2022 to systematically examine their coupling coordination relationship. The study period was selected based on three considerations: (1) policy evolution perspective—spanning the final phase of the 12th Five-Year Plan (2013–2015), the entirety of the 13th Five-Year Plan (2016–2020), and the initial stage of the Dual Carbon Strategy (2021–2022), effectively capturing policy-driven transitions from scale expansion to green and low-carbon development in the construction sector; (2) major events perspective—this period encompasses both the phase of ecological civilization intensification (2013–2018) and the impacts of the COVID-19 pandemic, alongside industry recovery (2019–2022), facilitating an analysis of dynamic emission response mechanisms under external shocks; (3) data accessibility—datasets utilized in this study were sourced from the National Bureau of Statistics’ China Construction Statistical Yearbook and the annual reports of the Ministry of Housing, thereby ensuring authoritative and verifiable data quality. Consequently, we developed a coupling coordination model integrated with multifactor interaction analysis to elucidate the mechanisms of regional disparities and to formulate mitigation strategies. Finally, we proposed empirically grounded and actionable low-carbon development strategies.
3. Materials and Methods
3.1. Construction Industry Development Level Indicator System Construction
In alignment with the “14th Five-Year Plan for the Development of the Construction Industry”, as outlined by Chinese authorities, this research establishes a multi-dimensional evaluation index system integrating environmental, economic, and social metrics to advance sustainable transformation in the built environment sector. The criteria for indicator selection within the evaluation framework integrate the principles of accessibility and scientific rigor, encompassing key aspects such as development scale, innovation, livelihood development, green development, and coordinated development. Within the construction industry subsystem, 20 fundamental indicators were selected for comprehensive evaluation. These indicators are derived from the relevant studies of Zhang Lixin, Wang Li, and Wu Xianghua regarding the evaluation of development in the construction industry [8,9,10]. The evaluation index system is presented in Table 1.

Table 1.
Construction industry development level evaluation index system.
3.2. Random Forest Algorithm
Random forest is a decision tree-based ensemble method that enhances predictive performance through bootstrap aggregation (bagging) and feature subspace randomization. The algorithm constructs multiple decorrelated trees via bootstrap sampling with replacement, then aggregates predictions through majority voting. Ying Wu’s application of the algorithm in bridge construction risk assessment demonstrates that the system processes multivariate datasets and extracts critical risk determinants through permutation-based feature importance analysis [60]. This approach aligns with the original random forest algorithm proposed by Breiman et al. [61], emphasizing the incorporation of randomness to optimize the model generalization. In this study, variables affecting the growth of the construction sector are utilized as features in the random forest algorithm, with the development level serving as the target variable for prediction. The precise implementation procedures can be distilled into three key steps, as depicted in Figure 1:
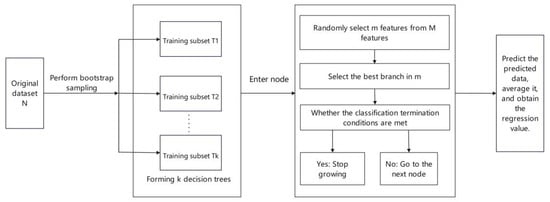
Figure 1.
Random forest prediction model construction process.
- The first approach employs a bootstrap sampling method that involves randomly selecting k samples from an original dataset of size N. Subsequently, this process facilitates the construction of k independent decision trees.
- During the construction of individual decision trees, each node evaluates a random subset of mfeatures (where m < M) from the total feature space of size M. Among these m features, the most suitable one is chosen for node splitting. This iterative process continues until a predefined stopping criterion is satisfied.
- The constructed decision tree should be utilized to predict new data. Subsequently, the prediction results of all trees should then be averaged to obtain the final regression output. Concurrently, the mean square error (MSE) is calculated to evaluate the model’s accuracy. The formula for the MSE is as follows: n is the number of test samples, denoting the true value of the first sample. The divergence between the predicted and observed values is measured by computing the root mean square error (RMSE), which is utilized to assess the performance of the model.
3.3. Carbon Emission Factor Method
Various methods are adopted to measure carbon emissions, including but not limited to the carbon emission factor method [33], the material balance method [62], the input–output method [63,64], and the comprehensive life cycle assessment approach [65,66]. Each method operates within defined application domains and offers distinct analytical strengths. Primarily, the carbon emission factor approach quantifies carbon emissions by applying established emission factors to specific activity data, reflecting the specific operational conditions and processes involved. Furthermore, real-world implementations of this method provide empirical support for its applicability [33,41,67]. Considering the calculation methodology, carbon emission activities are classified into direct and indirect emissions. Direct emissions primarily arise from the immediate consumption of energy during the production processes within the construction sector; in contrast, indirect emissions encompass those associated with the production and transportation of construction materials utilized throughout the project life cycle. This study draws on the existing literature [45,50,68]. The analysis incorporates 13 energy resource categories, including raw coal, other coal, washed coal, coke, gasoline, kerosene, diesel, fuel oil, LPG, natural gas, crude oil, and electricity. Additionally, this study focuses on four carbon-intensive construction materials—cement, steel, glass, and aluminum—based on their embodied carbon coefficients when evaluating direct carbon emissions in the construction sector. Based on the methodology recommended by the IPCC, the modeling is as follows:
In the above formula, denotes the aggregate carbon emissions generated by the construction sector. represents direct carbon emissions and denotes indirect carbon emissions. is the consumption of the i-th type of energy, is the average lower heating value of that energy, is the carbon content of the energy, and signifies the rate of carbon oxidation. is the electricity consumption; is the carbon emission factor of electricity. is the thermal energy consumption, indicating the carbon emission factor for thermal energy. Mj is the consumption of the j-th type of building material, is the carbon emission factor for that building material, and is the recycling rate of the building material.
3.4. Coupling Degree and Coupling Coordination Modeling
This paper draws upon the research conducted by Wang and Zhang pertaining to the interrelationship between regional sustainable development and tourism development within the framework of the “Beautiful China” initiative [69]. In addition, this research builds upon Zhan Cheng and Feng Yin’s research to analyze synergistic mechanisms between new urbanization efficiency and low-carbon transitions in Yangtze River Economic Belt cities [70]. The coupling degree represents the extent of synergistic interactions between construction industry development indices and carbon emissions trajectories. However, exclusive reliance on the coupling degree indicator may result in misleading assessments, particularly in transitional economies where provincial construction sector development indices and carbon emission trajectories exhibit interdependent yet disparate growth patterns. According to the coupling degree model, a higher coupling degree (D) indicates a greater level of coordinated development between the construction sector and carbon emissions. With reference to relevant studies [71,72],the results are summarized in Table 2, along with the formulas for the degree of coupling coordination, which are outlined as follows:
where α, β are weighting parameters, assigned equal values (α = β = 0.5) based on the equal-weighted influences.
C = [(f1 × f2)/(f1 + f2)2]1/2
D = (CF)1/2
F = αF1 + βF2
Table 2.
Coupling coordination degree rating class division.
3.5. Data Sources and Data Processing
3.5.1. Data Sources
Thirty Chinese provincial-level administrative regions are included in the analysis based on the reliability and availability of the data. However, due to limitations in data availability, this research excludes Taiwan Province as well as the special administrative regions of Hong Kong and Macau, along with Tibet Autonomous Region. The data primarily derive from the China Statistical Yearbook, China Energy Statistical Yearbook, China Construction Statistical Yearbook, and provincial and municipal statistical yearbooks covering the period from 2014 to 2023. Linear interpolation is applied to estimate missing observations in the dataset. The subsequent section provides further analysis. The average lower heating value of energy and the conversion factor for converting energy into standard coal equivalents are derived from the General Rules for Calculating Comprehensive Energy Consumption. The carbon oxidation rate associated with energy is derived from the Guidelines for the Preparation of Provincial Greenhouse Gas Inventories, while carbon emissions from electricity are measured based on the average value of the OM for each province in the Baseline Emission Factors for Regional Power Grids in China. Indirect carbon emissions from the construction industry are measured. The recycling coefficients for building materials are derived from the Interim Measures for the Administration of Energy Saving and Low Carbon Technology Promotion, along with the other relevant literature. These coefficients account for the practical recycling processes of construction materials.
3.5.2. Data Processing
- Data standardization:
A curated dataset comprising 30 provinces nationwide was established for analysis, evaluating five key dimensions: development scale, innovation drive, livelihood development, green development, and coordinated development. To mitigate scale-induced bias from varying measurement units, the dataset was preprocessed through Min–Max normalization. The formula used for this standardization is as follows:
where Yi is the input variable, Xmin refers to the minimum value in the input variable, and Xmax represents the maximum value in the input variable.
Positive indicator: Yi = (Xi − Xmin)/(Xmax − Xmin)
Negative indicator: Yi = (Xmax − Xi)/(Xmax − Xmin)
- 2.
- Constructing evaluation index grading criteria
The Jenks method is recognized as an effective approach to data classification [73]. This study implements the Jenks method within random forest algorithms, as pioneered by Wang Qisheng [74]. This method partitions datasets by identifying natural groupings inherent in the data, with the aim of maximizing intra-group homogeneity while minimizing inter-group similarity. This data-driven partitioning strategy significantly reduces the subjectivity associated with artificial classification boundaries. It accurately reflects the intrinsic structures and distribution patterns of the data, thereby facilitating the construction of more discriminative features and enhancing the predictive performance of the model [75]. Given the prevalent skewed distributions observed in the data of the indicator system, this method was selected for constructing the evaluation indicators of development levels in the construction industry for this study. Operationally, the 20 indicators selected across five dimensions—development scale, innovation drive, livelihood development, green development, and coordinated development—were classified into five tiers based on their respective intrinsic distribution characteristics. The specific classification criteria are presented in Table 3.
Table 3.
Construction industry development level indicator grading criteria.
4. Results
4.1. Evaluation of the Development Level of the Construction Industry Based on the Random Forest Model
The random generation method was used to generate 200 groups of random samples at each evaluation level, across a total of five levels. These samples were subsequently classified into a test set and a training set, with a ratio of 1:4. Furthermore, the model utilized grid search optimization with the following hyperparameter configuration: n_estimators = 190, max_depth = 20, min_samples_split = 4, min_samples_leaf = 2, max_features = 15, bootstrap = True, and random_state = 42. The model received standardized inputs from 20 indicators, with the target variable X21 serving as the output. Five-fold cross-validation demonstrated the stability of the model, yielding a mean R2 of 0.95 (±0.00) and a mean squared error (MSE) of 0.11 (±0.01), suggesting its suitability for conducting a thorough evaluation of the development level within the construction sector. Accordingly, the standardized construction industry data for each province and city were input into the optimized model, and the evaluation results are presented in Table 4.
Table 4.
Evaluation of the level of development of the construction industry in the provincial-level administrative regions, 2013–2022.
Evaluation Results: As shown in Table 4, the 30 regions in China unveil considerable geographic disparities in terms of construction industry development level scores. The economically advanced eastern regions, such as Beijing and Jiangsu, have maintained a leading position for an extended period. Beijing ranks first, with an average score of 2.95, achieving a peak score of 3.45 in 2021, thereby affirming its standing as the political and economic nucleus of China; Jiangsu follows, with an average score of 2.92, demonstrating a robust and stable growth. Meanwhile, provinces such as Fujian and Anhui exhibit a significant upward trend, particularly Fujian, which has increased from 2.12 in 2013 to 2.79 in 2022, indicating strong development potential. However, the development of certain regions, such as Tianjin and Zhejiang, has fluctuated or even declined. Tianjin decreased from 2.88 in 2013 to 2.35 in 2018, while Zhejiang has experienced a consecutive decline over four consecutive years since 2018, which can be attributed to escalating challenges in advancing industrial restructuring and transformational upgrading.
Notably, the overall development level of central and western regions is low in contrast to the eastern areas, with provinces such as Guizhou and Gansu displaying an average score of less than 2.1, highlighting regional developmental disparities. These findings exhibit strong consistency with the conclusions of Zhang et al. concerning the regional inequalities in the developmental progress of China’s construction sector [1]. As for development resilience, provinces such as Hubei and Shaanxi exhibit a stable upward trend, whereas regions like Inner Mongolia and Ningxia display significant fluctuations, underscoring differences in their ability to cope with economic disruptions and adjust to new policies. These data not only shed light on the spatial distribution of construction industry development in China but also provide a vital resource for formulating localized approaches to policy-making.
From 2013 to 2022, the score of China’s construction sector development level has exhibited a consistent upward trajectory (Figure 2), reflecting a 15% increase in the composite score over the decade and signifying the industry’s sustained advancement. The reduction in growth rates from 2013 to 2016 may be attributed to the prevalence of a conventional and rudimentary model within the construction industry. Following 2017, the growth rate has experienced an increase, spurred by government policies intended to foster the transformation and modernization of the construction sector, particularly through the introduction of advanced assembly techniques. However, in 2020, the score witnessed a brief decline due to the repercussions of the novel coronavirus epidemic; nevertheless, the industry demonstrated resilience, driven by the “new infrastructure” policy, followed by a swift recovery and a new peak in the subsequent year. In 2022, the score rose to 2.51, indicating that the construction industry made pronounced advancements in the areas of intelligence and sustainability during the 14th Five-Year Plan period. These advancements align with the “dual-carbon” objective and the requirements for sustainable development. China’s construction industry is undergoing a gradual transition, shifting its focus from mere scale expansion to place greater importance on technological innovation and sustainable development. The score curve verifies the shift.
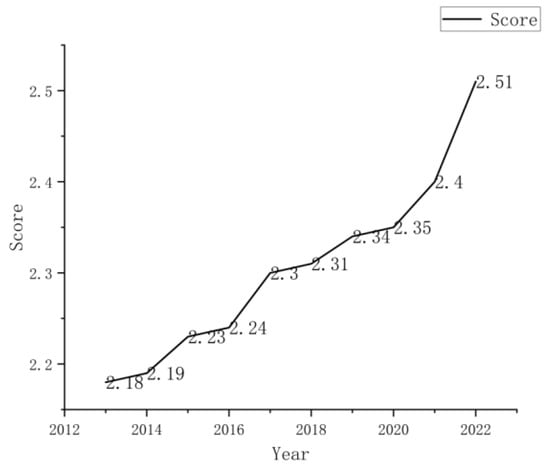
Figure 2.
National construction development level, 2013–2022.
4.2. Measurement of Carbon Emissions from the National Construction Industry
Utilizing the referenced carbon emission measurement model, we calculated the construction sector’s carbon emissions across 30 Chinese provinces (excluding Tibet, Taiwan, Hong Kong, and Macau) from 2013 to 2022. To visually represent the spatiotemporal trends and regional disparities, these results are presented in a heatmap (Figure 3), where color gradients reflect emissions across provinces and years.
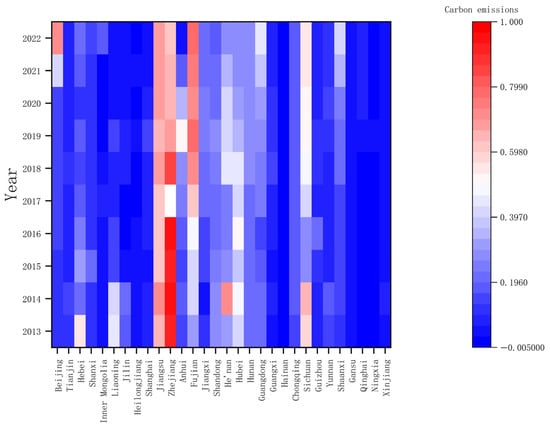
Figure 3.
Heatmap of construction industry carbon emissions in China’s 30 provinces (2013–2022).
As illustrated in the table above, carbon emissions in China’s construction sector exhibit significant spatial heterogeneity. Specifically, economically developed coastal provinces, such as Jiangsu, Zhejiang, and Guangdong, exhibit substantially higher carbon emission intensities compared to other regions, primarily due to their high-density construction activities and scale effects of the economy. This spatial distribution pattern aligns closely with the findings of Wen et al. (2022) concerning the geographical patterns of construction-related carbon emissions in China [76]. The rapid development of the construction sector in these regions, characterized by frequent infrastructure projects such as roads, bridges, and buildings, directly contributes to increased carbon emissions. By comparison, regions with smaller economic scales and limited construction activities, such as Hainan, Ningxia, and Qinghai, have lower carbon emissions.
The carbon emissions of each province were categorized by region, as shown in Figure 4.
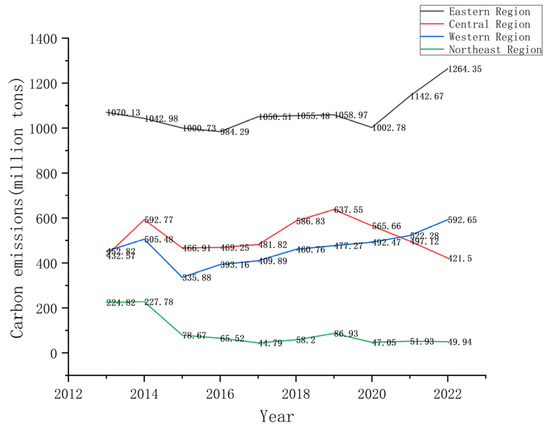
Figure 4.
Trends in construction-related carbon emissions across regions (2013–2022).
The comparative data visualization reveals significant disparities in construction-related carbon emissions across the major regions of China, with the eastern coastal areas consistently exhibiting higher emission levels than those in the central-western and northeastern regions. The relatively lower carbon emissions observed in the central, western, and northeastern regions may be linked to recent industrial restructuring efforts implemented in these areas. The upgrading and modernization of industrial infrastructure, combined with population decline, have reduced energy consumption in the construction sector.
As depicted in the Figure 5, China’s construction industry displayed a notable “M” fluctuation pattern in its carbon emissions from 2013 to 2022. Between 2013 and 2014, which coincided with the mid-term phase of the 12th Five-Year Plan, the accelerated implementation of new urbanization strategies was accompanied by sustained annual growth of over 20% in national real estate development investment. The initiation of numerous conventional construction projects resulted in significant increases in carbon emissions. China’s ongoing urbanization process experienced substantial advancements. Serving as a pivotal support sector in this process, the construction industry undertook numerous initiatives, spanning residential, commercial, and infrastructural developments. The increase in new projects led to a surge in the production and utilization of construction materials, consequently resulting in additional carbon emissions. From 2014 to 2015, China initiated a shift in its economic structure, transition, accompanied by restrictions and cancelations of specific construction projects characterized by high energy consumption and pollution levels. For instance, in 2014, Tangshan City in Hebei Province—renowned as China’s “Steel Capital”—witnessed widespread closures of small-scale steel mills due to a market downturn and tightened environmental regulations. Consequently, the construction sector underwent a deceleration in growth, which resulted in a reduction in carbon emissions. Simultaneously, the government enacted a range of energy conservation and emissions reduction policies aimed at regulating energy consumption and emissions within the sector. These policies included the remediation of construction projects that failed to adhere to energy-saving standards, compelling construction companies to implement measures to reduce emissions. From 2015 to 2019, in order to bolster economic stability, China embarked on extensive infrastructure construction projects, including high-speed railways, urban transit systems, and bridges. These large-scale projects, distinguished by prolonged construction periods, exhibit substantial demand for construction materials, thus precipitating an escalation in carbon emissions. At present, the traditional practice of high-carbon emission construction still exists during this period. This is primarily due to the lengthy industrial chain of the construction industry and the time lag between the research and development of new technologies, as well as research and development regarding new materials and their widespread application. Between 2019 and 2020, the outbreak of the COVID-19 epidemic resulted in restrictions on mass gatherings involving production and construction activities within the construction industry, leading to the suspension or slowdown of some projects. The manufacturing and transportation of construction materials were also impacted, resulting in a decline in carbon emissions. Simultaneously, in the wake of several years of accelerated growth, the construction industry initiated a period of self-examination regarding its development model, characterized by significant energy consumption and emissions during the epidemic. This introspection prompted some enterprises to implement process optimizations in production and construction, adopting more eco-friendly building materials and construction technologies. Consequently, these efforts contributed to a decrease in carbon emissions. The rebound observed between 2020 and 2022 revealed fundamental contradictions in sectoral transition: under the pressures of “growth stabilization,” the widespread revival of traditional infrastructure projects, combined with the inadequate adoption of clean construction technologies (CCTs), triggered retaliatory surges in carbon emissions. This trajectory distinctly illustrates the tripartite interplay among policy oscillations, economic cycles, and technological substitution, offering a paradigmatic case for understanding the implementation challenges associated with the “dual-carbon” goals in the construction sector.
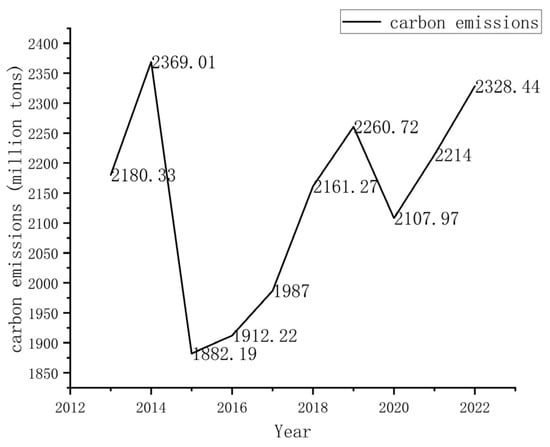
Figure 5.
Temporal variation in national construction sector carbon emissions (2013–2022).
4.3. Pearson Correlation Analysis
Following the methodology of Zhao et al. [77] in applying Pearson correlation analysis, we adopted this approach to examine the correlations between construction development level (CDL), carbon emissions (CE), and GDP. The detailed correlation coefficients are presented in Table 5.
Table 5.
Pearson correlation coefficient matrix.
Statistical analysis reveals a significant positive correlation between GDP and carbon emissions from the construction sector (r = 0.625, p < 0.01), confirming the driving effect of the expansion of economic scale on emission growth. This finding is consistent with the Environmental Kuznets Curve theory, which posits that economic development during industrialization exacerbates carbon emissions, particularly during phases of intensive construction activities.
A significant positive correlation (r = 0.557, p < 0.05) also exists between construction sector development level and carbon emissions, indicating an overall co-evolution coupled with notable asynchronicity and coordination complexity. For instance, regions like Beijing and Fujian have markedly reduced emission intensity through technological upgrades (e.g., BIM implementation, prefabricated construction), achieving a ‘high-growth, low-to-moderate carbon emission’ development pattern. These pronounced regional disparities and divergent pathways underscore the critical need to analyze the coupling coordination state and underlying drivers of construction development and the carbon emission system—the core focus of this study. Furthermore, GDP exhibits a moderate positive correlation with construction sector development level (r = 0.478, p < 0.05), suggesting economic scale is a necessary yet insufficient condition for high-quality sectoral growth. This implies the leading position of developed provinces (e.g., Jiangsu, Zhejiang) stems not merely from economic magnitude but crucially depends on technological innovation and synergistic policy coordination (e.g., green building initiatives).
4.4. Analysis of the Degree of Coupling Coordination
General Situation Analysis
After standardizing the data from the two systems, a coupling coordination degree model was employed to quantify the coupling coordination relationship between regional development levels and carbon emissions across China. The spatial heterogeneity of these relationships is visually represented in Figure 6a,b, which provides a multidimensional comparative analysis of regional characteristics. This graphical representation effectively illustrates both the overall coordination patterns and distinct regional disparities observed in the study.
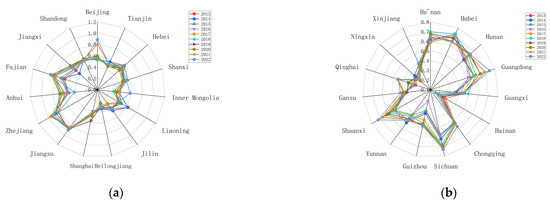
Figure 6.
Comparative radar chart of construction industry–carbon emission coordination degrees across 30 Chinese provinces. (a) Construction-Carbon Coordination: First 15 Provinces (Official Order). (b) Construction-Carbon Coordination: Next 15 Provinces (Official Order).
As shown in Figure 6, the coordination between construction industry development and carbon emissions across Chinese provinces exhibits pronounced regional heterogeneity and dynamic evolutionary characteristics. Coastal eastern provinces (e.g., Jiangsu, Zhejiang, and Fujian) demonstrate superior coordination indices, reflecting effective carbon intensity control during industrial expansion. This can be attributed to (i) the widespread adoption of green building technologies, (ii) the rapid proliferation of prefabricated construction, and (iii) the increased penetration of clean energy sources. In contrast, provinces such as Heilongjiang and Hainan demonstrate persistently low coordination levels, indicating dual constraints arising from dependence on fossil fuels and lagging low-carbon technological capabilities. Notably, the surge in coordination in Beijing post-2021 correlates strongly with the implementation of mandatory near-zero energy building standards, whereas the transitional fluctuations observed in central and western provinces likely result from construction-scale expansion outpacing the assimilation of emission-reduction technology during accelerated urbanization. Three pivotal determinants emerge: (1) interregional technology gradients, (2) energy mix profiles, and (3) the rigor of policy implementation. This necessitates the development of stage-specific decarbonization pathways tailored to regional development trajectories.
5. Discussion
5.1. Time Series Analysis
The data depicted in the figure illustrate a fluctuating upward trend in the CCD between construction quality development and carbon emissions in China from 2013 to 2022, revealing a dynamic equilibrium between policy interventions and industrial evolution. The modest increase in the CCD (from 0.505 to 0.513) during 2013–2014 resulted from green building standards implemented under the 12th Five-Year Plan; however, the surging emissions in 2014 indicated that scale expansion remained the dominant driver. The decline in CCD in 2015 was directly correlated with emission reductions resulting from the mandatory phase-out of obsolete capacity mandated by the Air Pollution Prevention Action Plan; however, the lagging growth in quality development exposed structural contradictions during this transitional phase. The recovery of CCD during 2016–2017 coincided with prefabrication policies that decoupled emission growth from quality enhancement (2.1% vs. 3.7% annual rates). From 2018 onwards, CCD optimization continued (maintaining a level of 0.524 during the 2020 lockdowns), demonstrating how the digitalization of the “New Infrastructure” strategy supported quality growth alongside reductions in emissions (−1.2% vs. +2.9%). Following the carbon peaking targets established post-2021, CCD exceeded 0.54, reaching a peak of 0.55 in 2022, demonstrating the policy synergy between dual-carbon goals and the 14th Five-Year Plan for Construction Development. This national trajectory exhibited regional gradients (see Table 6): eastern regions maintained leadership in CCD, with a U-shaped recovery observed post-2017 (Figure 7). Central regions exhibited an inverted-V decline. Western regions experienced linear growth supported by wind and solar projects. The northeast region exhibited W-shaped fluctuations. These patterns reveal uneven depths of transition across the regions.
Table 6.
Classification details of the four major economic zones.
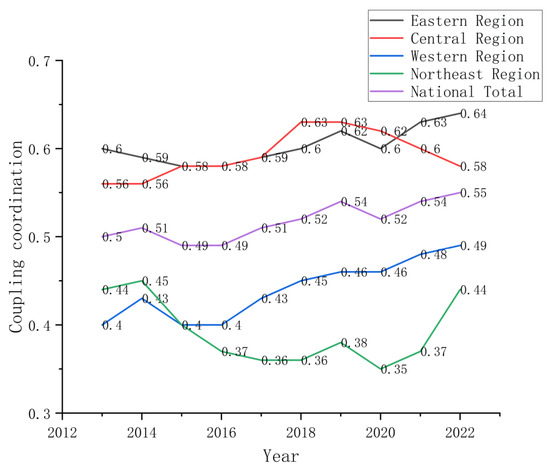
Figure 7.
Temporal variation in construction–carbon coupling coordination trend from 2013 to 2022.
5.2. Spatio-Temporal Evolution Characteristics
The coupling coordination degree between the construction industry’s development level and its carbon emissions was calculated for 30 provinces in China for the years 2013, 2016, 2019, and 2022. A spatial divergence map was generated using ArcGIS software (https://www.arcgis.com/index.html, accessed on 1 May 2025) to illustrate regional disparities (Figure 8).
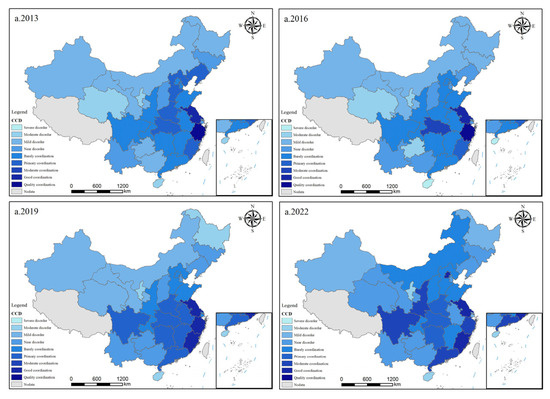
Figure 8.
Spatio-temporal evolution characteristics of the coupled coordination.
As illustrated in Figure 8, the coupling coordination degree exhibited pronounced spatial heterogeneity, demonstrating dynamic evolutionary trends across Chinese provinces. The temporal evolution revealed three characteristic patterns in the national average CCD, which increased from 0.505 (indicative of a barely coordinated level) in 2013: (1) the sustained expansion of premium-coordination provinces, which grew from Zhejiang and Jiangsu to include Fujian and others; (2) notable tier-jumping transitions, where Henan, Anhui, Jiangxi, and Sichuan upgraded from a barely coordinated to a moderately coordinated status in 2019; (3) remarkable improvements in lagging regions, where Qinghai, Gansu, and Inner Mongolia transitioned out of a mild imbalance status by 2022. Notably, regional disparities exhibited gradient amplification, with the conventional east–west gap evolving into an emerging north–south divide. This pattern of spatial differentiation emerged through the interplay of three key determinants. The primary determinant was regional variations in the timing and intensity of policy implementation, which created institutional dividends, whereby eastern coastal areas gained first-mover advantages through carbon trading pilots and green building incentives. Secondly, disparities in technological innovation played a pivotal role, as Beijing and Jiangsu established competitive advantages through building energy-efficiency R&D in higher education clusters. Lastly, the differential rates of energy transition exerted significant impacts, as Inner Mongolia and Shaanxi accelerated CCD growth through clean energy substitution, while fossil-dependent regions faced transition inertia. Collectively, these factors shaped the current spatial configuration of CCD through a tripartite interaction mechanism of “policy–technology–energy”.
6. Conclusions and Recommendations
6.1. Conclusion
Focusing on the period 2013–2022, this study comprehensively evaluates the developmental dynamics of the construction industry across 30 provincial-level administrative divisions in China. Concurrently, it estimates carbon emissions attributable to the construction sector and explores the interplay and coordination between industrial growth and emission trends. The following conclusions are drawn:
(1) This study innovatively employed the random forest algorithm to evaluate the development level of the construction industry. Machine learning assessments demonstrate consistent growth across the country; however, notable regional differences exist. Economically advanced provinces situated in the eastern region, such as Beijing, Jiangsu, and Zhejiang, have maintained a leading position for a considerable time due to their technological innovation, policy support, and industrial agglomeration. In contrast, regions such as Guangxi and Guizhou in central and western China are experiencing lagging indicators due to inadequate resource endowments, insufficient technology, and an underdeveloped industrial base. It is evident that the foundations in Fujian, Anhui, and other provinces are not robust. However, through policy guidance and technological upgrades, these regions have demonstrated the ability to achieve substantial annual growth rates. The industry is undergoing a comprehensive transformation, characterized by an increase in scale, enhanced quality, and improved efficiency. This transition is primarily driven by the principles of intelligence and sustainability.
(2) An examination of the national trend in carbon emissions from the construction sector indicates a distinct “M” shaped pattern. At the provincial level, there exists a significant variation in carbon emissions from the construction sector across different provinces. Developed coastal provinces, such as Jiangsu, Zhejiang, and Guangdong, present elevated carbon emissions as a result of substantial infrastructure development and vigorous economic activities, while regions such as Hainan and Qinghai demonstrate lower carbon emissions due to their economies and industrial structures. During the study period, policy-driven energy-saving and emission reduction measures (e.g., the promotion of assembled buildings) have started to yield benefits. However, the traditional high-carbon emission pattern remains prevalent, and carbon emissions produced during the production and construction phases of building materials remain a substantial challenge that necessitates immediate attention and resolution.
(3) This study employs a Coupling Coordination Degree (CCD) model not only to quantify regional disparities but also to establish a dynamic coordination evaluation framework that links construction industry development with carbon emissions. The national average CCD increased marginally from 0.50 in 2013 to 0.55 in 2022, indicating progressive synergy between construction development and carbon emission management; however, most provinces remained at a barely coordinated level. Four major regions exhibited distinct divergence patterns. The eastern region maintained its leadership with a pronounced U-shaped recovery trajectory, demonstrating its dual advantages in green technology innovation and policy responsiveness. The central region exhibited an inverted V-shaped fluctuation, revealing transitional characteristics during industrial restructuring. The western region achieved the most stable linear growth over the decade, demonstrating the effectiveness of the Western Development Strategy in fostering green construction practices. The northeast region experienced developmental stagnation characterized by prolonged low-level CCD fluctuations, highlighting unique challenges in revitalizing traditional industrial bases.
6.2. Recommendations
- (1)
- Upgrading the Construction Industry Development Level and Regional Coordination
To address regional development disparities in the construction industry, the following systemic measures are proposed: Increase fiscal investment in the central and western regions by establishing special funds to promote green buildings and prefabricated construction technologies. Develop technology transfer mechanisms and targeted assistance programs originating from eastern regions, while encouraging cross-regional industrial collaboration. Central and western regions should cultivate local building material industries and attract investments from eastern enterprises, with government subsidies supporting digital transformation. Strengthen partnerships between universities and industries for talent development, and establish regional innovation centers. Implement differentiated subsidy policies to support specialized construction sectors in the central and western regions. Eastern regions should concentrate on cutting-edge technology research and development (R&D), enhancing the capabilities of central and western regions through policy guidance and regional coordination. This integrated approach will facilitate the coordinated development of the national construction industry.
- (2)
- Systematic Control of Carbon Emissions in the Whole Chain of the Construction Industry
This discussion is grounded in the full life cycle of buildings. To reduce the carbon footprint during the operational phase, it is imperative to mandate the promotion of ultra-low-energy buildings and photovoltaic building-integrated construction technologies. To enforce economic constraints, policy synergy must be strengthened. The construction industry should be integrated into the national carbon market through the establishment of a carbon quota trading mechanism, while a tiered environmental tax on high-carbon projects should be implemented to incentivize cleaner production practices. Institutional support is also critical. A national carbon emissions platform dedicated to the construction industry should be established to enable real-time monitoring and data transparency. In addition, a “red–yellow–green” early warning mechanism should be applied to dynamically track the level of regional coupling coordination and identify areas requiring intervention. Furthermore, the Building Energy Efficiency Plan should be updated in a synchronized manner, with institutional reforms aligned with the “dual-carbon” goal. Green financial instruments—such as green bonds, loans, and insurance products—should be actively promoted to provide targeted funding support and policy guidance for low-carbon construction initiatives.
- (3)
- Coordinated Pathways for Synergistic Development Between Economic Growth and Low-Carbon Transition
In light of the regional disparities observed in the degree of coupling coordination between construction development and carbon emissions across China, differentiated strategies are recommended to optimize this coordinated relationship. Carbon-locked regions should implement progressively declining carbon-intensity targets, accompanied by subsidies for steel structures and prefabricated buildings, to reduce transition costs. High-coordination regions, such as the Yangtze River Delta, may expand carbon trading pilots by integrating the construction sector into regional carbon markets to stimulate technological innovation. From a technological perspective, mandatory building life-cycle carbon-monitoring platforms should be deployed in carbon-locked regions, the integration of Building Information Modeling (BIM) and the Internet of Things (IoT) for accurate emission management. An interregional carbon trading mutual-aid mechanism should connect the eastern, central, and western regions, allowing low-carbon provinces to offset quotas through technology transfers. Tiered solutions should address the technical, institutional, and financial constraints in carbon-locked regions, prioritizing the enhancement of green construction capabilities in central and western China. This approach will accelerate the transition from low-level coordination to high-quality coupling nationwide, ultimately achieving dynamic equilibrium between carbon peaking and neutrality goals and sectoral development.
The study presented here has certain limitations, which are important to acknowledge:
Temporal Scope Limitation: The dataset covers the period from 2013 to 2022, excluding the latest developments during the post-2023 phase of intensified “dual-carbon” policies in the construction sector. Incorporating a longer time-series dataset could enhance the robustness of trend analysis. Due to constraints in data accessibility, Tibet, Hong Kong, Macau, and Taiwan were not included in the analysis, which may introduce bias in the nationwide assessment of the coupling coordination between construction development and carbon emissions.
Absence of Spatiotemporal Dynamics Investigation: While this study reveals temporal variations in the coupling coordination degree between construction development and carbon emissions across China, the underlying dynamic mechanisms remain unexamined. Future research should address the temporal limitations by collecting additional data on construction and emissions, thereby enabling a more comprehensive investigation of spatiotemporal dynamics. This approach will facilitate long-term trend analyses of the growth of coupling coordination through studies on dynamic mechanisms. Furthermore, we propose developing semantic mining models integrated with economic and sociological theories to elucidate the driving mechanisms behind variations in coupling coordination.
Author Contributions
Conceptualization, methodology, software, validation, formal analysis, resources, data curation, writing—original draft preparation, writing—review and editing, visualization, and supervision, J.R. and Y.W. Investigation, C.X. All authors have read and agreed to the published version of the manuscript.
Funding
This research received no external funding.
Institutional Review Board Statement
Not applicable.
Informed Consent Statement
Not applicable.
Data Availability Statement
The data used can be shared by contacting the corresponding author.
Conflicts of Interest
The authors declare no conflicts of interest.
References
- Zhang, L.X.; Zhang, J.R.; Shao, Z.G.; Zhu, T. Comprehensive evaluation and analysis of obstacles to high-quality development of the construction industry. J. Eng. Manag. 2023, 37, 13–18. [Google Scholar] [CrossRef]
- Zhang, K.; Lu, Y.; Lu, H. Research on countermeasures for high-quality development of green building in China under the background of dual-carbon target. Constr. Econ. 2022, 43, 14–20. [Google Scholar] [CrossRef]
- Zhou, X.; Hu, P.; Cheng, P. Carbon emission accounting and carbon peak prediction in China’s construction industry based on the whole life cycle perspective. Environ. Sci. 2025, 46, 2020–2034. [Google Scholar] [CrossRef]
- Wang, D.; Cheng, X. Study on the path of high-quality development of the construction industry and its applicability. Sci. Rep. 2024, 14, 14727. [Google Scholar] [CrossRef]
- Jin, P.; Peng, C.; Song, M. Macroeconomic uncertainty, high-level innovation, and urban green development performance in China. China Econ. Rev. 2019, 55, 1–18. [Google Scholar] [CrossRef]
- Wei, M.; Li, S.H. Study on the measurement of economic high-quality development level in China in the new era. J. Quant. Technol. Econ. 2018, 11, 3–20. [Google Scholar]
- Zhao, A.; Guan, H.; Sun, Z. Understanding high-quality development of marine economy in China: A literature review. Mar. Econ. Manag. 2019, 2, 124–130. [Google Scholar] [CrossRef]
- Zhang, L.; Zhang, J. Evolution of high-quality development level of China’s construction industry and its influencing factors. Reg. Res. Dev. 2024, 43, 1–8. [Google Scholar]
- Wang, L.; Li, H. Measurement of the level of high-quality development of the construction industry and the choice of path--Taking Shaanxi Province as an example. Constr. Econ. 2020, 41, 24–28. [Google Scholar] [CrossRef]
- Wu, X.; Zhang, L. Research on Comprehensive Evaluation of High-Quality Development of Construction Industry—Taking Jiangsu Province as an Example. Constr. Econ. 2021, 42, 20–26. [Google Scholar] [CrossRef]
- Sayidganiev, Z.S.U.; Karimbaev, B.B.U.; Achilov, O.R. Advantages and Disadvantages of Construction Industries. Acad. Res. Educ. Sci. 2022, 3, 123–127. [Google Scholar]
- Sun, Y.; Xie, H.; Niu, X. Characteristics of Cyclical Fluctuations in the Development of the Chinese Construction Industry. Sustainability 2019, 11, 4523. [Google Scholar] [CrossRef]
- Wang, Y.; Li, S. Market Concentration, Market Power, and Firm Growth of Construction Companies. Adv. Civ. Eng. 2021, 2021, 90846. [Google Scholar] [CrossRef]
- Liu, D.; Li, C. Coupling coordination and spatial-temporal evolution between high-quality development of construction industry and scientific and technological innovation. Env. Dev. Sustain. 2024, 27, 19857–19887. [Google Scholar] [CrossRef]
- Wang, Q.; Qi, Y. Dynamic Correlation Analysis of Construction Industry Development Level and Science and Technology Innovation. IOP Conf. Ser. Earth Environ. Sci. 2024, 371, 022008. [Google Scholar] [CrossRef]
- Agenbag, H.; Amoah, C. The impact of modern construction technology on the workforce in the construction industry//IOP Conference Series: Earth and Environmental Science. IOP Publ. 2021, 654, 012001. [Google Scholar]
- Regona, M.; Yigitcanlar, T.; Xia, B.; Li, R.Y.M. Opportunities and Adoption Challenges of AI in the Construction Industry: A PRISMA Review. J. Open Innov. Technol. Mark. Complex. 2022, 8, 45. [Google Scholar] [CrossRef]
- Chen, H.-P.; Ying, K.-C. Artificial Intelligence in the Construction Industry: Main Development Trajectories and Future Outlook. Appl. Sci. 2022, 12, 5832. [Google Scholar] [CrossRef]
- Yousif, O.S.; Zakaria, R.B.; Aminudin, E.; Yahya, K.; Mohd Sam, A.R.; Singaram, L.; Munikanan, V.; Yahya, M.A.; Wahi, N.; Shamsuddin, S.M. Review of Big Data Integration in Construction Industry Digitalization. Front. Built Environ. 2021, 7, 770496. [Google Scholar] [CrossRef]
- Feng, X.; Jin, R.; Chiu, Y.; Zhang, L. The government-production nexus of energy efficiency in China’s construction industry: Regional. Environ. Sci. Pollut. Res. 2023, 30, 106227–106241. [Google Scholar] [CrossRef]
- Ouyang, T.; Liu, F.; Huang, B. Dynamic econometric analysis on influencing factors of production efficiency in construction industry of Guangxi province in China. Sci. Rep. 2022, 12, 17509. [Google Scholar] [CrossRef]
- Moshood, T.D.; Rotimi, J.O.; Shahzad, W. Enhancing sustainability considerations in construction industry projects. Environ. Dev. Sustain. 2024. [Google Scholar] [CrossRef]
- Khaertdinova, A.; Maliashova, A.; Gadelshina, S. Economic development of the construction industry as a basis for sustainable development of the country. E3S Web Conf. 2021, 274, 10021. [Google Scholar] [CrossRef]
- Hua, X.; Lv, H.; Jin, X. Research on High-Quality Development Efficiency and Total Factor Productivity of Regional Economies in China. Sustainability 2021, 13, 8287. [Google Scholar] [CrossRef]
- Yang, Y.; Lu, X.; Chen, J.; Li, N. Factor mobility, transportation network and green economic growth of the urban agglomeration. Sci. Rep. 2022, 12, 20094. [Google Scholar] [CrossRef]
- Xue, S.; Na, J.; Wang, L.; Wang, S.; Xu, X. The Outlook of Green Building Development in China during the “Fourteenth Five-Year Plan ” Period. Int. J. Environ. Res. Public Health 2023, 20, 5122. [Google Scholar] [CrossRef]
- China Building Energy Efficiency Association; Chongqing University. Research Report on Carbon Emissions from Buildings and Urban Infrastructure in China; China Building Energy Efficiency Association: Chongqing, China, 2023. [Google Scholar]
- Li, Y.; Ma, G. A Study on the High-Quality Development Path and Implementation Countermeasures of China’s Construction Industry toward the Carbon Peaking and Carbon Neutralization Goals. toward the Carbon Peaking and Carbon Neutralization Goals. Sustainability 2024, 16, 772. [Google Scholar] [CrossRef]
- National Development and Reform Commission/Ministry of Housing and Urban-Rural Development. Work Program on Accelerating the Promotion of Energy Conservation and Carbon Reduction in the Building Sector; General Office of the State Council: Beijing, China, 2024.
- Li, X.D.; Zhu, C. A review of research on carbon emission accounting and influencing factors of buildings in China. J. Saf. Environ. 2020, 20, 317–327. [Google Scholar] [CrossRef]
- Li, F. Research on Regional Differences and Influencing Factors of Carbon Dioxide Emissions from China’s Construction Industry. Master’s Thesis, Fujian Normal University, Fuzhou, China, 2020. [Google Scholar]
- Zheng, C. Analysis on the Spatial Effect and Driving Factors of Carbon Emissions in China’s Construction Industry. Master ‘s Thesis, Harbin Institute of Technology, Harbin, China, 2020. [Google Scholar]
- Lu, K.; Deng, X.; Zhang, Y.; Jiang, X.; Cheng, B.; Tam, V.W.Y. Extensible carbon emission factor database: Empirical study for the Chinese construction industry. Environ. Sci. Pollut. Res. 2024, 31, 41482–41501. [Google Scholar] [CrossRef] [PubMed]
- Rinne, R.; Ilgın, H.E.; Karjalainen, M. Comparative Study on Life-Cycle Assessment and Carbon Footprint of Hybrid, Concrete and Timber Apartment Buildings in Finland. Int. J. Environ. Res. Public Health 2022, 19, 774. [Google Scholar] [CrossRef] [PubMed]
- Han, Q.; Chang, J.; Liu, G.; Zhang, H. The Carbon Emission Assessment of a Building with Different Prefabrication Rates in the Construction Stage. Int. J. Environ. Res. Public Health 2022, 19, 2366. [Google Scholar] [CrossRef]
- Erdogan, S. Dynamic nexus between technological innovation and buildings Sector’s carbon emission in BRICS countries. J. Environ. Manag. 2021, 293, 112780. [Google Scholar] [CrossRef]
- Liao, B.; Li, L. How can green building development promote carbon emission reduction efficiency of the construction industry? -Based on the dual perspective of industry and space. Environ. Sci. Pollut. Res. 2022, 29, 9852–9866. [Google Scholar] [CrossRef] [PubMed]
- Xu, X.; Lian, Z. Improve energy-efficient construction in China. Science 2023, 380, 902. [Google Scholar] [CrossRef]
- Sun, S.; Chen, Y.; Wang, A.; Liu, X. An Evaluation Model of Carbon Emission Reduction Effect of Prefabricated Buildings Based on Cloud Model from the Perspective of Construction Supply Chain. Buildings 2022, 12, 1534. [Google Scholar] [CrossRef]
- Oh, S.; Tae, S.; Kim, R. Developing a Green Building Index (GBI) Certification System to Effectively Reduce Carbon Emissions in South Korea’s Building Industry. Sustainability 2018, 10, 1872. [Google Scholar] [CrossRef]
- Zhang, P.; Hu, J.; Zhao, K.; Chen, H.; Zhao, S.; Li, W. Dynamics and Decoupling Analysis of Carbon Emissions from Construction Industry in China. Buildings 2022, 12, 257. [Google Scholar] [CrossRef]
- Wang, L.; Long, X.; Wu, K.J.; Tseng, M.-L.; Cao, Y. Nexus amongst environmental regulations, carbon emission intensity and technological innovation in China’s construction industry. Environ. Sci. Pollut. Res. 2023, 30, 57915–57930. [Google Scholar] [CrossRef] [PubMed]
- Jiang, B.; Huang, B.; Zhang, H. Research on the influencing factors of carbon emissions from construction industry in Jiangsu Province Based on LMDI model. Environ. Sci. Technol. 2021, 44, 202–212. [Google Scholar]
- Li, D.; Huang, G.; Zhang, G.; Wang, J. Driving factors of total carbon emissions from the construction industry in Jiangsu Province, China. J. Clean. Prod. 2020, 276, 123179. [Google Scholar] [CrossRef]
- Guo, X.; Fang, C. Spatio-temporal interaction heterogeneity and driving factors of carbon emissions from the construction industry in China. Environ. Sci. Pollut. Res. 2023, 30, 81966–81983. [Google Scholar] [CrossRef]
- Zheng, S.; He, X.; Liang, X.; Yu, L. Research on the Decoupling Relationship and Driving Factors of Carbon Emissions in the Construction Industry of the East China Core Economic Zone. Buildings 2024, 14, 1476. [Google Scholar] [CrossRef]
- Lu, N.; Feng, S.; Liu, Z.; Wang, W.; Lu, H.; Wang, M. The Determinants of Carbon Emissions in the Chinese Construction Industry: A Spatial Analysis. Sustainability 2020, 12, 1428. [Google Scholar] [CrossRef]
- Wang, Z.; Zhou, Y.; Zhao, N.; Wang, T.; Zhang, Z. Spatial Correlation Network and Driving Effect of Carbon Emission Intensity in China’ s Construction Industry. Buildings 2022, 12, 201. [Google Scholar] [CrossRef]
- Li, M.; Chen, W.; Song, J.; Zhang, S. Research on economic and social impact of carbon emissions in the construction industry at a regional scale: A case of Environ. Sci. Pollut. Res. 2023, 30, 86437–86453. [Google Scholar] [CrossRef]
- Du, Q.; Lu, X.; Li, Y.; Wu, M.; Bai, L.; Yu, M. Carbon Emissions in China’s Construction Industry: Calculations, Factors and Regions. Int. J. Environ. Res. Public Health 2018, 15, 1220. [Google Scholar] [CrossRef]
- Nuri, O.; Murat, K. Carbon footprint of construction industry: A global review and supply chain analysis. Renew. Sustain. Energy Rev. 2020, 124, 109783. [Google Scholar] [CrossRef]
- Ram, L.; Ray Vijay, P.; Singh Sudhir, K.; Singh Bharat, S.; Acharya Yiping, H. What is the impact of COVID-19 pandemic on global carbon emissions? Sci. Total Environ. 2022, 16, 151503. [Google Scholar] [CrossRef]
- Chen, J.; Xu, C.; Gao, M.; Li, D. Carbon peak and its mitigation implications for China in the post-pandemic era. Sci. Rep. 2022, 12, 3473. [Google Scholar] [CrossRef] [PubMed]
- Zhang, L.; Zhang, J. Evaluation and promotion path of high-quality development in the Chinese construction industry under the context of carbon neutrality. Environ. Dev. Sustain. 2024. [Google Scholar] [CrossRef]
- Wang, Y.; Wu, X. Research on High-Quality Development Evaluation, Space-Time Characteristics and Driving Factors of China’s Construction Industry under Carbon Emission Constraints. Sustainability 2022, 14, 10729. [Google Scholar] [CrossRef]
- Zhang, A.; Liu, R.; Ma, Y. Coupling coordination of digital economy and high-quality development of construction industry—An empirical analysis based on a sample of 31 provincial administrative regions. Sci. Ind. 2023, 23, 60–67. [Google Scholar]
- Liu, X.; Wang, D.; Hu, W. Coupled and coordinated development of China’s construction industry and regional economy. Ind. Build. 2021, 51, 173–180. [Google Scholar] [CrossRef]
- Jian, X.; Yujia, Q.; Bingyue, H.; Zhang, L. Research on the measurement and influencing factors of coordinated development between new urbanization and construction industry: A case study of Yunnan Province. Small Towns Constr. 2024, 42, 60–68. [Google Scholar] [CrossRef]
- Xingyu, L. Research on the Coupling and Coordination of High-Quality Development of Provincial Construction Industry and Green Economy Efficiency. Master’s Thesis, Anhui University of Architecture, Anhui, China, 2024. [Google Scholar]
- Wu, Y.; Wang, Y.; Liu, H.; Xie, L.; Jiao, L.; Lu, P. Risk assessment of bridge construction investigated using random forest algorithm. Sci. Rep. 2024, 14, 20964. [Google Scholar] [CrossRef]
- Breiman, L. Random forests. Mach. Learn. 2001, 45, 5–32. [Google Scholar] [CrossRef]
- Zhang, X.; Xiang, X.; Liu, H. Empirical study on carbon emission accounting methods in the iron and steel industry. Ind. Saf. Environ. Prot. 2012, 38, 86–88. [Google Scholar]
- Zhang, Z.; Liu, R. Carbon emission accounting for the construction industry based on input-output analysis. J. Tsinghua Univ. (Nat. Sci. Ed.) 2013, 53, 53–57. [Google Scholar]
- Geng, Y.; Zhao, H.; Liu, Z.; Xue, B.; Fujita, T.; Xi, F. Exploring driving factors of energy-related CO2 emissions in Chinese provinces: A case of Liaoning. Energy Policy 2013, 60, 820–826. [Google Scholar] [CrossRef]
- Leif, G.; Joelsson, A.; Sathre, R. Life cycle primary energy use and carbon emission of an eight-storey wood-framed apartment building. Energy Build. 2010, 42, 230–242. [Google Scholar]
- Niu, J.; Xin, B.; Xin, B.; Zhang, Y.; Wang, M. Research on the coordinated development of provincial urbanization and carbon emission efficiency of construction industry in China. Carbon Balance Manag. 2024, 19, 12. [Google Scholar] [CrossRef]
- Fan-Wen, K.; Xiao-Nan, W.; Xin, T. Comparative study on carbon emissions during the construction phase of industrialized houses and traditional houses based on the carbon emission factor method. Ecol. Econ. 2017, 33, 81–84. [Google Scholar]
- Pengcheng, Z.; Xiaoxin, D.; Qun, W. Research on carbon emission measurement and influencing factors of the construction industry—Taking the three northeastern provinces as an example. J. Jilin Univ. Archit. 2023, 40, 58–64. [Google Scholar]
- Wang, X.; Zhang, M.; Jie, S.; Zhang, M.; Zhang, Z. Exploring the Coordinated Evolution Mechanism of Regional Sustainable Development and Tourism in China’s “Beautiful China” Initiative. Land 2023, 12, 1003. [Google Scholar] [CrossRef]
- Zhan, C.; Feng, Y.; Chen, J.; Cheng, P.; Cheng, J. Research on the coupling and coordination of new urbanization and green low-carbon development efficiency—A case study of cities in the Yangtze River Economic Belt. Res. Environ. Econ. 2024, 9, 128–146. [Google Scholar] [CrossRef]
- Ding, X.Q.; Wu, Q.; Liu, X.N.; Wang, J. Coupling coordination degree and influencing factors of land use, high-quality economic development, and carbon emissions: Empirical evidence from 282 prefecture-level cities in China. Resour. Sci. 2022, 44, 2233–2246. [Google Scholar] [CrossRef]
- Wang, S.J.; Kong, W.; Ren, L. Misunderstandings and corrections of the coupling coordination degree model in China. J. Nat. Resour. 2021, 36, 793–810. [Google Scholar]
- Jenks, G.F. The Data Model Concept in Statistical Mapping. Int. Yearb. Cartogr. 1967, 7, 186–190. [Google Scholar]
- Wang, Q.S.; Xiong, J.N.; Cheng, W.M.; Mao, Y. Landslide susceptibility assessment method coupling statistical methods, machine learning models, and clustering algorithms. J. Geo. Inf. Sci. 2024, 26, 620–637. [Google Scholar]
- Li, W.; Fan, X.; Huang, F.; Chen, W.; Hong, H.; Huang, J.; Guo, Z. Uncertainty in landslide susceptibility modeling based on different environmental factor connections and prediction models. Earth Sci. 2021, 46, 3777–3795. [Google Scholar]
- Wen, L.; Yan, X.L. Distribution characteristics and inter-regional impacts of carbon emissions in China’s construction industry. J. Eng. Manag. 2024, 38, 7–12. [Google Scholar] [CrossRef]
- Zhao, Z.; Sun, D.; Shu, H. Research on coupling coordination between water resources and socio-economy in Shiyang River Basin. Water Resour. Plan. Des. 2025, 9, 34–37. [Google Scholar]


Disclaimer/Publisher’s Note: The statements, opinions and data contained in all publications are solely those of the individual author(s) and contributor(s) and not of MDPI and/or the editor(s). MDPI and/or the editor(s) disclaim responsibility for any injury to people or property resulting from any ideas, methods, instructions or products referred to in the content. |
© 2025 by the authors. Licensee MDPI, Basel, Switzerland. This article is an open access article distributed under the terms and conditions of the Creative Commons Attribution (CC BY) license (https://creativecommons.org/licenses/by/4.0/).