Article

Scenario-Based Carbon Footprint of a Synthetic Liquid Fuel Vehicle

Department of Mechanical Engineering, Graduate School of Engineering, The University of Osaka, Suita 565-0871, Japan
*
Author to whom correspondence should be addressed.
Sustainability 2025, 17(16), 7500; https://doi.org/10.3390/su17167500
Submission received: 30 June 2025 / Revised: 8 August 2025 / Accepted: 15 August 2025 / Published: 19 August 2025
(This article belongs to the Special Issue Sustainable Fuel, Carbon Emission and Sustainable Green Energy)

Abstract

The mitigation of climate change impacts from the automotive sector is important for sustainable development, and for that purpose, synthetic liquid fuel vehicles (SLF-Vs) are being considered as a potential clean option alongside electric vehicles (EVs). However, the energy-intensive production of synthetic liquid fuels (SLFs) requires a thorough life-cycle analysis, as CO2 emissions vary significantly depending on the power sources and feedstock production technologies. This study evaluates the life-cycle CO2 emissions of SLF-Vs in Japan through long-term multiple scenarios up to 2050 and compares them with those of gasoline vehicles (GVs), hybrid electric vehicles (HEVs), and battery electric vehicles (BEVs). The results reveal that, in 2020, SLF-Vs’ life-cycle CO2 emissions were more than 2.9 times higher than those of GVs. By 2050, SLF-Vs’ emissions could only decrease to BEV-like levels if Japan achieves significant decarbonization of its power grid. Even if hydrogen is produced via water electrolysis in Australia, where renewable energy is abundant, and then imported, emissions remain high if Japan’s power grid remains insufficiently decarbonized. This highlights the critical importance of expanding domestic decarbonized power sources, particularly renewable energy, to reduce the life-cycle CO2 emissions of SLF-Vs in Japan.

1. Introduction

1.1. Life Cycle of Vehicles and Synthetic Liquid Fuel Vehicles

Accelerated and equitable action in mitigating and adapting to climate change impacts is critical to sustainable development, as highlighted by the Intergovernmental Panel on Climate Change (IPCC) [1]. Currently, the largest proportion of global greenhouse gas emissions consists of fossil-resource-derived CO2, accounting for 73.7% of total emissions [2]. Furthermore, the transportation sector accounts for approximately 23% of carbon dioxide emissions [3], with the automotive sector making up the largest portion. Therefore, reducing carbon dioxide (CO2) emissions in the automotive sector is critical for mitigating climate change, and one option for doing so is through the use of battery electric vehicles (BEVs) [4]. Unlike internal combustion engine vehicles (ICEVs), BEVs do not emit CO2 during the tank-to-wheel (TtW) process. However, when comparing the environmental impacts of BEVs and ICEVs, it is essential to consider not only TtW but also well-to-tank (WtT), which covers fuel production up to the point of filling the tank, as well as the overall well-to-wheel (WtW) and vehicle life cycle [5]. In addition, the CO2 emission reduction effect of BEVs heavily depends on the carbon intensity of the power sources used throughout the BEV life cycle [4,5].
The Japanese government is aiming for BEVs to account for 100% of new passenger car sales by 2035 [6]. However, the spread of BEVs in Japan has been limited. In 2022, BEVs accounted for only 1.8% of new car sales in Japan [7]. Contributing factors include their limited driving distance, long charging times, and poor access to charging infrastructure [8].
Therefore, in order to achieve the new passenger car sales target, a large volume of BEV production will be essential in the future, but this will entail an enormous consumption of critical metals. Zhang et al. analyzed the trade-off between the potential for CO2 emission reduction through BEV adoption and the increase in demand for critical metals. They also point out that the extraction and processing of critical metals are concentrated in a small number of politically unstable countries, which could worsen supply risks [9]. On the other hand, synthetic liquid fuels (SLFs) can potentially be used as a substitute for current fossil fuels in existing internal combustion engines by refueling at gasoline stations [10,11]. SLFs are liquid fuels produced from hydrogen (H2) and CO2, and if the latter is captured from exhaust gases or the atmosphere, then SLFs can contribute to net CO2 emission reductions. Consequently, attention is shifting not only to electric vehicles but also to synthetic liquid fuel vehicles (SLF-Vs), and Japan aims to commercialize the latter by the early 2030s [12]. SLFs include Fischer–Tropsch (FT) fuels, methanol, dimethyl ether, and oxymethylene dimethyl ether, which differ in how the H2 and CO2 are synthesized [13,14,15], and this study is focused on FT fuels, which are considered promising [14]. Among these, FT fuels are regarded as promising drop-in fuels that can be used in existing internal combustion engine vehicles [14]. This study conducts a life-cycle analysis focusing on FT fuels.

1.2. Related Studies on SLF-Vs

SLFs have been the subject of focused research, with numerous environmental impact assessments to date. For example, Hänggi et al. (2019) analyzed the well-to-mile energy requirements of various SLFs and showed that producing them requires a large amount of energy, with FT fuels requiring the highest energy input [16]. Therefore, because of the high energy requirements for producing SLFs, many studies have evaluated the GHG emissions associated with their production [17,18,19]. Hombach et al. (2019) conducted a WtW evaluation of SLFs produced from H2 via alkaline water electrolysis and CO2 via direct air capture (DAC) [20]. Schreiber et al. (2024) performed a WtT assessment of SLFs produced using H2 from alkaline water electrolysis and CO2 captured from flue gases in thermal power plants [carbon capture and utilization (CCU)] [15]. Zang et al. (2021) evaluated the life-cycle GHG emissions of synthetic methanol produced using H2 from water electrolysis and CO2 as a by-product of ammonia production [21]. Via scenario-based calculations, those studies showed that the GHG emissions from SLF production vary considerably depending on the electrical power source used. Uddin and Wang (2024) emphasized the importance of life-cycle assessment (LCA) of e-fuels in a review article and showed that the sustainability of e-fuels depends on multiple factors, such as the fuel’s production processes and raw material sources [11].
Meanwhile, comparisons of the environmental impact of ICEVs such as SLF-Vs with that of BEVs should consider the life cycle, including both WtW and vehicle life-cycle processes. Richter et al. (2024) evaluated the life-cycle GHG emissions of ICEVs, considering both WtW and vehicle life-cycle processes, using various fuels such as synthetic gasoline and fossil gasoline [22]. Sacchi et al. (2022) evaluated the life-cycle GHG emissions of HEVs powered by SLF or fossil gasoline and BEVs under various electricity supply scenarios, taking into account both WtW and vehicle life-cycle processes [23].
Luo et al. (2022) evaluated the GHG emissions of vehicles based on coal-based methanol, considering both WtW and vehicle life-cycle processes, and compared the results with those for GVs and BEVs [24]. In previous studies, the production technologies used for the raw materials of SLFs (e.g., H2 and CO2)—including alkaline water electrolysis, CCU, and DAC—were not yet at the commercial stage. The Cabinet Secretariat (2020) and METI (2023) have outlined target introduction years for each technology in their technology roadmaps [12,25]. Currently, the mainstream H2 production technology in Japan is steam reforming [26], and the primary CO2 production method is as a by-product of ammonia production [27]. Additionally, there is a future possibility of importing H2 produced via water electrolysis overseas [28], and it is necessary to consider the years in which these production technologies are expected to be widely adopted. Furthermore, some current H2 and CO2 production technologies may become unusable because of future societal conditions; for example, the CO2 production technology that captures CO2 from flue gases of thermal power plants may become obsolete if these are replaced by renewable energy power plants.
Presented in this study is a scenario-based carbon footprint analysis conducted to evaluate the life-cycle CO2 emissions of SLF-Vs in Japan under multiple scenarios, and it includes the following:
  • Setting of scenarios that consider the options for H2 and CO2 production technologies and power source configurations used in WtW processes for each evaluation year.
  • Evaluation of the life-cycle CO2 emissions of SLF-Vs for each scenario and comparison of the results with those for GVs, HEVs, and BEVs.
  • Sensitivity and uncertainty analyses conducted to identify which processes in SLF production have the most impact on life-cycle CO2 emissions.

2. Materials and Methods

2.1. Scenario-Based Carbon Footprint

Life-cycle assessment (LCA) is a methodology used to evaluate sustainability by considering the entire life cycle of a product. ISO 14040, which outlines the procedure for LCA, defines four steps: (i) defining the goal and scope, (ii) life-cycle inventory analysis, (iii) life-cycle impact assessment, and (iv) life-cycle interpretation [29]. In contrast, the carbon footprint is an indicator that evaluates the impact on climate change. The carbon footprint is defined as follows: “The carbon footprint is a measure of the exclusive total amount of carbon dioxide emissions that is directly and indirectly caused by an activity or is accumulated over the life stages of a product.” [30]. The author of this definition also argues that other greenhouse gases should not be included due to limitations in data availability. Schmidt (2009) discussed the relationship between carbon footprint and LCA, stating that a carbon footprint is a single indicator extracted from the LCA framework and must conform to it [31]. In ISO 14040, a study that only performs (i) defining the goal and scope, (ii) life-cycle inventory analysis, and (iv) life-cycle interpretation, without (iii) impact assessment is called a life-cycle inventory study (LCI study) [29].Synthetic fuels, which are the subject of this study, are technologies that have not yet been widely commercialized. For such emerging technologies, prospective LCAs have been proposed. Bisinella et al. (2021) provided recommendations for applying future scenarios and LCA [32]. Prospective LCAs are often highly dependent on data uncertainty. Accordingly, sensitivity and uncertainty analyses are used to quantify these uncertainties, while scenario analysis addresses epistemic uncertainties arising from modeling assumptions and future developments. Other key recommendations include the following:
  • Assessing the quality of both future scenarios and the LCA itself.
  • Clearly defining the term “scenario”.
Giesen et al. (2020) proposed using Monte Carlo simulations to consider parameter uncertainty in prospective LCAs of technologies not yet in widespread use [33].
Scenario-based LCA involves incorporating scenario analysis into LCA to evaluate and compare different future conditions through various assumption combinations [34]. This allows for the consideration of future technological changes and shifts in societal conditions, supporting more realistic decision-making. In LCA, scenario analysis is not merely predictive; it presents multiple potential futures to clarify risks and opportunities that may not be visible in the present. This approach improves decision-making quality, especially in climate change mitigation and technology innovation assessments. Due to these characteristics, scenario-based LCA has been applied to renewable energy technologies [35,36] and bio-based chemicals [37], making it highly effective for evaluating SLF-Vs, which are the focus of this study. Scenario use allows for the evaluation of a wide range of assumptions.
In this study, a scenario-based carbon footprint is examined using CO2 as a single indicator, and assumptions are made regarding inventory models, specifically the choices of H2 and CO2 production technologies and power mix configurations.
In the scenario-based carbon footprint approach, scenario setting is performed between steps (i) and (ii) of an LCI study. Therefore, the paper is structured along the following steps: (I) goal and scope definition described in Section 1 and Section 2.2, (II) scenario setting described in Section 2.3, (III) life-cycle inventory described in Section 2.4 and Section 3, and (IV) interpretation provided in Section 4 and Section 5.

2.2. Functional Unit and System Boundary

Figure 1 shows the system boundary of this study. The life cycle of a vehicle includes material production, component manufacturing, vehicle manufacturing, usage, and disposal/recycling. The usage phase encompasses both the production of fuel or electricity required for operation (WtT) and fuel combustion during operation (TtW); in other words, the WtW process is included. In this study, the construction and operation of plants used for material manufacturing and fuel production are not considered. However, the power generation required for each WtW process is taken into account, including the construction and operation of power plants.
In LCA, comparisons of products must be based on the same functional unit. Assen et al. (2013) provided a systematic framework for handling raw-material CO2 in LCA; CO2 recovery from air via DAC is considered a basic flow and is accounted for as negative emissions, whereas CO2 from flue gases (CCU) is considered an economic flow and is not counted as negative emissions [38]. Also, a system expansion approach has been proposed for evaluating the environmental impact of flue-gas carbon capture, with the functional unit defined as SLF production and power generation, and Schreiber et al. (2024) also used this approach [15].
From the present life-cycle inventory, an SLF-V using CO2 from CCU has 23,635 kWh of power generated at a thermal power plant simultaneously with CO2 production for the vehicle’s life cycle. Therefore, a system expansion approach is adopted, with the functional unit defined as the life cycle of one vehicle with a driving distance of 150,000 km and 23,635 kWh of power production. The driving distance in the use phase is assumed to be 150,000 km, which is a commonly used assumption in the automotive industry [39]. SLF-Vs using CO2 production technologies other than flue-gas CCU—as well as GVs, HEVs, and BEVs—include the generation of 35,490 kWh of compensatory power within the system boundary in addition to the life cycle of one vehicle, and this compensatory power comes from the grid electricity in each evaluation scenario and year.

2.3. Scenario Setting

In this study, long-term multiple scenarios were developed considering the applicable year and electric power mix of each technology used for SLF production. The scenarios considered are (1) business as usual (BAU), (2) decarbonization, and (3) Australia decarbonization and Japan BAU. The BAU scenario reflects the current trends and measures in Japan. The decarbonization scenario assumes a considerable reduction in Japan’s fossil resource usage and CO2 emissions by 2050 compared with the BAU scenario. The Australia decarbonization and Japan BAU scenario assumes that Japanese FT fuel companies import H2 produced via water electrolysis in Australia, where renewable energy adoption is more advanced than in Japan.
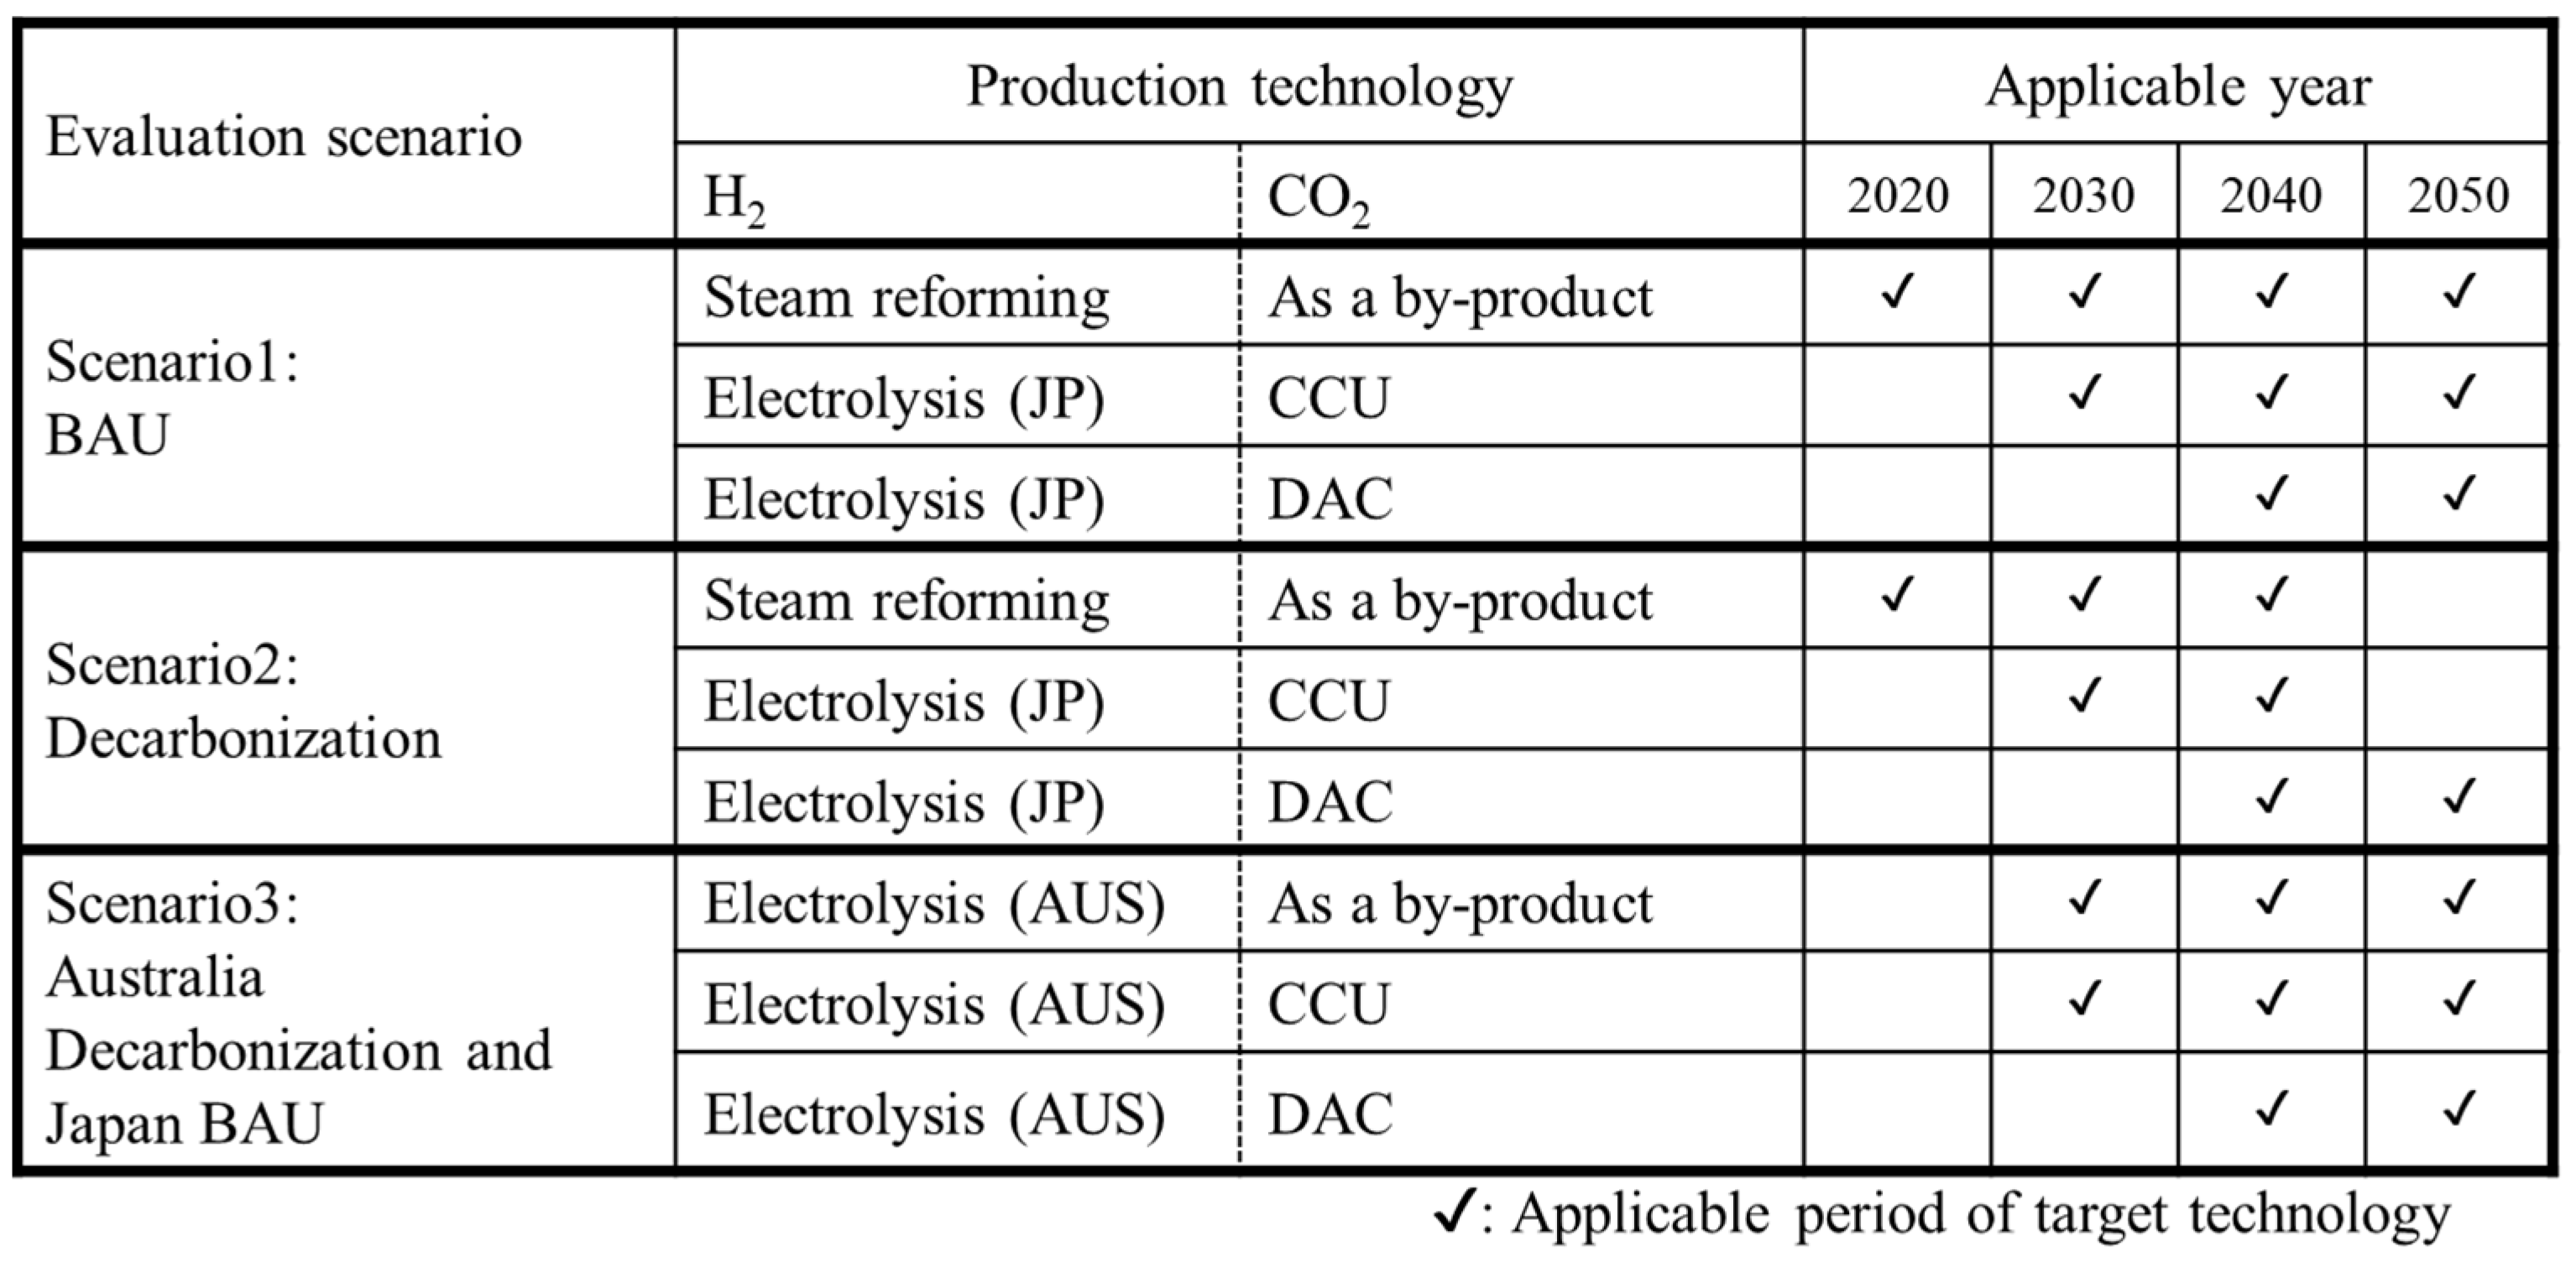
Figure 2 shows the combinations of H2 and CO2 production technologies to be evaluated for each scenario and their applicable years. Regardless of the scenario, CCU is considered applicable from 2030 and DAC from 2040. In the decarbonization scenario, fossil-resource-dependent production technologies (such as by-product and CCU) are assumed to be phased out by 2040. For the Australia decarbonization and Japan BAU scenario, the evaluation includes H2 production using water electrolysis in Australia; however, even in this scenario, all other processes such as CO2 production (excluding water electrolysis) are conducted in Japan.
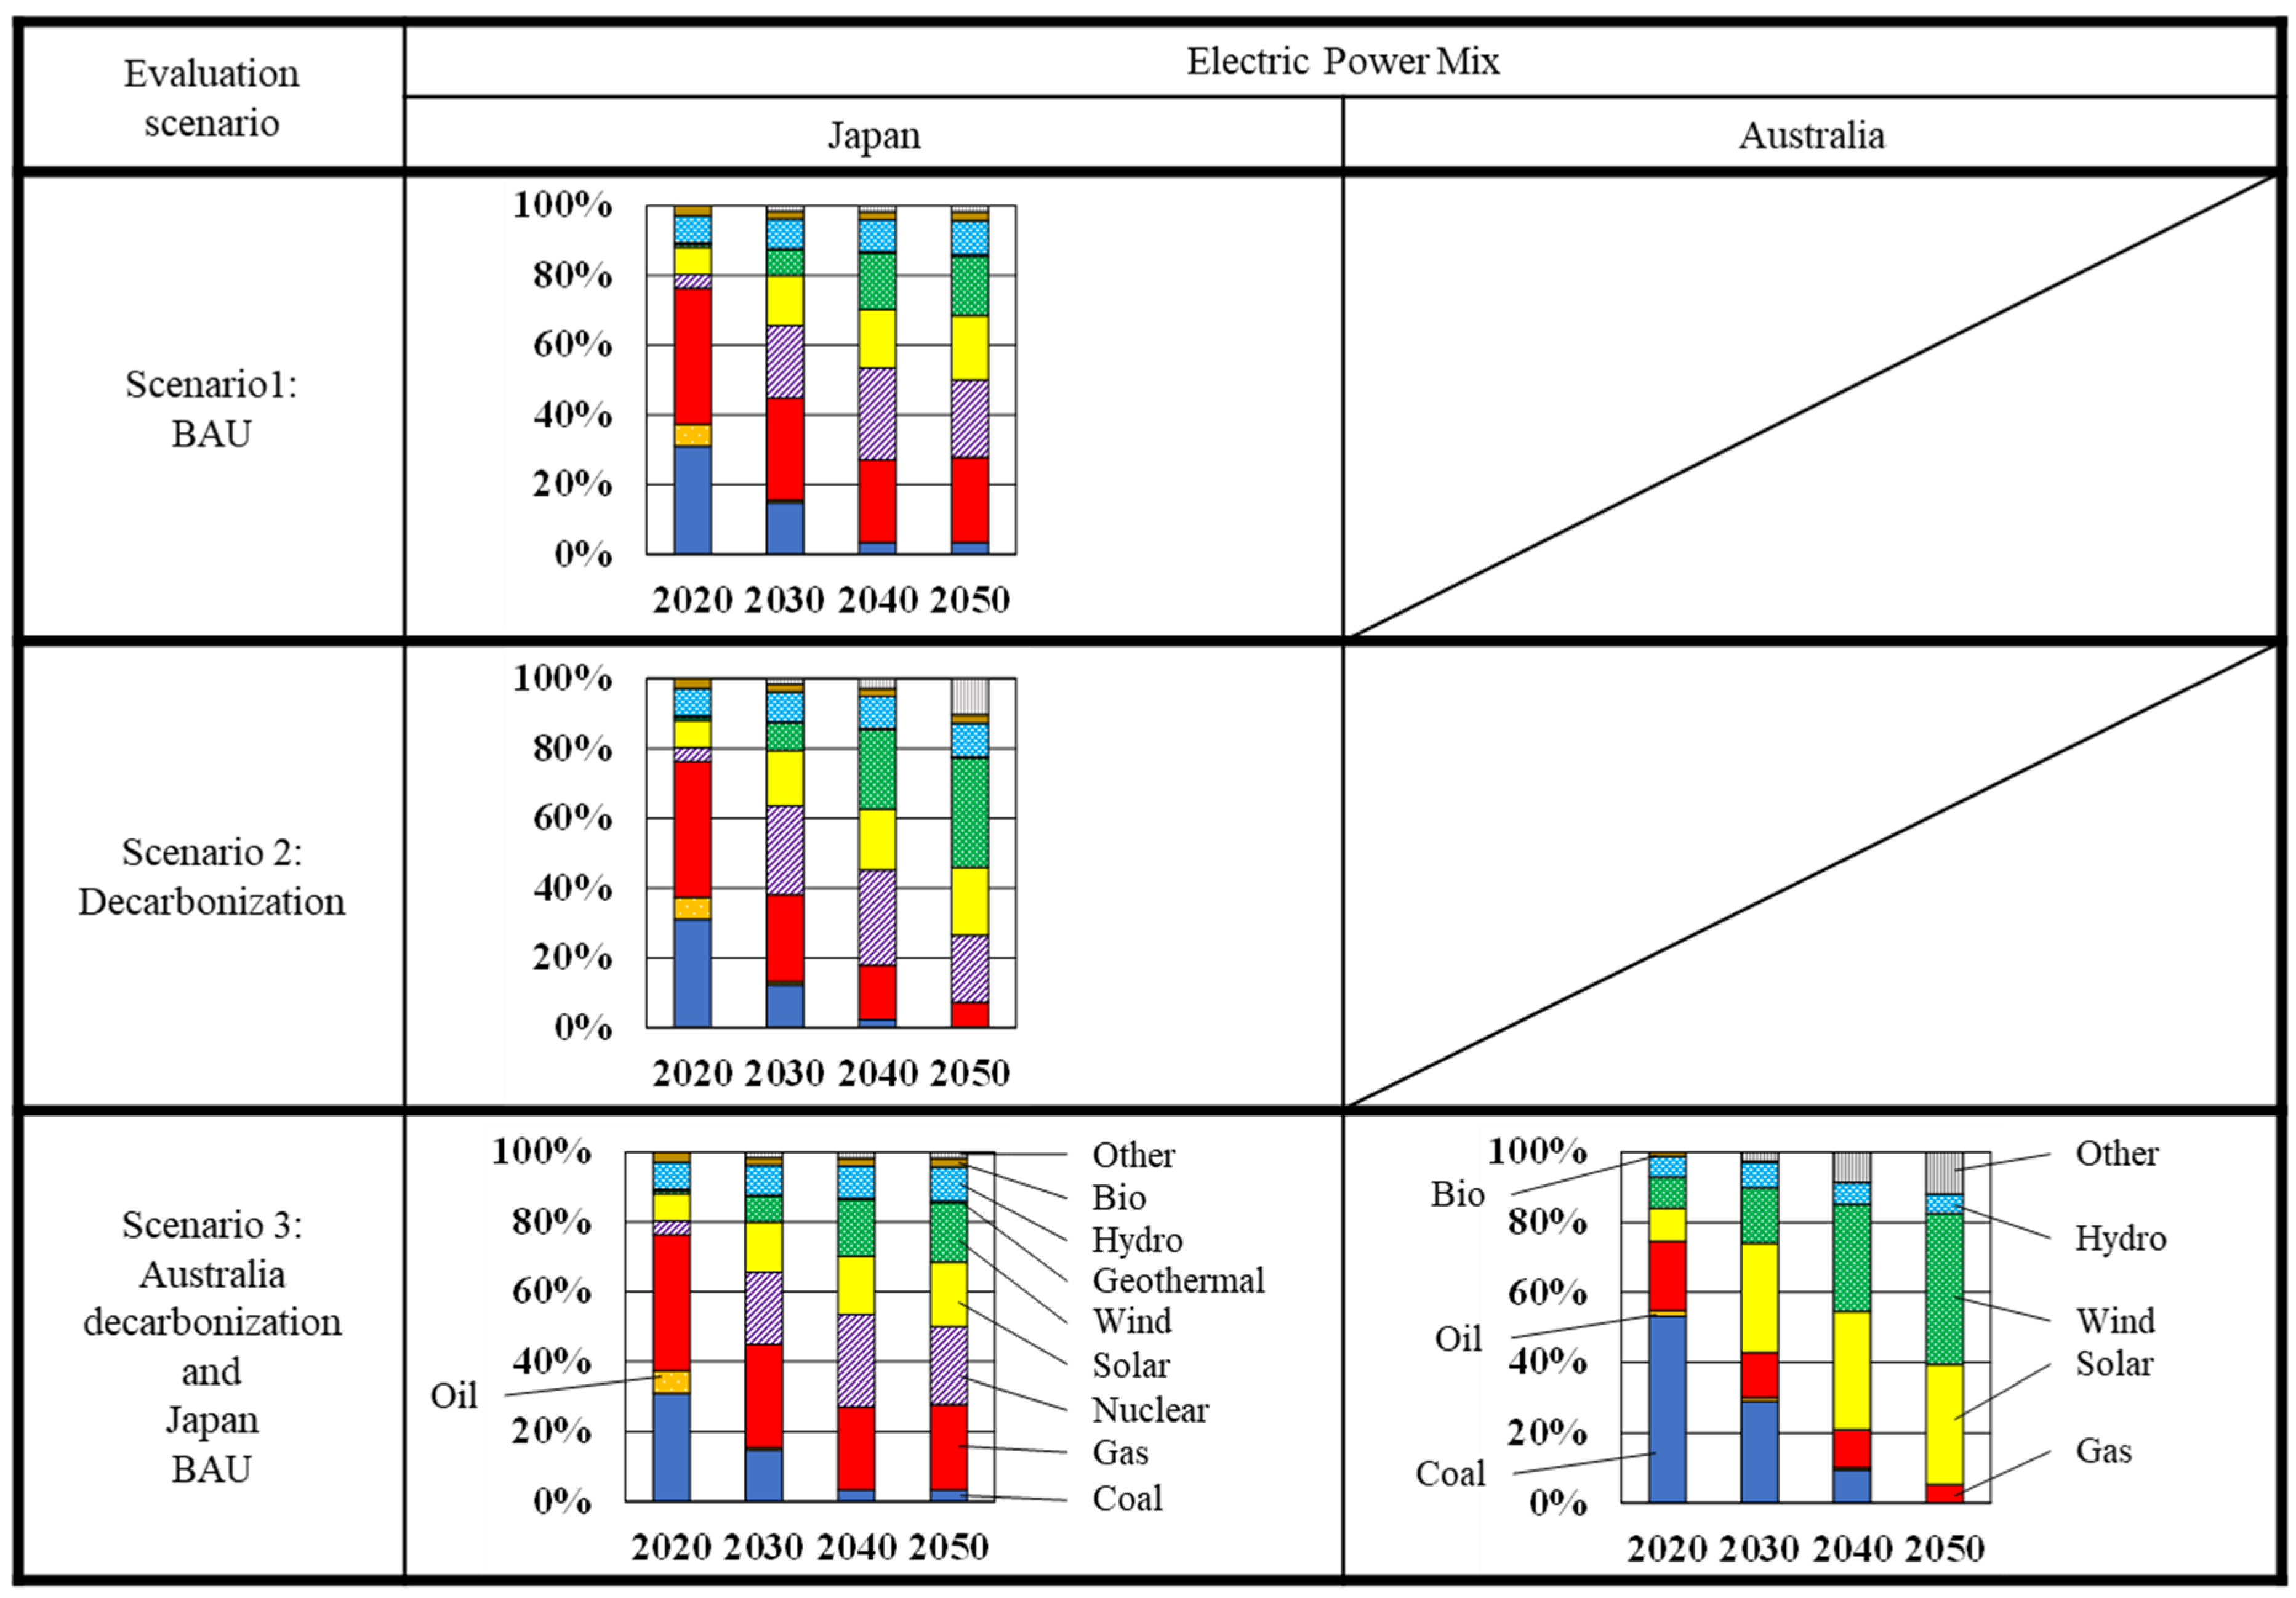
Figure 3 shows the power generation mix for each scenario from 2020 to 2050. The values for 2020 are based on confirmed data from each country [40,41], while forecasts are used from 2030 onward [42]. The power generation mix in the decarbonization scenario represents a more advanced adoption of renewable energy in Japan than that in the BAU scenario. In the Australia decarbonization and Japan BAU scenario, the power generation mix in Australia reflects a higher level of renewable energy adoption in the future than that in Japan under the BAU scenario, while Japan’s power generation mix remains the same as in the BAU scenario.

2.4. Life-Cycle Inventory

2.4.1. Vehicle Life Cycle

Data on the vehicle life cycles of GVs, HEVs, and BEVs are from MHRT (2008) [43], Kosai et al. (2021) [44], and AIST (2020) [45]. AIST provides the Inventory Database for Environmental Analysis (IDEA), a Japanese inventory database to support LCA. For SLF-Vs, the vehicle body and engine are assumed to be the same as those of GVs. Data on these vehicle life cycles are provided in Tables S1–S5 (in this study, all tables and figures with the prefix “S” are in the Supplementary Material). CO2 emissions during material production, parts manufacturing, vehicle manufacturing, and disposal/recycling are fixed and do not vary by year.

2.4.2. WtW

Inventory data for the WtT of SLFs were collected from various literature sources, and Table S6 gives the inventory data showing the inputs and outputs for each WtT process [16,17,45,46,47,48]. For electrolysis (AUS), the assessment includes not only water electrolysis in Australia but also maritime transportation to Japan.
For FT synthesis, since the body and engine of SLF-Vs in this study are the same as those of GVs, it is desirable to use inventory data for FT gasoline production. However, as most studies and reports on FT fuels focus on FT diesel, obtaining accurate inventory data for FT gasoline is difficult. Therefore, in this study, inventory data for FT diesel production were referenced. Considering this, the fuel efficiency E s [km/L] with SLF is expressed as
E S = E G Q d i e s e l Q g a s o l i n e
where E G [km/L] is the fuel efficiency of GVs; Q d i e s e l [kWh/L] is the diesel calorific value; and Q g a s o l i n e [kWh/L] is the gasoline calorific value. Table S7 gives the calorific value of each fuel, as well as the fuel and electricity efficiencies [17,44].
The CO2 emissions from electricity generation used in the production of SLFs depend on the electrical power mix. Table S8 gives the embodied CO2 intensity by power generation type [47,49], and Figure S1 shows the embodied CO2 intensity of grid power by electrical power mix. The CO2 emissions from the combustion of SLFs are equivalent to those of diesel, set at 2.54 kg/L [11].

3. Results

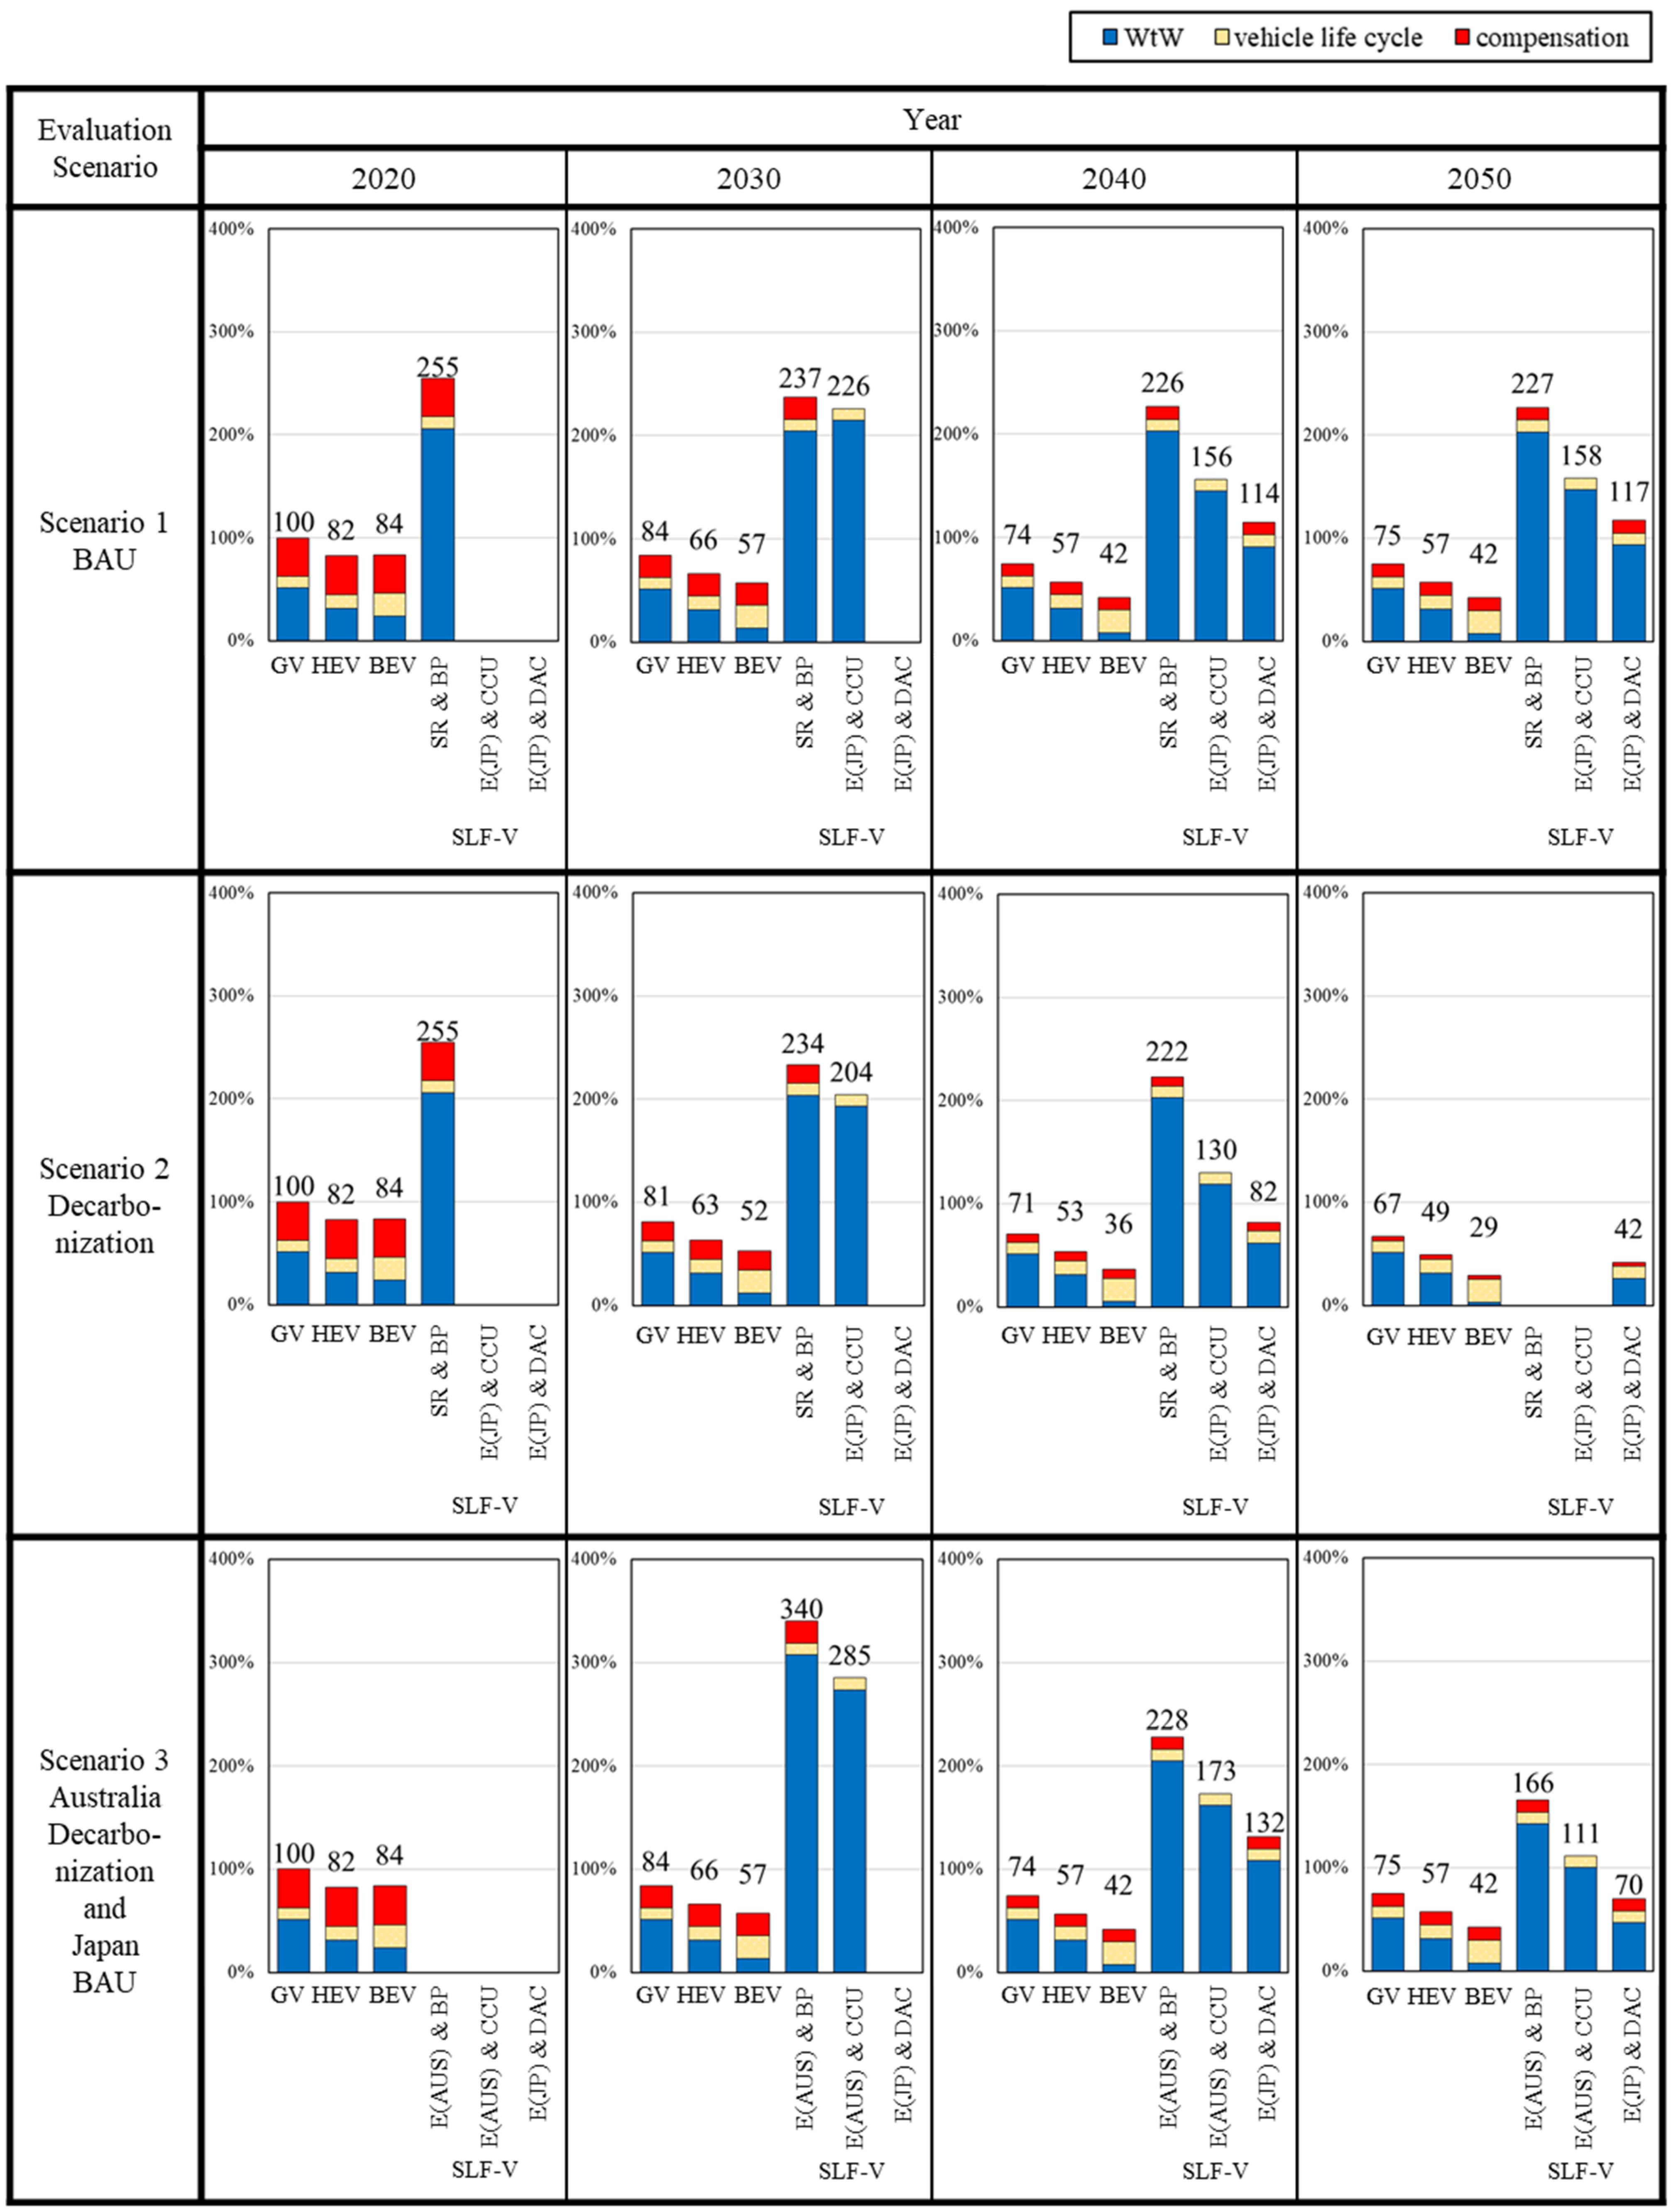
The results of the scenario-based carbon footprint are shown in Figure 4. The carbon footprint (life-cycle CO2 emissions) of SLF-Vs using the only H2 and CO2 production technology combination that was available in 2020 (i.e., steam reforming and by-product) is approximately 2.5 times that of GVs. This is due to the large amount of CO2 emitted from steam reforming and CO2 production as a by-product of ammonia. Therefore, in terms of carbon neutrality, SLF-Vs based on current H2 and CO2 production technologies offer no advantage.
In the BAU scenario, the carbon footprint of SLF-Vs was approximately 2.7 times that of GVs and about 4 times that of BEVs in 2030. In 2040 and 2050, the carbon footprint of SLF-Vs varied significantly depending on the SLF production method, but in all cases, the carbon footprint was more than 1.5 times that of GVs and more than 2.7 times that of BEVs in the same year. This is because, even with the use of future technologies like water electrolysis, CCU, and DAC, the decarbonization of the electricity used to operate them does not progress sufficiently in the BAU scenario. Therefore, under the BAU scenario, SLF-Vs have no advantage in terms of carbon neutrality, even in the future.
In the decarbonization scenario, the carbon footprint of SLF-Vs was more than 2.4 times that of GVs and more than 3.8 times that of BEVs in 2030. In 2040 and 2050, the carbon footprint varies significantly depending on the SLF production method. The carbon footprint of SLF-Vs using water electrolysis and DAC in Japan (i.e., E (JP) and DAC) decreases to approximately 1.15 times that of GVs in 2040 and to about 0.6 times in 2050. This is due to the significant progress in decarbonizing the electricity used for SLF production in Japan. However, it is evident that the carbon footprint of BEVs in 2050 is about 0.4 times that of GVs, demonstrating a greater CO2 emission reduction effect than SLF-Vs. Furthermore, SLF-Vs using fossil fuel-dependent technologies such as H2 from steam reforming and byproduct CO2 or CCU are not applicable in the decarbonization scenario.
For the Australia decarbonization and Japan BAU scenario, the carbon footprint of SLF-Vs using imported hydrogen produced via water electrolysis in Australia was more than 3.3 times that of GVs in 2030 and more than 1.7 times in 2040. Even in 2050, the carbon footprint is on par with GVs’ in the same year and is larger than that of HEVs and BEVs. This is attributed to the fact that even if water electrolysis (which requires a large amount of power) is performed in Australia with advanced renewable energy, Japan’s insufficient renewable energy penetration leads to considerable CO2 emissions from DAC and other processes conducted in Japan. This indicates that, for SLF-Vs in Japan to contribute to carbon neutrality, domestic renewable energy penetration is essential.
In summary, there is only one case in which the carbon footprint of an SLF-V is lower than that of a GV and an HEV: 2050 SLF-Vs under the decarbonization scenario. The H2 production technology is electrolysis conducted in Japan, and the CO2 production technology is DAC.

4. Discussion

4.1. Sensitivity and Uncertainty Analyses

Sensitivity and uncertainty analyses were conducted to examine the impact of individual parameters related to SLF production on the carbon footprint. In the sensitivity analysis, the energy efficiencies of H2 production, CO2 production, and synthesis are varied independently by ±10%, and the resulting changes in the carbon footprint are examined.
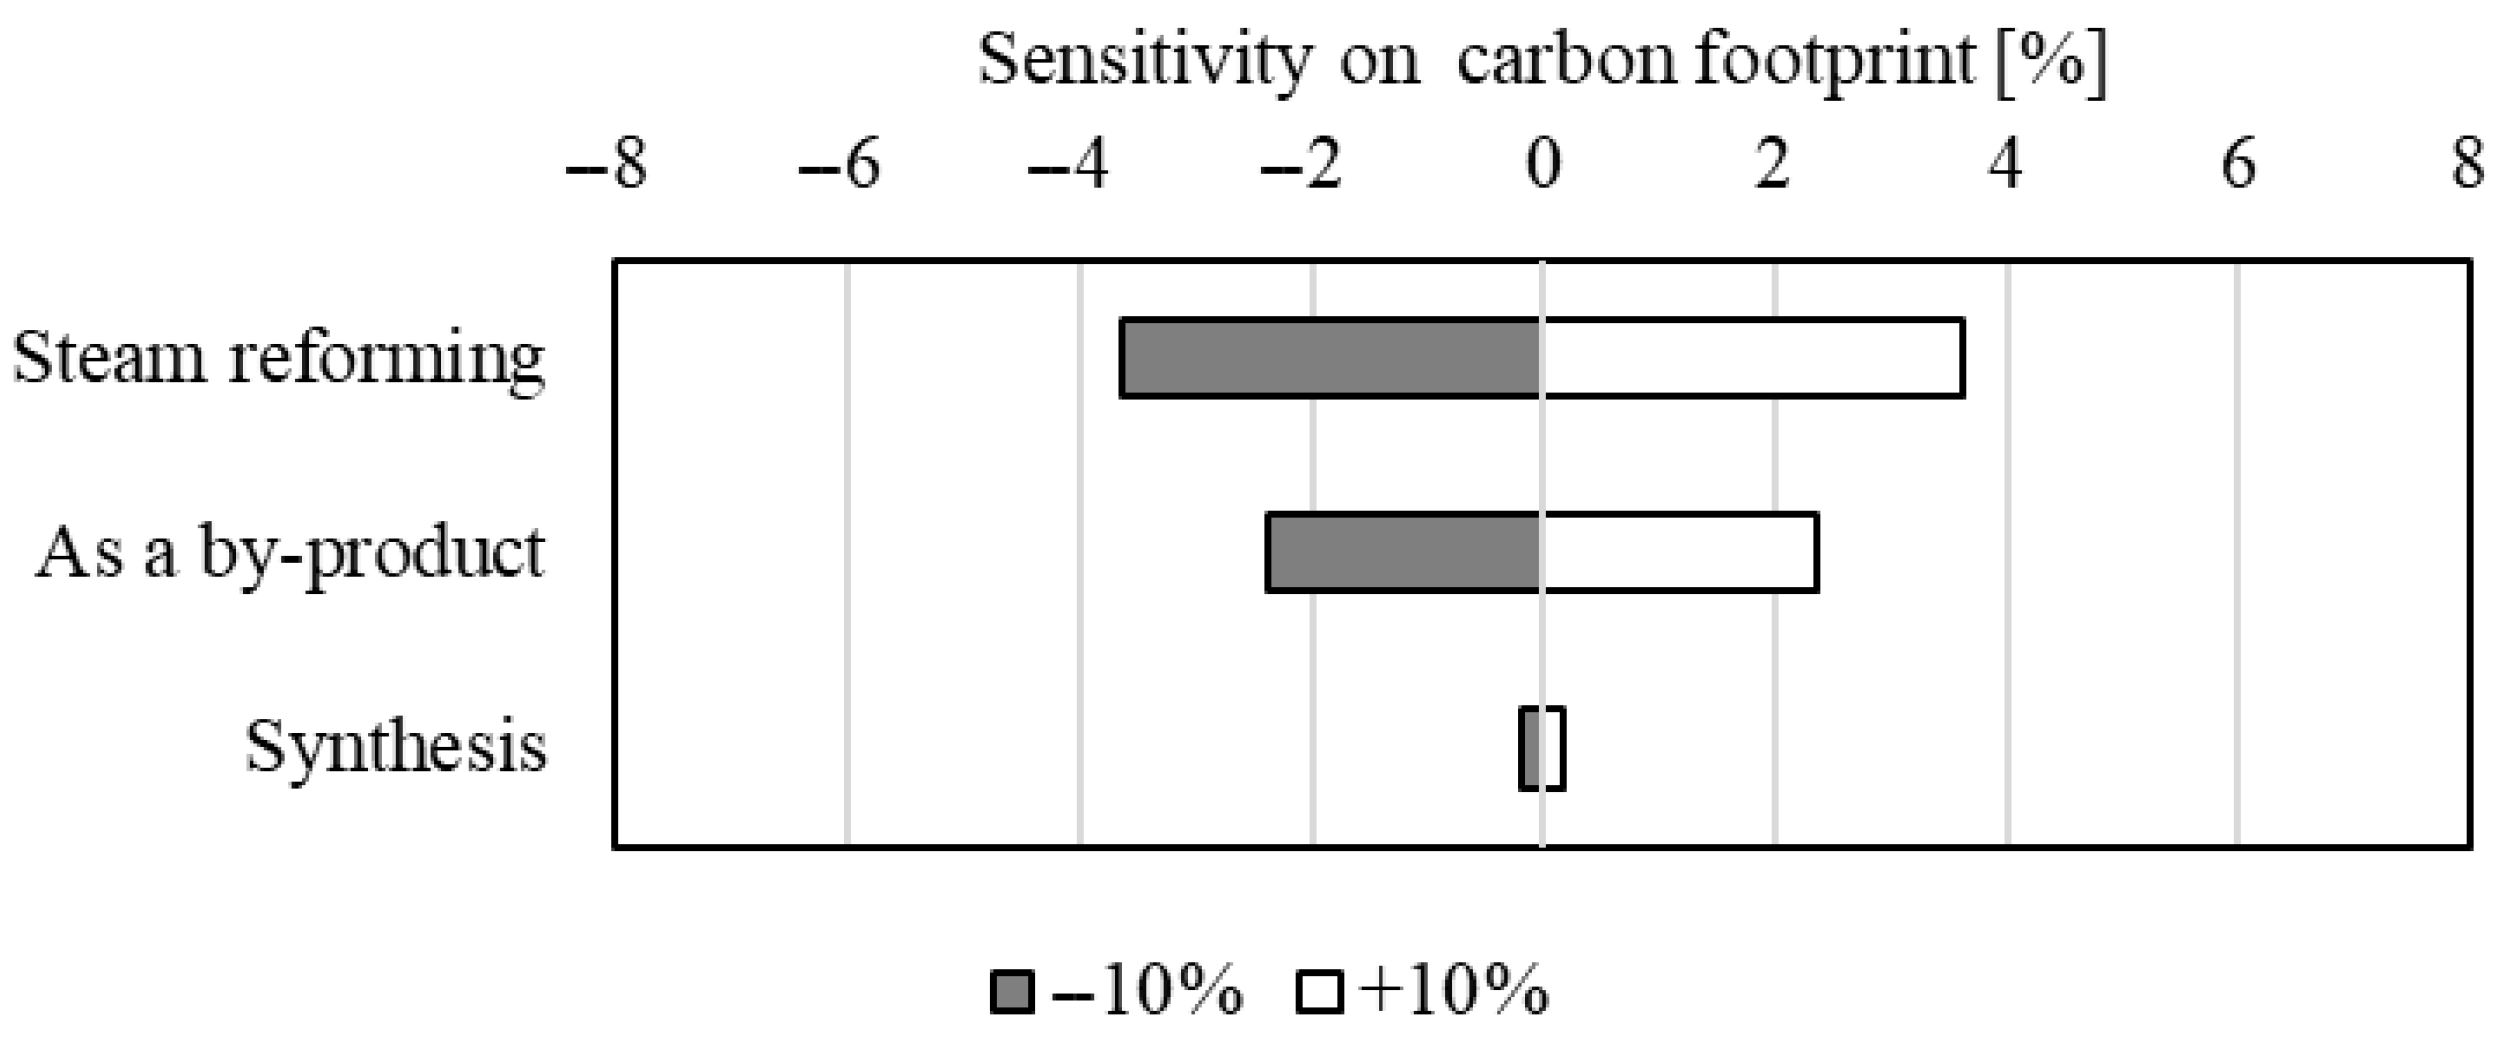
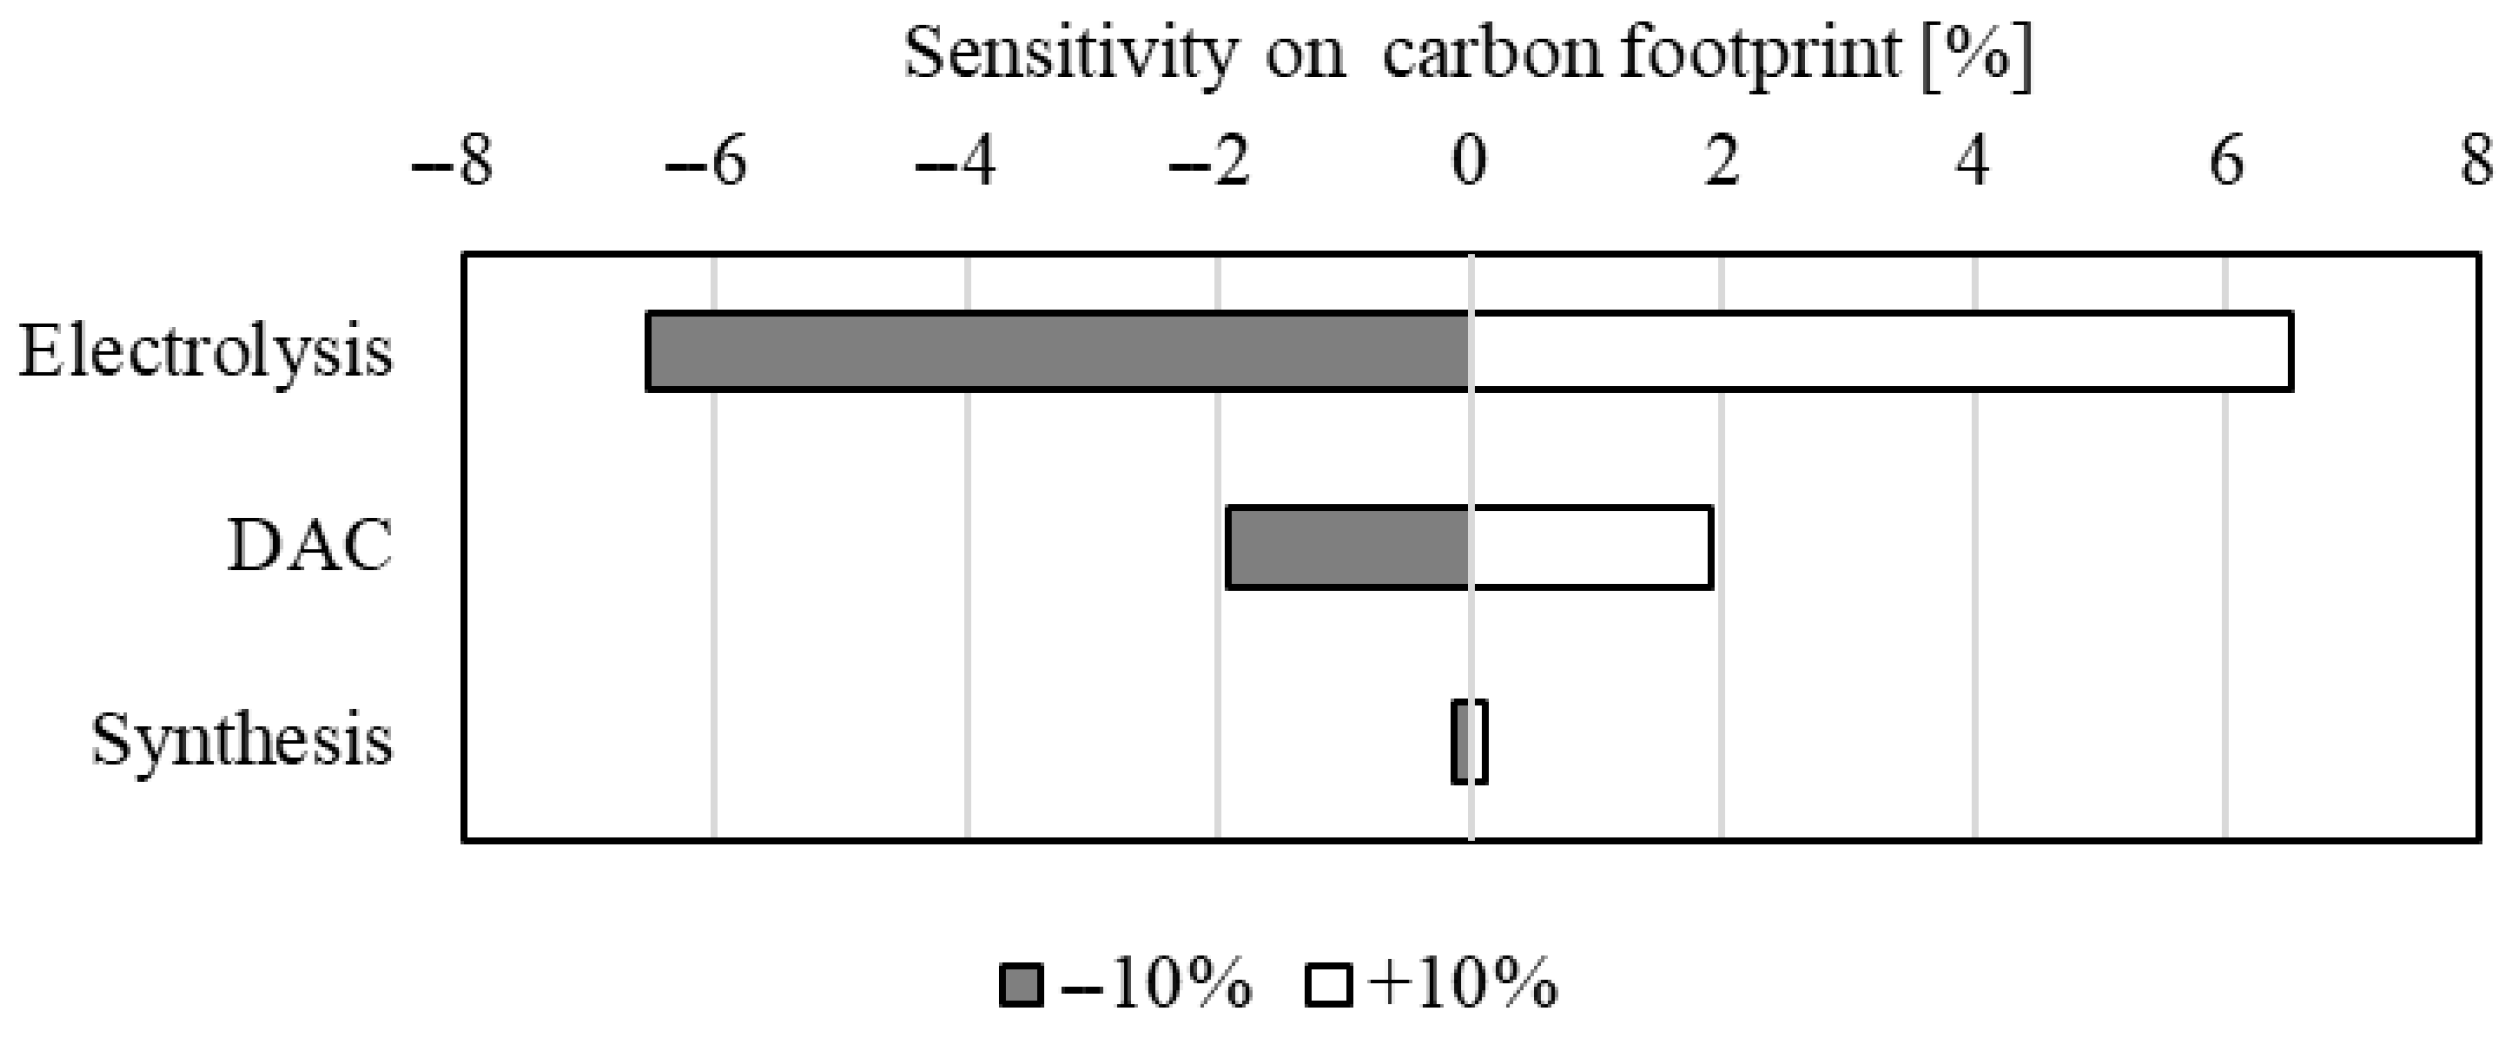
The sensitivity analysis was performed for the following two cases, with the results shown in Figure 5 and Figure 6.
Case 1.
The 2020 SLF-Vs under the BAU scenario. The H2 production technology is steam reforming, and the CO2 production technology is as a by-product.
Case 2.
The 2050 SLF-Vs under the decarbonization scenario. The H2 production technology is electrolysis conducted in Japan, and the CO2 production technology is DAC.
In Case 1, the sensitivity of the carbon footprint to a ±10% variation in each parameter was less than ±4% at maximum. Individual parameters related to SLF production did not have a significant impact on the carbon footprint.
On the other hand, in Case 2, the carbon footprint showed a high sensitivity of over 6% to a ±10% change in the production efficiency of water electrolysis. In this study, we used inventory data for the most advanced and widely used alkaline water electrolysis (56.7 kWh/kg-H2). Meanwhile, more energy-efficient water electrolysis methods are also being researched. Dresp et al. (2019) compared the energy consumption for producing 1 kg of hydrogen across various water electrolysis methods [50]. While the energy efficiency of alkaline water electrolysis is 47–63 kWh/kg-H2, that for proton-exchange membrane (PEM) electrolysis is 47–63 kWh/kg-H2 and for direct seawater electrolysis it is 50–53 kWh/kg-H2. The results of the sensitivity analysis indicate that the realization of such high-efficiency water electrolysis methods is highly valuable as it would lead to an improvement in the carbon footprint of SLF-Vs.
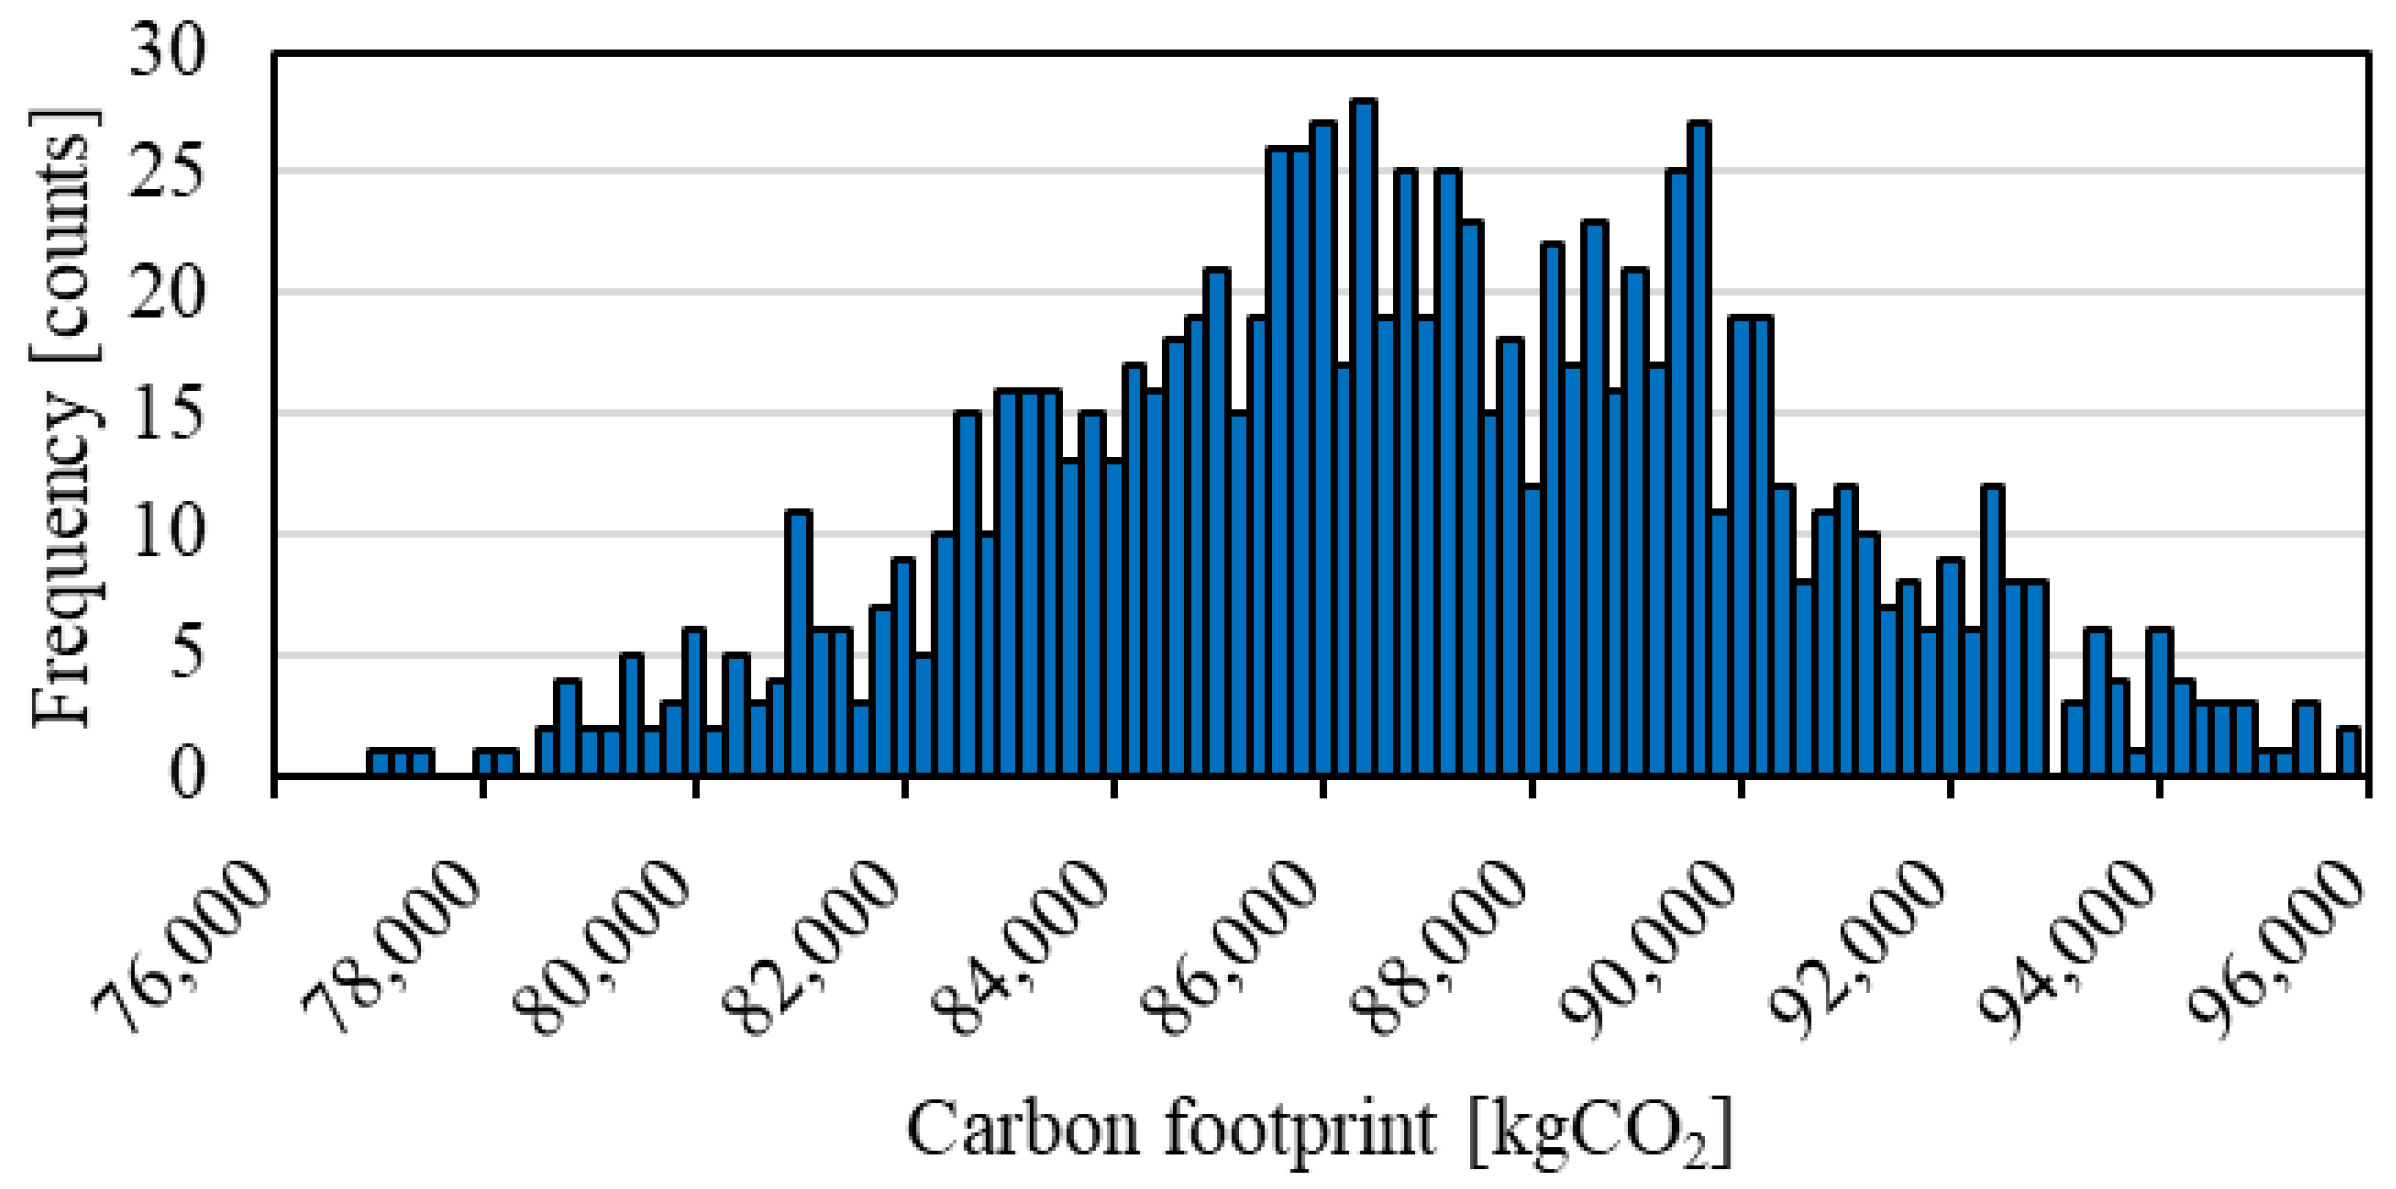
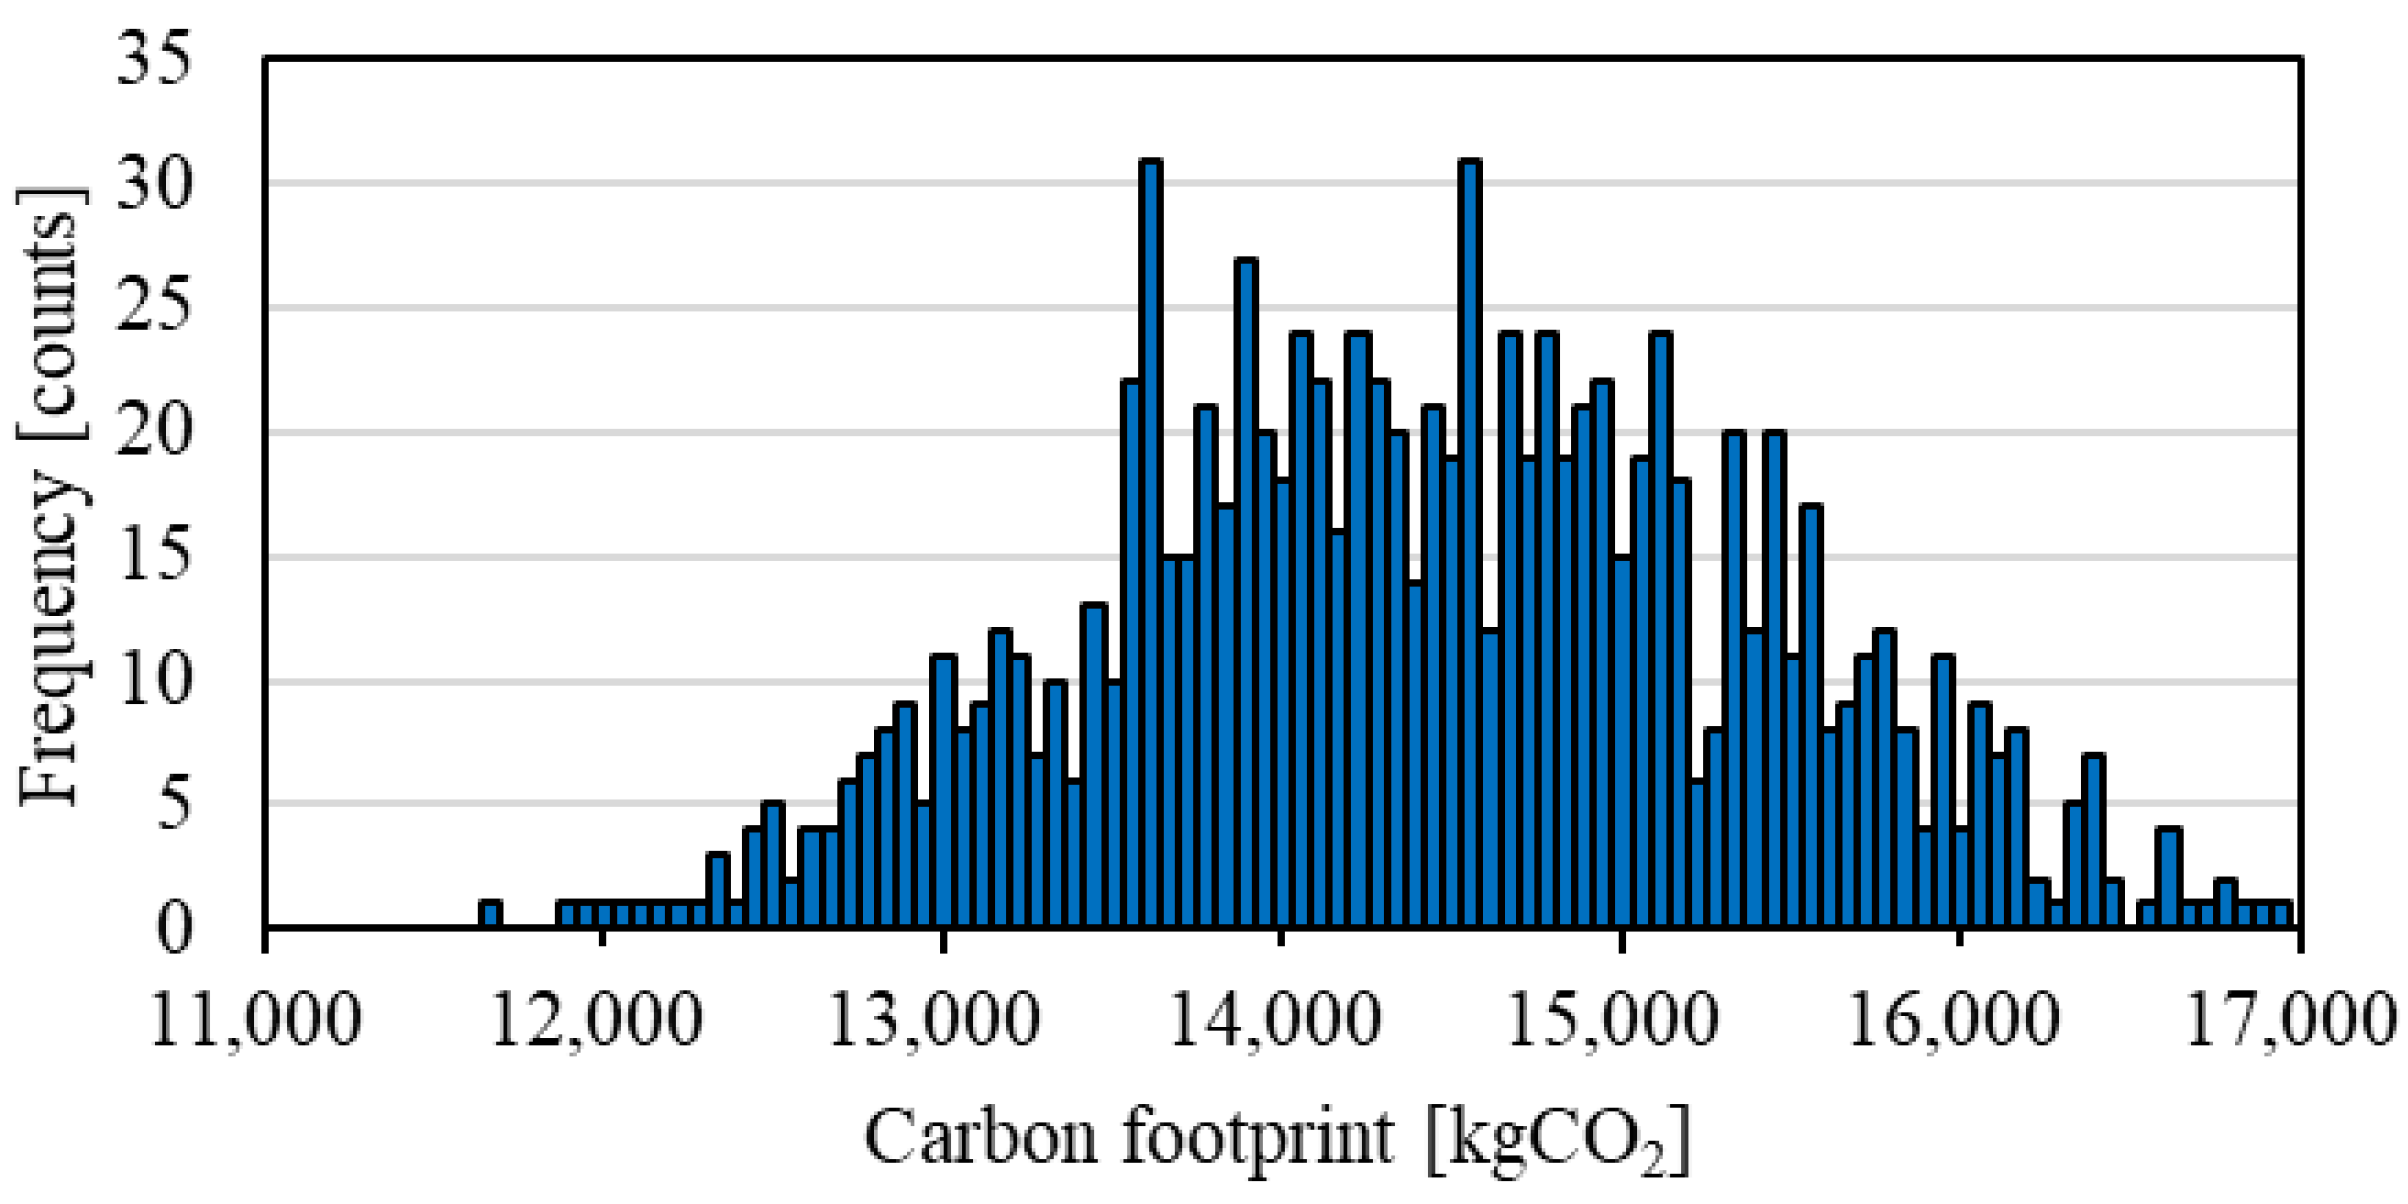
In the uncertainty analysis, Monte Carlo simulation is used to assign a normal distribution with a standard deviation of 10 to the CO2 intensity of H2 production, CO2 production, and synthesis, and a distribution of life-cycle CO2 emissions is generated over 1000 trial counts. The uncertainty analysis was conducted for all cases. The mean values and standard errors for all cases are shown in Table S9. In the main text, the results are shown only for the two cases that were the subject of the sensitivity analysis in Figure 7 and Figure 8.
The results of the uncertainty analysis for Case 1 are shown in Figure 7. In Case 1, the carbon footprint of GVs is 34,276 kg CO2, and even when considering uncertainty, the carbon footprint of SLF-Vs is much larger than that of GVs, indicating no advantage.
The results of the uncertainty analysis for Case 2 are shown in Figure 8. In Case 2, the carbon footprint of HEVs is 16,800 kg CO2. The carbon footprint of BEVs is 9940 kg CO2, and even when considering uncertainty, SLF-Vs do not outperform BEVs in terms of carbon footprint. This is attributed to the lower energy efficiency of SLF-Vs compared with BEVs, which is a result of energy conversions, such as water electrolysis, in the fuel production process [16].

4.2. Significance and Limitations

In this section, the significance of this study is clarified by comparing its evaluation conditions with those of previous studies on SLF-Vs by Sacchi et al. (2022) [23] and Schreiber et al. (2024) [15]. The limitations of this study are also discussed.
A comparison of the key evaluation conditions of the three studies is shown in Table 1. The scope of evaluation in this study is the entire vehicle life cycle, including WtW. Previous studies that evaluated the environmental impacts of SLFs typically had WtT or WtW scopes. However, BEVs and HEVs emit considerable amounts of CO2 during the production of lithium-ion batteries. Therefore, when comparing the climate impacts of ICEVs (including SLF-Vs) with those of BEVs and HEVs, it is crucial to assess the carbon footprint over the entire vehicle life cycle, including WtW emissions. Similarly to this study, Sacchi et al. also incorporated the vehicle life cycle into the system boundary, which enables a direct comparison between different vehicle types such as BEVs and HEVs. Furthermore, this study is the first scenario-based carbon footprint study on SLF-Vs specifically for Japan. Although Japan was included as a target country in the study by Sacchi et al., this is the first study to discuss the CO2 reduction effects of Japan-specific processes, such as the import of hydrogen from Australia. In this study, a scenario-based carbon footprint approach is adopted. Specifically, an evaluation was conducted for scenarios made up of various combinations of hydrogen production technologies, CO2 production technologies, power generation mixes, and their feasibility. By providing more-nuanced results, this approach enhances the decision-making quality of stakeholders in the SLF and automotive industries, as well as that of energy policymakers. This study and Schreiber et al. applied a system expansion approach to ensure consistency in the functional unit. Through this, the environmental impact of CCU in SLF production is considered, and a direct comparison with SLF-Vs using CO2 created by DAC and other vehicle types is made possible. Schreiber et al. also applied system expansion, which enables a direct comparison between different fuel synthesis processes. The results of the present study indicate that the inclusion or exclusion of compensation electricity can reverse the comparative magnitude of life-cycle CO2 emissions. The significance of using system expansion to align the functional unit has been shown [15,38]. The driving distance during the use phase in this study was set to 150,000 km, which is a commonly used assumption in the automotive industry. In contrast, Sacchi et al. set it to 200,000 km. If the driving distance were to be 4/3 times longer in this study, the CO2 emissions from WtW in Figure 4 would be 4/3 times greater. This indicates that, if the driving distance during the use phase is extended, the advantage of BEVs in the 2050 decarbonization scenario, which have very small emissions from WtW, would increase.
In this study, the CO2 emissions from SLF production vary according to the power generation mix. However, CO2 emissions from other aspects of the vehicle life cycle are treated as fixed values, independent of the power generation mix. In practice, CO2 emissions during the vehicle life cycle may vary depending on the power generation configuration. The target years of this study are 2020–2050, assuming constant production efficiency for all manufacturing technologies during this period. In practice, technological advancements may lead to improved production efficiency, and equipment such as water electrolysis units may experience degradation over time, resulting in lower efficiencies than their catalog specifications. However, this study does not account for such changes and conducts the evaluation using catalog specifications. In this study, it was assumed that FT fuels could be refueled directly into existing internal combustion engines. On the other hand, in the aviation sector, for example, due to the differences in characteristics between SLFs and fossil jet fuels, the blending ratio of sustainable aviation fuels (SAFs), which include SLFs, is currently set at a maximum of 50% [51]. Therefore, if an existing internal combustion engine were to be fueled with SLFs only, a process such as engine modification might be necessary, but such a process is not considered in this study.

4.3. Future Work

In this study, passenger cars fueled by SLFs were evaluated using a scenario-based carbon footprint approach. However, it is also important to apply this approach to large-scale transportation equipment that is difficult to electrify, such as large trucks, ships, and aircraft, which are also fueled by SLFs. Ueckerdt et al. argue that SLFs, which have a limited supply, should be used preferentially for these transportation devices [52]. Richter et al. conducted an LCA for the application of SLFs not only to passenger cars but also to various other transportation equipment [22]. For a more refined scenario-based carbon footprint assessment of SLF-Vs, it is necessary to account for changes in CO2 emissions from both SLF production and the vehicle life cycle based on variations in the power generation mix. This requires separating CO2 emissions from electricity generation and other emissions within the vehicle life cycle.
While future advances in production efficiency are anticipated, these can be accommodated by setting production efficiencies on a yearly basis. Additionally, scenario-specific settings for efficiency improvements can further enhance the quality of decision-making.
On the other hand, for equipment such as water electrolysis devices, it is necessary to consider stock effects, including replacements due to wear and degradation over time. In the context of widespread SLF-V adoption, it is also expected that existing GV bodies and engines will be repurposed for use in SLF-Vs. However, the scenario-based carbon footprint method, like conventional product-based carbon footprint or LCA approaches, typically evaluates a single product and does not consider stock effects. In this regard, life-cycle simulation (LCS) is effective, using dynamic material flow analysis, LCA, and discrete event simulation to model stock and material flows, thereby enabling dynamic assessments of CO2 emissions [53,54]. Based on these considerations, it is desirable to utilize LCS to evaluate the transition pathway toward the future adoption of SLF-Vs.
This study evaluates and compares the carbon footprint of SLF-Vs, BEVs, and other vehicle types. However, it does not aim to downplay the advantages of either SLF-Vs or BEVs from the perspective of CO2 emissions. Given the substantial electricity required for SLF production and the convenience challenges associated with BEVs, it is anticipated that both vehicle types will coexist in future society. Therefore, a long-term goal is to determine the optimal mix of SLF-Vs and BEVs, and the present scenario-based carbon footprint results provide essential information to support that deliberation.

5. Conclusions

In this study, the carbon footprint of SLF-Vs in Japan was analyzed across multiple scenarios up to 2050 and compared with those of GVs, HEVs, and BEVs. The carbon footprint of SLF-Vs varies considerably depending on the fuel production technology and the power generation mix.
The results show that, in fiscal years 2020 and 2030, the carbon footprint of SLF-Vs is more than 2.4 times that of GVs in all scenarios, indicating no advantage at that time. However, the carbon footprint of SLF-Vs decreases considerably when using water electrolysis or DAC combined with the increased adoption of renewable energy sources. In this scenario, the carbon footprint of SLF-Vs decreases to approximately 0.6 times in 2050, showing the potential for future CO2 emission reductions. Nonetheless, even if water electrolysis were to be conducted in Australia, where renewable energy adoption is advanced, and the fuel was then imported, the impact of Japan’s power generation mix remains. In this scenario, the carbon footprint of SLF-Vs was equal to or greater than that of GVs even in 2050. This highlights that advancing the adoption of decarbonized power sources in Japan is the most important future action.
In this study, the applicable year of each SLF production technology was determined based on technology roadmaps during scenario setting. However, in practice, even technically feasible options are subject to supply capacity constraints, and various production pathways are expected to coexist in the future. Additionally, while this study compares the life cycles of individual products, the widespread adoption of SLF-Vs may involve the reuse of GV bodies and engines. In this context, LCA, which focuses on a single product, is insufficient for evaluating the constraints on production technologies as well as material and energy stocks and flows. The complexity of assessing these limitations and dynamics warrants another independent study, which is currently underway.

Supplementary Materials

The following supporting information can be downloaded at: https://www.mdpi.com/article/10.3390/su17167500/s1, Table S1: Material composition of GVs and SLF vehicles, Table S2: Material composition of HEVs, Table S3: Material composition of BEVs, Table S4: Per-unit data by material, Table S5: CO2 emissions in each process of vehicle life cycle, Table S6: WtT inventory data, Table S7: Calorific value of each fuel, as well as fuel and electricity efficiencies, Table S8: CO2 emission intensity by power generation type, Table S9: The mean value and standard errors of Carbon footprint of SLF-Vs, Figure S1: Embodied CO2 intensity of grid power by electricity power mix.

Author Contributions

Conceptualization, G.Y. and H.K.; methodology, G.Y. and H.K.; software, G.Y.; validation, G.Y. and H.K.; formal analysis, G.Y.; investigation, G.Y., H.M., and H.K.; resources, G.Y., H.M., and H.K.; data curation, G.Y. and H.K.; writing—original draft preparation, G.Y.; writing—review and editing, H.M. and H.K.; visualization, G.Y.; supervision, H.K.; project administration, H.K.; funding acquisition, H.K. All authors have read and agreed to the published version of the manuscript.

Funding

This research received no external funding.

Institutional Review Board Statement

Not applicable.

Data Availability Statement

The original contributions presented in this study are included in the article or Supplementary Materials. Further inquiries can be directed to the corresponding author.

Conflicts of Interest

The authors declare no conflicts of interest. The funders had no role in the design of the study; in the collection, analyses, or interpretation of data; in the writing of the manuscript; or in the decision to publish the results.

Abbreviations

The following abbreviations are used in this manuscript:
SLF-VSynthetic liquid fuel vehicle
GVGasoline vehicle
HEVHybrid electric vehicle
BEVBattery electric vehicle
ICEVInternal combustion engine vehicle
TtWTank-to-wheel
WtTWell-to-tank
WtWWell-to-wheel
FTFischer–Tropsch
LCALife-cycle assessment
DACDirect air capture
CCUCarbon capture and utilization
BAUBusiness as usual

References

  1. Lee, H.; Calvin, K.; Dasgupta, D.; Krinner, G.; Mukherji, A.; Thorne, P.; Trisos, C.; Romero, J.; Aldunce, P.; Barret, K. IPCC, 2023: Climate Change 2023: Synthesis Report, Summary for Policymakers. Contribution of Working Groups I, II and III to the Sixth Assessment Report on Climate Change on Governmental Panel of the Sixth Assessment Report; Core Writing Team, Lee, H., Romero, J., Eds.; IPCC: Geneva, Switzerland, 2023. [Google Scholar]
  2. EDGAR. GHG Emissions of All World Countries—Report 2024; Publications Office of the European Union: Luxembourg, 2024. [Google Scholar]
  3. IEA. What Are the Main Sources of Global CO2 Emissions? Available online: https://www.iea.org/world/emissions#what-are-the-main-sources-of-global-co2-emissions/ (accessed on 28 July 2025).
  4. Knobloch, F.; Hanssen, S.V.; Lam, A.; Pollitt, H.; Salas, P.; Chewpreecha, U.; Huijbregts, M.A.J.; Mercure, J.-F. Net emission reductions from electric cars and heat pumps in 59 world regions over time. Nat. Sustain. 2020, 3, 437–447. [Google Scholar] [CrossRef]
  5. Kawamoto, R.; Mochizuki, H.; Moriguchi, Y.; Nakano, T.; Motohashi, M.; Sakai, Y.; Inaba, A. Estimation of CO2 emissions of internal combustion engine vehicle and battery electric vehicle using LCA. Sustainability 2019, 11, 2690. [Google Scholar] [CrossRef]
  6. METI. Green Growth Strategy Through Achieving Carbon Neutrality in 2050. Available online: https://www.meti.go.jp/english/policy/energy_environment/global_warming/ggs2050/index.html (accessed on 18 July 2025).
  7. IEA. Global EV Outlook 2020 Entering the Decade of Electric Drive? IEA: Paris, France, 2023. [Google Scholar]
  8. Hanni, U.E.; Yamamoto, T.; Nakamura, T. An Analysis of Electric Vehicle Charging Intentions in Japan. Sustainability 2024, 16, 1177. [Google Scholar] [CrossRef]
  9. Zhang, C.; Zhao, X.; Sacchi, R.; You, F. Trade-off between critical metal requirement and transportation decarbonization in automotive electrification. Nat. Commun. 2023, 14, 1616. [Google Scholar] [CrossRef]
  10. Dell’Aversano, S.; Villante, C.; Gallucci, K.; Vanga, G.; Di Giuliano, A. E-fuels: A comprehensive review of the most promising technological alternatives towards an energy transition. Energies 2024, 17, 3995. [Google Scholar] [CrossRef]
  11. Uddin, M.N.; Wang, F. Fuelling a clean future: A systematic review of Techno-Economic and Life Cycle assessments in E-Fuel Development. Appl. Sci. 2024, 14, 7321. [Google Scholar] [CrossRef]
  12. METI. 2023/06/23 Carbon Recycling Roadmap Review Committee. 2023. Available online: https://www.meti.go.jp/shingikai/energy_environment/carbon_recycle_rm/pdf/20230623_03.pdf (accessed on 18 July 2025).
  13. Dieterich, V.; Buttler, A.; Hanel, A.; Spliethoff, H.; Fendt, S. Power-to-liquid via synthesis of methanol, DME or Fischer–Tropsch-fuels: A review. Energy Environ. Sci. 2020, 13, 3207–3252. [Google Scholar] [CrossRef]
  14. Panzone, C.; Philippe, R.; Chappaz, A.; Fongarland, P.; Bengaouer, A. Power-to-Liquid catalytic CO2 valorization into fuels and chemicals: Focus on the Fischer-Tropsch route. J. CO2 Util. 2020, 38, 314–347. [Google Scholar] [CrossRef]
  15. Schreiber, A.; Troy, S.; Weiske, S.; Samsun, R.C.; Peters, R.; Zapp, P.; Kuckshinrichs, W. Comparative well-to-tank life cycle assessment of methanol, dimethyl ether, and oxymethylene dimethyl ethers via the power-to-liquid pathway. J. CO2 Util. 2024, 82, 102743. [Google Scholar] [CrossRef]
  16. Hänggi, S.; Elbert, P.; Bütler, T.; Cabalzar, U.; Teske, S.; Bach, C.; Onder, C. A review of synthetic fuels for passenger vehicles. Energy Rep. 2019, 5, 555–569. [Google Scholar] [CrossRef]
  17. van der Giesen, C.; Kleijn, R.; Kramer, G.J. Energy and Climate Impacts of Producing Synthetic Hydrocarbon Fuels from CO2. Environ. Sci. Technol. 2014, 48, 7111–7121. [Google Scholar] [CrossRef] [PubMed]
  18. Liu, C.M.; Sandhu, N.K.; McCoy, S.T.; Bergerson, J.A. A life cycle assessment of greenhouse gas emissions from direct air capture and Fischer–Tropsch fuel production. Sustain. Energy Fuels 2020, 4, 3129–3142. [Google Scholar] [CrossRef]
  19. Delgado, H.E.; Cappello, V.; Zang, G.; Sun, P.; Ng, C.; Vyawahare, P.; Elgowainy, A.A.; Wendt, D.S.; Boardman, R.D.; Marcinkoski, J. Techno-economic analysis and life cycle analysis of e-fuel production using nuclear energy. J. CO2 Util. 2023, 72. [Google Scholar] [CrossRef]
  20. Hombach, L.E.; Doré, L.; Heidgen, K.; Maas, H.; Wallington, T.J.; Walther, G. Economic and environmental assessment of current (2015) and future (2030) use of E-fuels in light-duty vehicles in Germany. J. Clean. Prod. 2019, 207, 153–162. [Google Scholar] [CrossRef]
  21. Zang, G.; Sun, P.; Elgowainy, A.; Wang, M. Technoeconomic and Life Cycle Analysis of Synthetic Methanol Production from Hydrogen and Industrial Byproduct CO2. Environ. Sci. Technol. 2021, 55, 5248–5257. [Google Scholar] [CrossRef]
  22. Richter, S.; Braun-Unkhoff, M.; Hasselwander, S.; Haas, S. Evaluation of the Applicability of Synthetic Fuels and Their Life Cycle Analyses. Energies 2024, 17, 981. [Google Scholar] [CrossRef]
  23. Sacchi, R.; Bauer, C.; Cox, B.; Mutel, C. When, where and how can the electrification of passenger cars reduce greenhouse gas emissions? Renew. Sustain. Energy Rev. 2022, 162, 112475. [Google Scholar] [CrossRef]
  24. Luo, L.; Wang, H.; Li, C.; Hu, Y. Life cycle assessment of methanol vehicles from energy, environmental and economic perspectives. Energy Rep. 2022, 8, 5487–5500. [Google Scholar] [CrossRef]
  25. Cabinet Secretariat. Growth Strategy Meeting (6th). Green Growth Strategy for Carbon Neutrality by 2050; Japan’s Ministry of Economy, Trade and Industry (METI): Tokyo, Japan, 2020. Available online: https://www.cas.go.jp/jp/seisaku/seicho/seichosenryakukaigi/dai6/siryou1.pdf (accessed on 18 July 2025).
  26. ANRE. How to Produce Hydrogen, the Next Generation Energy Source? 2021. Available online: https://www.enecho.meti.go.jp/about/special/johoteikyo/suiso_tukurikata.html (accessed on 18 July 2025).
  27. JIMGA. How Carbon Dioxide Is Produced. 2024. Available online: https://www.jimga.or.jp/gas/produce_co2/ (accessed on 18 July 2025).
  28. JETRO. Survey on the Hydrogen Industry in Australia. 2021. Available online: https://www.jetro.go.jp/world/reports/2021/01/82b3276826014c69.html (accessed on 18 July 2025).
  29. ISO 14040: 2006; Environmental Management-Life Cycle Assessment-Principles and Framework. International Organization for Standardization: Geneva, Switzerland, 2006.
  30. Wiedmann, T.; Minx, J. A definition of ‘carbon footprint’. Ecol. Econ. Res. Trends 2008, 1, 1–11. [Google Scholar]
  31. Schmidt, H.J. Carbon footprinting, labelling and life cycle assessment. Int. J. Life Cycle Assess. 2009, 14 (Suppl. S1), 6–9. [Google Scholar] [CrossRef]
  32. Bisinella, V.; Christensen, T.H.; Astrup, T.F. Future scenarios and life cycle assessment: Systematic review and recommendations. Int. J. Life Cycle Assess. 2021, 26, 2143–2170. [Google Scholar] [CrossRef]
  33. van der Giesen, C.; Cucurachi, S.; Guinée, J.; Kramer, G.J.; Tukker, A. A critical view on the current application of LCA for new technologies and recommendations for improved practice. J. Clean. Prod. 2020, 259, 120904. [Google Scholar] [CrossRef]
  34. Fukushima, Y.; Hirao, M. A structured framework and language for scenario-based Life Cycle assessment. Int. J. Life Cycle Assess. 2002, 7, 317–329. [Google Scholar] [CrossRef]
  35. Arvesen, A.; Hertwich, E.G. Environmental implications of large-scale adoption of wind power: A scenario-based life cycle assessment. Environ. Res. Lett. 2011, 6, 045102. [Google Scholar] [CrossRef]
  36. Rossi, F.; Zuffi, C.; Parisi, M.L.; Fiaschi, D.; Manfrida, G. Comparative scenario-based LCA of renewable energy technologies focused on the end-of-life evaluation. J. Clean. Prod. 2023, 405, 136931. [Google Scholar] [CrossRef]
  37. Kosamia, N.; Sanchez, A.; Rakshit, S. Scenario-based life cycle assessment and environmental monetary valuation of biosuccinic acid production from lignocellulosic biomass. Ind. Crop. Prod. 2023, 202, 117101. [Google Scholar] [CrossRef]
  38. von der Assen, N.; Jung, J.; Bardow, A. Life-cycle assessment of carbon dioxide capture and utilization: Avoiding the pitfalls. Energy Environ. Sci. 2013, 6, 2721–2734. [Google Scholar] [CrossRef]
  39. Hawkins, T.R.; Singh, B.; Majeau-Bettez, G.; Strømman, A.H. Comparative Environmental Life Cycle Assessment of Conventional and Electric Vehicles. J. Ind. Ecol. 2012, 17, 53–64. [Google Scholar] [CrossRef]
  40. METI. Energy Supply and Demand Performance for Fiscal Year 2021 (Final Report). 2023. Available online: https://www.meti.go.jp/press/2023/04/20230421001/20230421001-1.pdf (accessed on 18 July 2025).
  41. Our World in Data. Australia: Energy Country Profile. 2023. Available online: https://ourworldindata.org/energy/country/australia (accessed on 18 July 2025).
  42. APEC. APEC Energy Demand and Supply Outlook 8th Edition 2022. Available online: https://view.officeapps.live.com/op/view.aspx?src=https%3A%2F%2Faperc.or.jp%2Ffile%2F2022%2F9%2F27%2FAPEC_Outlook_8th_Edition-Appendix.xlsx&wdOrigin=BROWSELINK (accessed on 18 July 2025).
  43. Mizuho Information & Research Institute, Inc. Research on Life Cycle Assessment of Stationary Fuel Cell Systems and Fuel Cell Vehicles; Mizuho Information & Research Institute, Inc.: Tokyo, Japan, 2008. [Google Scholar]
  44. Kosai, S.; Matsui, K.; Matsubae, K.; Yamasue, E.; Nagasaka, T. Natural resource use of gasoline, hybrid, electric and fuel cell vehicles considering land disturbances. Resour. Conserv. Recycl. 2021, 166, 105256. [Google Scholar] [CrossRef]
  45. AIST. LCI database IDEA version 2.3. 2020. Available online: https://sumpo.or.jp/consulting/lca/idea/ (accessed on 18 July 2025).
  46. CRIEPI. Hydrogen/Ammonia Power Generation Costs and Thermal Power Generation Costs with CCS. 2022. Available online: https://www.meti.go.jp/shingikai/energy_environment/ccs_choki_roadmap/pdf/002_03_00.pdf (accessed on 18 July 2025).
  47. CRIEPI. Comprehensive Assessment of Life Cycle CO2 Emissions from Power Generation Technologies in Japan. 2016. Available online: https://criepi.denken.or.jp/hokokusho/pb/reportDownload?reportNoUkCode=Y06&tenpuTypeCode=30&seqNo=1&reportId=871 (accessed on 18 July 2025).
  48. Concawe. E-Fuels: A Technoeconomic Assessment of European Domestic Production and Imports Towards 2050. 2022. Available online: https://www.concawe.eu/wp-content/uploads/Rpt_22-17.pdf (accessed on 18 July 2025).
  49. JWBA. GHG Emissions from Wood Biomass Power Generation Using Domestic Timber. 2022. Available online: https://www.meti.go.jp/shingikai/enecho/shoene_shinene/shin_energy/biomass_sus_wg/pdf/012_03_00.pdf (accessed on 18 July 2025).
  50. Dresp, S.; Dionigi, F.; Klingenhof, M.; Strasser, P. Direct electrolytic splitting of seawater: Opportunities and challenges. ACS Energy Lett. 2019, 4, 933–942. [Google Scholar] [CrossRef]
  51. ASTM D7566-23b; Standard Specification for Aviation Turbine Fuel Containing Synthesized Hydrocarbons. ASTM International: West Conshohocken, PA, USA, 2023. Available online: https://www.astm.org/ (accessed on 3 August 2025).
  52. Ueckerdt, F.; Bauer, C.; Dirnaichner, A.; Everall, J.; Sacchi, R.; Luderer, G. Potential and risks of hydrogen-based e-fuels in climate change mitigation. Nat. Clim. Change 2021, 11, 384–393. [Google Scholar] [CrossRef]
  53. Kumazawa, T.; Kobayashi, H. A simulation system to support the establishment of circulated business. Adv. Eng. Informatics 2006, 20, 127–136. [Google Scholar] [CrossRef]
  54. Umeda, Y.; Nonomura, A.; Tomiyama, T. Study on life-cycle design for the post mass production paradigm. Artif. Intell. Eng. Des. Anal. Manuf. 2000, 14, 149–161. [Google Scholar] [CrossRef]
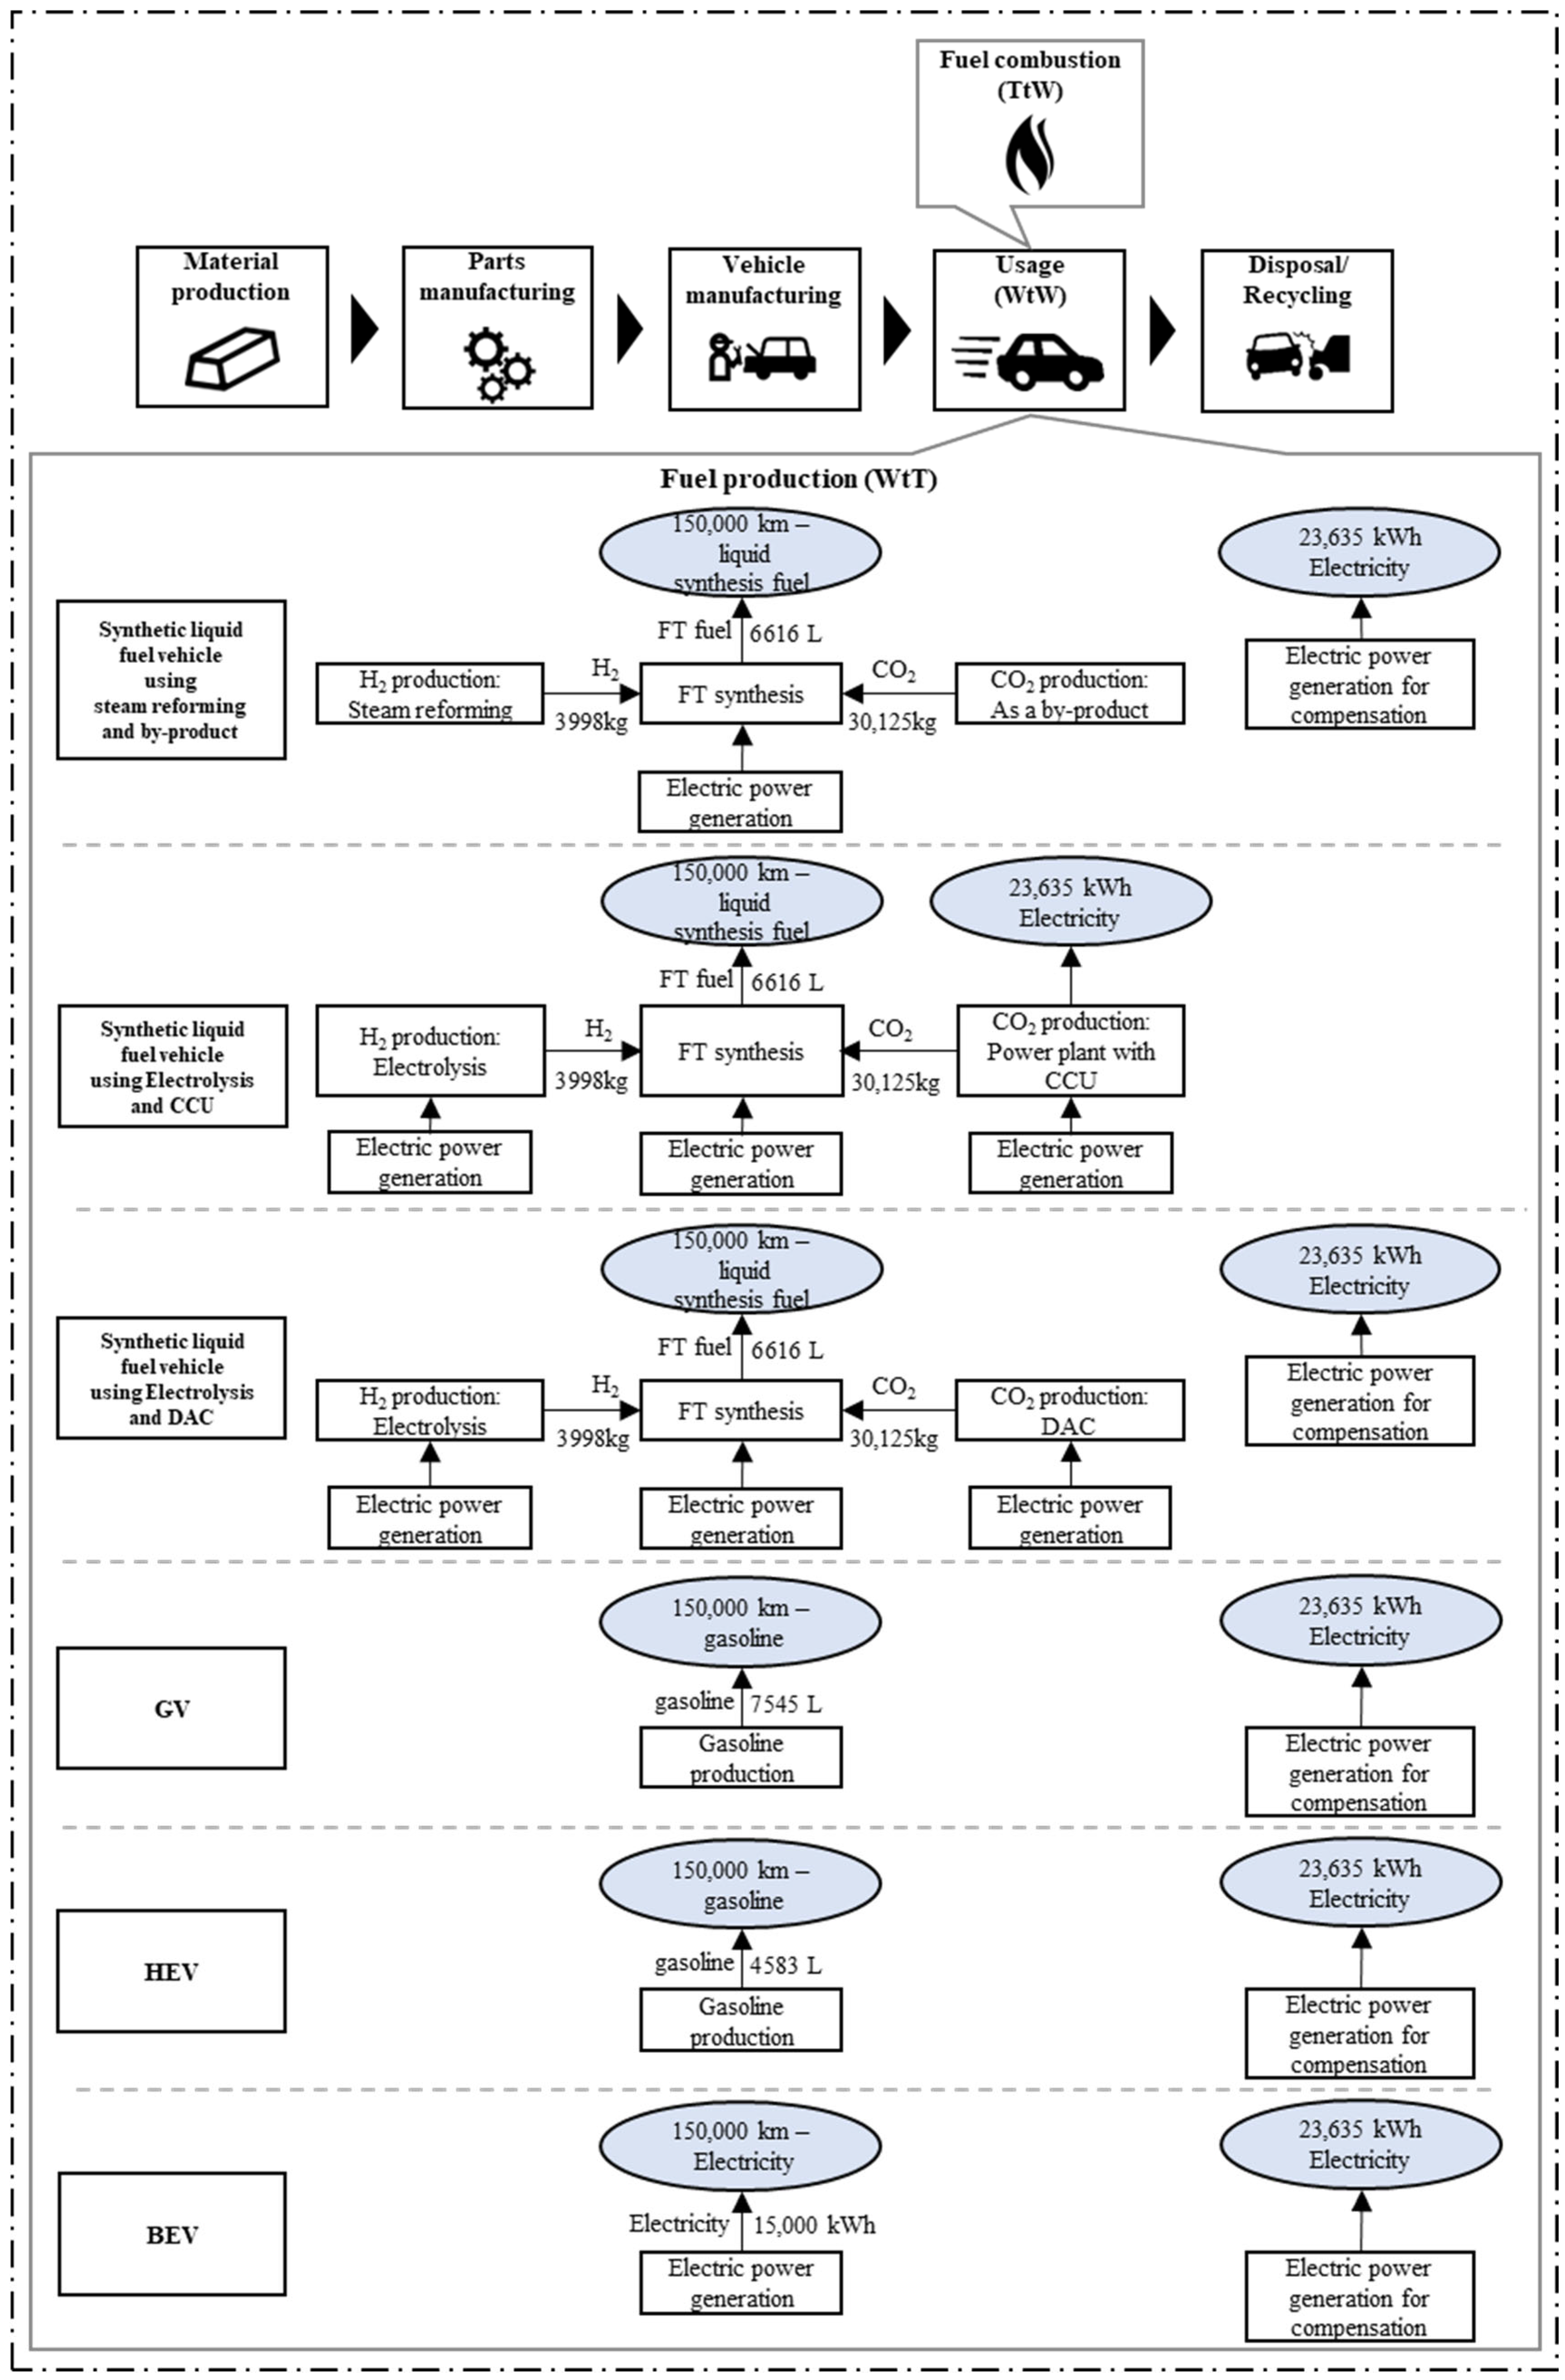
Figure 1. System boundary of the study.
Sustainability 17 07500 g001
Figure 2. Applicable period of production technology from technology roadmaps [5,20].
Sustainability 17 07500 g002
Figure 3. Electrical power mix of each scenario.
Sustainability 17 07500 g003
Figure 4. Carbon footprint expressed as a relative ratio of that of GVs in 2020 (34,276 kg CO2). Regarding SLF-V, “A&B” refers to SLF-Vs that run on SLF synthesized from H2 produced by method A and CO2 produced by method B. (SR: steam reforming, E(JP): electrolysis (JP), E(AUS): electrolysis (AUS), BP: by-product, CCU: carbon capture and utilization, DAC: direct air capture).
Sustainability 17 07500 g004
Figure 5. Sensitivity analysis for Case 1: 2020 SLF-Vs under BAU scenario. The H2 production technology is steam reforming, and the CO2 production technology is as a by-product.
Sustainability 17 07500 g005
Figure 6. Sensitivity analysis for Case 2: 2050 SLF-Vs under decarbonization scenario. The H2 production technology is electrolysis conducted in Japan, and the CO2 production technology is DAC.
Sustainability 17 07500 g006
Figure 7. Uncertainty analysis for Case 1: 2020 SLF-Vs under BAU scenario. The H2 production technology is steam reforming, and the CO2 production technology is as a by-product.
Sustainability 17 07500 g007
Figure 8. Uncertainty analysis for Case 2: 2050 SLF-Vs under decarbonization scenario. The H2 production technology is electrolysis conducted in Japan, and the CO2 production technology is DAC.
Sustainability 17 07500 g008
Table 1. Comparison of key evaluation conditions.
This StudySacchi et al. [23]Schreiber et al. [15]
Scope of EvaluationVehicle life cycle (manufacturing, usage, disposal/recycling). The usage phases encompasses both WtT and TtW.Vehicle life cycle (manufacturing, usage, disposal/recycling, road). The encompasses both WtT and TtW.WtT.
Target Vehicle TypesSLF-V (body/engine same as GV), GV, HEV, and BEV.BEV and HEV (fossil gasoline and synthetic gasoline).N/A (focus on fuel production).
Target CountryJapan. (H2 import from Australia in one scenario)European countries, Brazil, China, India, Japan, and the United States.Germany.
H2 Production TechnologySteam reforming, electrolysis (JP) and electrolysis (AUS)ElectrolysisElectrolysis
CO2 Production TechnologyBy-product, CCU and DACDACCCU
Availability of each technologyConsidered.Not Considered.Not Considered.
Fuel Synthesis ProcessesFT synthesis.Methanol to gasoline.Methanol, dymethyl ether, and oxymethylene dimethyl ether.
Electricity Power Mixes”Japan’s BAU”, “Decarbonization”, and “Australia decarbonization and Japan BAU” scenarios (2020–2050).Electricity mix in climate scenarios of “2 °C” and “3.5 °C” in each target country (2020–2050).German electricity mixes (2021, 2030), and wind power.
Functional UnitLife-cycle of one vehicle with a driving distance of 150,000 km and 23,635 kWh of power production (System Power Production).GHG emissions per kilometer driven.Supply of 1 L diesel-equivalent and 3.53 kWh of power production (System expansion).
Driving Distance in use phase150,000 km.200,000 km.N/A (WtT scope).
Disclaimer/Publisher’s Note: The statements, opinions and data contained in all publications are solely those of the individual author(s) and contributor(s) and not of MDPI and/or the editor(s). MDPI and/or the editor(s) disclaim responsibility for any injury to people or property resulting from any ideas, methods, instructions or products referred to in the content.