Article

Has Green Technological Innovation Become an Accelerator of Carbon Emission Reductions?

1
Glorious Sun School of Business and Management, Donghua University, 1882 West Yan’an Road, Shanghai 200051, China
2
School of Management, Hefei University of Technology, 193 Tunxi Road, Hefei 230009, China
*
Author to whom correspondence should be addressed.
Sustainability 2025, 17(16), 7499; https://doi.org/10.3390/su17167499
Submission received: 11 June 2025 / Revised: 13 August 2025 / Accepted: 14 August 2025 / Published: 19 August 2025
(This article belongs to the Section Economic and Business Aspects of Sustainability)

Abstract

With the advancement of global climate governance, public attention—an emerging form of social capital—has played an increasingly important role in the carbon emission effects of green technological innovation. Based on panel data from 267 prefecture-level cities in China from 2012 to 2022, this study employed a two-way fixed-effects model to identify the nonlinear relationship between green innovation and carbon emissions, incorporated interaction terms to examine the moderating effect of public attention, and applied a spatial Durbin model to analyze the spatial spillover effects of green innovation. The results reveal an inverted U-shaped relationship between green innovation and carbon emissions, with the inflection point corresponding to 8.58 authorized green patents per 10,000 people—a threshold that most cities have yet to reach. Public attention significantly altered the shape of the carbon effect curve by making it steeper; in cities with a higher share of secondary industry, it delayed the inflection point, whereas in cities dominated by the tertiary industry, the turning point appeared earlier. In addition, green innovation had significant spatial spillover effects, and its impact on carbon emissions in neighboring cities displayed a U-shaped pattern. This paper proposes an analytical framework of “socially empowered innovation” to reveal the nonlinear moderating mechanism through which public attention influences the carbon effects of green innovation. The findings offer important policy implications: efforts should focus on long-term innovation, promote regional coordination, guide rational public participation, and avoid short-sighted and unsustainable mitigation practices.

1. Introduction

As the global temperature continues to rise, the importance of greenhouse gas (GHG) emissions control has become increasingly prominent. As it is the most dominant greenhouse gas, reducing carbon dioxide (CO2) emissions has become a central issue in global climate governance [1]. In 2024, greenhouse gas emissions worldwide reached an all-time high and global temperatures hit unprecedented levels, and the effects of climate change are intensifying and accelerating [2]. Identifying the opportunities and challenges in the process of carbon neutrality is vital to accelerate global climate governance and realize a fair transformation [3].
The United Nations Environment Programme (UNEP) [4] has warned that if current emissions reductions are insufficient, global temperatures could rise by more than 3.1 °C by the end of the century, well above the 1.5 °C control target set by the Paris Agreement [5]. In response to this serious challenge, the United Nations [6] supported the establishment of the Net Zero Emissions Coalition (NZEC) to mobilize governments, businesses, cities and financial institutions to achieve net zero emissions by 2050 [7]. The Alliance encourages its members to formulate scientific and feasible emissions reduction pathways, and actively promotes the development of renewable energy and the improvement of energy efficiency to contribute to the realization of global climate goals [8].
As a responsible developing country, China clearly proposed the strategic goal of “carbon peaking and carbon neutrality”, striving to achieve carbon peaking by 2030 and carbon neutrality by 2050 [9]. This goal not only reflects China’s firm determination to combat climate change but also highlights its responsibility in the global green and low-carbon transition process [10]. To achieve the “dual-carbon” goal, China has issued a number of policy documents to systematically promote synergies between pollution reduction and carbon reduction in key areas, such as energy, industry, transport, and buildings [11]. These include the Action Plan for Carbon Dioxide Peaking Before 2030 [12]; the Opinions on Completely, Accurately, and Comprehensively Implementing the New Development Concept to Achieve Carbon Peaking and Carbon Neutrality Goals [13]; and the Implementation Plan for Synergizing Pollution Reduction and Carbon Reduction [14], which all provide detailed roadmaps for achieving coordinated environmental and climate goals in these sectors.
Additionally, green technology innovation has been established as the core pathway to achieving the goals of carbon peaking and carbon neutrality, with green technologies playing a key leading role in optimizing the energy structure, promoting industrial transformation and upgrading, and reducing the intensity of carbon emissions [15]. This will provide solid support for the synergy of high-quality economic development and carbon emission reduction goals. With the continuous improvement of the policy system and the accelerated promotion of green technology innovation, the concepts of green and low carbon have become increasingly prevalent in people’s minds, leading to the formation of a favorable atmosphere in which all of society pays attention to the environment and climate change and actively participates in the green and low-carbon transformation [11].
Therefore, has green technological innovation helped China achieve carbon emission reductions? Does public concern for the environment and climate affect green innovation’s effectiveness in reducing emissions? Addressing these questions is of great practical significance for achieving China’s “dual-carbon” goals and promoting global carbon neutrality. To this end, this study conducted an empirical investigation based on panel data from 267 prefecture-level cities in China from 2012 to 2022. First, a two-way fixed-effects panel model was employed to systematically assess the impact of green technological innovation on urban carbon emissions and its nonlinear characteristics. Second, public concern was introduced as a moderating variable through interaction terms to explore its regulatory role in this relationship. Furthermore, a spatial Durbin model was constructed to identify green innovation’s spatial spillover effects.
The results show that green technological innovation and carbon emissions exhibited an inverted U-shaped relationship—which initially promoted emissions and subsequently suppressed them. However, this curve’s inflection point shifted with the level of public concern: it moved to the right in cities with a more developed secondary industry and to the left in those with a stronger tertiary industry. Further analysis revealed that public concern enhanced the elasticity of emissions reduction during the technology maturity phase while exacerbating the energy rebound effect during the technology introduction phase. In addition, green innovation had significant spatial spillover effects, where its impact on carbon emissions in neighboring cities displayed a U-shaped pattern.
The marginal contributions of this study are as follows: Firstly, while most existing research employed carbon emissions or carbon emission efficiency as dependent variables to explore the relationship between green technology innovation and low-carbon development, these measures often lack an evaluation of the current state. In contrast, this study adopts total carbon dioxide emissions as an indicator of carbon emissions, which demonstrates strong inclusivity. The construction of the indicator system encompasses not only the economic and environmental systems but also the social system, with a focus on evaluating the current state. This approach enriches the existing literature on the relationship between technological innovation and the carbon dioxide emissions coefficient. Secondly, unlike previous studies that primarily considered the linear moderating effects of green technology innovation, this research further explores whether such moderating effects could be nonlinear. This extends the theoretical framework by incorporating the dynamic interactions among green technology innovation, public participation, and carbon emission reductions. This discovery also contributes to a deeper understanding of how green technology innovation impacts carbon reduction, offering valuable insights for more targeted policy design in the era of digital transformation. Finally, by constructing the “Public Participation in Green Technology Innovation” analytical framework, this study integrates public participation into the link between green technology innovation and carbon emission reduction goals, thereby filling a gap in the existing research. Crucially, this framework introduces a spatial perspective to evaluate the spatial spillover effects of green technology innovation, revealing how digital technologies can promote carbon reduction through public participation mechanisms, thereby offering new insights for regional collaborative governance and the diffusion of green technologies.
The remainder of the paper is structured as follows: the theoretical analysis and research hypotheses are presented in Section 2; the research design and data description are provided in Section 3; the empirical analysis in presented in Section 4; the discussion is presented in Section 5; and the conclusions and policy recommendations are presented in Section 6.

2. Theoretical Analysis and Research Assumptions

2.1. Analysis of Green Technology Innovation’s Impact on Carbon Emissions

According to the theory of sustainable transition, sustainability-oriented transformation is a nonlinear process rather than a one-off radical shift. This implies that the transformation does not follow a simple linear causal relationship but is instead achieved through the accumulation of multiple phases of technological innovation, institutional reform, and social engagement, eventually resulting in profound systemic change [16,17].
Based on this theory, some studies suggest that, in the early stages of green technological innovation, related innovations are primarily focused on improving energy efficiency. These improvements aim to reduce energy consumption and lower carbon emissions while maintaining the same output scale. However, the energy structure at this stage still relies heavily on coal and other high-carbon sources [18,19]. Specifically, in the initial stages of green technology development, there may be a rebound effect, and its rapid expansion necessitates attracting a significant flow of high-quality factor resources to the region [20]. Guo et al. further point out that when green technology innovation reaches a certain level, “Metcalfe’s Law” begins to manifest itself [21]. The marginal cost of integrated development across different sectors continues to decrease, while the benefits increase exponentially [22]. Based on the above research, and synthesizing these findings from the perspective of cost theory, it can be inferred that a decline in production costs may lead to lower product prices, which stimulates market demand. To meet this increased demand, enterprises tend to expand their production capacity and increase input factors. Since the energy structure in the early stage of innovation is still dominated by high-carbon energy, the resulting rise in energy consumption from the expanded output may offset the energy savings, leading to a “carbon rebound effect”, whereby green technology innovation could inadvertently increase carbon emissions.
Likewise, based on the theory of sustainable transition, Kafeel et al. argue that in OECD countries with higher green technological innovation levels, such technologies can promote the large-scale substitution of high-carbon energy with clean energy [23]. Combined with the findings of ref. [20], Wang et al. further deduced that in the advanced stage of green technological innovation, even when enterprises expand their production capacity, the additional energy demand primarily comes from clean sources [24]. In this context, the “clean effect” outweighs the “carbon rebound effect”. Therefore, green technological innovation at this stage can suppress carbon emissions. This conclusion aligns with the core proposition of ecological modernization theory, which holds that economic development and environmental protection are not necessarily in conflict, but can instead be coordinated to achieve a “win–win” outcome under appropriate institutional arrangements and technological progress.
Based on the above reasoning, this study proposed the following hypothesis:
H1. 
There is an inverted U-shaped nonlinear relationship between green technological innovation and carbon emissions.

2.2. Analysis of Public Concern’s Moderating Effect

From the perspective of stakeholder theory, corporate strategic decisions are based on responding to and balancing the interests of multiple actors [25]. Mitchell et al. [26] further proposed the “Stakeholder Salience Model”, which suggests that the influence of stakeholders on corporate behavior stems from three attributes: power, legitimacy, and urgency. In the digital age, social media’s rapid development has empowered the public with the ability to produce and disseminate information, enabling them to exhibit all three attributes regarding environmental issues. First, social platforms allow the public to aggregate and amplify public opinion pressure, substantially influencing corporate reputation and even stock prices [27]; second, the global and public nature of the climate crisis gives the public’s environmental demands a high level of moral legitimacy [28]; third, online public opinion is highly event-driven, often requiring companies to respond rapidly in a short period [29,30]. As a result, the public has shifted from being a “latent stakeholder” to a “definitive stakeholder” [31], and their environmental concern is gradually becoming a key strategic contextual variable in corporate green transformation.
Furthermore, ecological modernization theory provides a more systematic framework for explaining the mechanisms through which public attention influences corporate behavior. This theory emphasizes that environmental governance should not rely solely on government regulation but should be advanced through the synergy of technological innovation and market mechanisms to achieve a “win–win” outcome between economic development and environmental protection [32]. Using this logic, the public is not only the main body of green consumption but also a key driver of environmental institutional innovation. On the one hand, public opinion forms a “social monitoring arena”, pressuring enterprises to shift green technological innovation (GTI) from symbolic investments to strategic choices that generate substantive emissions reductions [33]; on the other hand, public environmental preferences are translated into clear market signals via social media, guiding enterprises to optimize resource allocation for green technologies [34]. Empirical studies have also provided support for this view. For example, Yuan et al. [35] showed that public attention helps improve the quantity and quality of corporate green innovation. This suggests that public attention is increasingly becoming a core pivot variable in the dual-track “market–society” dynamic of ecological modernization, playing an irreplaceable moderating role in technological selection, resource investment, and innovation diffusion.
Based on the above analysis, this study proposed the following hypothesis:
H2. 
Public attention moderates the relationship between green technological innovation and carbon emissions.

2.3. Analysis of Green Technological Innovation’s Spatial Effect

The theory of evolutionary economic geography emphasizes that geographical proximity facilitates the establishment of trust, improves the information exchange efficiency, and promotes the informal transmission of knowledge. As a result, innovation and knowledge diffusion often occur spatially, generating geographically specific spillover effects [36]. As an important branch of technological innovation, green technological innovation can be expected to exhibit similar spatial spillover characteristics. For example, Liu et al. [37], using provincial panel data and spatial econometric models in China, empirically found that green-investment-driven innovation not only enhances the local level of green development but also significantly promotes green development in neighboring regions. In addition, due to the ease of diffusion of carbon emissions between adjacent areas, the coordinated development of carbon emission reductions in neighboring areas will also be subject to the local carbon emission reduction level [38]. At the same time, the competition among local governments for key resources has intensified the administrative segmentation of the factor market, leading to the fragmentation of technological innovation [39]. While promoting local low-carbon green development, this has hindered green technological innovation in neighboring areas; this will have a “Beggar-thy-neighbor” effect on carbon emission reductions in neighboring areas. However, with the rapid development of green technology innovations, emerging technologies continue to emerge, and the speed of technological upgrades is accelerating. At this time, green technology innovation itself has the characteristics of high permeability, quickness, and external economy, with a large diffusion effect on the surrounding areas allowing it to penetrate all fields of economy and society [40]. fully realizing the regional advantages of green technology innovation in reducing carbon emissions will help to link the carbon emission reductions in different regions and form the effect of “Partnering with neighbors”.
Furthermore, based on institutional diffusion theory [41], local governments’ engagement in environmental governance tends to involve policy imitation and “yardstick competition”. When a region takes the lead in launching effective green regulatory tools (such as carbon trading mechanisms) and achieves positive results in green development, neighboring regions often replicate these policy paths due to the incentives regarding performance, risk aversion, or competitive pressure, thereby achieving institutional synergy.
In summary, based on the mechanisms of innovation diffusion and institutional coordination, green technological innovation can produce spatial spillovers. This implies that green innovation advancement in one region may affect carbon emissions in neighboring areas through spatial spillover mechanisms.
Based on this, the following research hypothesis was proposed:
H3. 
Green technology innovation has a significant spatial spillover effect on carbon emissions in neighboring cities, exhibiting a U-shaped change characterized by initial inhibition followed by promotion.

3. Research Design and Data Description

3.1. Variable Selection and Description

3.1.1. Explained Variables

Carbon emissions (CR): This study adopted the sum of the carbon dioxide emissions from the raw coal, gas, natural gas, liquefied petroleum gas, and electricity consumed by each city as the measure of carbon emissions. The specific calculation is shown in Equation (1), where Eijt denotes the amount of the jth type of energy consumed by ith city in tth year, and EFj denotes the carbon emissions factor corresponding to the jth type of energy. For direct energy sources [42], the carbon emissions factor was set according to the standards of the IPCC Guidelines for National Greenhouse Gas Inventories.
Given the significant changes in China’s power generation structure over the past decade, this study did not adopt a fixed electricity emissions factor. Instead, it calculated the carbon emissions based on the national grid emissions intensity for each year. Specifically, for 2015, the emissions factor of 0.6101 kg CO2/kWh, issued by the National Development and Reform Commission, was used [43]. For 2021 and 2022, the emissions factors of 0.5942 kg CO2/kWh and 0.5366 kg CO2/kWh, respectively, as released by the Ministry of Ecology and Environment in 2024, were adopted [44]. For the remaining years, due to the lack of official data, this study followed the methodology proposed by Liao et al. [45]. which involved constructing a dynamic estimation model based on the annual share of coal-fired power generation to more accurately reflect the changes in the power system’s carbon intensity; see Equation (2) for details.
C R i t = j E i j t × E F j
E F g r i d ( t ) = E F c o a l ( t ) α ( t ) + E F n o n c o a l ( 1 α ( t ) )
EFgrid(t) represents the grid emissions factor in year t, and α(t) denotes the proportion of coal-fired power generation in year t. EFcoal(t) represents the emissions factor of coal-fired power generation, with a median value of 1.05 tCO2/MWh, which was adopted from the Provincial Greenhouse Gas Inventory Compilation Guidelines [44]. EFnon-coal(t) refers to the average emissions factor of non-coal power sources (natural gas + renewable energy), for which the IPCC default value of 0.42 tCO2/MWh was used [42]. For renewable and nuclear energy, the emissions factor was set to 0 tCO2/MWh.

3.1.2. Core Explanatory Variables

Green Technological Innovation (GTI): The literature generally adopts the number of green patents granted or the number of green patent applications as an indicator of the green technological innovation level [21,46]. The green patents that are granted undergo a rigorous examination, a process that ensures the technological maturity and legal recognition of the patents. Therefore, this study selected the number of green patents granted (GTI1) to measure the green technological innovation level. Meanwhile, to enhance the robustness of the research findings, this study drew on related research [47] and adopted the number of green patent applications (GTI2) as a proxy variable for robustness testing.

3.1.3. Moderating Variables

Public attention (PA) was represented in this study using the Baidu Search Index as a proxy variable. As the largest search engine in China, with approximately 80% of the market share, the Baidu Search Index reflects users’ keyword search behavior over specific periods and offers strong representativeness, timeliness, and accessibility [48]. The Baidu Index is constructed based on the user search frequency and can dynamically track public interest in specific topics. It is widely used in research scenarios, such as public opinion analyses, risk perception, and information dissemination [49]. The search frequency of specific keywords can, to some extent, reflect public awareness of and attitudes toward particular issues.
Numerous studies in fields such as environmental science, public health, and policy communication have adopted the Baidu Index as an effective tool to measure public attention. For example, Li et al. used the Baidu Index to assess public concern regarding smog pollution [50], and Wang et al. applied it to examine the public-opinion response triggered by the release of environmental protection policies [51]. These studies offer methodological support and demonstrate the feasibility and reliability of using the Baidu Index to reflect public attention.
In constructing the variable, this study selected ten keywords closely related to air pollution and green development, including “carbon emissions”, “smog”, “PM2.5”, “vehicle exhaust”, “industrial emissions”, “energy conservation and emission reduction”, “new energy”, “renewable energy”, and “green products”. These keywords cover pollution sources, mitigation strategies, and clean energy dimensions to comprehensively capture the scope of public environmental concern. To mitigate the influence of fluctuations in individual keyword popularity on the overall index, this study applied the entropy weighting method to the annual Baidu Index data at the city level for each keyword to construct a composite index of public environmental concern. A higher composite index value indicates a higher level of public concern for environmental issues.

3.1.4. Control Variables

Referring to the related literature [8,9,52,53], variables that may influence carbon emissions were controlled to enhance the accuracy and reliability of the regression results. The following control variables were selected for this study: openness to the outside world (OP), expressed as the (amount of foreign investment actually used in the current year in USD 10,000 × exchange rate)/GDP in CNY 10,000; population density (PS), expressed as people/km2; the level of urbanization (UL), expressed as urban resident population/total resident population; government intervention level (GV), expressed as the local fiscal general budget expenditure in CNY 10,000/gross regional product in CNY 10,000; degree of financial development (FD), expressed as the deposit and loan balance of financial institutions at the end of the year/gross regional product in CNY 10,000; level of science and technology (SD), expressed as the science expenditure in million CNY/expenditure within the general budget of local finance in million CNY; human capital stock (HD), measured using the number of students enrolled in regular institutions of higher education per 10,000 people.
In addition, to have a comprehensive understanding of all the variables in the dataset, we conducted descriptive statistical analyses of all the variables, including the control variables (Table 1).

3.2. Data Sources

This study was based on the panel data of 267 prefecture-level cities in China from 2012 to 2022 (see Figure 1 for the specific city distribution). These data were mainly obtained from the China Statistical Yearbook, China Urban Statistical Yearbook and China Industrial Economics. To present each variable more clearly, all the above variables are summarized in Table 2.

3.3. Model Setting

3.3.1. Econometric Model

Focusing on the nonlinear impact of the green technology innovation level on carbon emissions, the baseline econometric model was set as follows (In Equation (3)):
L n C R i t = β 0 + β 1 L n G T I i t 1 + β 2 L n G T I i t 1 2 + β 3 C o n t r o l i t + μ i + γ i + ε i t
where LnCR denotes the carbon emissions and LnGTI denotes the green technological innovation level. To test the nonlinear relationship between the green technological innovation and carbon emissions, the squared term of the city’s green technological innovation level LnGTI2 was further added to the model, and considering that the green technological innovation cycle is relatively long and green technological innovation’s impact on carbon emissions may have a time lag, the lags of LnGTI and LnGTI2 were taken as one period. β is the parameter to be estimated, and Control denotes the set of control variables. μi, γi, and εi refer to the city fixed effect, year fixed effect, and random disturbance term, respectively.
In addition, to enhance the robustness of the model estimation results, this study conducted robustness tests from multiple dimensions. First, to address potential heteroskedasticity and serial correlation in the panel data, the regression employed two-way clustering at the city–year level, which simultaneously controlled for within-group serial correlation and cross-sectional heteroskedasticity. Second, to mitigate the risk of multicollinearity between variables, the green technological innovation variable was mean-centered to reduce the collinearity with its squared term, thereby improving the coefficient estimates’ interpretability.

3.3.2. Moderating Effect Model

Furthermore, to verify public concern’s moderating effect on green technology innovation affecting carbon emissions, referring to the method of Haans et al. [54]. and on the basis of model (3), we added the interaction term between public concern PA and the core explanatory variables LnGTI and LnGTI2 to construct econometric model (4), which also employed two-way clustered robust standard errors:
L n C R i t = β 0 + β 1 L n G T I i t 1 + β 2 L n G T I i t 1 2 + β 3 P A i t 1 + β 4 P A i t 1 × L n G T I i t 1 + β 5 P A i t 1 × L n G T I i t 1 2 + β 6 C o n t r o l i t + μ i + γ i + ε i t

3.3.3. Spatial Econometric Modeling

Finally, to test the spatial spillover effect of green innovation on carbon emissions, the spatial interaction terms of these two variables and the control variables were introduced into model (3) to construct the following model (5):
L n C R i t = β 0 + β 1 W L n C R i t + β 2 L n G T I i t 1 + β 3 L n G T I i t 1 2 + β 4 C o n t r o l i t + β 5 W L n G T I i t 1 + β 6 W L n G T I i t 1 2 + β 7 W C o n t r o l i t + ε i t
Model (5) is a spatial Durbin model, where β1 is the coefficient of the spatial lag term of the explanatory variables, β2–β4 denote the regression coefficients of the explanatory and control variables, β5–β7 are the coefficients of the spatial lag terms of the explanatory variables and the control variables, and ε is the error term. w is the spatial weight matrix, and in this study, considering the geographic features and the economic features at the same time, the spatial nesting matrix was constructed using Equation (6), where dij denotes the spherical distance derived from the latitude and longitude of cities i and j, and the GDPi and GDPj distributions denote the per capita gross regional products of cities i and j.
In the model estimation, to address the potential estimation bias caused by spatial dependence, this study further adopted robust standard error estimation. Moreover, the results report the direct, indirect, and total effects to comprehensively capture the spatial spillover pathways.
w i j = 1 2 1 d i j + 1 2 1 G D P i G D P j , i j 0 , i = j
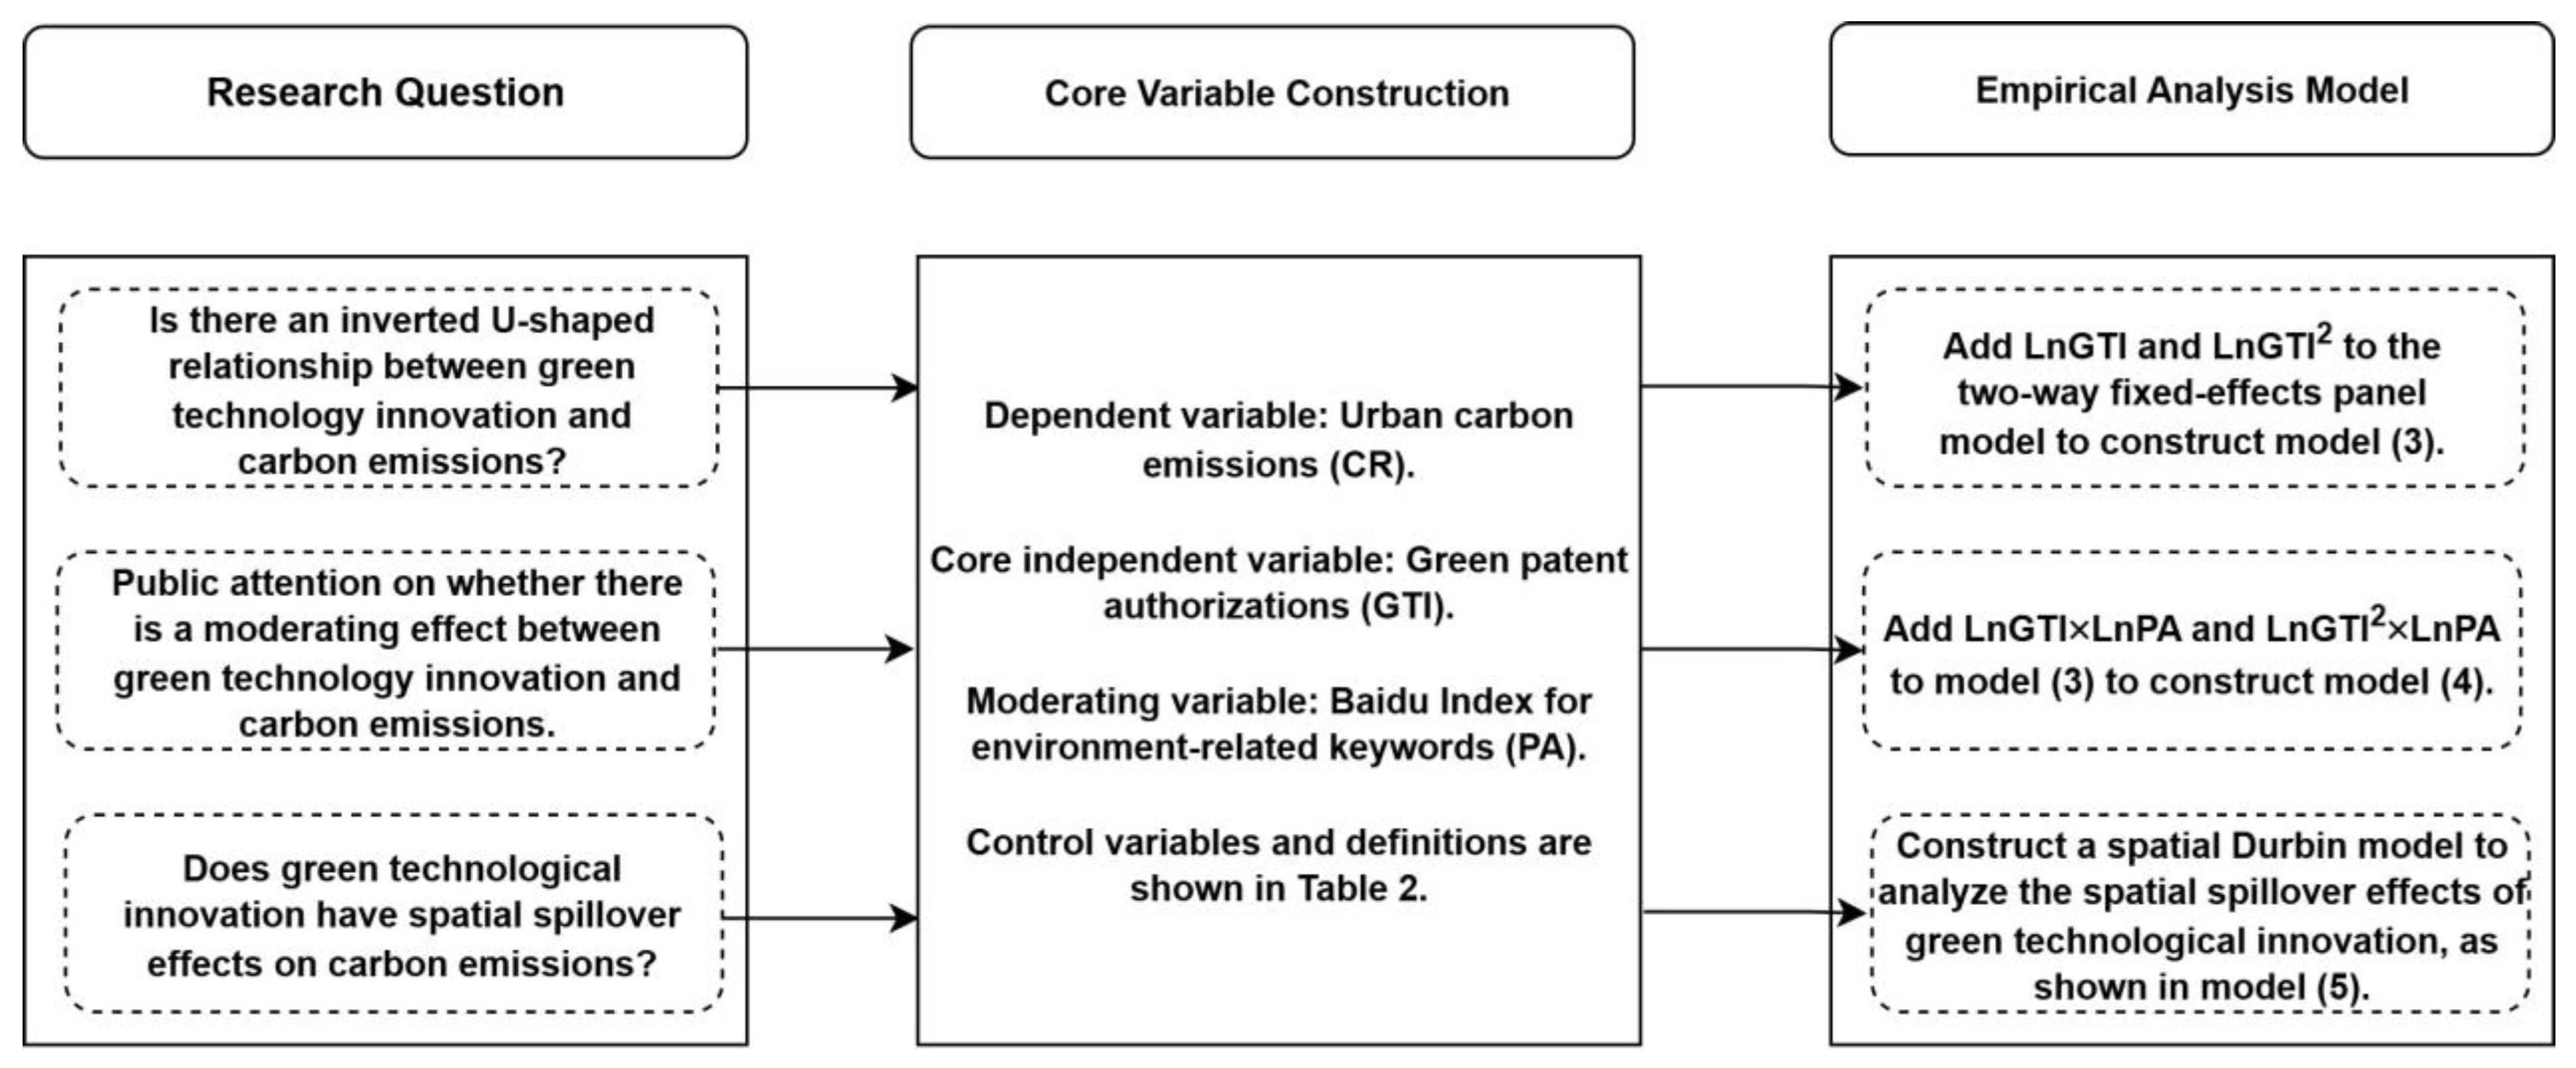
Finally, to more clearly illustrate the research procedures, a research flowchart is presented in Figure 2.

4. Analysis of Empirical Results

4.1. Benchmark Regression

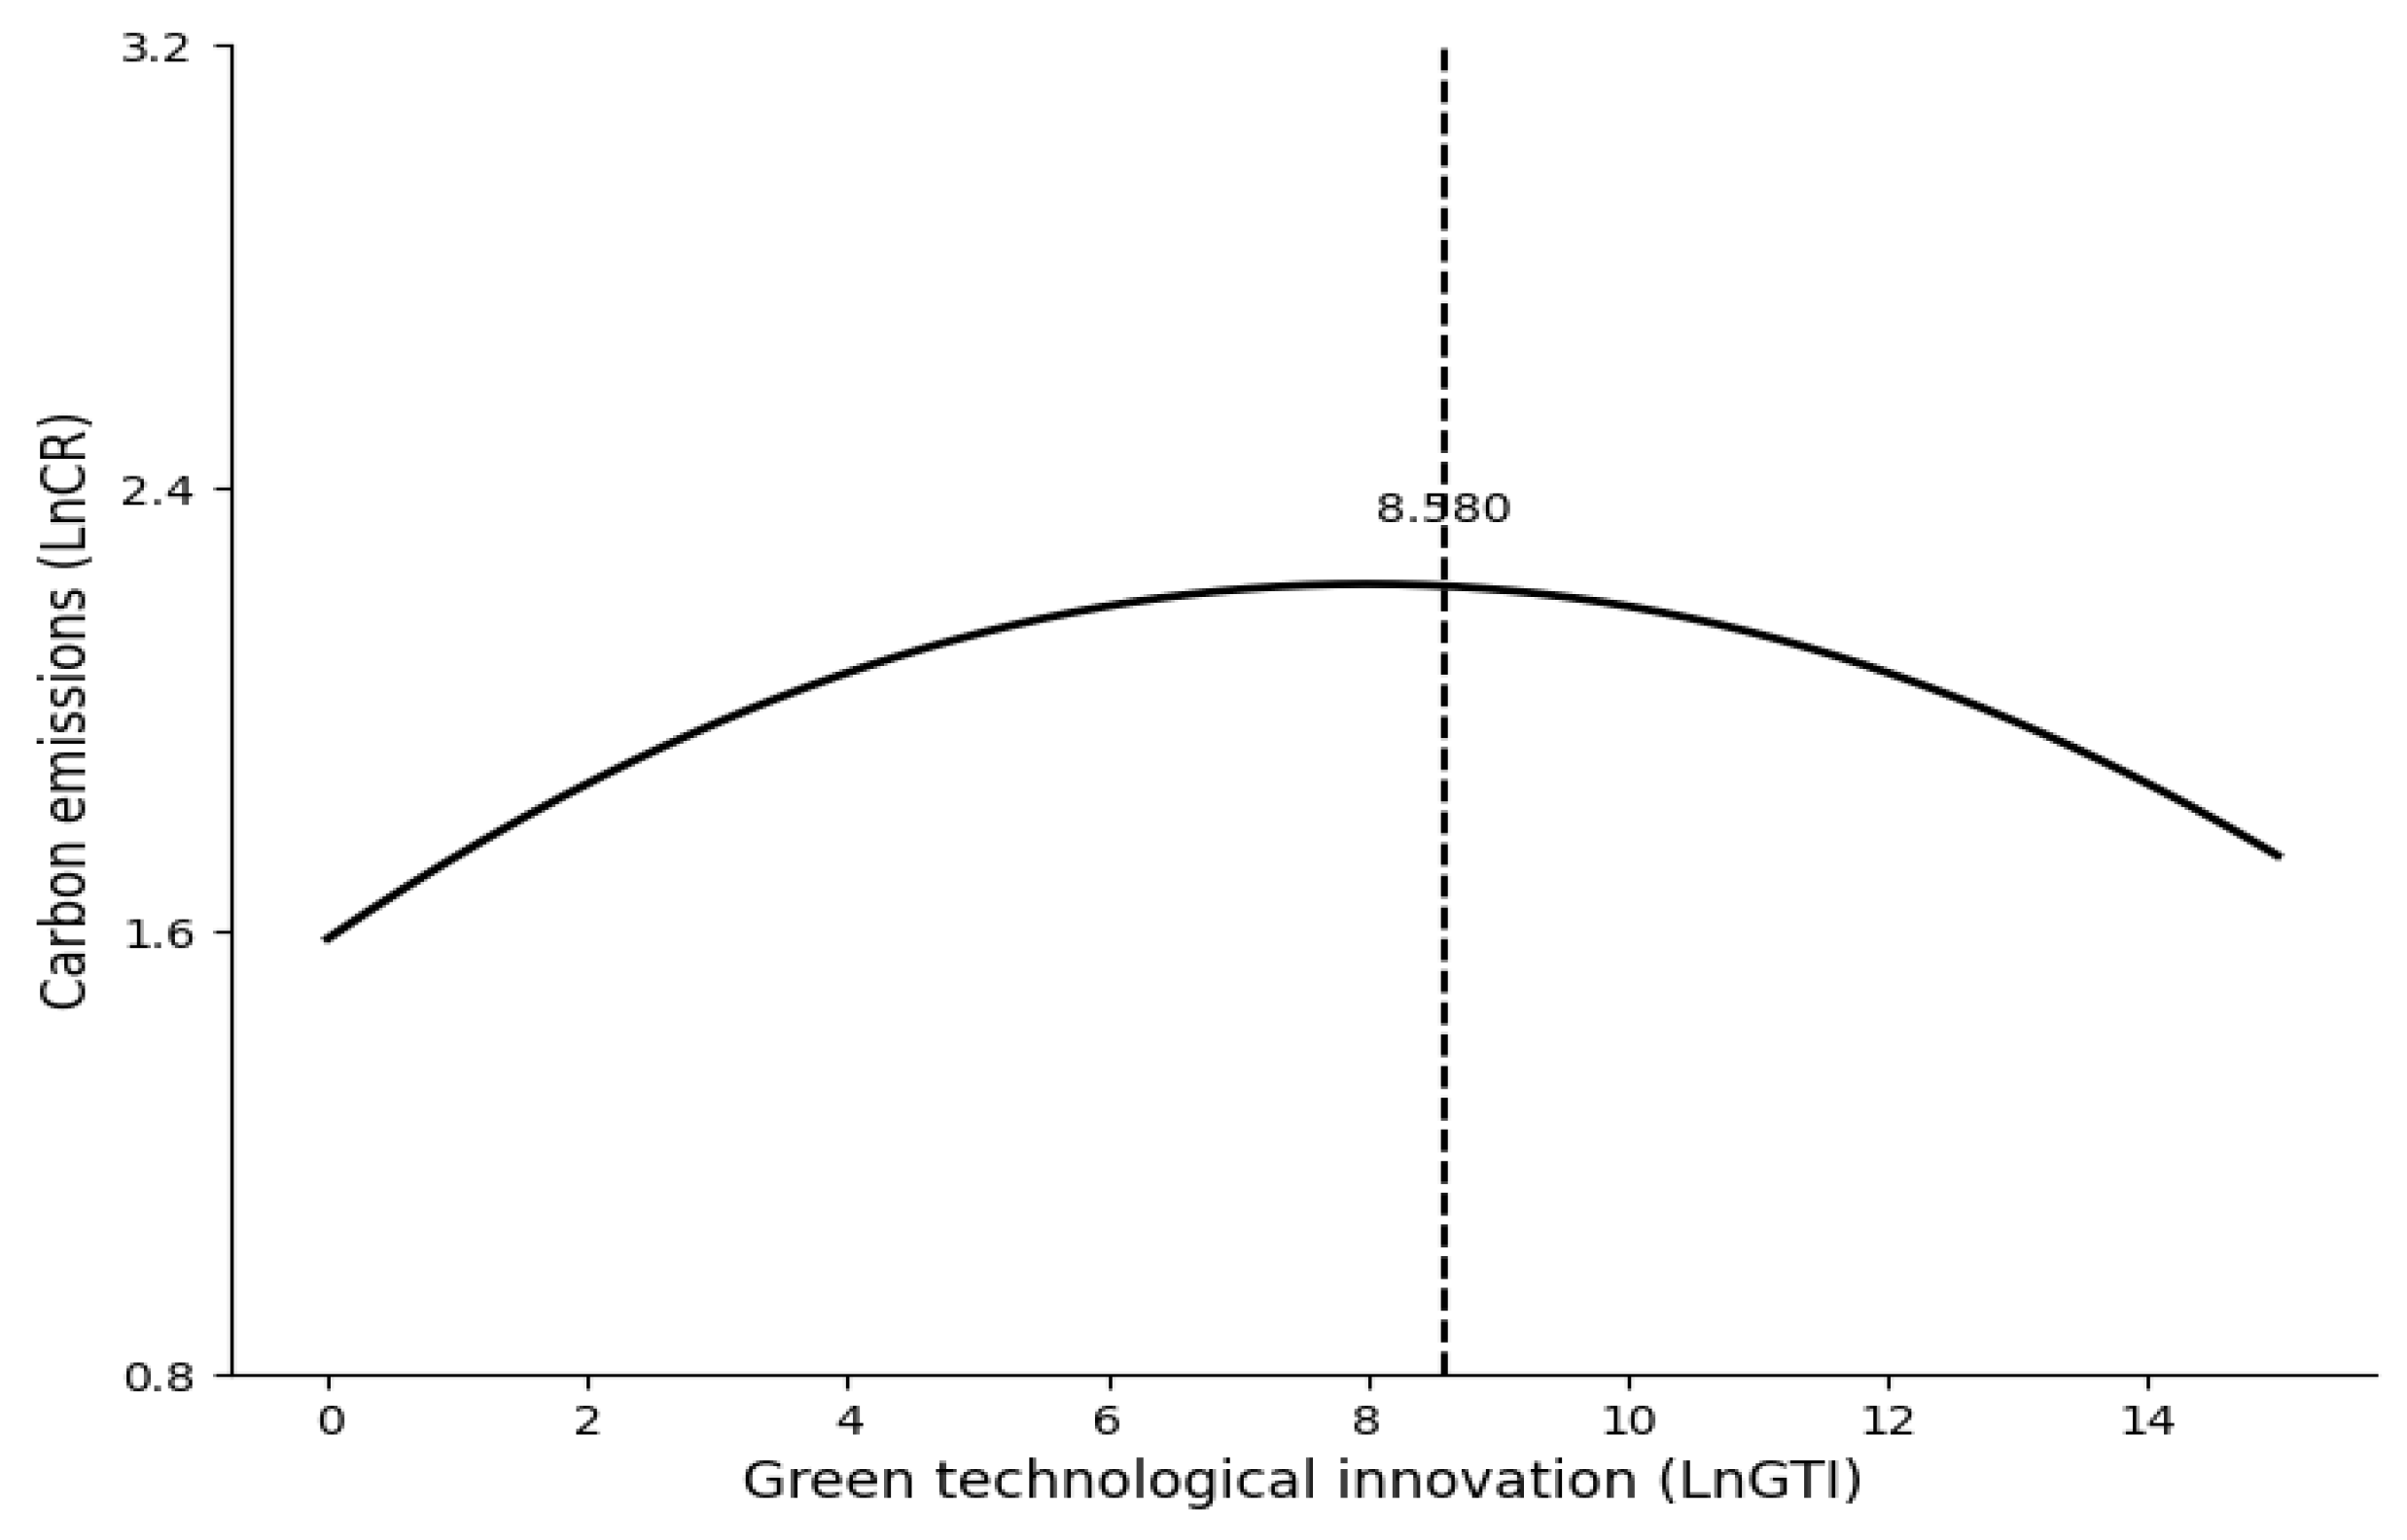
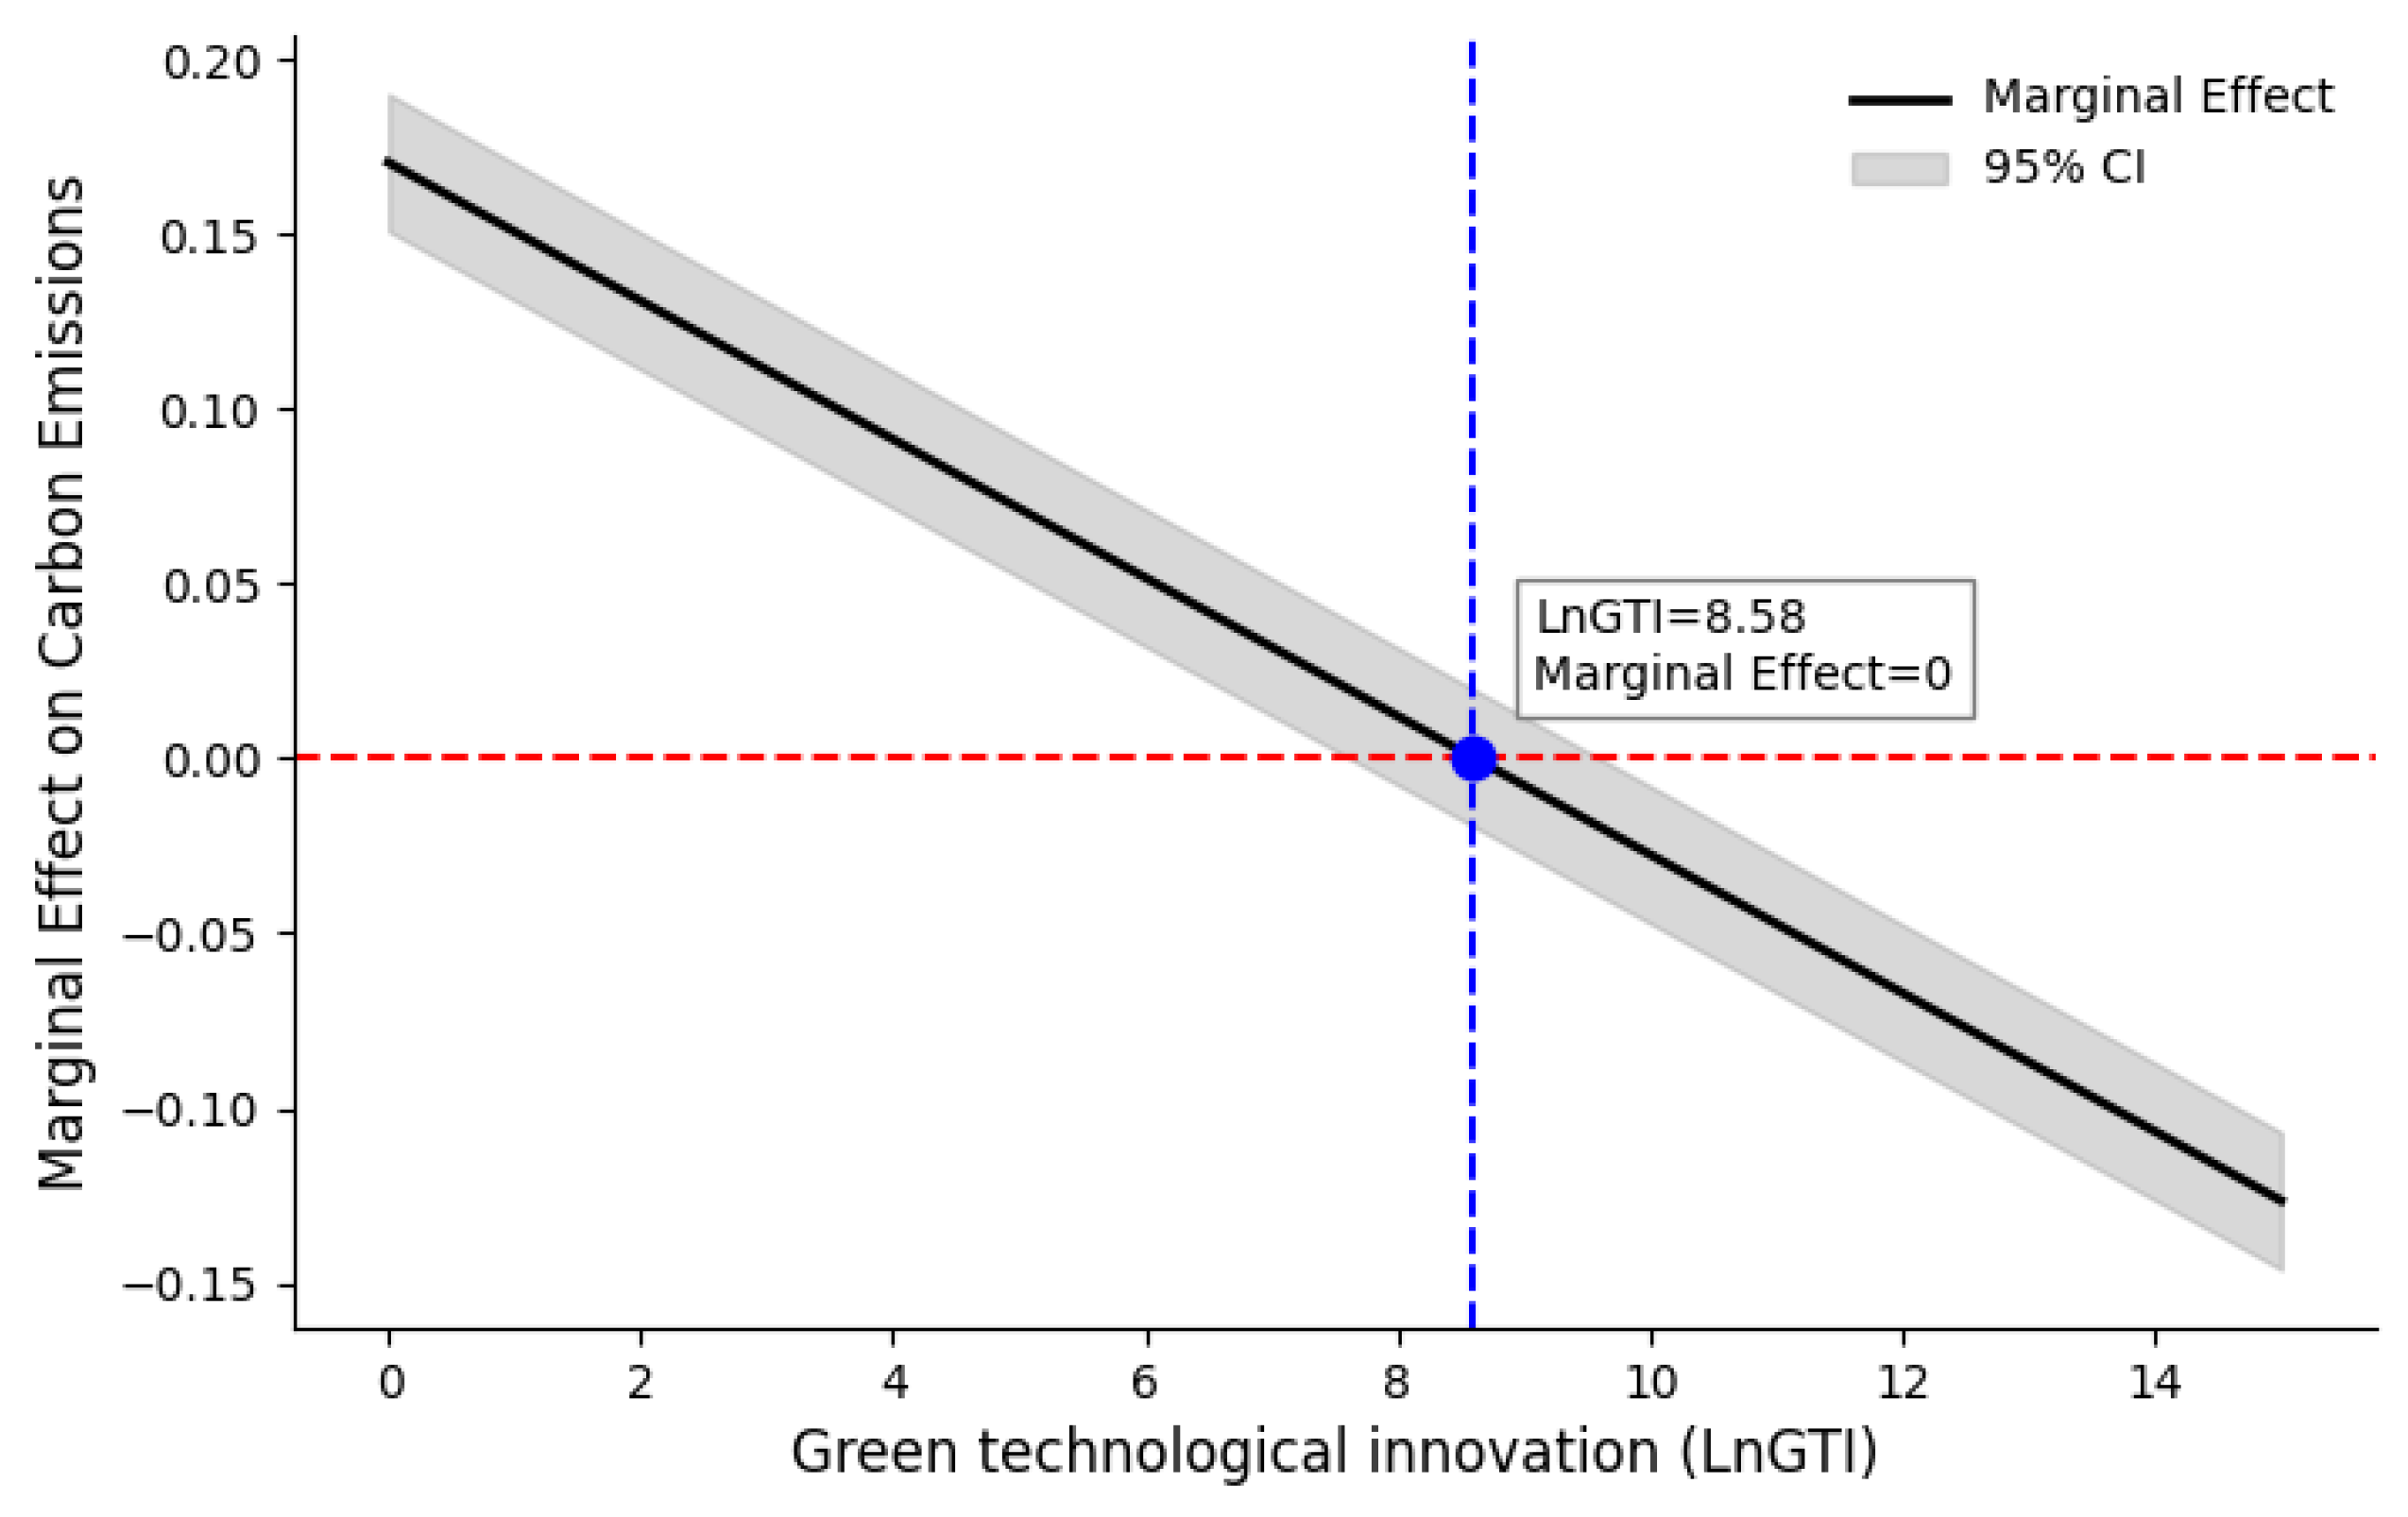
Table 3 reports the regression results of model (2). Column (1) includes only the core explanatory variables, while columns (2) through (8) sequentially introduce the control variables. All models accounted for the fixed effects of and applied two-way clustered robust standard errors at the city and year levels. Throughout the stepwise inclusion of control variables, the sign and statistical significance of the core explanatory variables remained consistent, which provided preliminary evidence of the regression results’ robustness. Column (8) presents the baseline regression. The results show that the coefficient of the linear term of green technological innovation was 0.0099 and that of the squared term was -0.0023, which were both statistically significant at the 1% level. This indicates a significant inverted U-shaped relationship between green technological innovation and urban carbon emissions, which confirmed Hypothesis 1. To present the inverted U-shaped relationship between LnGTI and LnCR more intuitively, this paper plotted the inverted U-shaped curve and the marginal effect graph based on the regression results of column (8), as shown in Figure 3 and Figure 4.
Based on the regression coefficients, the estimated turning point corresponded to approximately 8.58 authorized green patents per 10,000 people. This implies that when a city’s level of green technological innovation was below this threshold, such innovation tended to increase carbon emissions. However, once it exceeded this critical point, green technological innovation began to exhibit emission-reducing effects. Notably, the cities with larger populations typically required a higher level of green innovation to surpass this threshold. For example, in a city with a permanent population of 10 million, the annual number of authorized green patents needed to exceed 8580 for green innovation to generate emission-reduction benefits. This finding suggests that policymakers should take the city size into account when formulating green innovation policies and promote a differentiated, city-specific innovation support system.
Further analysis of the average annual number of authorized green patents from 2012 to 2022 revealed that among the 267 sample cities, only 11 surpassed the estimated threshold, most of which were concentrated in the eastern coastal region. This indicates that most Chinese cities have not yet reached the green innovation level required to produce carbon reduction effects, suggesting ample room for improvement in green innovation capacity.
The existence of a turning point carries important practical and policy implications. First, the findings reveal a significant “scale threshold effect” in the relationship between green innovation and carbon emissions: only when the number of authorized green patents reached a certain scale could green innovation truly translate into emission reductions. This underscores the importance for policymakers not to dismiss the value of green innovation due to a lack of short-term effects, but rather to acknowledge its cumulative and lagged characteristics and promote a stable and sustainable policy orientation. Second, most regions in central and western China were still in the phase where green innovation had yet to accumulate sufficiently, which led to a “carbon-increasing effect”. These regions should increase green R&D investment and improve incentive mechanisms to avoid falling into a low-efficiency cycle in which innovation grows but emission reductions remain limited. Finally, many eastern cities had already surpassed the emission-reduction threshold and accumulated mature practical experience. They should actively build cross-regional collaboration mechanisms for their green technology to facilitate technology diffusion and resource-sharing, thereby promoting coordinated green and low-carbon transitions across the country.
To verify the robustness of the inverted U-shaped relationship, this study employed the u-test command to conduct a formal U-shaped relationship test. The test results are reported in Table 4. The estimated turning point was 2.15, which lay within the confidence interval of [−5.6810, 3.1955]. Additionally, the confidence interval for the slope included zero, and the null hypothesis was rejected at the 1% significance level, indicating that the inverted U-shaped relationship was statistically valid and robust.

4.2. Robustness Test

In this part, the regression results of model (3) are further tested for robustness to verify the reliability of the results.
(1)
Replacement of Explanatory Variables
To test the model’s sensitivity to different green technology innovation indicators, this study used green patent applications LnGT to replace the green patent grants as a measure of green technology innovation and re-ran the regression analysis. Column (1) of Table 5 shows the regression results, which are consistent with the benchmark regression.
(2)
Shrinking the sample time range
The time range of the original regression data was 2012–2022. Considering that 2012–2013 data may have been disturbed by the international financial crisis, the time period was shortened to 2014–2022 and the regression was conducted again. Column (2) of Table 5 shows that the regression results confirm the benchmark results’ robustness.
(3)
Eliminate the influence of outliers
Considering that the outliers in the sample data may have had an impact on the estimation results, this study shrunk the explanatory variables and control variables to between the 1 and 99% quantile points and the 5 and 95% quantile points and re-estimated the parameters. Columns (3) and (4) of Table 5, respectively, show that the above estimation results confirm the benchmark results’ robustness.

4.3. Endogeneity Test

Given that the baseline regression model may suffer from omitted variable bias and reverse causality, leading to endogeneity issues, this study followed the methodology of Wu et al. and selected the number of telephones per 100 people in prefecture-level cities in 1984 as an instrumental variable for the level of green technological innovation [55]. On the one hand, the early diffusion of fixed-line telephones laid a foundation for the development of internet technology and information dissemination, thereby facilitating technological innovation and indicating a correlation with green innovation. On the other hand, as a historical variable, it has no direct influence on current urban carbon emissions, thus satisfying the exogeneity requirement of a valid instrument.
Furthermore, considering the panel data structure, this study constructed an interaction term between the 1984 telephone penetration rate and the number of internet users in the previous year (denoted as LnIV), along with its squared term (LnIV2), to serve as instrumental variables for the linear and quadratic terms of green technological innovation. A two-stage least squares (2SLS) estimation was then performed.
The first-stage regression results (columns (1) and (2) of Table 6) show that the two instrumental variables had significant effects on the endogenous variables, indicating a strong correlation. Moreover, the F-statistic of the first-stage regression was 24.55, well above the critical value of 10, suggesting that the issue of weak instruments was unlikely. As the number of instruments equals the number of endogenous variables, overidentification testing was not applicable. However, given the theoretical justification and empirical strength of the instruments, they were deemed valid.
The second-stage regression results indicate that the coefficient of the linear term of green technological innovation was significantly positive, while the quadratic term was significantly negative, which confirmed the expected inverted U-shaped relationship. This suggests that the effect of green technological innovation on carbon emissions remained robust after addressing the potential endogeneity.
To further test the exogeneity of the instrumental variables, this paper conducted a robustness analysis using the System Generalized Method of Moments (System GMM). The regression results are shown in column (4) of Table 6. AR(1) and AR(2) are tests for autocorrelation, where the null hypothesis of AR(1) is that there is no first-order autocorrelation, and the null hypothesis of AR(2) is that there is no second-order autocorrelation. The results show that the AR(1) test rejects the null hypothesis, while the AR(2) test does not reject the null hypothesis, indicating that the model does not have a second-order autocorrelation problem. The Sargan test’s null hypothesis is that all instrumental variables are exogenous and valid. Its p-value is greater than 0.1, so the null hypothesis cannot be rejected, suggesting that the instrumental variable setting is reasonable. In conclusion, the System GMM model passed the autocorrelation and over-identification tests, and the estimation results are robust and valid.

4.4. Regulatory Effect Test

Theoretical analysis shows that the degree of public concern reflects the sensitivity and attention of society to ecological and environmental issues and can significantly regulate the effect of corporate green technological innovation on carbon emissions by strengthening the external supervision and market pressure. To verify this regulation mechanism, this study constructed model (4) for regression. The regression results are shown in column (1) of Table 7, where the coefficient of the interaction term between public concern and the square term of green technology innovation was -0.0001, and it was significant at the 1% level, indicating that an increase in public concern strengthened the promotion effect before the inflection point of the curve and the inhibition effect after the inflection point, which steepened the inverted “U” curve of the impact of green technology innovation on carbon emissions.
By calculating the position of the inverted U-shaped inflection point after the introduction of the public concern interaction term, we found that β1 × β5 − β2 × β4 > 0, and the inflection point was shifted to the right compared with the baseline model. This suggests that public awareness significantly delayed the “suppression effect” emergence in the process of green technology innovation affecting carbon emissions. This may have been because, in the sample period, most of the cities had a large proportion of secondary industries, and the industrial structure characteristics and the increase in public environmental concern formed a two-way pressure transmission. On the one hand, the agglomeration of high-carbon industries amplifies the public’s demand for pollution control; on the other hand, the sunk cost barriers of asset-heavy industries force enterprises to show a significant path-dependent tendency in their transformation decisions, where they tend to pursue short-term emission-reduction effects and more often choose to improve the energy efficiency of existing technologies rather than carry out a higher level of green technological innovation. This choice leads to a delay in the tipping point of green technology innovation, which is manifested in the rightward shift in the inflection point of green technology innovation.
To verify this conclusion, this study conducted a regression using samples with a relatively high proportion of the tertiary industry during the sample period. The regression results are presented in column (2) of Table 7. As shown in the table, the coefficient of the interaction term between public attention and the squared term of green technological innovation is -0.0001, which is significant at the 1% level. Moreover, β1 × β5 − β2 × β4 < 0, indicating that at a higher level of industrial structure, public attention shifts the inverted U-shaped relationship between green technological innovation and carbon emissions to the left, thereby reducing the threshold of the turning point.
To verify the robustness of the conclusions, this study further employs media attention (LnMA) obtained from the China Economic News Database to replace the Baidu Search Index as a measure of public attention. The database covers reports from nearly one thousand authoritative print and online media outlets in mainland China, offering broad coverage and high credibility.
The specific data collection procedure is as follows: First, the China Economic News Database is used as the data source, and a set of core keywords closely related to environmental pollution and governance is selected, including “carbon emissions”, “smog”, “PM2.5”, “vehicle exhaust”, “industrial emissions”, “energy conservation and emission reduction”, “new energy”, “renewable energy”, and “green products”. The criteria for identifying environment-related reports are as follows: (i) if the headline or body text contains any of the above keywords and the context is related to environmental pollution, energy conservation and emission reduction, clean energy, or green products, the report is classified as environment-related; (ii) if the keywords appear but the context is unrelated to environmental issues (e.g., “new energy fund issuance” referring to financial investment rather than environmental topics), the report is excluded; (iii) duplicate republications of the same report by different media outlets are counted only once to avoid double-counting. Based on these criteria, the annual number of environment-related reports for each city is calculated, and the natural logarithm (LnMA) is taken as a proxy for public (media) attention.
Regression results are reported in Columns (3) and (4) of Table 7: Column (3) presents the results for the full sample, while Column (4) reports the results for cities with a relatively high share of the tertiary industry. The findings indicate that replacing the measure with LnMA yields results consistent with the baseline regression—under higher levels of public (media) attention, regardless of whether technology is in the carbon-increasing or carbon-reducing stage, the impact of green technological innovation on carbon emissions is amplified, and the inverted U-shaped relationship becomes more pronounced. Furthermore, in the full sample, higher attention significantly delays the occurrence of the carbon “inhibition effect”, whereas in cities with a higher share of the tertiary industry, the emission-reduction turning point occurs earlier, which may be attributed to differences in industrial structure and green transition capacity, thereby confirming the robustness of the earlier conclusions.

4.5. Heterogeneity Test

Existing studies suggest that a city’s stage of development and resource endowment may influence the foundation for implementing green technological innovation and its actual effectiveness at reducing carbon emissions [56,57]. Therefore, this study further investigated whether green technological innovation’s impact on carbon emissions varied significantly across different types of cities based on city-level heterogeneity.
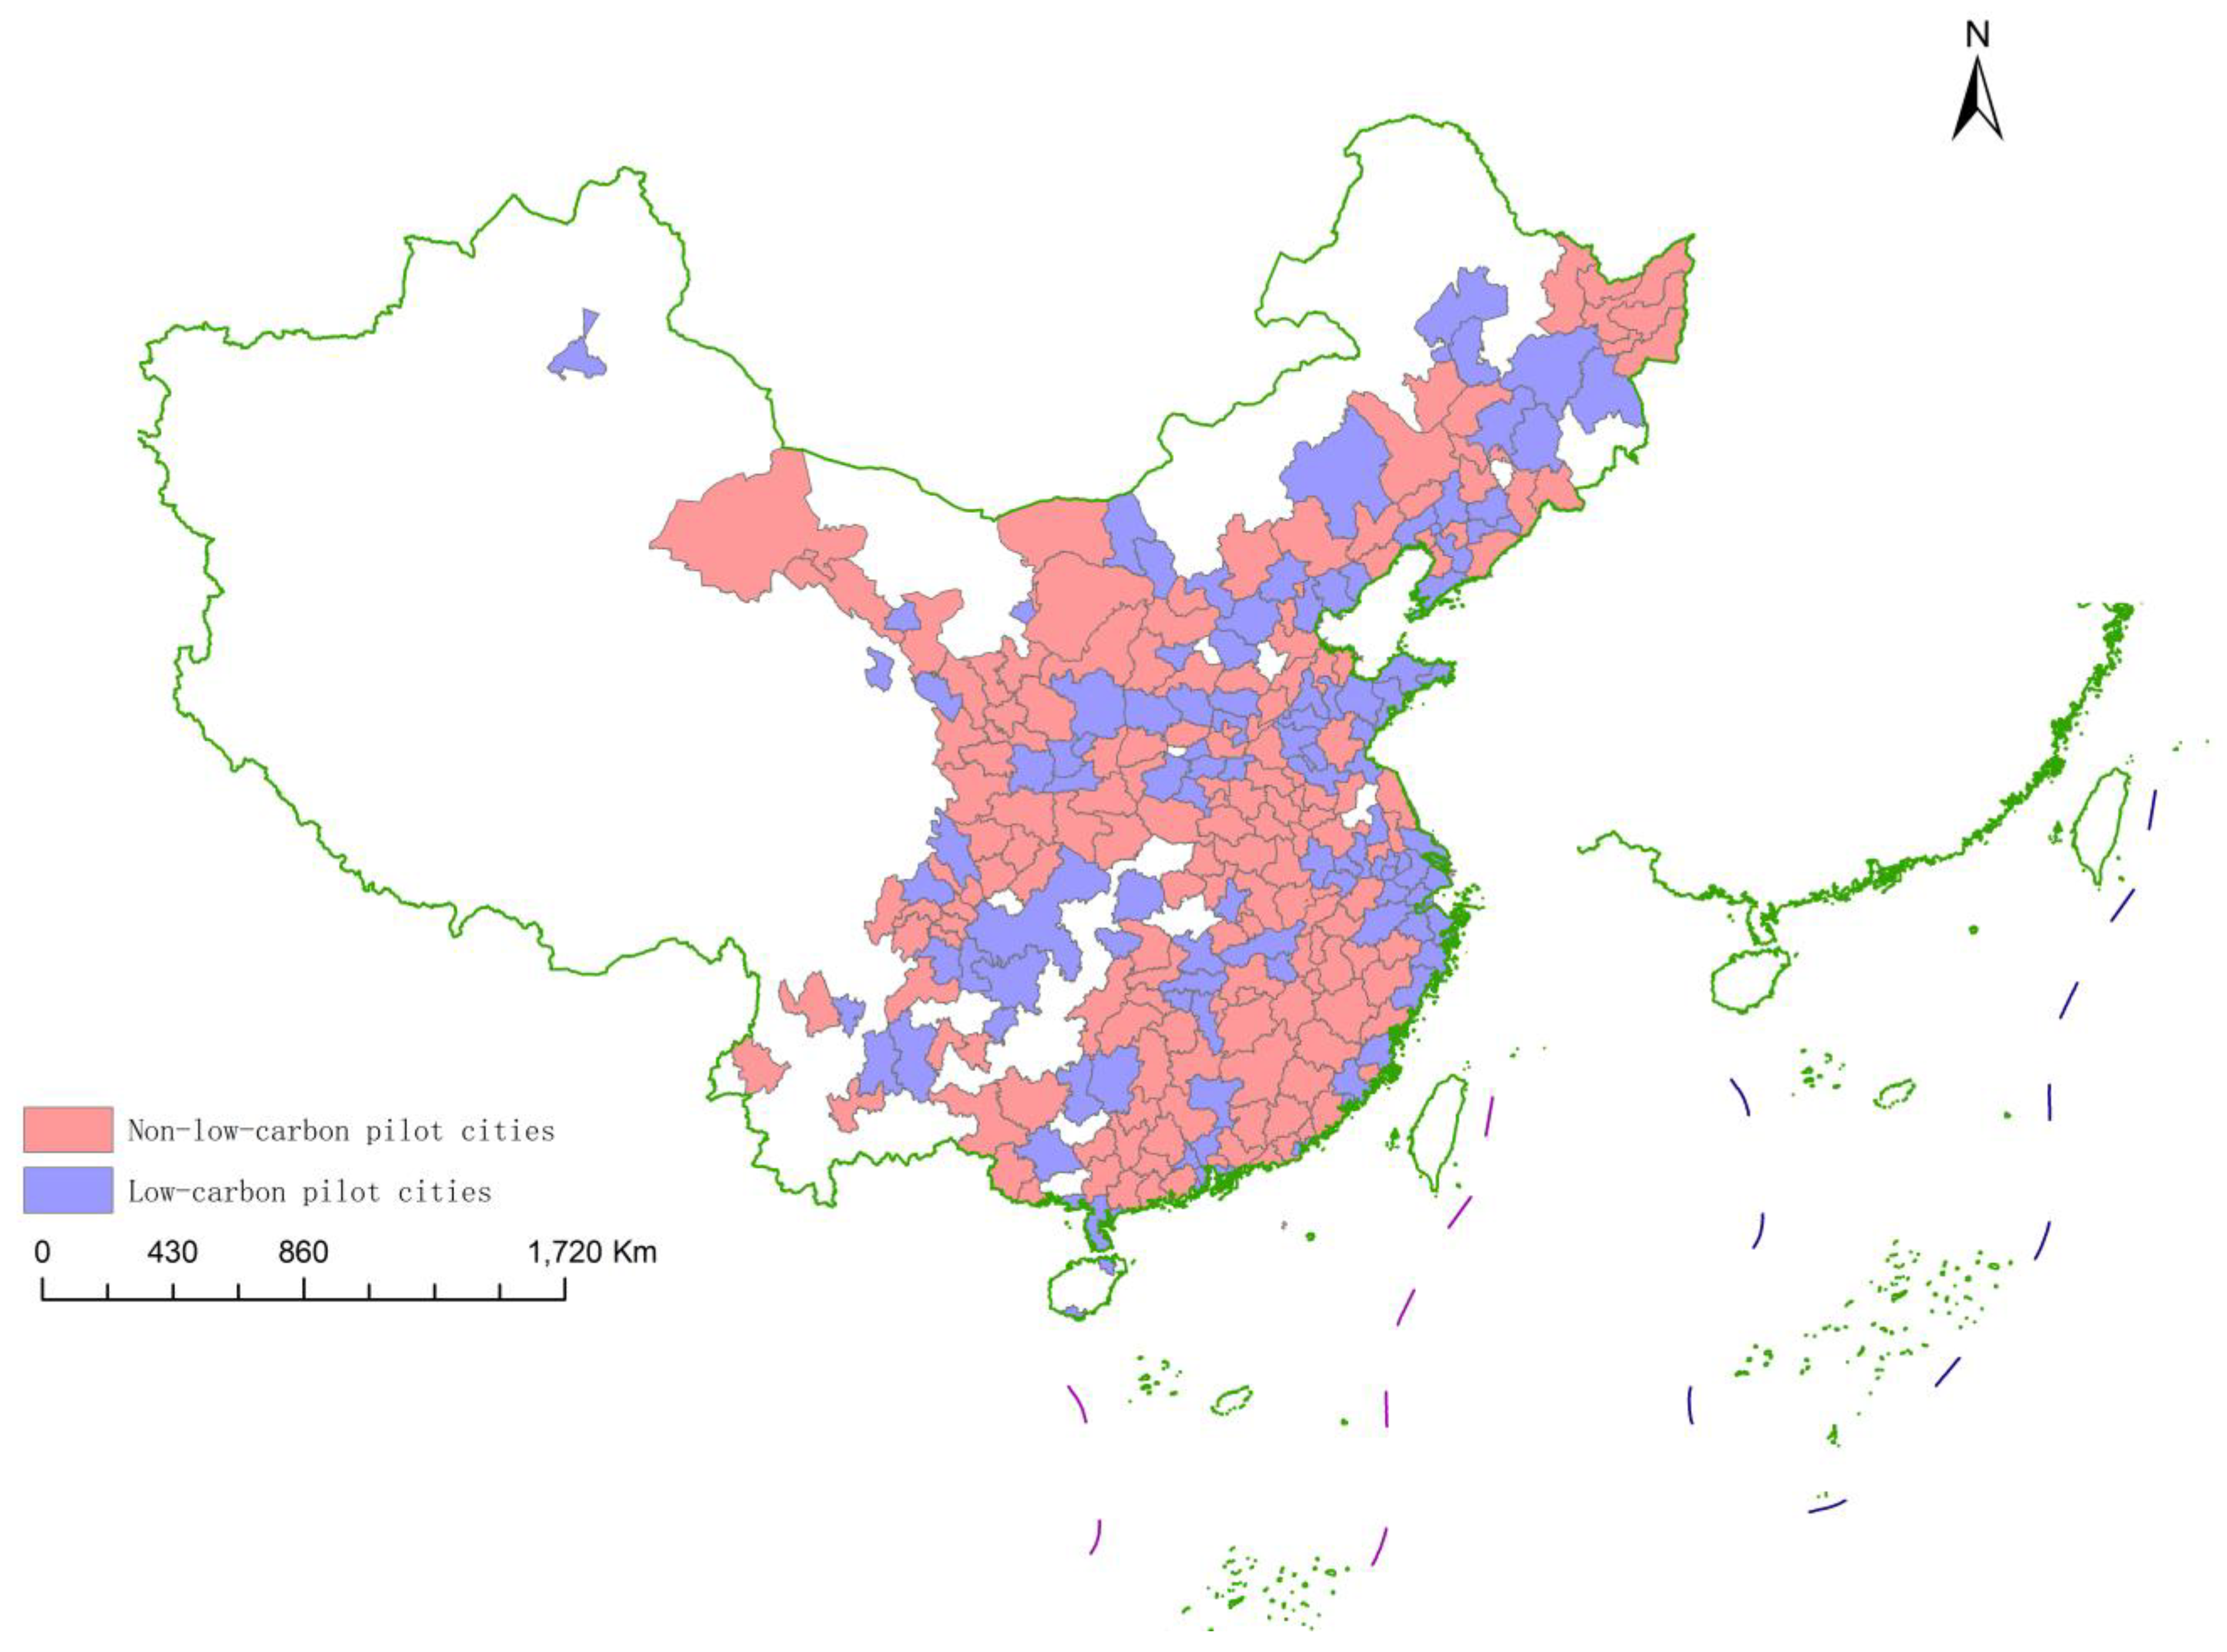
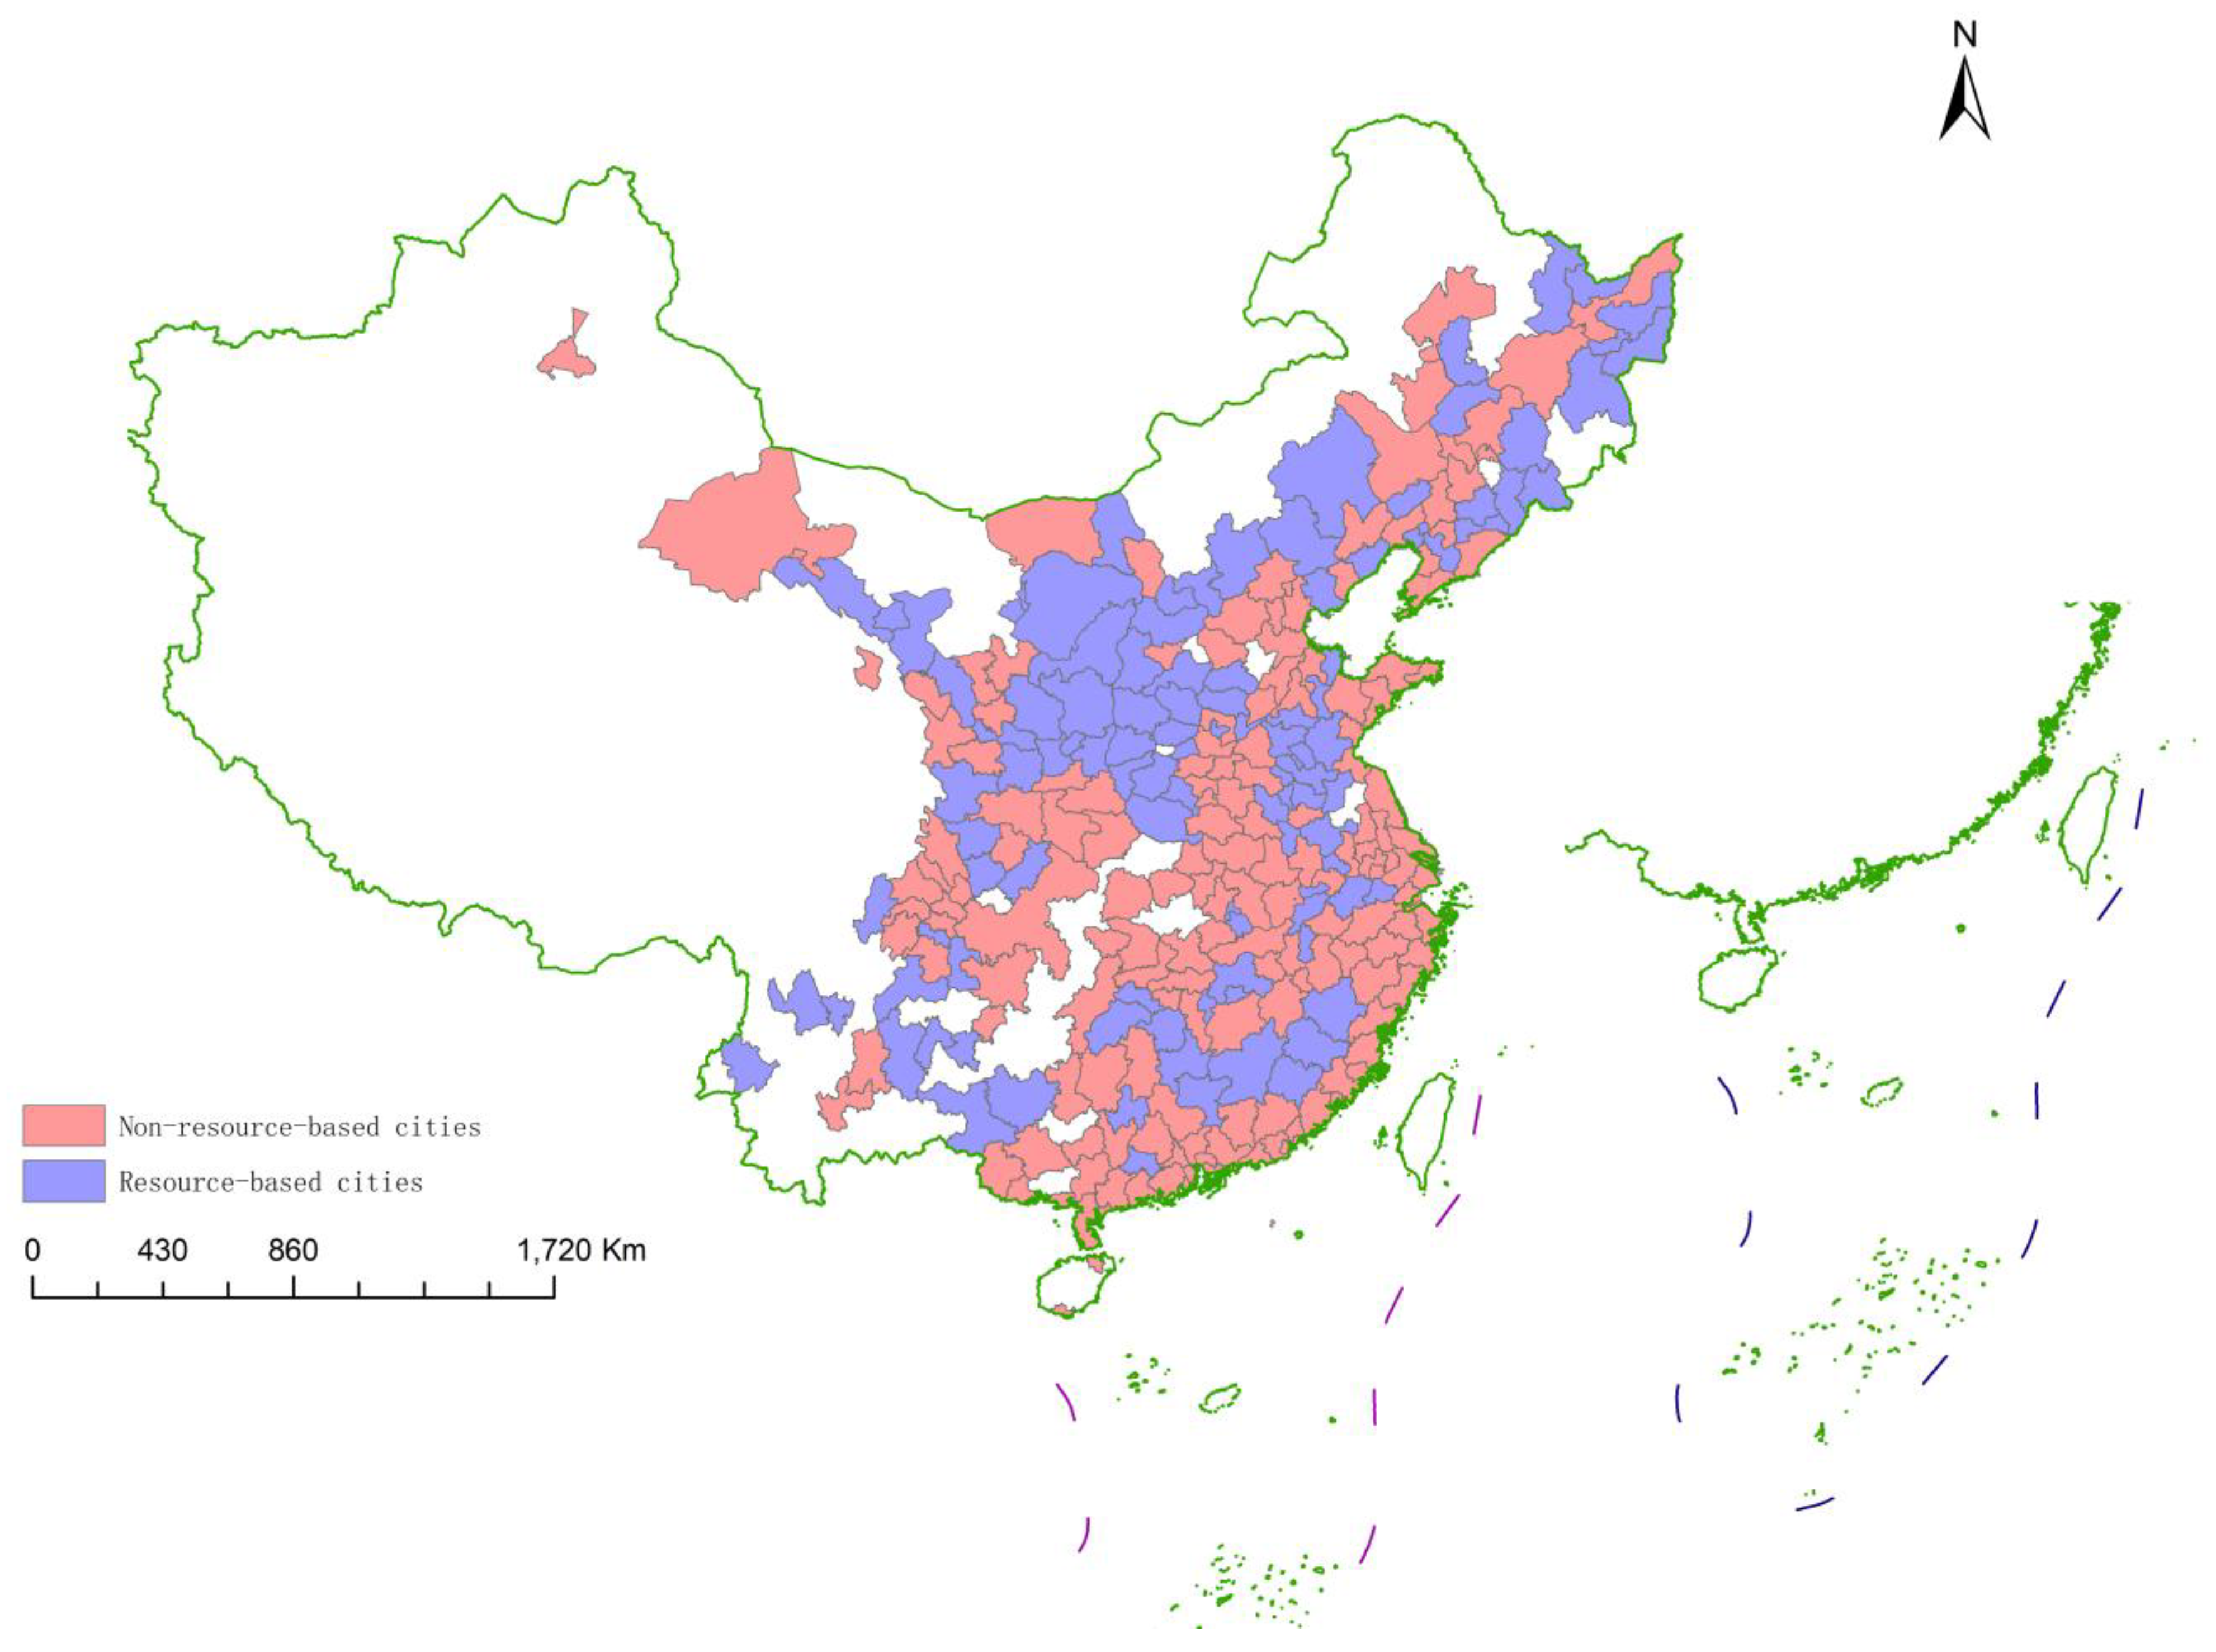
Specifically, we constructed subgroup regression models based on two classification criteria—whether a city was designated as a low-carbon pilot city and whether it was classified as a resource-based city—to identify differences in the emission reduction effects of green technological innovation across the city types (the geographic distributions of these cities are shown in Figure 5 and Figure 6). Low-carbon pilot cities were identified according to the three batches of pilot city lists published by the National Development and Reform Commission (NDRC) since 2010 [58]. Resource-based cities were defined based on official classification in the “National Plan for the Sustainable Development of Resource-Based Cities (2013–2020)” [59].
To enhance the interpretability of the subgroup analysis, we also report descriptive statistics for the low-carbon pilot vs. non-pilot cities and the resource-based vs. non-resource-based cities (Table 8, Table 9, Table 10 and Table 11).
The regression results are presented in Table 12. Columns (1) and (2) report the estimation results for low-carbon pilot and non-pilot cities, respectively, while columns (3) and (4) correspond to resource- and non-resource-based cities. A comparison of the results revealed that green technological innovation exhibited a significant inverted U-shaped relationship with carbon emissions in the low-carbon pilot and non-resource-based cities, whereas the effects were not statistically significant in the non-pilot and resource-based cities.
The insignificant carbon reduction effect of green technological innovation in non-low-carbon pilot cities stemmed from a dual dilemma of lacking institutional incentives and broken market signals. According to the theory of institutional complementarity [60], low-carbon pilot cities have established policy portfolios—such as carbon pricing and technology subsidies—that effectively reduce the transaction costs of green technological innovation and enhance the stability of corporate expectations. In contrast, non-pilot cities lack such institutional coordination mechanisms, making it difficult for enterprises to form stable expectations when facing policy uncertainty. This policy ambiguity significantly dampens their willingness to make long-term technological investments. Meanwhile, the insufficient demand-side momentum in non-pilot cities leads to green technologies persistently failing to achieve a price premium above cost thresholds. As such, innovation struggles to achieve economies of scale and falls into a low-level equilibrium trap, limiting the diffusion of green technologies and making emission reduction effects difficult to realize.
The lack of a significant emission reduction effect from green technological innovation in resource-based cities was primarily due to the interaction of reinforced path dependence and the carbon lock-in effect. First, the “asset specificity trap” locks physical and human capital in high-carbon production functions, severely restricting these cities’ ability to transition toward low-carbon technologies. Given that their economic structures are deeply reliant on high-carbon industries, the introduction of green technologies faces strong resistance, and the technical and financial support needed for the transition is insufficient, thus hindering the realization of emission reduction effects.
These heterogeneous results reveal the institutional and structural foundations that shape the effectiveness of green technological innovation across different city types. For non-low-carbon pilot cities, policies should focus on building institutional incentives and risk-mitigation mechanisms—such as establishing regional green technology funds, enhancing the transmission of market-based carbon pricing signals, and improving support for green finance services—to stimulate corporate green innovation efforts. For resource-based cities, policy priorities should shift toward capacity-building to break the path dependence. This includes measures such as retraining workers to transition from high-carbon to green industries, promoting pilot projects in green sectors, and supporting local governments in establishing transition funds, which are all aimed at enhancing cities’ absorptive capacity for green technologies. In addition, at the national level, it is advisable to promote a differentiated and locally tailored green technology policy system. Institutional design should consider city heterogeneity and differences in development stages to improve the overall efficiency and coordination of green transitions.

4.6. Further Analyses

To explore the spatial spillover effects of green technological innovation on carbon emissions, this study employed a spatial Durbin model (SDM) and constructed a geo-economic nested weight matrix to capture the spatial interactions between regions. The results of the Moran’s I test indicate a significant positive spatial correlation in green technological innovation, which confirmed the necessity and appropriateness of using a spatial econometric model.
In Table 13, columns (1) through (3) report the direct, indirect, and total effects of green technological innovation on carbon emissions. The results show that the quadratic term of green technological innovation was significantly negative regarding the direct and indirect effects at the 1% significance level. This indicates that the inverted U nonlinear relationship was only valid within local cities, but was present in adjacent cities, which confirmed the spatial spillover effect of green technological innovation in mitigating carbon emissions.
From a theoretical perspective, this spatial spillover mechanism can be explained by the lifecycle characteristics of green technologies and the cross-regional knowledge–institution interaction process. Based on evolutionary economic geography, green technology—as a form of knowledge-intensive innovation—relies heavily on informal knowledge transfer, industrial chain coordination, and technology imitation, which are enabled by geographical proximity. During the early (introduction) stage of green technology, due to insufficient technological maturity and potential rebound effects in energy efficiency, its diffusion often leads to a production capacity expansion, resulting in synchronized increases in carbon emissions in the local and neighboring imitating regions.
As green technologies enter maturity, their emission-reduction potential is gradually realized. Local cities may promote deep energy structure transitions to achieve the “absolute decoupling” of economic growth and carbon emissions. Meanwhile, under the influence of institutional diffusion mechanisms, neighboring cities—motivated by policy performance incentives, competitive pressures, or risk avoidance—tend to imitate the green governance tools and development paths of leading cities. This reduces the institutional friction and improves the technology adoption efficiency. Combined with supply chain collaboration and regulatory competition–coordination mechanisms within spatial networks, this process further facilitates the cross-regional diffusion, integration, and joint application of green technologies, ultimately forming a multi-regional coordinated carbon reduction framework.

5. Discussion

The impact of green technology innovation on carbon emissions remains a subject of ongoing debate, with no clear consensus yet established in the existing literature. To address this gap, this study focuses on the nonlinear relationship between the two and reveals significant spatial spillover effects of green technology innovation in carbon emission governance. Our empirical findings provide valuable insights and contribute to the theoretical framework of the Environmental Kuznets Curve (EKC) hypothesis induced by green technology innovation.
Traditional indicators, such as carbon emissions, possess certain advantages. Primarily due to data availability, carbon emissions are commonly used to assess the level of low-carbon transformation across different regions and industries [61]. In this study, the total amount of CO2 emissions is adopted as the indicator for carbon emissions, which exhibits strong inclusivity. The constructed indicator system, as well as encompassing the economic and environmental systems, also includes the social system, with a focus on evaluating the currenting status [62]. From a comprehensive factors perspective, this method enhances the analytical depth of low-carbon transformation research and provides a more holistic reference for assessing low-carbon policies.
This study provides additional empirical evidence for the relationship between green technology innovation and carbon emission reductions by revealing an inverted U-shaped nonlinear relationship between green technology innovation and carbon emissions [63]. When the level of green technology innovation is below a certain threshold, it actively contributes to carbon emission reductions by optimizing resource allocation, supporting the view that green technology innovation can reduce CO2 emissions [64]. However, once green technology innovation surpasses this threshold, its externalities begin to dominate, such as large-scale digital infrastructure construction, which in turn increases carbon emissions. This finding aligns with research indicating that excessive pursuit of green technology innovation adversely affects carbon reductions in specific sectors, like industrial agglomeration [65]. Overall, this study enriches the new domain of empirical research on green technology innovation within the framework of synergistic development for pollution reductions and carbon mitigation [66].
This study reveals the heterogeneous impact of green technology innovation on carbon emissions and highlights the differences in the inverted U-shaped relationship among various cities. Our findings contribute to a deeper understanding of the green technology innovation–carbon emissions linkage. The positive impact of green technology innovation on carbon reduction is more pronounced in non-resource-based cities, whereas its inhibitory effect is not significant in resource-based cities. The insignificant carbon reduction effect of green technology innovation in resource-based cities is attributed to the interaction between the path-dependence reinforcement mechanism and the carbon lock-in effect [67]. Similarly, the positive externalities of green technology innovation are more pronounced in low-carbon pilot cities, whereas the emission reduction effects of green technology innovation in non-pilot cities are not significant, primarily due to the dual challenges of a lack of institutional incentives and market signal disruptions. This aligns with the perspectives of Shen et al. [68], who reveal that there is a distinct spatial structural imbalance in the green transformation process of Chinese cities. The environmental effects of green technology innovation are constrained by a combination of factors, including regional development stages, industrial structure, and policy implementation capabilities.
This study reveals that public environmental concern plays a significant moderating role in the process of green technology innovation affecting carbon emissions. Specifically, the interaction term between public concern and the squared term of green innovation is negative, significantly intensifying the steepness of the inverted “U” curve of green technology innovation, indicating that social supervision mechanisms can effectively amplify the marginal effects of green technology innovation. This finding transcends traditional research perspectives and aligns with the views of Du et al. [69], who discovered that the moderating effect of public environmental concern on the relationship between green technology innovation and carbon emissions is both dynamic and nonlinear. Moreover, this study emphasizes that green technology innovation not only impacts local carbon emissions but also exerts significant spatial spillover effects on neighboring cities, exhibiting a U-shaped pattern of initial suppression followed by promotion. This indicates that the environmental effects of green technologies are not confined to individual regions but rather have trans-regional systemic implications. These findings align with China’s increasing trend toward regional integration [70].

6. Conclusions and Recommendations

6.1. Main Conclusions

Using the panel data of 267 prefecture-level cities in China from 2012 to 2022, this study investigates the impact of green technology innovation on carbon emissions, with special emphasis on the moderating role of public environmental concern. Through the moderating effect and spatial spillover effect model, this study identifies the moderating effect and spillover characteristics, and further explores the heterogeneity of the effects. The study found that, first, there is an inverted U-shaped nonlinear relationship between green technology innovation and carbon emissions: the corresponding carbon emission reduction inflection point appears at 8.58 green patents per 10,000 people. Second, the analysis of the adjustment mechanism shows that an increase in public attention causes the inverted U-shaped curve between green innovation and carbon emissions to steepen. Thirdly, in low-carbon pilot cities and non-resource-based cities, the positive externality of green technology innovation has a more significant effect on carbon emission reductions. Fourthly, this study confirms that green technology innovation has a significant spatial spillover effect on carbon emission reductions in neighboring cities, and shows a U-shaped change from inhibition to promotion.

6.2. Policy Implications

Based on the above conclusions, this paper proposes the following recommendations.
Firstly, considering the significant inverted U-shaped relationship between green technology innovation and carbon emissions, the corresponding carbon reduction turning point occurs at 8.58 green patents per 10,000 people. Cities at different stages of development should fully account for the accumulation and lag associated with green technologies, actively implement targeted policies, and formulate green transition pathways suited to their circumstances, avoiding a “one-size-fits-all” approach. For instance, to promote green technology innovation, the government can provide greater support through soft loans and tax incentives. On the one hand, cities with lower levels of green technology innovation should focus on economic development while avoiding an excessive reliance on investment. They should reasonably raise environmental and technological thresholds for various types of capital to prevent falling into the environmental Kuznets curve trap or the comparative advantage trap. On the other hand, they should draw on the governance experiences of central cities to minimize resource misallocation and avoid excessive market intervention by fiscal policies. Additionally, it is essential to further promote industry–university–research collaboration and enhance their attractiveness to talent through policies such as talent subsidies and rental subsidies to create the necessary conditions for the long-term settlement of talents and enterprises related to green technology innovation, as well as providing support and resources.
Secondly, considering the heterogeneous impact of green technology innovation on carbon emission reductions, it is essential to break the path-dependence on “regional fragmentation” in green technology innovation. In low-carbon pilot cities and non-resource-based cities with a high degree of green technology innovation, maintaining industrial diversity, promoting continuous innovation, and enhancing resource utilization efficiency are imperative. In contrast, non-low-carbon pilot cities and resource-based cities should accelerate investment in technological resources and establish a more incentivizing and differentiated policy system. Additionally, when formulating and implementing relevant policies at the national level, it is essential to consider the policy orientation of green technology innovation’s impact on carbon emissions, with a focus on enhancing regional comprehensive development capabilities and prioritizing policy guidance.
Finally, this study demonstrates that public environmental concern can amplify the marginal effects of green innovation. Therefore, regions should leverage their unique advantages and effectively utilize public participation in environmental governance. Establishing more robust information-disclosure mechanisms and public-engagement channels is essential to enhance the transparency and accountability of green technology innovation, thereby accelerating its transformation into tangible carbon reduction outcomes. Furthermore, it is important to consider that green technology innovation not only impacts local carbon emissions but also exerts significant spatial spillover effects on neighboring cities. Digital platforms should be leveraged to enhance inter-city communication and cooperation, establish higher-level green technology collaboration mechanisms, break down technical barriers caused by administrative boundaries, and strengthen cross-city cooperative governance.

6.3. Research Limitations and Outlook

Similarly to all empirical studies, this study has several limitations. Firstly, future research should incorporate machine learning algorithms to address bias issues through orthogonalization, thereby enhancing the accuracy of the results and effectively overcoming the shortcomings of traditional inference studies. This will help resolve potential endogeneity problems arising from the neglect of the dynamic nature of dependent variables. Secondly, this study uses the Baidu Index to measure public environmental concern. However, the Baidu Index, constrained by algorithmic filtering, cannot fully distinguish between genuine traffic and artificially inflated traffic, and only accounts for data from the Baidu search platform. It does not reflect the situation on other search platforms, and thus possesses certain limitations. For instance, newly developed indicators, which analyze and compile the frequency of environmental protection-related terms using Python-3.13, can serve as useful moderating or control variables in future model estimations. Thirdly, this study focuses on the number of green patents granted, some of which may be deemed invalid due to improper maintenance. However, the existing data does not reflect such dynamic adjustments, leading to insufficient comparability of the data. In the future, the adoption of a scientific quantitative model could be considered, using green technology innovation as a comprehensive indicator to measure the innovation levels of cities globally and to conduct cross-country comparisons between China and other nations, aiming to further validate the conclusions of this study. Lastly, this study primarily utilizes city-level data to verify this proposition. In the future, more detailed enterprise data and emission data from county-level cities could be utilized to provide stronger evidence for this hypothesis, and this evidence could be validated across most developed and developing countries worldwide.

Author Contributions

Conceptualization, J.Z.; Software, J.Z.; Validation, J.Z., F.L. and Y.Q.; Formal analysis, F.L. and Y.Q.; Investigation, J.Z.; Data curation, J.Z., F.L. and Y.Q.; Writing—original draft, J.Z.; Writing—review & editing, J.Z., F.L. and Y.Q.; Visualization, J.Z., F.L. and Y.Q.; Supervision, W.Y.; Project administration, W.Y.; Funding acquisition, W.Y. All authors have read and agreed to the published version of the manuscript.

Funding

This research received no external funding.

Institutional Review Board Statement

Not applicable.

Informed Consent Statement

Not applicable.

Data Availability Statement

The original contributions presented in the study are included in the article; Further inquiries can be directed to the corresponding author.

Conflicts of Interest

There are no conflicts of interest in the submission of this manuscript, and all authors have approved the manuscript for publication.

References

  1. Lu, H.; Zhang, Y.; Jiang, J.; Cao, G. Do market-based environmental regulations always promote enterprise green innovation commercialization. J. Environ. Manag. 2025, 375, 124183. [Google Scholar] [CrossRef]
  2. Tiwari, S.; Sharif, A. Disruptive solutions for carbon neutrality and sustainable development: Evidence from CS-ARDL approach. Sustain. Dev. 2025, 33, 5374–5389. [Google Scholar] [CrossRef]
  3. Braungardt, S.; der Wieden, M.B.; Kranzl, L. EU emissions trading in the buildings sector—An ex-ante assessment. Clim. Policy 2025, 25, 208–222. [Google Scholar] [CrossRef]
  4. United Nations Environment Programme (UNEP). Emissions Gap Report 2023: Broken Record—Temperatures Hit New Highs, Yet World Fails to Cut Emissions (Again); UNEP: Nairobi, Kenya, 2023. [Google Scholar]
  5. Lin, B.; Ma, R. How does digital finance influence green technology innovation in China? Evidence from the financing constraints perspective. J. Environ. Manag. 2022, 320, 115833. [Google Scholar] [CrossRef] [PubMed]
  6. United Nations. Net Zero Coalition. Available online: https://www.un.org/en/climatechange/net-zero-coalition (accessed on 9 July 2025).
  7. Squires, D.; Vestergaard, N. Rethinking the commons problem: Technical change, knowledge spillovers, and social learning. J. Environ. Econ. Manag. 2018, 91, 1–25. [Google Scholar] [CrossRef]
  8. Li, H.; Qian, Z.; Wang, S.; Wang, J.; Wang, Q. Do green concerns promote corporate green innovation? Evidence from Chinese stock exchange interactive platforms. Manag. Decis. Econ. 2023, 44, 1786–1801. [Google Scholar] [CrossRef]
  9. Gao, J.; Hua, G.; AbidAli, R.; Huo, B.; Mahamane, F.; Li, Z. The impact of green low-carbon finance on smog reduction and carbon mitigation: Evidence from a spatial panel simultaneous equations model. Int. J. Urban Sci. 2024, 1–34. [Google Scholar] [CrossRef]
  10. Zhou, B.; Ding, H. How public attention drives corporate environmental protection: Effects and channels. Technol. Forecast. Soc. Chang. 2023, 191, 122486. [Google Scholar] [CrossRef]
  11. Mao, Y.; Lin, Y. Do more hands make work easier? Public supervision and corporate green innovation. Int. Rev. Econ. Financ. 2024, 91, 1064–1083. [Google Scholar] [CrossRef]
  12. State Council of China, National Development and Reform Commission (NDRC). Action Plan for Carbon Dioxide Peaking Before 2030; State Council: Beijing, China, 2021. [Google Scholar]
  13. Central Committee of the Communist Party of China, State Council of China. Working Guidance for Carbon Dioxide Peaking and Carbon Neutrality in Full and Faithful Implementation of the New Development Philosophy; State Council: Beijing, China, 2021. [Google Scholar]
  14. Ministry of Ecology and Environment (MEE); National Development and Reform Commission (NDRC); Ministry of Industry and Information Technology (MIIT); Ministry of Housing and Urban-Rural Development (MOHURD); Ministry of Transport (MOT); Ministry of Agriculture and Rural Affairs (MARA); National Energy Administration (NEA). Implementation Plan for Synergizing Pollution Reduction and Carbon Reduction; Ministry of Ecology and Environment (MEE): Beijing, China, 2023. [Google Scholar]
  15. Chu, Z.; Yang, T.; Zhang, Z. Assessing the role of public, media, and government attention on air pollution governance in China. Sustain. Cities Soc. 2024, 113, 105681. [Google Scholar] [CrossRef]
  16. Khalid, Z.; Zhao, L.; Elahi, E.; Chang, X. The impact of green management on green innovation in sustainable technology: Moderating roles of executive environmental awareness, regulations, and ownership. Environ. Dev. Sustain. 2024, 1–27. [Google Scholar] [CrossRef]
  17. Ahlvik, L.; van den Bijgaart, I. Screening green innovation through carbon pricing. J. Environ. Econ. Manag. 2024, 124, 102932. [Google Scholar] [CrossRef]
  18. Geels, F.W. From sectoral systems of innovation to socio-technical systems: Insights about dynamics and change from sociology and institutional theory. Res. Policy 2004, 33, 897–920. [Google Scholar] [CrossRef]
  19. Song, A.; Rasool, Z.; Nazar, R.; Anser, M.K. Towards a greener future: How green technology innovation and energy efficiency are transforming sustainability. Energy 2024, 290, 129891. [Google Scholar] [CrossRef]
  20. Zhao, Z.; Zhao, Y.; Shi, X.; Zheng, L.; Fan, S.; Zuo, S. Green innovation and carbon emission performance: The role of digital economy. Energy Policy 2024, 195, 114344. [Google Scholar] [CrossRef]
  21. Guo, Y.; Li, X.; Li, S. Green Technology Innovation and Carbon Emission Performance of the Middle Reaches of the Yangtze River Urban Agglomeration: Mechanism and Spatio-Temporal Evolution. Energies 2024, 17, 5274. [Google Scholar] [CrossRef]
  22. Cao, Q.; Hong, Q.; Zhu, T.; Yu, W. Influence of green technology innovation and green finance on China’s carbon neutral performance: Do synergistic effects exist? Appl. Econ. 2024, 1–14. [Google Scholar] [CrossRef]
  23. Kafeel, K.; Zhou, J.; Phetkhammai, M.; Lu, H.; Sher, K. Green innovation and environmental quality in OECD countries: The mediating role of renewable energy and carbon taxes. Environ. Sci. Pollut. Res. 2024, 31, 2214–2227. [Google Scholar] [CrossRef]
  24. Wang, Z.; Sami, F.; Khan, S.; Alamri, A.M.; Zaidan, A.M. Green innovation and low carbon emission in OECD economies: Sustainable energy technology role in carbon neutrality target. Sustain. Energy Technol. Assess. 2023, 59, 103401. [Google Scholar] [CrossRef]
  25. Freeman, R.E. Strategic Management: A Stakeholder Approach; Pitman: Boston, MA, USA, 1984. [Google Scholar]
  26. Mitchell, R.K.; Agle, B.R.; Wood, D.J. Toward a theory of stakeholder identification and salience: Defining the principle of who and what really counts. Acad. Manag. Rev. 1997, 22, 853–886. [Google Scholar] [CrossRef]
  27. Etter, M.; Ravasi, D.; Colleoni, E. Social media and the formation of organizational reputation. Acad. Manag. Rev. 2019, 44, 28–52. [Google Scholar] [CrossRef]
  28. Dryzek, J.S. The Politics of the Earth: Environmental Discourses, 3rd ed.; Oxford University Press: Oxford, UK, 2013. [Google Scholar]
  29. Castells, M. Communication Power; Oxford University Press: Oxford, UK, 2009. [Google Scholar]
  30. Jagodnik, K.M.; Dekel, S.; Bartal, A. Persistence of collective memory of corporate bankruptcy events discussed on X (Twitter) is influenced by pre-bankruptcy public attention. Sci. Rep. 2024, 14, 6552. [Google Scholar] [CrossRef]
  31. Laplume, A.O.; Sonpar, K.; Litz, R.A. Stakeholder theory: Reviewing a theory that moves us. J. Bus. Ethics 2008, 83, 213–228. [Google Scholar] [CrossRef]
  32. Spaargaren, G.; Mol, A.P.J. Sociology, environment, and modernity: Ecological modernization as a theory of social change. Soc. Nat. Resour. 1992, 5, 323–344. [Google Scholar] [CrossRef]
  33. Etzion, D. Research on organizations and the natural environment, 1992–present: A review. J. Manag. 2007, 33, 637–664. [Google Scholar] [CrossRef]
  34. Bansal, P.; Roth, K. Why companies go green: A model of ecological responsiveness. Acad. Manag. J. 2000, 43, 717–736. [Google Scholar] [CrossRef]
  35. Yuan, G.; Liu, X.; Wang, Y. Public environmental concern and green innovation in firms: Evidence from Chinese listed companies. J. Clean. Prod. 2023, 421, 139789. [Google Scholar] [CrossRef]
  36. Lazzeretti, L.; Capone, F. How proximity matters in innovation networks dynamics along the cluster evolution: A study of the high technology applied to cultural goods. J. Bus. Res. 2016, 69, 5855–5865. [Google Scholar] [CrossRef]
  37. Liu, J.; Wang, Y.; Zhu, Q. An empirical analysis of the impact of green investment on China’s green development level: Based on mediating and spatial spillover effects. Adv. Econ. Manag. Politi-Sci. 2024, 73, 83–99. [Google Scholar] [CrossRef]
  38. Zhang, X.; Xu, F. Environmental regulation and spatial spillover effect of green technology innovation: An empirical study using the Spatial Durbin Model. Sustainability 2023, 15, 14133. [Google Scholar] [CrossRef]
  39. Fang, G.; Gao, Z.; Wang, L.; Tian, L. How does green innovation drive urban carbon emission efficiency?—Evidence from the Yangtze River Economic Belt. J. Clean. Prod. 2022, 375, 134196. [Google Scholar] [CrossRef]
  40. Lu, Y.; Xia, Z. Digital inclusive finance, green technological innovation, and carbon emissions from a spatial perspective. Sci. Rep. 2024, 14, 8454. [Google Scholar] [CrossRef]
  41. Shipan, C.R.; Volden, C. The mechanisms of policy diffusion. Am. J. Politi-Sci. 2008, 52, 840–857. [Google Scholar] [CrossRef]
  42. Intergovernmental Panel on Climate Change (IPCC). 2006 IPCC Guidelines for National Greenhouse Gas Inventories. Volume 2: Energy; Institute for Global Environmental Strategies (IGES): Hayama, Japan, 2006. [Google Scholar]
  43. National Development and Reform Commission (NDRC). Notice on the Average Emission Factor of the Regional Power Grid Baseline in 2015; NDRC: Beijing, China, 2017. [Google Scholar]
  44. Ministry of Ecology and Environment (MEE). Notice on the Carbon Emission Factor of China’s Power Grid in 2021 and 2022; MEE: Beijing, China, 2024. [Google Scholar]
  45. Liao, W.; Wang, Y.; Zhang, M. Temporal and spatial variations of carbon intensity from electricity generation in China: Decomposition and scenario analysis. J. Clean. Prod. 2022, 363, 132511. [Google Scholar]
  46. Wen, Y.; Zheng, L.; Gu, Y.; Yang, X. Impacts of green technology innovation on carbon emissions: A spatial-based perspective. Technol. Anal. Strat. Manag. 2024, 1–13. [Google Scholar] [CrossRef]
  47. Zhao, Q.; Fan, L.; Chen, H.; Yang, Y.; Wang, Z. Green innovation and carbon emission reduction: Empirical insights from spatial durbin and dynamic threshold models. Int. Rev. Financ. Anal. 2025, 101, 103997. [Google Scholar] [CrossRef]
  48. Wang, L.; Zhou, X.; Lu, M.; Cui, Z. Impacts of haze weather on tourist arrivals and destination preference: Analysis based on Baidu Index of 73 scenic spots in Beijing, China. J. Clean. Prod. 2020, 273, 122887. [Google Scholar] [CrossRef]
  49. Li, L.; Zhang, J.; Bai, Y.; Yang, R. Public environmental concern and enterprise environmental protection investment: From the perspective of enterprise life cycle. Environ. Dev. Sustain. 2024, 26, 15031–15065. [Google Scholar] [CrossRef]
  50. Li, C.; Ma, X.; Fu, T.; Guan, S. Does public concern over haze pollution matter? Evidence from Beijing–Tianjin–Hebei region, China. Sci. Total Environ. 2021, 755, 142397. [Google Scholar] [CrossRef]
  51. Wang, L.; Liu, B.; He, Y.; Dong, Z.; Wang, S. Have public environmental appeals inspired green total factor productivity? empirical evidence from Baidu Environmental Search Index. Environ. Sci. Pollut. Res. 2023, 30, 30237–30252. [Google Scholar] [CrossRef]
  52. Wang, J.; Xia, W. Public attention and investment efficiency: Incentive effect or deterrent effect? Analysis on heterogeneous bilateral stochastic frontier model. Technol. Forecast. Soc. Chang. 2022, 185, 122043. [Google Scholar] [CrossRef]
  53. Liu, B.; Cao, X.; Zhao, S.; Xu, Y. Prediction and lag analysis of public concern about air pollution based on gray relation analysis and bidirectional long short-term memory. Air Qual. Atmos. Health 2023, 16, 1037–1049. [Google Scholar] [CrossRef]
  54. Haans, R.F.J.; He, Z.L. Thinking about U: Theorizing and testing U- and inverted U-shaped relationships in strategy research. Strat. Manag. J. 2016, 37, 1177–1195. [Google Scholar] [CrossRef]
  55. Wu, K.; Geng, Y.-R.; Guo, T. The impact of green technological innovation in urban agglomerations on carbon emissions: The moderating effect of human capital. J. Nat. Resour. 2024, 39, 2121–2139. [Google Scholar] [CrossRef]
  56. Pang, G.; Li, L.; Guo, D. Does the Integration of the Digital Economy and the Real Economy Enhance Urban Green Emission Reduction Efficiency? Evidence from China. Sustain. Cities Soc. 2025, 122, 106269. [Google Scholar] [CrossRef]
  57. Xu, Z.; Xu, W.; Xin, D. Digital–Real Economy Integration and Urban Low-Carbon Development in China. Econ. Anal. Policy 2025, 86, 606–621. [Google Scholar] [CrossRef]
  58. National Development and Reform Commission (NDRC). Pilot Work Program for Low-Carbon Provinces and Low-Carbon Cities (Batch I, II, III); NDRC: Beijing, China, 2017. [Google Scholar]
  59. State Council of the People’s Republic of China. Sustainable Development Plan for Resource-Based Cities (2013–2020); State Council: Beijing, China, 2013. [Google Scholar]
  60. Nie, C.; Lee, C.-C. Synergy of Pollution Control and Carbon Reduction in China: Spatial–Temporal Characteristics, Regional Differences, and Convergence. Environ. Impact Assess. Rev. 2023, 101, 107110. [Google Scholar] [CrossRef]
  61. Yue, L.; Han, L. The Digital Empowerment Promotes Synergistic Efficiency in Regional Pollution Reduction and Carbon Emission Reduction—Analysis of the Moderating Effects of Market Structure and Government Behavior. J. Clean. Prod. 2025, 493, 144867. [Google Scholar] [CrossRef]
  62. Shen, N.; Zhang, L.; Wang, Q. The Empowerment of Smart City Construction on the Synergy Effect of Pollution Control and Carbon Reduce in China: Empirical Analysis with Double Machine Learning Method. J. Clean. Prod. 2025, 519, 145958. [Google Scholar] [CrossRef]
  63. Sun, G.; Fang, J.; Li, J.; Wang, X. Research on the Impact of the Integration of Digital Economy and Real Economy on Enterprise Green Innovation. Technol. Forecast. Soc. Chang. 2024, 200, 123097. [Google Scholar] [CrossRef]
  64. Xie, L.; Hui, S. Low-Carbon Transition Policy and Employment Structure: Evidence from China’s Low-Carbon City Pilot. Cities 2025, 162, 105985. [Google Scholar] [CrossRef]
  65. Zhang, X.; Liu, Z.; Walker, T.R.; Wilson, J.; Tao, X.; Dong, H.; Zhao, W. Impact of Political Incentives on Urban Green Development: An Analysis of 284 Cities in China. Cities 2025, 161, 105891. [Google Scholar] [CrossRef]
  66. Xiang, W.; Lan, Y.; Gan, L.; Li, J. How Does New Urbanization Affect Urban Carbon Emissions? Evidence Based on Spatial Spillover Effects and Mechanism Tests. Urban Clim. 2024, 56, 102060. [Google Scholar] [CrossRef]
  67. Zhu, Y.; Xu, Y.; Yin, S. How Does Digital Technology Innovation Drive Synergies for Reducing Pollution and Carbon Emissions? Sustainable Cities and Society 2024. Sustain. Cities Soc. 2024, 116, 105932. [Google Scholar] [CrossRef]
  68. Shen, N.; Zhou, J.; Zhang, G.; Wu, L.; Zhang, L. How Does Data Factor Marketization Influence Urban Carbon Emission Efficiency? A New Method Based on Double Machine Learning. Sustain. Cities Soc. 2025, 119, 106106. [Google Scholar] [CrossRef]
  69. Du, W.; Liu, X.; Liu, Y.; Xie, J. Digital Economy and Carbon Emission Efficiency in Three Major Urban Agglomerations of China: A U-Shaped Journey towards Green Development. J. Environ. Manag. 2025, 373, 123571. [Google Scholar] [CrossRef]
  70. Guo, P.-H.; Wang, X.-Q.; Meng, X.-R. U-Shaped Relationship between Environmental Regulation and the Digital Transformation of the Chinese Coal Industry: Mechanism and Moderating Effects. J. Environ. Manag. 2025, 373, 123641. [Google Scholar] [CrossRef]
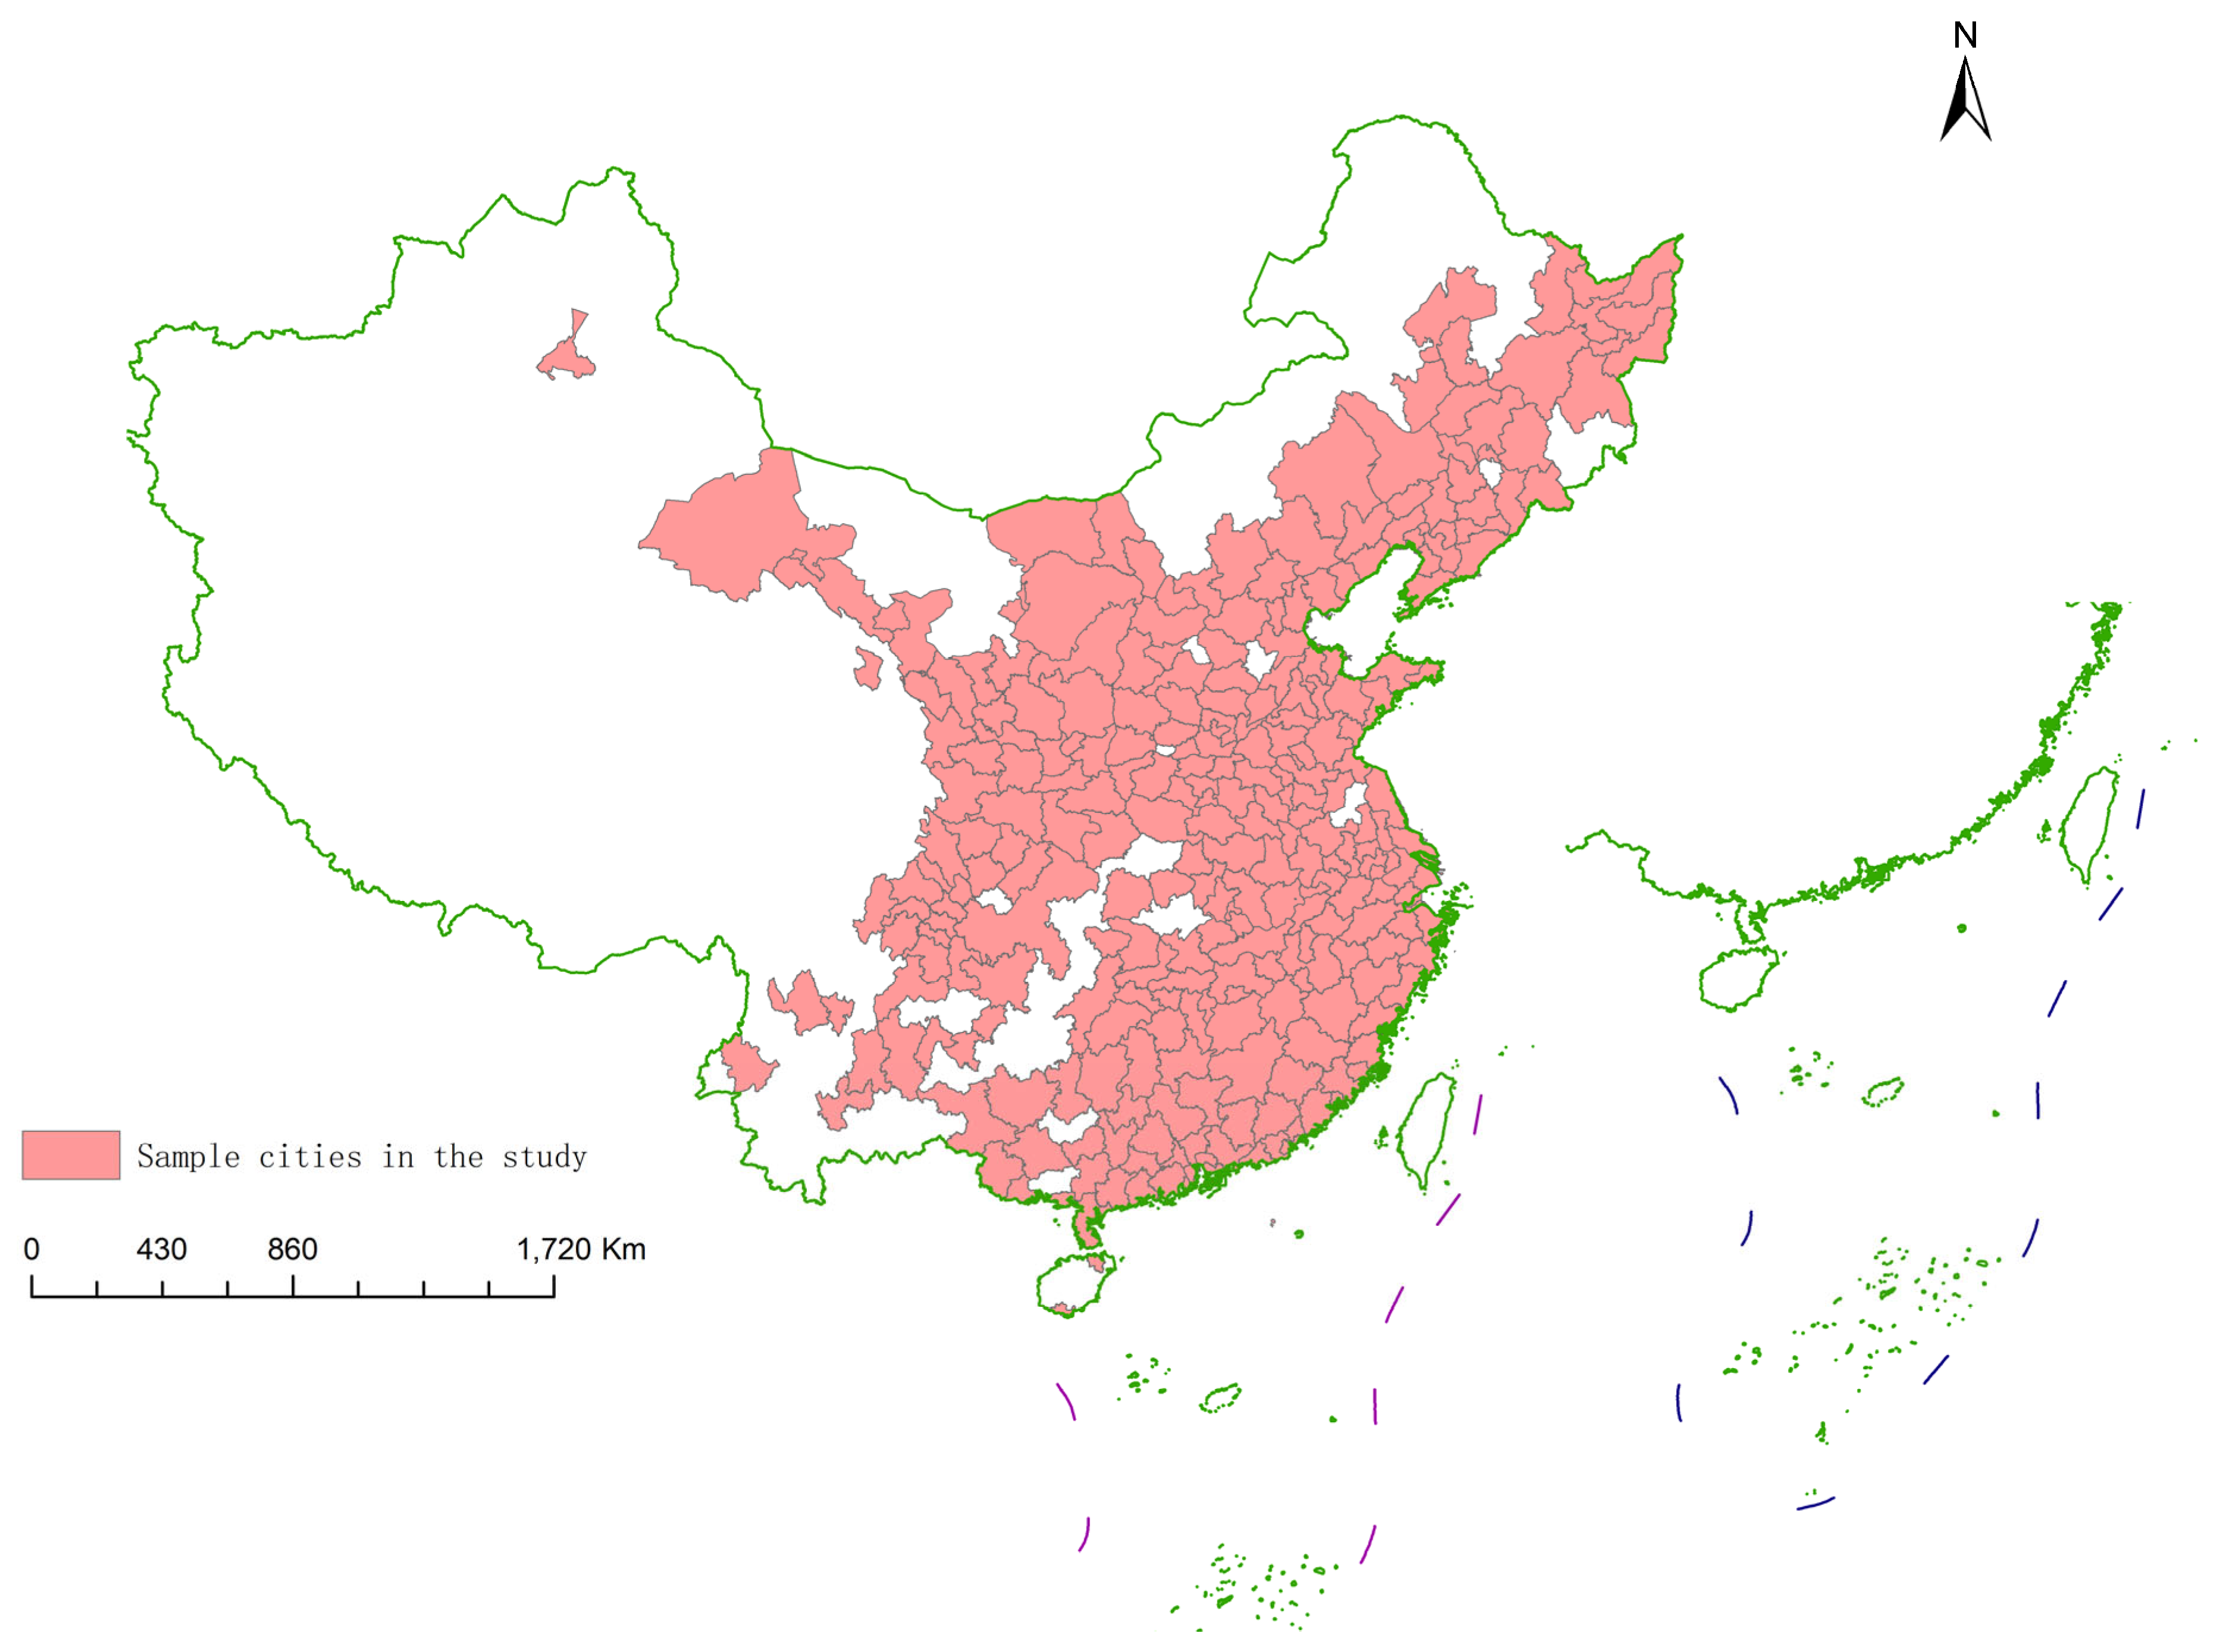
Figure 1. Cities in the study.
Sustainability 17 07499 g001
Figure 2. Research flowchart.
Sustainability 17 07499 g002
Figure 3. The inverted U-shaped relationship curve between green technological innovation and carbon emissions.
Sustainability 17 07499 g003
Figure 4. The marginal effect diagram of green technological innovation on carbon emissions.
Sustainability 17 07499 g004
Figure 5. Distribution of low-carbon pilot cities.
Sustainability 17 07499 g005
Figure 6. Distribution of resource-based cities.
Sustainability 17 07499 g006
Table 1. Descriptive statistics.
SymbolObsMeanSDMinMedianMax
LnCR29372.17260.73430.08642.12695.3715
LnGTI129370.70501.10000.00000.24674.6052
LnGTI229370.95001.10000.04490.39405.0000
LnPA29370.05300.04550.00000.03740.7577
OP29370.22000.20080.00020.15710.5000
LnPS29375.77620.90610.68315.93537.8816
UL29370.56300.14800.18150.54351.0000
GV29370.19500.09000.04390.17410.8055
FD29372.00401.00000.58791.85074.5000
SD29370.01750.01780.00060.01190.2068
LnHD29374.84000.82002.50004.71465.9915
Table 2. Summary of variables.
Variable NameAbbreviationDefinitionData SourceVariable TypeTime Span
Dependent VariableUrban Carbon EmissionsLnCRTotal CO2 emissions per 10,000 people (natural logarithm)China Statistical Yearbook, China Urban Statistical Yearbook, IPCC [42], China Power Grid [42,43,44]Continuous2012–2022
Explanatory VariablesAuthorized Green PatentsLnGTI1Number of authorized green patents per 10,000 people, log(1 + x) transformedNational Intellectual Property Administration (CNIPA)
https://www.cnipa.gov.cn
Applied Green PatentsLnGTI2Number of applied green patents per 10,000 people, log(1 + x) transformed
Moderating VariablesPublic Environmental AttentionLnPABaidu Index for environmental keywords per 10,000 people, log(1 + x) transformedBaidu Search Index Platform
https://index.baidu.com
Control VariablesOpenness to the Outside WorldOPActual utilized foreign investment/regional GDPChina Urban Statistical Yearbook
Population DensityLnPSNatural logarithm of population density (resident population per square kilometer)
Urbanization RateULUrban population/total population
Government InterventionGVGovernment expenditure/regional GDP
Financial DevelopmentFDBank deposits and loans/regional GDP
R&D Investment IntensitySDScience and technology expenditure/government expenditure
Human CapitalLnHDNumber of university students per 10,000 people (natural logarithm)
Table 3. Benchmark regression results.
(1)(2)(3)(4)(5)(6)(7)(8)
LnCRLnCRLnCRLnCRLnCRLnCRLnCRLnCR
LnGTI0.0107 ***0.0101 ***0.0100 ***0.0103 ***0.0102 ***0.0107 ***0.0099 ***0.0099 ***
(15.8382)(15.2476)(14.7649)(15.1469)(14.9689)(15.2518)(13.5591)(13.6222)
LnGTI2−0.0108 ***−0.0080 ***−0.0082 ***−0.0009 ***−0.0007 ***0.0013 ***−0.0032 ***−0.0023 ***
(−3.7712)(−2.8616)(−2.8505)(−3.1202)(−2.9762)(3.0150)(−3.0020)(−2.9286)
OP −0.2383 ***−0.2386 ***−0.2373 ***−0.2340 ***−0.2339 ***−0.2333 ***−0.2297 ***
(−11.7193)(−11.7220)(−11.6892)(−11.3968)(−11.4093)(−11.4099)(−11.2045)
PS 0.00900.0008−0.00120.0131−0.0272−0.0372
(0.3403)(0.0302)(−0.0464)(0.4854)(−0.9439)(−1.2750)
UL −0.1275 ***−0.1247 ***−0.1298 ***−0.1266 ***−0.1196 ***
(−3.9642)(−3.8662)(−4.0223)(−3.9321)(−3.7021)
GV −0.0408−0.0330−0.0339−0.0378
(−1.0552)(−0.8525)(−0.8794)(−0.9815)
FD 0.0468 ***0.0714 ***0.0723 ***
(2.9024)(4.1404)(4.1916)
SD 0.0275 ***0.0277 ***
(3.9436)(3.9677)
LnHD −0.0001 **
(−2.2443)
City FeYesYesYesYesYesYesYesYes
Year FeYesYesYesYesYesYesYesYes
_cons0.8564 ***0.9298 ***0.00370.49850.47700.30901.3537 **1.5860 ***
(55.8592)(56.4990)(0.0069)(0.9121)(0.8696)(0.5567)(2.3578)(2.7269)
N29372937293729372937293729372937
t statistics in parentheses. ** p < 0.05; *** p < 0.01.
Table 4. Inverted “U” curve test results.
Lower BoundUpper Bound
Interval−5.68103.1955
Slope−0.11520.0611
t value−19.17737.8061
P3.62 × 10−774.21 × 10⁻¹⁵
Table 5. Robustness test.
(1)(2)(3)(4)
LnCRLnCRLnCRLnCR
LnGT0.0458 ***
(2.5405)
LnGT2−0.0097 ***
(−16.9823)
LnGTI 0.0107 ***0.0111 ***0.0099 ***
(10.3444)(12.1935)(13.6222)
LnGTI2 −0.0034 ***−0.0008 ***−0.0023 ***
(−3.2102)(−3.0185)(−3.0588)
ControlYesYesYesYes
City FeYesYesYesYes
Year FeYesYesYesYes
_cons0.9516 ***0.73981.5781 ***1.4144 ***
(41.9245)(1.0279)(2.8062)(3.1266)
N2937213629372937
t statistics in parentheses. *** p < 0.01.
Table 6. Endogeneity test.
2SLSSYS-GMM
(1)
First-Stage
LnGTI
(2)
First-Stage
LnGTI2
(3)
Second-Stage
LnCR
(4)
LnIV1.1911 ***−0.1227 ***
(33.5400)(−7.1802)
LnIV2−0.1421 ***0.0040 ***
(−18.0301)(3.6700)
LnGTI 0.0414 ***0.0611 ***
(6.9103)(2.8510)
LnGTI2 −0.0143 ***−0.0166 ***
(−15.3903)(−4.5506)
AR(1) −1.92 (0.054)
AR(2) 1.15 (0.251)
Sargan test 22.16 (0.332)
F-statistic24.55
ControlYesYesYes
City FeYesYesYes
Year FeYesYesYes
N293729372937
t statistics in parentheses. *** p < 0.01.
Table 7. Moderating effect test results.
(1)(2)(3)(4)
LnCRLnCRLnCRLnCR
LnGTI0.0275 ***0.0402 ***0.1000 ***0.0800 ***
(6.0470)(9.4626)(6.0470)(9.4626)
LnGTI2−0.0053 ***−0.0049 ***−0.0200 ***−0.0500 ***
(−5.7571)(−5.3901)(−5.7571)(−5.3901)
LnPA × LnGTI0.0008 ***0.0007 ***
(9.1841)(8.5148)
LnPA × LnGTI2−0.0001 ***−0.0001 ***
(−2.8767)(−3.9048)
LnPA0.0002 **0.0001 ***
(0.8735)(0.4802)
LnMA × LnGTI 0.0050 ***0.0020 ***
(9.1841)(8.5148)
LnPA × LnGTI2 −0.0020 ***−0.0010 ***
(−2.8767)(−3.9048)
LnMA 0.0010 **0.0005 ***
(0.8735)(0.4802)
ControlYesYesYesYes
City FeYesYesYesYes
Year FeYesYesYesYes
_cons1.42550.1537 *1.20000.3000 *
(0.6174)(1.6666)(0.6174)(1.6666)
N2937177129371771
t statistics in parentheses. * p < 0.1; ** p < 0.05; *** p < 0.01.
Table 8. Descriptive statistics of variables for low-carbon pilot cities.
SymbolObsMeanSDMinMedianMax
LnCR11662.05030.71000.20002.01004.9500
LnGTI111660.89001.12000.00000.39004.6052
LnGTI211661.13001.15000.05000.53005.0000
LnPA11660.06210.04800.00000.04650.7577
OP11660.24000.20000.00020.18600.5000
LnPS11665.91000.87001.24005.98007.8500
UL11660.59600.14200.26000.57001.0000
GV11660.19000.08700.04390.17200.8055
FD11662.10001.00000.58791.98004.5000
SD11660.01820.01650.00100.01250.1900
LnHD11664.97000.79002.70004.85005.9915
Table 9. Descriptive statistics of variables for non-low-carbon pilot cities.
SymbolObsMeanSDMinMedianMax
LnCR17712.28500.74000.08642.21005.3715
LnGTI117710.57000.97000.00000.17004.1000
LnGTI217710.80001.07000.04490.29004.9000
LnPA17710.04600.04250.00000.03300.6400
OP17710.20000.18000.00030.13100.4800
LnPS17715.64000.92000.68315.81117.6500
UL17710.53200.14400.18150.51000.9800
GV17710.20200.09000.05000.18000.8055
FD17711.87000.95000.58791.73004.2100
SD17710.01600.01750.00060.01050.2068
LnHD17714.69000.78002.50004.52005.8500
Table 10. Descriptive statistics of variables for resource-based cities.
SymbolObsMeanSDMinMedianMax
LnCR18702.37000.72000.20002.31005.2500
LnGTI118700.60001.03000.00000.20004.3000
LnGTI218700.79001.10000.04500.31004.7000
LnPA18700.04500.04400.00000.03400.7020
OP18700.17000.17000.00020.09000.4780
LnPS18705.60000.89000.68315.73007.5811
UL18700.51900.14000.19000.49000.9600
GV18700.21300.09500.04900.19000.8055
FD18701.79000.91000.58791.62004.1000
SD18700.01580.01700.00060.01010.2000
LnHD18704.63000.78002.50004.51005.8400
Table 11. Descriptive statistics of variables for non-resource-based cities.
SymbolObsMeanSDMinMedianMax
LnCR10671.97500.69200.08641.94004.9911
LnGTI110670.81001.11000.00000.45004.6052
LnGTI210671.12001.14000.06000.58005.0000
LnPA10670.05900.04600.00000.04100.7577
OP10670.25000.21000.00020.18000.5000
LnPS10675.94000.89001.24126.02007.8816
UL10670.60400.14200.26000.58001.0000
GV10670.18000.08200.04390.16200.7012
FD10672.18001.02000.61702.10004.5000
SD10670.01900.01600.00120.01350.1900
LnHD10675.02000.78002.90004.91005.9915
Table 12. Heterogeneity.
(1)(2)(3)(4)
LnCRLnCRLnCRLnCR
LnGTI0.00790.0194 ***0.0027 ***0.0042
(1.4321)(3.3499)(2.8501)(1.5234)
LnGTI2−0.0138−0.0057 ***−0.0078 ***−0.0113
(−1.4321)(−5.2980)(−6.8064)(−1.3176)
ControlYesYesYesYes
City FeYesYesYesYes
Year FeYesYesYesYes
_cons0.4725 ***0.5804 ***0.5671 ***0.5190 ***
(13.1422)(19.0766)(18.0280)(15.0895)
N1166177118701067
t statistics in parentheses. *** p < 0.01.
Table 13. Spatial spillover effects.
(1)(2)(3)
VariablesLR_DirectLR_IndirectLR_Total
LnGTI0.0127 ***0.0017 ***0.0144 ***
(9.8042)(6.5196)(5.3271)
LnGTI2−0.0027 ***−0.0003 ***−0.0030 ***
(−7.1143)(−2.7819)(−4.4395)
ControlYesYesYes
City FeYesYesYes
Year FeYesYesYes
Observations293729372937
Number of ids267267267
Standard errors in parentheses. *** p < 0.01.
Disclaimer/Publisher’s Note: The statements, opinions and data contained in all publications are solely those of the individual author(s) and contributor(s) and not of MDPI and/or the editor(s). MDPI and/or the editor(s) disclaim responsibility for any injury to people or property resulting from any ideas, methods, instructions or products referred to in the content.