Abstract
As an important reserve resource for cultivated land, the improvement and fertility enhancement of saline-alkali land are key to alleviating the pressure on cultivated land and ensuring the sustainable utilization of land resources. Studying the regulatory effect of rotation patterns on the soil fertility of saline-alkali land is one of the core research contents in exploring low-cost and environmentally friendly comprehensive management strategies for saline-alkali land. This study focuses on Zhaoyuan County, a representative saline and alkaline area within the Songnen Plain. Utilizing remote sensing technology, crop information was systematically collected across 13 time periods spanning from 2008 to 2020. These data were employed to construct a comprehensive crop information change atlas. This atlas categorized crop rotation patterns based on crop combinations, rotation frequencies, and the number of consecutive years of planting. Using soil sampling data from 2008 and 2020, a soil fertility evaluation was conducted, and the changes in soil chemical properties and fertility under various crop rotation patterns were analyzed. The results of the study show that, during the study period, crop rotation patterns in Zhaoyuan County were dominated by paddy-upland rotations and upland crop rotations. Crop rotation patterns, categorized by crop combination, were dominated by soybean–maize–other crops rotation (S-M-O) and rice–soybean–maize–other crops rotation (R-S-M-O). The frequency of crop rotation is dominated by low- and medium-frequency crop rotation. Crop rotation significantly increased soil organic matter, total nitrogen content, and overall soil fertility in the study area, while simultaneously lowering soil pH levels. Crop rotation patterns with different crop combinations had significant effects on soil chemical properties, with smaller differences in the effects of different rotation frequencies and years of continuous cropping. Crop rotation patterns incorporating soybean demonstrate a significant positive regulatory impact on the soil fertility of saline-alkali land. Low-frequency crop rotation (with ≤5 crop changes) has a relatively better effect on improving soil fertility. This research provides important empirical support and decision-making references for establishing sustainable farming systems in ecologically fragile saline-alkali areas, ensuring regional food security, and promoting the long-term sustainable utilization of land resources.
1. Introduction
Soil salinization is one of the major obstacles threatening global soil health and sustainable agricultural development [1,2]. Soil salinization leads to a decline in land productivity [3,4] and an increase in ecosystem vulnerability [5] by disrupting the physical structure of soils, inhibiting microbial activity, and exacerbating ionic toxicity [6,7,8,9]. Ultimately, it leads to a systematic reduction in food production capacity [10], thereby constraining the achievement of food security and the goals of sustainable agriculture. According to the Food and Agriculture Organization of the United Nations (FAO) assessment, the global land area affected by salinization amounts to 1.381 billion hectares, accounting for about 10.7% of the total global land area [11]. China is the third largest country in the world in terms of saline land area, with a total saline land area of about 99 million hectares [12]. The Songnen Plain, situated in the core salinization zone of Northeast China and serving as a critical national base for commercial grain production, continues to face significant risks of soil salinization. These risks not only threaten regional food security but also pose significant challenges to the implementation of the national strategy for sustainable agricultural development.
Although recent comprehensive management strategies for cultivated land in saline areas achieved progress in engineering-based salt drainage and chemical amelioration techniques, several challenges persist, including high investment costs, strong reliance on technical expertise, potential environmental risks, and the lack of long-term sustainability, all of which hinder the widespread adoption and application of these methods [13,14,15,16,17,18,19]. Therefore, exploring the low-input, sustainable “use instead of cure” ecological management path and synchronizing the reduction in saline barriers and the enhancement of soil fertility through biological regulation have become the priority paths to promote sustainable development in regional saline and alkaline land management [20,21,22,23,24]. Crop rotation serves as the central mechanism of this approach, with its sustainability value rooted in the formation of differentiated root configurations through temporal crop turnover, dynamic reshaping of the rhizosphere microenvironment [25], and the structuring of microbial communities [26,27]. This synergy ultimately promotes soil health and enhances the sustainability of cropping systems [28,29,30,31]. Within the framework of the Global Sustainable Development Goals (SDGs), ensuring soil health, promoting agricultural sustainability, and enhancing food production capacity are issues that demand immediate attention. Consequently, investigating the regulatory impacts of crop rotation patterns on the soil fertility of saline-alkali lands not only furnishes a scientific foundation for the rational utilization of such lands, but also provides practical guidance for the realization of food security and the advancement of sustainable agriculture.
The current research on crop rotation is mostly limited to standardized rotation models, characterized by fixed crop combinations and constant rotation cycles. However, in actual agricultural production, the complexity of planting patterns is much higher than standardized crop rotation. This is primarily due to the fact that, in practical production settings, farming entities dynamically adjust both crop types and the duration of consecutive planting in response to market fluctuations, policy directives, climate variability, and soil conditions [32,33]. In light of this, this study, grounded in the diversity of crop combinations and the flexible nature of rotation cycles within agricultural production practices, identifies crop combinations and planting interval cycles [34,35] as key structural components of the rotation system. It further establishes a flexible crop rotation framework, classifies rotation mode types, and analyzes the impacts of different rotation strategies on soil chemical properties and soil fertility based on the resulting classification.
Focusing on the saline-alkali areas of the Songnen Plain, this study proposes the following three research components: 1. Pattern deconstruction: to quantify the temporal dynamics of crop rotations over a 13-year period and to identify rotation patterns based on crop combinations, rotation frequency, and the duration of consecutive crop cultivation. 2. Soil chemical balances: examining the impacts of dynamic crop rotation on the regulation of soil pH and key nutrient balances in saline soils. 3. Soil fertility synergies: identifying crop rotation patterns that enhance soil fertility in arable land. This study aims to analyze the cascading mechanism of the “barrier reduction–fertilization” process in saline-alkaline soils driven by dynamic crop rotation, thereby providing an actionable framework for building resilient cropping systems in the region and ultimately ensuring regional food security alongside sustainable land resource utilization.
2. Data Sources and Research Methods
2.1. Overview of the Study Area
Zhaoyuan County is situated between 45°23′–45°59′ N and 123°47′–125°45′ E in the southwestern region of Heilongjiang Province, covering an area of 4119.5 square kilometers (Figure 1). It lies within the hinterland of the Songnen Plain, characterized by relatively low-lying topography, an absence of mountains throughout the region, and a significant presence of swamps, lakes, and rivers. Zhaoyuan County experiences a mesothermal continental monsoon climate, characterized by dry and windy springs, strong evaporation, and concentrated summer precipitation. The region has a long-term average annual precipitation of 418 mm, an average annual temperature of approximately 4.0 degrees Celsius, an effective accumulated temperature of 3118.9 degree days per year, a frost-free period of approximately 150 days, and a single-cropping system per year.
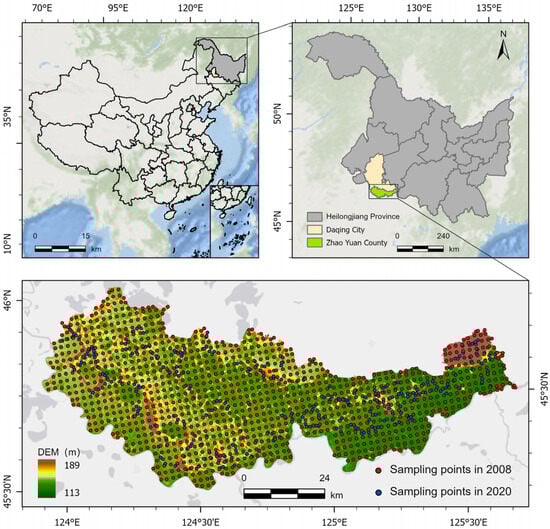
Figure 1.
Schematic diagram of the study area. Map source: Map Technical Review Center of the Ministry of Natural Resources of the People’s Republic of China (Map Review Number: GS (2024)0650).
2.2. Data Sources and Preprocessing
2.2.1. Satellite Remote Sensing Data Sources and Preprocessing
The remote sensing image data used in this study were sourced from the official websites of the United States Geological Survey (http://earthexplorer.usgs.gov (accessed on 5 February 2025)) and the Geospatial Data Cloud (https://www.gscloud.cn/ (accessed on 5 February 2025)). A total of 13 time periods of remote sensing images were selected, with detailed parameters presented in Table 1. Following the pre-processing of remote sensing images, including radiometric calibration, atmospheric correction, and geometric correction, Landsat 5, Landsat 7, and Landsat 8 images were fused using bands 4, 3, and 2 for Landsat 5; 4, 3, and 2 for Landsat 7; and 6, 5, and 2 for Landsat 8, respectively. Interpretation markers for rice, soybean, maize, and other crops were established through visual discrimination, and a set of training sample points for crop classification was created. Supervised classification methods were then applied to classify rice, maize, soybean, and other crops in the study area.

Table 1.
Statistics of remote sensing image information in the study area.
2.2.2. Source of Soil Samples
Soil sample data were collected from field sampling campaigns conducted in 2008 and 2020, with sampling depths ranging from 0 to 20 cm. A total of 1113 sample points were collected in 2008, and 290 sample points were collected in 2020. The analytical methods for determining soil pH, organic matter (OM), total nitrogen (TN), total phosphorus (TP), and total potassium (TK) followed the procedures outlined in Soil Agrochemical Analysis.
2.3. Research Methods
2.3.1. Geo-Information Tupu
Geo-information Tupu is a classical geospatial spatiotemporal analysis method proposed by Academician Chen Shupeng [36]. The term “map” primarily refers to the graphic representation of spatial information in cartographic form, while “spectrum” denotes a systematic arrangement of similar entities or phenomena organized according to temporal sequences. The integration of maps and spectra enables a unified representation of spatial and temporal dynamic changes [37,38,39]. In this study, raster cells representing different crop categories—rice, soybean, maize, and other crops—were assigned values of 1, 2, 3, and 4, respectively. By applying map algebra to perform spatial overlay analysis on the 13 time periods of crop classification data, a crop change information map was generated. The calculation formula is as follows:
where W denotes the newly generated graph code, while Ai represents the classification codes of the elements at each research stage, with calculations performed in chronological order.
2.3.2. Geostatistical Methods
Burgess and Webster were among the pioneers in applying geostatistical methods to soil mapping [40]. The Kriging interpolation method fully accounts for the spatial autocorrelation of soil properties. This approach requires first estimating the semi-variance using a substantial number of field sample points, and then constructing a semi-variogram model to perform spatial interpolation, thereby estimating the spatial distribution of soil properties across the study area. Its formula is as follows:
where r(h) represents the variogram; N(h) is the total number of sample point pairs when the sampling distance is h; Z(xi) and Z(xi + h) are the measured values of the regionalized variable Z(x) at positions xi and xi + h, respectively. The relevant parameters in the semivariogram mainly include nugget value (C0), sill (C + C0), range (A), nugget–sill ratio (C0/(C + C0)), and structural variance (C). The theoretical models mainly include linear, exponential, spherical, and Gaussian.
2.3.3. Fuzzy Comprehensive Evaluation Method
In this study, soil pH, organic matter (OM), total nitrogen (TN), total phosphorus (TP), and total potassium (TK) were selected as indicators for evaluating soil fertility. The membership functions for each indicator, along with the threshold values defining the abundance and deficiency levels, were determined based on relevant literature [41] and the background values of soil properties in the cultivated soils of Heilongjiang Province (Table 2). A peak-type membership function Equation (3) was applied to soil pH, whereas an upper-limit-type function Equation (4) was used for organic matter, total nitrogen, total phosphorus, and total potassium.
Table 2.
Membership function, inflection points, and weights of soil fertility evaluation indicators.
The weights of the soil fertility evaluation indicators were determined by calculating the proportion of common factor variances using principal component analysis [42]. Based on the addition and multiplication principles of fuzzy mathematics, the weights and membership values of each indicator were integrated through weighted summation to ultimately derive the integrated fertility index (IFI) of the soil. The calculation formula is presented in Equation (5).
where wi represents the weight of the soil fertility index, fi represents the membership degree of the soil fertility index, and n represents the number of soil fertility indices.
3. Results and Analysis
3.1. Crop Type Identification and Crop Rotation Pattern Classification
3.1.1. Evaluation of Crop Classification Accuracy
In Zhaoyuan County, the main crop types include rice, soybeans, maize, and other crops. In this study, crops with relatively small planting areas—such as sunflowers, millet, and adzuki beans—as well as fallow plots, are classified collectively as “other crop”. The confusion matrix method is employed to assess the accuracy of crop classification results using validation samples. The accuracy evaluation consists of four metrics: overall classification accuracy, the Kappa coefficient, user accuracy, and producer accuracy. The accuracy of the annual crop classification results throughout the study period was validated, and the results met the requirements for subsequent analysis. Table 3 presents the classification accuracy of crops in Zhaoyuan County in 2020. The overall accuracy is 95.29%, the Kappa coefficient is 0.94, and the user accuracy for rice, maize, soybeans, and other crops is 95.45%, 95.35%, 100%, and 91.30%, respectively.
Table 3.
Confusion matrix of crop classification in Zhaoyuan County.
3.1.2. The Changes of Cultivated Area and Spatial Distribution Pattern of Different Crops in Zhaoyuan County from 2008 to 2020
Statistical analysis of the crop classification results in Zhaoyuan County indicates that the planting areas of various crops have undergone varying degrees of change. The results are presented in Figure 2. From 2008 to 2018, the soybean planting area decreased from 768.21 square kilometers to 38.50 square kilometers, representing a reduction of 94.99%. Meanwhile, the maize planting area increased from 590.74 square kilometers to 983.52 square kilometers, reflecting a growth rate of 66.49%. The rice planting area also exhibited a continuous growth trend, increasing from 350.01 square kilometers to 650.57 square kilometers. Since 2019, the maize planting area exhibited a downward trend, decreasing from 983.52 square kilometers in 2018 to 445.11 square kilometers in 2020. The rice planting area fluctuated and increased to 723.08 square kilometers in 2020. The area of other crops exhibits irregular fluctuations. This pattern is primarily attributed to the low and flat terrain of Zhaoyuan County, which includes numerous swamps. The surrounding farmland is influenced by climatic conditions and precipitation, resulting in unstable cultivation practices. Furthermore, the combined effects of grain prices, subsidy policies, and other socioeconomic factors contributed to the irregular variations in the area of other crops across different years.
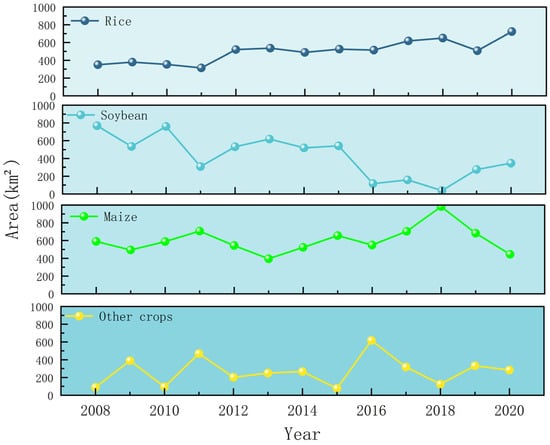
Figure 2.
Changes in the cultivated areas of different crops in Zhaoyuan County from 2008 to 2020.
The spatial distribution of crops in 2008, 2010, 2015, and 2020 was selected for visualization, as illustrated in Figure 3. The primary crops cultivated in Zhaoyuan County include rice, maize, soybeans, and other crops. The cropping pattern in Zhaoyuan County exhibits significant spatial differentiation, with distribution characteristics that are closely aligned with the regional geographical environment and the physiological traits of the crops. Precipitation in Zhaoyuan County exhibits a spatial differentiation pattern, decreasing from east to west. The primary maize production areas are concentrated in the eastern part of the county, where precipitation is relatively abundant. A significant amount of rainfall occurs during the critical growth period of maize, specifically from July to August. Combined with the irrigation system supplied by tributaries of the Songhua River, this ensures a stable water supply for maize from the jointing stage to the milk stage. Additionally, the soil layer in this region is deep and rich in organic matter, which satisfies the fertility requirements for high-yield maize cultivation. The primary soybean planting areas are located in the central part of Zhaoyuan County. Precipitation decreases gradually from east to west, and the maize planting area correspondingly diminishes. As a relatively drought-tolerant crop, soybeans possess physiological characteristics that allow them to adapt effectively to the precipitation conditions in the central region. Two major river systems—the Nenjiang and Songhua rivers—are situated in the western and southern parts of the study area. These rivers provide sufficient water resources to meet the requirements for rice cultivation, thereby forming a concentrated rice-growing region. Other crops are scattered throughout Zhaoyuan County, influenced by a combination of factors including land conditions, farmers’ planting traditions, and market demands. Consequently, no clear pattern of concentrated or contiguous distribution has been observed.
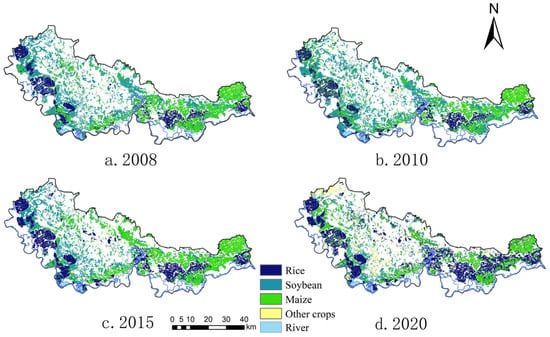
Figure 3.
Spatial distribution of different crops in Zhaoyuan County from 2008 to 2020.
3.1.3. Classification of Crop Rotation Patterns in Zhaoyuan County from 2008 to 2020
Thirteen time series crop classification datasets from 2008 to 2020 were processed using map algebra operations to construct a crop change information atlas. After merging identical codes, a total of 251,810 unique codes were obtained. These codes were categorized as follows, based on the coding characteristics of the mapping units:
① Based on crop types, the planting patterns are categorized into paddy-upland rotation, upland rotation, and continuous cropping patterns. Specifically, the proportions of cultivated land area under paddy-upland rotation and upland rotation are 58.29% and 34.33%, respectively. Given that the proportion of the continuous cropping area is relatively small, the proportions of the continuous cropping areas of rice (R), soybean (S), and corn (M) are 4.92%, 0.04%, and 2.42%, respectively. Therefore, this study will not conduct discussions and analyses on the continuous cropping patterns. Based on the paddy-upland rotation and upland rotation, it is specifically classified into 11 categories according to the crop combinations. The cultivated land areas under these rotation patterns, ranked from largest to smallest, are as follows: soybean–maize–other crops rotation (S-M-O), rice–soybean–maize–other crops rotation (R-S-M-O), rice–maize rotation (R-M), rice–soybean–maize rotation (R-S-M), rice–maize–other crops rotation (R-M-O), soybean–maize rotation (S-M), rice–soybean–other crops rotation (R-S-O), soybean–other crops rotation (S-O), maize–other crops rotation (M-O), rice–other crops rotation (R-O), and rice–soybean rotation (R-S). The corresponding proportions of these implemented areas are 24.04%, 20.46%, 13.92%, 10.05%, 7.03%, 4.84%, 4.36%, 3.26%, 2.19%, 1.57%, and 0.90%, respectively.
In terms of spatial distribution, paddy-upland rotation is primarily concentrated along the Songhua River and Nenjiang River, as well as in the eastern part of the county, where the rice–soybean–maize–other crops rotation pattern is dominant. Dryland rotation, on the other hand, is mainly distributed in the central and western regions of the county, with the soybean–maize–other crops rotation pattern as the primary type. These spatial patterns are influenced by multiple factors, including regional water resource conditions, fluctuations in grain market prices, and agricultural subsidy policies.
② According to the natural breaks method, the number of crop rotations is classified as follows: Low-frequency rotation (L-F) occurs when the number of rotations is less than or equal to five times; medium-frequency rotation (M-F) is defined as having six to eight rotations; and high-frequency rotation (H-F) is characterized by more than eight rotations. The proportions of cultivated land area under low-frequency crop rotation, medium-frequency crop rotation, and high-frequency crop rotation were 55.94%, 34.41%, and 9.65%, respectively.
The spatial distribution patterns exhibit the following characteristics: Low-frequency rotation is predominantly found along the Songhua River and Nenjiang River, as well as in the northeastern part of the county. Specifically, the areas along the Songhua River and Nenjiang River are endowed with abundant water resources, providing favorable natural conditions for rice cultivation. As a result, a relatively stable cropping structure has been established in these regions. Influenced by both natural conditions and long-standing planting traditions, the northeastern region is primarily dominated by maize cultivation, with limited crop rotation practices. Medium-frequency crop rotation is mainly observed in the central, southeastern, and southwestern parts of the county. The rotation patterns in these areas are shaped by a combination of natural and socio-economic factors, and exhibit a certain degree of randomness in crop combinations and planting sequences. High-frequency crop rotation is concentrated in the southwestern region, where the typical rotation pattern is a rice–soybean–maize–other crops rotation. This high frequency of rotation is attributed to the fact that farmland in this area is susceptible to fluctuations in the water level of the Nenjiang River, resulting in relatively low land use stability. To adapt to the dynamic changes in water and soil conditions, farmers frequently adjust their crop rotation practices.
③ According to the natural breakpoint method, the duration of continuous planting of the same crop is categorized into three types: long-term continuous cropping (L), medium-term continuous cropping (M), and short-term continuous cropping (S). Long-term continuous cropping refers to the practice of growing the same crop on the same land for a continuous period of 7 to 13 years; medium-term continuous cropping involves continuous planting for 4 to 6 years; and short-term continuous cropping refers to continuous planting for 1 to 3 years. From 2008 to 2020, based on the phased combination characteristics of continuous cropping years described above, crop planting patterns were classified into six categories. Ranked in descending order by the area of cultivated land under each pattern, they are as follows: the medium-term continuous cropping–short-term continuous cropping (M-S) pattern, the long-term continuous cropping–short-term continuous cropping (L-S) pattern, the short-term continuous cropping (S) pattern, the long-term continuous cropping–medium-term continuous cropping–short-term continuous cropping (L-M-S) pattern, the long-term continuous cropping–medium-term continuous cropping (L-M) pattern, and the medium-term continuous cropping (M) pattern. The corresponding proportions of these implemented areas are 39.75%, 28.39%, 20.25%, 3.93%, 0.29%, and 0.01%, respectively.
The medium-term continuous cropping–short-term continuous cropping (M-S) pattern is distributed across the entire county. The long-term continuous cropping–short-term continuous cropping (L-S) pattern is primarily concentrated in the southeastern and western riverfront regions. The short-term continuous cropping (S) pattern forms a relatively concentrated area in the western part of Minyi Township, while appearing in a scattered manner throughout other parts of the county. The specific proportions of these cropping patterns are summarized in Table 4 and illustrated in Figure 4, with their spatial distributions displayed in Figure 5.
Table 4.
Proportion of crop planting patterns in Zhaoyuan County.
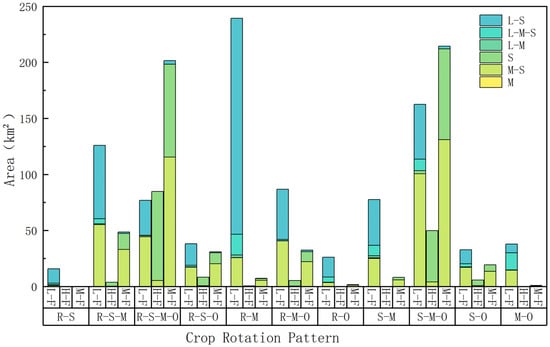
Figure 4.
Area statistics of different rotation patterns.
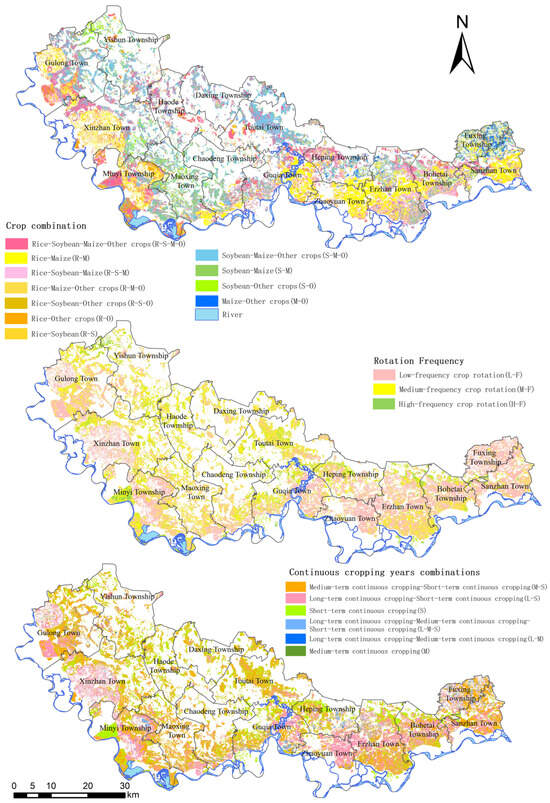
Figure 5.
Spatial Layout of Crop Rotation Patterns.
3.2. The Influence of Crop Rotation Patterns on Soil Chemical Properties
3.2.1. The Changes of Soil Chemical Properties and Spatial Distribution Patterns in Zhaoyuan County from 2008 to 2020
The statistics of soil chemical properties in Zhaoyuan County are shown in Table 5. The average pH value of the soil in Zhaoyuan County decreased from 8.95 in 2008 to 7.39 in 2020, showing a significant trend towards neutrality. The content of soil organic matter (OM) showed an increasing trend, with the average value rising from 16.69 g/kg in 2008 to 24.93 g/kg in 2020. The content of total nitrogen (TN) in the soil increased from 1.06 g/kg to 1.36 g/kg, representing a growth rate of 28.3%. The total phosphorus (TP) content in the soil slightly decreased from 0.46 g/kg to 0.45 g/kg, with a decrease of 2.17%. The total potassium (TK) content in the soil rose from 23.45 g/kg in 2008 to 24.68 g/kg in 2020, an increase of 5.25%.
Table 5.
Statistics of chemical properties of soils in Zhaoyuan County.
The changes in the spatial distribution pattern of soil chemical properties in Zhaoyuan County from 2008 to 2020 are shown in Figure 6. The spatial pattern of soil pH in Zhaoyuan County has undergone significant changes. In 2008, the soil was predominantly alkaline, with only a few neutral areas located in the southeastern part of the county. By 2020, the distribution of soil acidity and alkalinity evolved into a more complex pattern characterized by the coexistence of alkaline, neutral, and acidic zones. Notably, the central, western, and northeastern regions experienced a marked transition from alkaline to neutral conditions. The contents of soil organic matter and total nitrogen exhibit a significant increasing trend, with similar spatial distribution patterns. The accumulation of soil organic matter and total nitrogen is particularly pronounced in the western areas along the river. Total phosphorus displays a slight increase in the central region, while a decreasing trend is observed in the southeastern areas. Soil total potassium content shows a spatially differentiated pattern: an increase in the eastern cultivated areas and a decrease in some central and western cultivated regions.
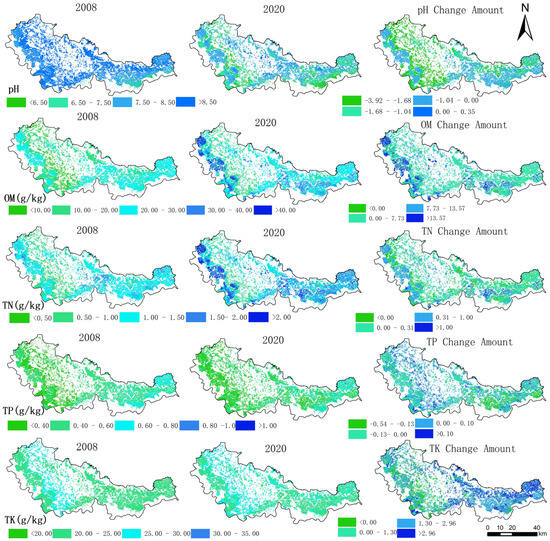
Figure 6.
Changes in the spatial distribution pattern of soil chemical properties from 2008 to 2020.
3.2.2. The Influence of Different Crop Combinations in Rotation Systems on Soil Chemical Properties
A comparative analysis was conducted to evaluate changes in soil pH, organic matter, total nitrogen, total phosphorus, and total potassium contents under different crop rotation patterns from 2008 to 2020 (Figure 7). The results indicate that crop rotation patterns involving diverse crop combinations led to a reduction in soil pH. Specifically, the soybean–other rotation (S–O), soybean–maize rotation (S–M), and soybean–maize–other crops rotation (S-M-O) exhibited the most pronounced decreases in soil pH, with reductions ranging from 21.84% to 27.05%. The crop rotation patterns involving soybeans significantly reduce soil pH values. This occurs because rhizobia that form symbiotic relationships with soybean roots secrete acidic substances during the nitrogen fixation process. These acids subsequently undergo neutralization reactions with alkaline components in the soil, leading to a decrease in soil pH.
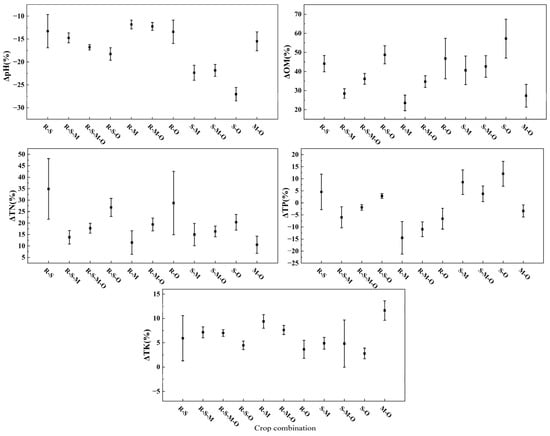
Figure 7.
Rates of change in soil chemical properties of different crop combinations from 2008 to 2020. R-S: rice–soybean rotation; R-S-M: rice–soybean–maize rotation; R-S-M-O: rice–soybean– maize–other crops rotation; R-S-O: rice–soybean–other crops rotation; R-M: rice–maize rotation; R-M-O: rice–maize–other crops rotation; R-O: rice–other crops rotation; S-M: soybean–maize rotation; S-M-O: soybean–maize–other crops rotation; S-O: soybean–other crops rotation; and M-O: maize–other crops rotation.
Under different rotation patterns, the soil organic matter content showed a significant upward trend. The rotation patterns with larger increases were soybean–other crops rotation (S-O), rice–soybean–other crops rotation (R-S-O), and rice–other crops rotation (R-O), with the increase ranging from 46.25% to 56.23%. The total nitrogen content in the soil also increased. The most significant increases were observed in the rice–soybean rotation (R-S), rice–other crops rotation (R-O), and rice–soybean–other crops rotation patterns (R-S-O), with the increase ranging from 26.85% to 35.24%. Crop rotation patterns that include rice can significantly enhance soil organic matter and total nitrogen content. This is primarily due to the fact that rice roots secrete abundant soluble organic substances, which serve as an effective carbon source for soil microorganisms. Following microbial transformation, these substances contribute to the formation and accumulation of stable humus in the soil. Furthermore, the alternating dry–wet conditions during the rotation process promote the formation of soil aggregates. The resulting aggregate structure physically protects organic matter, thereby reducing its decomposition rate.
Soil total phosphorus content increased significantly in the soybean–other crops rotation (S–O), soybean–maize rotation (S–M), and rice–soybean rotation (R–S), whereas it decreased notably in the rice–maize–other crops rotation (R–M–O) and rice–maize rotation (R–M). This variation can be attributed to the fact that soybeans secrete acidic substances through their root systems, which are capable of activating insoluble phosphorus in the soil. Additionally, the incorporation of soybean residues into the soil may enhance phosphorus input. These two mechanisms jointly contribute to the observed increase in soil total phosphorus content. In contrast, the rice–maize rotation system lacks an effective phosphorus activation mechanism. Combined with the continuous phosphorus uptake by crops during growth and potential phosphorus losses, this leads to a decline in soil total phosphorus content.
The soil total potassium content generally exhibits an increasing trend, with the most significant increase observed in the maize–other crops rotation pattern (M–O), reaching 11.58%. This can be attributed to the high potassium demand of maize, which leads farmers to apply potassium fertilizers regularly. When straw returning is practiced in the rotation system, maize stubble left after harvest can directly replenish potassium to the soil.
3.2.3. The Influence of Different Rotation Frequencies and Continuous Cropping Years in the Rotation System on Soil Chemical Properties
The changes in the chemical properties of cultivated soil under different rotation frequencies are as follows (Figure 8): the soil pH shows a downward trend, with a decrease ranging from 16.79% to 17.60%. The soil organic matter content increases, with an increase ranging from 39.06% to 39.20%. The total nitrogen content of the soil increases, with an increase ranging from 18.61% to 19.88%. The total phosphorus content of the soil slightly decreases, with a decrease ranging from 0.46% to 1.18%. The total potassium content of the soil increases, with an increase ranging from 5.83% to 7.40%.
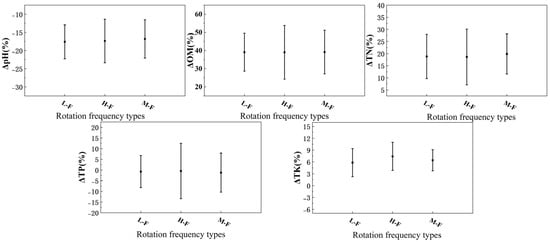
Figure 8.
Rates of change in soil chemical properties from 2008 to 2020 under different rotation frequencies. L-F: low-frequency rotation; H-F: high-frequency rotation; and M-F: medium-frequency rotation.
The changes in the chemical properties of cultivated soil under different rotation patterns with various continuous cropping years are as follows (Figure 9): the soil pH shows a varying degree of decline, with a decrease range of 16.72% to 20.07%. The soil organic matter content shows an increasing trend, with an increase range of 37.50% to 40.82%. The increase in soil total nitrogen content ranges from 12.80% to 21.50%, and the short-term continuous cropping pattern has a relatively larger increase in soil total nitrogen content. The soil total phosphorus content shows varying degrees of increase and decrease. The soil total phosphorus content under the short-term continuous cropping pattern slightly increases, while the soil total phosphorus content under the other rotation patterns decreases by 0.84% to 1.90%. The soil total potassium content slightly increases, with an increase range of 3.39% to 6.70%.
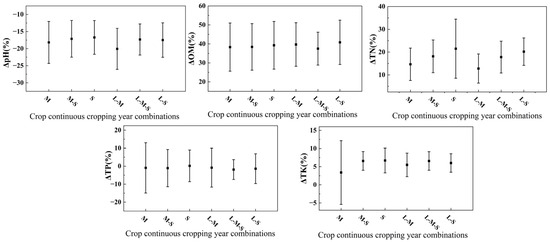
Figure 9.
Rates of change in soil chemical properties under combinations of different crop continuous cropping durations from 2008 to 2020. M: medium-term continuous cropping; M-S: medium-term continuous cropping—short-term continuous cropping; S: short-term continuous cropping; L-M: long-term continuous cropping—medium-term continuous cropping; L-M-S: long-term continuous cropping—medium-term continuous cropping—short-term continuous cropping; and L-S: long-term continuous cropping—short-term continuous cropping.
3.3. The Influence of Crop Rotation Patterns on Soil Fertility
3.3.1. The Changes of Soil Fertility and Spatial Pattern of Cultivated Land in Zhaoyuan County from 2008 to 2020
The fuzzy comprehensive evaluation method was applied to assess the soil fertility status of cultivated land in Zhaoyuan County for the years 2008 and 2020. The temporal changes in soil fertility during the study period were systematically analyzed (Figure 10). In 2008, the central and western parts of the county exhibited relatively low soil fertility, whereas the southeastern region demonstrated comparatively higher fertility levels. By 2020, the overall soil fertility of cultivated land in Zhaoyuan County improved, with the soil fertility index increasing from 0.469 in 2008 to 0.653. The spatial distribution pattern of soil fertility remained largely unchanged compared to 2008, suggesting a stable spatial structure throughout the study period. From the perspective of changes in the soil fertility index of cultivated land, the cultivated land soil fertility in Minyi Township in the southwest of Zhaoyuan County improved most significantly, while the soil fertility of cultivated land in the southeast of the county has shown a downward trend. In the southwestern part of Zhaoyuan County, the main crop rotation pattern is rice–soybean–maize–others. This area is close to rivers, and the flushing effect of the rivers has a desalination effect on the cultivated land in this region. The combined effect of crop rotation and river flushing effectively reduced the soil pH value in the saline-alkali areas, thereby significantly enhancing the fertility of the cultivated land. The decline in soil fertility in the southeastern farmland can be attributed to the rice–soybean–maize rotation system practiced in the region. Within this system, the nitrogen-fixing capacity of soybeans results in a progressive accumulation of soil nitrogen content, which shifts soil pH from neutral to acidic conditions, ultimately leading to a reduction in soil fertility.
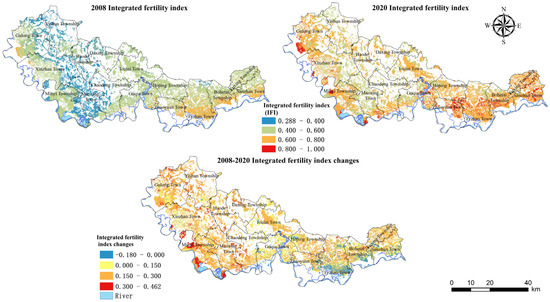
Figure 10.
Spatial distribution of soil fertility and its changes in 2008 and 2020.
3.3.2. The Influence of Different Crop Combinations in the Rotation System on Soil Fertility
The effectiveness of different crop rotation patterns in enhancing soil fertility in cultivated land, ranked from highest to lowest, is as follows (Figure 11): soybean–other crops rotation > rice–soybean–other crops rotation > rice–soybean rotation > soybean–maize–other crops rotation > maize–other crops rotation > soybean–maize rotation > rice–other crops rotation > rice–soybean–maize–other crops rotation > rice–maize–other crops rotation > rice–soybean–maize rotation > rice–maize rotation.
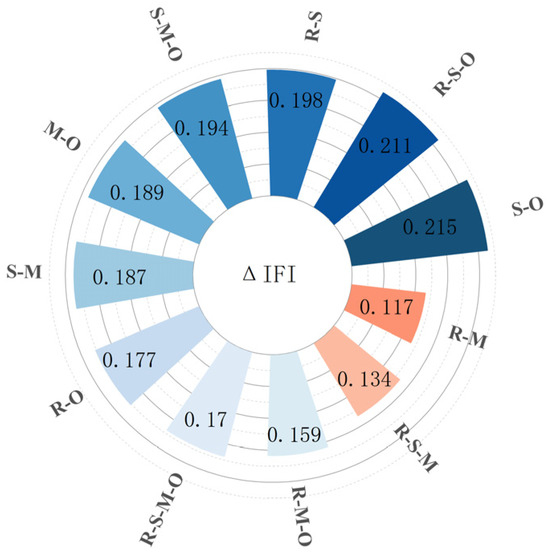
Figure 11.
Changes in soil fertility of different crop combinations from 2008 to 2020. R-S: rice–soybean rotation; R-S-M: rice–soybean–maize rotation; R-S-M-O: rice–soybean–maize–other crops rotation; R-S-O: rice–soybean–other crops rotation; R-M: rice–maize rotation; R-M-O: rice–maize-other crops rotation; R-O: rice–other crops rotation; S-M: soybean–maize rotation; S-M-O: soybean–maize–other crops rotation; S-O: soybean–other crops rotation; and M-O: maize–other crops rotation.
Based on variations in the soil fertility index, a cluster analysis was conducted on different crop rotation patterns, which were categorized into three groups: those with relatively high soil fertility improvement, those with moderate improvement, and those with general improvement. The group with relatively high soil fertility improvement includes the following rotation patterns: rice–other crops rotation, rice–soybean–other crops rotation, rice–soybean rotation, soybean– maize–other crops rotation, maize–other crops rotation, and soybean–maize rotation. The group showing moderate improvement consists of rice–other crops rotation, rice–soybean–maize–other crops rotation, and rice–maize–other crops rotation. The group with general improvement includes rice–soybean–maize rotation and rice–maize rotations rotation.
Research findings indicate that crop rotation patterns involving soybeans have a relatively significant impact on improving soil fertility. Soybeans, through nitrogen fixation by rhizobia, reduce the dependency on synthetic nitrogen fertilizers. Furthermore, their root systems secrete organic acids that can lower soil pH and promote the mobilization of soil phosphorus, thereby contributing to the maintenance of the soil nutrient balance.
3.3.3. The Influence of Different Rotation Frequencies and Continuous Cropping Years in the Rotation System on Soil Fertility
The effects of different rotation frequencies on soil fertility improvement in cultivated land, ranked from greatest to least, are as follows (Figure 12): low-frequency rotation > medium-frequency rotation > high-frequency rotation. Research has shown that low-frequency rotation has a more pronounced effect on enhancing soil fertility. This is because a lower crop replacement frequency helps maintain the stability of the soil–crop system, facilitates a better alignment between soil nutrient supply and crop nutrient uptake, and promotes the accumulation of soil organic matter and improved nutrient availability. In contrast, high-frequency rotation, characterized by frequent crop changes, may disrupt the release and balance of soil nutrients.
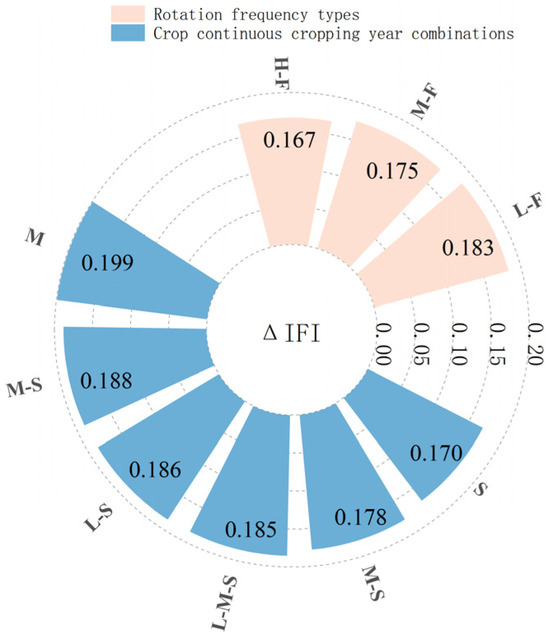
Figure 12.
Changes in soil fertility from 2008 to 2020 under different rotation frequencies and continuous planting years. L-F: low-frequency rotation; H-F: high-frequency rotation; and M-F: medium-frequency rotation. M: medium-term continuous cropping; M-S: medium-term continuous cropping—short-term continuous cropping; S: short-term continuous cropping; L-M: long-term continuous cropping—medium-term continuous cropping; L-M-S: long-term continuous cropping—medium-term continuous cropping—short-term continuous cropping; and L-S: long-term continuous cropping—short-term continuous cropping.
The effects of different rotation patterns with various continuous cropping years on the improvement of soil fertility in cultivated land, from greatest to least, are as follows: medium-term continuous cropping > long-term continuous cropping—medium-term continuous cropping > long-term continuous cropping—short-term continuous cropping > long-term continuous cropping—medium-term continuous cropping—short-term continuous cropping > medium-term continuous cropping—short-term continuous cropping > short-term continuous cropping. The medium-term continuous cropping pattern has a relatively good effect on improving soil fertility, with the same crop being continuously planted for 4 to 6 years. A reasonable crop rotation cycle not only enables crops to continuously obtain nutrients from the soil, but also avoids the excessive consumption of specific nutrients caused by long-term continuous cropping.
4. Discussion
4.1. Classification of Crop Rotation Patterns
The results of crop type identification based on 13 years of remote sensing imagery indicate that actual agricultural practices tend toward flexible crop rotation, rather than strictly adhering to fixed cycles or sequences, which are relatively uncommon. This study selected crop combinations, rotation frequency, and the number of consecutive years a single crop is planted as the key criteria for classifying rotation patterns. The rationale for this selection lies in the fact that different crops vary in their nutrient requirements, root system architecture, and resistance to pests and diseases. These differences lead to varying impacts on soil fertility depending on the crop combinations used in rotation [43]. Therefore, considering the complementary interactions among crops, this study prioritized crop combinations as the primary classification basis for rotation patterns. Rotation frequency reflects the temporal dynamics of crop alternation and directly influences the recovery cycles of soil physicochemical properties and microbial communities, thereby affecting soil fertility restoration and maintenance. The number of consecutive years a crop is planted serves as a key indicator for assessing the impact of long-term monoculture on the sustainability of soil ecosystems. Prolonged monoculture often leads to imbalances in soil nutrient composition. Thus, scientifically managing the crop rotation cycle is a crucial strategy for preventing soil fertility decline.
The findings of this study indicate that in Zhaoyuan County, paddy-upland rotation, and upland rotation are the dominant planting patterns. Paddy-upland rotation in Zhaoyuan County is predominantly found along the banks of the Songhua River and the Nenjiang River, as well as in the eastern regions, whereas upland rotation is mainly distributed in the central and western parts of the county. In Zhaoyuan County, a significant proportion of cultivated land implements rotation patterns such as soybean–maize–others and rice–soybean–maize–others. The formation and spatial distribution of these rotation models are primarily shaped by a combination of factors, including regional water availability, fluctuations in grain market prices, and agricultural subsidy policies [44]. A relatively high proportion of cultivated land in Zhaoyuan County adopts low-frequency rotation patterns, which are mainly concentrated along the banks of the Songhua River and the Nenjiang River, as well as in the northeastern part of the county. This is attributed to the region’s abundant water resources and long-established traditional farming practices, which encourage local farmers to maintain a relatively low rotation frequency. In Zhaoyuan County, the main combinations of consecutive cropping years are medium-term continuous cropping—short-term continuous cropping and long-term continuous cropping—short-term continuous cropping. Among them, the medium-term continuous cropping—short-term continuous cropping rotation pattern shows a scattered spatial distribution, while the long-term continuous cropping—short-term continuous cropping rotation pattern is concentrated, mainly along the banks of the Songhua River and Nenjiang River and in the northeastern part of the county. The formation of these rotation patterns is mainly influenced by traditional planting habits and the dynamic changes in precipitation.
4.2. The Influence of Crop Rotation Patterns on the Chemical Properties of Cultivated Soil in Saline-Alkali Areas
Through an analysis of the impacts of different cropping rotation patterns on the chemical properties of cultivated land soil, this study reveals that within the cropping rotation system, different crop combinations have a relatively notable influence on various soil chemical properties. By contrast, among cropping rotation patterns featuring different combinations of rotation frequencies and continuous cropping durations, the differences in their effects on individual soil chemical properties are relatively minor.
(1) In the crop combinations within the crop rotation system, rotation patterns involving soybeans exhibit a relatively significant effect on soil pH and total phosphorus content. Soybeans produce organic acids through symbiotic nitrogen fixation by rhizobia. These organic acids acidify the rhizosphere environment, resulting in a decrease in soil pH and promoting the dissolution and release of poorly soluble phosphorus in the soil. Previous studies also supported this finding. Li Ran et al. [45] reported that rice–soybean rotation significantly increased soil total nitrogen content while reducing soil pH. This study further extended the research perspective to the rotation systems composed of soybeans and different crops, confirming that the impact of soybeans on soil pH is not limited to specific rotation combinations, but has a certain universal pattern of action. In addition, soybean rhizobia fix nitrogen and produce organic acids, which not only further acidify the soil environment, but also activate phosphorus accumulated in the soil, thereby enhancing phosphorus availability [46].
(2) The crop rotation pattern involving rice within the rotation system has a significant impact on increasing soil organic matter and total nitrogen content. Water–dryland rotation generates a unique redox environment through the periodic alternation of wet and dry conditions. The anaerobic conditions during the flooded phase inhibit the rapid decomposition of organic matter and promote the formation and accumulation of humus, whereas the dryland phase accelerates the decomposition of crop straw and nitrogen release. This finding aligns with the research of Ou Y [47,48,49], who reported an increase in organic matter content in Chinese paddy soils over the past 30 years. This trend may be associated with the promotion of fallow rotation practices, straw incorporation into soil, and the application of compost and green manure. Furthermore, Pan Y et al. [50,51] support this view, suggesting that under water–land rotation, optimized crop configurations and integrated water and fertilizer management can influence soil nutrient levels and enhance soil organic matter content.
(3) The crop rotation pattern involving maize within the crop combination of the rotation system has a significant impact on the dynamic regulation of soil potassium. This mechanism primarily stems from maize being a high-potassium-uptake crop, which absorbs substantial amounts of potassium through its root system during growth and accumulates it in above-ground plant tissues. Subsequently, when maize stalks are returned to the field, the potassium is reintroduced into the surface soil in either organic or mineral forms, thereby increasing the total potassium content in the plough layer. This finding is supported by multiple studies. Research by Dandan Z et al. [52,53] indicates that implementing crop rotation combined with straw incorporation and scientific potassium fertilization can significantly enhance the levels of available and slow-release potassium in the soil. Zhang X et al. [54] found that long-term implementation of green manure–maize rotation increases both soil total potassium and organic matter content, further confirming that maize exerts a more pronounced influence on total soil potassium within the crop rotation system.
4.3. The Influence of Crop Rotation Patterns on the Fertility of Cultivated Soil
Comparative analysis of comprehensive soil fertility effects under different rotation patterns reveals that incorporating soybeans into crop combinations can significantly enhance the fertility of saline-alkali soils. This improvement is primarily achieved through the following mechanisms: (1) Optimization of soil’s physical and chemical properties mediated by root exudates. Low-molecular-weight organic acids secreted by soybean roots can significantly lower the pH of the rhizosphere soil. (2) Multi-dimensional improvement of soil structure. The multi-layered and dense root system of soybeans forms a surface absorption network. When rotated with deep-rooted crops, this can synergistically improve the soil’s physical structure, promote the formation of soil micro-aggregates, and enhance water retention capacity [55].
The effect of low-frequency crop rotation on improving comprehensive soil fertility is also significant. This is because a lower crop replacement frequency helps maintain the stability of the soil–crop system and promotes the synergistic interaction between soil nutrient mineralization and retention processes and crop nutrient uptake, thereby facilitating the accumulation of soil organic matter and enhancing nutrient availability. This finding underscores the importance of appropriately decreasing the frequency of tillage disturbance in the management of saline-alkali soils for the restoration of ecosystem functions. In contrast, the effect of high-frequency crop rotation on improving cultivated soil fertility is relatively limited. C. A. Campbell [56] reached a similar conclusion through long-term field experiments, finding that increasing the frequency of crop rotation did not significantly enhance the content of soil organic matter or other nutrients.
4.4. Recommendations and Limitations
Zhaoyuan County should formulate zonal crop rotation management strategies based on the characteristics of natural geographical differentiation. In the paddy-upland rotation zones along the Songhua River and Nenjiang River, it is advisable to adopt a low-frequency rotation pattern, such as rice–soybean or rice–soybean–other crop rotations. For the upland crop rotation areas in the eastern part, where maize cultivation is predominant, a low-frequency soybean–maize or maize–other crop rotation pattern is recommended. In the central upland crop rotation areas primarily dedicated to soybean cultivation, promoting a low-frequency rotation between soybeans and non-leguminous crops can effectively alleviate the negative effects of continuous cropping and help balance soil pH levels.
The primary limitation of this study is the lack of a complete framework for the comparative analysis of soil chemical element input–output fluxes, specifically manifested as follows:
(1) Absence of nutrient input flux data: Constrained by the heterogeneity of agricultural management at the farmer level, factors such as the amount of chemical fertilizer application, the fluctuations in organic fertilizer input, and the behavioral aspects such as growers’ risk preferences precluded the acquisition of continuous nutrient input data. As a result, it has not been possible to establish a complete element input–output balance model.
(2) Quantitative challenges in the output process. The flux of surface runoff migration and loss is influenced by multiple interacting factors, including rainfall intensity, soil slope, and drainage conditions. However, due to parameter uncertainties in existing hydrological–solute-coupled models, it remains difficult to achieve high-precision quantification of these fluxes.
In the future, typical plots with specific crop rotation patterns will be selected to establish long-term positioning observation stations. Nutrient input data will be recorded synchronously to deepen the research on the interaction mechanism between crop rotation patterns and fertilization management strategies.
5. Conclusions
This research focused on Zhaoyuan County, a typical saline-alkali region within the Songnen Plain. Through remote sensing technology, crop types were identified, and a crop change information atlas was constructed. Based on crop combinations, rotation frequencies, and consecutive planting durations, the crop rotation patterns were systematically classified. An in-depth exploration was carried out regarding the regulatory effects of different crop rotation patterns on the fertility of saline-alkali soil. The main conclusions are as follows:
(1) In Zhaoyuan County, the agricultural planting patterns predominantly feature paddy-upland rotation and upland rotation. Among these, the rotation combinations of “soybean—maize—other crops” and “rice—soybean—maize—other crops” account for the largest proportion of the implemented rotation areas. Regarding the rotation frequency, medium and low frequencies are the most common, while for the combination of crop continuous cropping periods, “medium-term continuous cropping—short-term continuous cropping” and “long-term continuous cropping—short-term continuous cropping” are the main types. The formation and distribution of these rotation patterns are influenced by multiple factors, including regional water resource conditions, fluctuations in grain market prices, and agricultural subsidy policies.
(2) There are remarkable differences in the regulatory effects of crop rotation patterns with different crop combinations on the soil pH and nutrient contents in saline-alkali lands. Among these, the rotation patterns with soybeans included in the crop combination exhibit the most pronounced effects in reducing soil pH and enhancing total phosphorus content. The rotation patterns incorporating rice in the crop combination can significantly boost soil organic matter and total nitrogen content. In contrast, the rotation patterns featuring maize in the crop combination demonstrate a more prominent regulatory impact on the variation in total potassium content. In contrast, for rotation patterns with different combinations of rotation frequencies and continuous cropping durations, the differences in their impacts on individual soil chemical indicators are not pronounced.
(3) The fuzzy comprehensive evaluation method confirmed that the implementation of crop rotation can enhance soil fertility, and the rotation pattern including soybeans has the most significant effect on improving soil fertility. Under different rotation frequencies, low-frequency rotation shows a relatively better improvement trend in the comprehensive score. This result clarifies the advantageous rotation model applicable to saline-alkali land improvement, providing a specific and feasible guidance direction for enhancing soil fertility in regional saline-alkali land.
In summary, this study, by uncovering the associative mechanisms between crop rotation patterns and soil fertility in saline-alkali lands, clearly defined the improvement effects of different rotation patterns and the most optimal matching types. This not only enriches the theoretical research on the agricultural utilization of saline-alkali lands, but also provides a scientific basis and practical guidance for enhancing the quality of cultivated land and promoting sustainable agricultural development in the saline-alkali regions of the Songnen Plain. It holds great significance for regional sustainable agricultural development and food security.
Author Contributions
H.Z.: writing–original draft and visualization and conceptualization and data curation and methodology and software. W.C.: writing–original draft and visualization and conceptualization and data curation and methodology and software. G.D.: review and editing and formal analysis and supervision and conceptualization. All authors have read and agreed to the published version of the manuscript.
Funding
This study was supported by National Key R&D Program of China (2024YFD1500901).
Institutional Review Board Statement
Not applicable.
Informed Consent Statement
Not applicable.
Data Availability Statement
The datasets presented in this article are not readily available because the data are not publicly available due to privacy or ethical restrictions.
Acknowledgments
The authors would like to acknowledge all experts’ contributions in the building of the model and the formulation of the strategies in this study.
Conflicts of Interest
The authors declare that they have no known competing financial interests or personal relationships that could have appeared to influence the work reported in this paper.
References
- Ajay, S. Soil salinity: A global threat to sustainable development. Soil Use Manag. 2021, 38, 39–67. [Google Scholar] [CrossRef]
- Minhas, P.S.; Ramos, T.B.; Ben-Gal, A.; Pereira, L.S. Coping with salinity in irrigated agriculture: Crop evapotranspiration and water management issues. Agric. Water Manag. 2020, 227, 105832. [Google Scholar] [CrossRef]
- Cuevas, J.; Daliakopoulos, I.N.; del Moral, F.; Hueso, J.J.; Tsanis, I.K. A Review of Soil-Improving Cropping Systems for Soil Salinization. Agronomy 2019, 9, 295. [Google Scholar] [CrossRef]
- Cao, W.; Gao, H.; Wang, X.; Chen, R.; Chai, C.; Liu, Z.; Zhao, X.; Liu, H. Effects of different fertilization measures on growth and yield of soybean in coastal saline-alkaline land. Jiangsu Agric. Sci. 2023, 51, 53–60. [Google Scholar] [CrossRef]
- Lian, F.; Zhang, F.; Wang, J. Vulnerability Assessment of Land-use under the Threat of Coastal Saline Alkali Area of Soil Salinization——A Case Study of Huanghua City in Hebei Province. J. Catastrophology 2015, 30, 209–215. [Google Scholar]
- Soda, N.; Ephrath, J.E.; Dag, A.; Beiersdorf, I.; Presnov, E.; Yermiyahu, U.; Ben-Gal, A. Root growth dynamics of olive (Olea europaea L.) affected by irrigation induced salinity. Plant Soil 2017, 411, 305–318. [Google Scholar] [CrossRef]
- Zhao, C.; Zhang, H.; Song, C.; Zhu, J.; Shabala, S. Mechanisms of Plant Responses and Adaptation to Soil Salinity. Innovation 2020, 1, 100017. [Google Scholar] [CrossRef] [PubMed]
- Xiao, W.; Wang, H.; Wang, M.; Wang, J. Mechanisms of Plant Response to Saline-alkali Stress: A Review. Chin. Agric. Sci. Bull. 2024, 40, 78–85. [Google Scholar]
- Wei, J.; Cai, Q.; Li, Y.; Shang, L.; Bu, X.; Yu, Z.; Ma, R. Research Progress on Response Mechanism of the Plant to Saline-Alkali Stress. Shandong Agric. Sci. 2022, 54, 156–164. [Google Scholar] [CrossRef]
- Wang, Q.; Deng, M.; Ning, S.; Sun, Y. Reality and problems of controlling soil water and salt in farmland. Adv. Water Sci. 2021, 32, 139–147. [Google Scholar]
- Food and Agriculture Organization of the United Nations. World Soil Day: FAO Highlights the Threat of Soil Salinization to Global Food Security. Available online: https://www.fao.org/newsroom/detail/world-soil-day-fao-highlights-threat-of-soil-salinization-to-food-security-031221/en (accessed on 5 July 2025).
- Liu, X.; Guo, K.; Feng, X.; Sun, H. Discussion on the agricultural efficient utilization of saline-alkali land resources. Chin. J. Eco-Agric. 2023, 31, 345–353. [Google Scholar]
- Cui, S.; Zhang, J.; Sun, M.; Chen, H.; Feng, Z. Leaching effectiveness of desalinization by rainfall combined with wheat straw mulching on heavy saline soil. Arch. Agron. Soil Sci. 2017, 64, 891–902. [Google Scholar] [CrossRef]
- Geng, Q.; Yan, H.; Yang, J.; Zhang, J.; Cheng, Y. Evaluation for Soil Improvement Effect of Open Ditch and Concealed Drainage Engineering on Saline Alkali Land Development. Chin. J. Soil Sci. 2019, 50, 617–624. [Google Scholar] [CrossRef]
- Wang, S.; Chen, Q.; Li, Y.; Zhuo, Y.; Xu, L. Research on saline-alkali soil amelioration with FGD gypsum. Resour. Conserv. Recycl. 2016, 121, 82–92. [Google Scholar] [CrossRef]
- Zhao, Y.; Wang, S.; Li, Y.; Liu, J.; Zhuo, Y.; Zhang, W.; Wang, J.; Xu, L. Long-term performance of flue gas desulfurization gypsum in a large-scale application in a saline-alkali wasteland in northwest China. Agric. Ecosyst. Environ. 2018, 261, 115–124. [Google Scholar] [CrossRef]
- He, K.; He, G.; Wang, C.; Zhang, H.; Xu, Y.; Wang, S.; Kong, Y.; Zhou, G.; Hu, R. Biochar amendment ameliorates soil properties and promotes Miscanthus growth in a coastal saline-alkali soil. Appl. Soil Ecol. 2020, 155, 103674. [Google Scholar] [CrossRef]
- Huang, J.; Shang, Y.; Chen, Y.; Xu, L.; Yang, Y.; Zhao, X. Analysis of Research Trends and Comprehensive Utilization Solutions for Saline–Alkali Land. Sustainability 2025, 17, 5202. [Google Scholar] [CrossRef]
- Tang, C.; Yang, J.; Xie, W.; Yao, R.; Wang, X. Effect of Biochar Application on Soil Fertility, Nitrogen Use Efficiency and Balance in Coastal Salt-Affected Soil under Barley–Maize Rotation. Sustainability 2023, 15, 2893. [Google Scholar] [CrossRef]
- Kumari, A.; Jha, B. Engineering of a novel gene from a halophyte: Potential for agriculture in degraded coastal saline soil. Land Degrad. Dev. 2019, 30, 595–607. [Google Scholar] [CrossRef]
- Chen, X.; Wu, J.; Opoku-Kwanowaa, Y. Effects of Returning Granular Corn Straw on Soil Humus Composition and Humic Acid Structure Characteristics in Saline-Alkali Soil. Sustainability 2020, 12, 1005. [Google Scholar] [CrossRef]
- Li, J.; Pu, L.; Han, M.; Zhu, M.; Zhang, R.; Xiang, Y. Soil salinization research in China: Advances and prospects. J. Geogr. Sci. 2014, 24, 943–960. [Google Scholar] [CrossRef]
- Yang, J.; Yao, R.; Wang, X.; Xie, W.; Zhang, X.; Zhu, W.; Zhang, L.; Sun, R. Research on Salt-affected Soils in China: History, Status Quo and Prospect. Acta Pedol. Sin. 2022, 59, 10–27. [Google Scholar]
- Liu, X. Reclamation and utilization of saline soils in water-scarce regions of Bohai Sea. Chin. J. Eco-Agric. 2018, 26, 1521–1527. [Google Scholar]
- Yun, P.; Gao, X.; Chen, L.; Lu, C.; Zhang, J.; Liu, R.; Wang, H.; Lin, G. Plant nitrogen utilization and soil nitrogen status in rhizosphere of maize as affected by various nitrogen rates in wheat-maize rotation system. J. Plant Nutr. Fertil. 2010, 16, 567–574. [Google Scholar]
- Zhang, J.; Wang, G.; Wu, B.; Jia, C.; Zhang, J.; Zhou, Y.; Ma, B. The Effects of Alfalfa-Triticale Rotation on Soil Bacterial and Fungal Community Diversity and Co-occurrence Network in Coastal Saline-Alkaline Soil. Ecol. Environ. Sci. 2024, 33, 1048–1062. [Google Scholar] [CrossRef]
- Liu, Q.; Zhao, Y.; Li, T.; Chen, L.; Chen, Y.; Sui, P. Changes in soil microbial biomass, diversity, and activity with crop rotation in cropping systems: A global synthesis. Appl. Soil Ecol. 2023, 186, 104815. [Google Scholar] [CrossRef]
- Yang, R.; Song, S.; Chen, S.; Du, Z.; Kong, J. Adaptive evaluation of green manure rotation for a low fertility farmland system: Impacts on crop yield, soil nutrients, and soil microbial community. Catena 2023, 222, 106873. [Google Scholar] [CrossRef]
- Wu, Y.; Wang, L.; Cui, Y.; Hao, X.; Wang, B.; Tian, X.; Li, X.; Qin, Y. Rice yield, quality, and soil fertility in response to straw incorporation and rotation pattern. J. Plant Nutr. Fertil. 2021, 27, 1926–1937. [Google Scholar]
- Guo, Y.; Cheng, M.; Zhao, X.; Hao, B.; Zhang, Y.; Cao, W.; Zheng, P. Effects of green manure rotation on soil properties and yield and quality of silage maize in saline-alkali soils. Chin. J. Eco-Agric. 2018, 26, 856–864. [Google Scholar] [CrossRef]
- Šeremešić, S.; Živanov, S.T.; Rajković, M.; Aćin, V.; Milić, S.; Babec, B.; Jovanović, S. Exploring Fungal Biodiversity in Crop Rotation Systems: Impact of Soil Fertility and Winter Wheat Cropping. Plants 2024, 14, 65. [Google Scholar] [CrossRef]
- Nuppenau, E.-A. Soil Fertility Management by Transition Matrices and Crop Rotation: On Spatial and Dynamic Aspects in Programming of Ecosystem Services. Sustainability 2018, 10, 2213. [Google Scholar] [CrossRef]
- Chongtham, I.R.; Bergkvist, G.; Watson, C.A.; Sandström, E.; Bengtsson, J.; Öborn, I. Factors influencing crop rotation strategies on organic farms with different time periods since conversion to organic production. Biol. Agric. Hortic. 2017, 33, 14–27. [Google Scholar] [CrossRef]
- Łukowiak, R.; Grzebisz, W.; Sassenrath, G.F. New insights into phosphorus management in agriculture—A crop rotation approach. Sci. Total Environ. 2016, 542, 1062–1077. [Google Scholar] [CrossRef]
- Cai, Y.; Hao, M. Effects of rotation model and period on wheat yield, nutrient uptake and soil fertility in the Loess Plateau. J. Plant Nutr. Fertil. 2015, 21, 864–872. [Google Scholar]
- Chen, S.; Yue, T.; Li, H. Studies on Geo-Informatic Tupu and its application. Geogr. Res. 2000, 19, 337–343. [Google Scholar]
- Lu, F.; Chu, Y.; Zhang, X. Spatiotemporal Knowledge Graph: Advances and Perspectives. J. Geo-Inf. Sci. 2023, 25, 1091–1105. [Google Scholar]
- Liao, K. The Discussion and Prospect for Geo-Informatic Tupu. J. Geo-Inf. Sci. 2002, 1, 14–20. [Google Scholar]
- Du, G.; Yao, L.; Han, L.; Bonoua, F. What Should Be Learned from the Dynamic Evolution of Cropping Patterns in the Black Soil Region of Northeast China? A Case Study of Wangkui County, Heilongjiang Province. Land 2023, 12, 1574. [Google Scholar] [CrossRef]
- Burgess, T.M.; Webster, R. Optimal interpolation and isarithmic mapping of soil properties: I The semi-variogram and punctual kriging. Eur. J. Soil Sci. 2019, 70, 11–19. [Google Scholar] [CrossRef]
- Wang, Y.; Huang, J.; Liu, K.; Han, T.; Du, J.; Ma, X.; Hao, X.; Zhou, B.; Liu, C.; Jiang, X.; et al. Evaluation and spatial variability of paddy soil fertility intypical county of northeast China. J. Plant Nutr. Fertil. 2020, 26, 256–266. [Google Scholar]
- Wang, Z.; Wang, S.; Xu, L.; Guo, Q.; Chen, Y.; Qiu, W.; Sun, J. Comparative Evaluation Methods of Comprehensive Soil Fertility in Jiangsu’s Coastal Saline–Alkali Land. Land 2025, 14, 469. [Google Scholar] [CrossRef]
- Zong, D.; Zhou, Y.; Zhou, J.; Zhao, Y.; Hu, X.; Wang, T. Soil microbial community composition by crop type under rotation diversification. BMC Microbiol. 2024, 24, 435. [Google Scholar] [CrossRef]
- Sara, R.; Amanda, C.; De Forest Whitney, B.; Bruce, L.; Luis, E.; Kassim, A.K.; Michelle, L.M.; Cameron, P. Crop Rotations in California Rice Systems: Assessment of Barriers and Opportunities. Front. Agron. 2022, 4, 806572. [Google Scholar] [CrossRef]
- Li, R.; Li, J.; Lin, S.; Xie, T.; Fan, P.; Wang, Q.; Li, T.; Wang, S. Effects of rice-soybean-rice rotation on soil physicochemicalproperties and microbial community. J. Trop. Biol. 2024, 15, 157–164. [Google Scholar] [CrossRef]
- Wang, Y.; Chen, X.; Shi, Y.; Lu, C. Review on the effects of low-molecular-weight organic acids on soil phosphorus activation and mechanisms. Chin. J. Ecol. 2018, 37, 2189–2198. [Google Scholar] [CrossRef]
- Li, D.; Huang, J.; Ma, C.; Xue, Y.; Gao, J.; Wang, B.; Zhang, Y.; Liu, K.; Han, T.; Zhang, H. Spatio-Temporal Variations of Soil Organic Matter in Paddy Soil and Its Driving Factors in China. Sci. Agric. Sin. 2020, 53, 2410–2422. [Google Scholar]
- Ou, Y.; Alain, N.R.; Wang, L.; Yan, B. Spatio-temporal patterns of soil organic carbon and pH in relation to environmental factors—A case study of the Black Soil Region of Northeastern China. Agric. Ecosyst. Environ. 2017, 245, 22–31. [Google Scholar] [CrossRef]
- Yang, F.; Xu, Y.; Cui, Y.; Meng, Y.; Dong, Y.; Ma, R.; Ma, Y. Variation of Soil Organic Matter Content in Croplands of China over the Last Three Decades. Acta Pedol. Sin. 2017, 54, 1047–1056. [Google Scholar]
- Pan, Y.; Wang, P.; Guo, Y.; Wang, Y.; Liu, S.; Zhang, Q.; Zhu, H.; Dai, L. Effects of Crop Allocation and Optimization of Fertilizer and Water on Crop Yield and Soil Nutrients under Paddy Rice-upland Crop Rotation. Southwest China J. Agric. Sci. 2018, 31, 276–283. [Google Scholar] [CrossRef]
- Zhang, S.; Ren, T.; Fang, Y.; Zhao, J.; Zhu, J.; Cong, W.; Lambers, H.; Lu, J. Enhancing soil labile organic matter through oilseed rape-rice rotation and straw returning in paddy-upland systems. Plant Soil 2025, 1–18. [Google Scholar] [CrossRef]
- Yang, W.; Luo, H.; Dong, E.; Wang, J.; Wang, Y.; Liu, Q.; Huang, X.; Jiao, X. Effects of Long-Term Fertilization and Deep Plough on Crop Potassium Utilization and Soil Potassium Forms in Maize-Sorghum Rotation System. Sci. Agric. Sin. 2024, 57, 2390–2403. [Google Scholar]
- Zhu, D.; Cong, R.; Ren, T.; Lu, Z.; Lu, J.; Li, X. Straw incorporation improved the adsorption of potassium by increasing the soil humic acid in macroaggregates. J. Environ. Manag. 2022, 310, 114665. [Google Scholar] [CrossRef]
- Zhang, X.; Yin, M.; Wang, Z.; Cheng, J.; Cheng, H.; Wang, W.; Yang, Y.; Wang, Y.; Su, Y.; Fu, L. Effects of long-term different green manure maize rotation on maize yield, nutrient absorption and soil fertility. Soil Fertil. Sci. China 2025, 17, 85–92. [Google Scholar]
- Dabessa, A.; Debala, C. Long-term soybean–maize rotation experiments in cereal-based farming systems at Bako, Western Ethiopia. Food Energy Secur. 2023, 12, e496. [Google Scholar] [CrossRef]
- Campbell, C.A.; Biederbeck, V.O.; Zentner, R.P.; Brandt, S.A.; Schnitzer, M. Effect of crop rotations and rotation phase on characteristics of soil organic matter in a Dark Brown Chernozemic soil. Can. J. Soil Sci. 1992, 72, 403–416. [Google Scholar] [CrossRef]
Disclaimer/Publisher’s Note: The statements, opinions and data contained in all publications are solely those of the individual author(s) and contributor(s) and not of MDPI and/or the editor(s). MDPI and/or the editor(s) disclaim responsibility for any injury to people or property resulting from any ideas, methods, instructions or products referred to in the content. |
© 2025 by the authors. Licensee MDPI, Basel, Switzerland. This article is an open access article distributed under the terms and conditions of the Creative Commons Attribution (CC BY) license (https://creativecommons.org/licenses/by/4.0/).