Article

Higher Emissions Scenarios Increase Wildland–Urban Interface Fire Hazard in China

1
Key Laboratory of Forest and Grassland Fire Risk Prevention, Ministry of Emergency Management, China Fire and Rescue Institute, Beijing 102202, China
2
College of Forestry, Northeast Forestry University, Harbin 150040, China
Sustainability 2025, 17(16), 7409; https://doi.org/10.3390/su17167409
Submission received: 20 July 2025 / Revised: 12 August 2025 / Accepted: 14 August 2025 / Published: 15 August 2025
(This article belongs to the Section Hazards and Sustainability)

Abstract

Climate change has intensified the occurrence of wildfires, increasing their frequency and intensity worldwide, and threatening sustainable development through ecological and socioeconomic impacts. Understanding the driving factors behind wildland–urban interface (WUI) fire events and predicting future wildfire hazards in WUI areas are essential for effective wildfire management and sustainable land-use planning. In this study, we developed a WUI fire hazard prediction model for China using machine learning techniques. Diagnostic attribution analysis was employed to identify key drivers of WUI fire hazards. The results revealed that the random forest-based WUI fire hazard model outperformed other models, demonstrating strong generalization capability. SHapley Additive exPlanations analysis revealed that meteorological factors are the primary drivers of WUI fire hazards. These factors include temperature, precipitation, and relative humidity. We further examined the evolution of WUI fire hazards under historical and future climate change scenarios. During the historical baseline period (1985–2014), regions classified as moderate and high hazards were concentrated in southern China. These regions include East China, South Central China, and Southwest China. Climate change exacerbates future WUI fire hazards in China. Projections under the high emission scenario (SSP5–8.5) indicate a rapid increase in WUI fire hazard indices in northern China by the end of the 21st century. Concurrently, the gravity center of high hazard areas is predicted to shift northward, accompanied by a substantial expansion in their area coverage. These findings highlight an urgent need to reorient fire management resources toward northern China under high-emission scenarios. Our findings establish a predictive framework for WUI fire hazards and emphasize the urgency of implementing climate-adaptive management strategies aligned with future hazard patterns. These strategies are critical for enhancing sustainability by reducing fire-related ecological and socioeconomic losses in WUI areas.

1. Introduction

The wildland–urban interface (WUI), where wildfire exposure risk is most pronounced [1], remains a persistent global wildfire management priority [2]. This transitional zone exhibits higher fuel density than urban areas while experiencing more intensive human activities than natural landscapes. Consequently, WUI fires frequently cause substantial economic losses and significant human casualties [3]. Despite constituting a mere 4.7% of the global land area, the WUI comprises nearly half the world’s population (3.5 billion people) [4]. The global expansion of WUI areas [1] has intensified wildfire risk [5]. This spatial growth pattern exposes growing populations and infrastructure to heightened wildfire threats [6], raising concerns about wildfire management worldwide. China’s rapid economic growth has driven widespread urbanization. This transformation has reshaped regional landscapes. Concurrently, the national drive toward ecological civilization and the development of forest cities have spurred a marked proliferation of WUI areas [7,8]. In recent years, several catastrophic WUI fires have occurred in China. The 2019 Qipanshan fire in Liaoning Province required the emergency evacuation of 16,690 residents [9]. Moreover, the 2020 Sichuan Province wildfire caused 19 fatalities and mandated evacuation within a 5 km radius. These incidents demonstrate the substantial public safety risks posed by WUI fires.
Wildfire occurrence is driven by fire weather patterns, atmospheric dynamics, and long-term climatic shifts [10,11,12,13]. These natural drivers are now globally amplified by anthropogenic pressures and contemporary climate change, exacerbating both fire frequency and severity [14,15]. Accurately predicting future wildfire patterns under evolving climatic scenarios has become essential for effective hazard mitigation. However, the WUI involves interactions between artificial and natural factors, including meteorological conditions, vegetation type, topography, and anthropogenic factors [16,17,18,19,20]. This complexity means WUI fire occurrence and its drivers are more diverse and spatially/temporally variable [21,22]. This complexity poses exceptional challenges for WUI fire hazard modeling. Traditional modeling approaches, exemplified by the fire weather index [23], focus primarily on meteorological parameters. The exclusion of critical vegetation dynamics and anthropogenic influences substantially constrains predictive accuracy and operational utility. Advances in big data and remote sensing technologies, particularly the exponential growth of fire driver datasets [24], have enabled machine learning (ML) to deliver enhanced predictive capabilities for wildfire hazards. ML applications in wildfire research have undergone accelerated adoption in recent years [25], particularly because of their efficacy in modeling complex nonlinear systems [26,27].
The WUI represents the highest wildfire risk exposure zone for human populations [5,28]. This designation has elevated WUI management to a critical global wildfire policy priority, particularly in fire-prone nations including the United States [19,20,29], Canada [17], Australia [30], and multiple European countries [31]. In contrast, China’s scientific focus on WUI fire dynamics remains underdeveloped. Currently, China mainly focuses on analyzing fire risk in forest or grassland areas, with less research on quantitative assessment at the landscape scale. Traditional methods primarily utilize models such as probabilistic statistics or weighted hierarchical analyses to statistically classify the probability of fire occurrence [9,32]. These static frameworks are insufficient for addressing the dynamic nature of WUI fire hazards. Current research predominantly concentrates on modeling WUI fire occurrence or evaluating static risk within monotemporal frameworks [9]. A critical gap persists in systematic analyses of long-term WUI fire hazard evolution under climate change scenarios. Accelerated global warming drives transformative shifts in China’s land-use patterns and anthropogenic activities [8]. These changes amplify WUI fire susceptibility through synergistic feedback mechanisms. Thus, developing dynamic assessment frameworks for WUI fire hazards under climate change scenarios constitutes an urgent research priority.
We hypothesize that although a variety of physical, biological, and human factors contribute to fires, meteorological factors should be the most important drivers of WUI fire hazards in China under future climate change scenarios. This study focuses on fire hazard prediction and assessment in Chinese WUI regions under climate change conditions on the basis of previous work on WUI identification and zoning in China [8]. Specifically, we construct a fire hazard prediction model by integrating meteorological, vegetation, socioeconomic, and fire history data to reveal the dynamic effects of future climate change on WUI fire hazards. Addressing these issues helps demonstrate the dynamic changes and driving mechanisms of WUI fires. This study provides theoretical support and a data basis for China’s scientific response to fire risk in the context of climate change.

2. Materials and Methods

2.1. Study Area

The study encompassed mainland China, which was partitioned into six geographical divisions: Northeast (NE), North China (NC), East China (EC), South Central China (SCC), Northwest (NW), and Southwest (SW). For descriptive purposes, the following terms are used: eastern China (including NE, NC, EC, and SCC), western China (SW and NW), northern China (NE, NC, and NW), and southern China (EC, SCC, and SW). As reported in the 2022 China Land Greening Status Bulletin, China’s forest area covers 231 million hectares. This represents 24.02% of the nation’s total land area. The vegetation distribution exhibited distinct regional patterns: coniferous–broadleaf forests dominated NE, EC, SCC, and SW; grasslands prevailed in NC, NW, and SW; and croplands were concentrated in western NE, southern NC, western EC, and eastern SW.
Acquiring WUI fire data across the study area requires the development of a localized WUI identification model. Our methodology implemented the FAO’s spatial delineation framework [33], which defines WUI as “urban–wildland buffer overlap zones.” Using historical WUI fire cases throughout China, we quantified buffer distances as a critical parameter for WUI delineation. This process established WUI buffers that effectively encompassed 90% of historical fire incidents [8]. Building upon these published findings, we generated a map of China’s WUI spatial distribution (Figure 1). Higher WUI densities occur in economically developed, densely populated regions, predominantly within southeastern China.

2.2. Data

Wildfire data originated from the State Forestry and Grassland Administration’s Satellite Monitoring Center. These ground-validated fire monitoring datasets ensure reliability. On the basis of the results of a previous study [8], we obtained Chinese WUI area and WUI fire point data. We used 16 variables as predictors:
  • Meteorological data, including average air temperature (TMP), maximum air temperature (TMX), minimum air temperature (TMN), wind speed (WIN), relative humidity (RH), total precipitation (PRE), were obtained from national-level surface meteorological observation stations. These data were screened according to the proportion of missing elements (not higher than 5%) during the study period at each station. After screening, the remaining 2207 valid stations were corrected for anomalies and missing values and interpolated via multilinear regression analysis [34]. The vapor pressure deficit (VPD), which can be directly calculated from the temperature, indicates the extent to which the actual air is far from the water vapor saturation state, i.e., the degree of atmospheric aridity [35], and was obtained via empirical formulae [36].
  • China’s digital elevation model (DEM) derived from Shuttle Radar Topography Mission (SRTM) data (http://srtm.csi.cgiar.org (accessed on 25 June 2025)). Using ArcGIS 10.8, we extracted elevation (ELE), slope, and aspect values. The aspect ( α , in degrees) was converted to a southwestness index (SWI) with a value between −1 and 1, indicating the degree to which the slope is oriented to the southwest, i.e., receives the maximum potential insolation [37,38].
    S o u t h w e s t n e s s = 1 × c o s ( r a d i a n s ( α 45 ) )
  • The MODIS satellite variables provided normalized vegetation index (NDVI) and gross primary productivity (GPP) data.
  • Road distance (RD) and housing density (HD) originated from China’s National Geographic Information Resource Catalog System (http://www.webmap.cn (accessed on 25 June 2025)).
  • The annual population density (PD) was derived from WorldPop (https://hub.worldpop.org/ (accessed on 25 June 2025)).
  • Annual gross domestic product (GDP) data were sourced via Zenodo (https://www.zenodo.org/ (accessed on 25 June 2025)).
In addition, to predict WUI fire hazard under different future climate change scenarios, future climate model data from CMIP6 (data source: https://esgf-node.ipsl.upmc.fr/search/cmip6-ipsl/ (accessed on 25 June 2025)) were selected, in which three scenarios, SSP1-RCP2.6, SSP2-RCP4.5, and SSP5-RCP8.5, represent three pathways of sustainable, moderate, and conventional development, respectively. Four highly accurate CMIP6 models in China, CMCC-CM2-SR5, EC-Earth3, CanESM5, and EC-Earth3-Veg-LR, which have more complete historical and future scenario data releases, were selected [39,40]. However, owing to the uncertainties in the parameterization and structure of the existing models, some differences in the simulation results among the Earth system models exist [41,42]. To reduce the uncertainty of model simulations, this study adopted the traditional multi-model ensemble (MME) method, which integrates models through arithmetic averaging [43,44,45,46]. This method follows IPCC best practices, treating all models equally to reduce subjective bias in the absence of regional performance-weighted consensus [47]. The calculation method is as follows:
M M E = 1 M n = 1 M M o d n ,
where M is the total number of modes in the set of participating modes and where M o d n is the modal simulation result of the nth participating mode set.
The most recent 30 years (1985–2014) were used as the historical baseline, and 2021–2050 (mid-21st century) and 2071–2100 (end-21st century) were selected as the forecast periods. The spline spatial interpolation method was used to interpolate the historical observation data, and the bias correction method Equation (3) was used to correct the meteorological elements of different models under different scenarios.
X r d = P p r j _ d × ( P o b s d ¯   ÷   P p r j _ d ¯ ) T p r j _ d × ( T o b s d ¯ T p r j _ d ¯ ) ,
where X r d represents the corrected meteorological factors, d takes values of 1–366, P o b s _ d ¯ and T o b s d ¯ represent the historical average values of precipitation and other meteorological factors on day d, respectively; P p r j _ d ¯ and T p r j _ d ¯ represent the average values of precipitation, and other meteorological factors predicted for climate change on day d in the future; and P p r j _ d and T p r j _ d represent the predicted values of precipitation and other meteorological factors predicted for climate change on day d, respectively.

2.3. Hazard Assessment

Fire hazard is the likelihood of a particular potential disaster occurring at a given time and area [48,49]. Synthesizing the fire hazard as defined by Pettinari and Chuvieco [50], we assume that the occurrence of WUI fires within a single pixel has some randomness. In contrast, the same image element may have multiple fires within a certain period, and the probability weights for the occurrence of fires in that element have some certainty. From a machine learning standpoint, we define the fire hazard for any image element as the weight magnitude associated with the fire occurrence probability. This probability is dependent on the observed fire driver values. We quantify it via the kernel density [51,52]. Kernel density estimation (KDE) provides a nonparametric approach to estimate probability density functions. For a given image element, multiple fires occurring successively at different times have higher values of kernel density weights, indicating that the predictor variables in the area are highly correlated with the hazard of fire occurrence. It is defined as follows:
λ b s = 1 c b ( s ) i = 1 n k i b ( s s i ) ,
where s1…, sn denote the observed values of the attribute variables at n points in space; λb (s) is the density of the space at point s; kib denotes the kernel strength; and cb denotes the edge correction factor.
Kernel density maps of WUI fire points (2008–2020) were generated alongside annual impact factor datasets. To ensure spatial consistency, we established a 0.25° × 0.25° grid network across the study area, assigning all variables to grid cells. After data cleaning, 6821 valid samples were obtained. These data were split into training (70%) and testing sets (30%) for model development. A random search with fivefold cross-validation was used to optimize the hyperparameters. This study implemented multiple machine learning algorithms: support vector machine (SVM), random forest (RF), gradient boosting variants (XGBoost, LightGBM), and multilayer perceptron (MLP). Briefly, these models operate as follows: the SVM finds optimal hyperplanes for classification/regression, handling high-dimensional nonlinear data but being parameter-sensitive. RF, an ensemble of decision trees, reduces overfitting via bootstrap sampling and random feature selection, with strong generalizability. XGBoost uses gradient boosting with regularization and parallel computing, which excels with imbalanced/high-dimensional data. LightGBM, a gradient boosting variant, employs histogram algorithms and leafwise growth for faster training on large datasets. MLP, an artificial neural network with input/hidden/output layers, captures nonlinear patterns via backpropagation. Model performance was evaluated via four metrics [53]: coefficient of determination (R2), mean absolute error (MAE), root mean square error (RMSE), and the concordance correlation coefficient (CCC). SHAP summary plots visualized feature contributions [54]. We conducted all the statistical analyses via R software version 4.2.2. The computational environment was consistently maintained throughout this study.

2.4. Statistical Analysis

Using established risk analysis frameworks [55,56], we quantified the evolution of WUI fire hazards under climate change. The temporal change rate of the WUI fire hazard index was determined as follows:
σ   =   R c i R n o r m a l i S D R n o r m a l , R c     R n o r m a l < 0 , R c   <   R n o r m a l ,
where Rci and Rnormali denote the WUI fire hazard indices of the ith raster under different future radiation stress intensities and the base scenario, respectively, and SDRnormal denotes the standard deviation of the WUI fire hazard index under the base scenario for the region with increased WUI fire hazard. σ denotes the change in the WUI fire hazard index, which indicates an increase in WUI fire hazard when Rc > Rnormal and, a decrease in WUI fire hazard when Rc < Rnormal.
We employed the Jenks Breaks method to classify WUI fire hazard levels, enabling detailed characterization of high-risk area evolution. Spatial distribution patterns were analyzed via standard deviation ellipse (SDE) methodology [57]. This technique quantifies directional bias in China’s high hazard zones through four core parameters: centroid coordinates, major/minor axes, and azimuthal orientation. SDE computations in ArcGIS 10.8 utilized Equations (6)–(8):
X ¯ = i = 1 n w i x i i = 1 n w i , Y ¯ = i = 1 n w i y j i = 1 n w j ,
tan θ = i = 1 n w i 2 x i 2 ¯ i = 1 n w i 2 y i 2 ¯ + i = 1 n w i 2 x i 2 ¯ i = 1 n w i 2 y i 2 ¯ 2 + 4 i = 1 n w i 2 x i 2 ¯ y i 2 ¯ 2 i = 1 n w i 2 x i ¯ y i ¯ ,
δ x = i = 1 n ( w i x i ¯ c o s θ w i y i ¯ s i n θ ) 2 i = 1 n w i 2 , δ y = i = 1 n ( w i x i ¯ s i n θ w i y i ¯ c o s θ ) 2 i = 1 n w i 2 ,
where i is the grid cell, n is the total number of grid cells; w i is the weight of the ith grid cell, which represents different levels of WUI fire hazard values; X ¯ and Y ¯ are the coordinates of the center of gravity of the standard deviation ellipse; x i and y i are the coordinates of the center of the grid cell; x i ¯ and y i ¯ are the horizontal coordinates of the center point of the grid cell and the vertical coordinates of the center of gravity of the coordinates of the deviation; θ is the azimuthal angle of the ellipse; and δ x and δ y are the standard deviations of the x-axis and y-axis, respectively.

3. Results

3.1. Evaluation of Machine Learning Methods

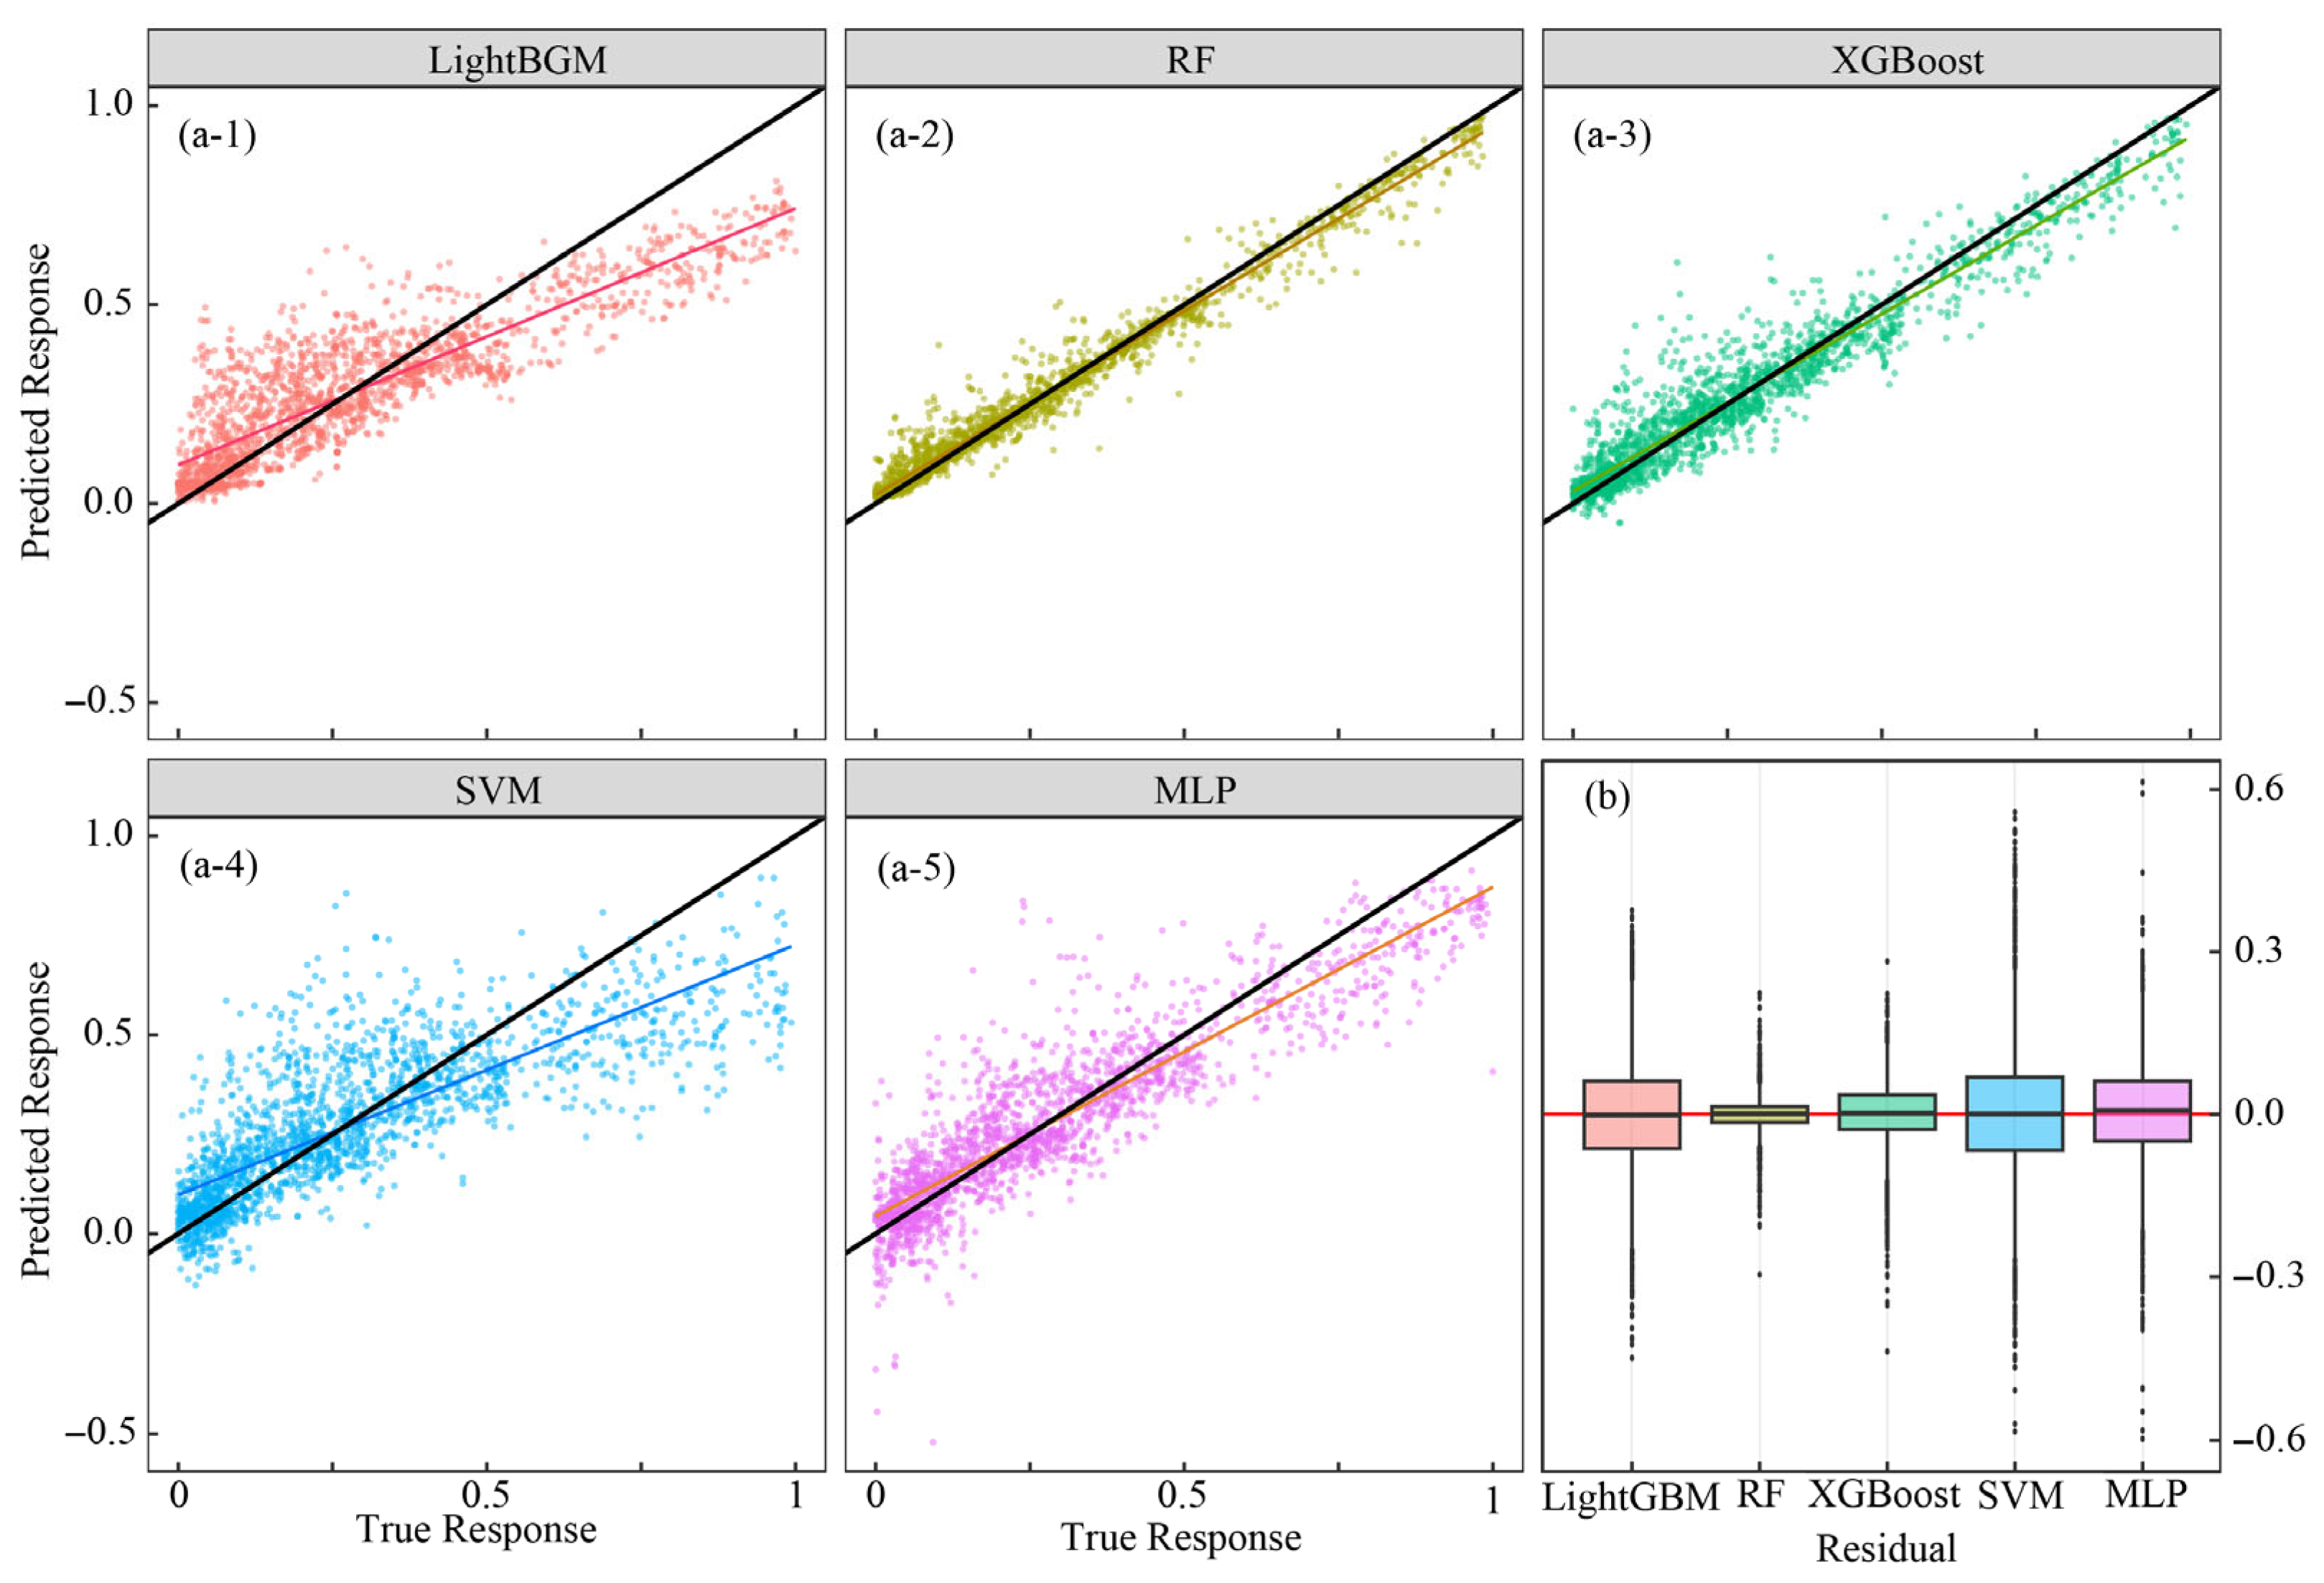
This study establishes a machine learning framework to predict fire hazards across China’s WUI. The model quantified the relative contributions of 16 critical drivers spanning four domains: meteorological conditions, vegetation characteristics, topographic features, and anthropogenic activities. The evaluation metrics demonstrated distinct model performance variations (Table 1). The random forest (RF) model demonstrated the highest predictive accuracy among all the models tested. The coefficient of determination (R2) was 0.974 and the concordance correlation coefficient (CCC) was 0.985. This model also showed the lowest errors: root mean squared error (RMSE) = 0.0405 and mean absolute error (MAE) = 0.0254. The XGBoost model ranked second, with R2 > 0.9 and CCC > 0.9. The LightGBM and multilayer perceptron (MLP) models showed moderate performance (R2 > 0.76, CCC > 0.83). In contrast, the support vector machine (SVM) model underperformed across all the metrics (R2 = 0.634, CCC = 0.774). Figure 2 visually contrasts model predictions and residual distributions across the test dataset, further elucidating performance disparities.
Figure 2 shows that the random forest model achieves optimal fitting performance between the observed and predicted values, closely aligning with the y = x reference line (Figure 2a-1–a-5). This model resulted in the smallest residual values among all the compared methods, as evidenced by the residual distribution in Figure 2b. These results indicate that the random forest-based WUI fire hazard model possesses strong generalizability.
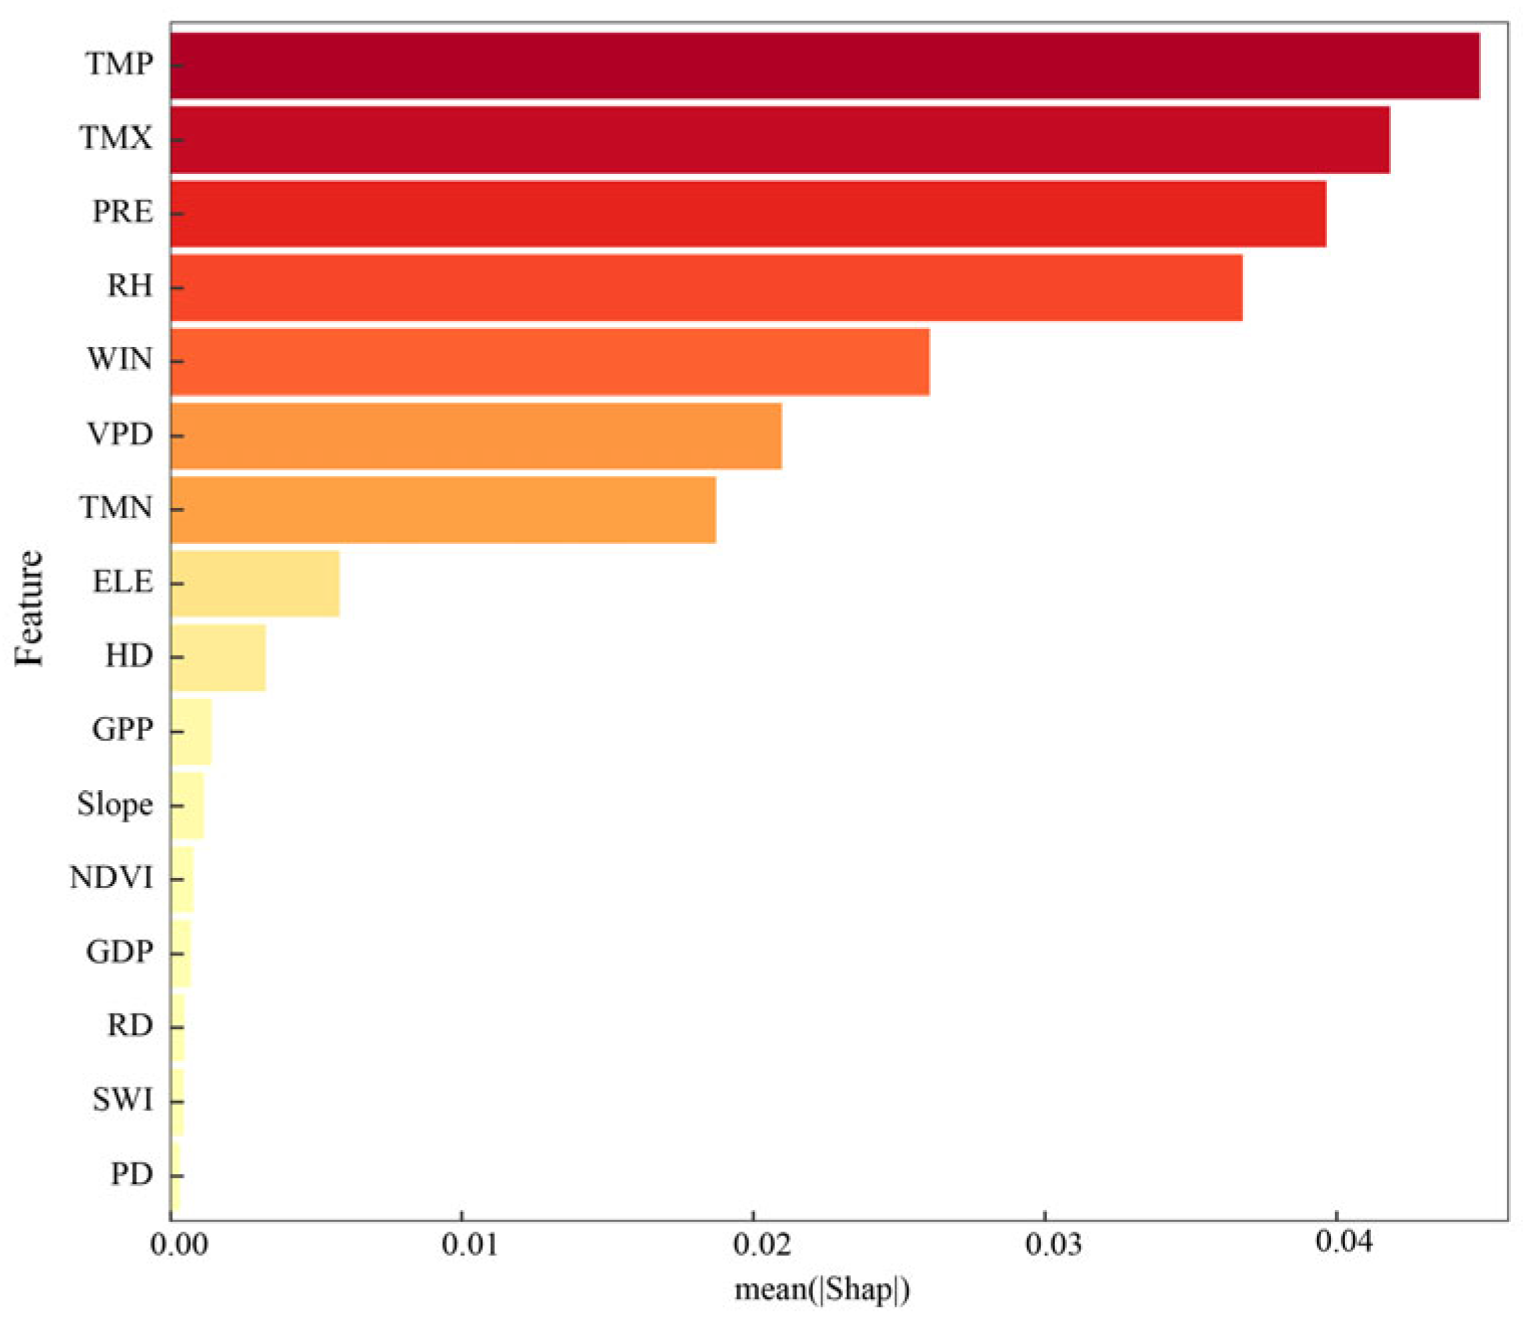
We identified key predictive drivers among all the input variables for the burned pixels in the test sets. SHAP analysis quantified each feature’s marginal contribution. Figure 3 ranks the top 16 covariates by SHAP importance. We find that the most significant factors affecting fire hazard in the WUI are meteorological factors, with the greatest contribution from hydrothermal conditions such as average air temperature, maximum air temperature, precipitation, relative humidity, and wind speed. In contrast, anthropogenic factors (e.g., road density and population density) and vegetation characteristics (e.g., NDVI) have relatively lower contributions.

3.2. WUI Fire Hazard Characteristics

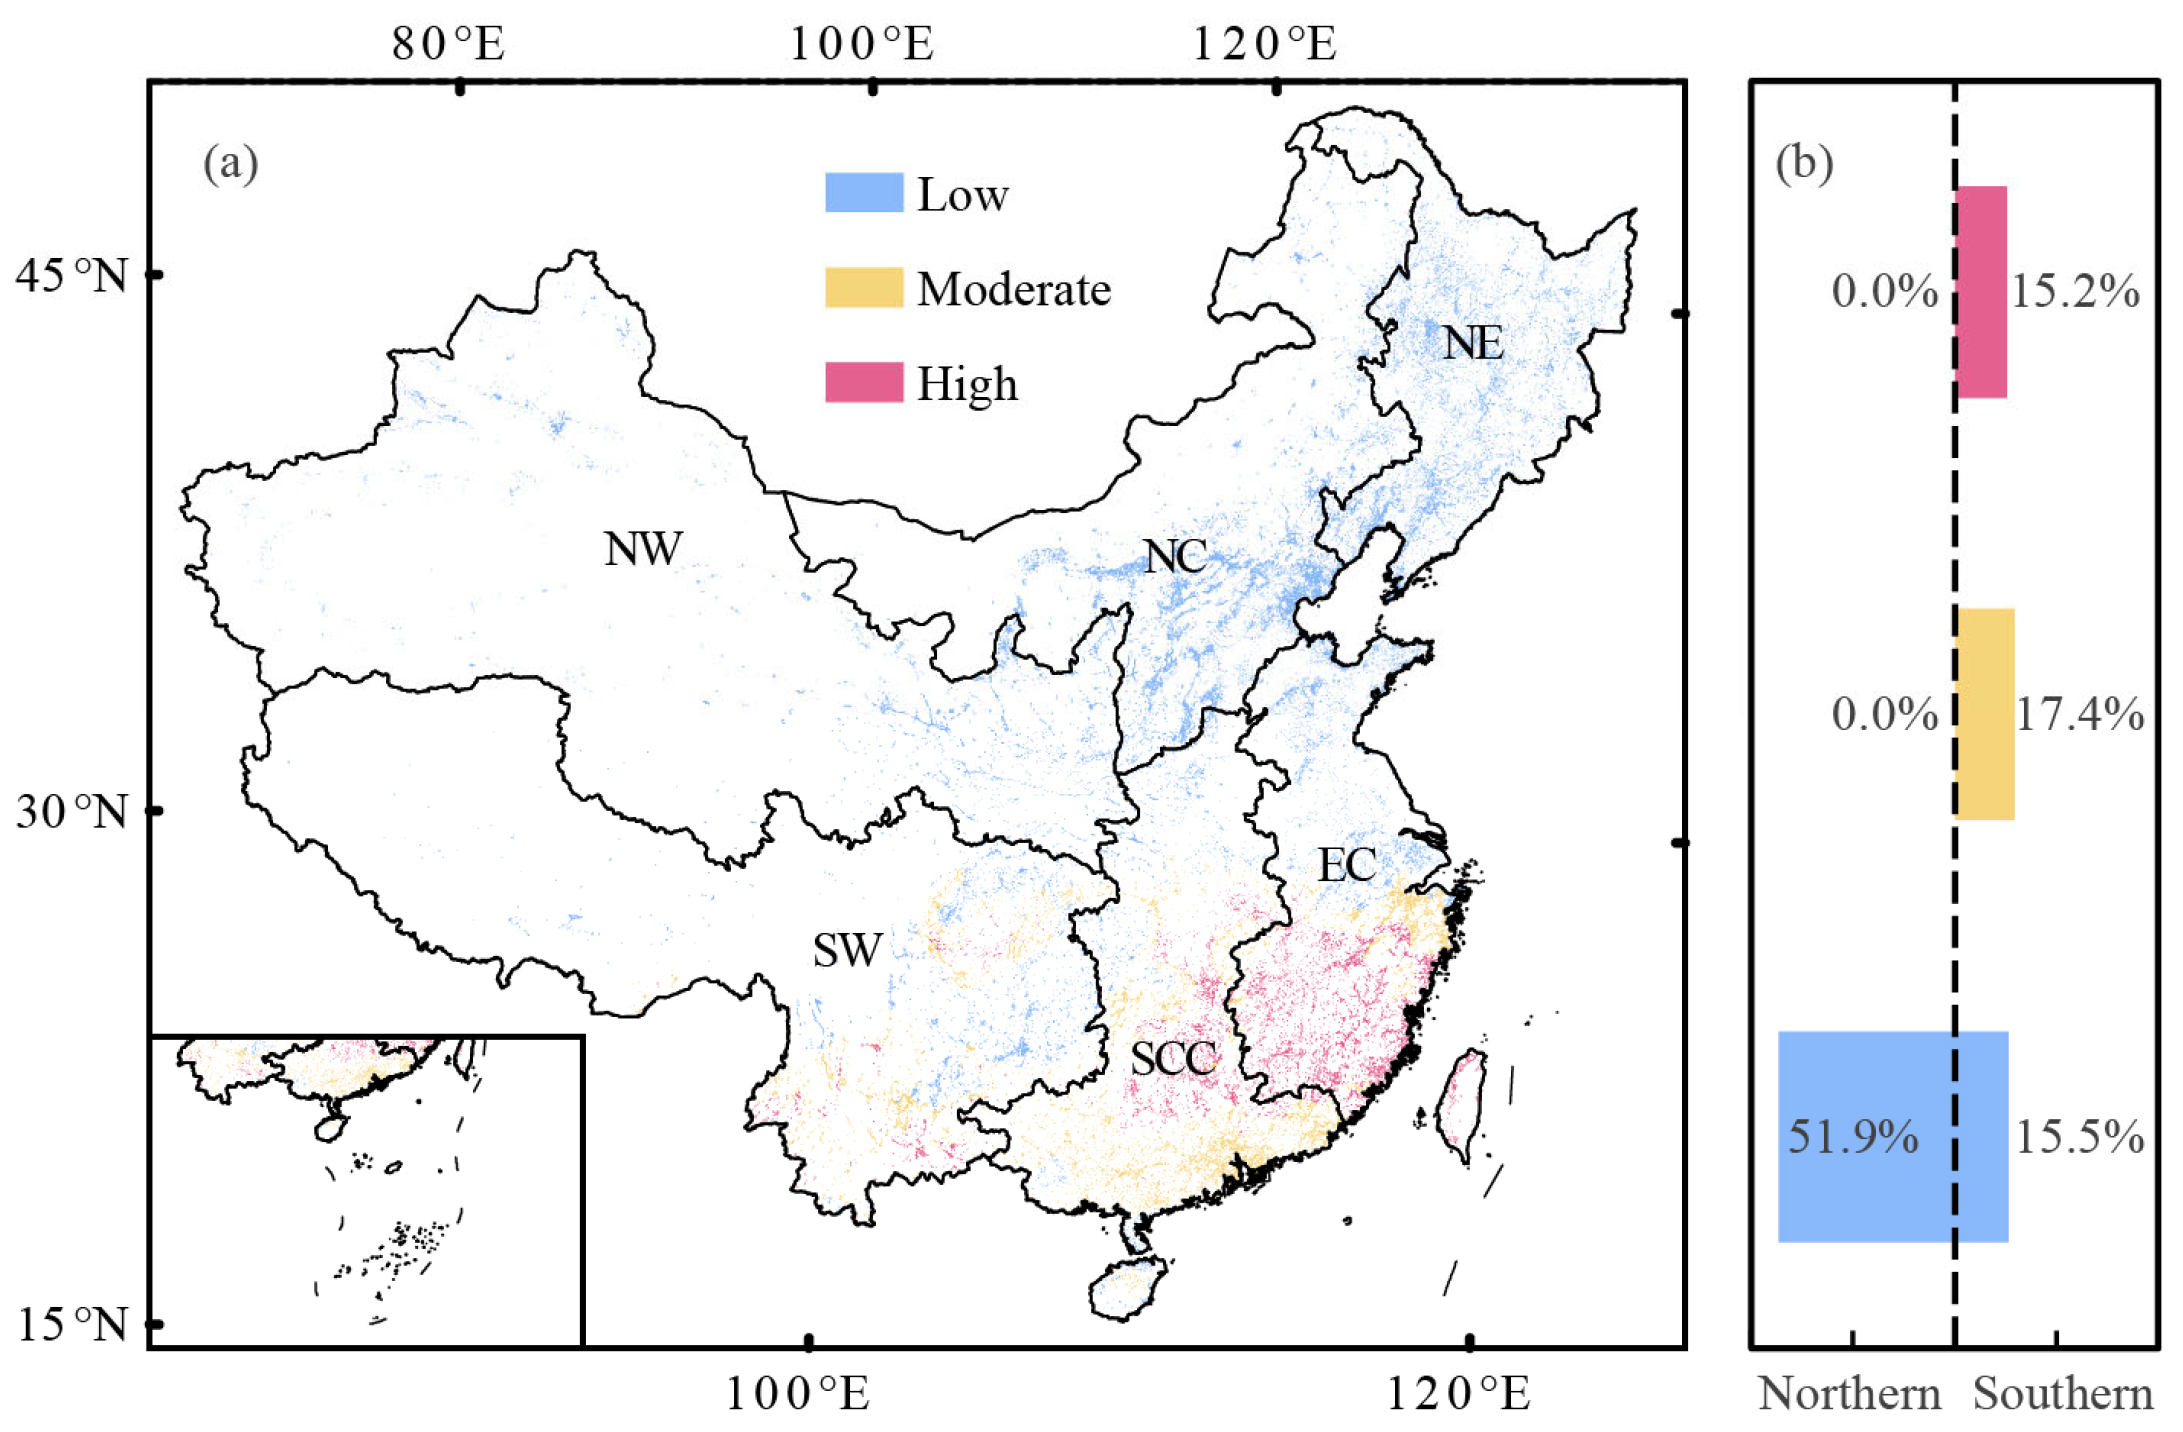
We first benchmarked WUI fire hazard patterns via the established random forest model, with a focus on the historical baseline period (1985–2014) as a reference for future climate projections (Figure 4). Nationwide analysis revealed distinct hazard stratification: 67.4% of historical WUI areas fell into the very low hazard category. The moderate and high hazard areas collectively occupied 32.6% of the national WUI extent. These hazard areas exhibited strict geographic confinement to southern China, comprising three macroregions: EC, SCC, and SW. The moderate hazard areas covered 17.4% of the national WUI, whereas the high hazard areas accounted for 15.2%. Regional disparities were pronounced, with EC containing 9.4% of national high hazard WUI areas—more than double the percentages of SCC (4.3%) and sixfold of SW (1.5%). In contrast, all the WUI areas in northern China (NE, NC, and NW) presented low fire hazard, accounting for 51.9% of the national WUI area.
Figure 5 quantifies the projected growth rates of WUI fire hazard indices across climate scenarios (SSP1-2.6, SSP2-4.5, SSP5-8.5). Compared with the historical baseline stage, significant divergence emerged between the northern and southern China under the projected scenarios. In northern China (NC, NE, NW), the fire hazard index exhibited consistent upward trajectories across all emission scenarios. Under the higher emission scenario, the growth rate of the WUI fire hazard index accelerated significantly by the end of the 21st century. Specifically, the highest increase rates were observed in NW (9.30), NC (7.55), and NE (1.42). These results indicate that the WUI fire hazard in northern China is projected to continue increasing, necessitating enhanced prevention and control measures. In contrast, southern China’s WUI fire hazard indices (EC, SCC, and SW) generally showed a trend of first increasing and then decreasing, and the growth rates were all less than 1.10 (SW). By the end of the 21st century, the SCC demonstrated negative growth (−0.66), falling below historical baseline levels. EC and SW maintained near-baseline conditions with marginal rates of 0.05 and 0.33, respectively. This pattern suggests stabilized fire hazards along the southeastern coastal zones.

3.3. Characteristics of High Hazard Area Deviation

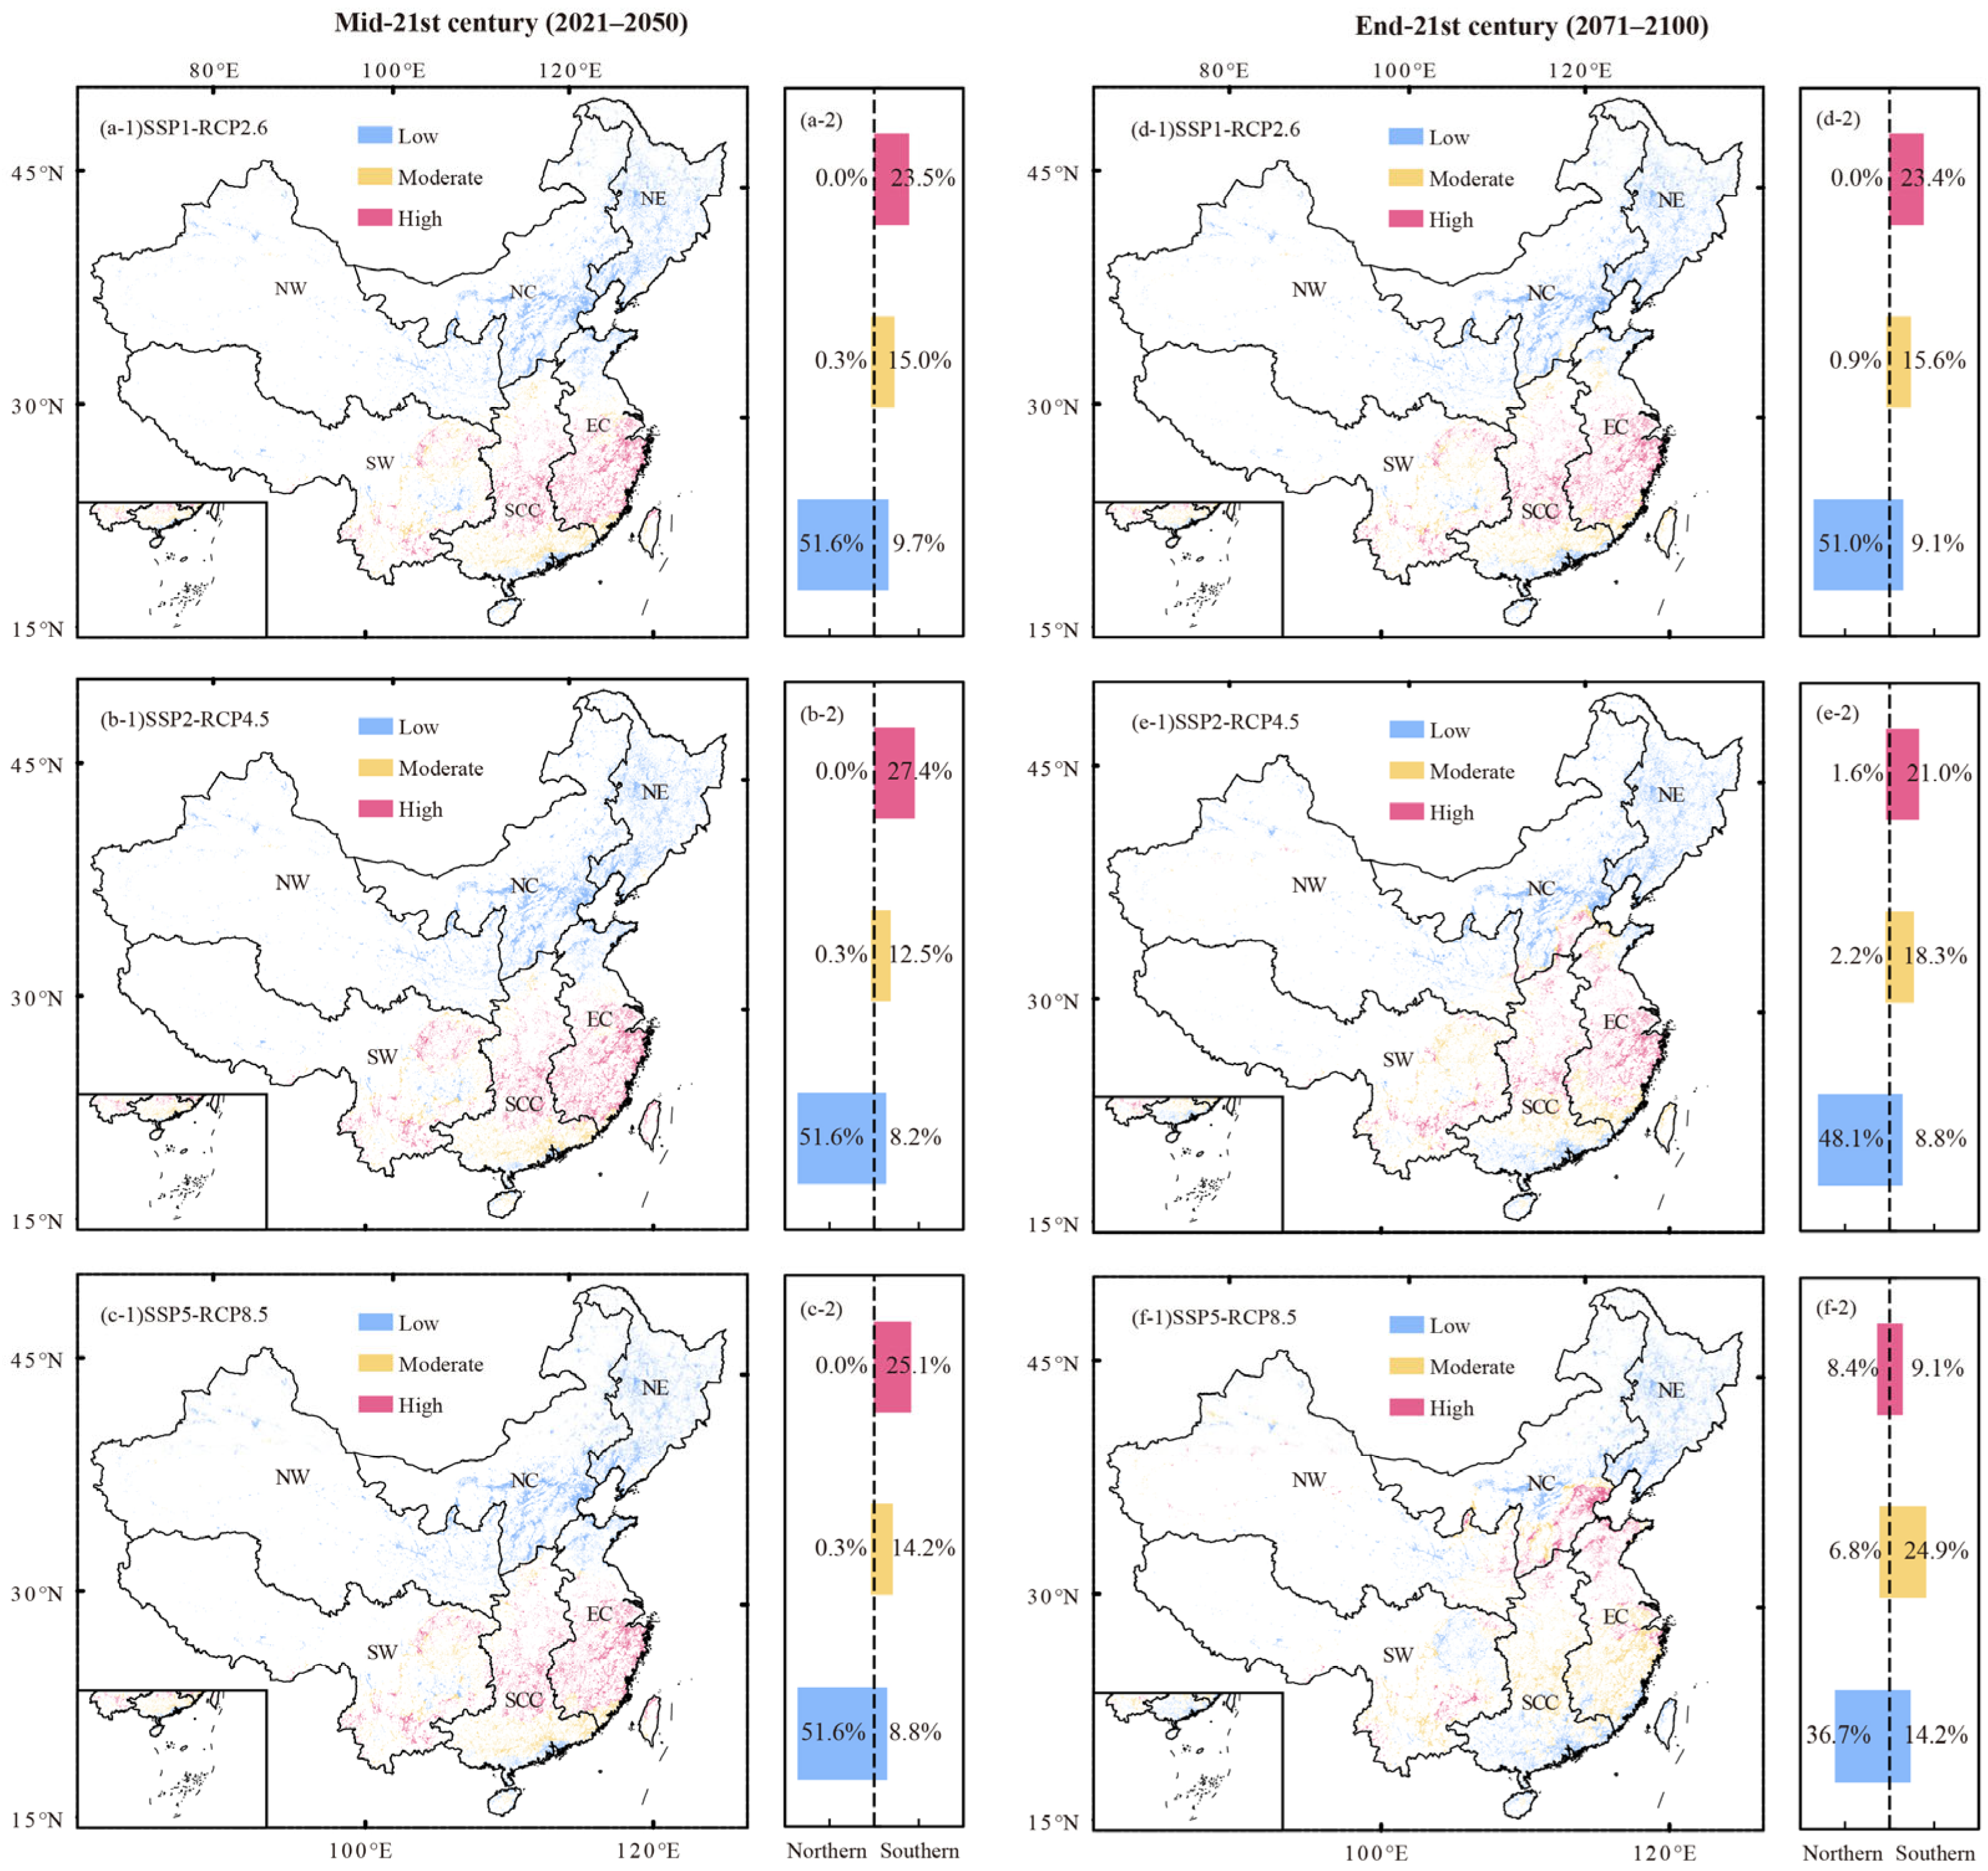
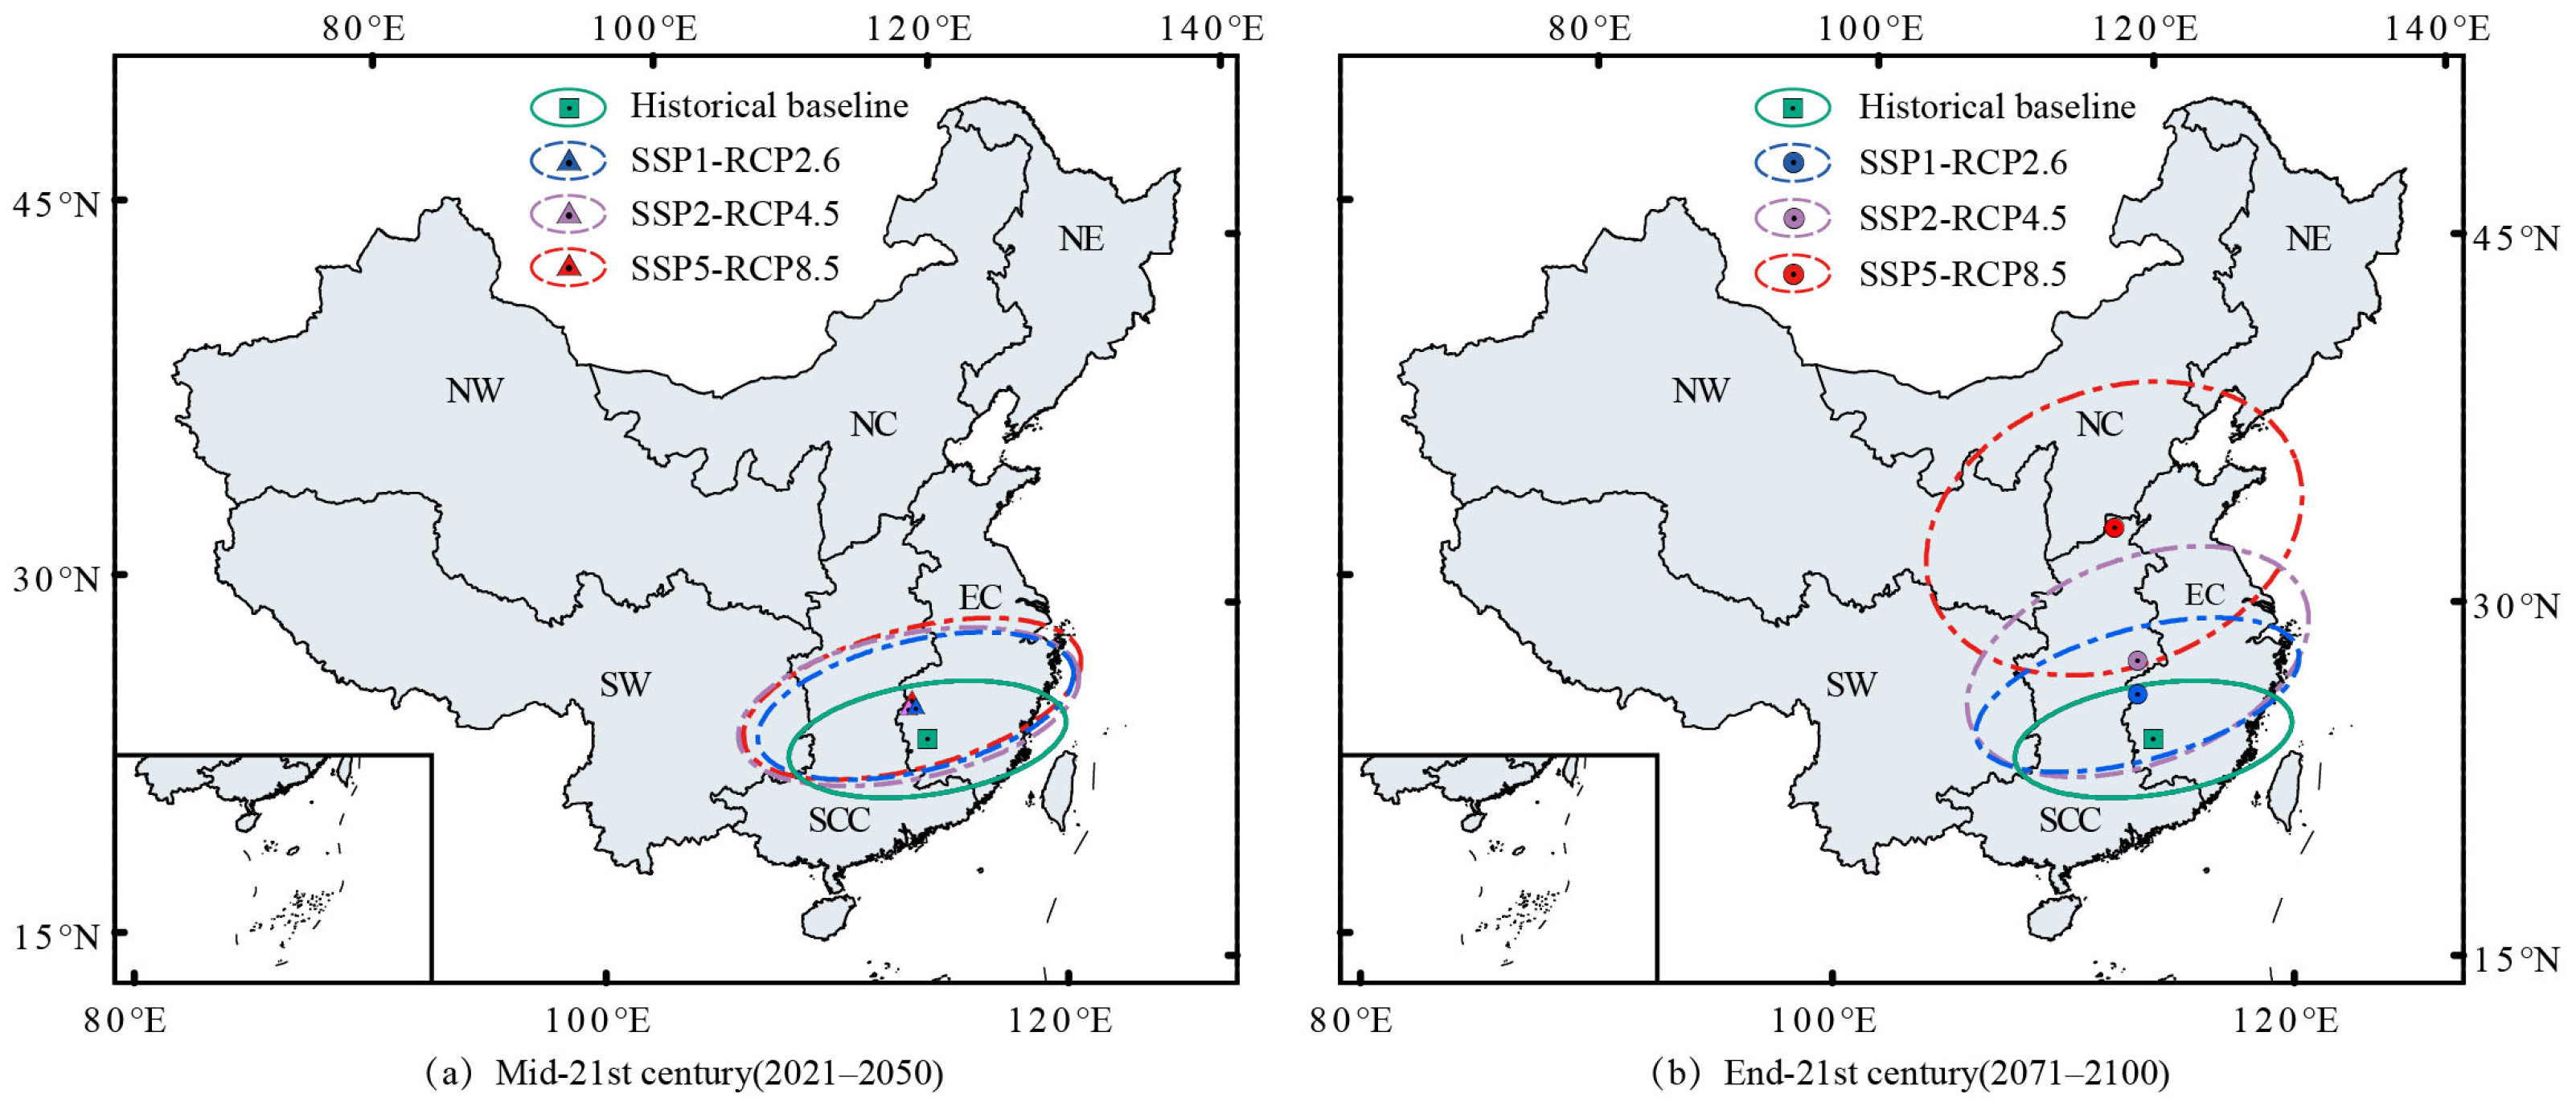
Figure 6 shows the spatiotemporal patterns of WUI fire hazard classification under multiple climate change scenarios. Nationally, the proportion of high hazard WUI areas progressively expanded across all three scenarios over time. End-century projections revealed 23.4% (SSP1-2.6), 22.6% (SSP2-4.5), and 17.5% (SSP5-8.5) WUI areas in the high hazard classification, surpassing the historical baseline of 15.2%. This inverse relationship between emission intensity and hazard expansion highlights unexpected hazard dynamics under mitigation scenarios. In terms of regional differences, mid-century projections (2021–2050) maintained geospatial consistency with historical patterns. Southern China retained 23.5%–27.4% high hazard coverage across all the scenarios, whereas northern China did not contain high hazard areas. By the end of the 21st century (2071–2100), the proportion of WUI high hazard areas under higher emission scenarios was even lower in southern China, from 23.4% (SSP1-2.6) to 9.1% (SSP5-8.5); the areas of reduced WUI high hazard under SSP5-8.5 were mainly concentrated in EC (3.7%) and SCC (3.2%). In contrast, many high hazard areas began to appear in northern China at the end of the 21st century. Spatial extent variations show strong emission dependency. Under SSP2–4.5, high hazard areas expand by 1.6% (1.4% in NC and 0.2% in NW). This percentage increases to 8.4% (6.8% in NC and 1.6% in NW) under SSP5–8.5. Geospatial analysis identified NC as the core region for hazard intensification, with NE showing negligible hazard escalation. Our analysis reveals divergent spatial responses across emission scenarios. Under low emission scenarios (SSP1-2.6), WUI fire hazards demonstrate nationwide intensification. In contrast, high emission scenarios (SSP5-8.5) induce polarized regional patterns: WUI fire hazards accelerate significantly in northern China but decline in southern China. This north–south divergence under SSP5-8.5 is further characterized by latitudinal northward migration in high hazard areas.
Figure 7 shows the center of gravity migration paths of the WUI fire high hazard area. In the historical base period, the high hazard area was located mainly in the EC and SCC areas along the southern coast of China. Its elliptical center of gravity was located in EC. In the middle of the 21st century (2021–2050), China’s WUI high hazard area generally shows a northward shift under different climate change scenarios. Spatial shifts exhibited minimal variation across scenarios, and the gravity center of the high hazard area was still located in the EC region. At the end of the 21st century (2071–2100), the center of gravity in the high hazard area significantly shifted northward (Figure 6). The elliptical center of gravity under the SSP2-4.5 and SSP5-8.5 models shifts to the northern part of the SCC, which is consistent with the characteristics of the spatial evolution of the fire hazard (Figure 6). This northward trend is more evident in the scenario of higher emissions. Specifically, the standard deviation ellipse area is the largest in the SSP5-8.5, which is as high as 194.8×10⁴ km2, and the azimuthal angle of the standard deviation ellipse is changed from 81.4 (compared with that in the historical baseline) in the SSP5−8.5 to 69.1°. In addition, the long axis (932.6 km) and short axis (664.7 km) of the ellipses are the longest. Nevertheless, the difference between the short and long half-axes is the smallest (the smallest flatness, 0.29). This suggests that the high hazard area of WUI fires under SSP5-8.5 has evolved from agglomeration to diffusion and that the coverage of the high hazard area is becoming increasingly broader.

4. Discussion

Comprehending wildfire drivers forms the foundation for strategic fire mitigation [12,58,59]. This knowledge directly informs risk assessment protocols and resource allocation strategies. However, modeling wildfire hazards remains particularly challenging because of the stochastic propagation dynamics from ignition to landscape-scale spread and nonlinear driver interactions [48]. Although the internationally widely used Fire Weather Index (FWI) has confirmed the influence of meteorological conditions on fire risk [60], the FWI only applies well in northeast and southwest China [61,62], and performs poorly in most parts of southern China, which has different vegetation and climates [63]. In contrast, compared with various traditional fire risk indices, the RF algorithm has demonstrated excellent performance in predicting fire hazards in China’s WUI areas, while also identifying key driving factors. The RF methodology offers distinct advantages over alternative machine learning approaches, including enhanced classification performance, computational efficiency [8,64,65], and robust handling of noisy datasets with complex variable interdependencies [66]. These capabilities explain its widespread adoption in wildfire hazard prediction and driver analysis [67,68,69]. Although meteorological, vegetation, topographic, and human-related factors were considered to construct predictive models in this study, the main controlling factors driving wildfire occurrence in the WUI were climate factors such as temperature, rainfall, and humidity. Climate regulates the interactions between fire sources, vegetation productivity, fuel moisture, and weather conditions [70]. Increasing temperatures [35], increasing atmospheric dryness [71], decreasing precipitation [72], and widespread drought [73] are all thought to contribute to wildfire activity at regional to global scales. Notably, more than 90% of wildfires in China are triggered by human activities [74], and our SHAP analysis revealed relatively low contributions of human factors to the WUI fire hazard. This apparent contradiction arises from the fundamental distinction between fire ignition triggers and hazard drivers. Human activities primarily provide ignition sources, whereas meteorological factors determine the environmental suitability for fire development, including fuel dryness, spread potential, and hazard intensity [75,76]. We believe that human-induced ignition behaviors, which were subjective in nature, serve as triggers for fire occurrence rather than constituting the risk itself.
Our study revealed that the areas at high hazard of WUI fires in the historical baseline period are all distributed in southern China, which is different from the distribution of forest fires in China. Tian et al. [77] reported that high hazard areas of wildfires in China are located mainly in NE and SW China, which is due to the significant differences in the areas where WUI fires and wildfires [8] occur. The high WUI area in southern China and the high population density associated with intensive human activities increase the possibility of ignition [8,74]. In particular, we observed relatively high densities of wildfires in some of the boundary areas between regions. We believe that WUI fire management policies may be poorly implemented in these areas [32]. In addition, we found that future climate change will increase the proportion of high hazard areas, with a clear northward trend in China. The increasing trends in climate-related wildfire potential are driven by increasingly severe fire weather, which likely reflects the impacts of anthropogenic climate change [73]. Empirical evidence confirms accelerating temperature and precipitation increases across China by the end-21st century, particularly at high latitudes/elevations [78]. These trends validate our temperature-precipitation-driven WUI fire hazard model, which accurately projects poleward expansion of high-risk zones in China. The far-reaching impacts of climate change and threats to wildfires are increasingly recognized; thus, adaptation and management policies are needed. Areas below the rank of the WUI fire moderate hazard are acceptable dangers, whereas highly ranked areas need to be focused on prevention and control. Our findings on migration from high-risk areas highlight the importance of dynamically reallocating wildfire management resources. Southern regions (EC, SCC) require sustained investments in community prevention during the early 21st century, whereas northern China (NC, NW) demands urgent scaling of monitoring infrastructure, fuel management, and evacuation planning by end-century under high-emission scenarios. Policymakers should integrate our hazard projections into land-use zoning and climate adaptation funding to mitigate emerging risks.
This study developed a predictive model for WUI fire hazards across China, evaluated future climate change impacts, and enriched the theoretical framework for WUI fire management. Constrained by data availability, non-meteorological factors were held at baseline-year values to isolate the independent influence of climate change on fire hazard redistribution. While this approach assumes static landscape attributes and population density, emission scenarios intrinsically reflect potential anthropogenic impacts through their climate pathways. This methodology aligns with established climate-attribution frameworks where non-climatic drivers are maintained at reference states to disentangle climate-driven mechanisms [79]. Critically, longitudinal analyses confirmed that these variables exhibited no regime shifts during our study period [70]. Thus, our projections primarily capture climate-induced modifications to future fire hazards—an approach that maintains reliability despite acknowledged simplifications. This study employed an unweighted arithmetic mean MME method to integrate CMIP6 models, which effectively reduces the structural uncertainty of individual models [47]. However, this approach may not fully account for performance differences among models at regional scales. Unweighted averaging may slightly smooth the magnitude of extreme weather events [80]. We advocate for the prioritization of finer-scale analyses in future research. Such localized approaches better capture heterogeneous climate impacts [81], advancing beyond conventional assessment paradigms. While this study focused on fire hazard (likelihood of occurrence), future work will incorporate receptor exposure, and social vulnerability to achieve a comprehensive risk assessment. This study will support tiered prevention strategies tailored to regional fire behavior and community resilience.

5. Conclusions

Accurate prediction of WUI fire hazards is essential for developing sustainable fire management strategies that balance ecological protection and community safety. In this study, we constructed a WUI fire hazard prediction model for China via machine learning methods and evaluated the effects of climate, vegetation, topography, and human activities on fires. Among them, the WUI fire hazard model based on the random forest outperforms the other models and has good generalizability. SHAP analysis identified key meteorological drivers: mean/maximum temperatures, precipitation, and relative humidity. A historical baseline assessment (1985–2014) revealed that more than two-thirds of China’s WUI areas experienced low hazards. In contrast, all the moderate and high hazard regions were concentrated in southern China. By the end of the 21st century, the WUI fire hazard index will increase the fastest in northern China (NW, NC, and NE) under the higher emission scenario (SSP5-8.5), and climate change will significantly increase the proportion of WUI fire high hazard areas in northern China, with the proportion in northern China (8.4%) being similar to that in southern Chian (9.1%) in the end of the 21st century under SSP5-8.5. The gravity center of China’s WUI high fire hazard areas will shift from south to north under the higher emission scenario, and the importance of WUI fire management in northern China will become increasingly prominent. These findings establish a robust foundation for hazard forecasting and underscore the need for adaptive strategies. Short-term priorities should target southern high hazard zones to mitigate immediate risks to populated areas. Long-term sustainable resource allocation must address the northward shift in hazard centroids, integrating fire resilience into regional development planning and climate adaptation frameworks. These measures are critical for achieving balanced ecological security and socioeconomic sustainability under changing climate conditions.

Funding

This work was supported by the China Fire and Rescue Institute Scientific Research Project [XFKZD202502] and the National Key Research and Development Program of China [2023YFC3011700].

Institutional Review Board Statement

Not applicable.

Informed Consent Statement

Not applicable.

Data Availability Statement

The data are available from the corresponding author on reasonable request.

Conflicts of Interest

The author declares no conflict of interest.

References

  1. Guo, Y.; Wang, J.; Ge, Y.; Zhou, C. Global Expansion of Wildland-Urban Interface Intensifies Human Exposure to Wildfire Risk in the 21st Century. Sci. Adv. 2024, 10, eado9587. [Google Scholar] [CrossRef]
  2. Alcasena, F.J.; Salis, M.; Ager, A.A.; Castell, R.; Vega-García, C. Assessing Wildland Fire Risk Transmission to Communities in Northern Spain. Forests 2017, 8, 30. [Google Scholar] [CrossRef]
  3. Bowman, D.M.J.S.; Kolden, C.A.; Abatzoglou, J.T.; Johnston, F.H.; van der Werf, G.R.; Flannigan, M. Vegetation Fires in the Anthropocene. Nat. Rev. Earth Environ. 2020, 1, 500–515. [Google Scholar] [CrossRef]
  4. Schug, F.; Bar-Massada, A.; Carlson, A.R.; Cox, H.; Hawbaker, T.J.; Helmers, D.; Hostert, P.; Kaim, D.; Kasraee, N.K.; Martinuzzi, S.; et al. The global wildland–urban interface. Nature 2023, 621, 94–99. [Google Scholar] [CrossRef]
  5. Chen, B.; Wu, S.; Jin, Y.; Song, Y.; Wu, C.; Venevsky, S.; Xu, B.; Webster, C.; Gong, P. Wildfire Risk for Global Wildland–Urban Interface Areas. Nat. Sustain. 2024, 7, 474–484. [Google Scholar] [CrossRef]
  6. Godoy, M.M.; Martinuzzi, S.; Kramer, H.A.; Defossé, G.E.; Argañaraz, J.; Radeloff, V.C. Rapid WUI Growth in a Natural Amenity-Rich Region in Central-Western Patagonia, Argentina. Int. J. Wildland Fire 2019, 28, 473–484. [Google Scholar] [CrossRef]
  7. Chen, R.; Li, X.; Hu, Y.; Wen, C.; Peng, L. Road Extraction from Remote Sensing Images in Wildland–Urban Interface Areas. IEEE Geosci. Remote Sens. Lett. 2022, 19, 1–5. [Google Scholar] [CrossRef]
  8. Gong, D.; Sun, L.; Hu, T. Characterizing the Occurrence of Wildland-Urban Interface Fires and Their Important Factors in China. Ecol. Indic. 2024, 165, 112179. [Google Scholar] [CrossRef]
  9. Zong, X.; Tian, X.; Fang, L. Assessing Wildfire Risk and Mitigation Strategies in Qipanshan, China. Int. J. Disaster Risk Reduct. 2022, 80, 103237. [Google Scholar] [CrossRef]
  10. Fazel-Rastgar, F.; Sivakumar, V. Weather Pattern Associated with Climate Change During Canadian Arctic Wildfires: A Case Study in July 2019. Remote Sens. Appl. Soc. Environ. 2022, 25, 100698. [Google Scholar] [CrossRef]
  11. Kang, Y.; Jang, E.; Im, J.; Kwon, C.; Kim, S. Developing a New Hourly Forest Fire Risk Index Based on Catboost in South Korea. Appl. Sci. 2020, 10, 8213. [Google Scholar] [CrossRef]
  12. Lan, Z.; Su, Z.; Guo, M.; Alvarado, E.C.; Guo, F.; Hu, H.; Wang, G. Are Climate Factors Driving the Contemporary Wildfire Occurrence in China? Forests 2021, 12, 392. [Google Scholar] [CrossRef]
  13. Zhao, F.; Liu, Y. Atmospheric Circulation Patterns Associated with Wildfires in the Monsoon Regions of China. Geophys. Res. Lett. 2019, 46, 4873–4882. [Google Scholar] [CrossRef]
  14. Ellis, T.M.; Bowman, D.M.J.S.; Jain, P.; Flannigan, M.D.; Williamson, G.J. Global Increase in Wildfire Risk Due to Climate-Driven Declines in Fuel Moisture. Glob. Change Biol. 2022, 28, 1544–1559. [Google Scholar] [CrossRef]
  15. Vilar, L.; Herrera, S.; Tafur-García, E.; Yebra, M.; Martinez-Vega, J.; Echavarría, P.; Martín, M.P. Modelling Wildfire Occurrence at Regional Scale from Land Use/Cover and Climate Change Scenarios. Environ. Model. Softw. 2021, 145, 105200. [Google Scholar] [CrossRef]
  16. Bar-Massada, A.; Stewart, S.I.; Hammer, R.B.; Mockrin, M.H.; Radeloff, V.C. Using Structure Locations as a Basis for Mapping the Wildland-Urban Interface. J. Environ. Manag. 2013, 128, 540–547. [Google Scholar] [CrossRef] [PubMed]
  17. Johnston, L.M.; Flannigan, M.D. Mapping Canadian Wildland Fire Interface Areas. Int. J. Wildland Fire 2018, 27, 1–14. [Google Scholar] [CrossRef]
  18. Lampin-Maillet, C.; Jappiot, M.; Long, M.; Bouillon, C.; Morge, D.; Ferrier, J.-P. Mapping Wildland-Urban Interfaces at Large Scales Integrating Housing Density and Vegetation Aggregation for Fire Prevention in the South of France. J. Environ. Manag. 2010, 91, 732–741. [Google Scholar] [CrossRef] [PubMed]
  19. Radeloff, V.C.; Helmers, D.P.; Kramer, H.A.; Mockrin, M.H.; Alexandre, P.M.; Bar-Massada, A.; Butsic, V.; Hawbaker, T.J.; Martinuzzi, S.; Syphard, A.D.; et al. Rapid Growth of the US Wildland-Urban Interface Raises Wildfire Risk. Proc. Natl. Acad. Sci. USA 2018, 115, 3314–3319. [Google Scholar] [CrossRef]
  20. Theobald, D.M.; Romme, W.H. Expansion of the US Wildland–Urban Interface. Landsc. Urban Plan. 2007, 83, 340–354. [Google Scholar] [CrossRef]
  21. Herrero-Corral, G.; Jappiot, M.; Bouillon, C.; Long-Fournel, M. Application of a Geographical Assessment Method for the Characterization of Wildland–Urban Interfaces in the Context of Wildfire Prevention: A Case Study in Western Madrid. Appl. Geogr. 2012, 35, 60–70. [Google Scholar] [CrossRef]
  22. Rehm, R.G.; Mell, W. A Simple Model for Wind Effects of Burning Structures and Topography on Wildland–Urban Interface Surface-Fire Propagation. Int. J. Wildland Fire 2009, 18, 290–301. [Google Scholar] [CrossRef]
  23. Van Wagner, C.E. Structure of the Canadian Forest Fire Weather Index System; Canadian Forestry Service: Ottawa, ON, Canada, 1974; Volume 1333. [Google Scholar]
  24. Forkel, M.; Dorigo, W.; Lasslop, G.; Teubner, I.; Chuvieco, E.; Thonicke, K. A Data-Driven Approach to Identify Controls on Global Fire Activity from Satellite and Climate Observations (SOFIA V1). Geosci. Model Dev. 2017, 10, 4443–4476. [Google Scholar] [CrossRef]
  25. Jain, P.; Coogan, S.C.P.; Subramanian, S.G.; Crowley, M.; Taylor, S.; Flannigan, M.D. A Review of Machine Learning Applications in Wildfire Science and Management. Environ. Rev. 2020, 28, 478–505. [Google Scholar] [CrossRef]
  26. Camps-Valls, G.; Tuia, D.; Zhu, X.; Reichstein, M. Deep Learning for the Earth Sciences: A Comprehensive Approach to Remote Sensing, Climate Science, and Geosciences; Wiley: Hoboken, NJ, USA, 2021. [Google Scholar]
  27. Reichstein, M.; Camps-Valls, G.; Stevens, B.; Jung, M.; Denzler, J.; Carvalhais, N.; Prabhat. Deep Learning and Process Understanding for Data-Driven Earth System Science. Nature 2019, 566, 195–204. [Google Scholar] [CrossRef]
  28. Bento-Gonçalves, A.; Vieira, A. Wildfires in the Wildland-Urban Interface: Key Concepts and Evaluation Methodologies. Sci. Total Environ. 2020, 707, 135592. [Google Scholar] [CrossRef]
  29. Calkin, D.E.; Cohen, J.D.; Finney, M.A.; Thompson, M.P. How Risk Management Can Prevent Future Wildfire Disasters in the Wildland-Urban Interface. Proc. Natl. Acad. Sci. USA 2014, 111, 746–751. [Google Scholar] [CrossRef]
  30. Koksal, K.; McLennan, J.; Every, D.; Bearman, C. Australian Wildland-Urban Interface Householders’ Wildfire Safety Preparations: ‘Everyday Life’ Project Priorities and Perceptions of Wildfire Risk. Int. J. Disaster Risk Reduct. 2019, 33, 142–154. [Google Scholar] [CrossRef]
  31. Modugno, S.; Balzter, H.; Cole, B.; Borrelli, P. Mapping Regional Patterns of Large Forest Fires in Wildland–Urban Interface Areas in Europe. J. Environ. Manag. 2016, 172, 112–126. [Google Scholar] [CrossRef]
  32. Xue, J.; Li, K.; Li, H.; Wang, Y.; Guo, X.; Zhang, H.; Zhao, J.; Chen, H. A Novel Data Source for Human-Caused Wildfires in China: Extracting Information from Judgment Documents. Geomat. Nat. Hazards Risk 2024, 15, 2361132. [Google Scholar] [CrossRef]
  33. FAO. Guidelines on Fire Management in Temperate and Boreal Forests; Food and Agriculture Organization: Rome, Italy, 2002; Available online: https://openknowledge.fao.org/server/api/core/bitstreams/2b21e040-ea55-4894-92d3-d877631633a8/content (accessed on 1 July 2024).
  34. Tsinko, Y.; Bakhshaii, A.; Johnson, E.A.; Martin, Y.E. Comparisons of Fire Weather Indices Using Canadian Raw and Homogenized Weather Data. Agric. For. Meteorol. 2018, 262, 110–119. [Google Scholar] [CrossRef]
  35. Williams, A.P.; Abatzoglou, J.T.; Gershunov, A.; Guzman-Morales, J.; Bishop, D.A.; Balch, J.K.; Lettenmaier, D.P. Observed Impacts of Anthropogenic Climate Change on Wildfire in California. Earths Future 2019, 7, 892–910. [Google Scholar] [CrossRef]
  36. Allan, R.G.; Pereira, L.S.; Smith, M. Crop Evapotranspiration: Guidelines for Computing Crop Water Requirements. In FAO Irrigation and Drainage Paper 56; Food and Agriculture Organization: Rome, Italy, 1998. [Google Scholar]
  37. Khatchikian, C.; Sangermano, F.; Kendell, D.; Livdahl, T. Evaluation of Species Distribution Model Algorithms for Fine-Scale Container-Breeding Mosquito Risk Prediction. Med. Vet. Entomol. 2011, 25, 268–275. [Google Scholar] [CrossRef] [PubMed]
  38. Trang, P.T.; Andrew, M.E.; Chu, T.; Enright, N.J. Forest Fire and Its Key Drivers in the Tropical Forests of Northern Vietnam. Int. J. Wildland Fire 2022, 31, 213–229. [Google Scholar] [CrossRef]
  39. Su, B.; Huang, J.; Mondal, S.K.; Zhai, J.; Wang, Y.; Wen, S.; Gao, M.; Lv, Y.; Jiang, S.; Jiang, T.; et al. Insight from CMIP6 SSP-RCP Scenarios for Future Drought Characteristics in China. Atmos. Res. 2021, 250, 105375. [Google Scholar] [CrossRef]
  40. You, Q.; Cai, Z.; Wu, F.; Jiang, Z.; Pepin, N.; Shen, S.S.P. Temperature Dataset of CMIP6 Models over China: Evaluation, Trend and Uncertainty. Clim. Dyn. 2021, 57, 17–35. [Google Scholar] [CrossRef]
  41. Anav, A.; Friedlingstein, P.; Kidston, M.; Bopp, L.; Ciais, P.; Cox, P.; Jones, C.; Jung, M.; Myneni, R.; Zhu, Z. Evaluating the Land and Ocean Components of the Global Carbon Cycle in the CMIP5 Earth System Models. J. Clim. 2013, 26, 6801–6843. [Google Scholar] [CrossRef]
  42. Zhu, Z.; Piao, S.; Myneni, R.B.; Huang, M.; Zeng, Z.; Caadell, J.G.; Ciais, P.; Sitch, S.; Friedlingstein, P.; Arneth, A.; et al. Greening of the Earth and its drivers. Nat. Clim. Change 2016, 6, 791–795. [Google Scholar] [CrossRef]
  43. Mao, J.; Ribes, A.; Yan, B.; Shi, X.; Thornton, P.E.; Séférian, R.; Ciais, P.; Myneni, R.B.; Douville, H.; Piao, S.; et al. Human-Induced Greening of the Northern Extratropical Land Surface. Nat. Clim. Change 2016, 6, 959–963. [Google Scholar] [CrossRef]
  44. Xu, C.; McDowell, N.G.; Fisher, R.A.; Wei, L.; Sevanto, S.; Christoffersen, B.O.; Weng, E.; Middleton, R.S. Increasing Impacts of Extreme Droughts on Vegetation Productivity Under Climate Change. Nat. Clim. Change 2019, 9, 948–953. [Google Scholar] [CrossRef]
  45. Sillmann, J.; Kharin, V.V.; Zhang, X.; Zwiers, F.W.; Bronaugh, D. Climate Extremes Indices in the CMIP5 Multimodel Ensemble: Part 1. Model Evaluation in the Present Climate. J. Geophys. Res. Atmos. 2013, 118, 1716–1733. [Google Scholar] [CrossRef]
  46. Yang, M.; Xiao, T.; Li, Y.; Hu, T. Evaluation and Projection of Climate Change in Southwest China Using CMIP6 Models. Plateau Meteorol. 2022, 41, 1557–1571. [Google Scholar] [CrossRef]
  47. Rhymee, H.; Shams, S.; Ratnayake, U.; Rahman, E.K.A. Comparing Statistical Downscaling and Arithmetic Mean in Simulating CMIP6 Multi-Model Ensemble over Brunei. Hydrology 2022, 9, 161. [Google Scholar] [CrossRef]
  48. Kondylatos, S.; Prapas, I.; Ronco, M.; Papoutsis, I.; Camps-Valls, G.; Piles, M.; Fernández-Torres, M.-Á.; Carvalhais, N. Wildfire Danger Prediction and Understanding with Deep Learning. Geophys. Res. Lett. 2022, 49, e2022GL099368. [Google Scholar] [CrossRef]
  49. Thompson, M.P.; Zimmerman, T.; Mindar, D.; Taber, M. Risk Terminology Primer: Basic Principles and a Glossary for the Wildland Fire Management Community; Rocky Mountain Research Station: Fort Collins, CO, USA, 2016. [Google Scholar]
  50. Pettinari, M.L.; Chuvieco, E. Fire Danger Observed from Space. Surv. Geophys. 2020, 41, 1437–1459. [Google Scholar] [CrossRef]
  51. Chen, R.; He, B.; Li, Y.; Fan, C.; Yin, J.; Zhang, H.; Zhang, Y. Estimation of Potential Wildfire Behavior Characteristics to Assess Wildfire Danger in Southwest China Using Deep Learning Schemes. J. Environ. Manag. 2024, 351, 120005. [Google Scholar] [CrossRef]
  52. Koutsias, N.; Balatsos, P.; Kalabokidis, K. Fire Occurrence Zones: Kernel Density Estimation of Historical Wildfire Ignitions at the National Level, Greece. J. Maps 2014, 10, 630–639. [Google Scholar] [CrossRef]
  53. Wu, L.; Zhou, H.; Ma, X.; Fan, J.; Zhang, F. Daily Reference Evapotranspiration Prediction Based on Hybridized Extreme Learning Machine Model with Bio-Inspired Optimization Algorithms: Application in Contrasting Climates of China. J. Hydrol. 2019, 577, 123960. [Google Scholar] [CrossRef]
  54. Parsa, A.B.; Movahedi, A.; Taghipour, H.; Derrible, S.; Mohammadian, A. Toward Safer Highways, Application of XGBoost and SHAP for Real-Time Accident Detection and Feature Analysis. Accid. Anal. Prev. 2020, 136, 105405. [Google Scholar] [CrossRef]
  55. Lorenzoni, I.; Pidgeon, N.F.; O’Connor, R.E. Dangerous Climate Change: The Role for Risk Research. Risk Anal. 2005, 25, 1387–1398. [Google Scholar] [CrossRef]
  56. Zong, X.; Tian, X.; Wang, X. The Role of Fuel Treatments in Mitigating Wildfire Risk. Landsc. Urban Plan. 2024, 242, 104957. [Google Scholar] [CrossRef]
  57. Duman, Z.; Mao, X.; Cai, B.; Zhang, Q.; Chen, Y.; Gao, Y.; Guo, Z. Exploring the Spatiotemporal Pattern Evolution of Carbon Emissions and Air Pollution in Chinese Cities. J. Environ. Manag. 2023, 345, 118870. [Google Scholar] [CrossRef]
  58. Guo, M.; Yao, Q.; Suo, H.; Xu, X.; Li, J.; He, H.; Yin, S.; Li, J. The Importance Degree of Weather Elements in Driving Wildfire Occurrence in Mainland China. Ecol. Indic. 2023, 148, 110152. [Google Scholar] [CrossRef]
  59. Ying, L.; Cheng, H.; Shen, Z.; Guan, P.; Luo, C.; Peng, X. Relative Humidity and Agricultural Activities Dominate Wildfire Ignitions in Yunnan, Southwest China: Patterns, Thresholds, and Implications. Agric. For. Meteorol. 2021, 307, 108540. [Google Scholar] [CrossRef]
  60. Shmuel, A.; Lazebnik, T.; Heifetz, E.; Glickman, O.; Price, C. Fire weather indices tailored to regional patterns outperform global models. Npj Nat. Hazards 2025, 2, 74. [Google Scholar] [CrossRef]
  61. Tian, X.; Zhao, F.; Shu, L.; Wang, M. Changes in forest fire danger for south-western China in the 21st century. Int. J. Wildland Fire 2014, 23, 185–195. [Google Scholar] [CrossRef]
  62. Tian, X.; McRae, D.J.; Jizhong, J.; Shu, L.; Zhao, F.; Wang, M. Changes of Forest Fire Danger and the Evaluation of the FWISystem Application in the Daxing’anling Region. Sci. Silvae Sin. 2010, 46, 127–132. [Google Scholar] [CrossRef]
  63. Yang, M.; Yao, Q.; Fang, K.; Dong, Z. Applications of Canadian Forest Fire Weather Index System in the World and China. J. Subtrop. Resour. Environ. 2021, 16, 48–54. [Google Scholar] [CrossRef]
  64. Belgiu, M.; Drăguţ, L. Random Forest in Remote Sensing: A Review of Applications and Future Directions. ISPRS J. Photogramm. Remote Sens. 2016, 114, 24–31. [Google Scholar] [CrossRef]
  65. Breiman, L. Random Forests. Mach. Learn. 2001, 45, 5–32. [Google Scholar] [CrossRef]
  66. Mellor, A.; Boukir, S.; Haywood, A.; Jones, S. Exploring Issues of Training Data Imbalance and Mislabelling on Random Forest Performance for Large Area Land Cover Classification Using the Ensemble Margin. ISPRS J. Photogramm. Remote Sens. 2015, 105, 155–168. [Google Scholar] [CrossRef]
  67. Aldersley, A.; Murray, S.J.; Cornell, S.E. Global and Regional Analysis of Climate and Human Drivers of Wildfire. Sci. Total Environ. 2011, 409, 3472–3481. [Google Scholar] [CrossRef]
  68. Collins, L.; Griffioen, P.; Newell, G.; Mellor, A. The Utility of Random Forests for Wildfire Severity Mapping. Remote Sens. Environ. 2018, 216, 374–384. [Google Scholar] [CrossRef]
  69. Oliveira, S.; Zêzere, J.L.; Queirós, M.; Pereira, J.M. Assessing the Social Context of Wildfire-Affected Areas. The Case of Mainland Portugal. Appl. Geogr. 2017, 88, 104–117. [Google Scholar] [CrossRef]
  70. Andela, N.; Morton, D.C.; Giglio, L.; Chen, Y.; van der Werf, G.R.; Kasibhatla, P.S.; DeFries, R.S.; Collatz, G.J.; Hantson, S.; Kloster, S.; et al. A Human-Driven Decline in Global Burned Area. Science 2017, 356, 1356–1362. [Google Scholar] [CrossRef] [PubMed]
  71. Chen, B.; Jin, Y.; Scaduto, E.; Moritz, M.A.; Goulden, M.L.; Randerson, J.T. Climate, Fuel, and Land Use Shaped the Spatial Pattern of Wildfire in California’s Sierra Nevada. J. Geophys. Res. Biogeosci. 2021, 126, e2020JG005786. [Google Scholar] [CrossRef]
  72. Holden, Z.A.; Swanson, A.; Luce, C.H.; Jolly, W.M.; Maneta, M.; Oyler, J.W.; Warren, D.A.; Parsons, R.; Affleck, D. Decreasing Fire Season Precipitation Increased Recent Western US Forest Wildfire Activity. Proc. Natl. Acad. Sci. USA 2018, 115, E8349–E8357. [Google Scholar] [CrossRef]
  73. Richardson, D.; Black, A.S.; Irving, D.; Matear, R.J.; Monselesan, D.P.; Risbey, J.S.; Squire, D.T.; Tozer, C.R. Global Increase in Wildfire Potential from Compound Fire Weather and Drought. npj Clim. Atmos. Sci. 2022, 5, 23. [Google Scholar] [CrossRef]
  74. Zong, X.; Tian, X.; Liu, J. A Fire Regime Zoning System for China. Front. For. Glob. Change 2021, 4, 717499. [Google Scholar] [CrossRef]
  75. Su, H.; Yu, Y.; Guo, W.; Mao, J. Convective potential and fuel availability complement near-surface weather in regulating global wildfire activity. Sci. Adv. 2025, 11, eadp7765. [Google Scholar] [CrossRef]
  76. Cawson, J.G.; Collins, L.; Parks, S.A.; Nolan, R.H.; Penman, T.D. Atmospheric dryness removes barriers to the development of large forest fires. Agric. For. Meteorol. 2024, 350, 109990. [Google Scholar] [CrossRef]
  77. Tian, X.; Dai, X.; Wang, M.; Zhao, F.; Shu, L. Forest Fire Risk Assessment for China Under Different Climate Scenarios. Chin. J. Appl. Ecol. 2016, 27, 769–776. [Google Scholar] [CrossRef]
  78. Yang, X.; Zhou, B.; Xu, Y.; Han, Z. CMIP6 Evaluation and Projection of Temperature and Precipitation over China. Adv. Atmos. Sci. 2021, 38, 817–830. [Google Scholar] [CrossRef]
  79. Chawla, I.; Mujumdar, P.P. Isolating the impacts of land use and climate change on streamflow. Hydrol. Earth Syst. Sci. 2015, 19, 3633–3651. [Google Scholar] [CrossRef]
  80. Zhang, J.; Wu, T.; Li, L.; Furtado, K.; Xin, X.; Xie, C.; Zheng, M.; Zhao, H.; Zhou, Y. Constraint on regional land surface air temperature projections in CMIP6 multi-model ensemble. NPJ Clim. Atmos. Sci. 2023, 6, 85. [Google Scholar] [CrossRef]
  81. Yu, H.W.; Wang, S.Y.S.; Liu, W.Y. Estimating Wildfire Potential in Taiwan Under Different Climate Change Scenarios. Clim. Change 2024, 177, 13. [Google Scholar] [CrossRef]
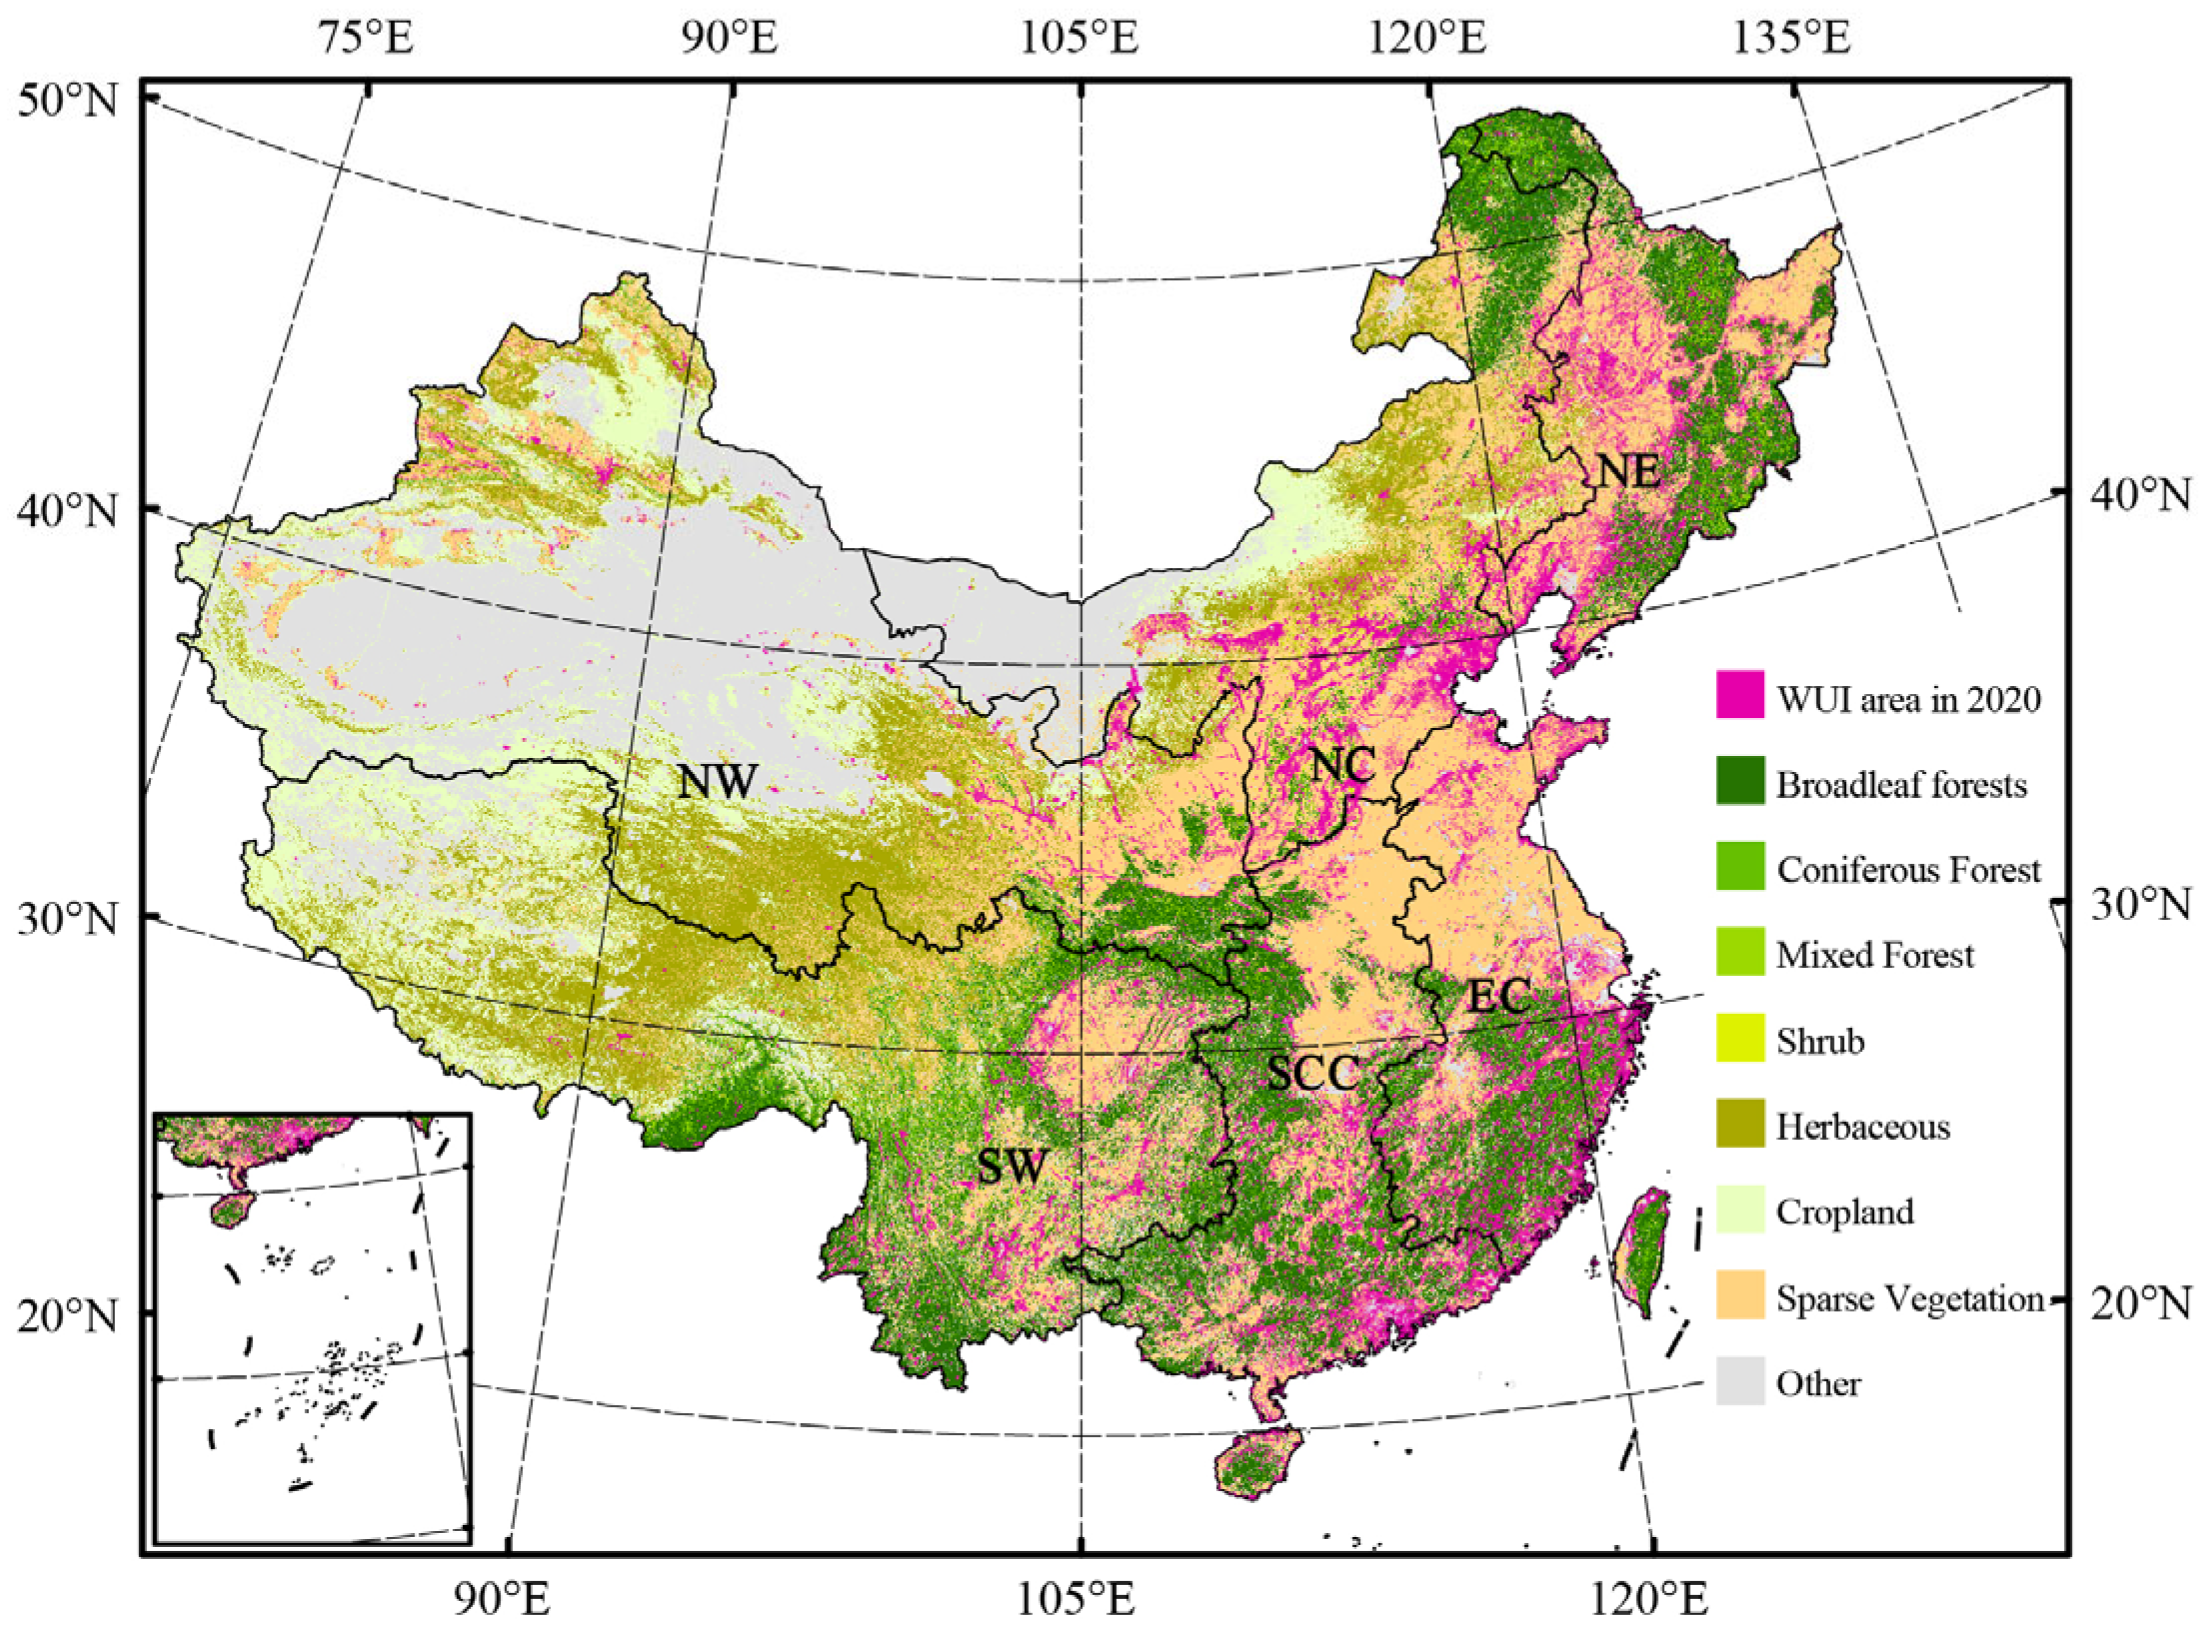
Figure 1. Spatial distribution of the WUI and vegetation classification in China. Vegetation classification data sourced from https://globalmaps.github.io/ (accessed on 25 June 2025).
Sustainability 17 07409 g001
Figure 2. Prediction results (a-1a-5 correspond to the five models) and residual distributions (b) of different machine learning models.
Sustainability 17 07409 g002
Figure 3. SHAP value rankings of the variables in the RF model.
Sustainability 17 07409 g003
Figure 4. Spatial patterns of WUI fire hazard levels across China: (a) historical baseline distribution; (b) proportional area by hazard level.
Sustainability 17 07409 g004
Figure 5. Average growth rates of the WUI under different climate change scenarios.
Sustainability 17 07409 g005
Figure 6. Spatiotemporal dynamics of China’s WUI fire hazard classification across climate scenarios: (a-1f-1) spatial patterns; (a-2f-2) proportional area by hazard level.
Sustainability 17 07409 g006
Figure 7. Center of gravity migration paths of the WUI fire high hazard area.
Sustainability 17 07409 g007
Table 1. Performance of the models on the test data.
MoldRMSEMAER2CCC
SVM0.14500.10200.6340.774
RF0.04050.02540.9740.985
XGBoost0.06620.04630.9250.959
LightGBM0.12200.09010.7630.835
MLP0.10500.07640.8120.898
Disclaimer/Publisher’s Note: The statements, opinions and data contained in all publications are solely those of the individual author(s) and contributor(s) and not of MDPI and/or the editor(s). MDPI and/or the editor(s) disclaim responsibility for any injury to people or property resulting from any ideas, methods, instructions or products referred to in the content.