Article

Statistical Characteristics of Hourly Extreme Heavy Rainfall over the Loess Plateau, China: A 43 Year Study

1
State Grid Shanxi Electric Power Research Institute, Taiyuan 030001, China
2
Key Laboratory of Earth System Numerical Modeling and Application, Institute of Atmospheric Physics, Chinese Academy of Sciences, Beijing 100029, China
3
State Grid Shanxi Electric Power Co., Ltd., Taiyuan 030021, China
*
Author to whom correspondence should be addressed.
Sustainability 2025, 17(16), 7395; https://doi.org/10.3390/su17167395
Submission received: 14 May 2025 / Revised: 8 August 2025 / Accepted: 12 August 2025 / Published: 15 August 2025

Abstract

The Loess Plateau, possessing the world’s most extensive loess deposits, is highly vulnerable to accelerated soil erosion and vegetation loss triggered by extreme hourly rainfall (EHR) events due to the inherently erodible nature of its porous, weakly cemented sediment structure. EHR exacerbates soil erosion, induces flash flooding, compromises power infrastructure, and jeopardizes agricultural productivity. Through analysis of 43 years (1981–2023) of station observational data and ERA5 reanalysis, we present the first comprehensive assessment of EHR characteristics across the plateau. Results reveal pronounced spatial heterogeneity, with southeastern regions exhibiting higher EHR intensity thresholds and frequency compared to northwestern areas. EHR frequency correlates positively with elevation, while intensity decreases with altitude, demonstrating orographic modulation. Synoptic-scale background environment of EHR events is characterized by upper-level divergence, mid-tropospheric warm advection, and lower-tropospheric convergence, all of which are linked to summer monsoon systems. Temporally, EHR peaks in July during the East Asian summer monsoon and exhibits a bimodal diurnal cycle (0700/1700 LST). Long-term trends reveal a significant overall increase in the frequency of EHR events (~0.82 events a−1). While an overall increase in EHR intensity is also observed, it fails to achieve statistical significance due to opposing regional signals. Collectively, these trends elevate the risks of slope failures and debris flows. Our findings highlight three priority interventions: (i) implementation of elevation-adapted early warning systems, (ii) targeted agricultural soil conservation practices, and (iii) climate-resilient infrastructure design for high-risk valleys—all essential for safeguarding this ecologically sensitive region against intensifying hydroclimatic extremes.

1. Introduction

Under global warming, extreme rainfall events exhibit pronounced amplification in both frequency and intensity [1,2], with nearly two-thirds of observed stations documenting rising trends in such extremes [3]. This intensification triggers cascading socio-environmental impacts, initiating with heightened flood risks that accelerate catchment saturation while paradoxically exacerbating inter-event droughts through shifting precipitation regimes [4,5]. These dynamics propagate across interconnected socio-economic systems, manifesting as critical infrastructure failures, severe agricultural losses, elevated mortality, and large-scale population displacement—disproportionately impacting marginalized communities with limited adaptive capacities [4,5,6,7]. Such impacts attain critical amplification in ecologically fragile regions where degraded natural buffers intensify systemic vulnerabilities [2,5]. Notably, mountain and plateau ecosystems experience accelerated soil erosion and landslides that severely compromise hydrological regulation and ecological stability [2,6,7,8]—a pattern acutely manifested across China’s Loess Plateau, where extreme precipitation events increasingly threaten both geomorphological integrity and socio-ecological resilience.
The Loess Plateau, located in northern China (Figure 1), is the largest loess accumulation area in the world, with unique topographical and climatic features [9,10]. The region’s terrain is primarily composed of thick Quaternary wind-blown loess deposits, which have been shaped into a fragmented landform by long-term water erosion [11]. The Loess Plateau has an average elevation ranging primarily between 1000 and 2000 m, characterized by pronounced surface undulations and steep slopes [12,13]. Its complex topography, combined with unique climatic conditions—positioned at the transitional boundary between China’s eastern monsoon region and northwestern arid zone—fosters a distinct natural environment highly susceptible to frequent meteorological hazards [14,15,16].
Among the disastrous weather events in the Loess Plateau, heavy precipitation demands particular attention due to its frequent triggering of soil erosion, landslides, flash floods, urban waterlogging, and power grid failures, leading to significant economic losses [10,17,18,19,20,21,22,23,24,25,26]. The loess deposits on the Loess Plateau are predominantly composed of silt-sized particles with high porosity and well-developed vertical joints, exhibiting structural stability when dry but rapid disintegration upon intense rainfall due to their low clay mineral and organic matter content, which severely limits cementation capacity and erosion resistance [26,27,28]. This inherent vulnerability, coupled with frequent drought-induced soil desiccation, exacerbates surface soil saturation and structural collapse during extreme rainfall events, as desiccated soils are more prone to cracking and mass wasting under intense precipitation [27,28]. As a typical rain-fed agricultural region, the Loess Plateau’s crop production, forestry, and livestock husbandry are highly dependent on precipitation variability [15,20,21,22,23,24,25]. Given this strong reliance, in-depth research on heavy precipitation events in the region is critically needed.
Due to their critical societal and environmental implications, heavy rainfall events over the Loess Plateau have long been a focal point of scientific research, with numerous studies characterizing their fundamental properties. For instance, spatial distribution analyses [19,22,23] have revealed significant heterogeneity in rainfall patterns, with the northwestern regions exhibiting particularly pronounced heavy precipitation (i.e., daily accumulated precipitation ≥50 mm) dominance. Temporal trend examinations [14,19] demonstrate contrasting seasonal patterns, with annual and summer–autumn precipitation showing marked declines, while spring–winter precipitation has significantly increased. Comprehensive analyses of precipitation intensity categories [20] based on station daily rainfall observations indicate substantial decreases in both precipitation days and amounts across all intensity classifications, including reductions in precipitation intensities. However, climate change projections [14,20] suggest an anticipated increase in both frequency and intensity of extreme daily precipitation events under global warming scenarios. The mechanisms underlying extreme daily precipitation have been elucidated through studies of atmospheric dynamics [20,25], which identify positive water vapor influx and notable cold–warm air convergence as critical factors for above-average summer extreme daily precipitation. Furthermore, spectral analysis of annual precipitation [24] reveals a distinct four-year cyclicity strongly associated with El Niño events, highlighting the important influence of large-scale climate oscillations on regional precipitation variability. These findings collectively reveal a complex interplay between local topography, seasonal atmospheric circulation, and global climate dynamics in governing precipitation characteristics across the Loess Plateau. The documented trends and future projections carry substantial implications for developing adaptive water resource strategies and implementing targeted ecological protection measures in this fragile ecosystem.
Previous research based on daily rainfall data has substantially improved our understanding of precipitation patterns across the Loess Plateau. However, these conventional datasets cannot resolve extreme hourly rainfall (EHR) events—critical meteorological phenomena that serve as primary triggers for flash floods and urban waterlogging. The hydrological impacts of EHR are particularly severe in the Loess Plateau region due to its unique geomorphological characteristics, where rainfall intensity rather than cumulative precipitation dominates erosive processes, and soil loss demonstrates a nonlinear dependence on precipitation intensity [26,27,28]. Despite their environmental significance, the spatiotemporal characteristics of EHR events across the plateau remain poorly quantified. A systematic investigation of EHR is essential to inform evidence-based disaster mitigation strategies, ecological conservation efforts, and optimized water resource management, including agricultural irrigation. Such insights are vital for minimizing socioeconomic losses, preserving ecosystem integrity, and safeguarding regional food production. To address the research gap regarding the key statistical characteristics of EHR events across the Loess Plateau (e.g., spatial characteristics, background environment features, temporal features), we conduct a comprehensive statistical analysis of EHR events using hourly observational data from meteorological stations distributed across and surrounding the plateau during the 1981–2023 period. The reminder of this article is structured as follows: Section 2 shows the data and methods used in this paper; Section 3 presents the spatial characteristics of EHR events; Section 4 presents the synoptic-scale background environment features of EHR events; in Section 5, EHR events’ temporal features are shown; and finally, a conclusion and discussion are reached in Section 6.

2. Data and Methods

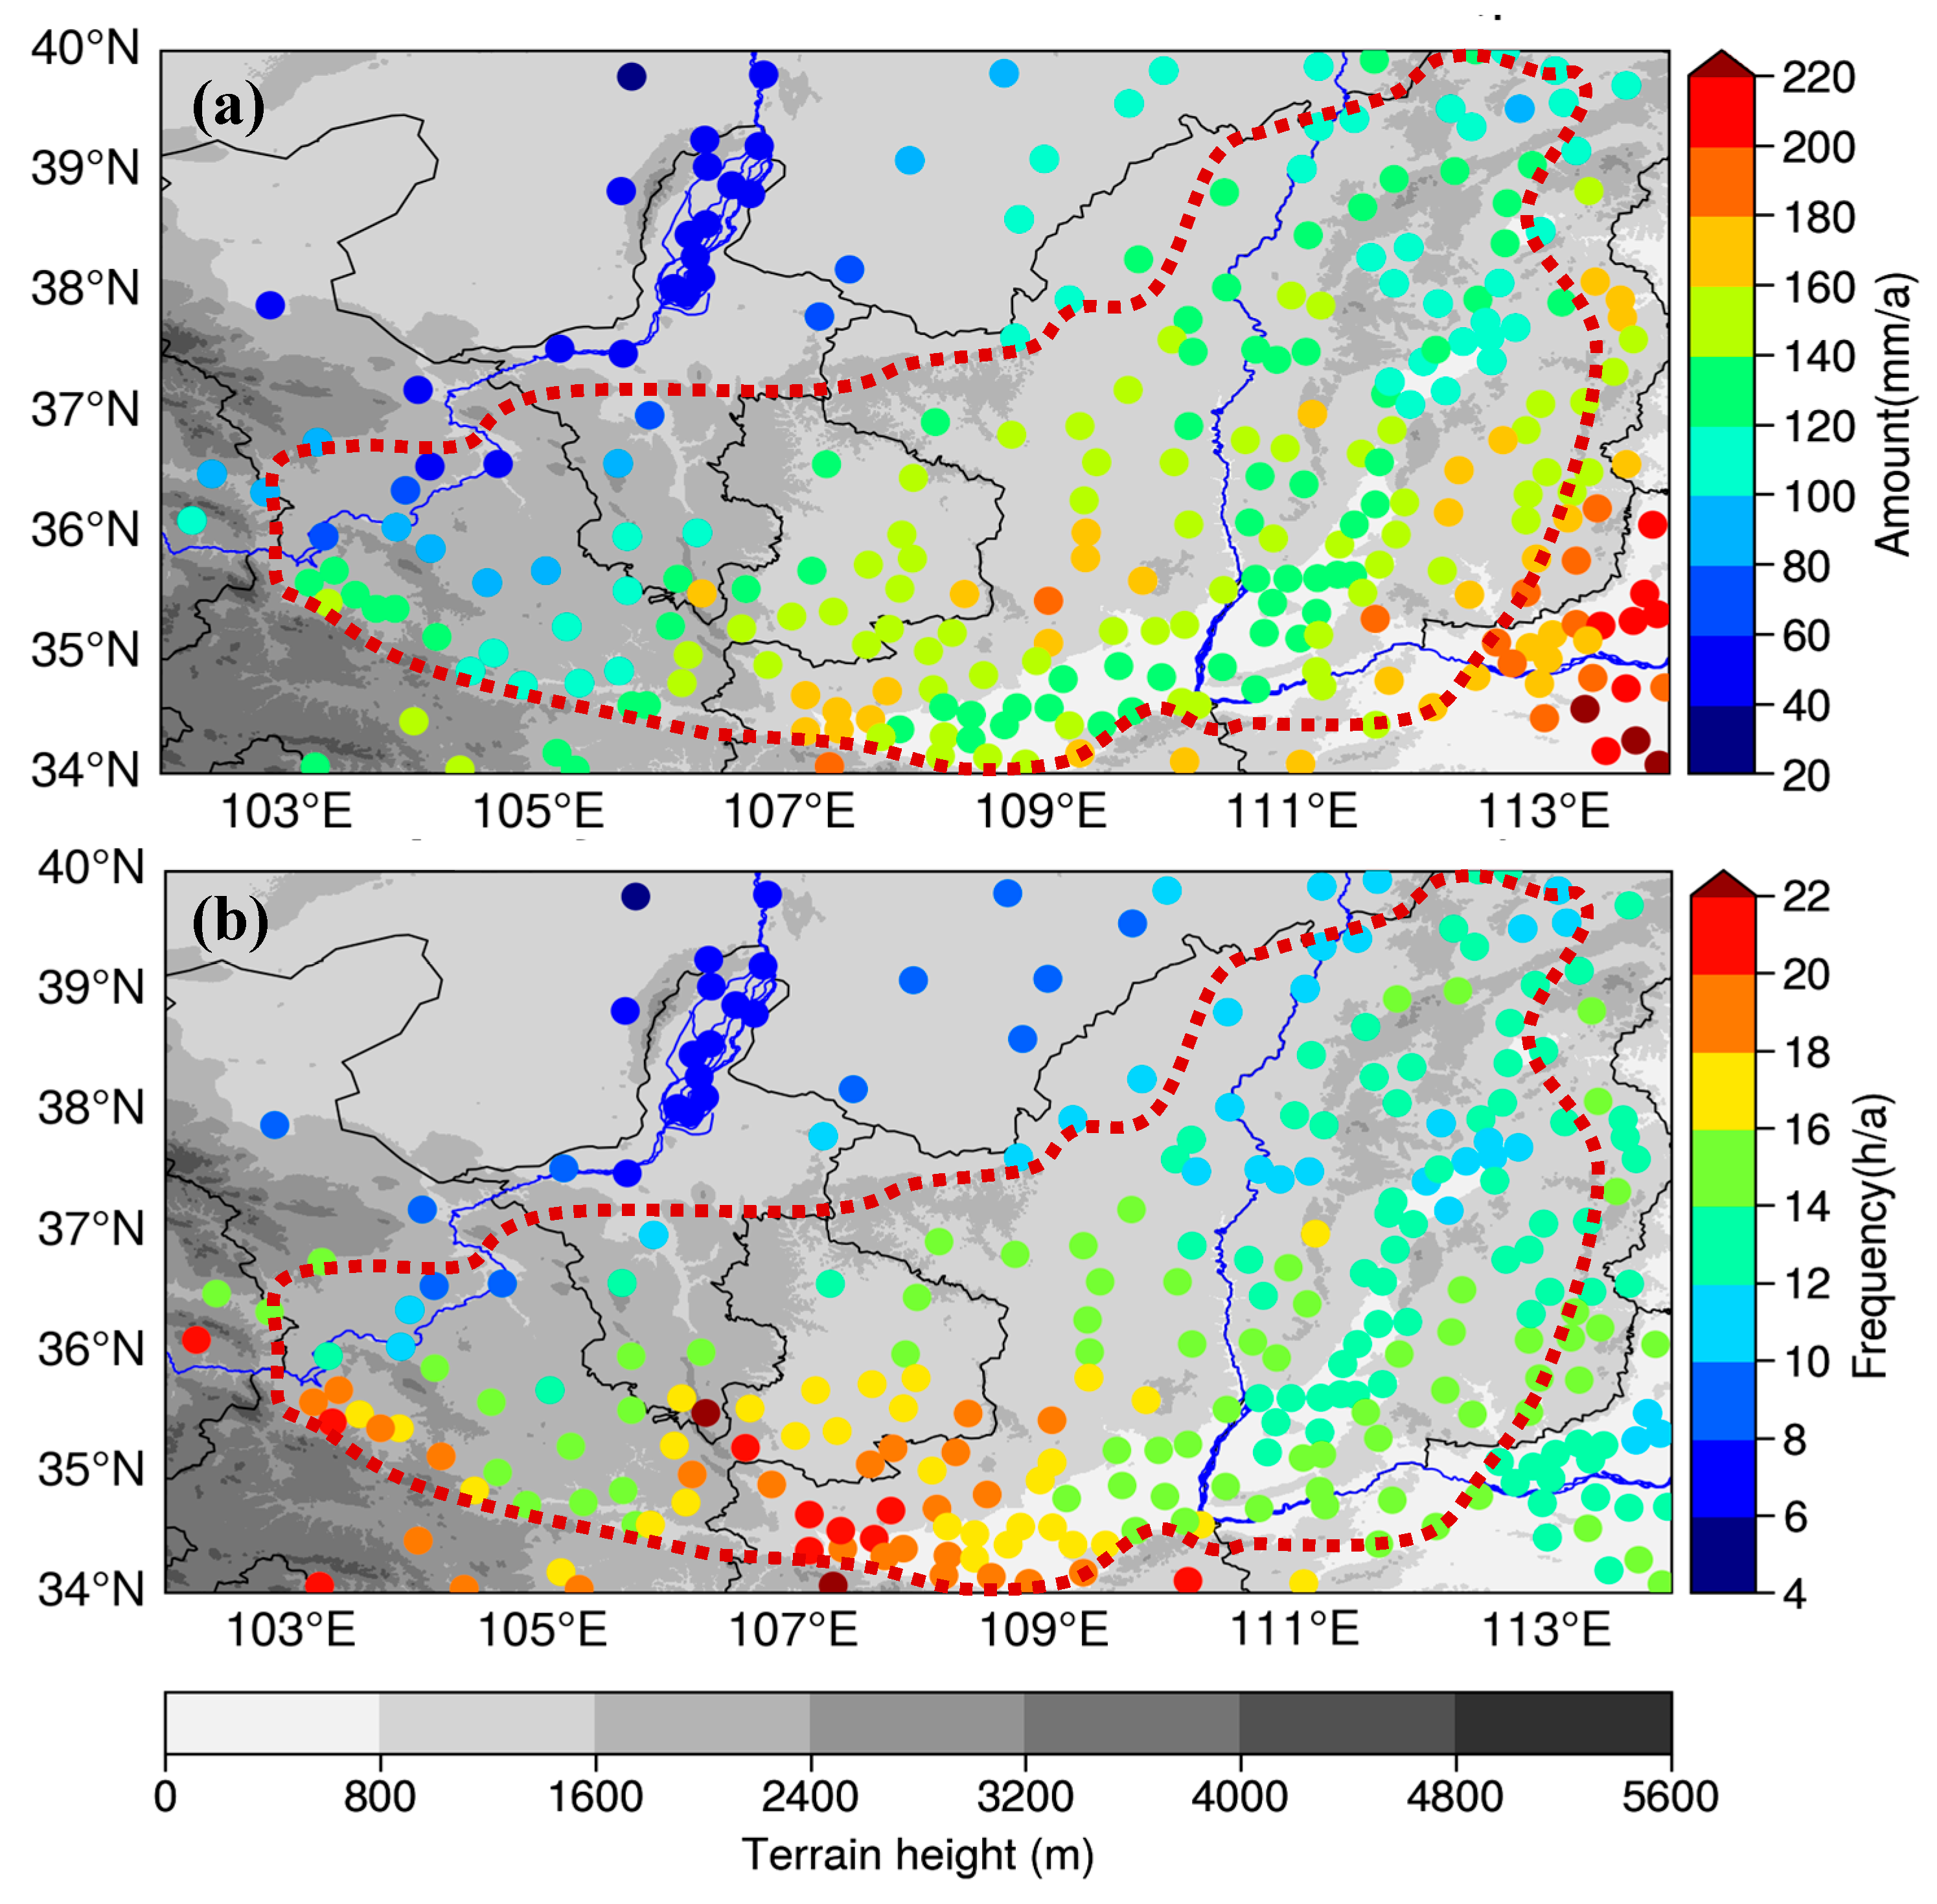
This study integrates three primary datasets: (i) Hourly precipitation observations (1981–2023) from 275 China Meteorological Administration (CMA) monitoring stations, all with <2% missing data rates, were used to systematically analyze the spatiotemporal distribution of extreme hourly rainfall (EHR) across the Loess Plateau. As the dots in Figure 2 show, the spatial distribution of the 275 stations exhibits non-uniform characteristics, with higher station density observed in the southern and eastern sectors of the study region compared to the northern and western sectors. Due to this uneven distribution of stations across complex terrain areas, regions with higher station densities generally yield more reliable results than those with lower station densities. (ii) High-resolution atmospheric reanalysis: ECMWF Reanalysis v5 (ERA5) with 0.25°× 0.25° spatial and hourly temporal resolution [29] was utilized to diagnose composite synoptic-scale background environments associated with EHR events. (iii) Integrated topographic data: 15 arc-second resolution bathymetric/topographic grids from the General Bathymetric Chart of the Oceans (GEBCO; https://www.gebco.net) were applied to characterize orographic characteristics of the Loess Plateau and its adjacent regions.
We adopt the Eulerian compositing method, which computes the arithmetic mean of meteorological fields in their native coordinates throughout the study period, to examine the synoptic-scale background environment associated with EHR events over the Loess Plateau. For the compositing procedure, we utilize the precise timestamps of EHR occurrences. In cases where multiple EHR events coincide at the same timestamp, that particular time point is only incorporated once in the composite analysis. We employ Pearson’s correlation coefficient to quantify linear relationships between paired meteorological variables. All correlation results are subsequently validated using Student’s t-test at a 95% confidence level. The sample size for each correlation coefficient corresponds to the number of available data points used in the calculation (excluding missing data). For determining the degrees of freedom, we apply the effective degrees of freedom method proposed by Bretherton [30]. Linear trend analysis is applied to quantify the temporal variation of EHR events (from 1981 to 2023) through least squares regression. The statistical significance of identified trends was rigorously assessed using the non-parametric Mann–Kendall test at a 95% confidence level.

3. Spatial Characteristics

3.1. General Features

As illustrated in Figure 2a, the annual accumulated precipitation across the Loess Plateau predominantly varied between 20 mm and 200 mm, with distinct spatial heterogeneity observed. The southeastern Shanxi and southern Shaanxi regions recorded significantly higher precipitation accumulation than other areas, while the northwestern Loess Plateau showed the lowest values. Specifically, the plateau’s southeastern sector received substantially greater annual precipitation (maximum > 220 mm), contrasting sharply with the arid northwestern regions. A distinct southeast-to-northwest gradient in annual precipitation distribution is observed, showing a progressive decrease that aligns consistently with the spatial pattern of moisture availability across the region (discussed in Section 4).
In this study, according to the standard provided by the National Standard of the People’s Republic of China [31], we employ the 95th percentile as the threshold for defining EHR events, applying this consistent criterion across all 275 study stations. The spatial distribution of rainfall intensity thresholds for EHR events across all monitoring stations encompassing the Loess Plateau and its surrounding regions is presented in Figure 3. Analysis reveals a pronounced regional unevenness in EHR threshold values, with the most substantial precipitation thresholds (the maximum value exceeds 8.4 mm/h) consistently observed at stations located southeast of the plateau. Conversely, meteorological stations situated within the western and middle-southern sectors of the Loess Plateau, along with those positioned northwest of the plateau, exhibit markedly lower threshold values within the study area. Overall, the EHR thresholds across the plateau predominantly ranged between 2.4 and 6.6 mm/h, exhibiting a general spatial pattern of a decrease from the southeastern to the northwestern regions. This distribution differs from those of the annual accumulated precipitation, as EHR frequency also affects the EHR thresholds.

3.2. Key Characteristics of Extreme Hourly Rainfall

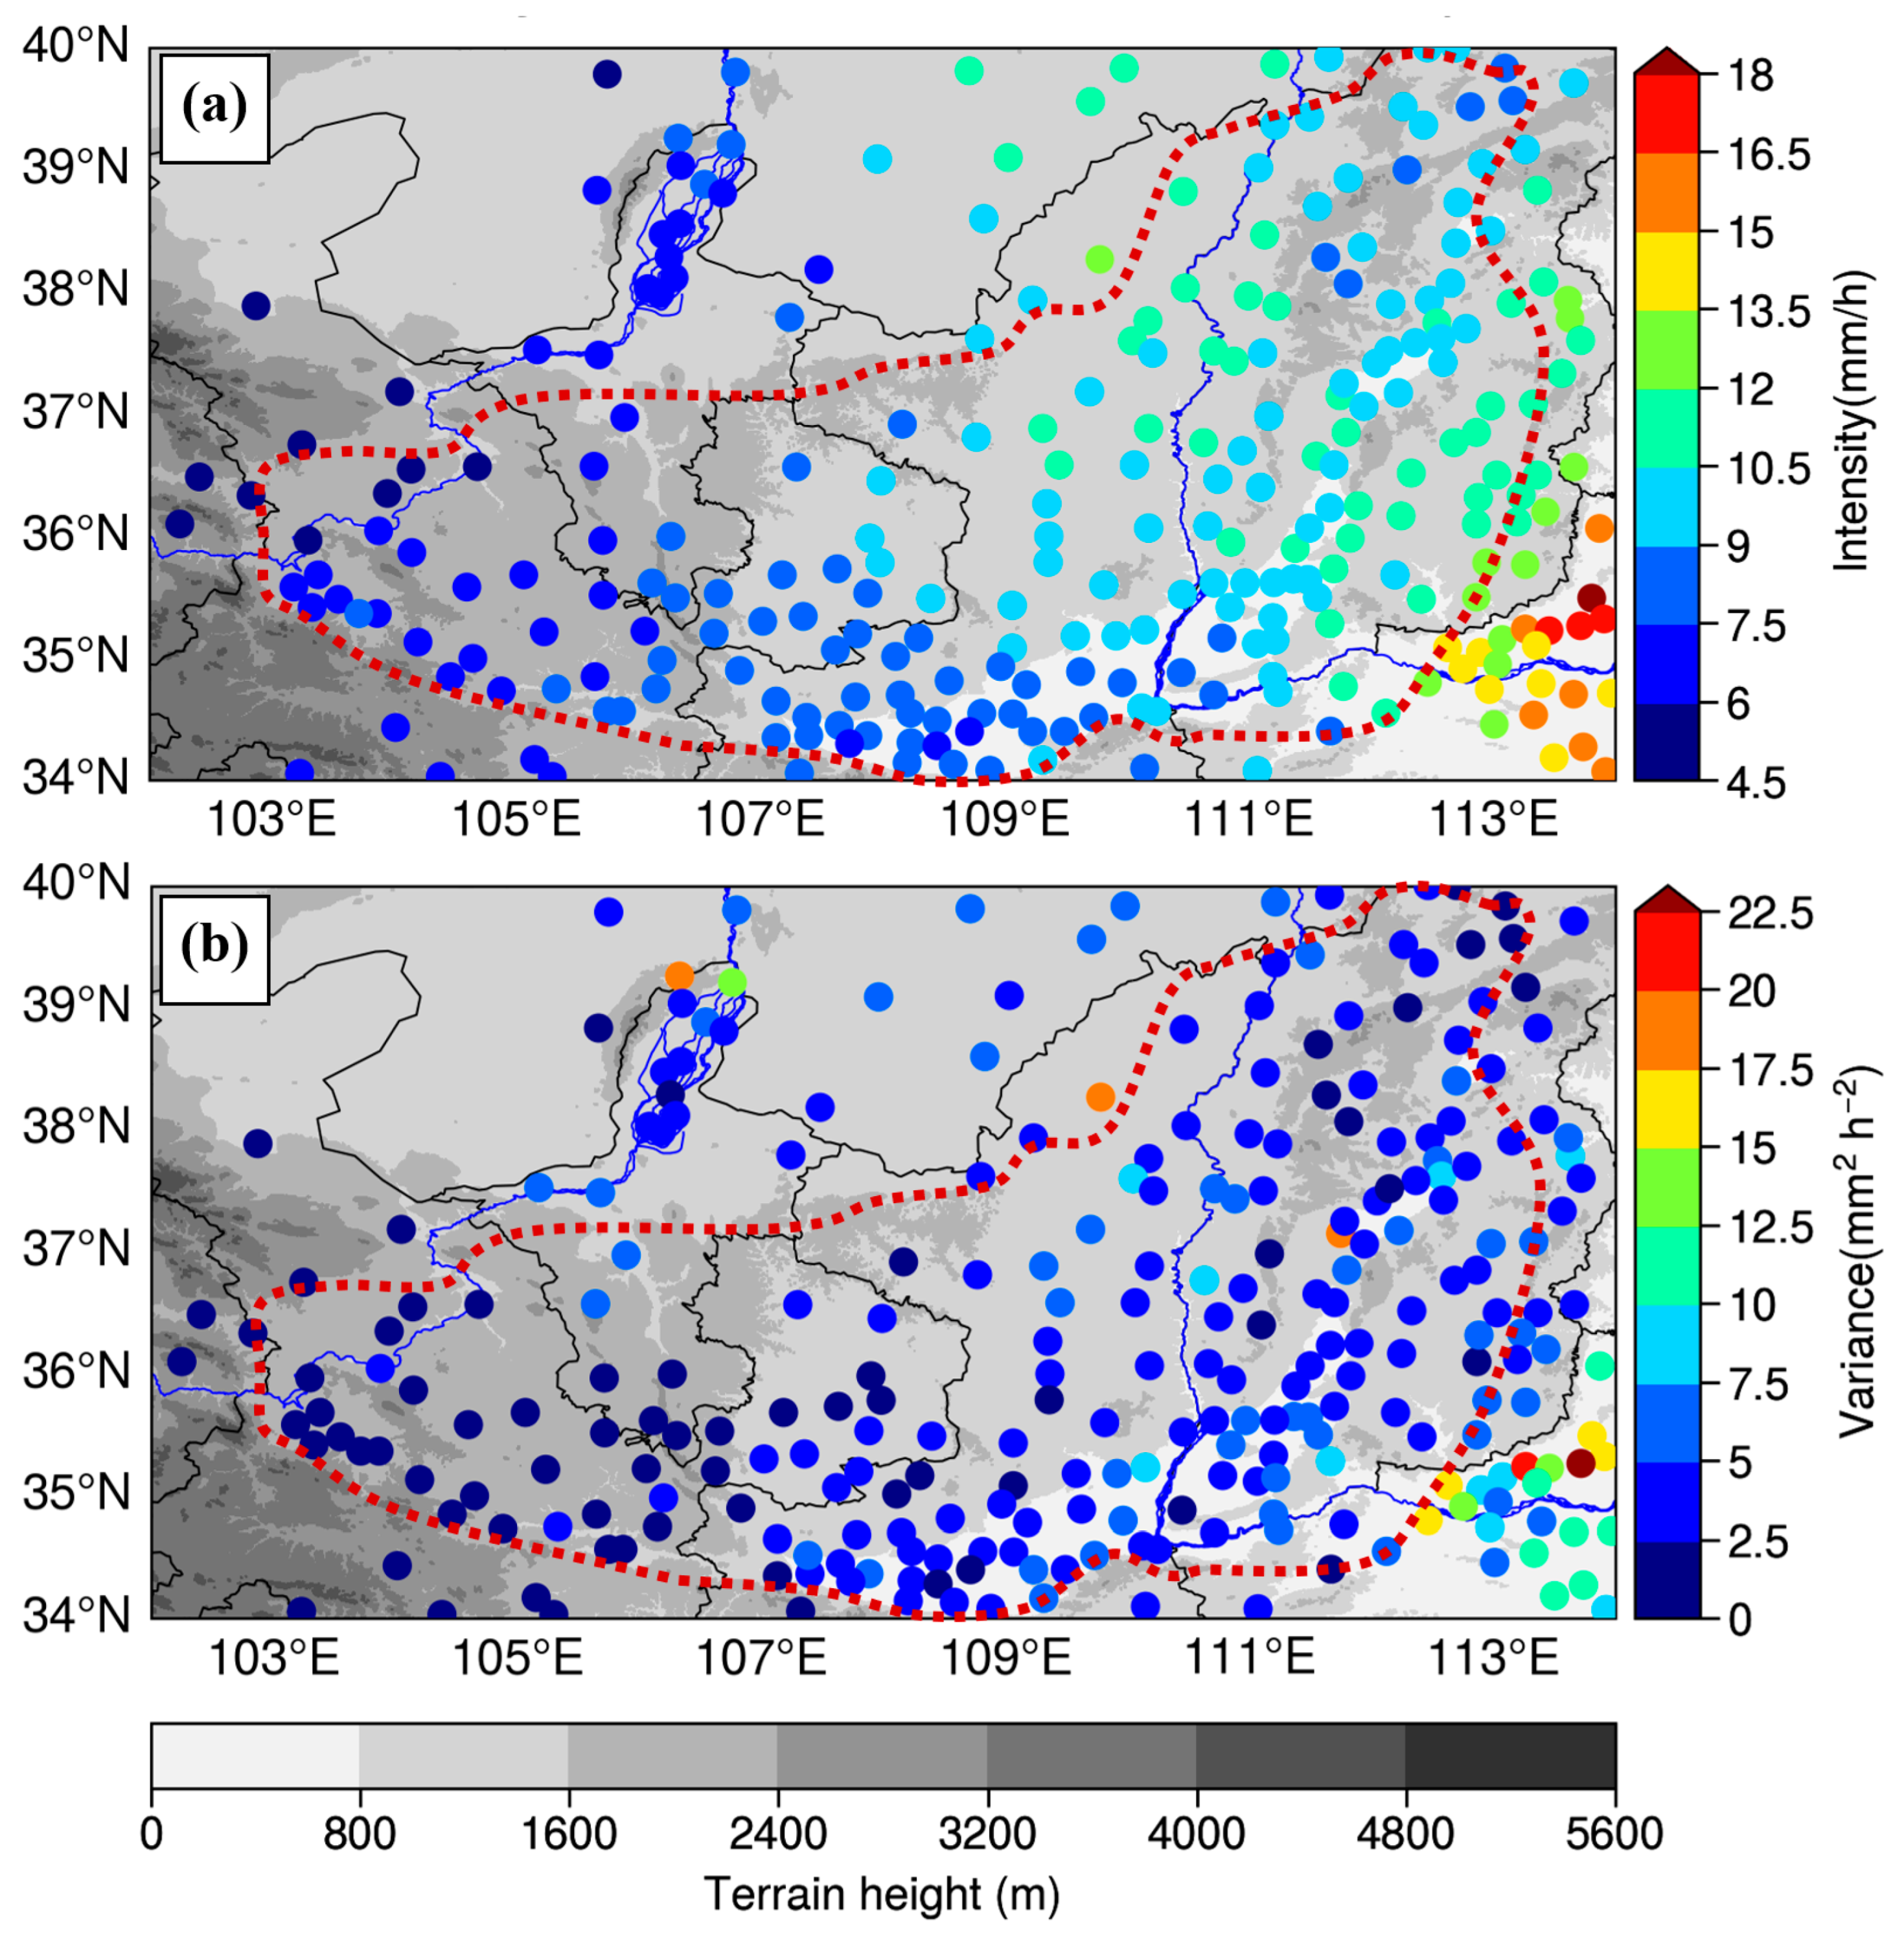
From Figure 4a, it is clear that the temporal mean intensity of EHR across the Loess Plateau exhibits pronounced spatial heterogeneity, ranging predominantly from 4.5 mm/h to 13.5 mm/h, with significantly higher values observed in the eastern sector compared to the western sector. Notably, the EHR intensity southeast of the plateau (the maximum value > 18 mm/h) substantially exceeds that of the regions northwest of the plateau (<9 mm/h), mirroring the spatial distribution pattern of EHR thresholds shown in Figure 3. In addition, mountainous valleys in Shaanxi Province display notably weaker EHR intensity compared to their counterparts in Shanxi Province, implying geomorphology represents but a single component within a suite of dominant controlling parameters for EHR. The variances of EHR primarily range from 0 to 7.5 mm2/h2 (Figure 4b), with peak values exceeding 17.5 mm2/h2 observed predominantly in northern Ningxia, northern Shaanxi, central Shanxi, and northern Henan. These elevated variance regions exhibit particularly pronounced EHR intensity fluctuations, indicating areas where event strength demonstrates the highest degree of spatial variability and unpredictability.
The annual mean frequency of EHR events exhibits a distinct spatial distribution pattern compared to that of the annual accumulated precipitation (see Figure 2a,b for comparison). The mean annual frequency predominantly ranges between 6 and 22 occurrences per year. Notably, the adjacent regions of Ningxia, Shaanxi, and Gansu exhibit the highest occurrence frequency, surpassing 22 events annually, whereas the border areas between Gansu and Ningxia show the lowest frequency, with fewer than 8 events per year. Furthermore, mountainous valleys in Shaanxi Province display significantly higher EHR occurrence rates compared to those in Shanxi Province. Geospatial analysis reveals a distinct southwest-to-northeast decreasing trend in event frequency. This distribution differs notably from those of the annual accumulated precipitation and the EHR thresholds. In addition, the regions situated southeast of the Loess Plateau typically experience 10–16 annual occurrences, substantially higher than the frequencies observed northwest of the plateau, which remain below 12 occurrences per year.
To systematically examine the potential linkages between EHR characteristics and topographic influences, we quantified the relationships through Pearson correlation analysis between 43-year climatological means of EHR frequency, intensity, and accumulated precipitation (defined as the annual mean total precipitation from all EHR events at each station) with corresponding station elevations. As shown in Figure 5, statistical analysis reveals a significant positive correlation (coefficient ≈ 0.11, exceeding the 90.0% confidence level) between EHR frequency and elevation across the Loess Plateau and surrounding regions. This relationship suggests that EHR events occur more frequently in higher-elevation areas, likely due to orographic precipitation enhancement on windward slopes. In contrast, both mean rainfall intensity (coefficient ≈ −0.63, exceeding the 99.9% confidence level) and annual EHR precipitation (coefficient ≈ −0.45, exceeding the 99.9% confidence level) exhibit significant negative correlations with elevation, indicating that while higher-altitude regions experience more frequent EHR events, individual EHR intensity and total precipitation amounts tend to decrease with increasing elevation, possibly due to moisture availability constraints. These robust statistical relationships collectively underscore the fundamental role of topographic forcing in modulating the spatiotemporal characteristics of EHR across the Loess Plateau and its surrounding areas. This is because, over the complex terrain, slope-aspect-induced variations in solar radiation and valley wind-driven adiabatic processes generate distinct anisotropic thermal gradients [32]. These topography-induced thermal heterogeneities significantly modify boundary layer energy distribution and buoyancy dynamics, consequently modulating the probability of convective initiation and ultimately influencing EHR frequency patterns.

4. Synoptic-Scale Background Environment Features

To identify common synoptic-scale favorable conditions for EHR events over the Loess Plateau, we composite their background environments using the method described in Section 2. While the ERA5-based composites effectively characterize the large-scale atmospheric environment, they possess inherent limitations in resolving mesoscale features directly associated with EHR occurrence. Additionally, due to its 0.25° × 0.25° horizontal resolution, ERA5 demonstrates limited capability in capturing small-scale topographic influences that may significantly affect EHR distribution.
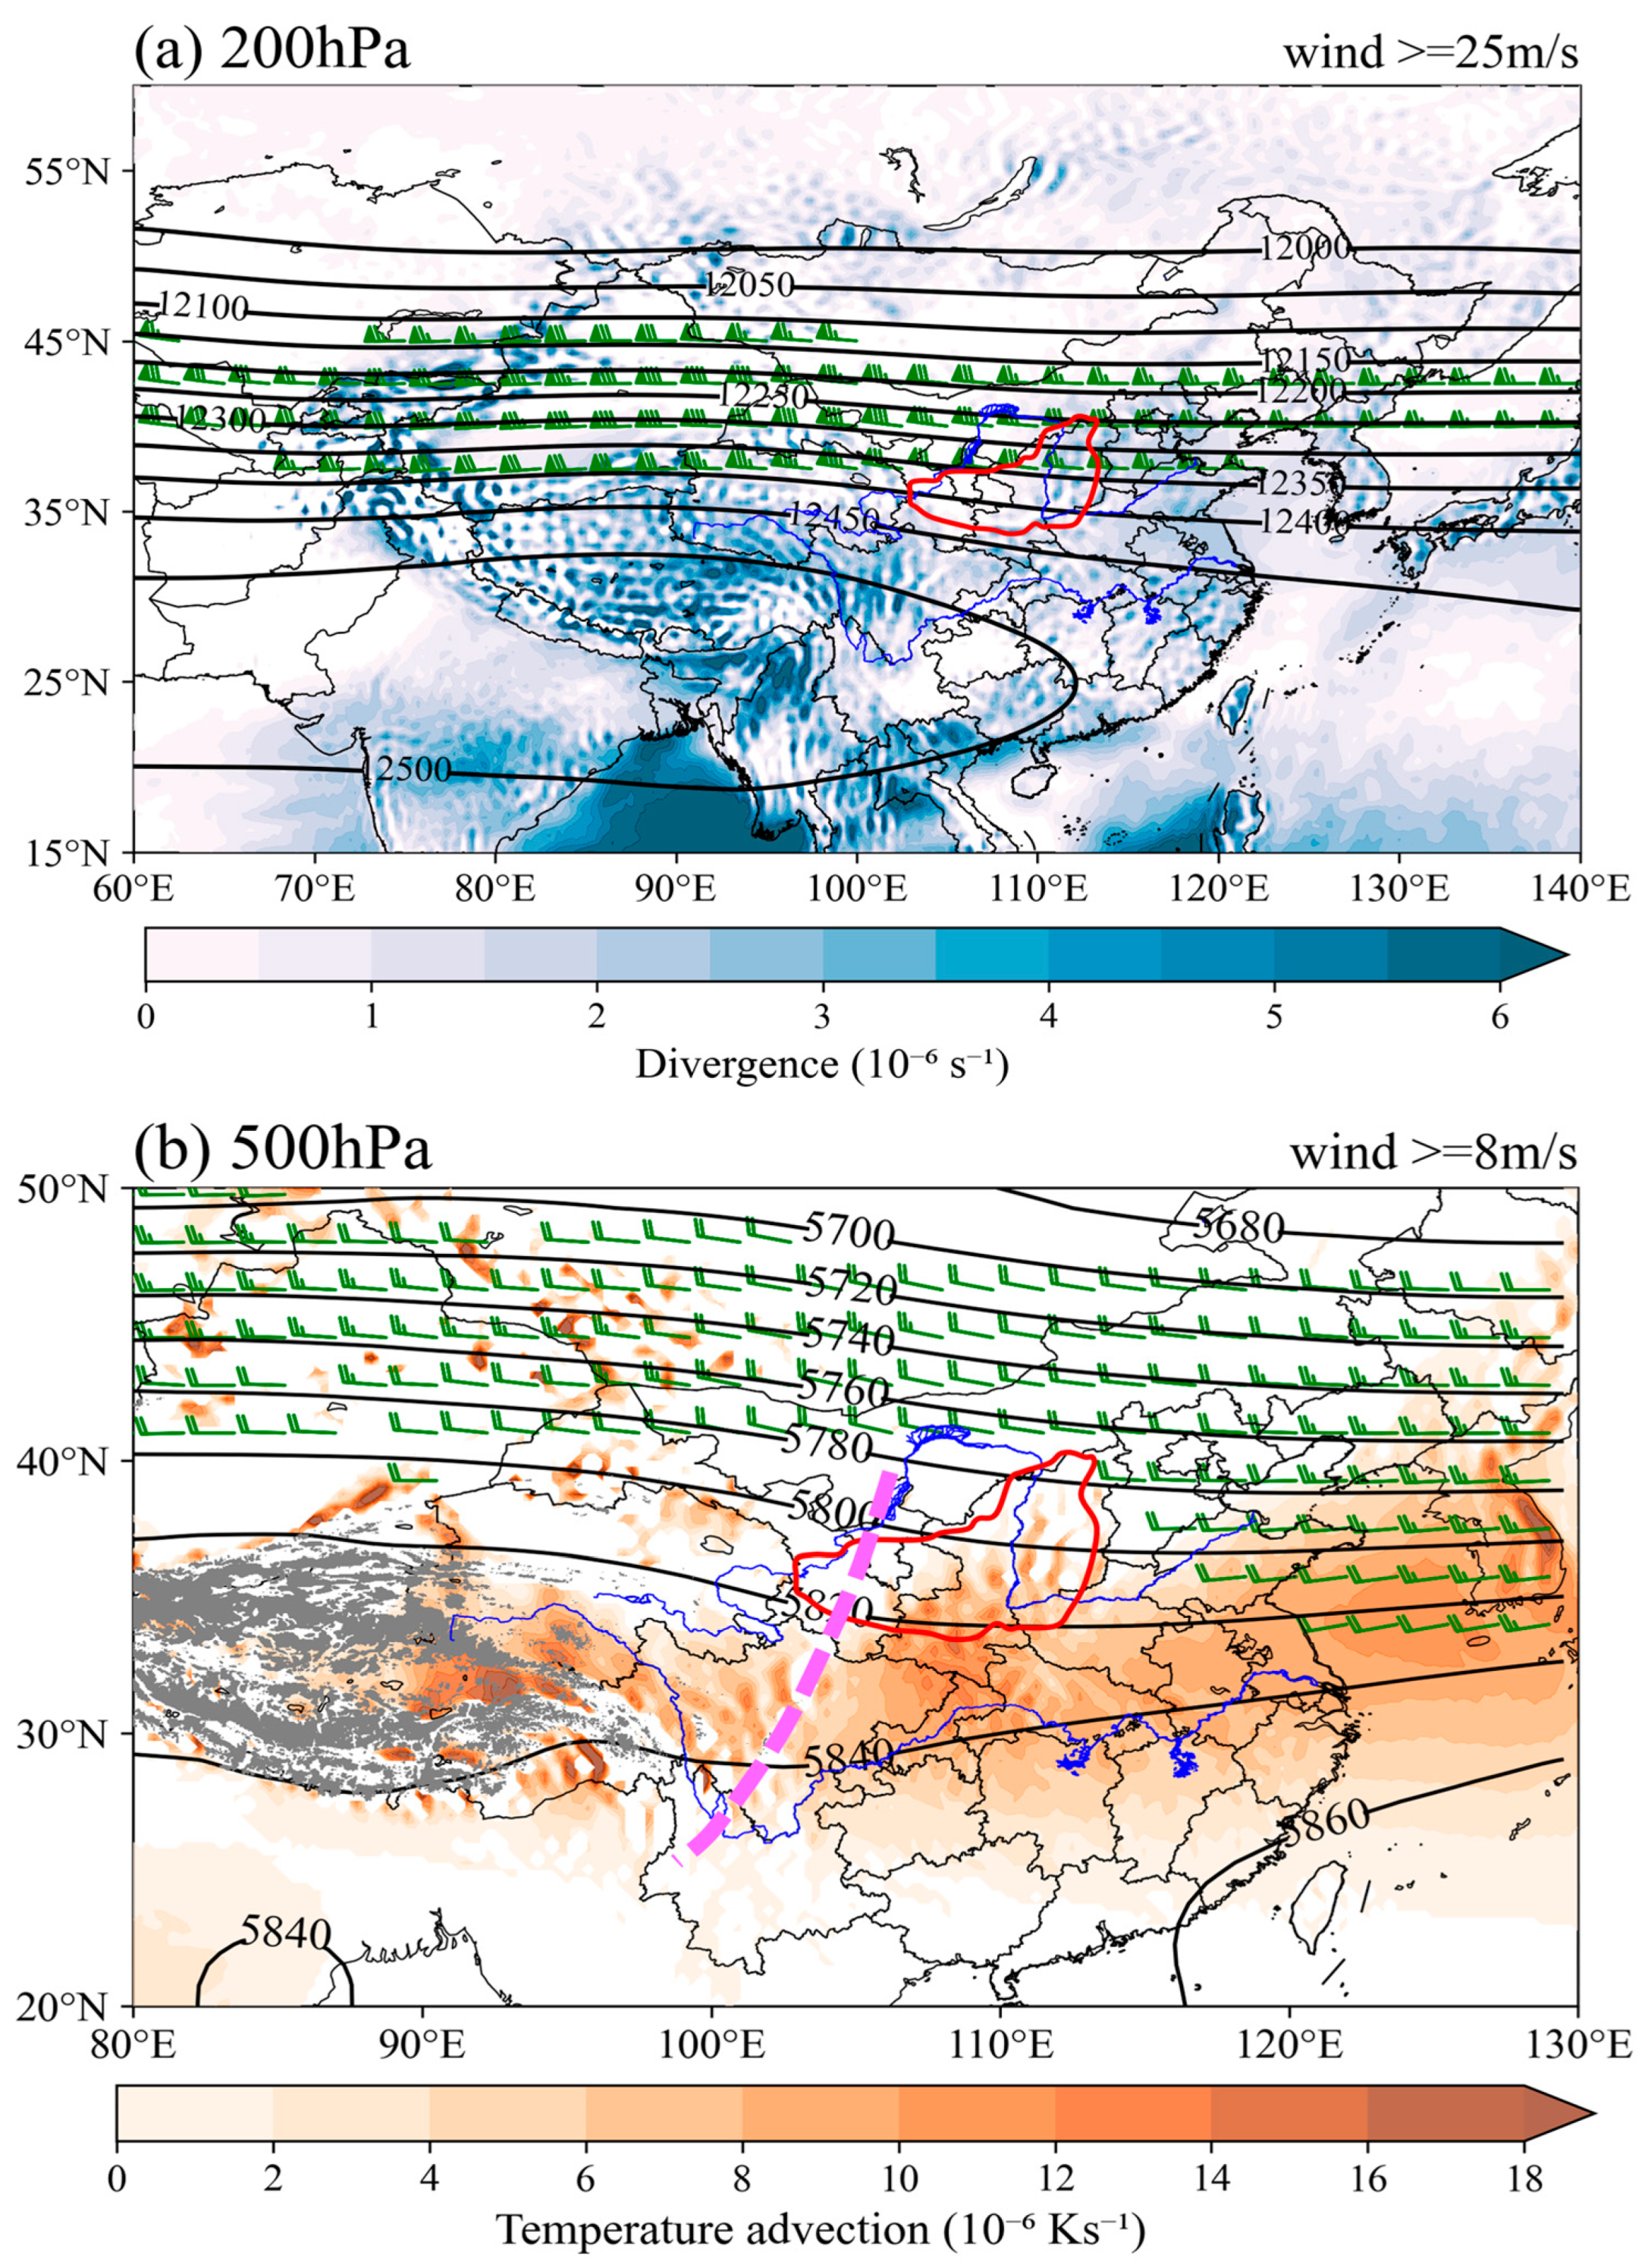
As Figure 6a shows, in the upper troposphere, the synoptic-scale background environment is characterized by a robust South Asia High centered over the Indian Peninsula, southern Tibetan Plateau, and Southern China. To the north of this anticyclonic system, a pronounced upper-level jet stream exhibits quasi-stationary behavior mainly within the 35–45° N zonal band, with the Loess Plateau positioned predominantly along its southern flank and its northern sector lying directly beneath the jet core. Over the eastern sector of the Loess Plateau, the upper troposphere is mainly dominated by divergence, which creates dynamically favorable conditions for the sustenance and intensification of vertical motion, thereby providing a crucial mechanistic explanation for the genesis of EHR events in this region.
In the middle troposphere, the Western Pacific Subtropical High exhibits its primary position eastward of southeastern China (Figure 6b). Northwestward of this high-pressure system, a short-wave trough persists in the region east of the Tibetan Plateau. The Loess Plateau is predominantly positioned within the forward sector of this trough, characterized by prevailing warm temperature advection. As elucidated by quasi-geostrophic theory, such warm advection facilitates ascending atmospheric motions [33,34,35], while Markowski and Richardson [36] further demonstrate its contribution to the reduction of surface-level pressure—both mechanisms being conducive to the formation of EHR events. Poleward of the shortwave trough, intense westerly flow prevails, with its core predominantly confined within the latitudinal belt between 40 and 50 degrees north. The northerly wind component associated with the strong westerly flow facilitates the advection of colder air masses from higher latitudes southward, thereby enhancing precipitation intensity through dynamic interactions with warmer, moisture-laden air masses prevalent in lower latitudes [37,38].
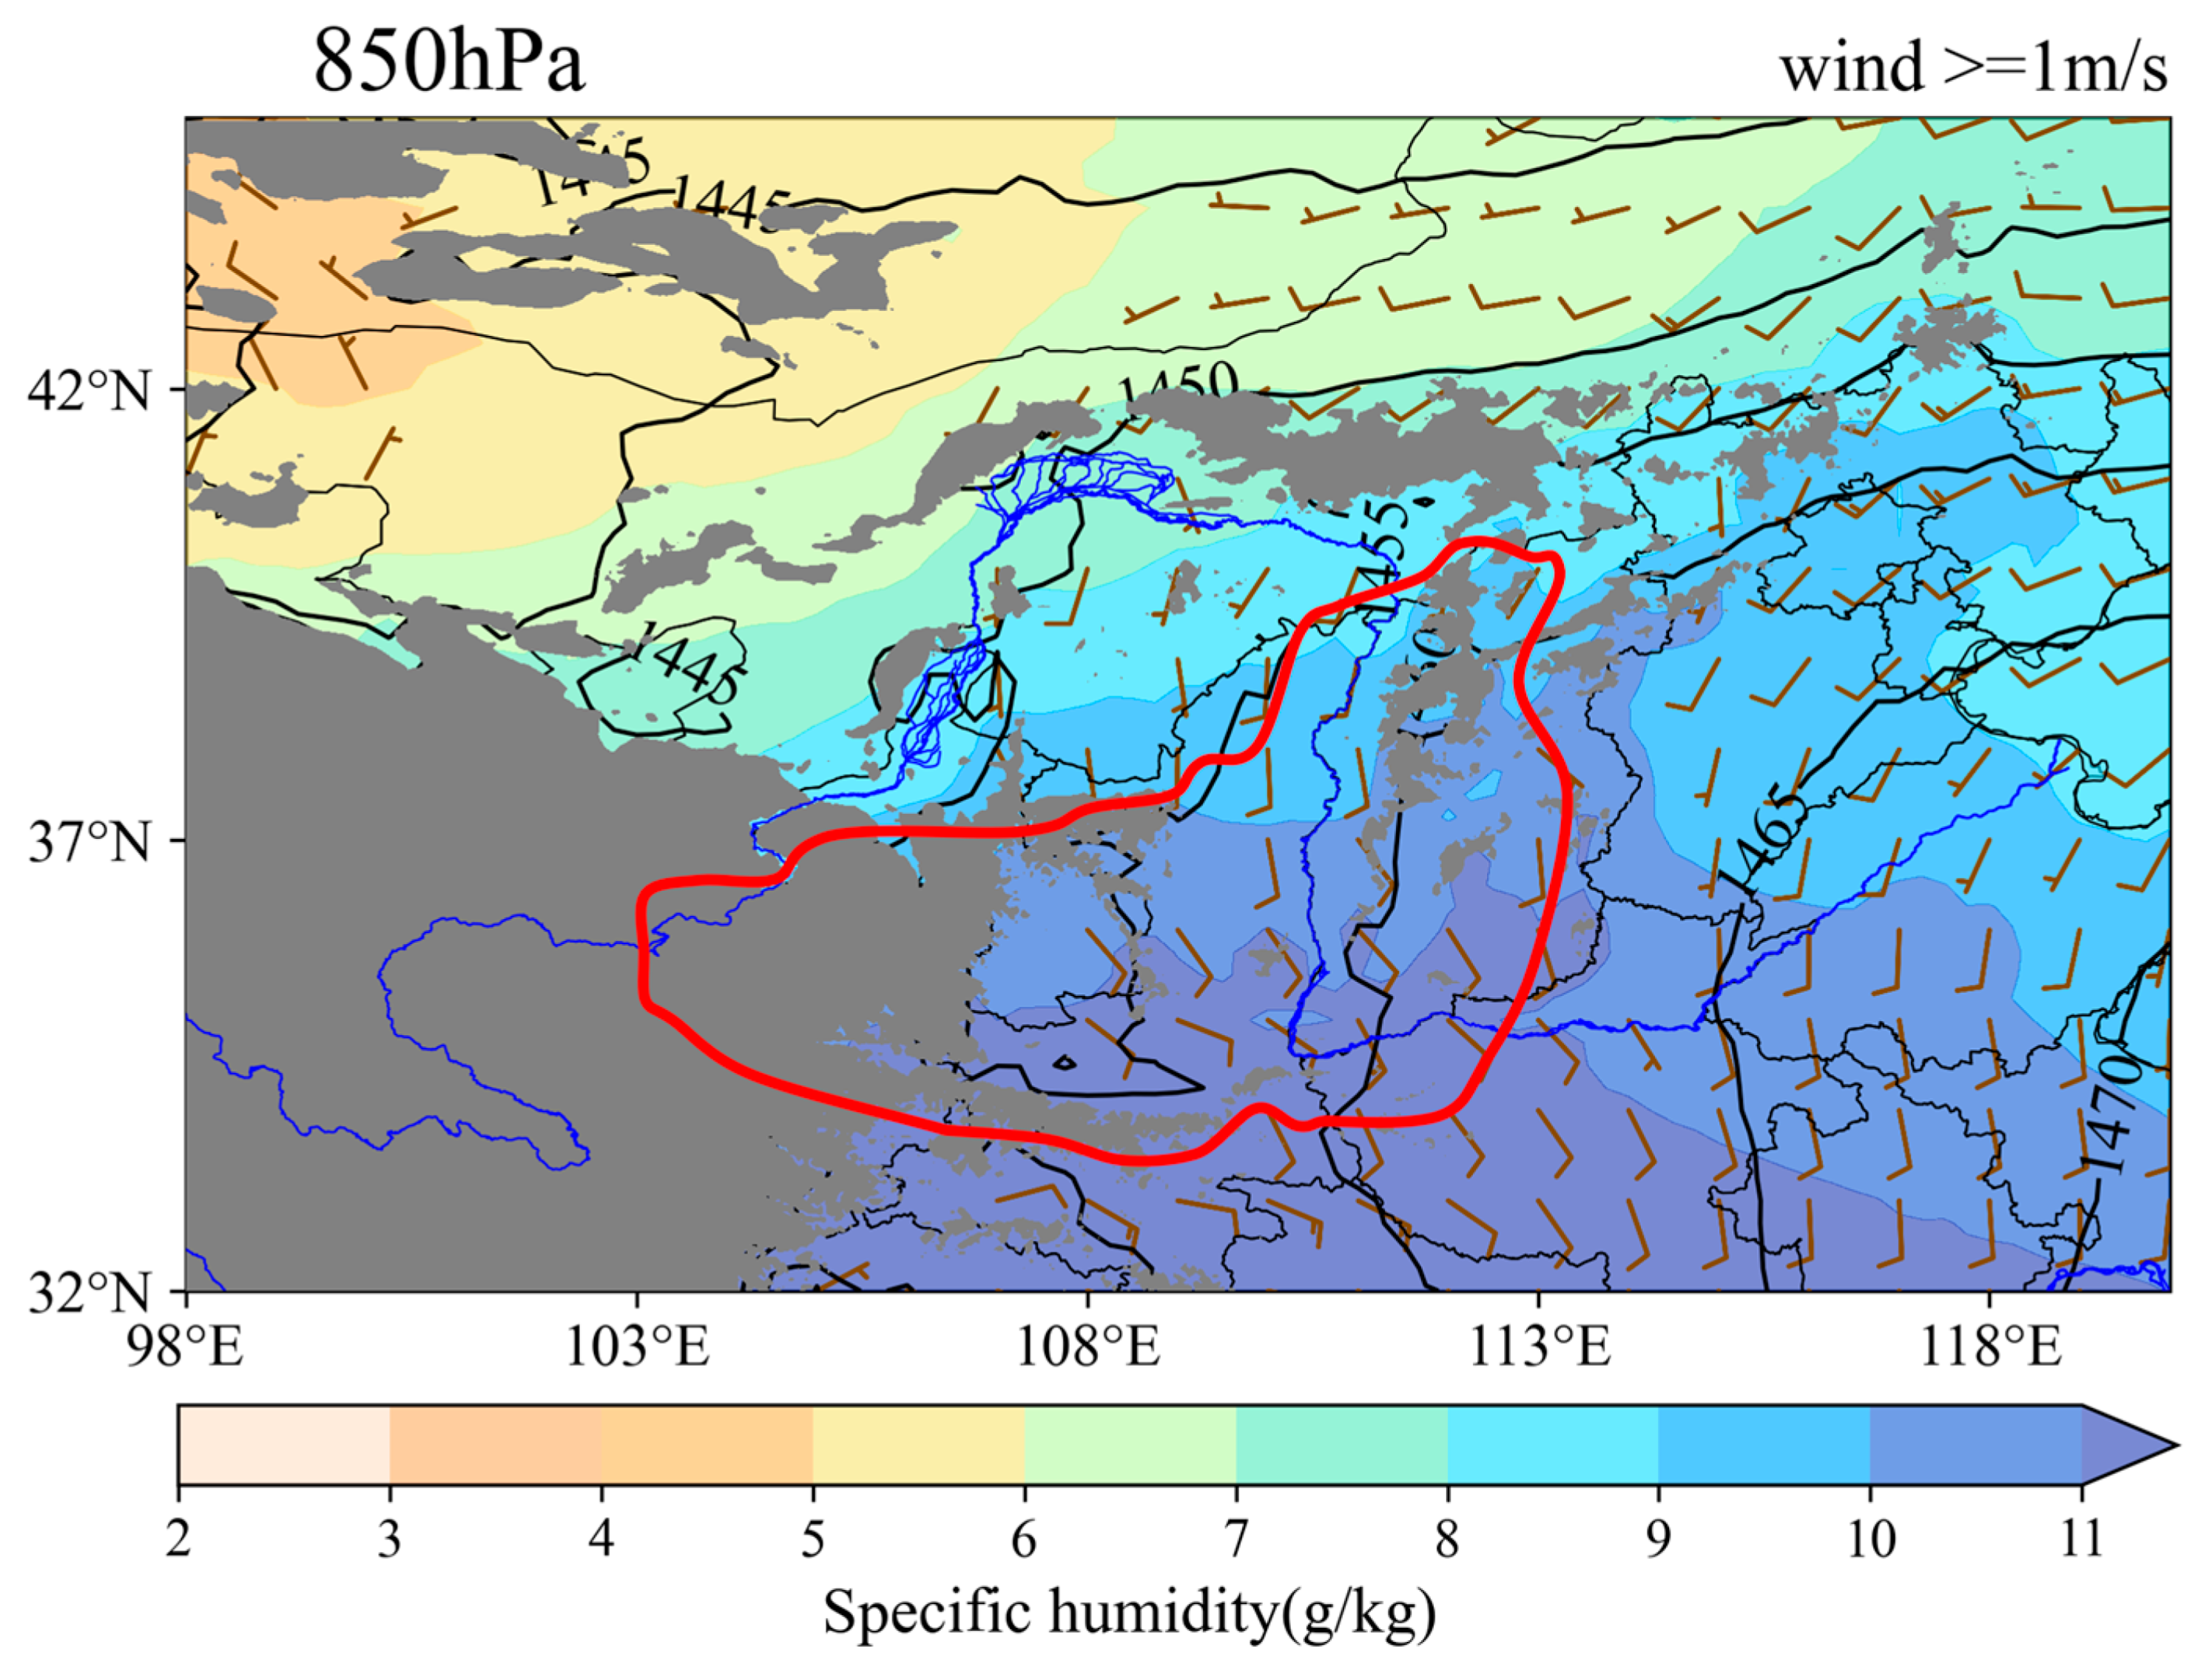
In the lower troposphere, the atmospheric circulation over the Loess Plateau is predominantly characterized by distinct southerly and southeasterly wind regimes associated with the summer monsoon (Figure 7). The wind speed exhibits a distinct northwestward-decreasing gradient, generating significant convergence within this region. This lower-tropospheric convergence dynamically induces ascending motion through fundamental fluid continuity principles [33], thereby creating favorable dynamical conditions for EHR events. Furthermore, these robust southerly and southeasterly flows efficiently transport substantial moisture, characterized by a marked southeastward-increasing specific humidity gradient, into the Loess Plateau, providing essential moisture supply that serves as a critical prerequisite for EHR occurrence. As mentioned above, the spatial pattern of southerly and southeasterly summer monsoon winds provides a partial explanation for the observed southeastward increase in EHR thresholds shown in Figure 3.
Overall, the spatial distribution of upper-level divergence, mid-level warm advection, and lower-level convergence reveals distinct regional differences across the Loess Plateau. The southern and eastern sections exhibit stronger upper-level divergence, more pronounced mid-level warm advection, and more intense lower-level convergence compared to other parts of the plateau. These dynamic and thermodynamic conditions collectively enhance EHR events in these regions. Consequently, the temporal-averaged annual accumulated precipitation and the mean annual occurrence frequency of EHR are significantly higher in the southern and eastern sections, as illustrated in Figure 2.

5. Temporal Features

5.1. Monthly and Diurnal Variations

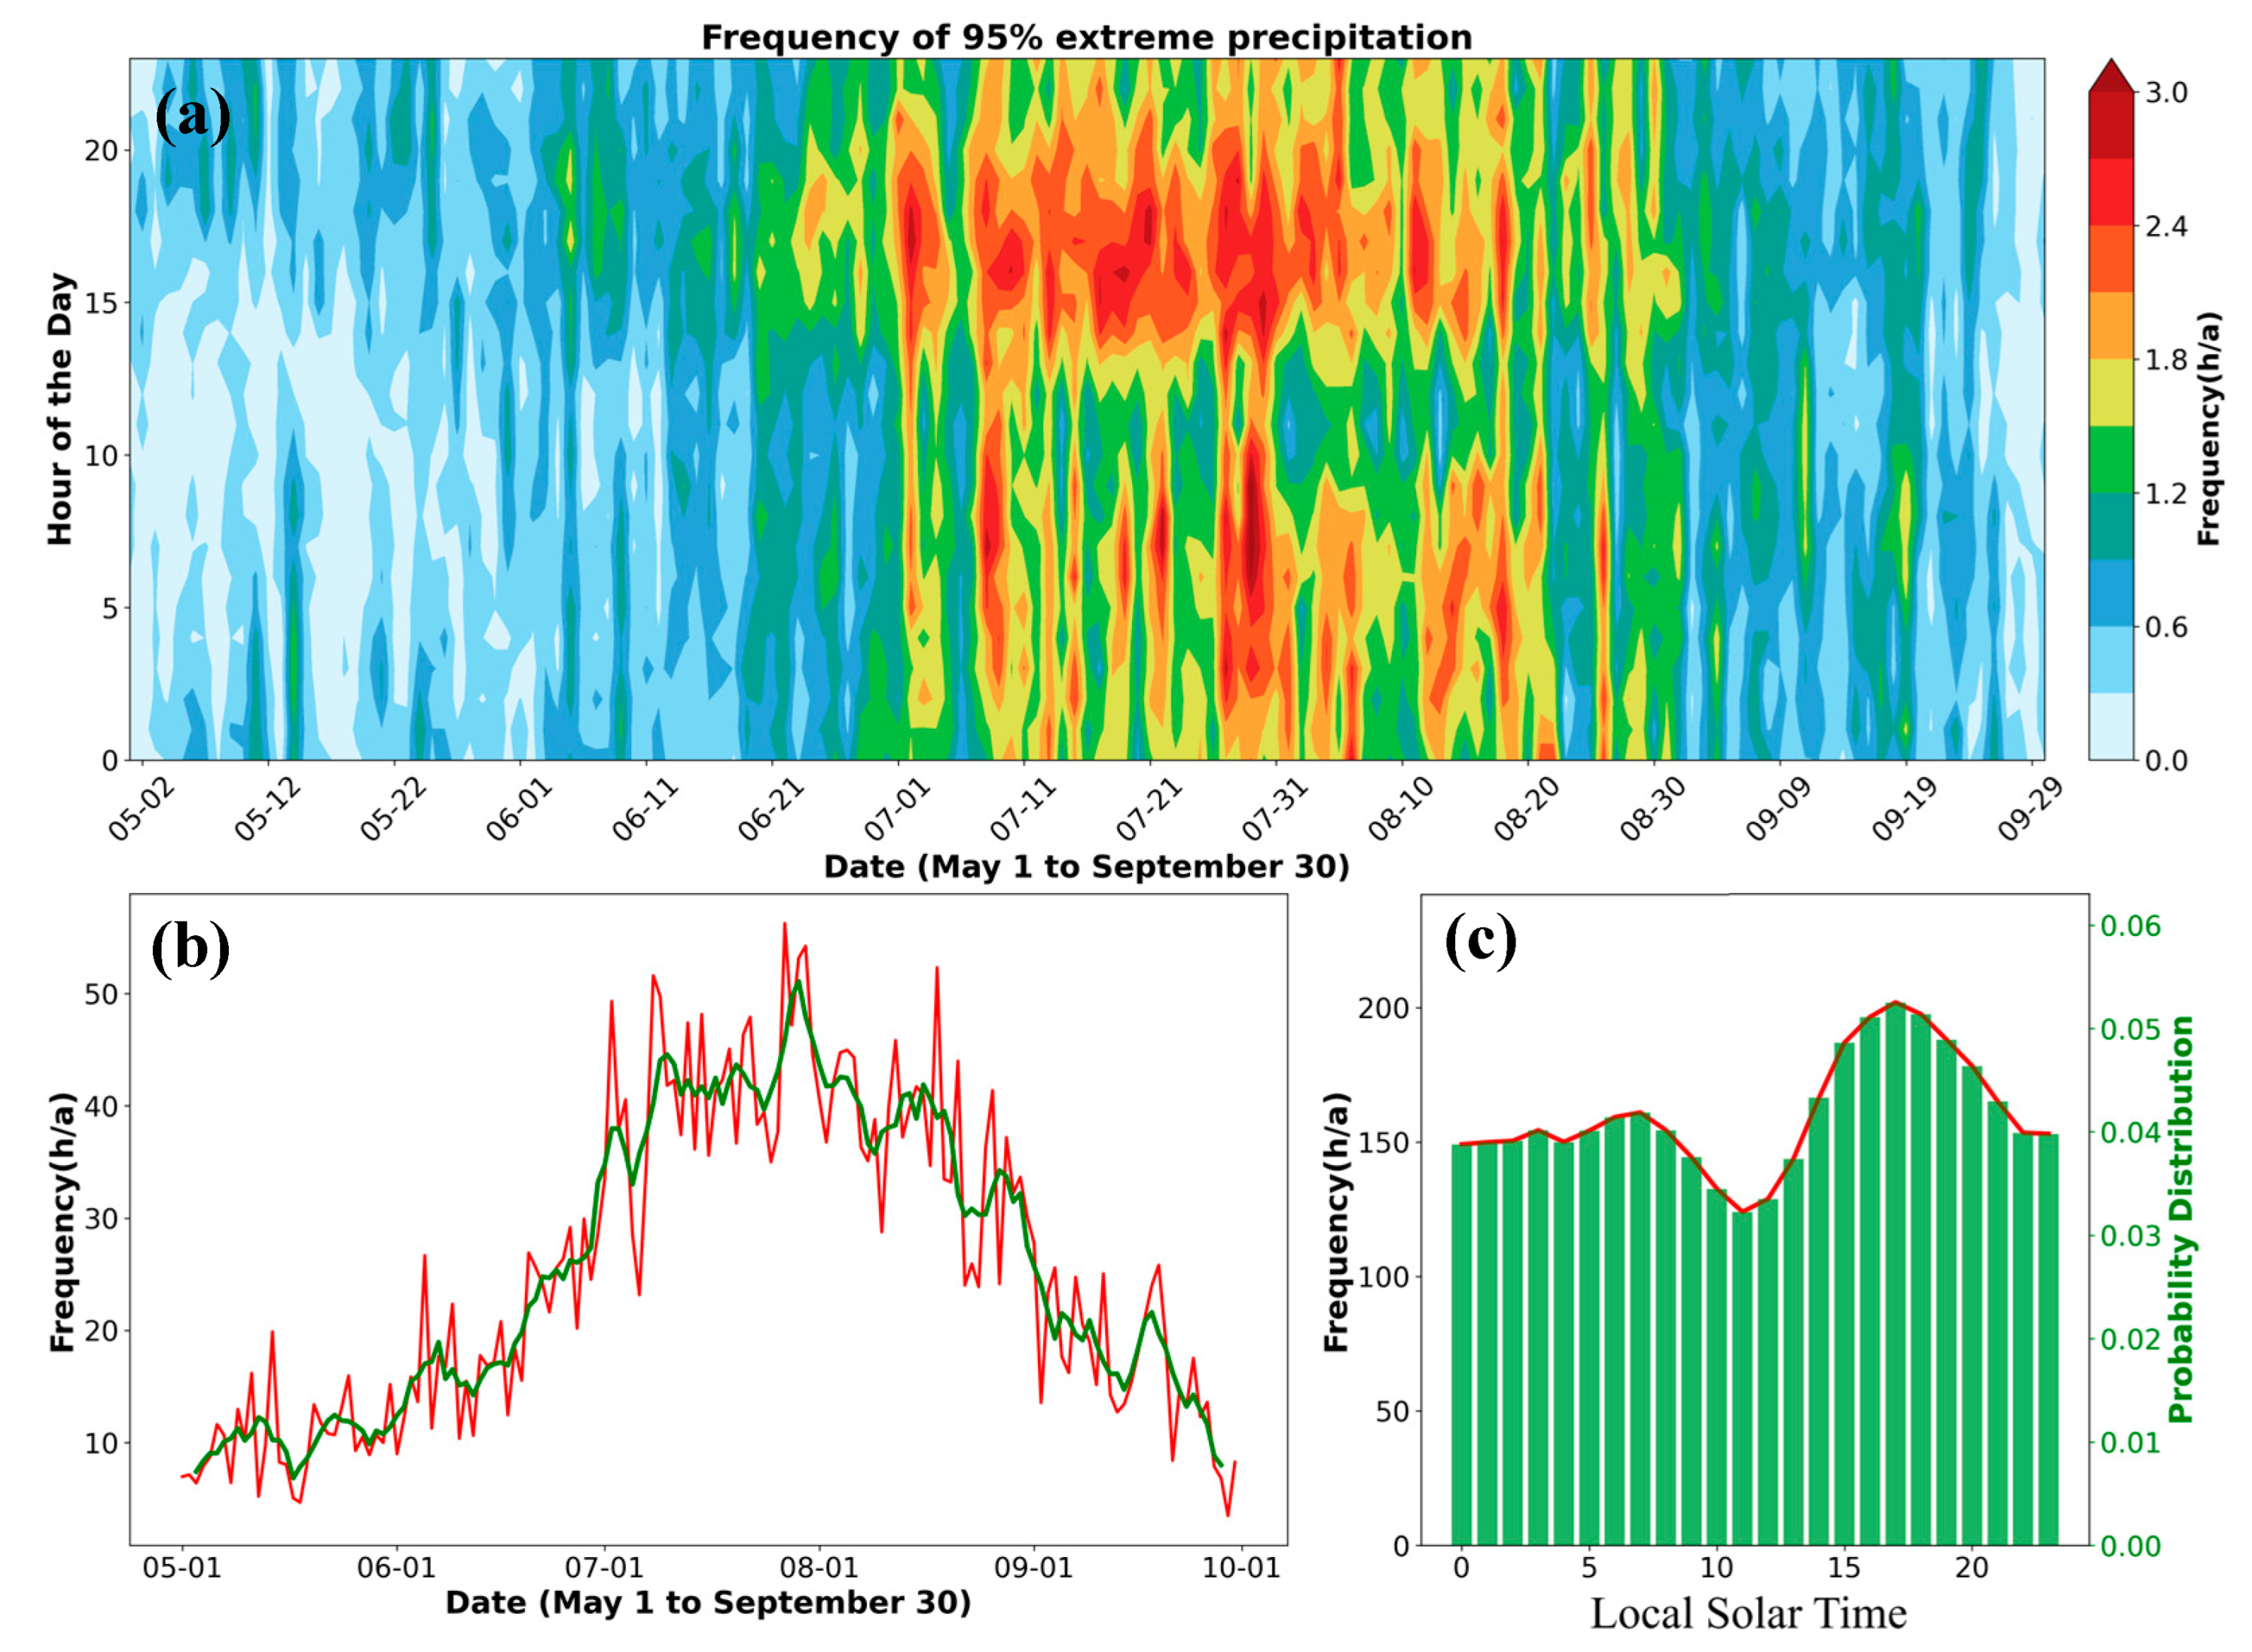
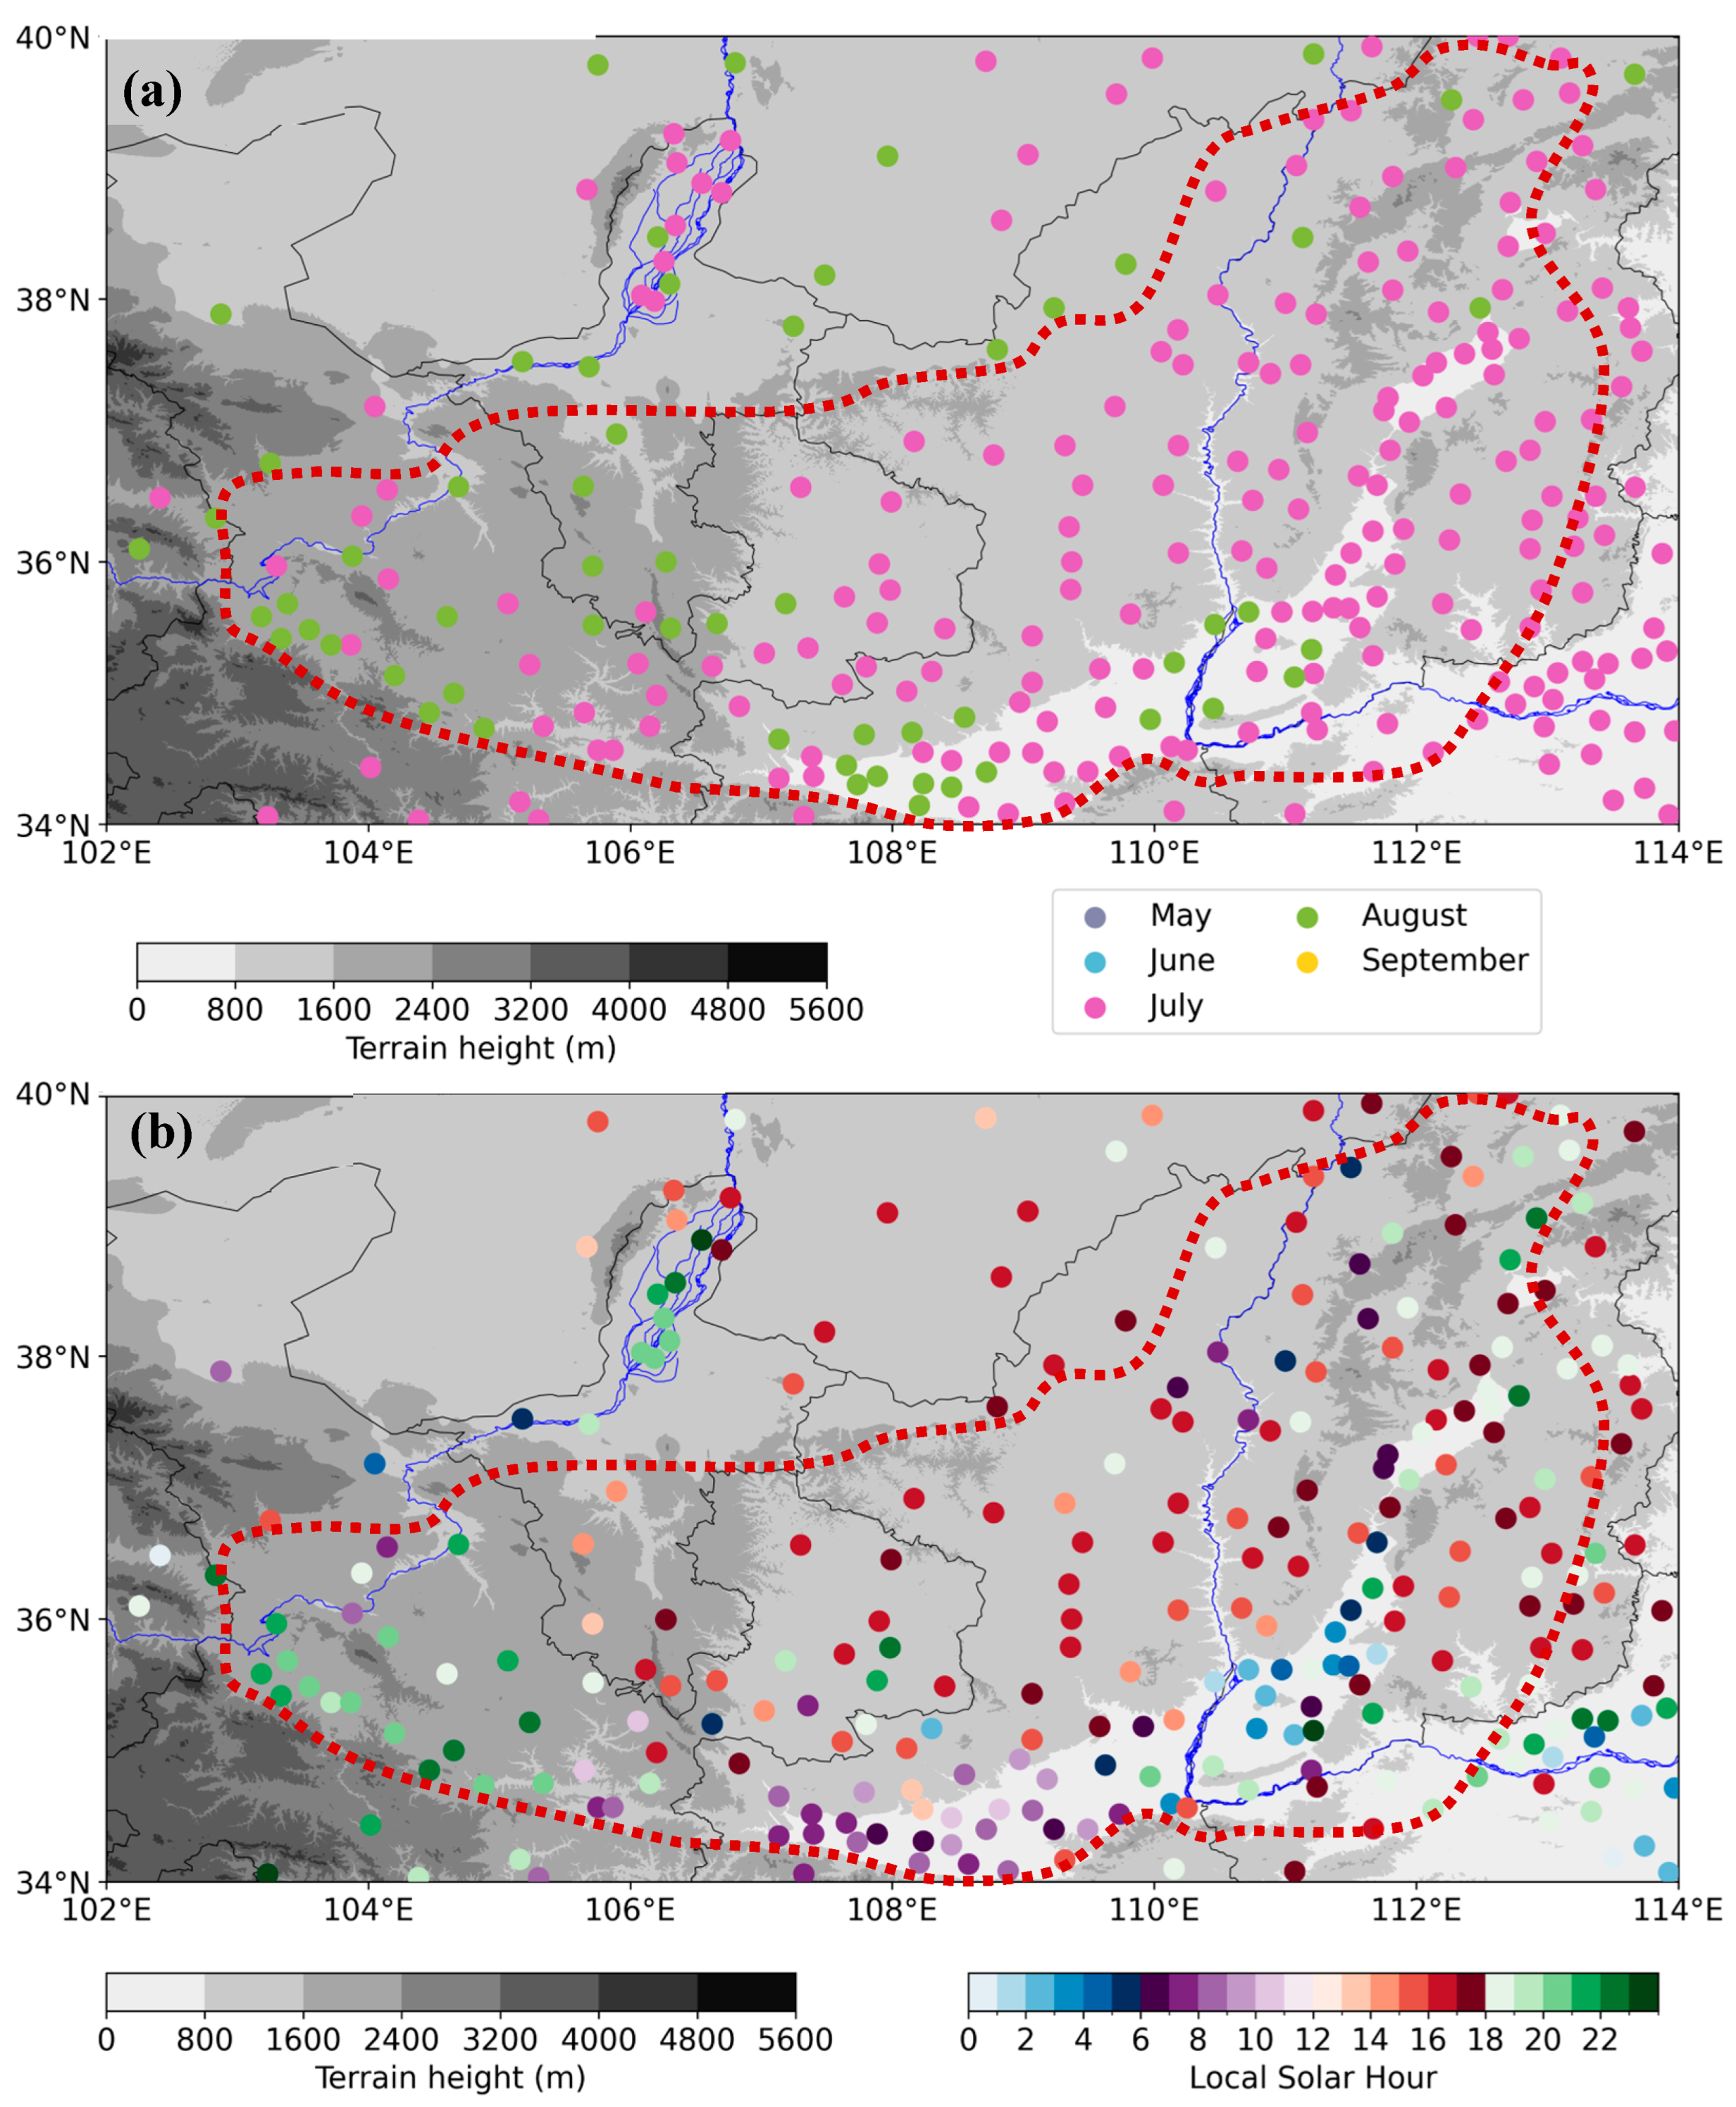
The EHR events over the Loess Plateau exhibit pronounced multi-timescale characteristics, with distinct monthly variations demonstrating a rapid increase in occurrence frequency from 1 May to 1 August followed by a sharp decline from 1 August to 10 October (Figure 8a,b), a pattern that aligns well with the established seasonal progression of the East Asian summer monsoon’s northward advance and subsequent retreat [39,40]. Spatial analysis indicates July as the predominant peak month for EHR frequency across most of the Loess Plateau, with only localized areas in the western and mid-southern regions showing maximal occurrence in August (Figure 9a). A distinct spatial pattern emerges, with all southeastern plateau stations exhibiting unanimous July peaks. In contrast, northwestern and northern regions demonstrate more variable temporal distributions, with stations divided between July and August maxima. This spatial heterogeneity in peak occurrence months highlights regional differences in the spatiotemporal organization of extreme rainfall events across the plateau.
In terms of diurnal variations, the occurrence of EHR events over the Loess Plateau exhibits a distinct bimodal distribution (Figure 8c), characterized by a primary peak at approximately 1700 Local Solar Time (LST) and a secondary peak around 0700 LST, separated by a minimum occurrence frequency near 1100 LST. The bimodal diurnal cycle, significantly influenced by mountain-valley wind circulation, boundary-layer dynamics, differential diabatic heating, and precipitation phase propagation [41,42], is most pronounced during peak summer (late June to early September; Figure 8a). This pattern becomes less distinct during transitional periods (early May to late June and early September to late September), when EHR events occur less frequently. Spatial analysis reveals significant regional heterogeneity in peak EHR timing (Figure 9b). While most Loess Plateau stations exhibit peak activity between 0600 and 1800 LST, the northwestern and southeastern sectors display markedly different temporal characteristics.

5.2. Long-Term Trends

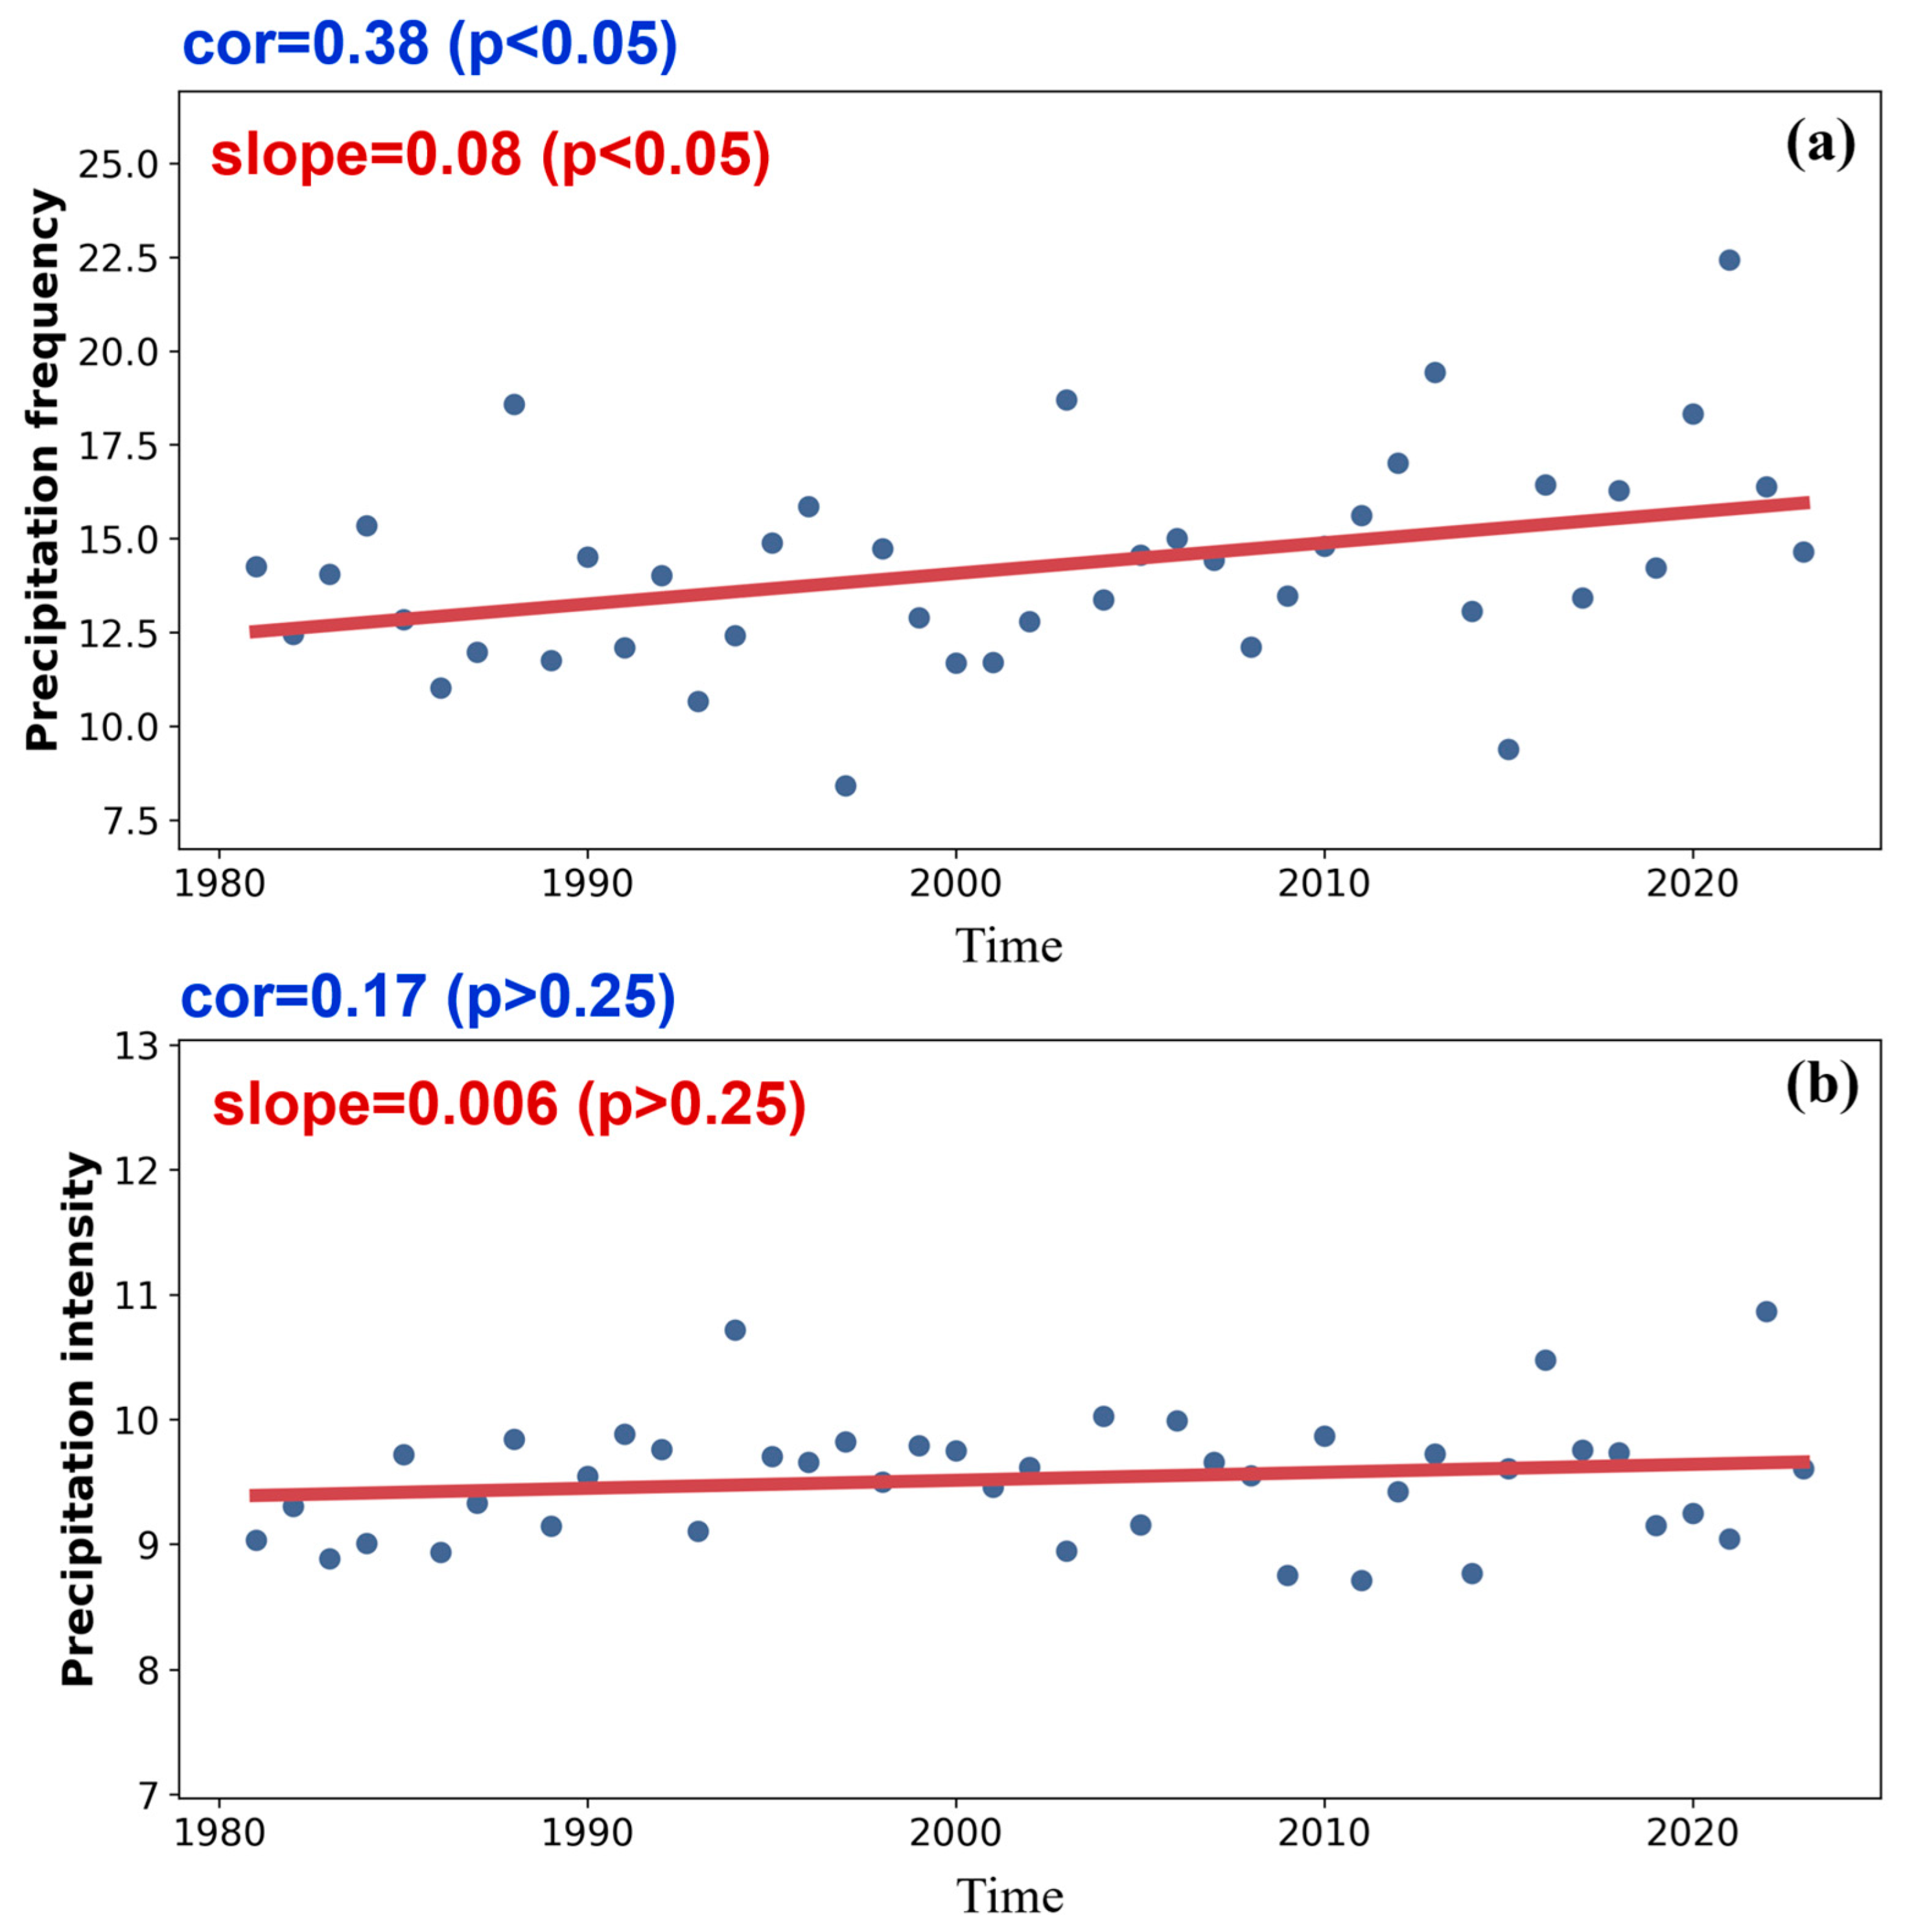
The 43-year long-term trends in the frequency and intensity of EHR events across stations over and around the Loess Plateau are systematically analyzed, as illustrated in Figure 10. The results demonstrate that for EHR frequency, the majority of stations within the study region exhibit positive trends (>96%), yet only approximately 12% of these stations surpass the 95% confidence level (Figure 10a). The small percentage of stations showing significant trends (<15%) aligns with earlier findings on EHR [43,44]. Stations displaying negative trends are predominantly clustered in the western and southeastern sectors of the Loess Plateau, as well as in regions southeast of the plateau. Notably, only three stations within the study area exhibit statistically significant decreasing trends in extreme hourly rainfall (EHR) frequency, all clustered in the western Loess Plateau. To assess the regional EHR behavior, we computed the spatial mean of EHR occurrence frequency across the plateau. As shown in Figure 11a, the spatially averaged EHR frequency displays a statistically significant increasing trend, rising at a rate of approximately 0.82 events per decade over the 1981–2023 period. These findings align with IPCC AR6 projections [2], which predict heightened extreme precipitation frequency in China, including the Loess Plateau, under global warming. The observed upward trend underscores a growing risk posed by EHR events to this region.
The distribution of EHR intensity exhibits significantly greater spatial heterogeneity compared to the occurrence frequency (Figure 10). While more than 50% of stations demonstrate an increasing trend in EHR intensity (Figure 10b), only 15 stations within the study region show statistically significant increases at the 95% confidence level. Approximately 41% of stations display decreasing trends, with merely four stations (predominantly located in the eastern Loess Plateau) reaching statistical significance. Overall, the spatial average across the Loess Plateau reveals a non-significant increasing trend in EHR intensity (Figure 11b), attributable to opposing long-term trends among stations from 1981 to 2023. Notably, in the valley regions of Shaanxi and Shanxi provinces, over 70% of stations exhibit increasing trends in EHR intensity (spatial average is positive), although only four stations show statistically significant trends at the 95% confidence level. This means that EHR events in these areas may enhance in intensity. In addition to splash erosion, enhanced EHR activity boosts groundwater infiltration and acidity, accelerating synergistic physical/chemical weathering cycles [45]. This feedback loop weakens valley slopes—mirroring sandstone’s pore expansion and strength loss—promoting instability while increasing fracture density and permeability, further enhancing EHR’s destructive power.

6. Conclusions and Discussion

6.1. Conclusions

This study provides the first comprehensive EHR characterization for China’s Loess Plateau, which hosts Earth’s largest loess deposit and demonstrates particular EHR susceptibility. Our analysis utilizes 43 years of station-observed hourly rainfall data to address key knowledge gaps in EHR climatology and environmental drivers. Key findings are as follows: Spatially, EHR intensity and frequency exhibit pronounced heterogeneity. Southeastern sectors—particularly Shanxi and Shaanxi provinces—experience higher intensity thresholds (exceeding 8.4 mm/h) and greater annual occurrences (10–16 events) compared to northwestern regions (<8.4 mm/h, <12 events). Distribution patterns align with topographic gradients and moisture availability, evidenced by the distinct southeast–northwest precipitation decline. EHR frequency demonstrates significant positive correlation with elevation, while intensity and accumulated EHR precipitation decrease with altitude, highlighting orographic modulation of extreme rainfall dynamics. Temporally, EHR events peak in July coinciding with the northward advance of the East Asian summer monsoon [39,40], exhibiting a bimodal diurnal cycle with maxima at 0700 LST and 1700 LST. Long-term trends (1981–2023) reveal a spatially averaged significant increase in EHR frequency (0.82 events/decade), contrasting with non-significant intensity trends due to opposing regional signals. Over 70% of meteorological stations in valley regions of Shaanxi and Shanxi provinces show increasing EHR intensity trends, with four stations exceeding the 95% confidence level. This elevates risks for secondary geological hazards including landslides, debris flows, collapses, ground subsidence, and slope erosion. A devastating example is the 2010 Zhouqu debris flow in Gansu Province (https://baike.baidu.com/item/8%C2%B77%E7%94%98%E8%82%83%E8%88%9F%E6%9B%B2%E7%89%B9%E5%A4%A7%E6%B3%A5%E7%9F%B3%E6%B5%81/9406724, accessed on 6 May 2025), which caused massive fatalities and infrastructure damage. Additionally, while ~96% of stations report rising EHR frequency, only ~12% demonstrate statistical significance, suggesting complex climatic–local forcing interplay. Mechanistically, EHR genesis involves synergistic upper-level divergence, mid-tropospheric warm advection, and lower-tropospheric convergence coupled with moisture transport—consistent with quasi-geostrophic theory and monsoon-driven moisture transport.

6.2. Discussion

Extreme precipitation has been a globally significant research focus in meteorology for decades [4,5,6,7]. Observational evidence reveals increasing trends at approximately two-thirds of monitoring stations, with pronounced patterns observed across continental scales (Asia, Europe, North America) and specific regions including eastern North America, northern Central America, northern Europe, the Russian Far East, eastern Central Asia, and East Asia. However, only a limited subset of these trends achieves statistical significance at the 95% confidence level, which aligns with our results. Research on extreme precipitation in China [45,46] also confirms an increasing frequency of extreme precipitation events in the southern Loess Plateau, though the trend is weaker compared to that in southern China. Overall, the observed intensification of EHR in this study aligns primarily with the Clausius–Clapeyron-predicted moisture increase (~7% °C−1) [1,2,6]. However, as documented in previous studies, the sub-daily rainfall extremes often exceed the Clausius–Clapeyron scaling in monsoon-dominated regions like eastern China [3], suggesting a more pronounced precipitation response to global warming [2].
The observed EHR intensification in vulnerable valleys of the Loess Plateau, where over 70% of valley stations in Shanxi/Shaanxi exhibit increasing EHR intensity, significantly elevates landslide and debris flow risks, as demonstrated by the 2010 Zhouqu disaster. This trend underscores the urgent requirement for early warning systems incorporating real-time soil moisture monitoring guided by hydrochemical corrosion thresholds. The elevation-dependent EHR distribution necessitates differentiated adaptation strategies: vegetation-based stabilization for high-altitude frequency hotspots and enhanced drainage infrastructure for low-lying flood-prone zones. Implementation priorities should focus on areas with pronounced upward trends, integrating real-time soil moisture monitoring guided by hydrochemical corrosion thresholds into early warning systems. Urban drainage systems in high-risk valleys require immediate capacity upgrades to address escalating flash flood threats.
Several methodological limitations warrant careful consideration. First, while the 95th percentile threshold effectively identifies extreme events, it may not sufficiently capture the full spectrum of EHR variability, suggesting the need for complementary analyses using alternative percentiles (e.g., 90th or 99th). Second, although the 43-year observational record provides robust temporal coverage, it may not fully resolve decadal-scale variability associated with climate oscillations such as the Pacific Decadal Oscillation (PDO). Third, sparse station density in topographically complex regions limits our ability to accurately represent orographic precipitation patterns, potentially introducing uncertainties in EHR parameter estimation across diverse landscapes. To address these limitations, future research should (i) implement high-resolution, convection-permitting climate models to better simulate orographic processes and project EHR evolution under different climate scenarios; (ii) systematically investigate aerosol–precipitation interactions to quantify their effects on EHR intensity and sub-hourly extremes; and (iii) integrate multi-source satellite observations (e.g., MODIS, FY-4 AGRI [47,48]) to enhance spatial validation and facilitate finer-scale analysis of sub-daily precipitation dynamics. Such integrated approaches would significantly improve climate risk assessments and inform the development of targeted adaptation strategies for the Loess Plateau’s changing hydroclimatic system.

Author Contributions

Conceptualization, F.H., W.Z. and S.F.; Methodology, H.Y. and Y.G.; Software, Y.G.; Validation, W.Z.; Formal analysis, H.Y.; Investigation, H.Y. and W.Z.; Resources, H.Y. and F.H.; Data curation, F.H., X.M. and Y.G.; Writing—original draft, H.Y., F.H. and X.M.; Writing—review & editing, S.F.; Visualization, W.Z.; Supervision, S.F.; Project administration, X.M. and S.F.; Funding acquisition, S.F. All authors have read and agreed to the published version of the manuscript.

Funding

This work was supported by the Science and Technology Foundation of State Grid Corporation of China (Grant 5200-202415102A-1-1-ZN).

Institutional Review Board Statement

Not applicable.

Informed Consent Statement

Not applicable.

Data Availability Statement

The data used in this research are available upon request.

Conflicts of Interest

Authors Fan Hu and Wei Zhang are employed by State Grid Shanxi Electric Power Company. The rest of authors declare no conflicts of interest.

References

  1. Allen, M.R.; Ingram, W.J. Constraints on future changes in climate and the hydrologic cycle. Nature 2002, 419, 224–232. [Google Scholar] [CrossRef]
  2. IPCC. Climate Change 2021: The Physical Science Basis. Contribution of Working Group I to the Sixth Assessment Report of the Intergovernmental Panel on Climate Change; Cambridge University Press: Cambridge, MA, USA, 2021. [Google Scholar] [CrossRef]
  3. Sun, Q.; Zhang, X.; Zwiers, F.; Westra, S.; Alexander, L.V. A Global, Continental, and Regional Analysis of Changes in Extreme Precipitation. J. Clim. 2021, 34, 243–258. [Google Scholar] [CrossRef]
  4. Berg, P.; Moseley, C.; Haerter, J.O. Strong Increase in Convective Precipitation in Response to Higher Temperatures. Nat. Geosci. 2013, 6, 181–185. [Google Scholar] [CrossRef]
  5. Tabari, H. Climate Change Impact on Flood and Extreme Precipitation Increases with Water Availability. Sci. Rep. 2020, 10, 13768. [Google Scholar] [CrossRef]
  6. Trenberth, K.E.; Dai, A.; Rasmussen, R.M.; Parsons, D.B. The Changing Character of Precipitation. Bull. Am. Meteorol. Soc. 2003, 84, 1205–1218. [Google Scholar] [CrossRef]
  7. Zhang, W.; Zhou, T.; Ye, W.; Zhang, T.; Zhang, L.; Wolski, P.; Risbey, J.; Wang, Z.; Min, S.-K.; Ramsay, H.; et al. A Year Marked by Extreme Precipitation and Floods: Weather and Climate Extremes in 2024. Adv. Atmos. Sci. 2025, 42, 1045–1063. [Google Scholar] [CrossRef]
  8. Oliver, T.H.; Heard, M.S.; Isaac, N.J.B.; Roy, D.B.; Procter, D.; Eigenbrod, F.; Freckleton, R.; Hector, A.; Orme, C.D.L.; Petchey, O.L.; et al. Biodiversity and Resilience of Ecosystem Services. Trends Ecol. Evol. 2015, 30, 673–684. [Google Scholar] [CrossRef]
  9. Guan, X.; Huang, J.; Guo, N.; Bi, J.; Wang, G. Variability of Soil Moisture and Its Relationship with Surface Albedo and Soil Thermal Parameters over the Loess Plateau. Adv. Atmos. Sci. 2009, 26, 692–700. [Google Scholar] [CrossRef]
  10. Wang, Q.; Wang, M.; Fan, X.; Zhang, F.; Zhu, S.; Zhao, T. Trends of Temperature and Precipitation Extremes in the Loess Plateau Region of China, 1961–2010. Theor. Appl. Climatol. 2017, 129, 949–963. [Google Scholar] [CrossRef]
  11. Sun, K.; Zeng, X.; Li, F. Climate Change Characteristics in Ecological Fragile Zones in China during 1980–2014. Clim. Environ. Res. 2019, 24, 455–468. [Google Scholar] [CrossRef]
  12. Huang, J.; Zhang, W.; Zuo, J.; Bi, J.; Shi, J.; Wang, X.; Chang, Z.; Huang, Z.; Yang, S.; Zhang, B. An Overview of the Semi-Arid Climate and Environment Research Observatory over the Loess Plateau. Adv. Atmos. Sci. 2008, 25, 906–921. [Google Scholar] [CrossRef]
  13. Liang, J.; Zhang, L.; Bao, J. Turbulence Influenced by Mesoscale Motions in the Stable Boundary Layer over Complex Terrain of the Loess Plateau. Chin. J. Atmos. Sci. 2013, 37, 113–123. [Google Scholar]
  14. Peng, S.; Gang, C.; Cao, Y.; Chen, Y. Assessment of Climate Change Trends over the Loess Plateau in China from 1901 to 2100. Int. J. Climatol. 2018, 38, 2250–2264. [Google Scholar] [CrossRef]
  15. Liao, H.; Huang, Q.; Wang, M. Analysis of the Relationship between Surface Soil Moisture and Precipitation over the Loess Plateau. Plateau Meteorol. 2024, 43, 549–560. [Google Scholar] [CrossRef]
  16. You, D.; Zhang, S.; Jin, C. Analysis of Cloud Characteristics in the Loess Plateau Based on CloudSat-CALIPSO Satellite Data. Plateau Meteorol. 2024, 43, 583–594. [Google Scholar] [CrossRef]
  17. Zhao, H.; Fan, Z.; Ren, Y. Flood Risk Assessment in the Loess Plateau: A Case Study of the Quchan Basin, China. Clim. Environ. Res. 2022, 27, 147–156. [Google Scholar] [CrossRef]
  18. Xu, Y.; Guo, W.; Wang, W.; Luo, S.; Chen, Z.; Lou, Y.; Fei, J. Characteristics of Shallow Landslides under Extreme Rainfall and Their Effects on Runoff and Sediment on the Loess Plateau. Acta Ecol. Sin. 2022, 42, 7898–7909. [Google Scholar] [CrossRef]
  19. Ren, Q.; Gong, Y.; Liu, X. Temporal and Spatial Variation Characteristics of Daytime and Nighttime Precipitation in Monsoon and Westerly Regions of the Loess Plateau from 1961 to 2020. Plateau Meteorol. 2023, 42, 1444–1456. [Google Scholar]
  20. Lu, S.; Hu, Z.; Fu, C. Characteristics and Possible Causes for Extreme Precipitation in Summer over the Loess Plateau. Plateau Meteorol. 2022, 41, 241–254. [Google Scholar] [CrossRef]
  21. Wang, F.; Liu, W. A Preliminary Study of Climate Vulnerability of Agro-Production in the Loess Plateau. Clim. Environ. Res. 2003, 8, 91–100. [Google Scholar] [CrossRef]
  22. Wan, L.; Zhang, X.P.; Ma, Q. Spatiotemporal Characteristics of Precipitation and Extreme Events on the Loess Plateau of China between 1957 and 2009. Hydrol. Process. 2013, 28, 4971–4983. [Google Scholar] [CrossRef]
  23. Li, Z.; Song, Y.; Ding, D. Variation Characteristics of the Extreme Precipitation Event during the Main Flood Period in Shanxi Province. Clim. Environ. Res. 2010, 15, 433–442. [Google Scholar]
  24. Wu, J.; Deng, H.; Sun, R. Analysis of Spatiotemporal Variation in Precipitation on the Loess Plateau from 1961 to 2016. Sustainability 2024, 16, 11119. [Google Scholar] [CrossRef]
  25. An, B.; Xiao, W.; Zhang, S.; Zhang, J. Spatio-Temporal Characteristics of Precipitation Days and Intensity with Different Grades in the Loess Plateau during 1961–2017. Arid. Zone Res. 2021, 38, 714–723. [Google Scholar] [CrossRef]
  26. Wang, G.; Yan, H.; Liu, C.; Han, T.; Zhao, N.; Yang, H. Spatio-temporal evolution of extreme precipitation in Loess Plateau during 1960–2017 and its response to atmospheric circulation changes. J. Earth Environ. 2023, 14, 588–602. (In Chinese) [Google Scholar]
  27. Xu, J.X. Vegetation-Precipitation Thresholds and Ecological Restoration on the Loess Plateau. Acta Ecol. Sin. 2005, 25, 12331239. [Google Scholar]
  28. Zhang, S.; Yang, D.; Yang, Y.; Piao, S.; Yang, H.; Lei, H.; Fu, B. Excessive Afforestation and Soil Drying on China’s Loess Plateau. J. Geophys. Res. Biogeosci. 2018, 123, 923–935. [Google Scholar] [CrossRef]
  29. Hersbach, H.; Bell, B.; Berrisford, P.; Hirahara, S.; Horányi, A.; Muñoz-Sabater, J.; Nicolas, J.; Peubey, C.; Radu, R.; Schepers, D.; et al. The ERA5 Global Reanalysis. Q. J. R. Meteorol. Soc. 2020, 146, 1999–2049. [Google Scholar] [CrossRef]
  30. Bretherton, C.S.; Widmann, M.; Dymnikov, V.P.; Wallace, J.M.; Bladé, I. The Effective Number of Spatial Degrees of Freedom of a Time-Varying Field. J. Clim. 1999, 12, 1990–2009. [Google Scholar] [CrossRef]
  31. GB/T 33669-2017; Monitoring Indices of Precipitation Extremes. Standardization Administration of the People’s Republic of China (SAC): Beijing, China, 2017. Available online: https://openstd.samr.gov.cn/ (accessed on 16 March 2025).
  32. Chen, W.; Wan, W.; He, H.; Liao, D.; Liu, J. Temperature Field Distribution and Numerical Simulation of Improved Freezing Scheme for Shafts in Loose and Soft Stratum. Rock Mech. Rock Eng. 2024, 57, 2695–2725. [Google Scholar] [CrossRef]
  33. Holton, J.R.; Hakim, G.J. An Introduction to Dynamic Meteorology, 5th ed.; Academic Press: Cambridge, MA, USA, 2013; p. 552. [Google Scholar] [CrossRef]
  34. Fu, S.-M.; Mai, Z.; Sun, J.-H.; Li, W.-L.; Ding, Y.; Wang, Y.-Q. Impacts of Convective Activity over the Tibetan Plateau on Plateau Vortex, Southwest Vortex, and Downstream Precipitation. J. Atmos. Sci. 2019, 76, 3803–3830. [Google Scholar] [CrossRef]
  35. Fu, S.-M.; Zhang, Y.-C.; Wang, H.-J.; Tang, H.; Li, W.-L.; Sun, J.-H. On the Evolution of a Long-Lived Mesoscale Convective Vortex That Acted as a Crucial Condition for the Extremely Strong Hourly Precipitation in Zhengzhou. J. Geophys. Res. Atmos. 2022, 127, e2021JD036233. [Google Scholar] [CrossRef]
  36. Markowski, P.M.; Richardson, Y.P. Mesoscale Meteorology in Midlatitudes; Wiley-Blackwell: Chichester, UK, 2010; p. 407. [Google Scholar]
  37. Fu, S.-M.; Zhang, J.-P.; Xiao, X.; Huang, T.-T.; Sun, J.-H. A 42-yr Statistic on the Dabie Vortices: Multi-Scale Temporal Characteristics and Associated Mechanisms, and Hourly-Rainfall Features. J. Clim. 2025, 38, 1553–1572. [Google Scholar] [CrossRef]
  38. Fu, S.M.; Tang, H.; Sun, J.H.; Zhao, T.B.; Li, W.L. Historical Rankings and Vortices’ Activities of the Extreme Mei-yu Seasons: Contrast 2020 to Previous Mei-yu Seasons. Geophys. Res. Lett. 2022, 49, e2021GL096590. [Google Scholar] [CrossRef]
  39. Wang, B.; Fan, Z. Choice of South Asian Summer Monsoon Indices. Bull. Am. Meteorol. Soc. 1999, 80, 629–638. [Google Scholar] [CrossRef]
  40. Li, J.; Zeng, Q. A Unified Monsoon Index. Geophys. Res. Lett. 2002, 29, 1274. [Google Scholar] [CrossRef]
  41. Bao, X.; Zhang, F.; Sun, J. Diurnal Variations of Warm-Season Precipitation East of the Tibetan Plateau over China. Mon. Weather. Rev. 2011, 139, 2790–2810. [Google Scholar] [CrossRef]
  42. Sun, J.; Zhang, F. Impacts of Mountain–Plains Solenoid on Diurnal Variations of Rainfalls Along the Mei-Yu Front over the East China Plains. Mon. Weather. Rev. 2012, 140, 379–397. [Google Scholar] [CrossRef]
  43. Wang, X.; Jiang, W.; Wu, J.; Hou, P.; Dai, Z.; Rao, P.; Ling, Z.; Deng, Y. Extreme Hourly Precipitation Characteristics of Mainland China from 1980 to 2019. Int. J. Climatol. 2023, 43, 2989–3004. [Google Scholar] [CrossRef]
  44. Zhang, H.; Zhai, P. Temporal and Spatial Characteristics of Extreme Hourly Precipitation over Eastern China in the Warm Season. Adv. Atmos. Sci. 2011, 28, 1177–1183. [Google Scholar] [CrossRef]
  45. Chen, Y.; Li, W.; Jiang, X.; Zhai, P.; Luo, Y. Detectable Intensification of Hourly and Daily Scale Precipitation Extremes across Eastern China. J. Clim. 2021, 34, 1185–1201. [Google Scholar] [CrossRef]
  46. Zhang, A.; Zhao, X. Changes of precipitation pattern in China: 1961–2010. Theor. Appl. Climatol. 2022, 148, 1005–1019. [Google Scholar] [CrossRef]
  47. Platnick, S.; King, M.D.; Ackerman, S.A.; Menzel, W.P.; Baum, B.A.; Riédi, J.C.; Frey, R.A. The MODIS Cloud Products: Algorithms and Examples from Terra. IEEE Trans. Geosci. Remote Sens. 2003, 41, 459–473. [Google Scholar] [CrossRef]
  48. Niu, Z.; Tang, F.; Wang, L. All-Sky Assimilation of FY-4A AGRI Water Vapor Channels: An Observing System Experiment Study for South Asian Monsoon Prediction. Q. J. R. Meteorol. Soc. 2024, 150, 2458–2471. [Google Scholar] [CrossRef]
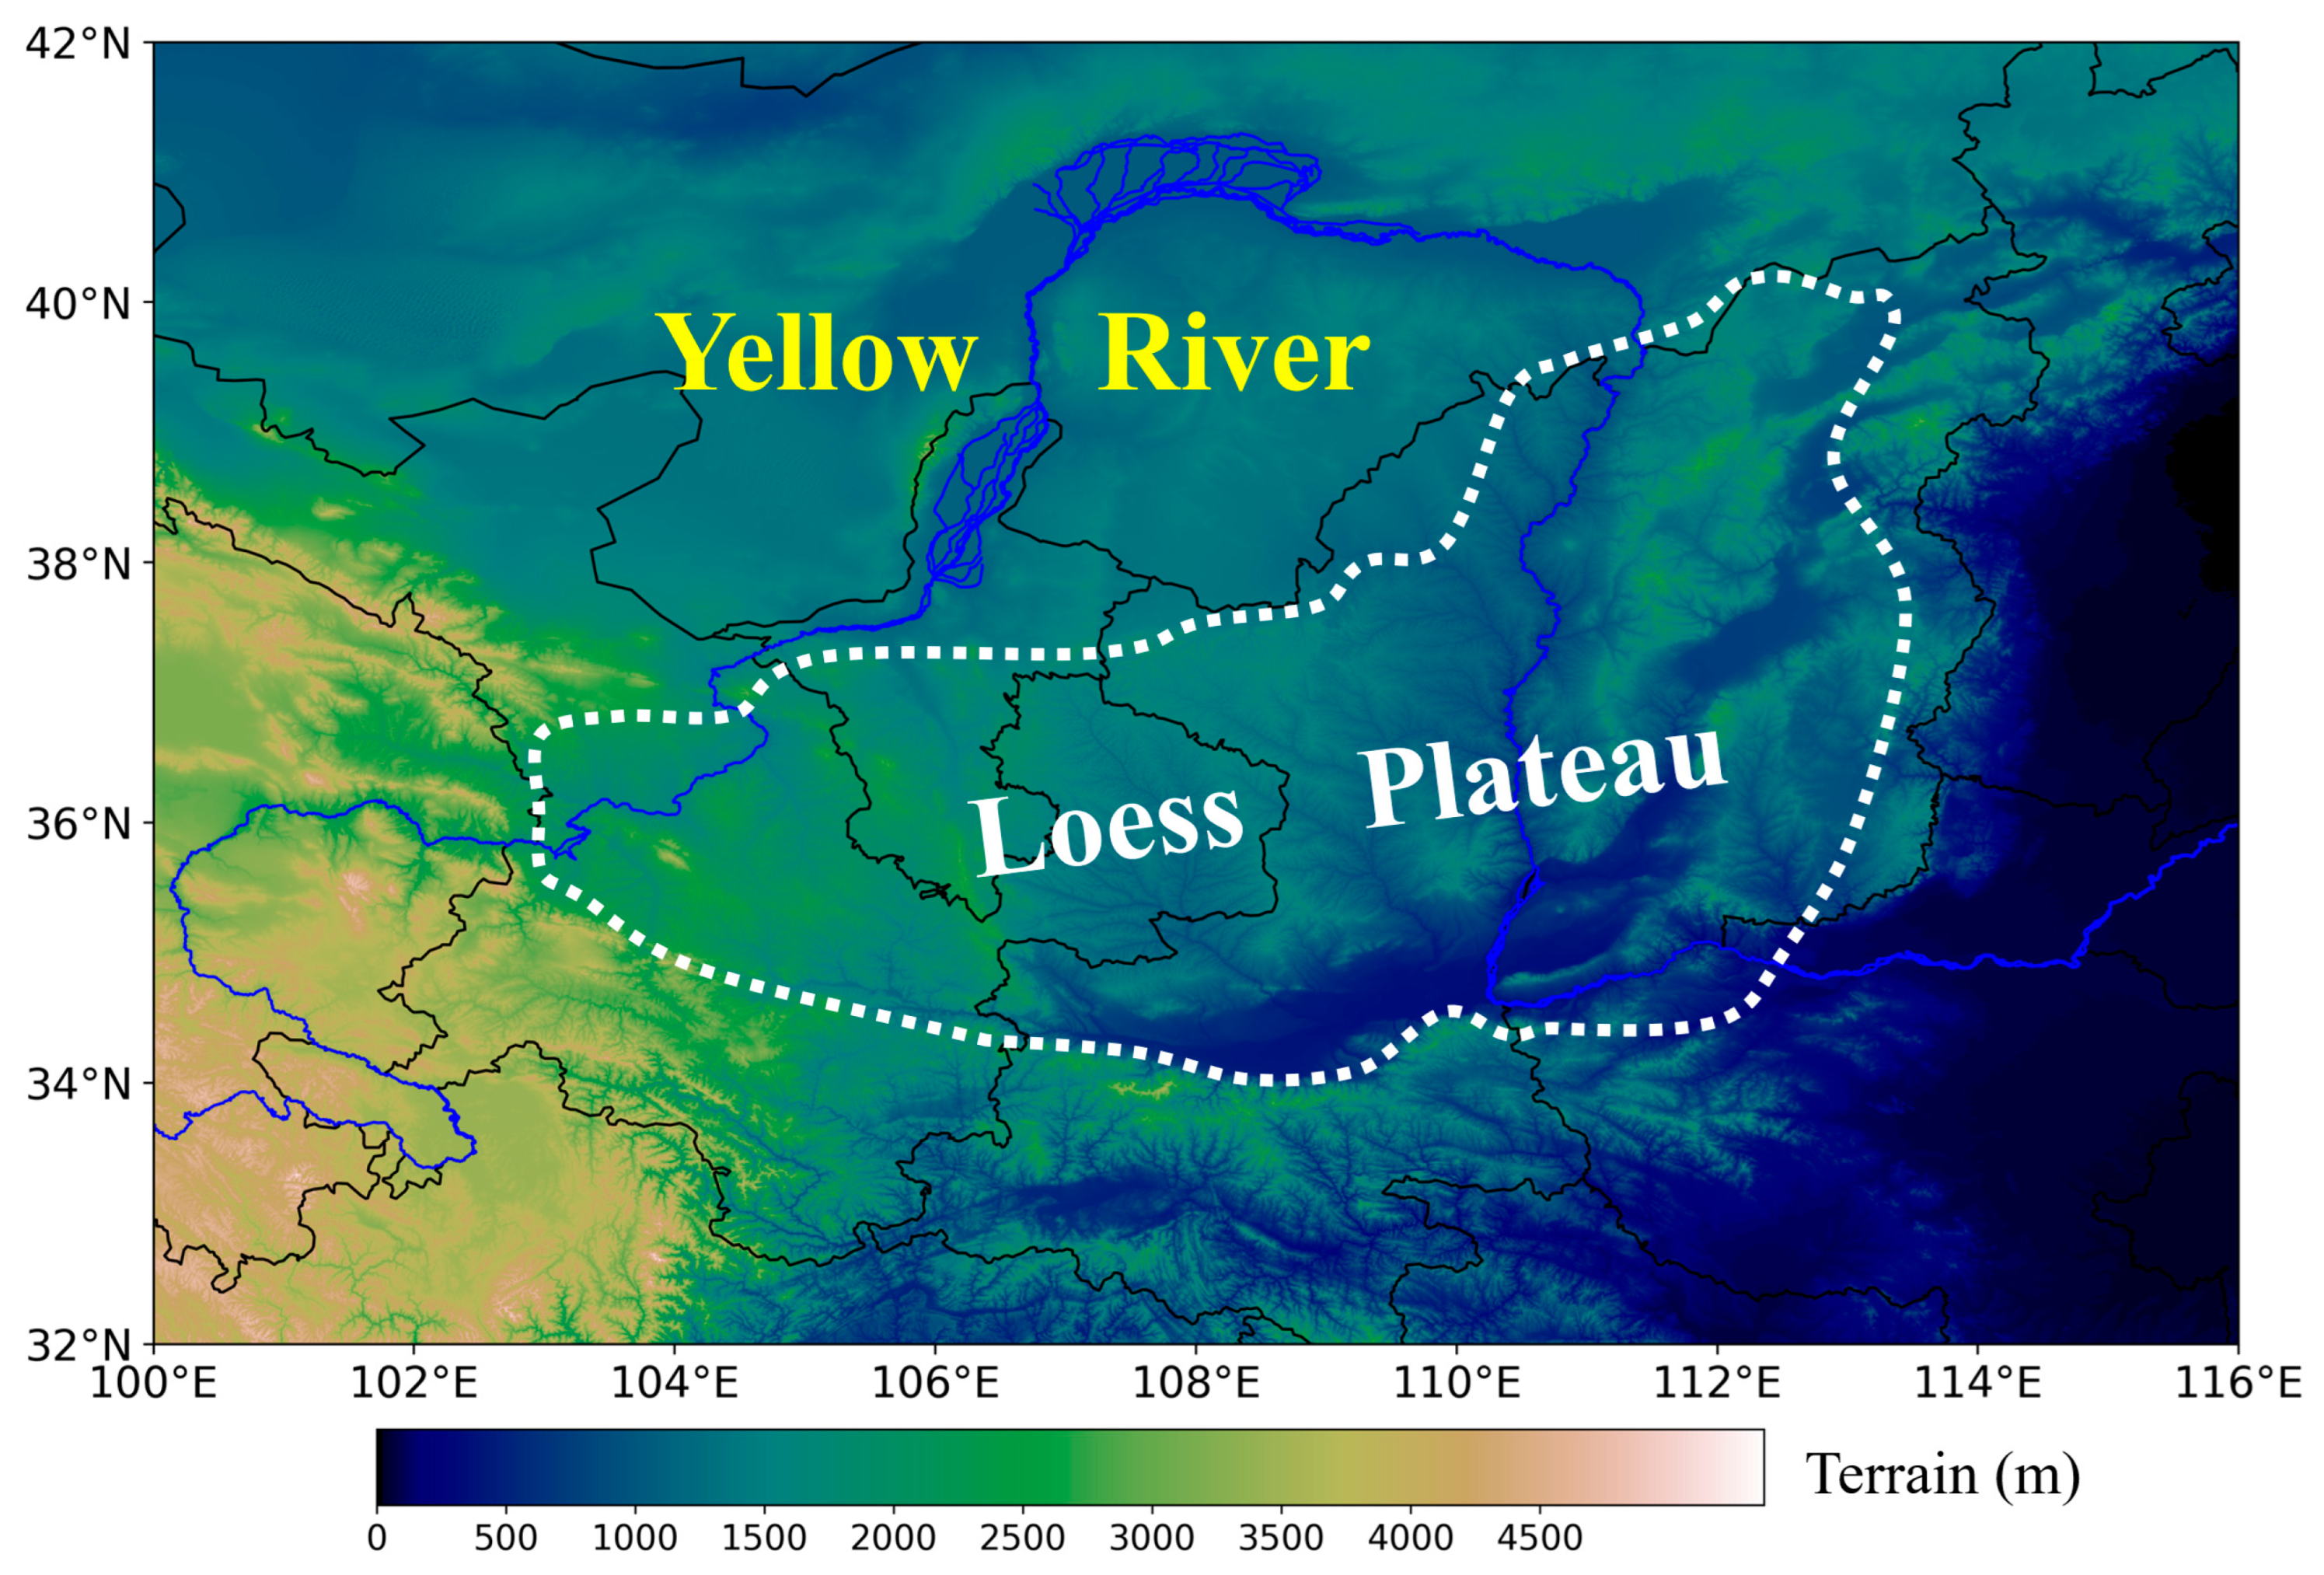
Figure 1. Topography features of regions surrounding the Loess Plateau, where shading represents terrain height (units: m), and the white dashed line outlines the main body of the Loess Plateau.
Sustainability 17 07395 g001
Figure 2. (a) Spatially averaged annual accumulated precipitation (mm; station observations denoted by shaded dots) superimposed on terrain elevation (m; gray shading). The red dashed line outlines the main body of the Loess Plateau. This panel reveals the spatial pattern of mean precipitation, highlighting its relationship with topography and the regional boundaries. (b) Same as (a), but for the annual mean occurrence frequency of EHR. This panel identifies regions most prone to EHR within the Loess Plateau.
Sustainability 17 07395 g002
Figure 3. Threshold values for EHR (mm/h; station observations denoted by shaded dots) derived from the warm seasons of 1981–2023, overlaid on terrain height (gray shading). The red dashed line outlines the main body of the Loess Plateau (208/275). This panel identifies the spatially varying baseline intensity defining EHR, crucial for understanding regional susceptibility to intense rainfall.
Sustainability 17 07395 g003
Figure 4. (a) Temporal mean (during warm seasons of 1981–2023) intensity of EHR (shading dots, mm/h) overlaid on terrain height (gray shading). The red dashed line outlines the main body of the Loess Plateau. This panel reveals the spatial distribution of the typical strength of EHR, indicating where the most intense downpours occur. (b) Same as (a), but for the variance (shading dots, mm2/h2) in EHR. This panel highlights regions with high interannual variability in EHR, signifying where event strength is most unpredictable.
Sustainability 17 07395 g004
Figure 5. Panel (a) shows the relationship between the temporal mean frequency of extreme hourly precipitation (ordinate) and station elevation (abscissa; m), where the red line is the linear regression line between them. cor = correlation coefficient between frequency of extreme hourly precipitation and station elevation. Panels (b,c) are the same as (a) but for intensity of extreme hourly precipitation (ordinate; mm) and annual total amount of extreme hourly precipitation (ordinate; mm), respectively.
Sustainability 17 07395 g005
Figure 6. Panel (a) shows the composite of 200 hPa geopotential height (black contour; gpm), divergence (shading; 10−6 s−1), and wind above 25 m s−1 (a full bar represents 10 m s−1), where the red thick line outlines the main body of the Loess Plateau, and the blue curved lines show the Yellow River (top) and Yangtze River (bottom). Panel (b) shows the composite of 500 hPa geopotential height (black contour; gpm), temperature advection (shading; 10−6 K s−1), and wind above 8 m s−1 (a full bar represents 4 m s−1), where the red thick line outlines the main body of the Loess Plateau, the purple dashed line highlights the trough line, and the gray shading shows the terrain higher than 5000 m.
Sustainability 17 07395 g006
Figure 7. The image shows the composite of 850 hPa geopotential height (black contour; gpm), specific humidity (shading; g kg−1), and wind above 1 m s−1 (a full bar represents 2 m s−1), where the red thick line outlines the main body of the Loess Plateau, the blue line highlights the Yellow River, and the gray shading shows the terrain higher than 1500 m.
Sustainability 17 07395 g007
Figure 8. Panel (a) shows the temporal distribution of average EHR frequency by date and local solar time. Panel (b) shows the daily frequency of EHR during the warm season (red line) and 5-day moving average (green line). Panel (c) shows the hourly frequency of EHR (red line) and probability density distribution (green histogram) relative to the local solar time.
Sustainability 17 07395 g008
Figure 9. Panel (a) shows the peak months for extreme hourly precipitation (shading dots), where the gray shading show the terrain height, and red dashed line outlines the main body of the Loess Plateau. Panel (b) is the same as (a) but for the peak local solar hour (shading dots) of extreme hourly precipitation.
Sustainability 17 07395 g009
Figure 10. Panel (a) shows the trends of the frequency of extreme hourly precipitation at different stations (colored dots), where gray shading shows the terrain height (m), and the red dashed line highlights the main body of the Loess Plateau; deep red and deep blue represent negative and positive trends, that pass the significance test of 95%; and light red and light blue represent negative and positive trends, which cannot pass the significance test. Panel (b) is the same as (a) but for intensity of extreme hourly precipitation.
Sustainability 17 07395 g010
Figure 11. Panel (a) shows the relationship between the spatial averaged frequency of extreme hourly precipitation (ordinate) and time (abscissa), where the red line is the linear regression line. cor = correlation coefficient between frequency of extreme hourly precipitation and time. Panel (b) is the same as (a) but for intensity of extreme hourly precipitation (ordinate; mm/h).
Sustainability 17 07395 g011
Disclaimer/Publisher’s Note: The statements, opinions and data contained in all publications are solely those of the individual author(s) and contributor(s) and not of MDPI and/or the editor(s). MDPI and/or the editor(s) disclaim responsibility for any injury to people or property resulting from any ideas, methods, instructions or products referred to in the content.