Article

A Three-Stage Stochastic–Robust Scheduling for Oxy-Fuel Combustion Capture Involved Virtual Power Plants Considering Source–Load Uncertainties and Carbon Trading

1
School of Economics and Management, Shaanxi University of Science and Technology, Xi’an 710026, China
2
School of Economics and Management, North China Electric Power University, Beijing 102206, China
3
Department of Economic Management, North China Electric Power University, Baoding 071003, China
*
Author to whom correspondence should be addressed.
Sustainability 2025, 17(16), 7354; https://doi.org/10.3390/su17167354
Submission received: 11 July 2025 / Revised: 11 August 2025 / Accepted: 13 August 2025 / Published: 14 August 2025

Abstract

Driven by the “dual carbon” goal, virtual power plants (VPPs) are the core vehicle for integrating distributed energy resources, but the multiple uncertainties in wind power, electricity/heat load, and electricity price, coupled with the impact of carbon-trading cost, make it difficult for traditional scheduling methods to balance the robustness and economy of VPPs. Therefore, this paper proposes an oxy-fuel combustion capture (OCC)-VPP architecture, integrating an OCC unit to improve the energy efficiency of the system through the “electricity-oxygen-carbon” cycle. Ten typical scenarios are generated by Latin hypercube sampling and K-means clustering to describe the uncertainties of source and load probability distribution, combined with the polyhedral uncertainty set to delineate the boundary of source and load fluctuations, and the stepped carbon-trading mechanism is introduced to quantify the cost of carbon emission. Then, a three-stage stochastic–robust scheduling model is constructed. The simulation based on the arithmetic example of OCC-VPP in North China shows that (1) OCC-VPP significantly improves the economy through the synergy of electric–hydrogen production and methanation (52% of hydrogen is supplied with heat and 41% is methanated), and the cost of carbon sequestration increases with the prediction error, but the carbon benefit of stepped carbon trading is stabilized at the base price of 320 DKK/ton; (2) when the uncertainty is increased from 0 to 18, the total cost rises by 45%, and the cost of purchased gas increases by the largest amount, and the cost of energy abandonment increases only by 299.6 DKK, which highlights the smoothing effect of energy storage; (3) the proposed model improves the solution speed by 70% compared with stochastic optimization, and reduces cost by 4.0% compared with robust optimization, which balances economy and robustness efficiently.

1. Introduction

1.1. Background and Motivation

Driven by the goal of “double carbon”, energy structure transformation and the construction of new power system have become the core of national strategy. While renewable energy sources, such as photovoltaic (PV) and wind power, are connected to the power grid on a large scale, their volatility poses a serious challenge to the flexible regulation of the system. Carbon-oriented energy system integration is increasingly becoming an important means of promoting the consumption of renewable energy [1], among which virtual power plant (VPP), as a key carrier for aggregating distributed resources, urgently needs to integrate low-carbon technologies to support the cleaner operation of power grids [2]. Oxy-fuel combustion capture (OCC) is a high-efficiency carbon reduction technology, which can realize fuller combustion by increasing the oxygen concentration in the combustion zone, reduce the emission of pollutants such as carbon monoxide, significantly reduce the nitrogen content in the flue gas, significantly increase the carbon dioxide concentration, greatly simplify the subsequent carbon capture process, and reduce energy costs. In addition, this technology is compatible with the existing coal-fired power plant infrastructure, with low retrofit cost and high thermal efficiency, which is one of the key technology paths to realize deep decarbonization in the industrial sector [3,4]. Therefore, introducing OCC into VPP and constructing OCC-VPP is an important technological path to build a low-carbon and high-efficiency energy system, and its optimized operation has important engineering value to realize the strategic goal of energy transition.
However, the actual scheduling of VPP faces a complex environment with multiple uncertainties superimposed. On the one hand, the uncertainty of source (wind power) and load (electricity/heat load) prediction deviation and electricity price fluctuation can easily lead to the deviation of the traditional deterministic optimization results from the reality, which can lead to the risk of wind abandonment, light abandonment, or imbalance of energy supply [5,6]; on the other hand, the carbon-emission cost under carbon trading has a direct influence on the system economy, but there is not yet a consensus on the form of carbon-emissions trading. Traditional stochastic optimization relies on the exact probability distribution, which is inefficient; robust optimization is overly conservative, which sacrifices too much in terms of economy. In this regard, there is an urgent need to establish a scheduling framework that takes into account both robustness and economy, and provides a scientific decision basis for the scientific and efficient operation of VPP by coupling the cost of carbon trading and finely modeling the multiple uncertainties in the source–charge–electricity price.

1.2. Literature Review

As the core carrier of integrating distributed energy resources, the research progress of VPP is mainly reflected in three aspects, namely, composition structure expansion, operation optimization model deepening, and an uncertainty handling method. In terms of composition structure, early research mainly focuses on the aggregation and dispatch of conventional resources such as wind, light, and storage, and in recent years, it gradually extends to the direction of multi-energy complementarity and decarbonization. Some scholars have explored the structure of VPP containing renewable energy sources such as wind and light and energy storage, which enhances the capacity of renewable energy consumption through energy-storage regulation. Heredia et al. combined wind power with large-scale energy storage to form a VPP, which transforms uncertain wind power generation into dispatchable output [7]. Abdullah et al. combined the energy-storage system, wind power, photovoltaic, and small-scale conventional power plant combination to form a VPP and explored the techno-economics of this type of VPP in Malaysia [8]. Dadashi et al. combined several wind farms and energy-storage systems in the form of a VPP and studied its strategy to participate in the market [9]. Morcilla and Enano combined PV power-generation systems and centralized battery-storage systems in community residences to form a VPP, and investigated the impact on the distribution network reliability [10]. Rodrigues et al. introduced electric-to-hydrogen conversion into a conventional VPP, and analyzed the impact of power to hydrogen (P2H) on the autonomous operation of the VPP and carbon-emission reduction [11]. Yang et al. integrated distributed power generation, energy storage, and flexible loads for residential buildings to form a VPP, which provides a new energy solution to improve the renewable energy consumption capacity of residences [12].
With the development of carbon capture technology, the introduction of carbon capture-generating units (CCUS) in VPPs, which can balance low carbon and controllable output, is increasingly garnering attention. Chen et al. introduced CCUS in a VPP to promote the economic and low carbon synergy of the VPP [13]. Jin et al. coupled wind power, PV, cogeneration system, CCUS, and power to gas (P2G) to form a VPP which can cope with the uncertainty of wind power and PV output and achieve better environmental benefits [14]. Ju et al. integrated wind power, PV, biomass power generation, and CCUS to form a VPP for rural areas, which provides a new technological pathway for the green and low-carbon transformation of energy sources in rural areas [15]. Lin et al. proposed a multi-energetic VPP architecture integrating P2G, CCUS, and energy storage that optimizes renewable energy consumption and multi-market trading strategies through hydrogen-power coupling [16]. Current carbon-capture units in VPPs mostly use traditional amine capture technology, which has high energy consumption and insufficient flexibility. In contrast, OCC has become an emerging research direction due to its ability to significantly reduce capture energy consumption, compatibility with existing gas facilities, and near-zero emissions. By supplying oxygen as a byproduct of hydrogen production through electrolytic cells to the OCC unit, it replaces some forms of producing oxygen through air separation with high energy consumption. At the same time, hydrogen is used for fuel-cell heating and methane conversion reactions, forming a closed-loop collaborative mechanism of renewable energy hydrogen production, oxygen recycling, and CO2 resource utilization. For example, He et al. proposed a VPP structure considering oxygen-enriched combustion (OEC) and power-to-ammonia (P2A), aiming to achieve low-carbon economy of the VPP [17]. Huang et al. constructed a VPP that combines wind power, photovoltaic, oxygen-enriched combustion, gas turbine, waste-heat recovery and utilization system, and proton-exchange membrane electrolysis (PEMEL), and the VPP can be utilized through multi-energy complementation and energy gradient utilization to achieve low-carbon and economic operation of VPP [18]. Compared with existing research that commonly uses high-energy-consumption amine-based carbon-capture technology (such as CCS), the OCC-VPP design in this paper can reduce carbon-capture energy consumption and utilize oxygen storage tanks to achieve cross-period oxygen–carbon collaborative scheduling, providing a new technological path for VPP that combines deep decarbonization and multi-energy complementarity characteristics.
In the field of operation optimization, the existing research results are relatively abundant, which lays a good foundation for this paper. Earlier optimization models had economics as a single objective, and scheduling was achieved by minimizing the cost of purchased electricity/gas or the penalty for wind and light abandonment. Huang et al. constructed an scheduling model for VPPs by considering interval forecasting of loads and outputs, and with the objective of cost minimization [19]. Zhu et al. proposed a two-tiered economic scheduling method for VPPs by considering the different interests of VPPs and system operators [20]. Park et al. considered the network conditions of the distribution system operator, proposed a scheduling model by maximizing VPP’s profit, and the simulation results show that the proposed model improves VPP’s profit by 1.6% compared to the traditional method [21]. Michael et al. considered the electrical parameter uncertainty and proposed a scheduling model by maximizing the revenue of VPP in the market, emphasizing the importance of the collaborative operation of VPP and demand response [22]. Hou et al. developed a two-phase economic scheduling method for a multi-energy VPP in response to uncertainty of demand and response of flexible resources, and the simulation results revealed that the proposed method was superior in reducing the balancing cost caused by parameter deviations and improving the VPP economics [23].
With the promotion of the carbon-trading mechanism, some studies have started to introduce carbon cost-related factors in VPP scheduling. Liu et al. proposed an optimal scheduling model for VPP covering demand response resources and photovoltaics by considering the carbon-emissions trading mechanism [24]. Liu considered multiple energy sources complementing each other and the decarbonization of energy sources, and with the goal of maximizing the operational efficiency of the carbon-containing trading, he established a multi-VPP optimal scheduling model, and proposed a multi-region cooperative scheduling strategy for VPP [25]. Zhang et al. analyzed the VPP operation mode under carbon-trading and green certificate trading mechanisms, and incorporated them into the scheduling model of VPP, in order to balance economy and environment [26]. Li et al. evaluated the limitations of traditional energy sources, the unpredictability of renewable energy output, and the constraints faced by energy-storage devices in VPPs, and constructed a dispatch model of VPPs guided by the carbon tax framework, and the simulation results showed that the cooperation between VPP and storage brought mutual benefits to both the operator and the storage provider, and the carbon emissions are significantly reduced [27]. Xie et al. constructed a VPP cluster cooperative operation optimization model by considering the carbon-emission constraints, and the results show the operating costs and carbon emissions of the three VPPs are reduced after VPP clusters operate [28]. Zhou et al. analyzed the mode of VPP participating in the electricity and carbon markets, and constructed a scheduling strategy optimization model for multiple VPPs participating in the joint market, and the results showed the carbon emissions decreased by 31.3% through the cooperation, and at the same time, the total profit of the alliance increased [29].
Since renewable energy (like wind power and PV) are usually included in VPPs, and load demand also exists in some VPPs, the source–load uncertainty problem is inevitably faced in VPP scheduling [30,31,32]. For uncertainty optimization methods, stochastic optimization (SO) and robust optimization (RO) are the current mainstream frameworks. Stochastic optimization relies on an accurate description of the probability distribution of the scenery load, which requires a large number of scenarios to be generated to ensure the accuracy, and leads to a disaster in the solution dimension, making it difficult to meet the timeliness demand of the day-ahead scheduling [33,34]; robust optimization requires only the uncertainty set to describe the fluctuation boundaries of the scenery load, which ensures the feasibility of scheduling scheme under the worst scenarios but does not increase economical performance due to the over-protection of the guards [35,36]. In order to balance the two, distributionally robust optimization (DRO) describes the probability distribution uncertainty through the ambiguity set, but most of the existing studies are limited to a single source of uncertainty (e.g., only wind power or load), and the lack of joint modeling of the multiple uncertainties of “source-load-price” [37,38].
In summary, the following gaps exist in the existing studies: firstly, most of the existing VPPs adopt the energy-consuming traditional amine carbon-capture technology (e.g., CCUS), which has limited regulating capability, and the synergistic scheduling mechanism of OCC in VPPs has not yet been fully investigated, although it is highly energy-efficient; secondly, most of the existing dispatch models are limited to a single source of uncertainty, and lack the synergistic modeling of multiple source–load–price uncertainties, which makes it difficult for the optimization results to cope with the complex environment of overlapping fluctuations in practice.
1.3. Research Contribution and Paper Structure

The research contributions and novelty of this paper are as follows:
(1)
The OCC-VPP is constructed and analyzed by combining the OCC unit and the conventional VPP, which enriches the type of resource aggregation of the VPP, and provides a new energy utilization way under VPP framework.
(2)
Considering the complex impacts of multiple uncertainties of renewable energy output, load, and electricity price on OCC-VPP scheduling, integrating the ideas of stochastic optimization and robust optimization, a three-stage stochastic–robust (TSRO) scheduling model of OCC-VPP is constructed, and a targeted model-solving algorithm is proposed, which provides a new tool and methodology for solving the operation optimization problems of energy systems under complex uncertainty environments.
(3)
Through the simulation analysis of typical cases, it is verified that the proposed scheduling model can ensure that the OCC-VPP can achieve better economy and low carbon under the complex uncertainty environment, which provides a decision-making basis for the formulation of the targeted operation scheme of the OCC-VPP and the promotion of the system to operate in an efficient and orderly manner.
The remainder of this paper is organized as follows: Section 2 analyzes the system structure and models of the designed OCC-VPP, and then analyzes the carbon-trading mechanism; Section 3 introduces the constructed TSRO scheduling model of OCC-VPP that considers the source–load uncertainties; Section 4 gives the solution methodology and flow of the model; Section 5 conducts an example simulation to verify the applicability and validity of the proposed model; Section 6 summarizes the whole paper.

2. Modeling of OCC-VPP System and Carbon-Trading Mechanism

2.1. OCC-VPP System

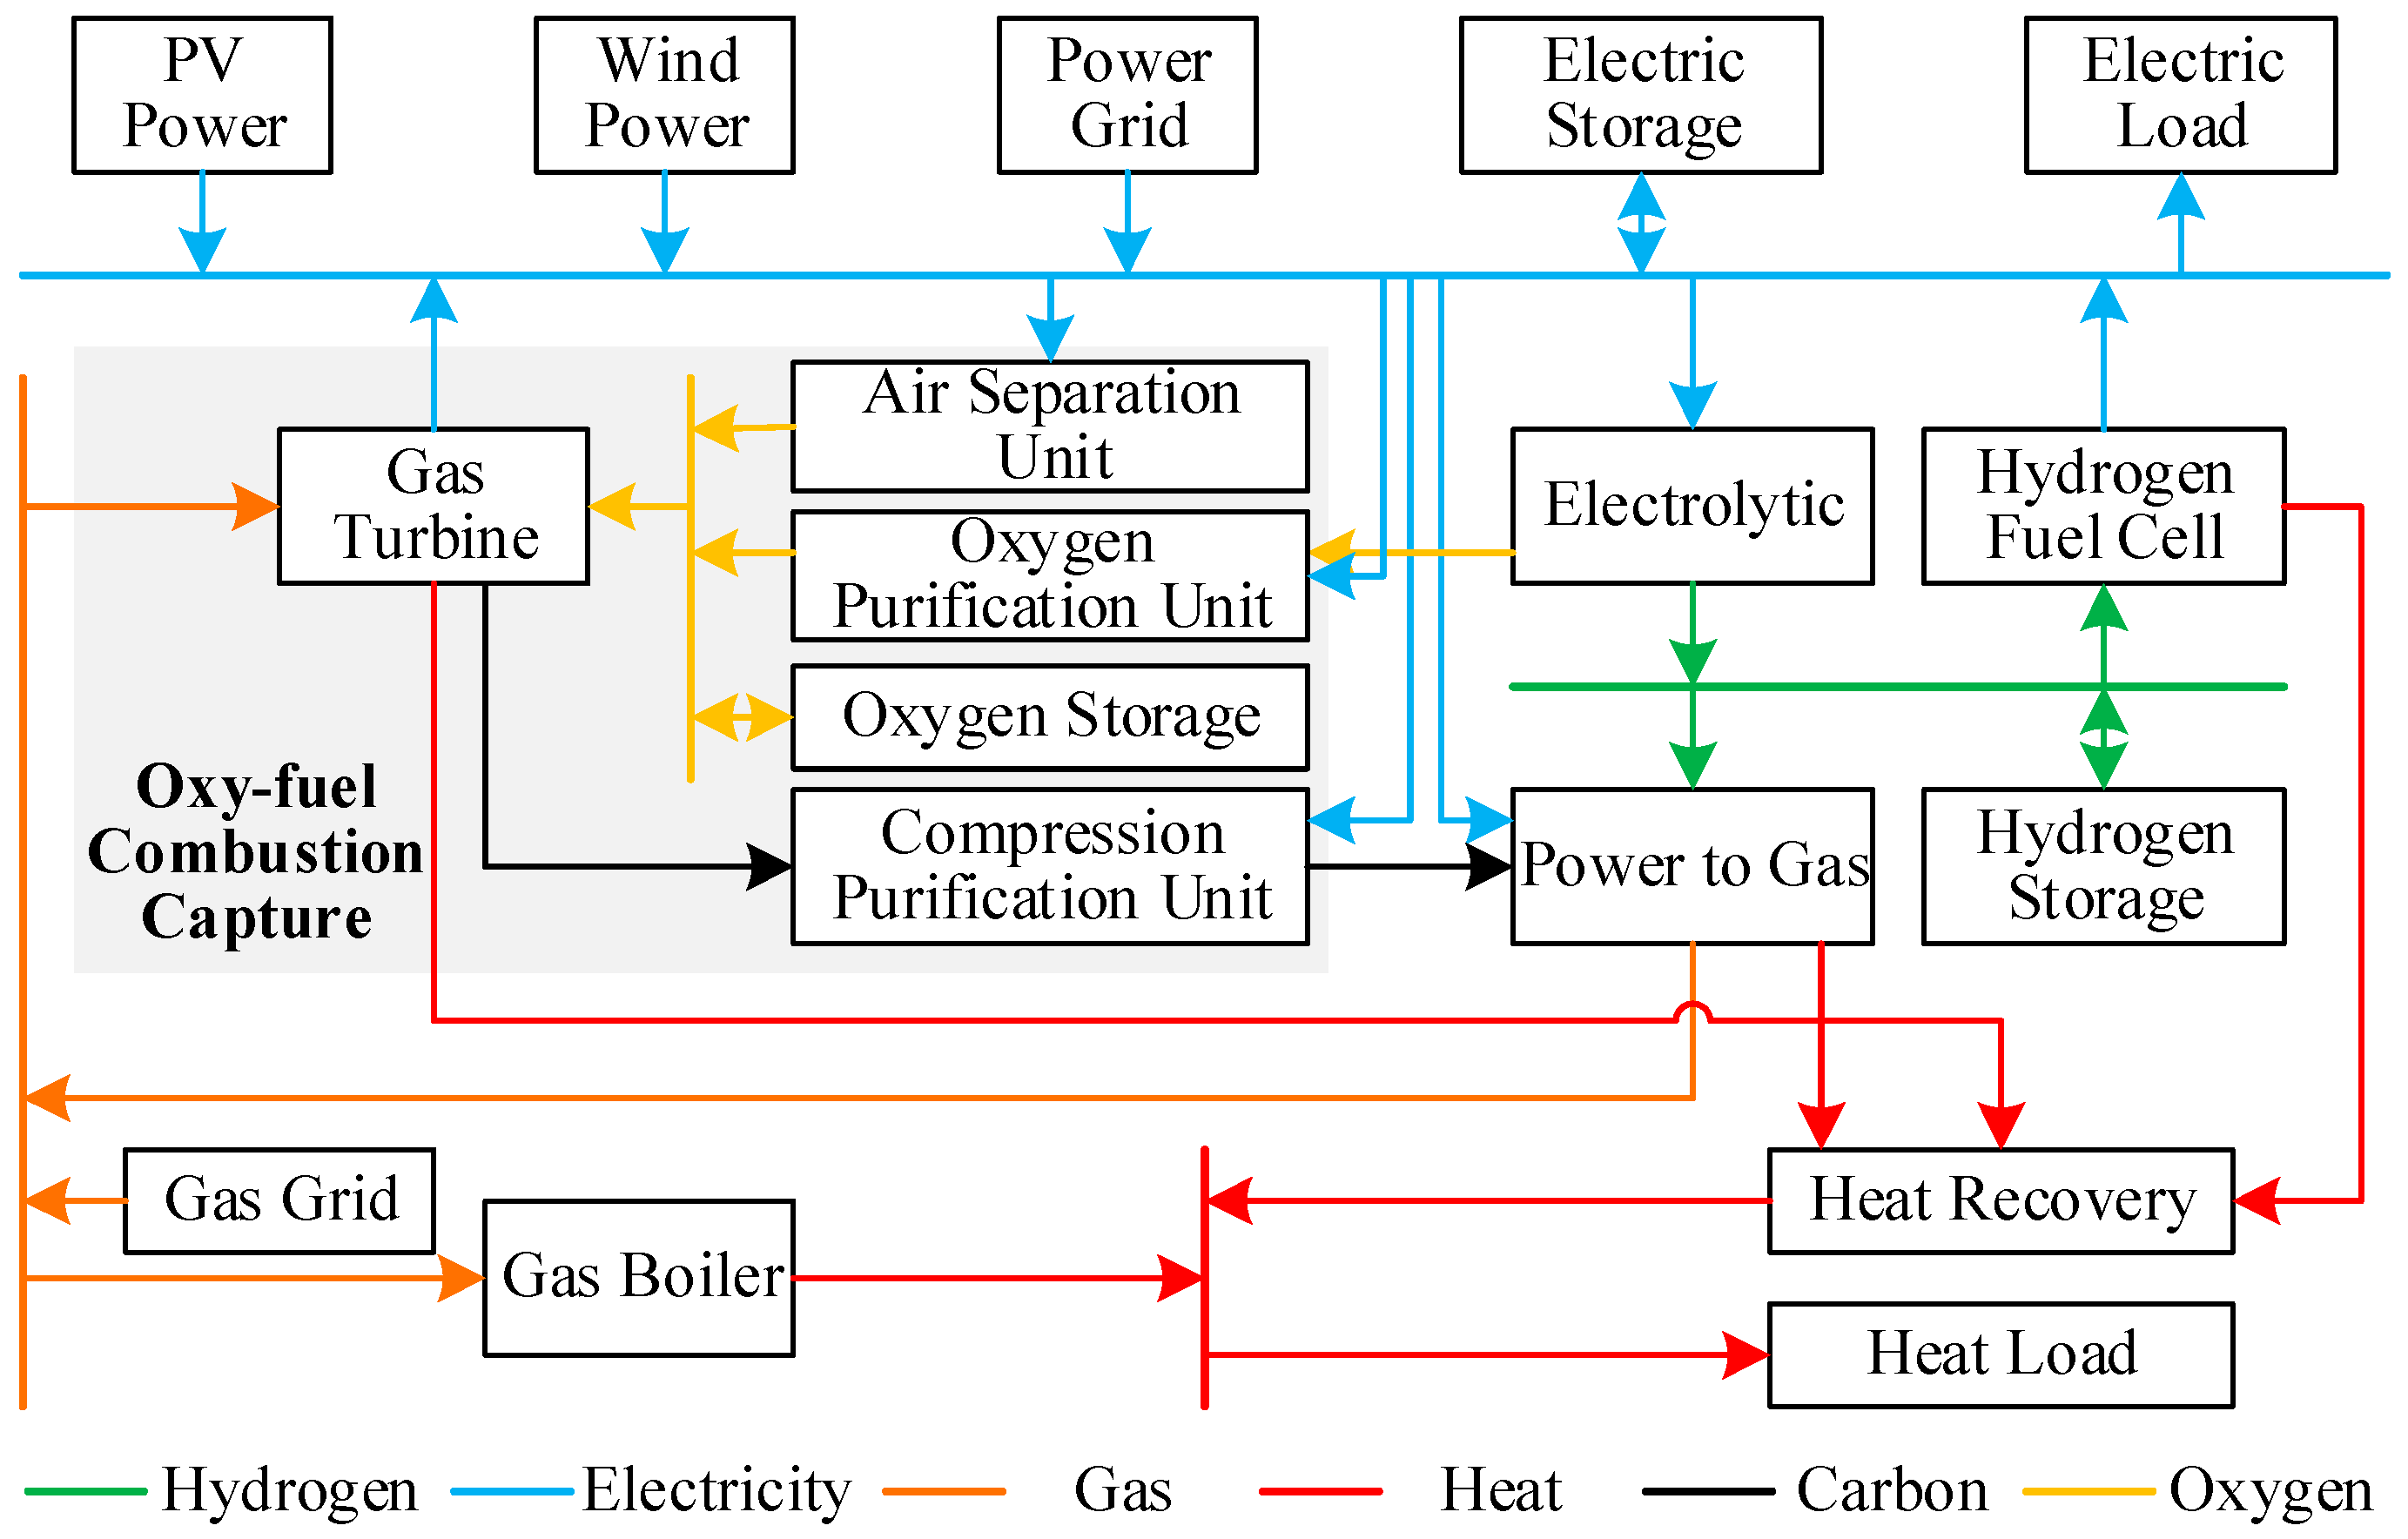
The structure of OCC-VPP is given in Figure 1. The OCC-VPP system constructs a low-carbon operation architecture with synergistic multi-energy streams by coupling the OCC with distributed energy sources. The core of the system consists of an OCC unit (including gas turbine (GT), air-separation unit (ASU), compression purification unit (CPU) and oxygen purification unit (OPU)), renewable energy sources (wind power, photovoltaic), electric–hydrogen conversion system (electrolyzer, hydrogen fuel cell, and hydrogen storage), energy-storage unit (electric energy storage) and multi-energy loads (electric/heat loads). On the one hand, the gas turbine burns natural gas to generate electricity, the ASU provides high-concentration oxygen to assist combustion, so that the concentration of CO2 in the flue gas is significantly increased, and the CPU captures CO2 and then partially sequesters it and partially transfers it to the methane reactor; the electrolysis tank utilizes surplus new energy power to produce hydrogen, and the by-product oxygen is stored in the OS for calling, forming the “electricity-oxygen-carbon” cycle, reducing the energy consumption of air-separation oxygen production. On the other hand, when the wind/photovoltaic power fluctuates, the hydrogen fuel cell consumes HS to store hydrogen to generate electricity and heat, and the ES suppresses the short-term shortfall of electricity; the methane reactor synthesizes natural gas (CH4) from rich hydrogen and captured CO2, and feeds it back to the gas turbine or gas boiler to realize the reuse of resources.

2.1.1. OCC Modeling

OCC technology is a combustion method with higher oxygen concentration than air, which utilizes high concentration of O2 and CO2 recovered in the flue gas cycle instead of air to fuel the combustion, and produces a high concentration of CO2, which is also easily captured and sequestered by the CPU equipment [39]. Yun et al. [40] pointed out that the oxy-fuel combustion technology has a higher requirement for the cleanliness of the fuel used. In this paper, a gas-fired unit with adjustable heat-to-electricity ratio is selected as the target for retrofit, and Ref. [41] can be referred to for its specific working principle.
The power loss of the OCC unit is mainly concentrated in the ASU, CPU, and OPU, and in order to cope with the load change, the ASU is usually equipped with an OS to realize load transfer. At night when the wind power is sufficient and the electric load demand is low, by increasing the output of the ASU and cooperating with the EL equipment, part of the generated O2 is used for oxy-fuel combustion and the other part is stored by the OS. When the electric load is at peak, the OCC unit prioritizes to meet the electric load demand and reduces the operating output of CPU equipment and ASU equipment. At this time, the OS supplies the stored O2 to the OCC unit when the load is in the trough to alleviate the pressure on the OCC unit’s output, ensure the CPU equipment is in normal operation, and reduce the unit’s carbon emission.
Ref. [39] modeled a gas-fired unit with adjustable thermoelectric ratio, and concluded that the unit’s thermoelectric efficiency and are constants, and that the thermoelectric ratio can be flexibly changed by the real-time electrical and thermal load demand. The relationship between the output power of the oxygen-enriched combustion carbon-capture unit and the natural gas consumption is as follows:
P G T , t + H G T , t = ρ G T G G T , t L H V g a s / γ
0 P G T , t P G T , max
μ G T , down P H F C , max P G T , t P G T , t 1 μ G T , up P G T , max
k G T , min H G T , t / P G T , t k G T , max
where P G T , t and H G T , t are the output electric power and thermal power of GT at t period; ρ G T , E is the energy conversion efficiency of GT; G G T , t is the amount of natural gas consumed by GT at t period; L H V g a s is the low calorific value of the natural gas, that is, 36 MJ/m3; γ is the conversion value of calorific value and power, that is, 3.6 MJ/kWh; P G T , m a x is the maximum generating power of GT; μ G T , d o w n and μ G T , u p are the gradient coefficient of GT; and k G T , m i n and k G T , m a x are the upper and lower limits of the thermoelectric ratio of GT, which are taken as 2.07 and 0.4 [42], respectively.
According to the energy-flow characteristics of OCC, the electric power output of OCC unit is divided into four parts, namely, GT production, ASU consumption, CPU consumption, and OPU consumption. The net output power of OCC is as follows:
P O C C , t = P G T , t P A U S , t P C P U , t P O P U , t
P C P U , t = α C P U ρ C P U η G T P G T , t
P A S U , t = α A S U O A S U , t
P OPU , t = α p u r O E L , t
P C P U , down , max P C P U , t P C P U , t 1 P C P U , up , max
λ A S U , min P A S U , max P A S U , t P A S U , max
In the formula, P O C C , t , P A U S , t , P C P U , t and P O P U , t are the net power output of the OCC unit, and the power consumption of AUS, CPI, and OPU at t period, respectively; α C P U , α A S U , and α p u r are the power consumption of CPU, ASU, and OPU, respectively; η G T is the carbon-emission intensity of GT, usually calculated based on the natural gas consumption per unit of power generation and the emission coefficient of natural gas combustion. According to Bao et al. [43], the carbon-emission intensity of the gas unit is taken to be 0.441 kg/kWh; ρ C P U is the carbon-capture efficiency of the CPU equipment, and O A S U , t is the oxygen production of ASU at t period, O E L , t is the oxygen production of electrolyzer, and λ A S U , min is the minimum operation coefficient of ASU. Due to the long start-up time and high power consumption of ASU devices, there exists a minimum operating power. Referring to Yun et al. [40] and Gao et al. [44], this paper sets λ A S U , min = 50 % .
The oxygen of the OCC unit is mainly supplied by the ASU equipment, OS, and electrolyzer. Among them, the oxygen produced by the process of electrolyzing water to produce hydrogen usually contains trace amounts of water vapor, hydrogen gas, and other impurities (such as electrolyte aerosols), which need to be compressed, dried, and purified to meet the requirements of oxygen purity for oxygen-rich combustion. The expression is as follows:
O E L , p u r , t = ρ p u r O E L , t
O A S U , t + O E L , p u r , t + O d i s , t = O O C C , t + O c h a , t
O O C C , t = α O C C P G T , t
where O E L , p u r , t is the oxygen purified by OPU, O c h a , t and O d i s , t are the charged and discharged oxygen from the OS tank at time t ; O O C C , t is the oxygen consumed by the OCC unit at time t ; ρ p u r is the purification efficiency of OPU, α O C C is the oxygen consumption per unit of power during the operation of the OCC unit.
Most of the CO2 produced by the OCC unit during operation is captured and sequestered by the carbon capture equipment, and a small portion is discharged into the atmosphere. Part of the captured CO2 is used for hydrogen methanation and the other part is sequestered by carbon sequestration technology. Therefore, the actual carbon emission of the OCC unit is the CO2 emitted into the atmosphere, and the expression is as follows:
η G T P G T , t = Q C O 2,0 , t + Q C O 2 , f c , t + Q C O 2 , P 2 G , t
where Q C O 2,0 , t , Q C O 2 , f c , t , and Q C O 2 , P 2 G , t are the amount of CO2 emitted into the atmosphere, the amount of carbon sequestration, and the amount consumed by the methane reaction at time t , respectively.

2.1.2. Hydrogen Production and Methanation

(1)
Electrolytic (EL)
EL converts electrical energy into hydrogen energy, realizing the conversion of electrical energy and hydrogen energy. The hydrogen production of the EL during the t period by electrolyzing water is determined as follows:
Q E L , t = ρ E L P E L , t
O E L , t = α O H Q E L , t
P E L , min P E L , t P E L , max
where Q E L , t is the hydrogen production, P E L , t is the power consumption of EL, ρ E L is EL’s efficiency coefficient, and α O H is the ratio of hydrogen and oxygen production of electrolysis. P E L , min and P E L , max is the minimum/maximum electrical power consumed by the EL.
(2)
Hydrogen fuel cell (HFC)
HFC converts the hydrogen energy produced by the system into electrical energy. The output power of HFC at t period is:
P H F C , t = ρ H F C , E Q H F C , t L H V H 2
μ H F C , down P H F C , max P H F C , t P H F C , t 1 μ H F C , up P H F C , max
In the formula, P H F C , t is the generated power of HFC, ρ H F C , E is the power-generation coefficient of HFC, Q H F C , t is the hydrogen consumed by HFC, and L H V H 2 is the low calorific value of hydrogen combustion. μ H F C , down and μ H F C , up are the gradient coefficient of HFC, and P H F C , max is the maximum generated power of HFC.
Accordingly, the heat produced by HFC at time t is as follows:
H H F C , t = ρ H F C , H P H F C , t
where ρ H F C , H is the thermoelectric conversion efficiency of HFC.
(3)
Methane reactor (Power to gas, P2G)
P2G, as an important part of the OCC-VPP system, is the key to connect the three energy systems of electricity, hydrogen, and gas. Its mathematical model is:
G P 2 G , t = ρ P 2 G P P 2 G , t L H V g a s
Q C O 2 , P 2 G , t = ρ C O 2 P P 2 G , t
G H 2 , t = ρ H 2 Q C O 2 , P 2 G , t
H P 2 G , t = ρ P 2 G , H G P 2 G , t
where G P 2 G , t is the amount of natural gas produced by the P2G plant in time period t , P P 2 G , t is the input electric power of the P2G plant in time period t , ρ P 2 G is the electrical conversion efficiency of the P2G plant, Q C O 2 , P 2 G , t is the amount of CO2 required by the P2G plant in time period t , ρ C O 2 is the coefficient of ratio of the amount of CO2 required by the P2G plant to the electric power consumed, G H 2 , t is the amount of H2 required by the P2G plant in time period t , ρ H 2 is the ratio factor between the amount of H2 required by the P2G plant and the amount of CO2 required. H P 2 G , t is the heat of the reaction that can be recovered from the methane reaction in the P2G plant, and ρ P 2 G , H is the heat coefficient that can be recovered.

2.1.3. Heat-Production System

(1)
Gas boiler (GB)
The gas boiler utilizes natural gas to produce and supply heat to the system. The thermal power output of GB is:
H G B , t = ρ G B G G B , t 0 H G B , t H G B , max
In the formula, H G B , t is GB’s output thermal power at t time, G G B , t indicates the natural gas consumption of GB at t time; ρ G B is GB’s efficiency; H G B , max is the maximum generated heat of GB.
(2)
Heat recovery (HR)
Heat recovery equipment recovers waste heat generated by GT, HFC, and the methane reactor to supply heat to the system. The total recovered heat through HR at t period is:
H H R , t = ρ H R H G T , t + H H F C , t + H P 2 G , t
where H H R , t is the total heat recovery of HR at t period, and ρ H R is the recovery efficiency of HR. H G T , t , H H F C , t , and H P 2 G , t are the heat generation of GT, HFC, and methane reactor, respectively.

2.1.4. Energy Storage System

(1)
Electric storage (ES)
In the OCC-VPP system constructed, the energy-storage equipment can inhibit the fluctuation of renewable energy output, and is an important part of supplying energy continuously for a long time. The mathematical model of ES is:
E E S , t = E E S , t 1 + ρ E S , c h a P E S , c h a , t P E S , d i s , t ρ E S , d i s
where E E S , t is the electric power stored in ES at t period; P E S , c h a , t and P E S , d i s , t are the charging and discharging power of ES at t period; ρ E S , c h a and ρ E S , d i s are the charging and discharging efficiency of ES.
The output power constrains of ES are:
E E S , min E E S , t E E S , max 0 P E S , c h a , t μ E S , c h a , t P E S , c h a , max 0 P E S , d i s , t μ E S , d i s , t P E S , d i s , max 0 μ E S , c h a , t + μ E S , d i s , t 1 E E S , 0 = E E S , T
In the formula, E E S , max and E E S , min are the upper and lower stored power limits of ES; P E S , c h a , max and P E S , d i s , max are the upper charging and discharging power limits of ES; μ E S , c h a , t and μ E S , d i s , t are the charging- and discharging-state variables of the electric energy storage in time period t ; E E S , 0 and E E S , T are the stored power of ES in the initial and final moments of a scheduling cycle, respectively.
(2)
Hydrogen storage (HS)
Similarly to ES, the mathematical model of HS is:
E H 2 S , t = E H 2 S , t 1 + ρ H 2 S , c h a P H 2 S , c h a , t P H 2 S , d i s , t ρ H 2 S , d i s
where E H 2 S , t is the stored hydrogen in HS at t period; P H 2 S , c h a , t and P H 2 S , d i s , t are the charging and discharging rates of HS at t period; ρ H 2 S , c h a and ρ H 2 S , d i s are the charging and discharging efficiencies of HS.
The output constrains of HS are:
E H 2 S , min E H 2 S , t E H 2 S , max 0 P H 2 S , c h a , t μ H 2 S , c h a , t P H 2 S , c h a , max 0 P H 2 S , d i s , t μ H 2 S , d i s , t P H 2 S , d i s , max 0 μ H 2 S , c h a , t + μ H 2 S , d i s , t 1 E H 2 S , 0 = E H 2 S , T
where E H 2 S , max and E H 2 S , min are the upper and lower hydrogen stored limits of HS; P H 2 S , c h a , max and P H 2 S , d i s , max are the upper charging and discharging rate limits of HS; μ H 2 S , c h a , t and μ H 2 S , d i s , t are the charging- and discharging-state variables of HS at t period; E H 2 S , 0 and E H 2 S , T are the amount of hydrogen stored at the initial and final moments of HS in a scheduling cycle.
(3)
Oxygen storage (OS)
Oxygen storage tank can store O2 produced by ASU and electrolyzer during low load periods, which can realize the use of oxygen across time while ensuring the full utilization of electric power. During peak-load periods, the OCC unit will be given priority, in order to meet the electric load and reduce the output power of ASU equipment. Then, the shortfall of oxygen can be supplied by OS, which can ensure the operation of OCC unit and the electric supply and demand balance. Similarly to HS, the mathematical model of OS is:
E O S , t = E O S , t 1 + ρ O S , c h a O c h a , t O d i s , t ρ O S , d i s
where E O S , t is oxygen stored in OS at t period. O c h a , t and O d i s , t are the charging and discharging oxygen in OS at t period. ρ O S , c h a and ρ O S , d i s are the charging and discharging efficiencies of OS.
The output constrains of OS are:
E O S , min E O S , t E O S , max 0 O c h a , t μ O S , c h a , t O O S , c h a , max 0 O d i s , t μ O S , d i s , t O O S , d i s , max 0 μ O S , c h a , t + μ O S , d i s , t 1 E O S , 0 = E O S , T
In the formula, E O S , max and E O S , min are the upper and lower stored oxygen limits of OS; O O S , c h a , max and O O S , d i s , max are the upper charging- and discharging-rate limits of OS; μ O S , c h a , t and μ O S , d i s , t are the charging- and discharging-state variables of the oxygen storage tank at time t ; E O S , 0 and E O S , T are the stored oxygen quantities of the oxygen storage tank at the initial and ending moments of a scheduling cycle, respectively.

2.2. Carbon-Trading Mechanism

The carbon-trading mechanism refers to treating CO2 as a kind of tradable resource, allowing market players to buy and sell carbon-emission rights based on economic incentives, aiming to effectively promote the reduction of carbon dioxide emissions. If VPP’s actual carbon emissions exceeds its allocated carbon-emission allowances, it may choose to purchase additional carbon allowances in the carbon-trading market to achieve compliance. Conversely, if a VPP’s actual carbon emissions are lower than its quota, it can sell them in the carbon market for a profit. This process not only promotes the efficient allocation of carbon resources, but also provides VPPs with the economic means to flexibly respond to carbon-emissions management.

2.2.1. Carbon-Emission Quota Modeling

The VPP’s main carbon-emissions sources are the OCC unit, GB, and the equivalent carbon emissions from the main grid due to power purchases. Its carbon-emission allowance model is:
C Q V P P , t = C Q G T , t + C Q G B , t + C Q g r i d , t C Q G T , t = φ e φ e h P G T , t + γ H G T , t C Q G B , t = γ φ h H G B , t C Q g r i d , t = φ e P g r i d , t
where C Q V P P , t , C Q G T , t , C Q G B , t , C Q g r i d , t are the carbon-emission quota of the VPP system, OCC unit, GB, and purchased electricity, respectively. φ e and φ h are the carbon-emission intensities of electricity and heat. P g r i d , t is the purchased electricity of VPP at t period, and φ e h is the conversion factor of electricity and heat.

2.2.2. Actual Carbon-Emission Modeling

It is assumed that part of the purchased power comes from thermal power units, in which the carbon-capture equipment will use part of the captured CO2 for hydrogen methanization, and the other part will be sequestered by carbon sequestration technology. Therefore, in this section, only the amount of CO2 not captured by the OCC units, the CO2 emitted to the atmosphere by the gas boilers, and the equivalent carbon emissions from the main grid are considered. The actual carbon emissions are modeled as follows:
C E V P P , t = Q C O 2,0 , t + C E G B , t + C E g r i d , t C E G B , t = c G B G G B , t C E g r i d , t = σ c g r i d P g r i d , t
where C E V P P , t is the carbon emission of VPP in t period; C E G B , t and C E g r i d , t are equivalent carbon emissions from the gas boiler and grid at t period, respectively; c G B and c g r i d are carbon-emission coefficients of gas boiler and thermal power generation, respectively; σ is the proportion of thermal power from the grid.

2.2.3. Stepped Carbon-Trading Modeling

Compared with traditional carbon trading, the stepped carbon trading divides carbon emissions into multiple intervals, and the carbon-trading price will be higher along with the corresponding interval, resulting in VPP’s carbon-trading cost increasing. On the contrary, when the carbon emissions are lower than carbon quota, VPP can sell the excess carbon quota to obtain revenue (at this time, the cost is negative) [45]. In this regard, the stepped carbon-trading model is as follows:
E V P P , t = C E V P P , t C Q V P P , t
F t c o 2 = p 2 + 3 Δ τ + p 1 + 3 Δ C E V P P , t + 2 τ ,       C E V P P , t 2 τ p 1 + Δ τ + p 1 + 2 Δ C E V P P , t + τ ,   2 τ < C E V P P , t τ p 1 + Δ C E V P P , t ,                                     τ < C E V P P , t 0 p C E V P P , t ,                                                           0 < C E V P P , t τ p C E V P P , t + p 1 + Δ C E V P P , t τ ,               τ < C E V P P , t 2 τ p 2 + Δ τ + p 1 + 2 Δ C E V P P , t 2 τ ,               C E V P P , t > 2 τ
where E V P P , t and F t c o 2 are the carbon-trading emissions and the cost of VPP at t period, respectively; p is the base carbon-trading price; Δ is the price growth rate, and τ is the carbon-emissions interval length.
Overall, this section aims to characterize the multi-energy flow coupling basic model of the OCC-VPP system and design a carbon-trading mechanism involving OCC-VPP participation. Specifically, Formulas (1)–(14) depict the dynamic balance relationship of “electricity-oxygen-carbon” in the OCC unit, quantify the energy consumption characteristics and thermoelectric ratio adjustment capabilities of the ASU and CPU, and reveal the mechanism by which oxygen-enriched combustion reduces capture energy consumption; Formulas (15)–(32) define the operational constraints of EL, P2G, and energy-storage systems (ES/HS/OS), which support the energy-efficiency improvement path of hydrogen production, oxygen carbon cycle, and methane feedback through the transfer of oxygen/hydrogen/electrical energy across time periods (such as Formulas (12), (29) and (31)); Formulas (33)–(36) are embedded in a stepped carbon-trading mechanism, and a piecewise linear function (36) is used to dynamically correlate the system’s carbon emissions with costs, thereby guiding the low-carbon operation of the system.

3. TSRO Modeling Considering Source–Load Uncertainties

3.1. Modeling of Source–Load Uncertainty

(1)
Source–load scenario generation
Stochastic optimization describes fluctuations by assuming that random variables obey specific empirical probability distributions. In this paper, we adopt the scenario method in stochastic optimization to deal with the uncertainty of scenario probability. The essence of the scenario method is to sample the uncertainty factors, which are then converted into a deterministic problem to be solved under a deterministic scenario. For the scene generated by scene probability distribution, too many scenes will make the solution too difficult, and too few scenes will affect the accuracy of the solution results. Firstly, a large-scale scenario set is obtained by the Latin hypercube sampling method [46]; then, 10 typical scenarios are obtained by using K-means clustering method [47] for scenario reduction.
(2)
Source–load uncertainty modeling
The polyhedral uncertainty set controls the conservatism of RO decision results by adjusting the uncertainty parameter, which solves the problem of the over-conservative decision results in the box uncertainty set [48]. Therefore, in this paper, the polyhedral uncertainty set is chosen to model the source–load uncertainty. The uncertainty is portrayed from two aspects: first, the fluctuation amplitude of the deviation between the predicted power and the actual power; and second, the uncertainty time period. The portrayal of uncertainty is more accurate and close to the actual engineering situation, which is modeled as follows:
U = u = P t W T , P t P V , P t L T R P t W T = P t , k W T + D + , t W T Δ P t W T D , t W T Δ P t W T P t P V = P t , k P V + D + , t P V Δ P t P V D , t P V Δ P t P V P t L = P k , t L D + , t L Δ P t L + D , t L Δ P t L
The uncertainty budget is as follows:
D + , t W T + D , t W T 1 ; t = 1 T D + , t W T + D , t W T Γ W T D + , t P V + D , t P V 1 ; t = 1 T D + , t P V + D , t P V Γ P V D + , t L + D , t L 1 ; t = 1 T D + , t L + D , t L Γ L
In the formula, P t W T , P t P V and P t L represent actual wind power, PV power, and electric load. P t , k W T , P t , k P V and P k , t L denote predicted wind power, PV power, and electric load. Δ P t W T , Δ P t P V , and Δ P t L are deviation values of the predicted wind power, PV power, and electric load. D + , t W T , D + , t P V , and D + , t L are the identifiers of the optimization of wind power output, PV power output, and electric load. D , t W T , D , t P V , and D , t L are the values for the worst results for wind power, PV power, and load. Γ W T , Γ P V and Γ L are the regulation parameters for wind power, PV power, and load uncertainty. The polyhedral uncertainty set parameters Γ W T , Γ P V , and Γ L are calibrated based on historical forecast error data. We analyze one year of wind/PV/load forecast errors from the North China region, fitting their distributions to establish fluctuation boundaries.
(3)
Probabilistic uncertainty modeling of source–load scenarios
The 10 scenarios obtained through scenario reduction have initial scenario probabilities, and the probabilities of the actual scenarios are inconsistent with the initial scenario probabilities, i.e., there is uncertainty in the probability distribution of the source–load scenarios. In order to obtain a feasible optimal operation strategy, the source–load scene probabilities are constrained. The comprehensive paradigm constraints on the scene probabilities are stronger than the separate 1-parameter and ∞-parameter constraints, which are closer to the actual engineering operation situation and help to reduce the system cost. In this paper, the fuzzy sets of scene probabilities for ten scenarios are constrained by the integrated paradigm constraints consisting of 1-paradigm and -paradigm:
Ω = σ s σ s 0 ,   s = 1 T σ s = 1 s = 1 T σ s σ s 0 θ 1 max 1 s M σ s σ s 0 θ
where θ 1 and θ denote the 1-paradigm and -paradigm constraints, respectively.
θ 1 = M 2 M k l n 2 M 1 α 1 θ = 1 2 M k l n 2 M 1 α
where α 1 and α denote the 1-paradigm and -paradigm confidence levels, respectively. M is the number of reduced scenarios, which is 10 scenarios in this paper, and M k is the amount of historical data.

3.2. Objective Function

In this paper, a TSRO model based on the combination of probability-driven distributionally robustness and two-stage robustness of min–max–max–min form is developed. The model is as follows:
min x f 1 + max σ s Ω   max u U   min y s = 1 N s σ s f 2
where x and y denote the first-stage and second-stage decision variables, respectively, σ s is the scenario probability of the s-th scenario, and Ω is the fuzzy set of scenario probabilities. f 1 and f 2 are the first- and second-stage objective functions.
(1)
First-stage objective function
The decision variables of the first-stage min problem are the power purchase from the system to the external power grid, the equipment charging and discharging states within the VPP, the dyadic variables in the robustness problem bounded by the inequality about the uncertainty quantities and time periods, and the auxiliary variables introduced in order to linearize the robustness problem. The start–stop variables within the system are put into the first stage, decision making, because a 0–1 variable in the second stage, the max–min structure, would not satisfy the strong dyadic and the KKT condition cannot be used. The first-stage objective function is as follows:
f 1 = min t = 1 T F t b u y + F t z + F t s t a t e + F t C C G
where F t b u y , F t z , F t s t a t e denotes the purchasing electricity cost, the penalty cost of considering tariff uncertainty, and the cost of starting and stopping equipment in the VPP system, respectively. F t C C G denotes the cost required to link the master and sub-problems of C&CG.
F t g r i d = π t g r i d P g r i d , t F t z = β t + α ϱ
where π t g r i d denotes the power purchase price, and P t g r i d denotes the electricity purchased from external power grid. β t is the dual variable of the inequality constraint on the amount of power price uncertainty; α is the dual variable of inequality constraint during power price uncertainty period, and ϱ is the amount of tariff deviation.
F t s t a t e = c y u c h , t y + u d i s , t y
where y presents ES, HS, ES, OS, respectively; c y denotes their start–stop cost coefficient, and u c h , t y and u d i s , t y are their charging and discharging states.
(2)
Second-stage objective function
The purpose of the second-stage max–min issue is to find the worst case in the scenario and develop an optimal strategy for VPP operation. The objective function is:
f 2 = t = 1 T F t C H 4 + F t o m + F t c u t + F t c o 2 + F t c u
where F t C H 4 , F t o m , F t c o 2 , F t c u t and F t c u are the gas purchase cost, O&M cost, carbon-trading cost (the revenue when it is negative), scenery penalty cost, and carbon sequestration cost, respectively.
F t C H 4 = π t C H 4 G t g a s
In the formula, π t C H 4 denotes the gas purchase price. G t g a s denotes the volume of gas purchased by VPP from the external gas grid.
F t o m = c j o m P t j F t c u t = c c u t P c u t , t W T + P c u t , t P V
where c j o m is the O&M cost of equipment j in VPP, and P t j is the output power of equipment j in VPP. c c u t is the cost of renewable energy abandonment. P c u t , t W T and P c u t , t P V are the abandoned wind and PV power.
F t c u = c c u m t c u
where c c u is the carbon sequestration cost coefficient.
(3)
Third-stage objective function
The third-stage max problem decides the worst-case scenario probability with ten scenarios, and the predicted probabilities of the beginning ten scenarios are used as the initial value of the iteration. Each scenario has a max–min problem, after the second stage of the ten scenarios calculated, the third stage calculates the worst probability distribution of the ten scenarios. The objective function of the third stage is:
f 3 = σ s f 2

3.3. Constraints

The constraints of this paper are as follows:
C = C 1 , C 2 , C C C G C C C G = [ C c , C c f ]
where C 1 and C 2 are the first- and second-stage constraints, respectively. C C C G is the optimal cutting constraint for the C&CG algorithm. C c and C c f are the optimal cut constraints for constraints and objective functions.

3.3.1. First-Stage Constraints

(1)
Electricity market power-purchase constraints
0 P t g r i d P max g r i d
where P max g r i d is the upper electricity limit purchased from the grid.
(2)
Strong dual linearization robust-problem constraints
α + β t ε τ t α 0 β t 0 τ t 0 τ t P t g r i d τ t
where τ t is an auxiliary variable introduced to linearize the robust problem.

3.3.2. Second-Stage Constraints

(1)
Equipment operation constraints
Specifically, it includes all the relevant operation constraints of the equipment in Section 2.1 of this paper.
(2)
Power balance constraints
P W T , t + P P V , t + P grid , t + P E S , d i s , t + P O C C , t + P H F C , t = P l o a d , t + P E L , t + P E S , c h a , t + P P 2 G , t + P t , c u t W T + P t , c u t P V H G B , t + H H R , t = H l o a d , t G t g a s + G P 2 G , t = G G T , t + G G B , t Q E L , t + P H 2 S , d i s , t = Q H F C , t + G H 2 , t + P H 2 S , c h a , t Formula   ( 10 )
where P t L and Q t L are the electrical and thermal loads.
Overall, this section aims to construct a scheduling model for OCC-VPP and propose a TSRO model to address the multiple uncertainties. Specifically, Formulas (37) and (38) use polyhedral uncertain sets to describe the boundaries of wind, solar, and load fluctuations, and control conservatism by adjusting parameters; Formulas (39)–(40) solve the problem of inaccurate probability distribution in stochastic optimization by constraining the scene probability fuzzy set with a comprehensive norm. On this basis, Formula (41) constructs a TSRO optimization framework, coupling the physical model with uncertainty to achieve a balance between robustness and economy; Formulas (42)–(49) specifically explain the objective function of the model, while Formulas (50)–(53) provide the constraints of the scheduling model.

4. Stochastic–Robust Model Solution

The TSRO model is written in the following compact form:
min X c T X + max σ s Ω   max u U   min Y h x , σ s , u s σ s d T Y s . t . K X + H Y = E ,   A Y g   u , D σ s J ,   B u S ,   V X N
where X and Y are the vector forms of the first- and second-stage quantities X and Y , respectively, and V and N are the coefficient matrices of the first-stage constraint equations. K , H , and E denote the coefficient matrices of the constraints associated with the first and second stages. A , B and S are the coefficient matrices of the second-stage constraints. D and J are the coefficient matrices of the third-stage constraints.
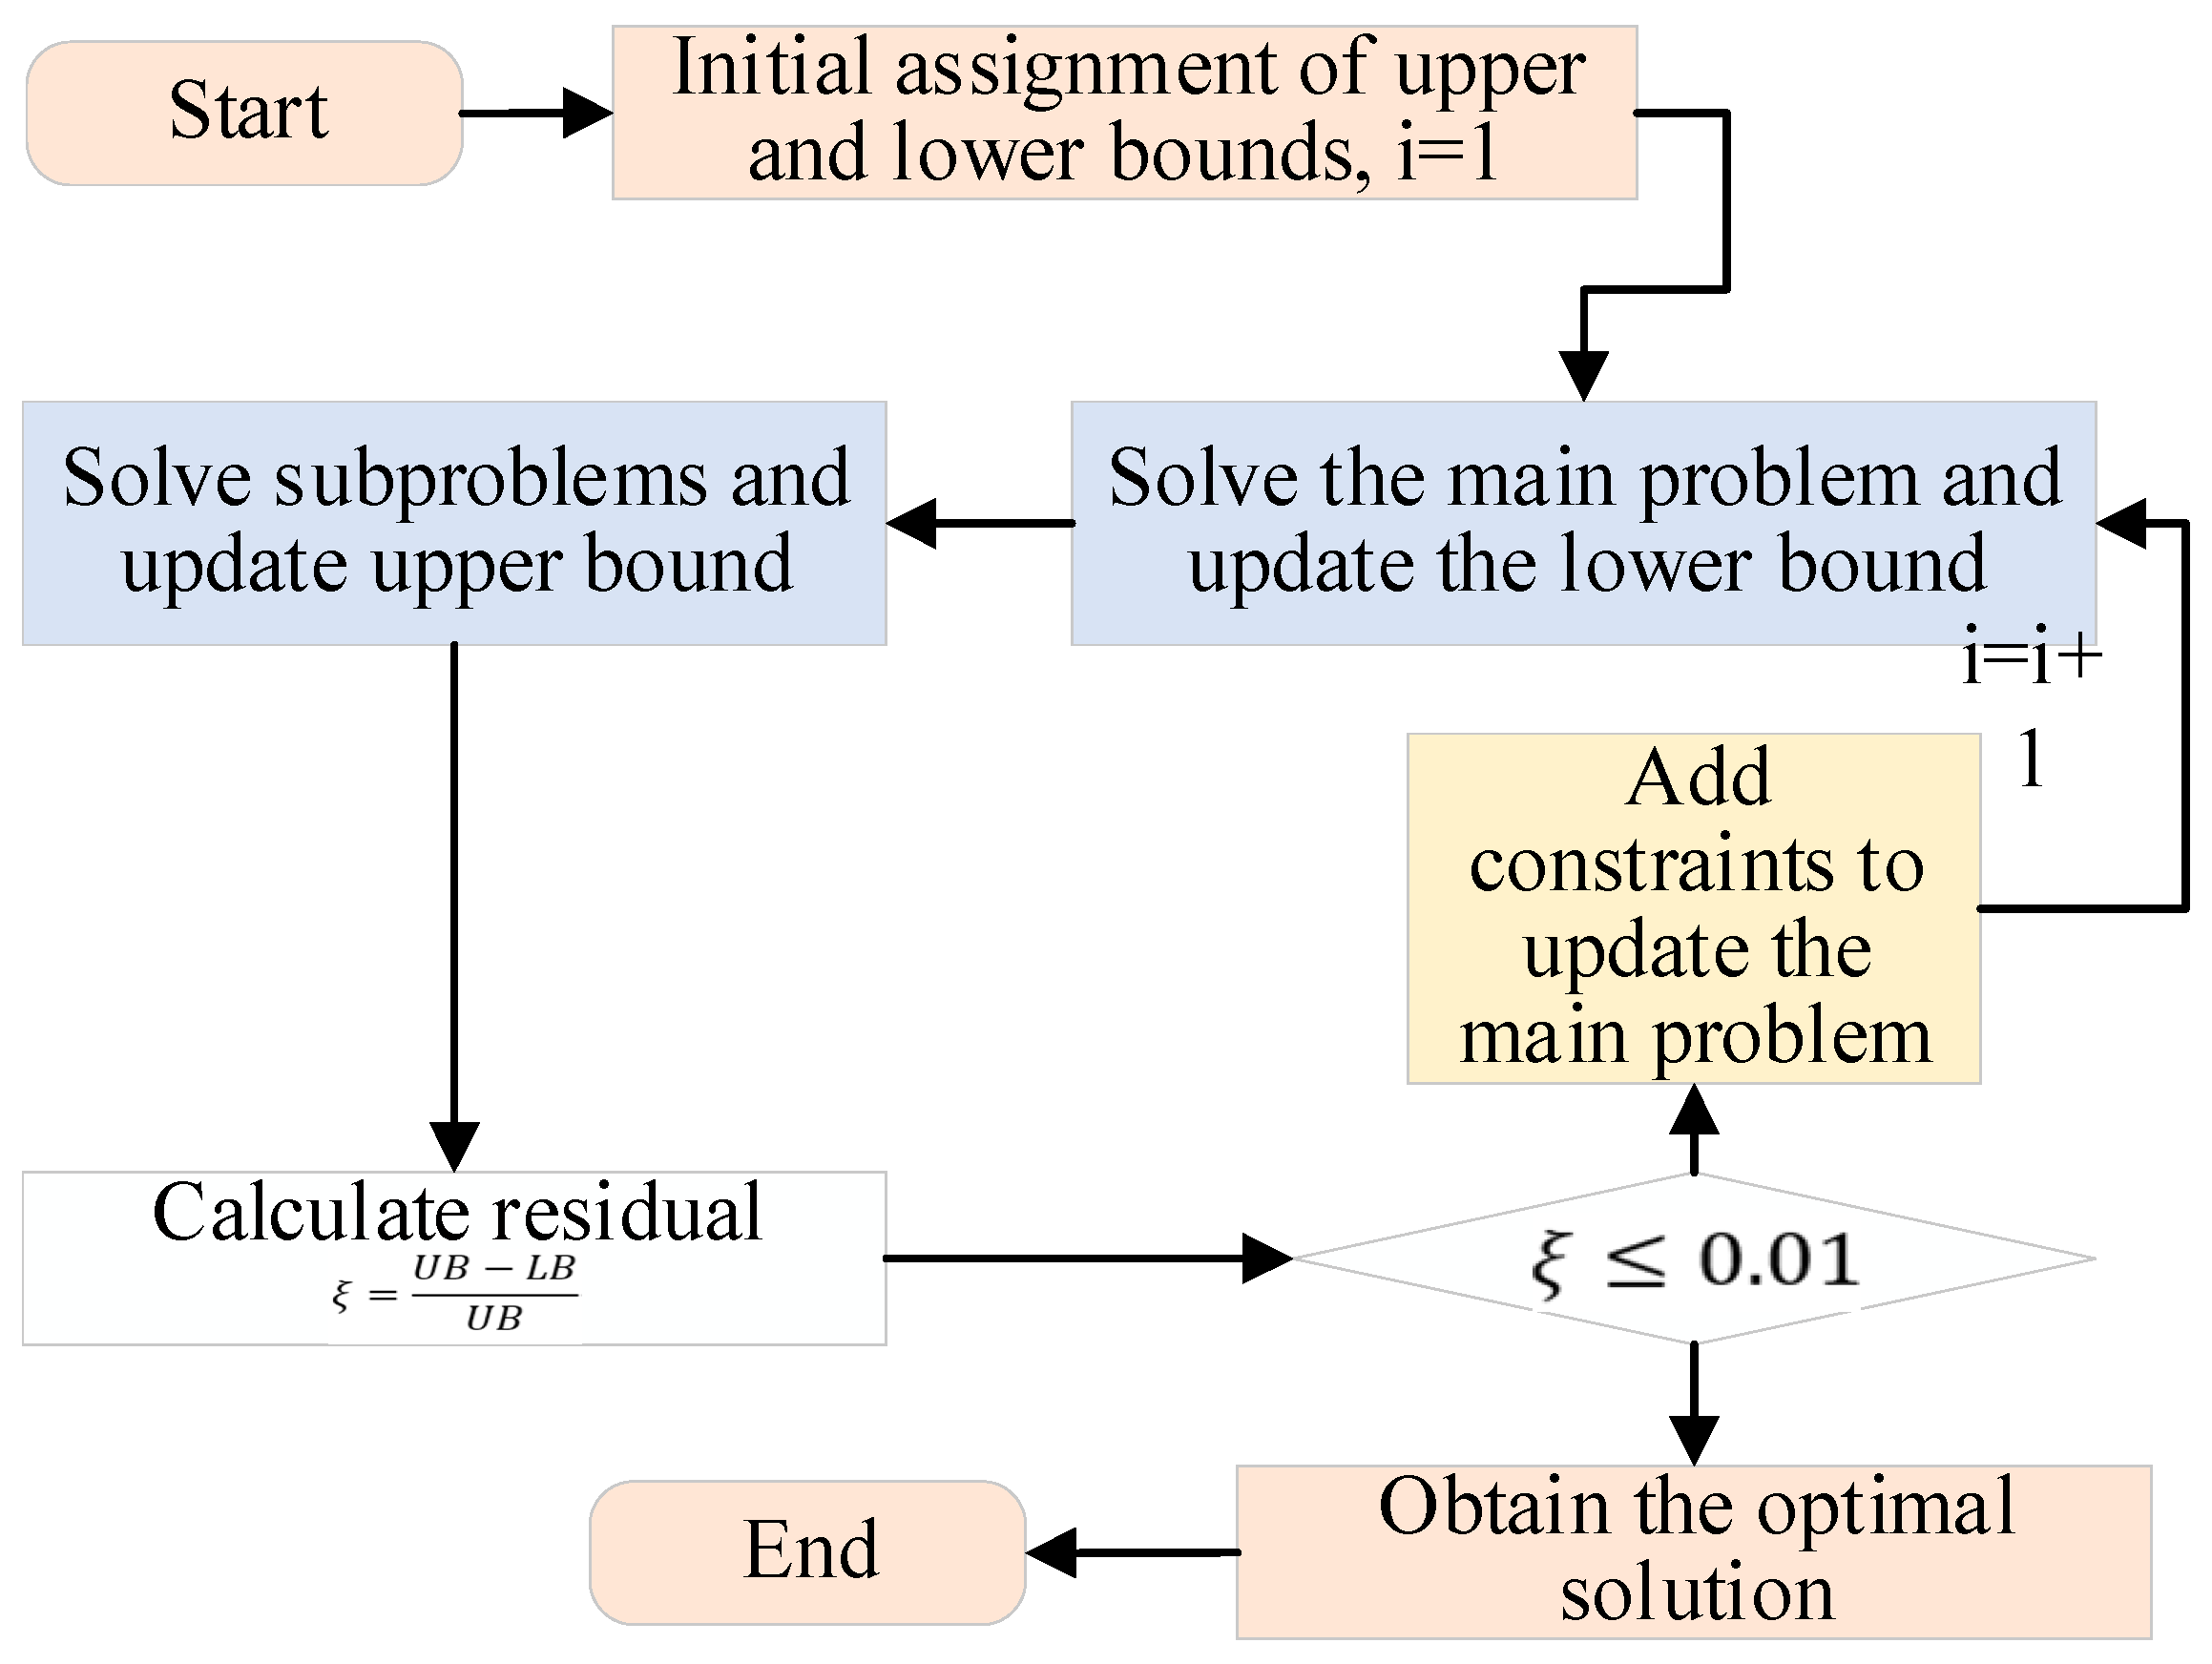
The model is solved using a parallelizable C&CG algorithm [49] by dividing the model into master-problem and sub-problem variables in alternating iterations. The main problem is the first-level min problem, where all the start–stop state variables of the system must be decided at the first level. The sub-problem is a max–max–min three-level structure; there are 10 scenarios in this paper, there are also 10 max–min problems, and only after the calculation can we proceed to the fourth-level max problem, and the purpose of the fourth level is to compute the worst-case scenario probability of the 10 scenarios.

4.1. Master Problem

The objective function of the main problem serves as model’s lower bound, and a new set of variables and constraints is added to the main problem every time the worst-case scenario is discovered during iteration, which is the optimal cut constraint described in the previous section of this paper. The master problem is represented as follows:
min X , σ s , u , Y i c T X + Ξ s . t .   Ξ s σ s d T Y i K X + H Y = E A Y g i u V X N
where Ξ is the predicted value of the sub-problem and i is the iteration number. g i u is the worst-case scenario for the i -th iteration.

4.2. Sub-Problems

The sub-problem is able to pass the found worst-case scenario to the master problem, and the objective function of the sub-problem can calculate the upper bound of the model. The sub-problem is represented as follows:
max σ s Ω   max u U   min Y h x , σ s , u s σ s d T Y s . t . K X + H Y = E ,   A Y g   u ,   D σ s J ,   B u S ,   V X N
The sub-problem can be decomposed into two sub-problems that can be solved.
(1)
Sub-problem 1:
max u U min Y h x , σ s , u s σ s d T Y s . t . K X + H Y = E ,   A Y g   u ,     B u S ,   V X N
For the max–min two-layer problem, in order to simplify the solution process, the two-layer problem is transformed into a single-layer max problem using the KKT condition, and then the constraints are linearized using the large M method [50]. The transformation process is as follows:
max u U min Y h x , σ s , u s σ s d T Y s . t . K X + H Y = E ,   A Y g   u ,     B u S ,   V X N ϖ 1 T H + s σ s d T = 0 ,   ϖ 1 0 ϖ 2 T A + s σ s d T = 0 ,   ϖ 2 0 ϖ 1 T K X + H Y E = 0 ϖ 2 T A Y g   u = 0
Then, linearize it by the large M method:
M   1 ϕ ϖ 2 T A Y g   u M ϕ
where M is a large positive number and ϕ is a binary variable.
(2)
Sub-problem 2:
max σ s Ω min Y h x , σ s , u s σ s d T Y s . t . K X + H Y = E D σ s J V X N
In the formula, the nonlinear terms consisting of σ s and Y are in two separate layers, so the min problem can be solved first and the max problem can be solved later. The representation is as follows:
y s = min Y h x , σ s , u s σ s d T Y s . t .   K X + H Y = E V X N
max σ s Ω σ s y s s . t . D σ s J
Overall, Formulas (54)–(62) provide a model-solving algorithm based on C&CG, where the master problem (55) generates a scheduling ground state, and sub-problems (57)–(62) use KKT conditions and the big M method to handle double-layer optimization, achieving parallel computing for multiple scenarios and significantly improving solving efficiency.
The solution flow of C&CG algorithm is shown in Figure 2.

5. Case Simulation

5.1. Description of the Algorithm

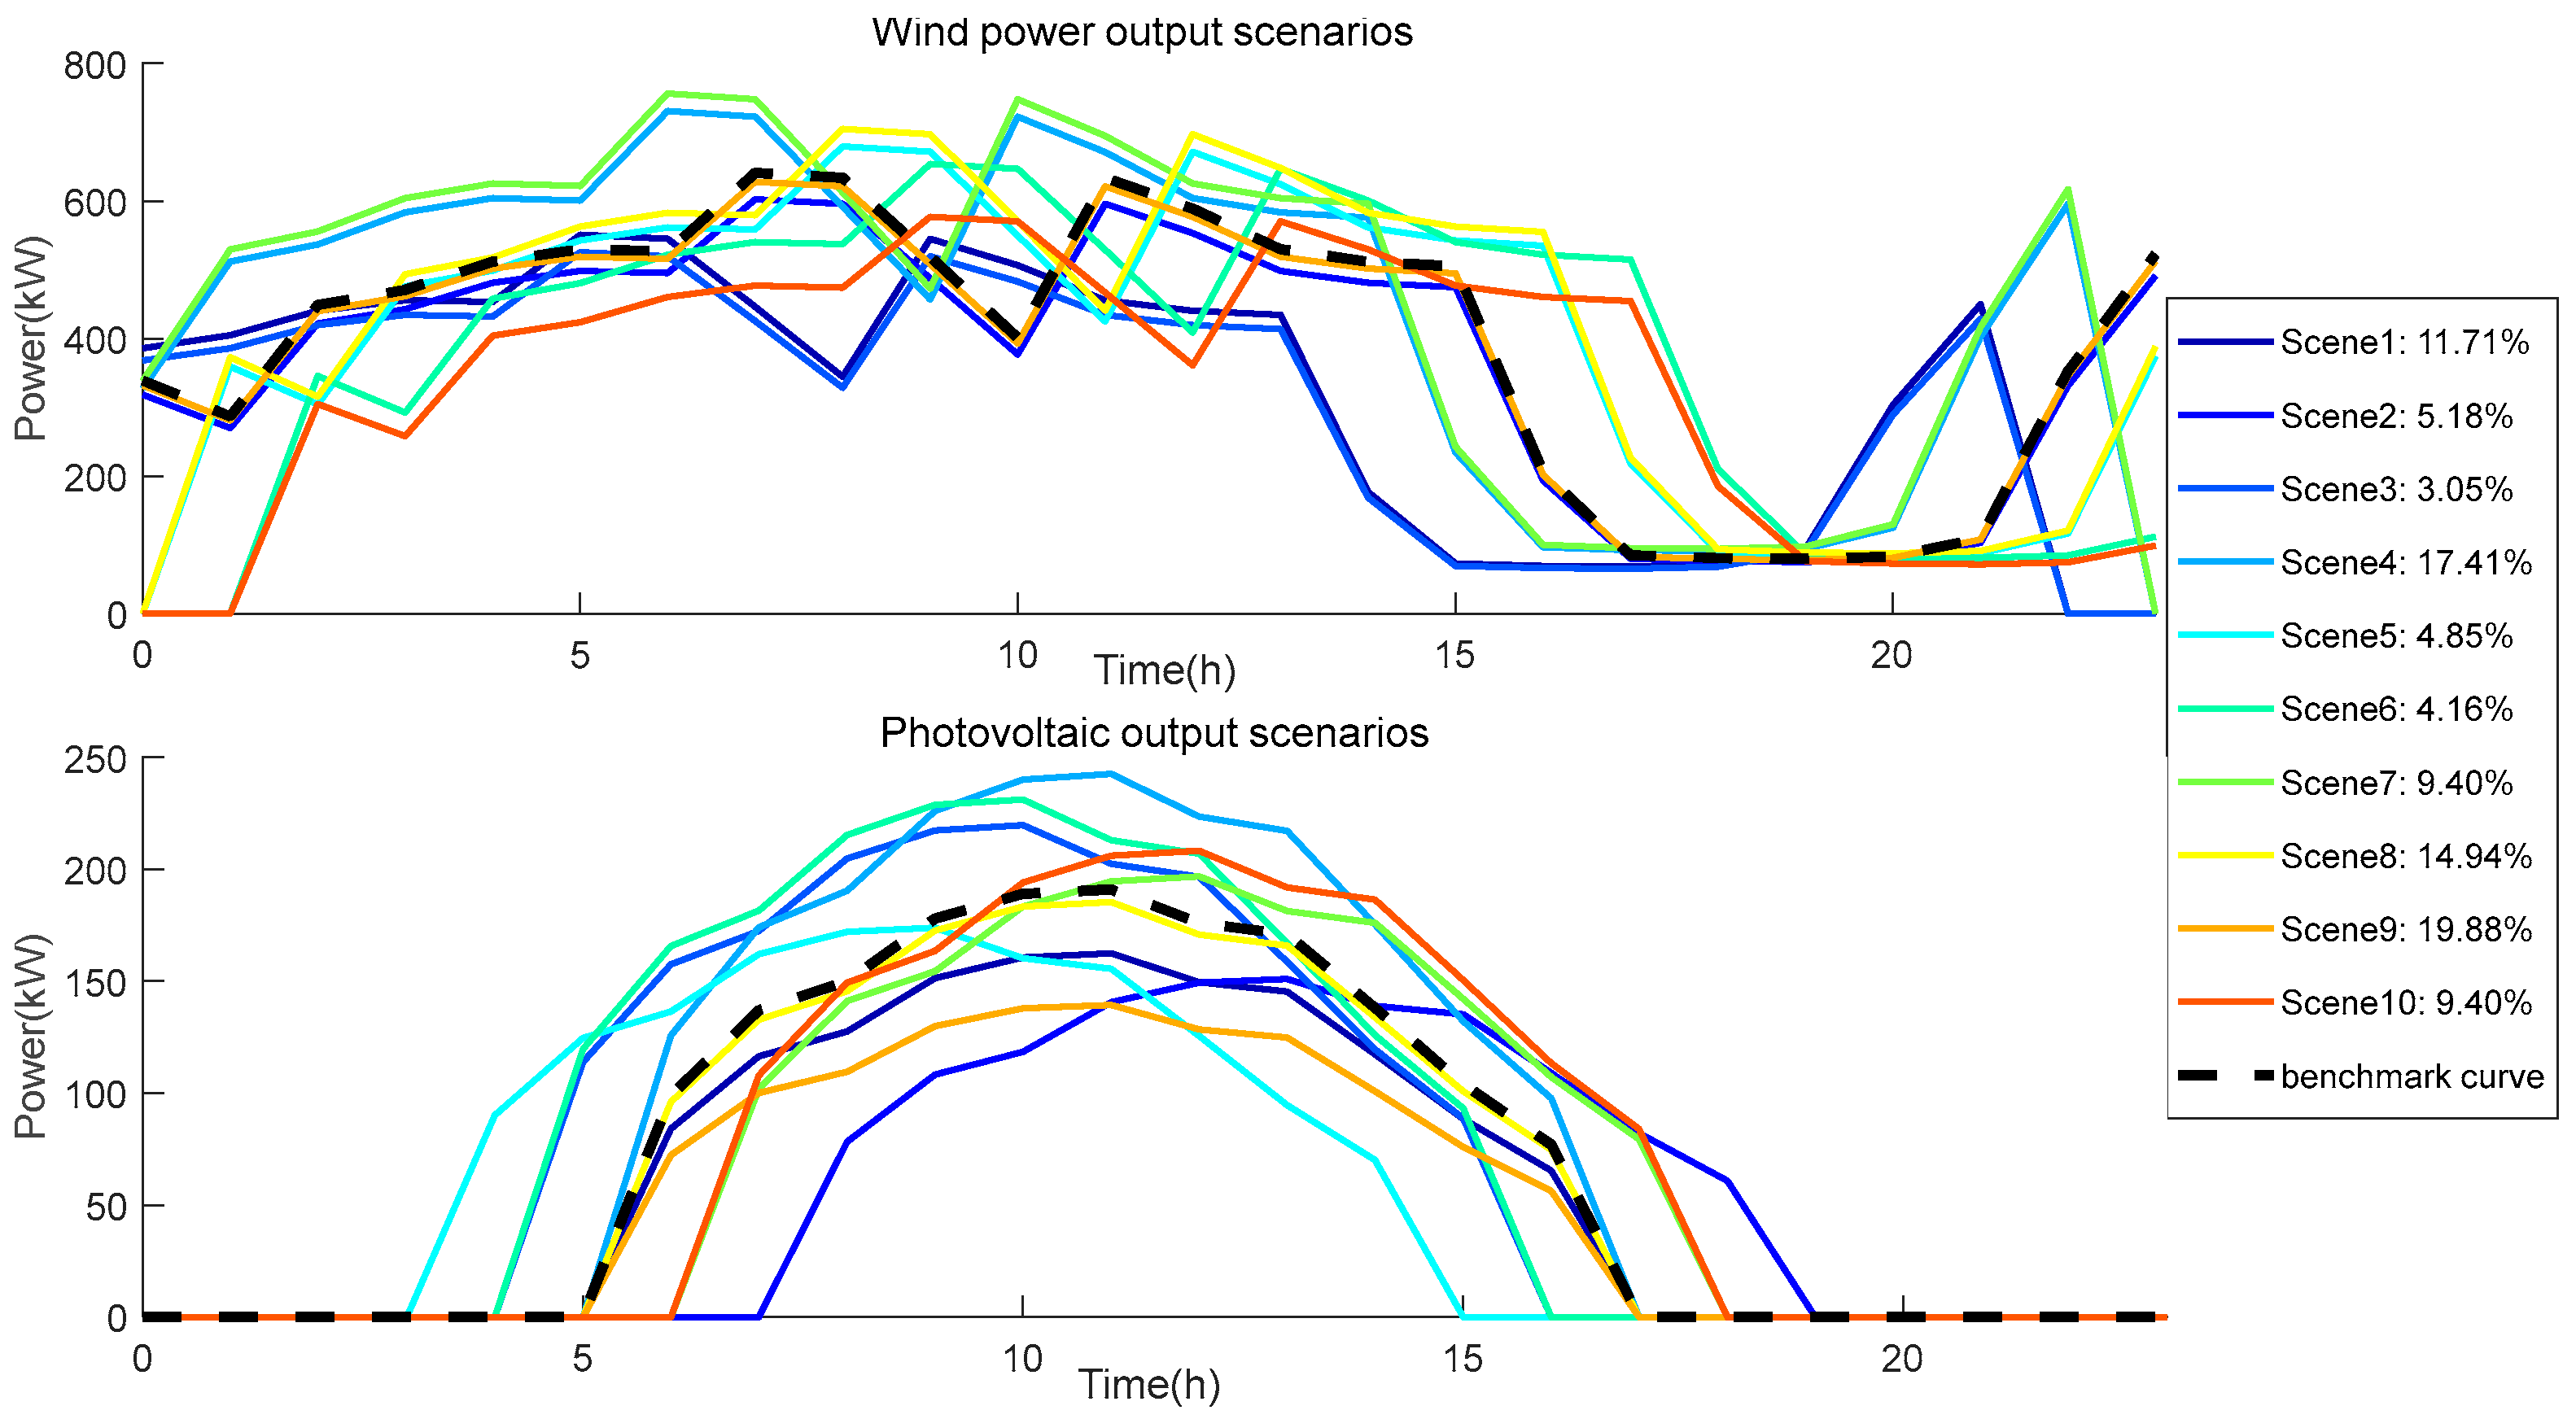
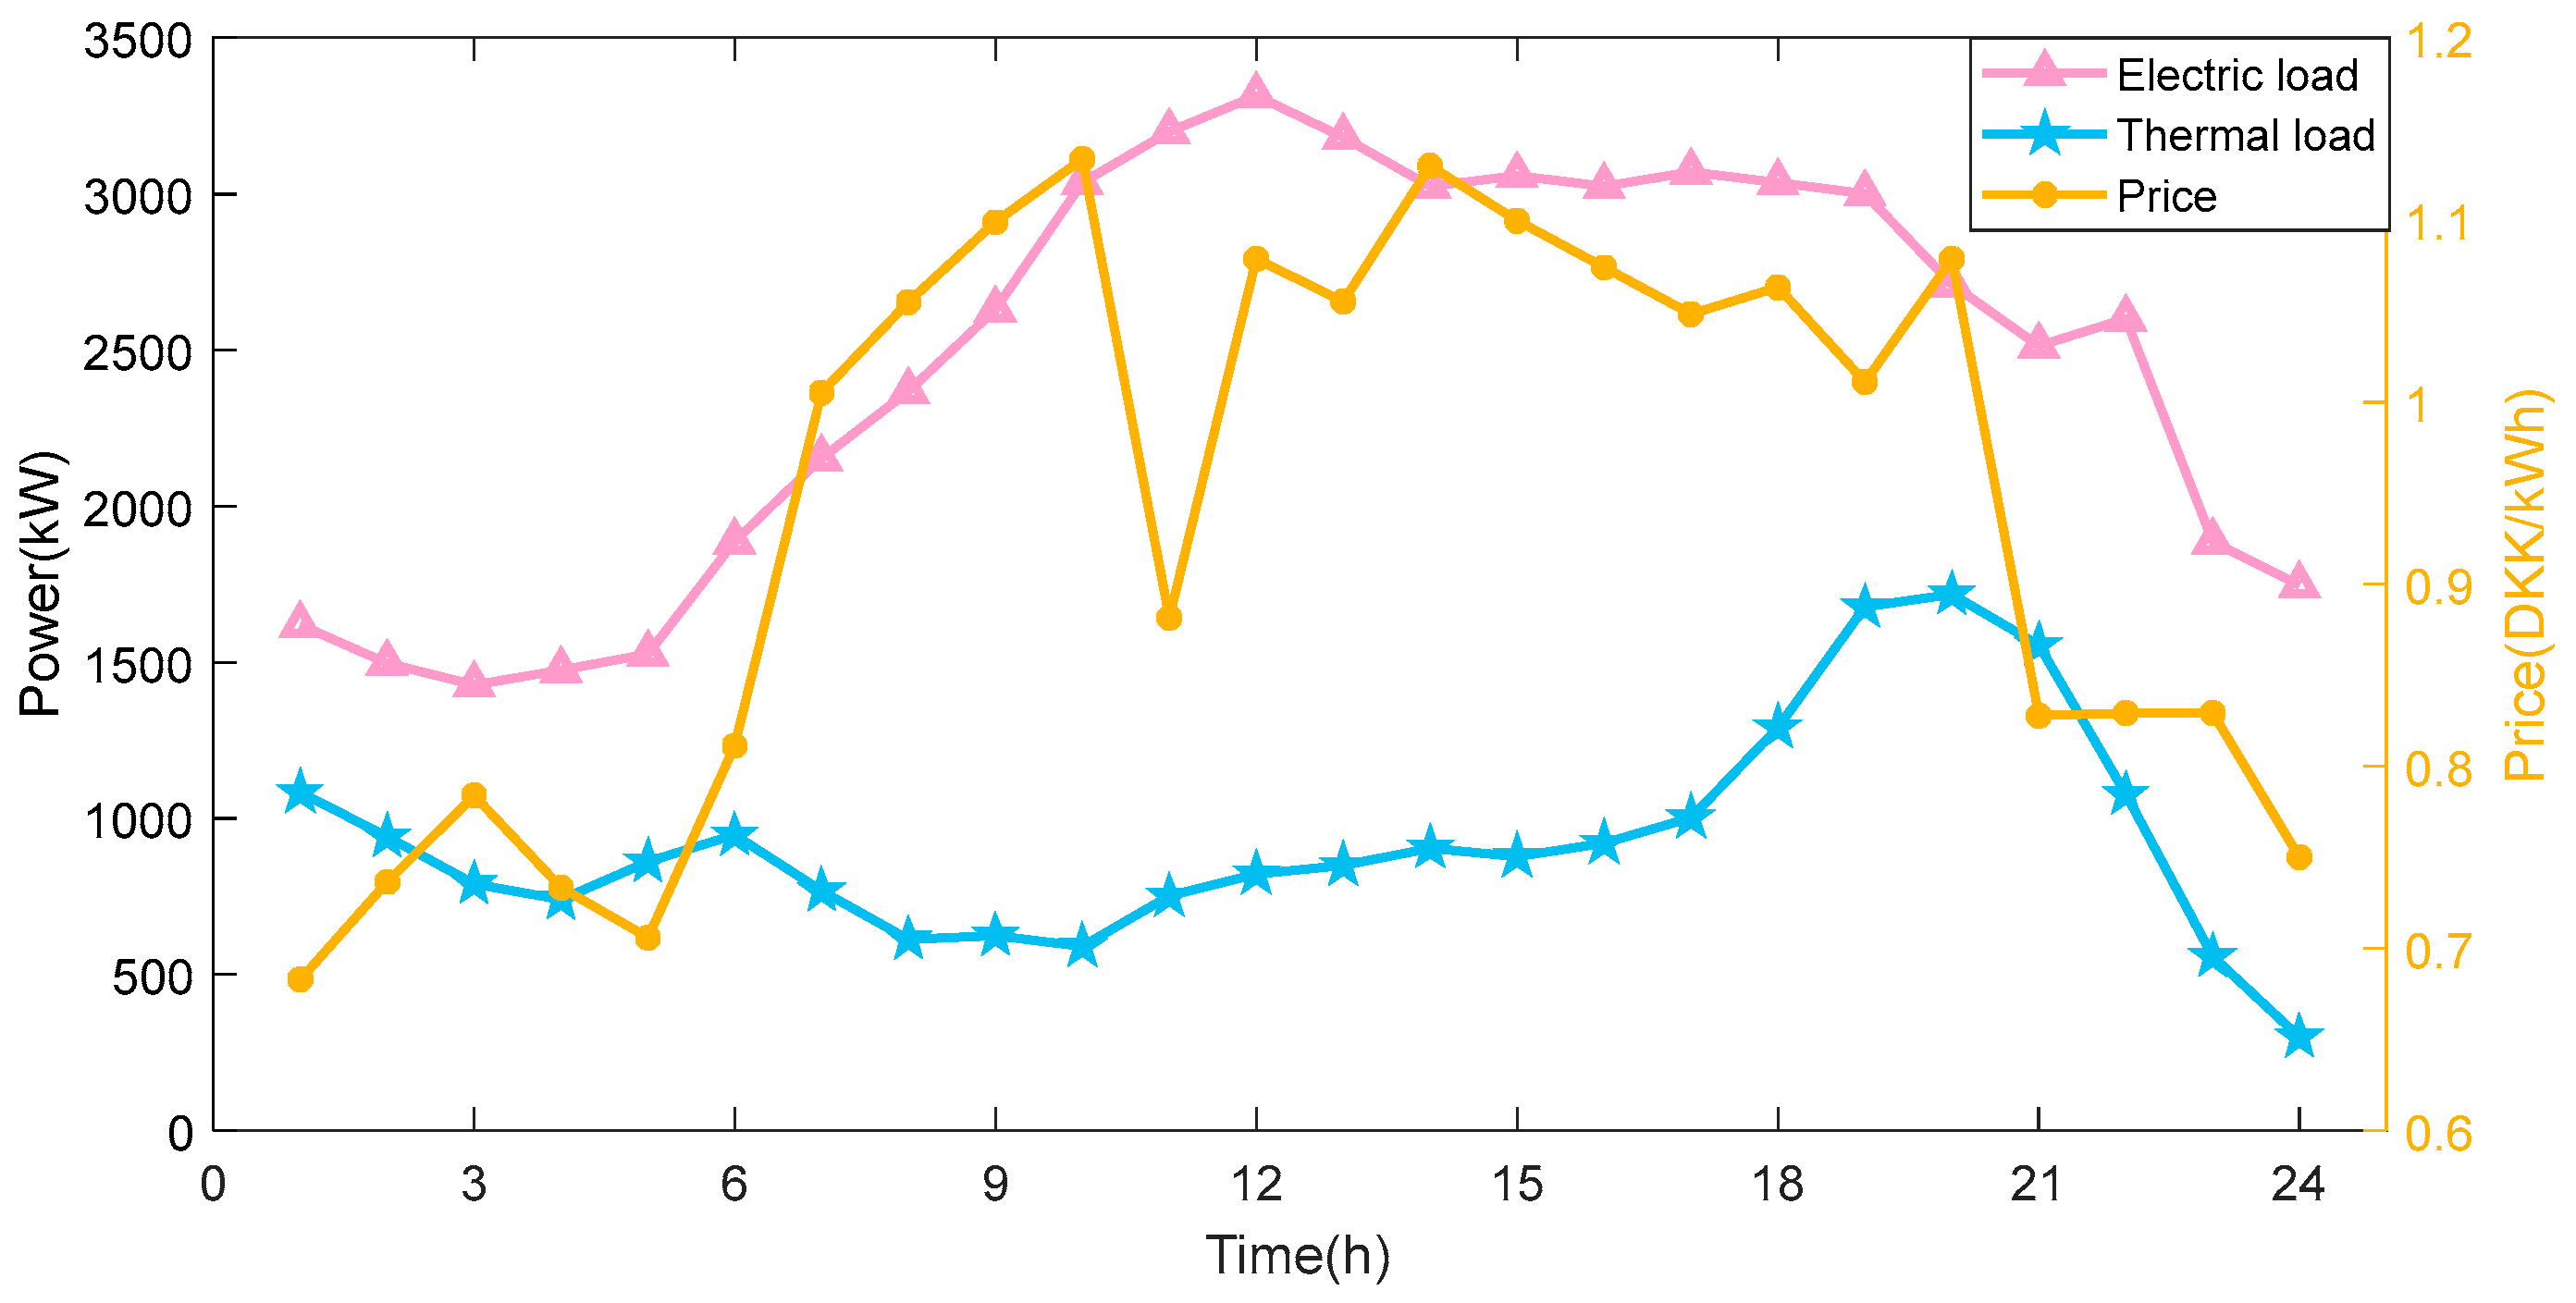
In this paper, the VPP in a region in North China is used as a case study to illustrate the effectiveness of the three-stage, four-level stochastic–robust model proposed in this paper. The data related to wind power and PV needed in the system simulation are obtained from https://www.tennet.eu, where the wind power and PV output are shown in Figure 3. The electricity-load and heat-load data as well as the electricity market price within the VPP are shown in Figure 4. Relevant parameters for VPP system are listed in Table 1. The code is programmed in MATLAB 2018 and solved by the Gurobi solver, which operates on Intel (R) Core (TM) i5 1.99 GHz computer with 8 GB RAM. The convergence accuracy of C&CG is 0.01 and the maximum number of iterations is set to 15.

5.2. Analysis of VPP System Operation Results

5.2.1. Analysis of Results of Electric Heat Supply in VPP

(1)
Analysis of electric energy-scheduling results
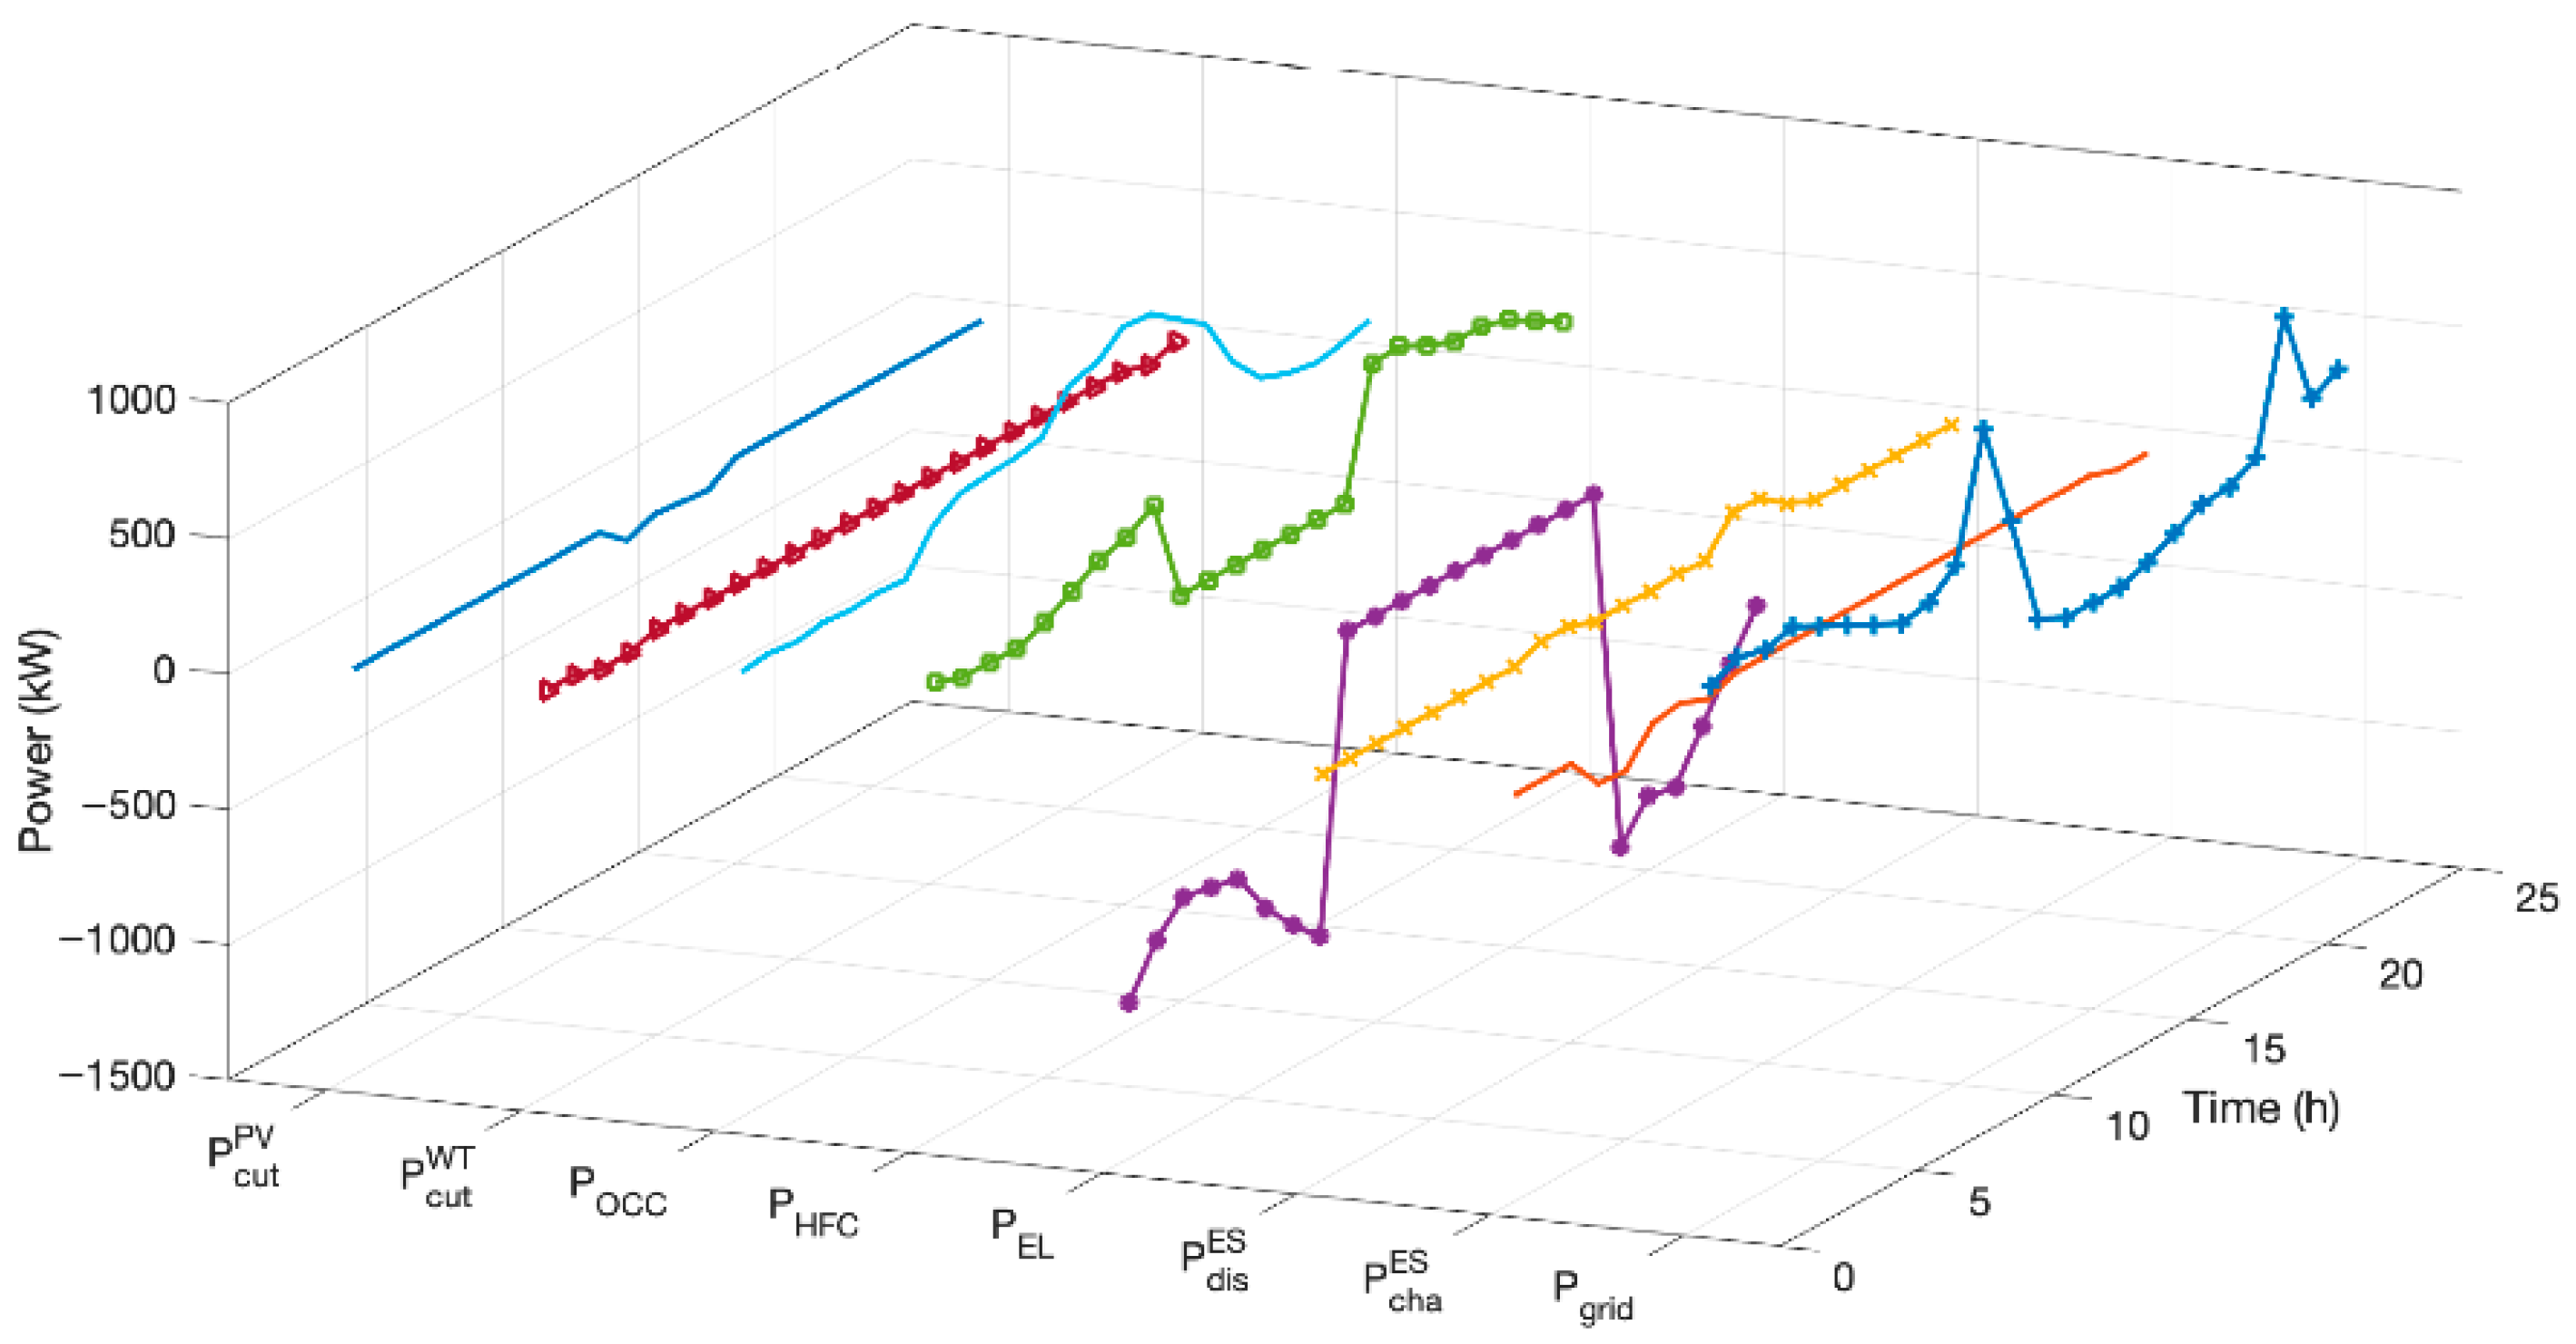
From Figure 5, it can be seen that the electrical energy load in the VPP is mainly supplied by the oxygen-rich combustion unit, and wind power and photovoltaic are utilized as much as possible. When the VPP experiences an energy shortfall, it supplements its supply by purchasing electricity from the main power grid or activating HFC generation. Energy-storage systems simultaneously provide flexible regulation services to the VPP by leveraging their operational capabilities. During periods of high renewable output and low electricity demand—specifically from 21:00 to 04:00 and 11:00 to 14:00—the system prioritizes renewable energy utilization. Excess electricity is diverted to power-to-hydrogen conversion systems and storage units, enabling temporal energy transfer and preservation. Conversely, when renewable generation is low, the VPP utilizes OCC and HFC units to maintain electricity supply, ensuring continuous low-carbon power delivery. Furthermore, energy-storage assets optimize economic performance by dynamically adjusting charge/discharge cycles in response to market pricing signals. A typical strategy involves charging during low-price intervals (e.g., 04:00–07:00) and discharging during high-price periods (e.g., 16:00–18:00), thereby capitalizing on price arbitrage opportunities.
(2)
Analysis of thermal energy-scheduling results
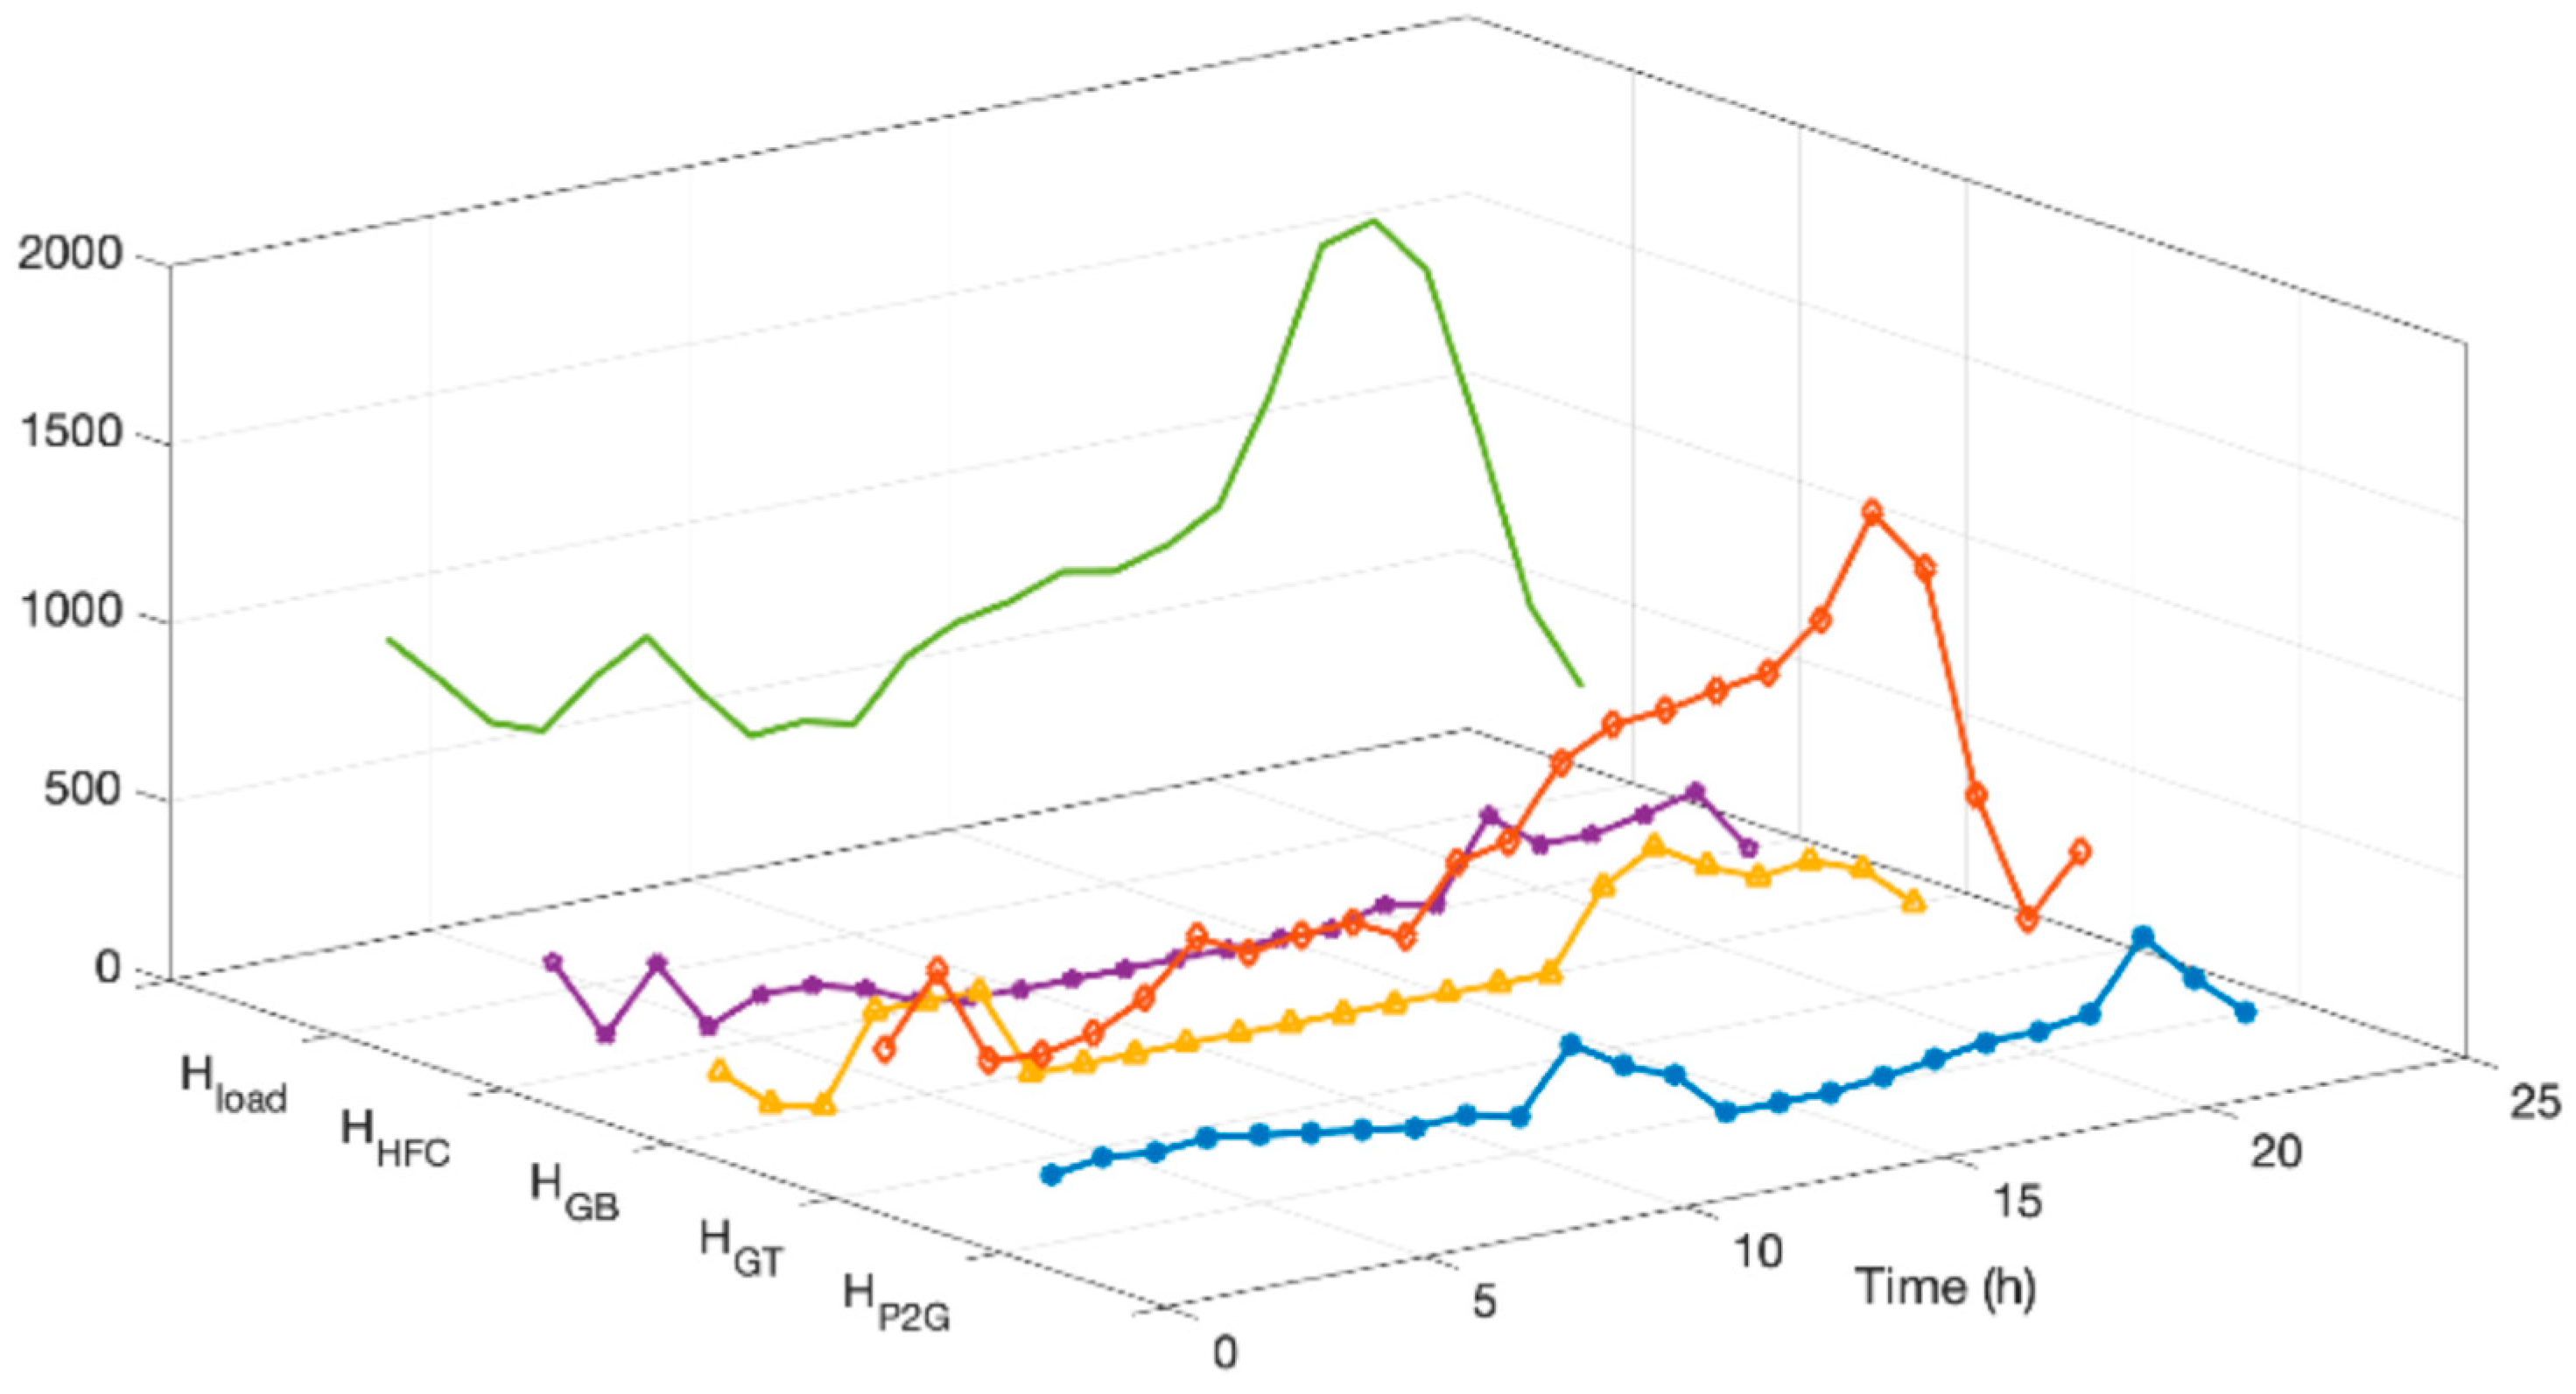
As can be seen from Figure 6, the thermal load in VPP is mainly supplied by OCCs and hydrogen fuel units. During periods of high thermal demand and low electrical load, the VPP maximizes heat production by operating OCC and HFC units at their peak heat-to-power ratio. Should thermal supply prove insufficient, GB are activated to meet the residual heat-load demand. After 20:00, as the thermal load gradually decreases, the primary heat supply transitions to OCC within the VPP. During concurrent peaks in both thermal and electrical demand, the system prioritizes electrical balance by reducing the heat-to-power ratio of OCC and HFC units. Since these units cannot fully satisfy thermal requirements under this operating mode, GB output increases accordingly to maintain thermal energy balance.

5.2.2. OCC Operation Analysis

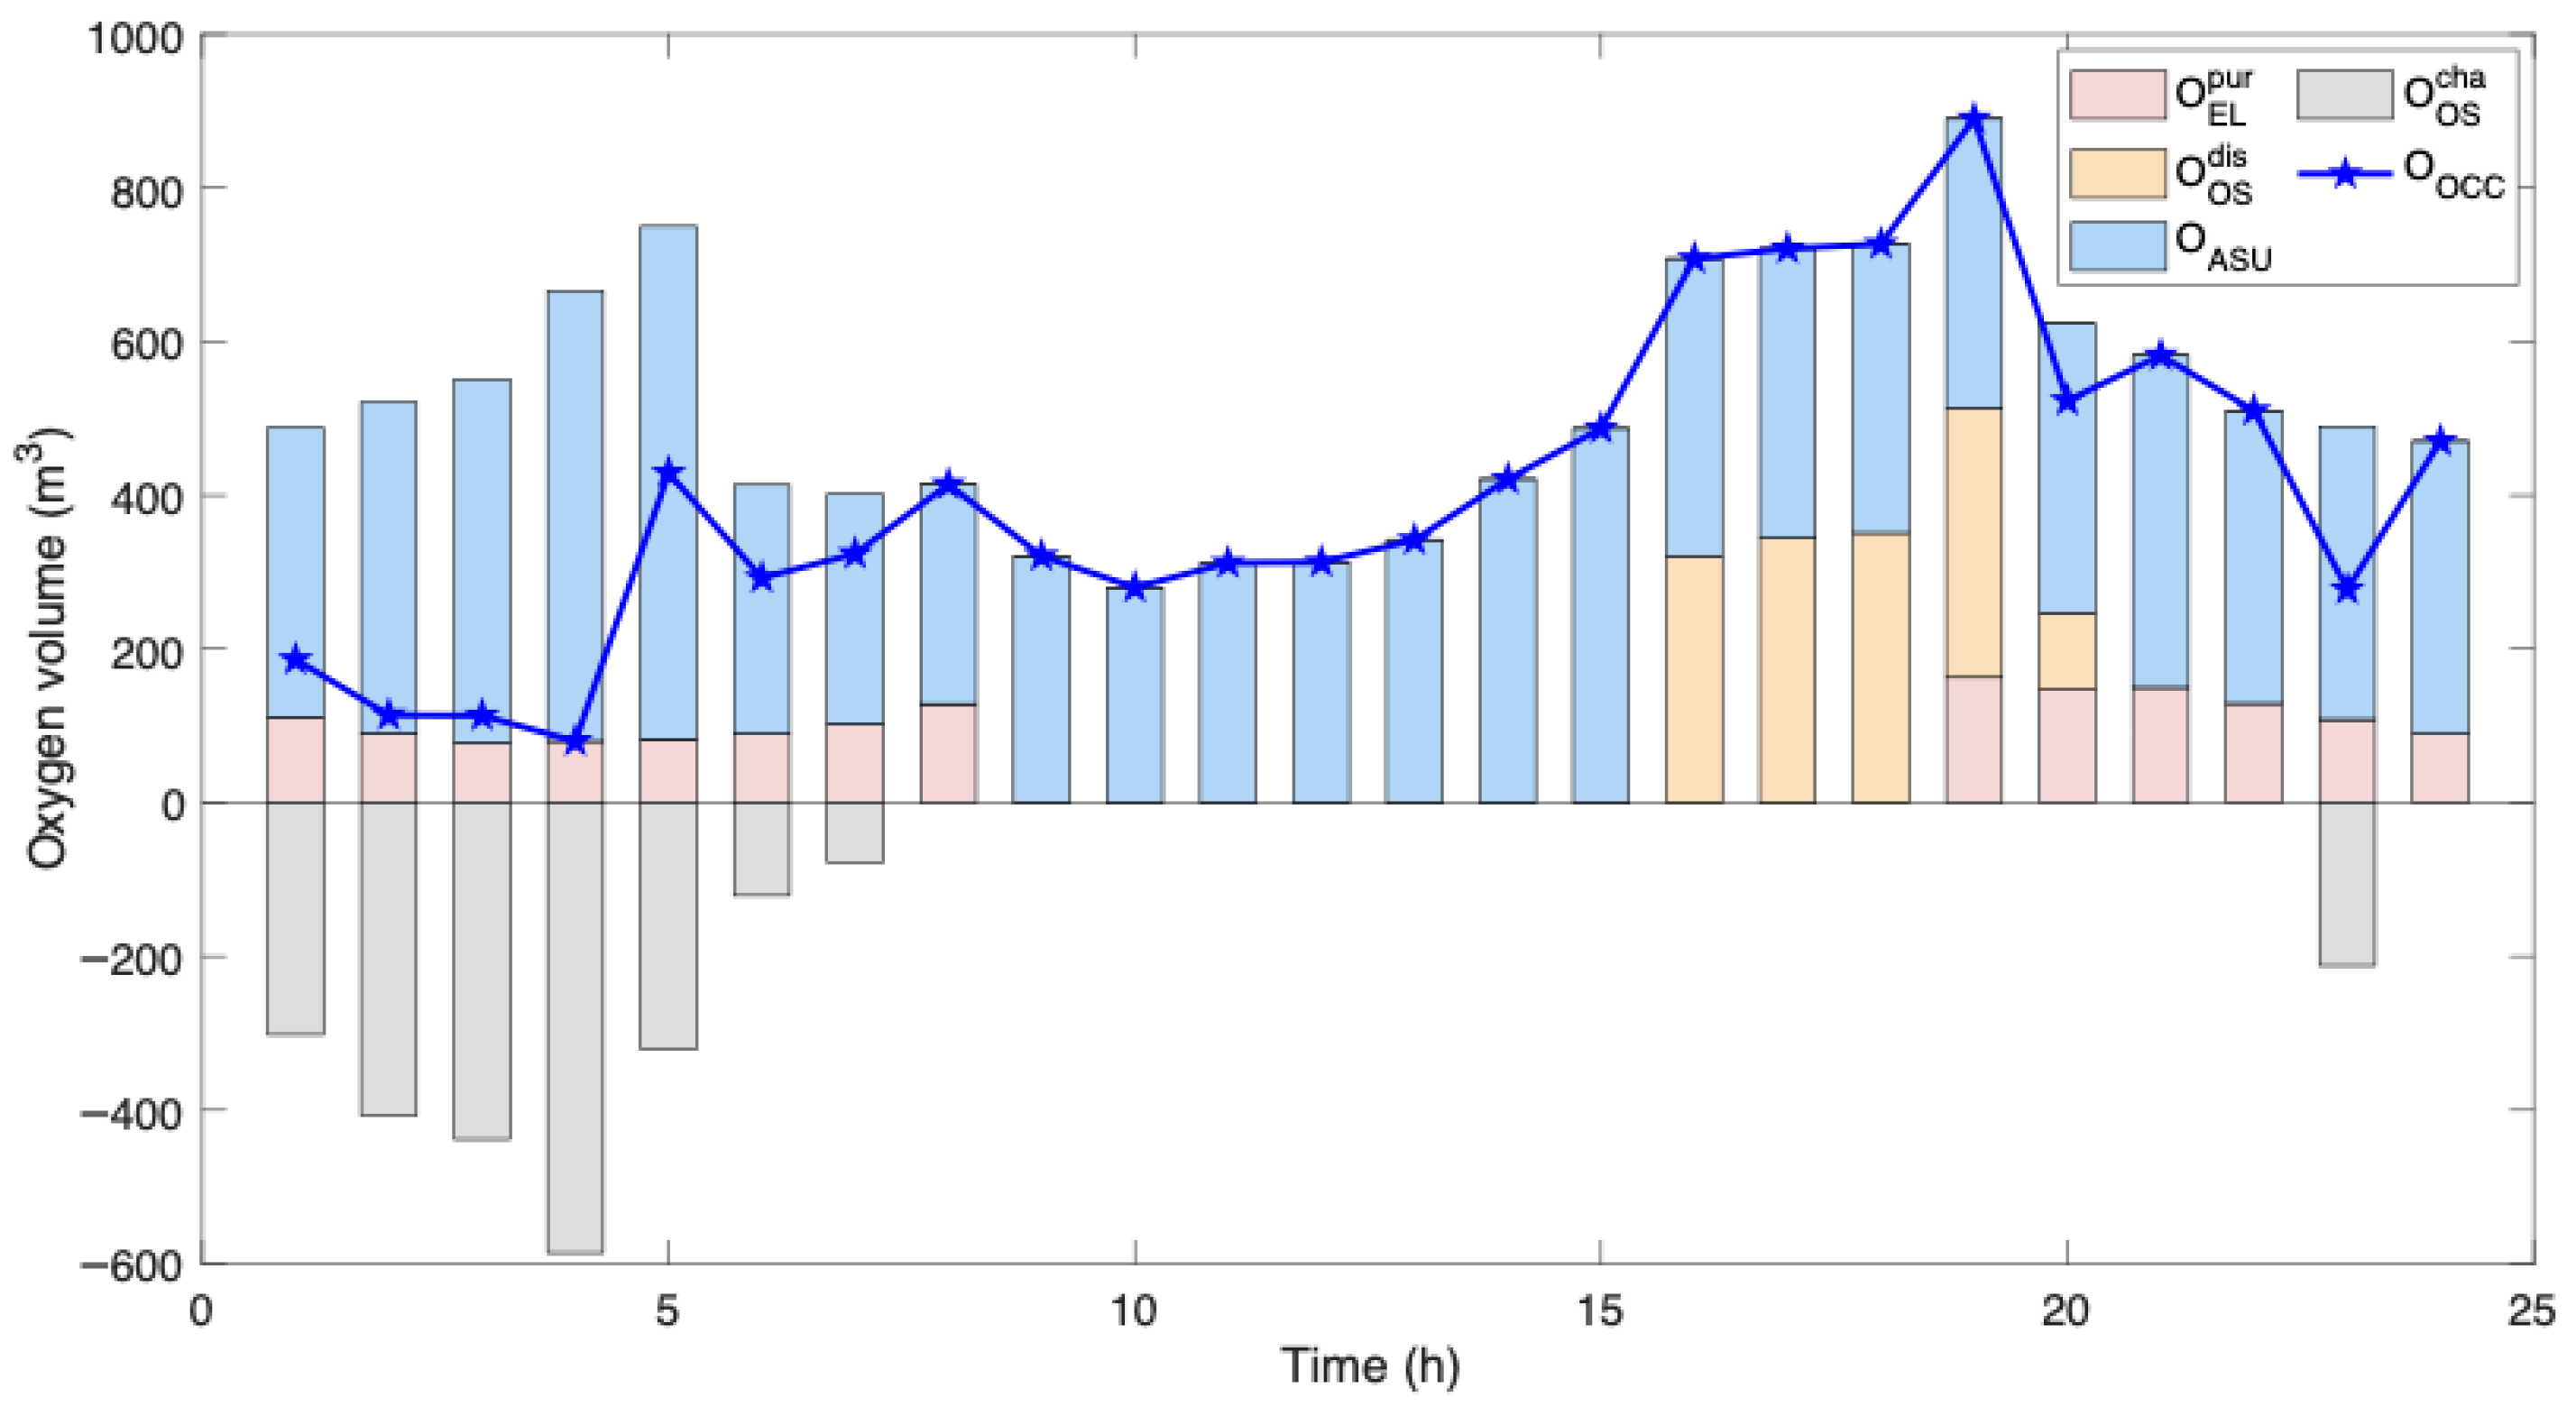
The relationship between the oxygen generated through the electric–hydrogen generation system and the oxygen supply and demand of the OCC is shown in Figure 7.
From Figure 7, it can be seen that the oxygen filling and discharging operations of the oxygen storage s are mainly concentrated in the wind power resource-rich hours as well as the peak-load hours of electricity. From 00:00 to 05:00, when wind power generation is abundant and electricity demand is low, the system diverts excess energy to operate the ASU and EL. The oxygen produced by these units is stored in the OS system, effectively utilizing surplus nighttime wind power through energy transfer. As electrical load increases, the OCC adjusts to meet demand by reducing ASU power consumption. Simultaneously, the OS releases stored oxygen, ensuring coordinated electricity–oxygen operation of the OCC. Notably, oxygen from electrolysis accounts for 19.7% of the system’s total oxygen supply. This integration achieves three key benefits, that is, it reduces ASU energy consumption, increases net power output of the OCC, and enhances operational flexibility. Additionally, this approach lowers the unit’s oxygen procurement costs by partially substituting purchased oxygen with electrolytically produced oxygen.
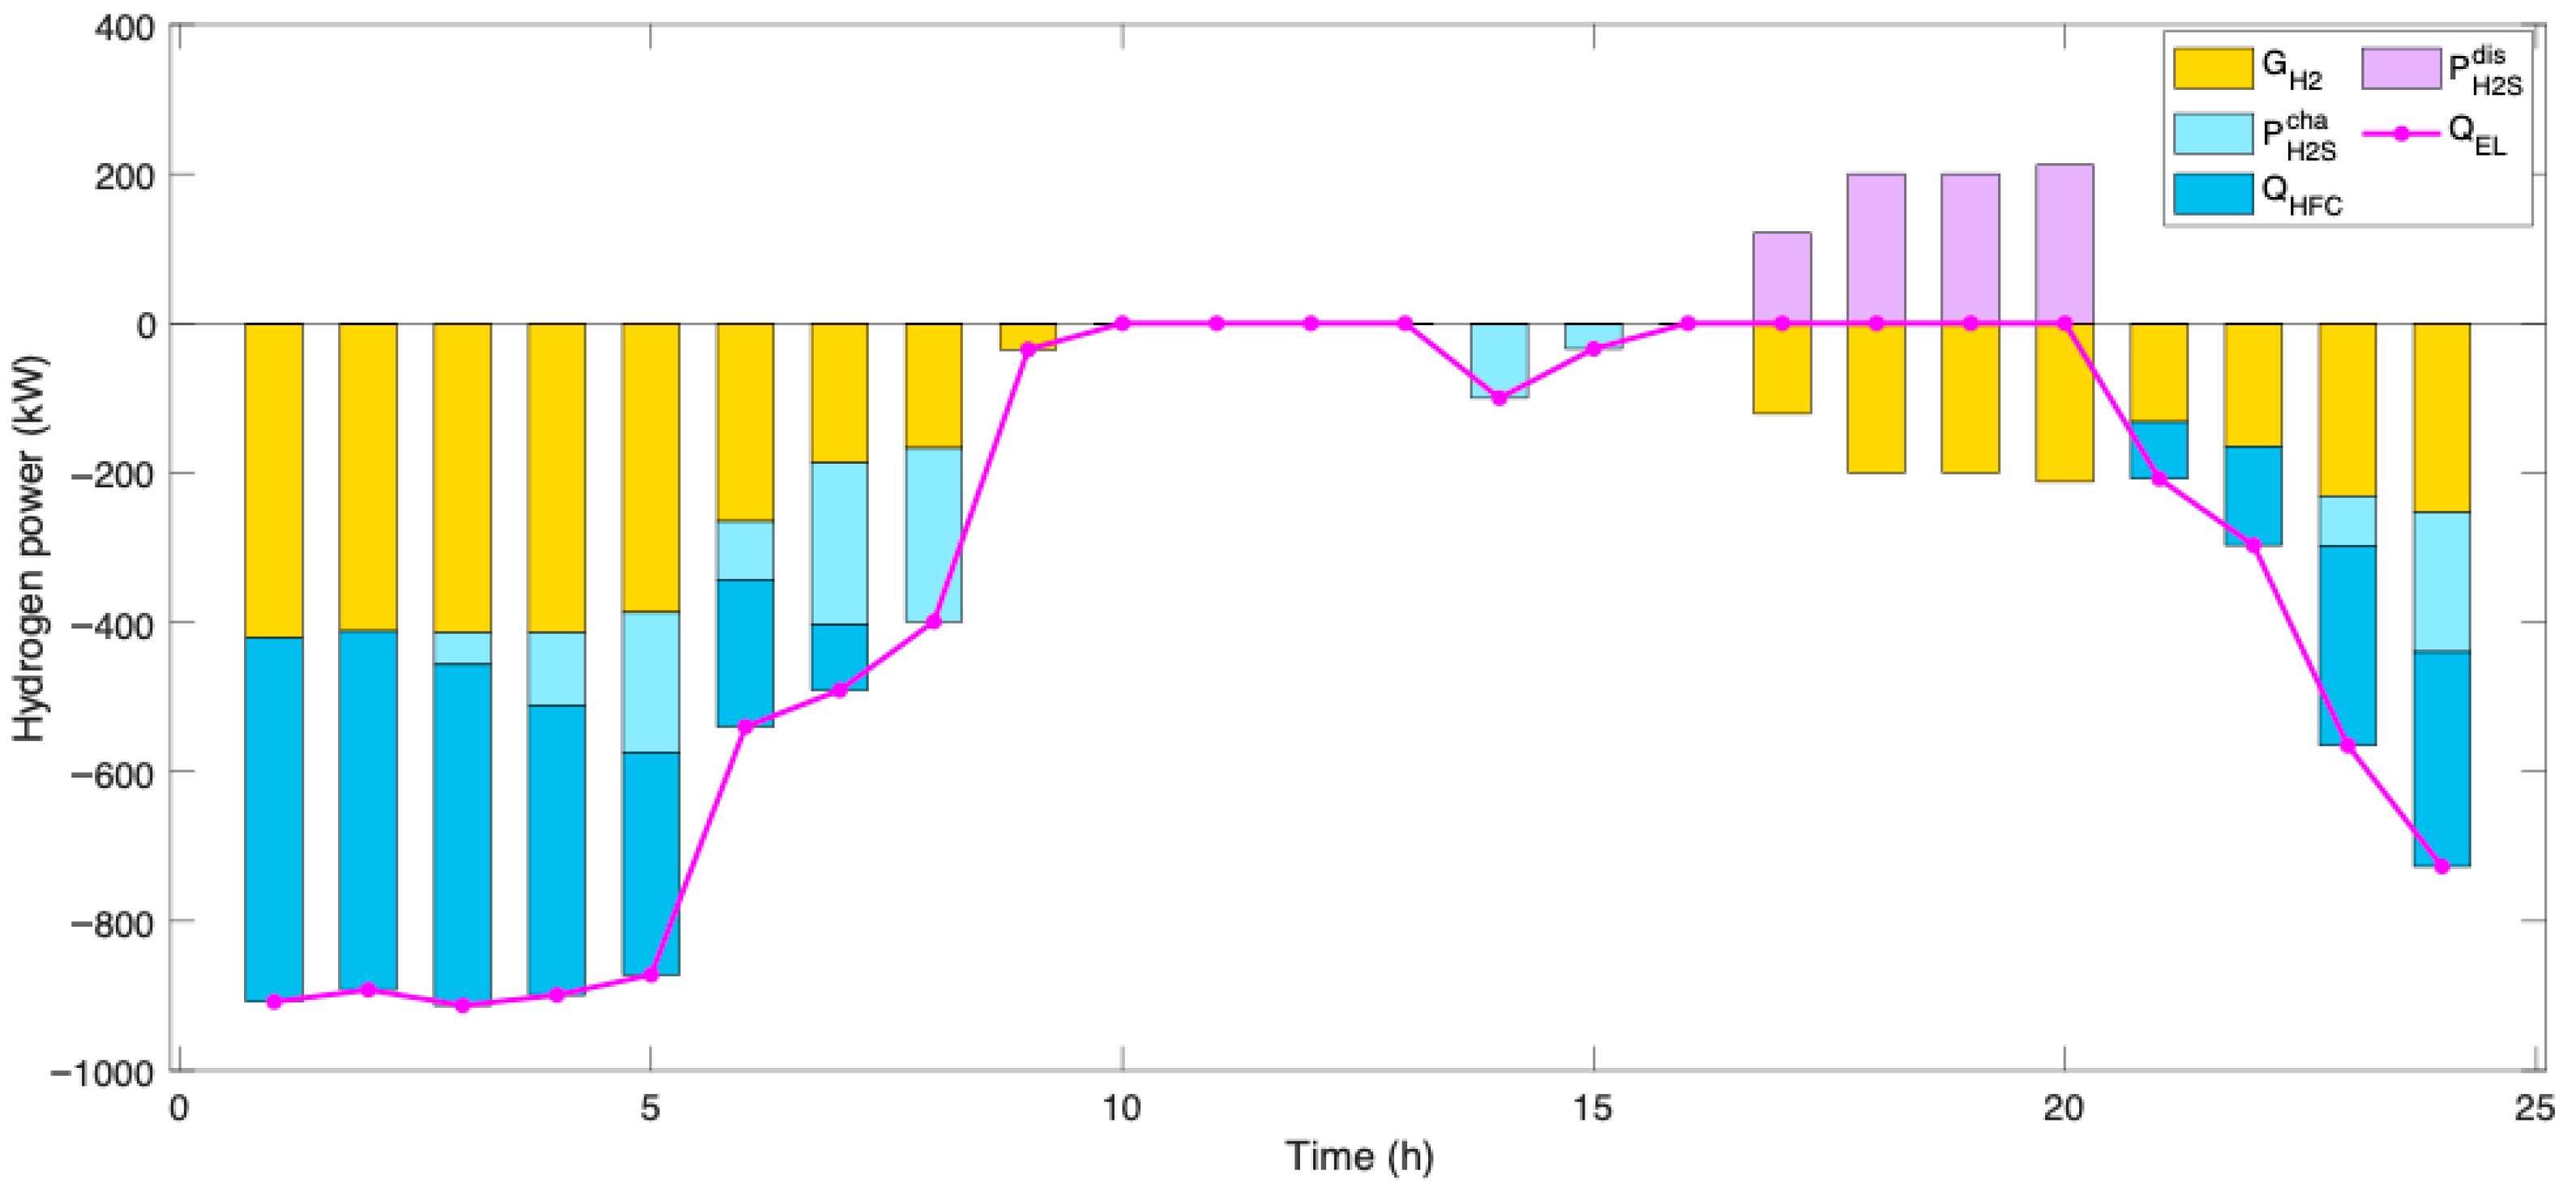
As can be seen from Figure 8, EL supplies 52% of the generated hydrogen energy to the hydrogen fuel unit to satisfy the demand of electric and thermal loads, 41% of the hydrogen energy is used for hydrogen methanization, and the remaining 7% of the hydrogen energy is stored through HS. During the overnight period (21:00–05:00) characterized by low electricity demand, high thermal load, and abundant wind generation, EL convert surplus electrical energy into hydrogen. A portion of this hydrogen directly fuels hydrogen-powered units to meet concurrent electricity and heat demand, while another fraction undergoes methanation to produce synthetic natural gas (SNG) for supply to gas-fired equipment. The HR from this methanation process simultaneously alleviates thermal production pressure on gas units and reduces system gas procurement costs. The remaining hydrogen is stored in HS systems and strategically discharged during the evening peak-consumption window (17:00–19:00), leveraging HS’s energy time-shifting capability to achieve peak shaving and valley filling while lowering overall operational expenses.

5.3. Impact of Uncertainty on VPP Scheduling Results

5.3.1. Impact Analysis of Uncertainty Degree

The prediction error is set to 10%, and the 1-parameter and ∞-parameter confidence levels are taken as 0.9 and 0.9. The uncertainty degree indicates the number of time periods in which the uncertainty parameter obtains the maximum value of the uncertainty interval within 24 time periods in a dispatch cycle, and when the uncertainty degree is taken as 0, the system is a deterministic scheduling model. Within a scheduling cycle, uncertainties of 0, 6, 12, and 18 were selected to compare and analyze the adjustment parameters of photovoltaics, wind power output, and load-response uncertainties. The results are shown in Table 2.
As can be seen from Table 2, the total system cost increases by 2120.4 DKK, 1673.7 DKK, and 994.5 DKK when the uncertainty increases sequentially from 0 to 18; this is due to the fact that the system needs to sacrifice more economics to ensure the system robustness; and the change in the total cost becomes progressively smaller because the total cost gradually becomes saturated as the uncertainty changes.
With increasing uncertainty, the OCC-VPP system relies more on natural gas, raising its associated costs. Simultaneously, reduced wind and PV output limits renewable-based hydrogen production, lowering utilization rates and increasing curtailment costs. A comparison of purchased gas costs and wind curtailment costs shows that gas costs have a greater impact on the system, as natural gas is primarily used for heat supply and the resulting energy deficit significantly affects total costs. In contrast, the system’s electric and hydrogen storage equipment enhances operational flexibility, maintaining a high renewable utilization rate. Consequently, curtailment costs remain relatively stable even under more severe renewable energy output fluctuations.

5.3.2. Impact of Probabilistic Uncertainty in Source–Load Scenarios

The scenarios in this paper are mainly constrained by the integrated paradigm composed of 1-parameter and ∞-parameter. Setting the uncertainty as 12 h and the prediction error as 10%, the confidence levels corresponding to the 1-paradigm and ∞-paradigm are taken as 0.7, 0.8, and 0.9, respectively, and the impacts of different confidence levels on the results of the VPP optimization operation are shown in Table 3.
From Table 3, it can be seen that the confidence level increases from 0.7 to 0.8, the total cost of operation increases by 1118.4 DKK; from 0.8 to 0.9, the cost increases by 651.8 DKK. This is because as the confidence level increases to close to 1, the impact of the confidence level on the cost is close to saturation, and its impact on the cost gradually becomes smaller. The wind power output gradually decreases as the confidence level increases, i.e., as the confidence level becomes larger, the wind power output becomes more conservative.

5.4. Low-Carbon Analysis of VPP System

(1)
Influence of carbon-trading base price on low carbon performance
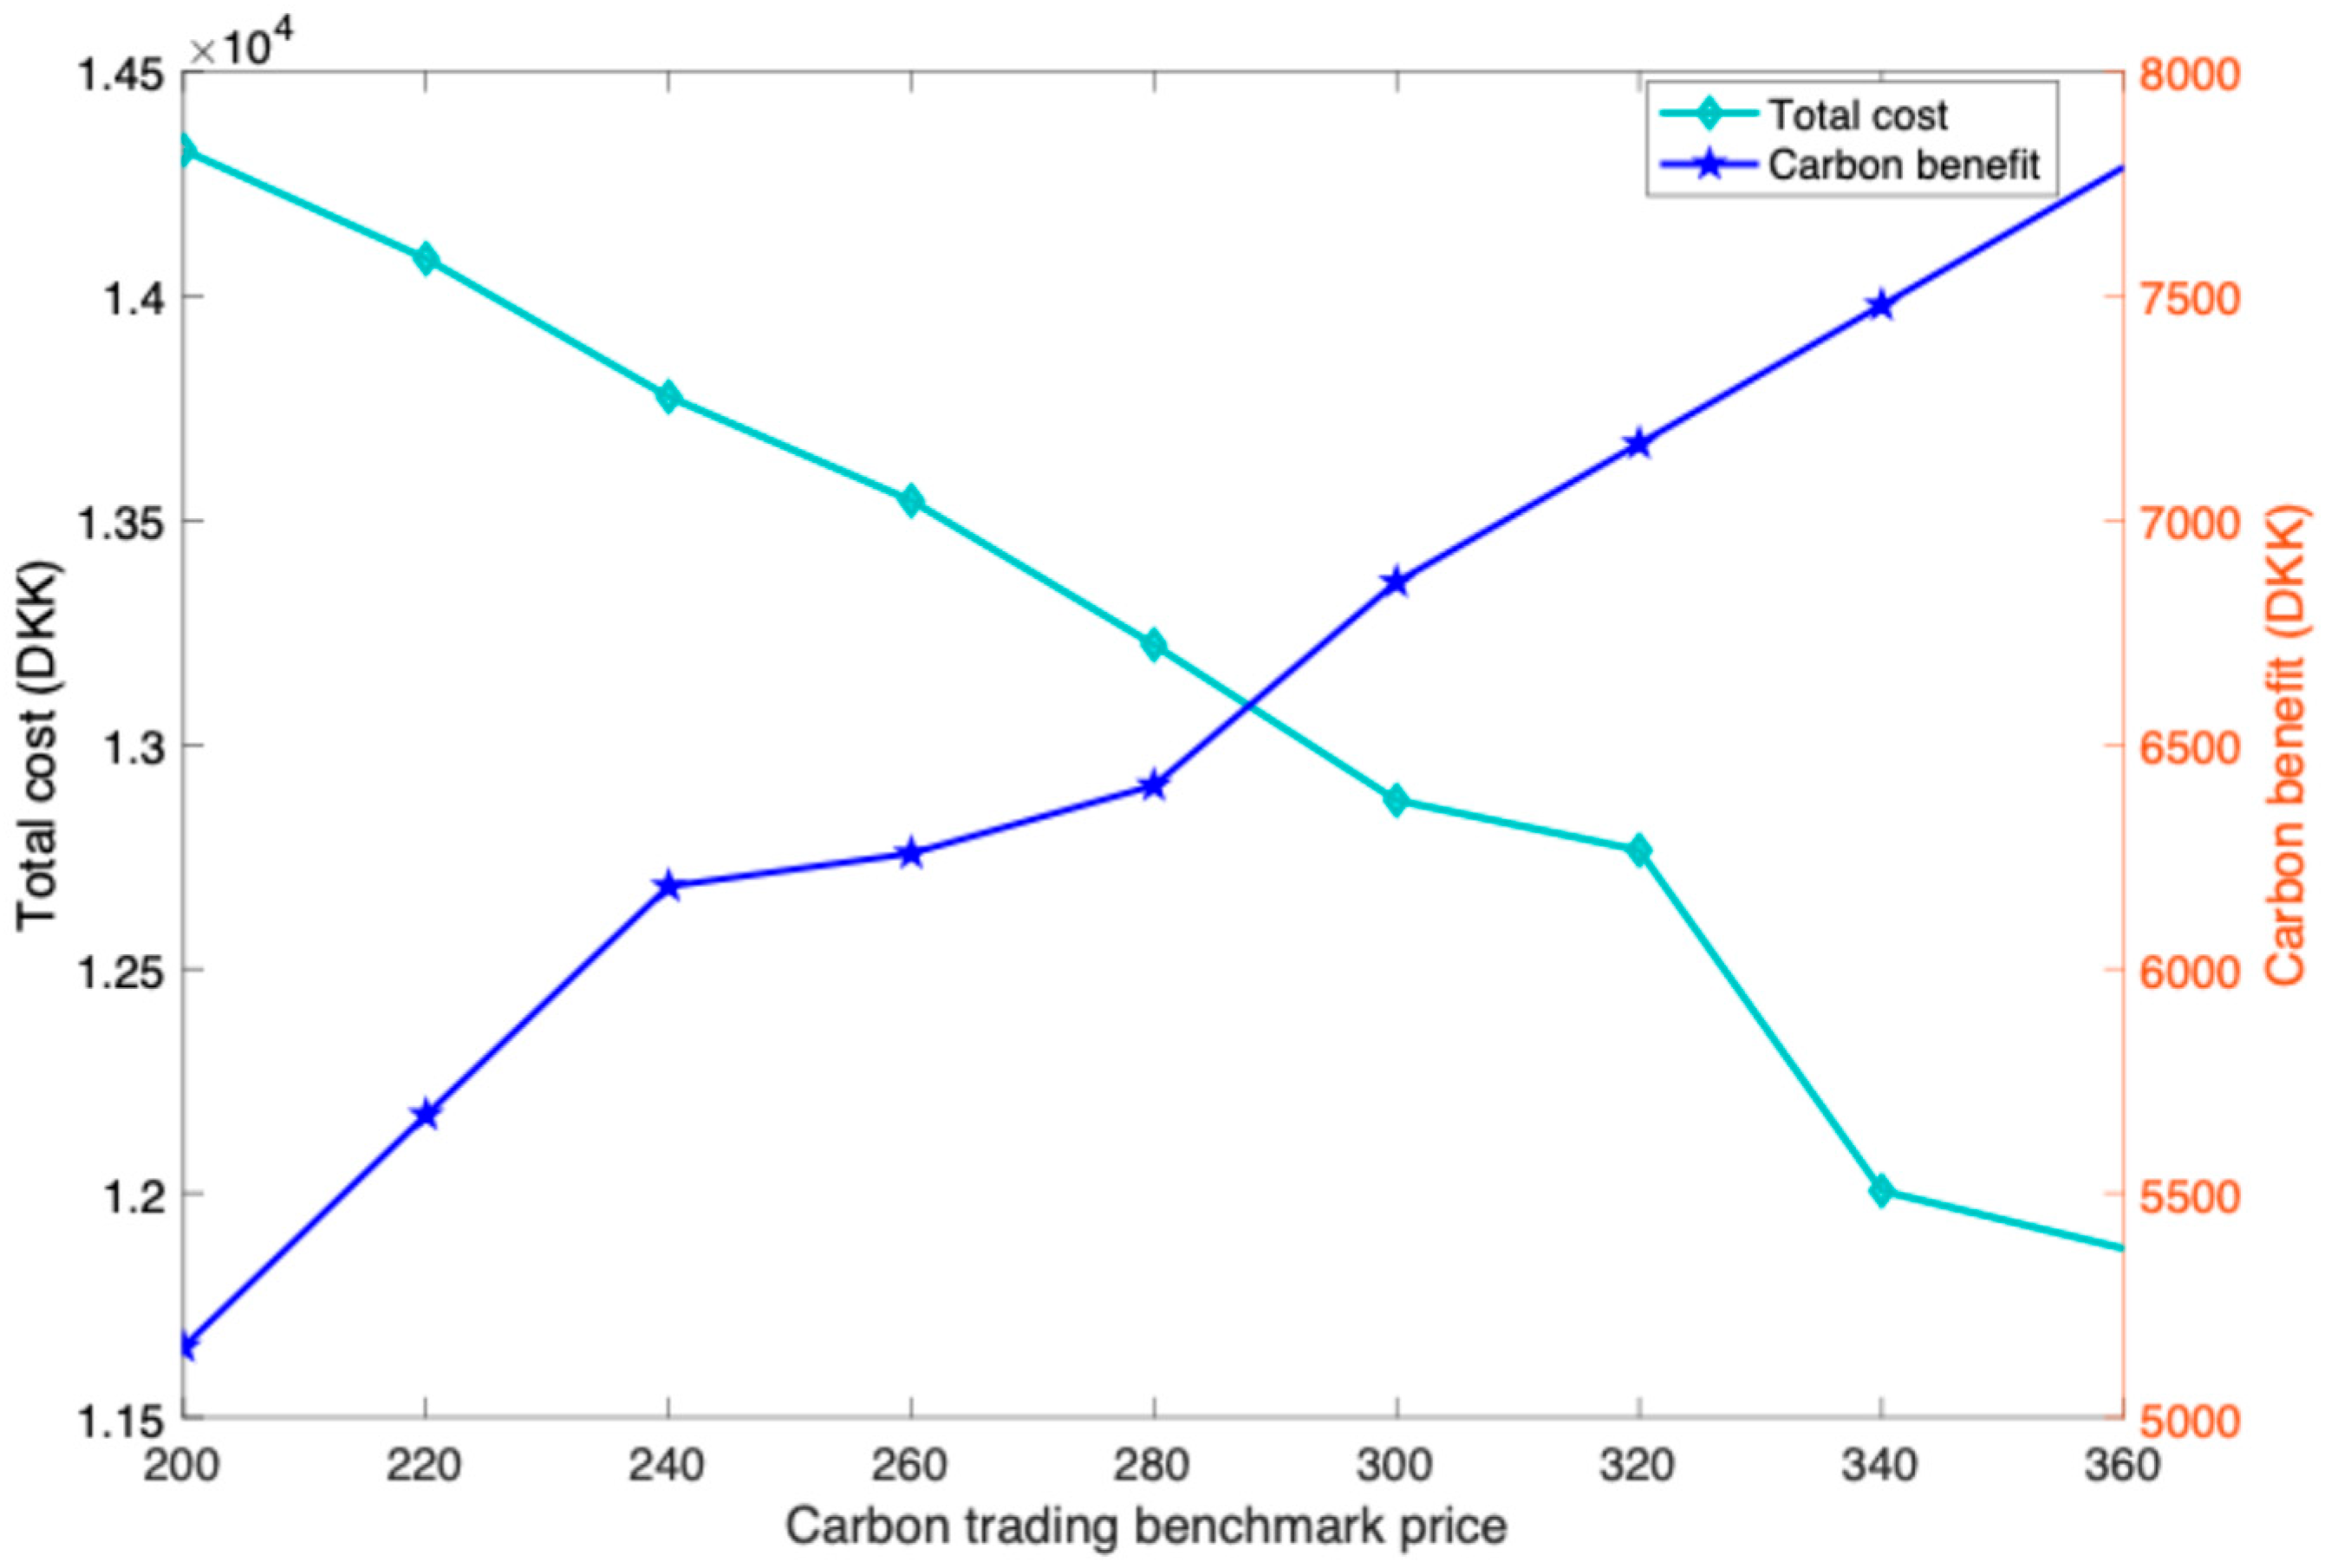
In order to further examine the relationship between the carbon-trading base price and the total system cost, this paper analyzes the change curve graph of the relationship between different carbon-trading base price and carbon-trading revenue and total system cost, as shown in Figure 9.
Figure 9 demonstrates a positive correlation between the system’s carbon-trading revenue and the increasing carbon-trading base price, while revealing an inverse relationship with total system cost. This dynamic arises because, within the stepped carbon-trading mechanism proposed in this model, the base price functions as a weighting coefficient. As the base price rises, the system is incentivized to enhance its renewable energy utilization rate to secure a larger free carbon-emission allowance, thereby increasing its revenue potential in the carbon market. However, beyond a threshold of 320 DKK/ton, the growth rate of carbon-trading revenue diminishes. This occurs because the system’s capacity to further absorb renewable energy nears saturation, limiting its ability to gain additional emission allowances. Consequently, the revenue contribution from carbon trading stabilizes. Simultaneously, escalating renewable energy penetration necessitates greater investment in storage units within the traction power-supply system to manage consumption and recovery. This increases hybrid energy-storage system costs, counteracting potential cost reductions and moderating the overall downward trend in total system expenses.
In summary, carbon-trading costs constitute a significant component of operating expenses within the proposed model. Strategically increasing the carbon-trading base price can effectively reduce the system’s total costs and enhance its overall economic efficiency.
(2)
The impact of different prediction errors on low carbon performance
The uncertainty is taken as 12 h, the confidence level is taken as 0.9, and the analysis of prediction error on low-carbon nature is shown in Table 4.
The source–load scenario gets worse as the uncertain parameters increase. The source-side wind power output becomes more and more conservative, while the increased demand on the load side requires more energy from the carbon capture unit, corresponding to more carbon emissions, carbon sequestration costs, and the amount of carbon involved in carbon trading increases, so the cost of stepped carbon trading increases.

5.5. Analysis of Model Impact on Optimization Results

(1)
Comparative analysis of different models
To validate the proposed method, this section compares it with alternative approaches, and the results are listed in Table 5. The TSRO model developed in this study is solved using a parallelizable C&CG algorithm and a mixed ambiguity set (Equations (39) and (40)) for numerical examples. The stochastic optimization (SO) method generates 1000 source–load uncertainty scenarios via Latin hypercube sampling, reduces them to 10 scenarios using K-means clustering, and solves a two-stage optimization model. The traditional robust optimization (RO) approach applies a box uncertainty set to estimate source–load bilateral prediction bias without probabilistic scenarios. The Wasserstein distributionally robust optimization (Wasserstein-DRO) method employs Wasserstein metrics to construct an ambiguity set of prediction errors for supply–demand matching, which is then linearized and solved following the procedure in Ref. [37].
The solver and hardware configuration are provided in Section 5.1. For all models, the convergence tolerance is set to ≤0.01 with a maximum iteration limit. Table 5 presents a comparison of model costs and solution times.
Although stochastic optimization has the lowest running cost, its solution requires all scenarios to be solved jointly, resulting in the longest solution time, and the TSRO model is 2561 s faster than SO, with a solution time that meets the day-ahead scheduling requirements. The traditional RO method is too conservative and has the highest cost. Comparatively, the TSRO proposed in this paper takes into account the VPP source–load output uncertainty as well as source–load scenario probabilistic uncertainty, and at the same time considers the impact of tariff uncertainty on the scheduling results, which is able to balance the relationship between VPP economics and robustness well.
The higher cost of the TSRO model compared to the SO model stems from its dual-layer protection: it accounts for probabilistic uncertainty through scenario-based DRO and deterministic uncertainty via polyhedral bounds on source–load fluctuations. While this enhances robustness, it increases operational costs by 7.1% relative to the SO model, which assumes perfect knowledge of probability distributions. In addition, SO ignores correlation between uncertainties (e.g., wind-load joint deviations), while TSRO conservatively models them via polyhedral sets (Equations (37) and (38)). This correlation handling adds the total cost but reduces load-shedding risk.
From the perspective of upper bound (UB) and lower bound (LB), the TSRO’s LB (14,318.7) remains 4.8% below RO’s UB (15,033.6), confirming genuine superiority. SO’s lower cost (13,477.1) reflects its risk neutrality but ignores distributional ambiguity (Section 5.5). The proposed TSRO optimization model achieves a 6.1% cost reduction over Wasserstein-DRO by jointly modeling source–load uncertainty. Its carbon-trading revenue (−5157.1 DKK) is closer to SO’s ideal value than RO’s, confirming its economic robustness.
(2)
Sensitivity analysis of boundary for model solving
Convergence accuracy and iteration times are key conditions in model solving, which can have an impact on the system’s operational results. In view of this, this section has added sensitivity analysis on convergence accuracy and iteration times. As shown in Table 6 and Table 7.
Table 6 shows that increasing the number of iterations from 15 to 30 improved the cost by only 0.03%, while significantly extending solution time. Similarly, tightening the convergence tolerance from 0.01 to 0.001 yielded a 0.05% cost improvement but markedly increased computation time (Table 7). This is primarily because the proposed approach reformulates the original model as a mixed-integer linear program using techniques such as the big-M method, thereby substantially enhancing solution efficiency.
The original settings ( δ ≤ 0.01, max iter = 15) strike a practical balance between computational efficiency and economic precision for day-ahead VPP scheduling. While tighter tolerances offer marginal theoretical improvements, their computational cost is unjustifiable in industrial applications.
(3)
Comparative analysis of carbon-pricing models
The European Union primarily adopts a unified carbon-pricing mechanism. To better incentivize emission reductions and advance the dual-carbon goals, this study introduces a tiered carbon-trading mechanism. Table 8 compares the two mechanisms.
Table 8 shows that replacing the stepped carbon-pricing mechanism with a unified pricing mechanism significantly affects system economics and equipment operation. Under the same uncertainty level (12 h), the total cost with unified pricing decreases to 13,894.1 DKK, 3.8% lower than with the stepped mechanism. This improvement mainly results from eliminating the punitive marginal cost in the stepped mechanism; the fixed carbon price encourages the OCC-VPP to prioritize high-efficiency units. Consequently, gas turbine utilization increases from 78% to 85%, fully leveraging their low-carbon characteristics in stable operation and promoting low-carbon system development. Moreover, in this paper, the carbon price mechanism is treated as an exogenous parameter; in practice, it can be adjusted according to carbon market policies without altering the OCC-VPP operational model.

6. Conclusions

Driven by the “dual-carbon” goal, VPP, as a key vehicle for integrating distributed energy resources, needs to balance low-carbon and flexibility. Aiming at the scheduling problems of high energy consumption and multiple uncertainties (source–load–price) superimposed on traditional carbon-capture technologies, this paper proposes a new OCC-VPP architecture by combining OCC and VPP, which realizes near-zero emission and energy efficiency improvement through the “electricity-oxygen-carbon” cycle. On this basis, a stepped carbon-trading mechanism is introduced to quantify the carbon-emission cost, scenario generation and polyhedral uncertainty sets are used to characterize the wind and light-load fluctuations, and a TSRO scheduling model is constructed to jointly deal with the uncertainty of the probability distribution of the source, loads, and the uncertainty of the boundary of the tariff fluctuations, and the applicability and validity of the model are verified through case simulation. The core innovation and research findings of this paper are as follows:
In terms of technological integration and innovation, OCC-VPP achieves deep carbon reduction and energy efficiency improvement through the “electricity-oxygen-carbon” cycle mechanism. OCC-VPP reduces the energy consumption of air-separation oxygen production by 19.7% through the electric–hydrogen–methanation cycle. In the path of hydrogen resource utilization, 52% directly supplies power and heat load and 41% participates in methane synthesis of natural gas, forming a closed-loop synergy of renewable energy hydrogen production, oxygen cycle, and CO2 resource utilization. Compared to traditional amine-based carbon-capture technologies such as CCS, the OCC-VPP design not only reduces system energy consumption, but also achieves cross-period oxygen and carbon scheduling through OS, providing a technological path for VPP that combines deep decarbonization and multi-energy complementarity. The calculation example shows that under the stepped carbon-trading mechanism (base price of 320 DKK/ton), the system’s carbon benefits tend to stabilize, but the carbon sequestration cost increases with the increase in prediction error (reaching 543.2 DKK at an error of 0.18).
In terms of uncertainty-modeling methods, this paper proposes a TSRO optimization framework to effectively coordinate the handling of multiple uncertainties in “source-load-electricity price”. In the first stage, Latin hypercube sampling and K-means clustering are used to generate 10 typical scene descriptions of wind, solar, and load probability distributions; in the second stage, polyhedral uncertain sets are introduced to characterize the boundary of source–load fluctuations, and the conservatism is controlled by adjusting parameters; in the third stage, the probability fuzzy set of the scene is constrained by the comprehensive norm to solve the problem of inaccurate probability distribution in stochastic optimization. This model significantly improves decision robustness. When the uncertainty increases from 0 to 18, the total cost rises by 45%, in which the increase in gas purchase cost is the largest, and the cost of energy abandonment only increases by 299.6 DKK, which highlights the flexible leveling effect of energy storage. A comparison of the models shows that the proposed model improves the solution speed by 70% compared with stochastic optimization, the cost is 4.7% lower than traditional robust optimization, and the robustness is still high at a confidence level of 0.9.
In terms of engineering application, the model proposed in this paper quantifies the impact of key parameters on system economy. Increasing the carbon-trading base price can effectively reduce total costs, but when it exceeds 320 yuan/ton, the growth of revenue slows down, reflecting that the potential for new energy consumption is approaching saturation. The increase in source and load prediction error will lead to an increase in carbon emissions and carbon sequestration costs, and the stepped carbon-trading mechanism buffers cost fluctuations through segmented pricing strategies. These findings provide replicable decision-making tools for low-carbon scheduling of high proportion new energy grids, especially for regional energy systems that need to balance policy compliance and operational flexibility.
However, there are still limitations in this study: first, physical constraints such as equipment failure and network blocking are not considered, and the computational efficiency of the model in larger-scale systems needs to be further verified; second, the design of the carbon-trading mechanism is based on fixed policy parameters, and market mechanisms such as green certificate trading are not dynamically coupled. Future work can explore the cooperative scheduling of multi-VPP clusters, optimize the uncertainty decision-making speed by combining deep reinforcement learning, and study the OCC-VPP scheduling strategy under the multi-market coupling mechanism of electricity–carbon–green certificate.

Author Contributions

Conceptualization, B.L. and J.W.; methodology, J.W.; software, J.W.; validation, J.W. and X.W.; formal analysis, X.W.; investigation, X.W.; resources, J.W.; data curation, X.W.; writing—original draft preparation, J.W.; writing—review and editing, J.W. and X.W.; visualization, B.L.; supervision, B.L.; project administration, B.L.; funding acquisition, B.L. All authors have read and agreed to the published version of the manuscript.

Funding

This research was funded by Beijing Natural Science Foundation (9254037).

Institutional Review Board Statement

Not applicable.

Informed Consent Statement

Not applicable.

Data Availability Statement

The raw data supporting the conclusions of this article will be made available by the authors on request.

Acknowledgments

During the preparation of this manuscript/study, the author(s) used MATLAB 2018b for the purposes of analysis. The authors have reviewed and edited the output and take full responsibility for the content of this publication.

Conflicts of Interest

The authors declare no conflicts of interest.

References

  1. Lei, X.; Zhong, J.; Chen, Y.; Shao, Z.; Jian, L. Grid integration of electric vehicles within electricity and carbon markets: A comprehensive overview. eTransportation 2025, 25, 100435. [Google Scholar] [CrossRef]
  2. Wang, K.; Cheng, B.; Ren, Y.; Wang, S.; Ji, R.; Kong, X. Flexible resource dynamic aggregation regulation method of virtual power plant to ensure more renewable energy generation. Process Saf. Environ. Prot. 2023, 180, 339–350. [Google Scholar] [CrossRef]
  3. Luján, J.M.; Arnau, F.J.; Piqueras, P.; Farias, V.H. Design of a carbon capture system for oxy-fuel combustion in compression ignition engines with exhaust water recirculation. Energy Convers. Manag. 2023, 284, 116979. [Google Scholar] [CrossRef]
  4. Chu, X.; Fu, L.; Liu, Q.; Yu, S. Optimal allocation method of oxygen enriched combustion-carbon capture low-carbon integrated energy system considering uncertainty of carbon-source-load. Int. J. Electr. Power Energy Syst. 2024, 162, 110220. [Google Scholar] [CrossRef]
  5. Cao, W.; Yu, J.; Xu, M. Optimization scheduling of virtual power plants considering source-load coordinated operation and wind–solar uncertainty. Processes 2023, 12, 11. [Google Scholar] [CrossRef]
  6. Liu, J.; Hu, H.; Yu, S.S.; Trinh, H. Virtual power plant with renewable energy sources and energy storage systems for sustainable power grid-formation, control techniques and demand response. Energies 2023, 16, 3705. [Google Scholar] [CrossRef]
  7. Heredia, F.J.; Cuadrado, M.D.; Corchero, C. On optimal participation in the electricity markets of wind power plants with battery energy storage systems. Comput. Oper. Res. 2018, 96, 316–329. [Google Scholar] [CrossRef]
  8. Abdullah, W.S.W.; Osman, M.; Ab Kadir, M.Z.A.; Verayiah, R.; Ab Aziz, N.F.; Rasheed, M.A. Techno-economics analysis of battery energy storage system (BESS) design for virtual power plant (VPP)–A case study in Malaysia. J. Energy Storage 2021, 38, 102568. [Google Scholar] [CrossRef]
  9. Dadashi, M.; Zare, K.; Seyedi, H.; Shafie-khah, M. Coordination of wind power producers with an energy storage system for the optimal participation in wholesale electricity markets. Int. J. Electr. Power Energy Syst. 2022, 136, 107672. [Google Scholar] [CrossRef]
  10. Morcilla, R.V.; Enano, N.H., Jr. Sizing of community centralized battery energy storage system and aggregated residential solar PV system as virtual power plant to support electrical distribution network reliability improvement. Renew. Energy Focus 2023, 46, 27–38. [Google Scholar] [CrossRef]
  11. Rodrigues, L.; Soares, T.; Rezende, I.; Fontoura, J.; Miranda, V. Virtual power plant optimal dispatch considering power-to-hydrogen systems. Int. J. Hydrogen Energy 2024, 68, 1019–1032. [Google Scholar] [CrossRef]
  12. Yang, Q.; Wang, H.; Wang, T.; Zhang, S.; Wu, X.; Wang, H. Blockchain-based decentralized energy management platform for residential distributed energy resources in a virtual power plant. Appl. Energy 2021, 294, 117026. [Google Scholar] [CrossRef]
  13. Cheng, Y.; Zhang, S.; Zhang, Y.; Yu, H.; Xie, J. Robust optimization of CCS P2G virtual power plants considering penalized carbon prices in price sensitive intervals. J. Electr. Power Sci. Technol. 2025, 39, 251–259. [Google Scholar]
  14. Jin, X.; Yin, J.; Yang, G.; Li, W.; Wang, G.; Wang, L.; Yang, N.; Zhou, X. Optimal Scheduling of virtual power plant with coupled operation of CCS-P2G considering wind and photovoltaic uncertainty. J. Syst. Simul. 2025, 37, 1129. [Google Scholar]
  15. Ju, L.; Zhou, Q.; Pan, M.; Wei, W.; Wang, Y.; Sun, J.; Pan, Y. Robust optimal dispatching model and a benefit allocation strategy for rural novel virtual power plants incorporating biomass waste energy conversion and carbon cycle utilization. Front. Energy Res. 2023, 11, 1181310. [Google Scholar] [CrossRef]
  16. Lin, X.; Lin, X.; Zhong, W.; Zhou, Y. Predictive operation optimization of multi-energy virtual power plant considering behavior uncertainty of diverse stakeholders. Energy 2023, 280, 128130. [Google Scholar] [CrossRef]
  17. He, J.; Mao, Z.; Huang, W.; Zhang, B.; Xiao, J.; Zhang, Z.; Liu, X. Low-carbon economic dispatch of virtual power plants considering the combined operation of oxygen-enriched combustion and power-to-ammonia. Sustainability 2024, 16, 4026. [Google Scholar] [CrossRef]
  18. Huang, D.; Tao, Y.; Zhang, W.; Hu, A.; Sun, J.; Sun, Y. Low carbon economic scheduling for virtual power plants considering proton exchange membrane electrolyzers for oxygen enriched combustion and waste heat utilization. J. Electr. Power Sci. Technol. 2025, 40, 196–205. [Google Scholar]
  19. Huang, C.; Yue, D.; Xie, J.; Li, Y.; Wang, K. Economic dispatch of power systems with virtual power plant based interval optimization method. CSEE J. Power Energy Syst. 2016, 2, 74–80. [Google Scholar] [CrossRef]
  20. Zhu, J.; Duan, P.; Liu, M.; Xia, Y.; Guo, Y.; Mo, X. Bi-level real-time economic dispatch of VPP considering uncertainty. IEEE Access 2019, 7, 15282–15291. [Google Scholar] [CrossRef]
  21. Park, S.Y.; Park, S.W.; Son, S.Y. Optimal VPP operation considering network constraint uncertainty of DSO. IEEE Access 2023, 11, 8523–8530. [Google Scholar] [CrossRef]
  22. Michael, N.E.; Hasan, S.; Al-Durra, A.; Mishra, M. Economic scheduling of virtual power plant in day-ahead and real-time markets considering uncertainties in electrical parameters. Energy Rep. 2023, 9, 3837–3850. [Google Scholar] [CrossRef]
  23. Hou, L.; Yi, Z.; Xu, Y.; Wu, Y.; Qie, Z.; Zhou, Z.; Leng, Z.; Han, L.; Feng, T. Robust economic dispatch approach for the multi-energy virtual power plant considering multiple uncertainties. IEEE Trans. Ind. Appl. 2025, 61, 5338–5349. [Google Scholar] [CrossRef]
  24. Liu, Z.; Zheng, W.; Qi, F.; Wang, L.; Zou, B.; Wen, F.; Xue, Y. Optimal dispatch of a virtual power plant considering demand response and carbon trading. Energies 2018, 11, 1488. [Google Scholar] [CrossRef]
  25. Liu, X. Research on optimal dispatch method of virtual power plant considering various energy complementary and energy low carbonization. Int. J. Electr. Power Energy Syst. 2022, 136, 107670. [Google Scholar] [CrossRef]
  26. Zhang, L.; Liu, D.; Cai, G.; Lyu, L.; Koh, L.H.; Wang, T. An optimal dispatch model for virtual power plant that incorporates carbon trading and green certificate trading. Int. J. Electr. Power Energy Syst. 2023, 144, 108558. [Google Scholar] [CrossRef]
  27. Li, J.; Huang, M.; Qu, D.; Liu, Q. Low carbon economic dispatch for virtual power plant considering energy storage. Int. J. Green Energy 2024, 22, 1915–1931. [Google Scholar] [CrossRef]
  28. Xie, T.; Wang, Q.; Zhang, G.; Zhang, K.; Li, H. Low-carbon economic dispatch of virtual power plant considering hydrogen energy storage and tiered carbon trading in multiple scenarios. Processes 2023, 12, 90. [Google Scholar] [CrossRef]
  29. Zhou, J.; Huang, D.; Ma, X.; Hu, W. Operation strategy of multi-virtual power plants participating in joint electricity–carbon market based on carbon emission theory. Energies 2025, 18, 2820. [Google Scholar] [CrossRef]
  30. Kong, X.; Xiao, J.; Liu, D.; Wu, J.; Wang, C.; Shen, Y. Robust stochastic optimal dispatching method of multi-energy virtual power plant considering multiple uncertainties. Appl. Energy 2020, 279, 115707. [Google Scholar] [CrossRef]
  31. Tan, Z.; Fan, W.; Li, H.; De, G.; Ma, J.; Yang, S.; Ju, L.; Tan, Q. Dispatching optimization model of gas-electricity virtual power plant considering uncertainty based on robust stochastic optimization theory. J. Clean. Prod. 2020, 247, 119106. [Google Scholar] [CrossRef]
  32. Li, Q.; Wei, F.; Zhou, Y.; Li, J.; Zhou, G.; Wang, Z.; Liu, J.; Yan, P.; Yu, D. A scheduling framework for VPP considering multiple uncertainties and flexible resources. Energy 2023, 282, 128385. [Google Scholar] [CrossRef]
  33. Gulotta, F.; Del Granado, P.C.; Pisciella, P.; Siface, D.; Falabretti, D. Short-term uncertainty in the dispatch of energy resources for VPP: A novel rolling horizon model based on stochastic programming. Int. J. Electr. Power Energy Syst. 2023, 153, 109355. [Google Scholar] [CrossRef]
  34. Jin, W.; Wang, P.; Yuan, J. Key role and optimization dispatch research of technical virtual power plants in the new energy era. Energies 2024, 17, 5796. [Google Scholar] [CrossRef]
  35. Naughton, J.; Wang, H.; Cantoni, M.; Mancarella, P. Co-optimizing virtual power plant services under uncertainty: A robust scheduling and receding horizon dispatch approach. IEEE Trans. Power Syst. 2021, 36, 3960–3972. [Google Scholar] [CrossRef]
  36. Chen, Y.; Niu, Y.; Du, M.; Wang, J. A two-stage robust optimization model for a virtual power plant considering responsiveness-based electric vehicle aggregation. J. Clean. Prod. 2023, 405, 136690. [Google Scholar] [CrossRef]
  37. Liu, H.; Qiu, J.; Zhao, J. A data-driven scheduling model of virtual power plant using Wasserstein distributionally robust optimization. Int. J. Electr. Power Energy Syst. 2022, 137, 107801. [Google Scholar] [CrossRef]
  38. Esfahani, M.; Alizadeh, A.; Amjady, N.; Kamwa, I. A distributed VPP-integrated co-optimization framework for energy scheduling, frequency regulation, and voltage support using data-driven distributionally robust optimization with Wasserstein metric. Appl. Energy 2024, 361, 122883. [Google Scholar] [CrossRef]
  39. Huang, Q.; Yao, J.; Hu, Y.; Liu, S.; Li, H.; Sun, Q. Integrating compressed CO2 energy storage in an oxy-coal combustion power plant with CO2 capture. Energy 2022, 254, 124493. [Google Scholar] [CrossRef]
  40. Yun, Y.; Zhang, D.; Wang, X.; Ni, P.; He, J. Low-carbon operational optimization of integrated electricity-heat-gas energy system considering concentrating solar power plant and oxygen-enriched combustion capture technology. Trans. China Electrotech. Soc. 2023, 38, 6709–6726. [Google Scholar]
  41. Khallaghi, N.; Hanak, D.P.; Manovic, V. Staged oxy-fuel natural gas combined cycle. Appl. Therm. Eng. 2019, 153, 761–767. [Google Scholar] [CrossRef]
  42. Liu, Y.; Hu, Z.; Chen, J.; Weng, C.; Gao, M.; Liu, S. Low-carbon economic dispatch of integrated energy system considering carbon capture power plant and multi-utilization of hydrogen energy. Autom. Electr. Power Syst. 2024, 48, 31–40. [Google Scholar]
  43. Bao, G.; Zhang, Y.; Peng, X.; Zhu, C. Optimal dispatching of virtual power plant considering information gap decision theory and oxy-fuel combustion carbon capture technology. Electr. Meas. Instrum. 2025, 1–12. [Google Scholar]
  44. Gao, D.; Chen, H.; Yang, J.; Gu, J. Influence factor analysis of circulating fluidized bed boiler oxy-fuel combustion and CO2 capture power generation unit operation energy consumption. Proc. CSEE 2019, 39, 1387–1397. [Google Scholar]
  45. Zheng, K.; Zhao, C.; Wang, F. Optimal scheduling of integrated energy system considering power to gas and carbon capture system. Energy Sources Part A Recovery Util. Environ. Eff. 2025, 47, 9944–9965. [Google Scholar] [CrossRef]
  46. Wang, S.; Wu, S.; Tang, B.; Liu, L.; Cheng, L. Generation method of wind power and photovoltaic output scenarios based on LHS-GRU. Sustain. Energy Grids Netw. 2025, 41, 101602. [Google Scholar] [CrossRef]
  47. Jiao, J.; He, P.; Zhang, Y.; Zhang, J.; Long, Z.; Liu, H. Flexible resource allocation optimization model considering global K-means load clustering and renewable-energy consumption. Clean Energy 2024, 8, 129–143. [Google Scholar] [CrossRef]
  48. El-Meligy, M.A.; El-Sherbeeny, A.M.; Soliman, A.T.A.; Abd Elgawad, A.E.; Naser, E.A. On the solution of robust transmission expansion planning using duality theorem under polyhedral uncertainty set. Electr. Power Syst. Res. 2022, 206, 107785. [Google Scholar] [CrossRef]
  49. Zhou, Q.; Zhang, J.; Gao, P.; Zhang, R.; Liu, L.; Wang, S.; Cheng, L.; Wang, W.; Yang, S. Two-stage robust optimization for prosumers considering uncertainties from sustainable energy of wind power generation and load demand based on nested C&CG algorithm. Sustainability 2023, 15, 9769. [Google Scholar]
  50. Kleinert, T.; Labbé, M.; Plein, F.; Schmidt, M. There’s no free lunch: On the hardness of choosing a correct big-M in bi-level optimization. Oper. Res. 2020, 68, 1716–1721. [Google Scholar] [CrossRef]
Figure 1. OCC-VPP system structure.
Sustainability 17 07354 g001
Figure 2. Diagram of C&CG algorithm.
Sustainability 17 07354 g002
Figure 3. Wind and PV output.
Sustainability 17 07354 g003
Figure 4. VPP load and market price of electricity.
Sustainability 17 07354 g004
Figure 5. Electricity scheduling results.
Sustainability 17 07354 g005
Figure 6. Thermal energy-scheduling results.
Sustainability 17 07354 g006
Figure 7. Oxygen flow curve.
Sustainability 17 07354 g007
Figure 8. Hydrogen flow curve.
Sustainability 17 07354 g008
Figure 9. Carbon-trading revenue and total cost change.
Sustainability 17 07354 g009
Table 1. Relevant parameters for VPP system.
ParametersValueParametersValue
E m i n M T 600 kW E m a x M T 2500 kW
E u p M T 300 kW E d o w n M T −300 kW
ε m a x M T 2.07 ε m i n M T 0.48
P d o w n C P U −100 kW P u p C P U 100 kW
η t C P U 0.85 P r a t e E L 2000 kW
P u p E L 200 kW P d o w n E L −200 kW
H H V 142 MJ/kg η F C 0.86
P u p F C , H 2 100 kW P d o w n F C , H 2 −100 kW
P m a x F C , H 2 800 kW P m i n F C , H 2 200 kW
ε m a x F C 1.6 ε m i n F C 0.58
S m a x H E S 1000 kW S m a x E E S 800 kW
S m a x T E S 700 kW S m a x O E S 3000 m2
η c h 0.9 η d i s 0.9
P m a x M R 500 kW P m i n M R 100 kW
P u p M R 100 kW P d o w n M R −100 kW
α C P U 0.4 kwh · m 3 α A S U 0.4 kwh · kg 1
π t C H 4 3.14 DKK/m3
Table 2. Low-carbon analysis under different prediction errors.
Uncertainty DegreeTotal Cost/DKKPurchased Gas Cost/DKKPurchased Electricity Cost/DKKCost of Energy Disposal/DKK
010,643.54044.53086.60
612,763.94850.33701.5121.4
1214,437.65443.64154.3263.5
1815,432.15864.24475.3299.6
Table 3. Effect of different confidence levels on VPP operation.
Confidence LevelTotal Cost/DKKWind Power Output/kWPV Output/kW
0.712,667.49103.64912.1
0.813,785.88976.14775.4
0.914,437.68854.44672.3
Table 4. Analysis of low-carbon performance with different prediction errors.
Prediction ErrorTotal Carbon Emission/kgCarbon Sequestration Cost/DKKCarbon-Trading Cost/DKK
0.093438.1289.3−5157.1
0.123511.4409.4−5267.1
0.153643.2476.2−5464.8
0.183744.1543.2−5616.2
Table 5. Comparison results of different models.
ModelCost/DKKCarbon-Trading Cost/DKKUB/DKKLB/DKKSolution Time/s
TSRO14,437.6−5157.114,437.614,318.71202
SO13,477.1−4892.313,477.113,477.13763
Traditional RO15,033.6−5864.715,033.615,027.9876
Wasserstein-DRO14,901.2−5210.514,901.214,901.21892
Table 6. Sensitivity analysis of iteration numbers.
Maximum Number of IterationsCost/DKK Δ Cost/DKKSolution Time/s
1014,483.91.11%674
1514,325.3-1143
3014,321.1−0.03%4832
Table 7. Sensitivity analysis of convergence accuracy.
Convergence AccuracyCost/DKK Δ Cost/DKKSolution Time/s
0.114,743.12.92%362
0.0114,325.3-1143
0.00114,317.7−0.05%4783
Table 8. Comparative analysis of carbon-pricing mechanisms.
Price MechanismCost/DKKCarbon Cost/DKKGas Turbine Utilization/%
Stepped pricing (In this paper)14,437.6−5157.178%
Unified pricing mechanism13,894.1−4629.385%
Disclaimer/Publisher’s Note: The statements, opinions and data contained in all publications are solely those of the individual author(s) and contributor(s) and not of MDPI and/or the editor(s). MDPI and/or the editor(s) disclaim responsibility for any injury to people or property resulting from any ideas, methods, instructions or products referred to in the content.