Remote Sensing-Based Assessment of Eco-Environmental Quality Dynamics and Driving Forces in the Anhui Section of the Yangtze-to-Huaihe Water Diversion Project (2015–2024)
Abstract
1. Introduction
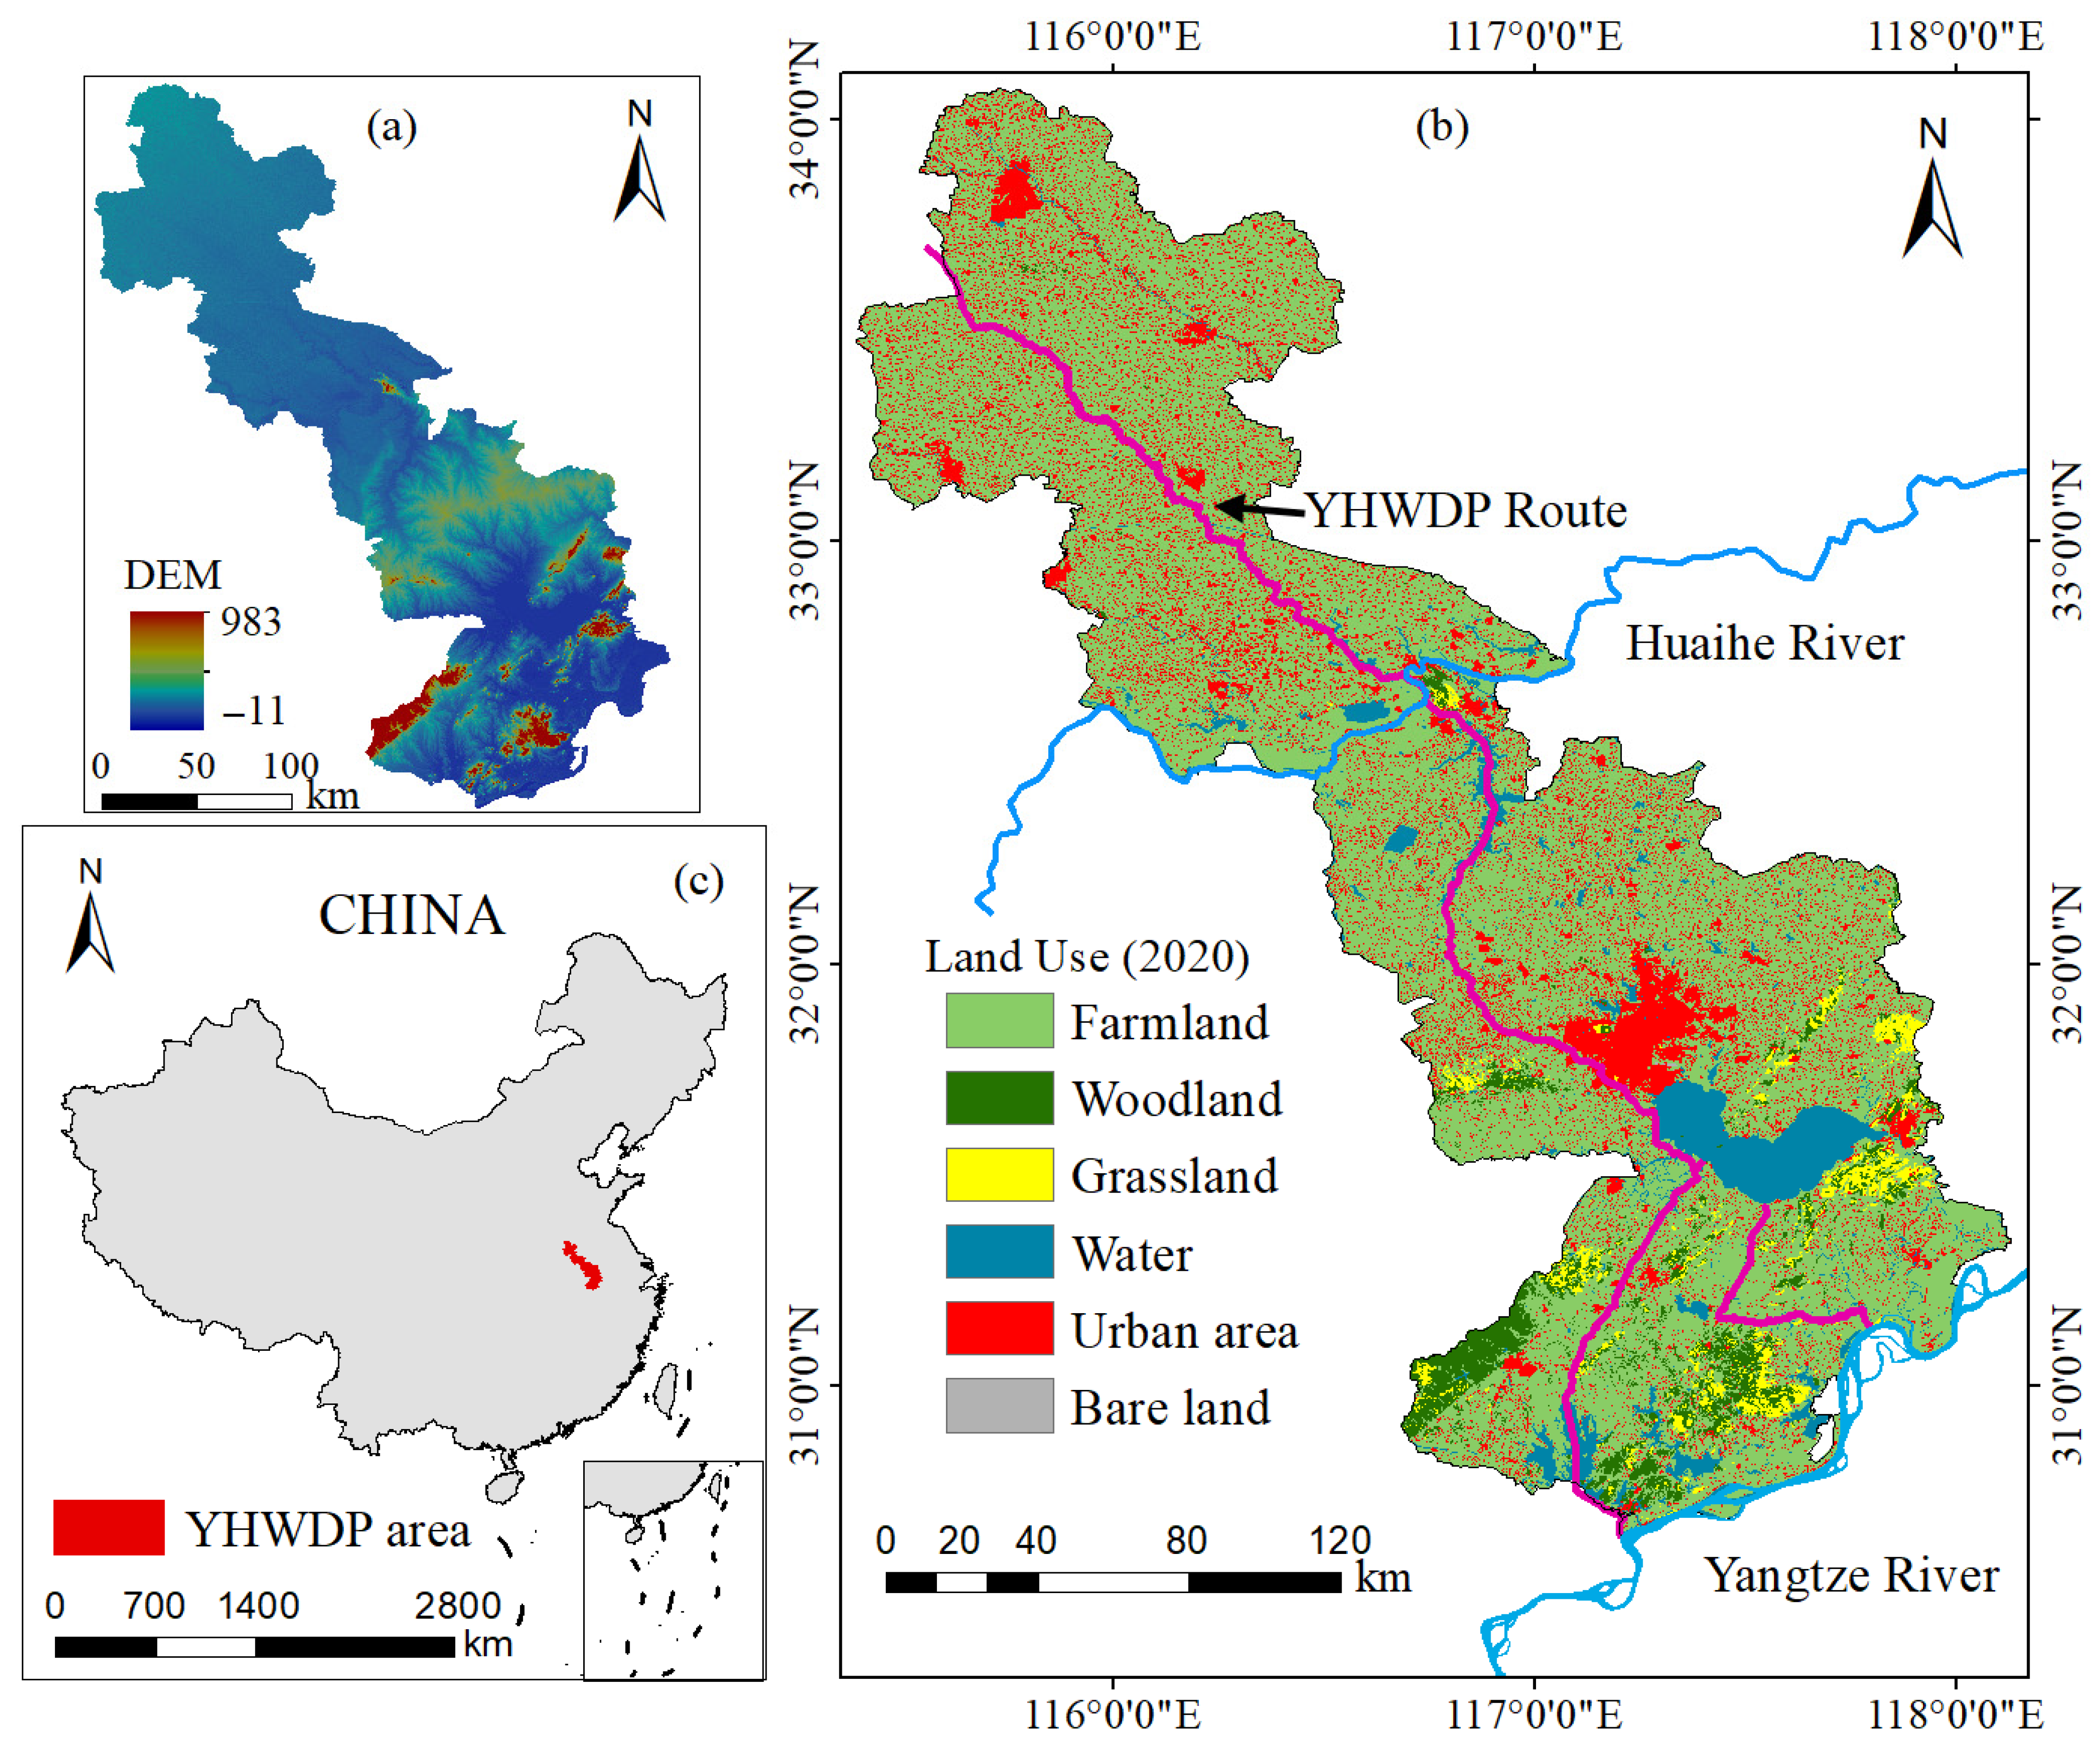
2. Study Area and Datasets
2.1. Study Area
2.2. Datasets
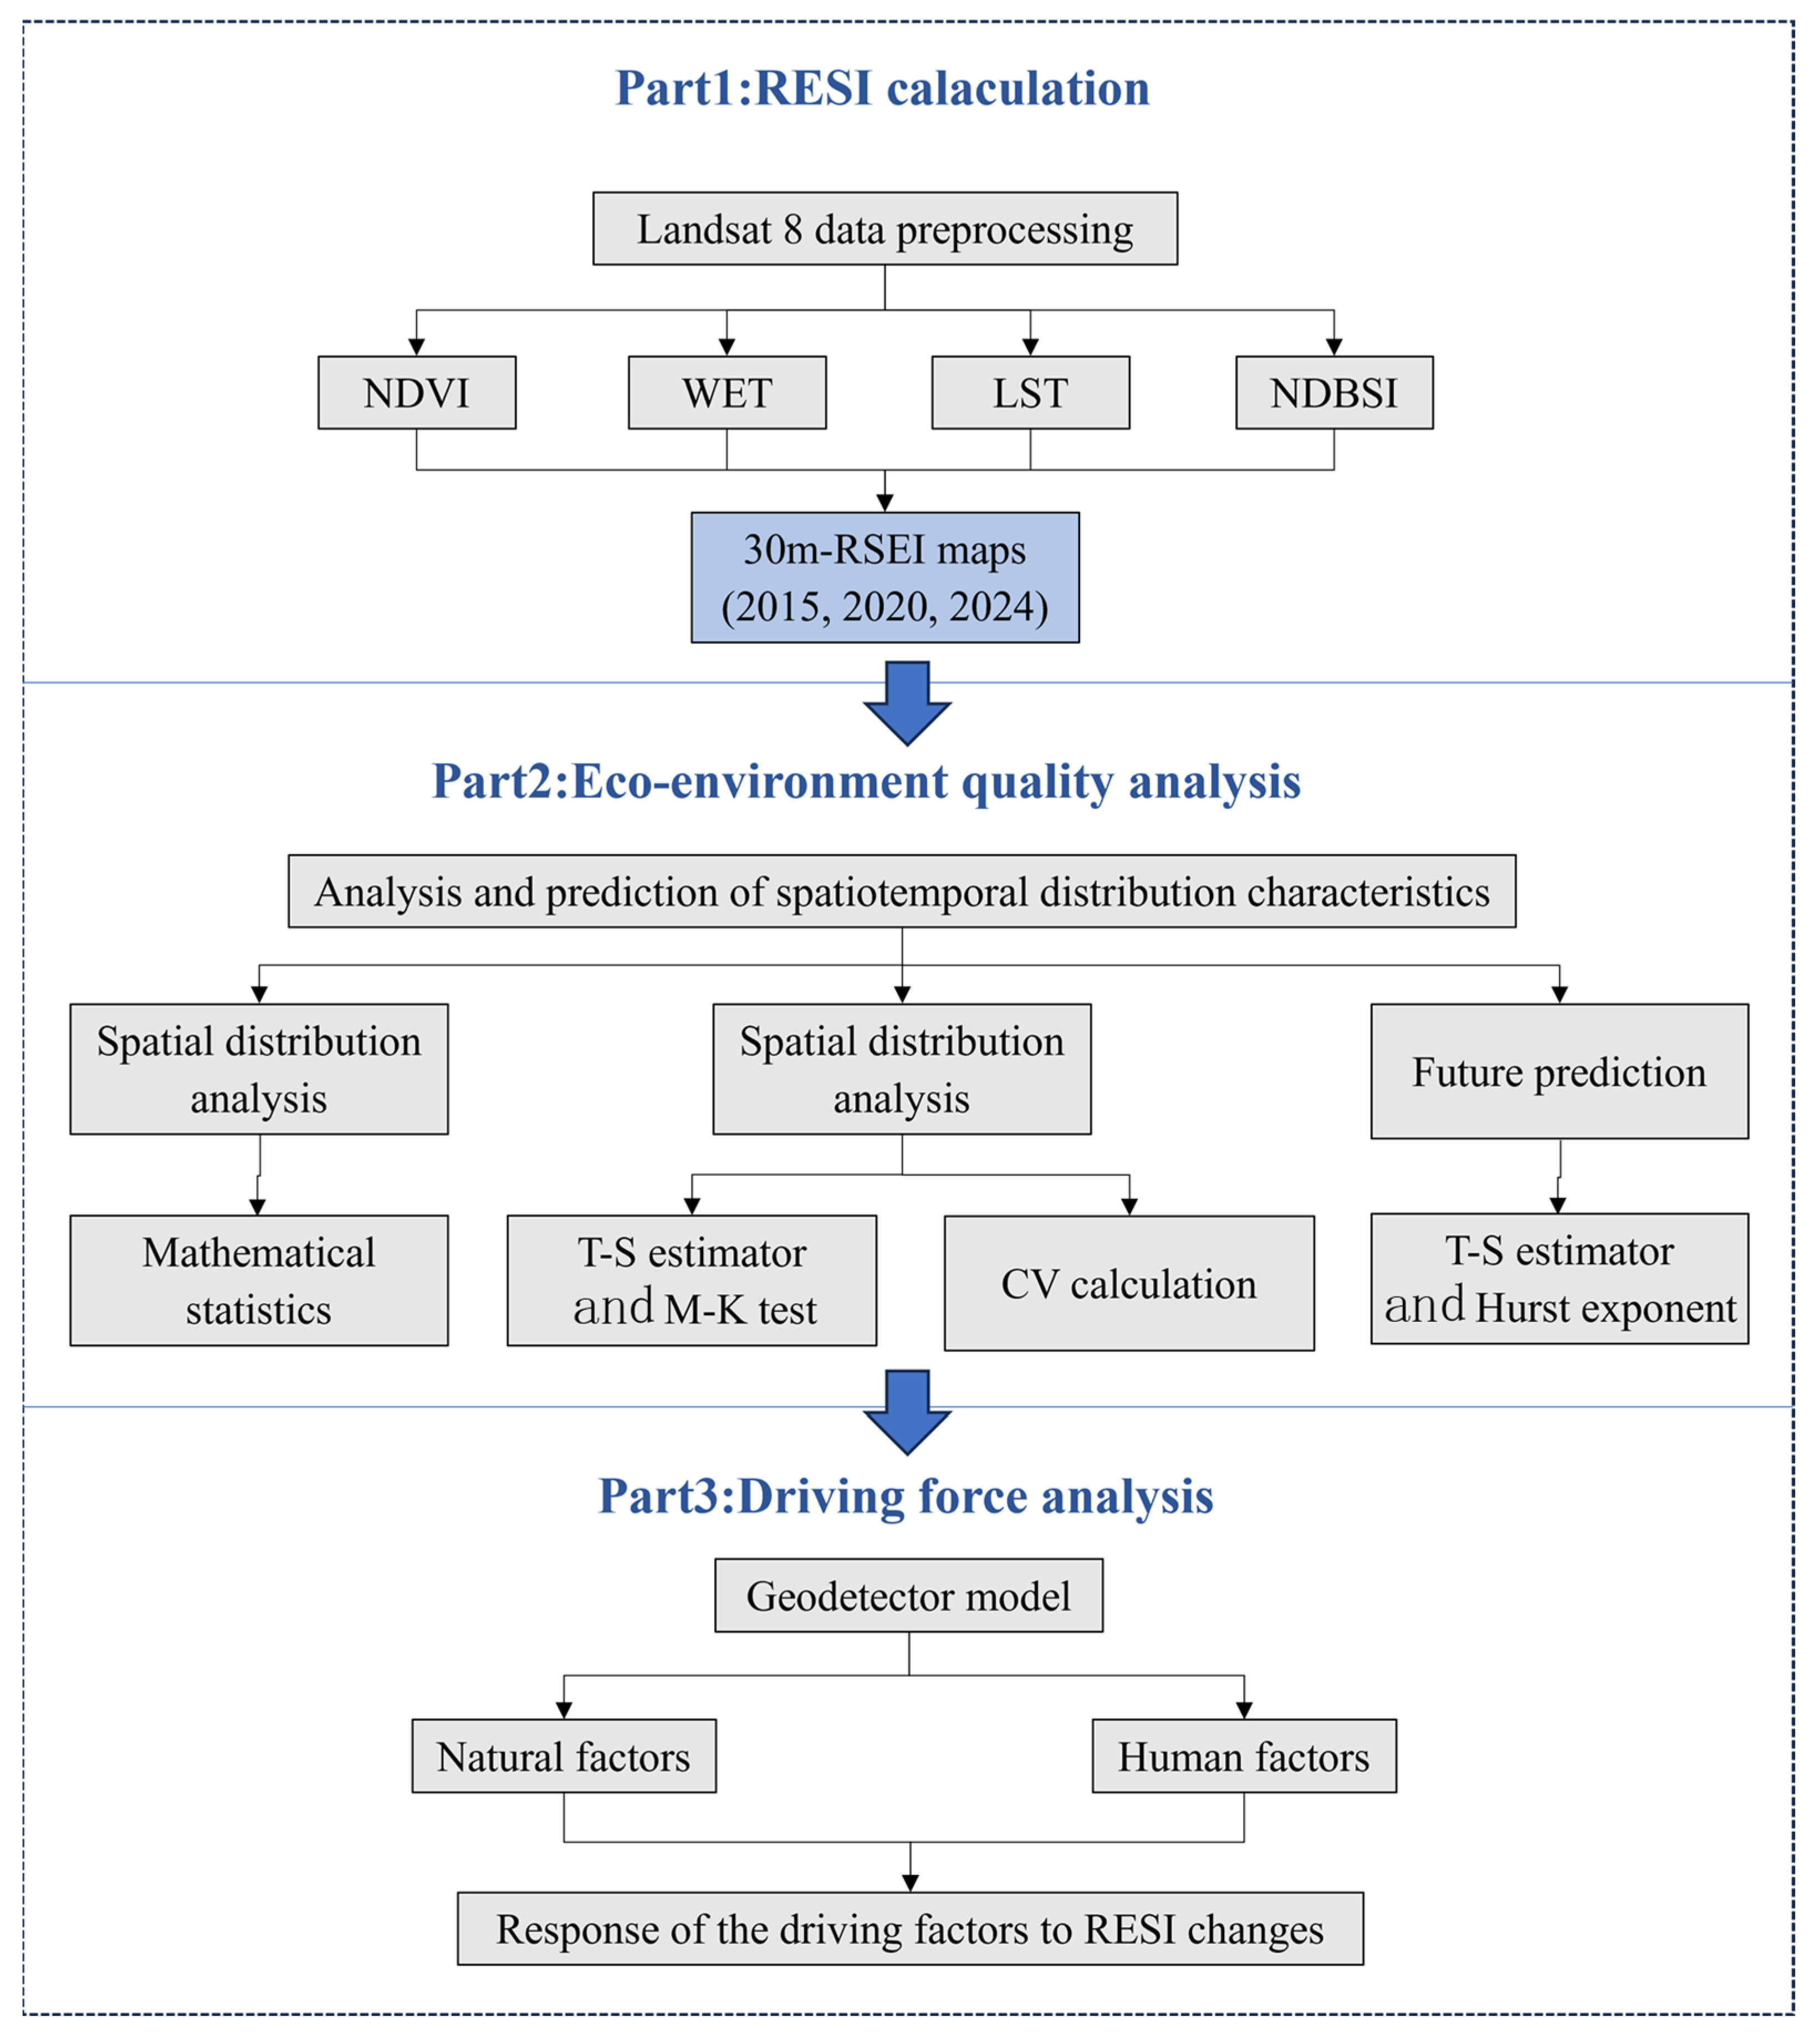
3. Methods
3.1. RSEI Model
- (1)
- Retrieval of vegetation
- (2)
- Retrieval of land surface moisture
- (3)
- Retrieval of land surface moisture
- (4)
- Retrieval of land surface temperature
- (5)
- Acquisition of RSEI
3.2. Combined T–S Estimator with M–K Test
3.3. Coefficient of Variation (CV)
3.4. Hurst Exponent
3.5. Quantitative Analysis Methods for Geospatial Differentiation
4. Results
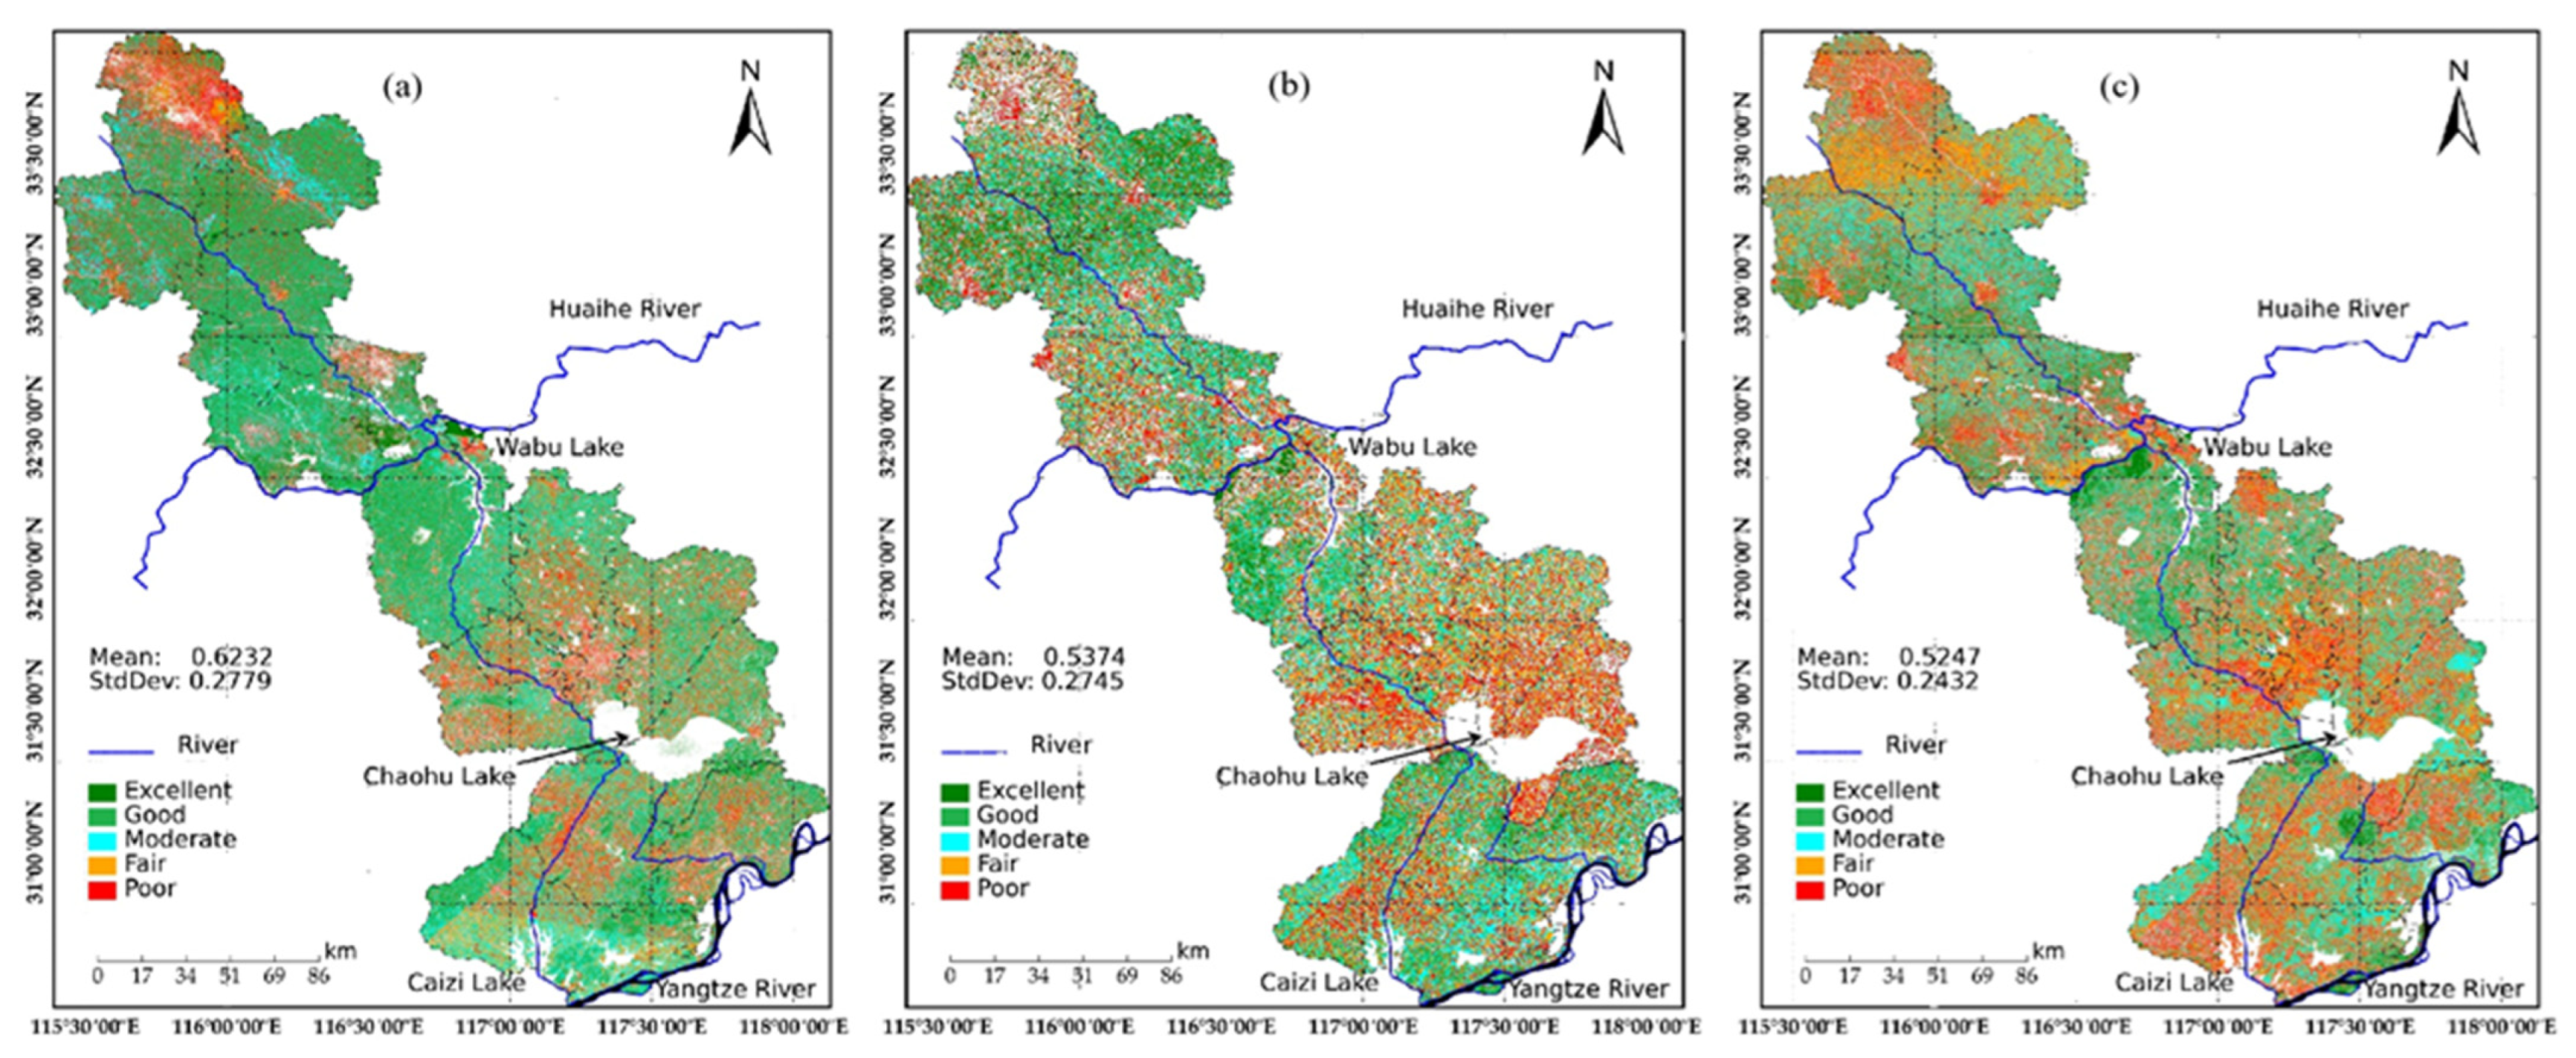
4.1. RSEI Model Applicability Validation
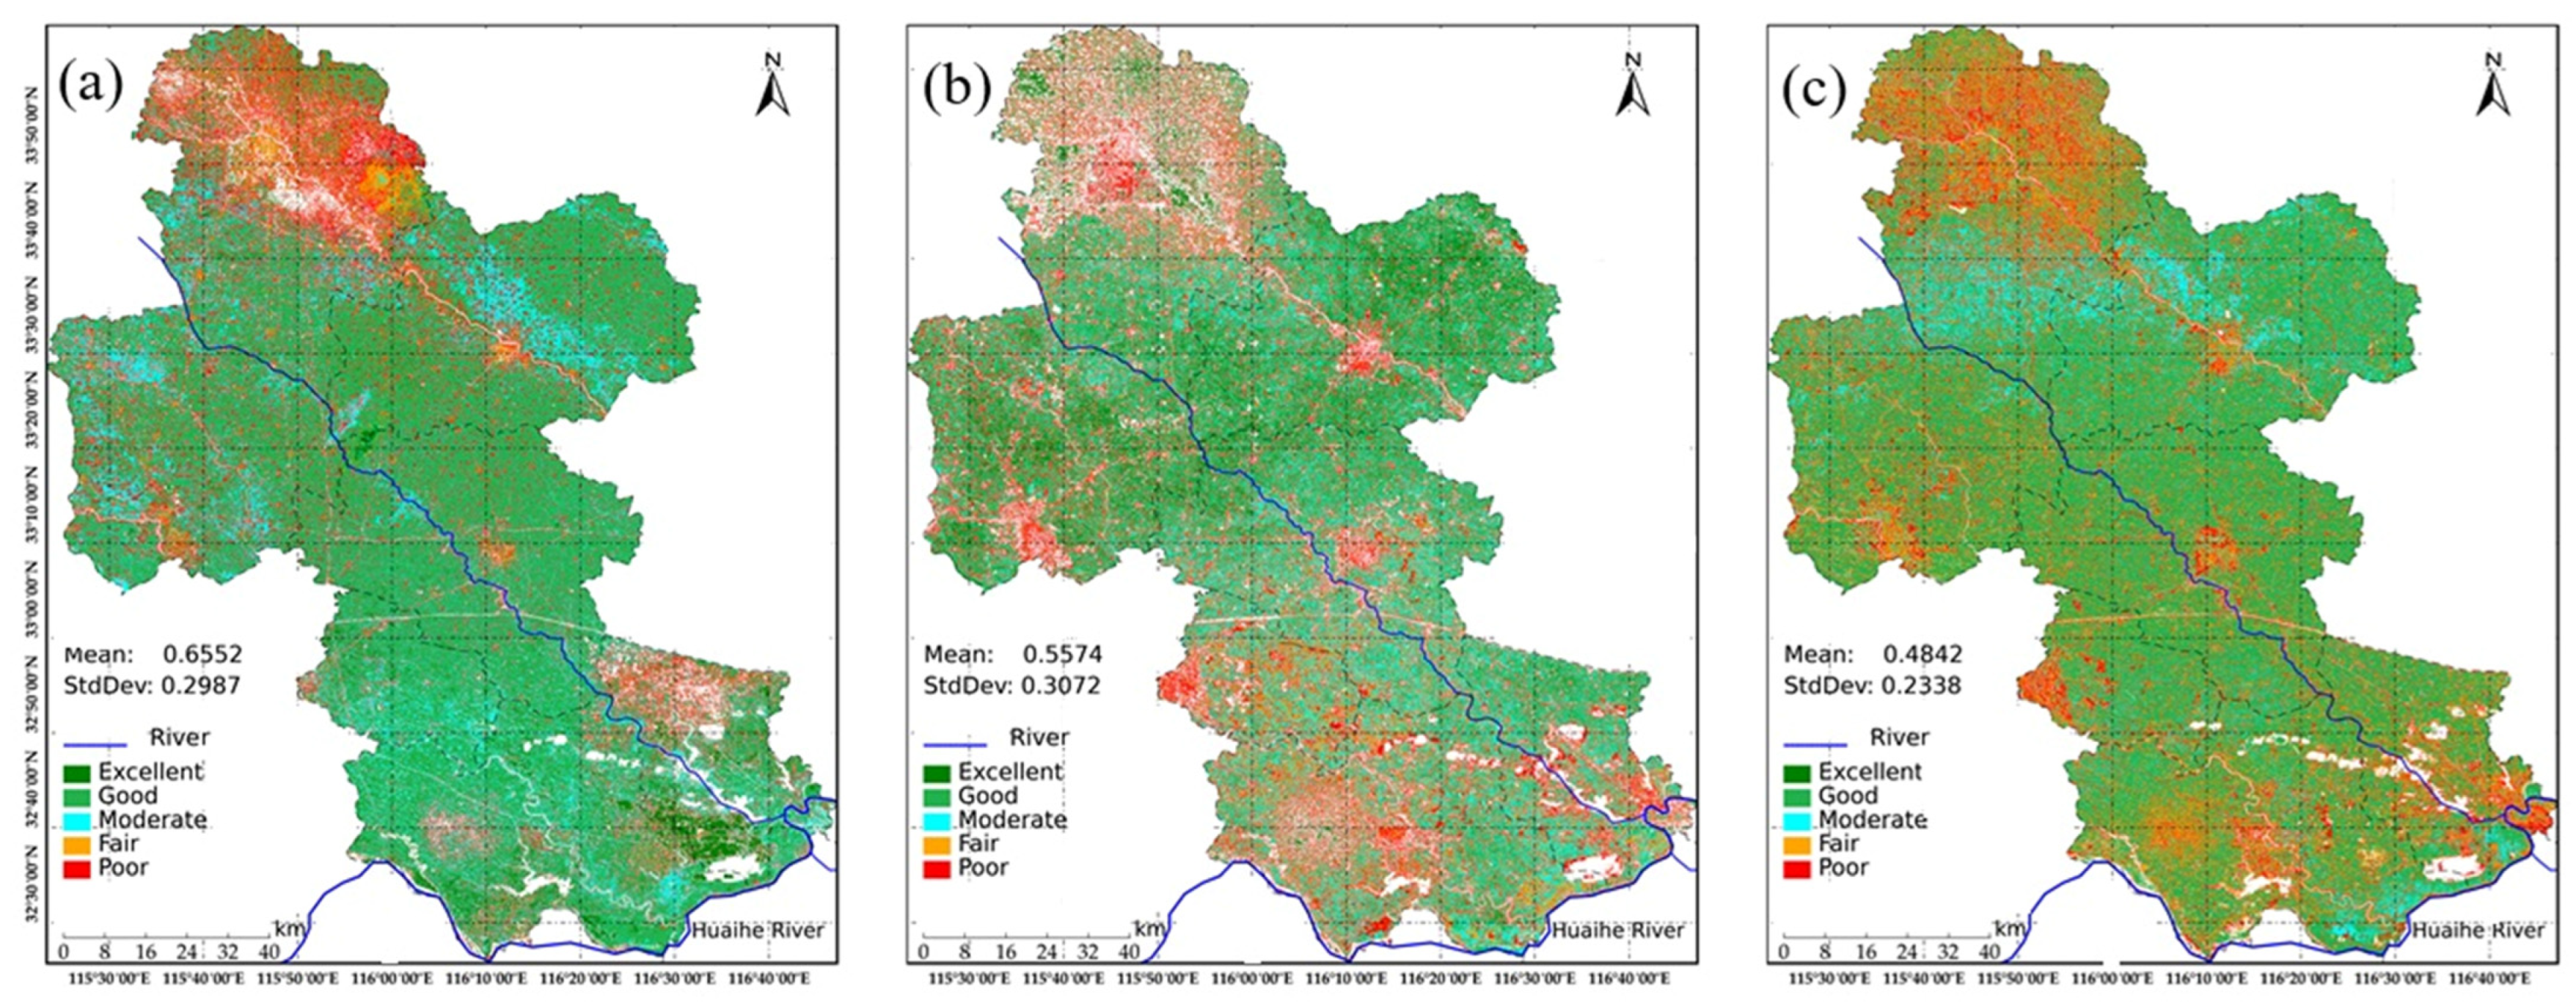
4.2. Spatial Distribution of EEQ
4.3. Spatial Change Characteristics of EEQ
4.4. Spatial Stability of the RSEI
4.5. Prediction of Future Trends in Ecological Environment Quality
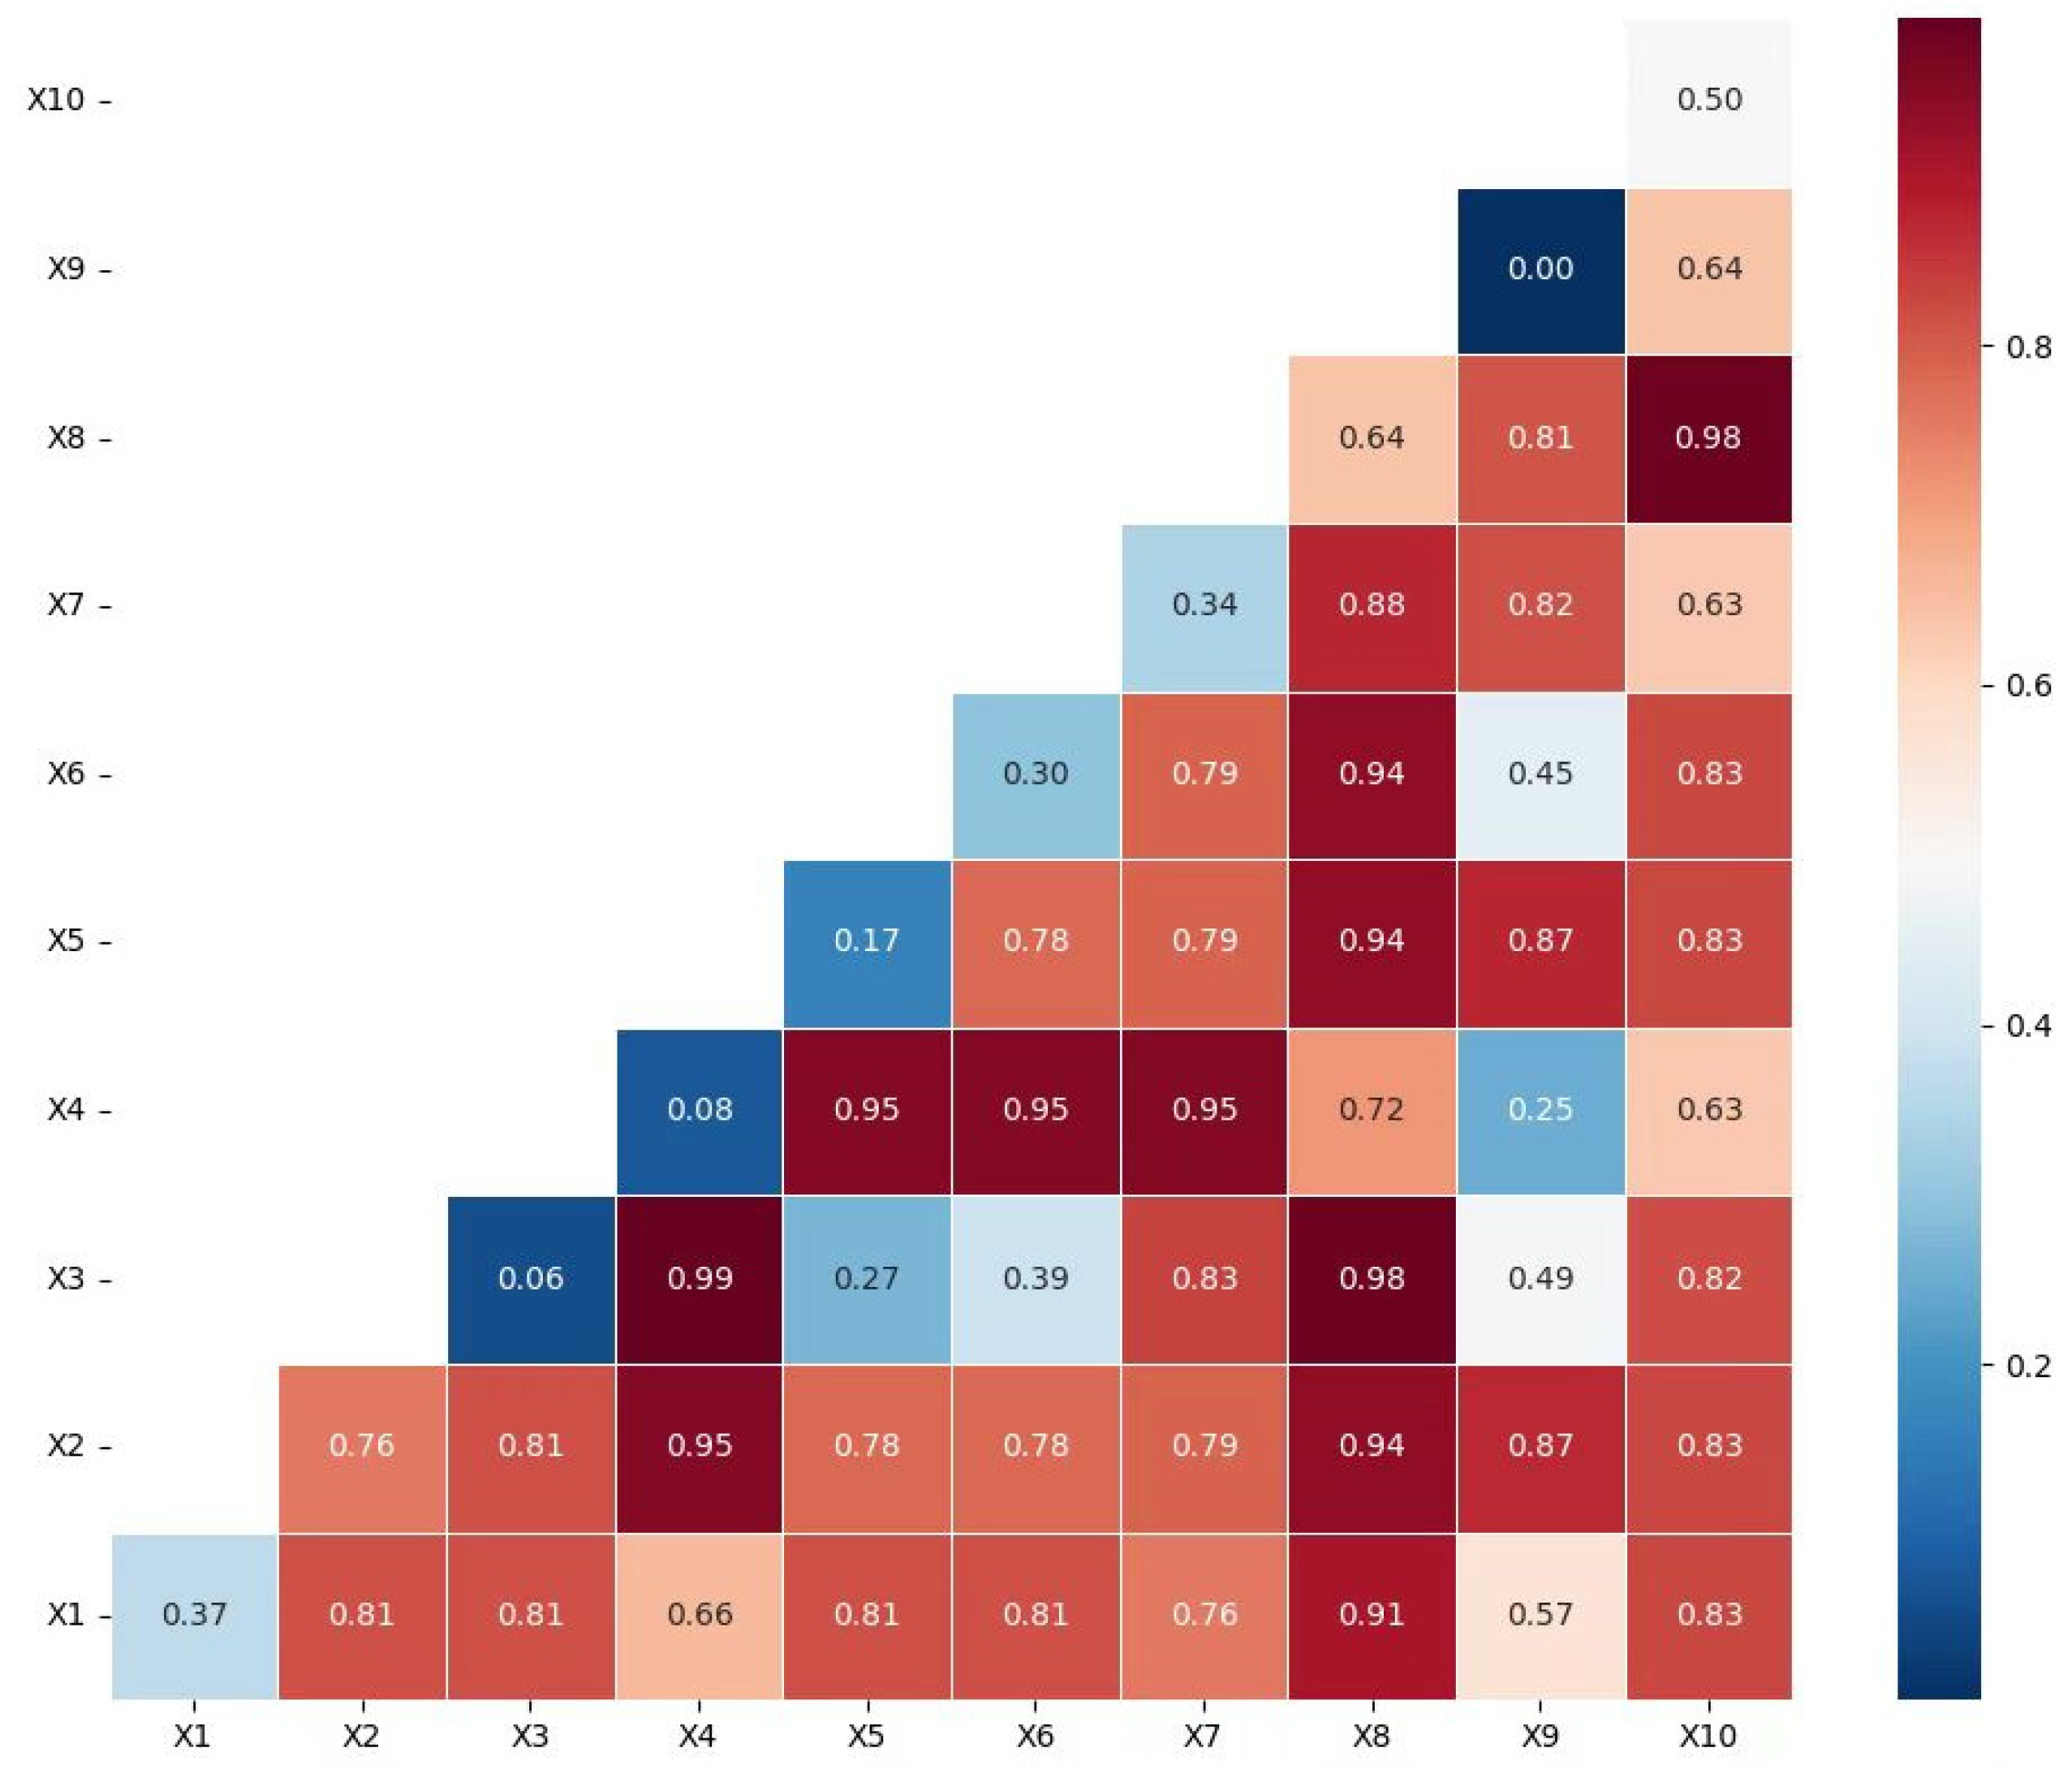
4.6. Quantitative Attribution Analysis of Driving Factors for Spatial Differentiation of RSEI
5. Discussion
6. Conclusions
- (1)
- The RSEI in these areas exhibited a fluctuating upward trend followed by a decline, with increasing spatial heterogeneity in ecological quality. The ecological quality ranking across subregions was: Yangtze River–Huaihe River Connection (86.51%) < Yangtze River Water Northward Conveyance (78.81%) < Yangtze River–Chaohu Lake Water Diversion (29.79%). Over the nine-year period, areas classified as “Good” and “Moderate” ecological quality significantly expanded, while “Poor” and “Very Poor” categories decreased, indicating overall ecological improvement. However, spatial imbalances persist, with pronounced regional disparities in stability: Yangtze River–Huaihe River Connection (40.66% stable/slight fluctuation) > Yangtze River–Chaohu Lake Water Diversion (30.19%) > Yangtze River Water Northward Conveyance (25.02%).
- (2)
- Yangtze River Water Northward Conveyance demonstrated relatively high ecological quality but greater RSEI volatility, attributed to vegetation dynamics in cropland protection zones. In contrast, the Yangtze River–Huaihe River Connection exhibited lower baseline ecological quality but milder fluctuations (slight to moderate), with intense ecological changes observed near Hefei City.
- (3)
- Annual precipitation, impervious surface area, and vegetation coverage emerged as primary drivers of ecological quality, interacting synergistically with annual average temperature and land cover to significantly enhance explanatory power over RSEI variations. Human activities, particularly land-use changes, markedly amplified RSEI dynamics, demonstrating strong collaborative effects with natural factors. All factor interactions exhibited nonlinear enhancement, emphasizing the critical role of coupled natural-anthropogenic processes in shaping ecological patterns.
Author Contributions
Funding
Institutional Review Board Statement
Informed Consent Statement
Data Availability Statement
Conflicts of Interest
References
- Zhang, Y.; Chen, X.; Zhang, Y.; Wang, B. Quantitative contribution of climate change and vegetation restoration to ecosystem services in the Inner Mongolia under ecological restoration projects. Ecol. Indic. 2025, 171, 113240. [Google Scholar] [CrossRef]
- Zhang, X.; Jia, W.; Lu, S.; He, J. Ecological assessment and driver analysis of high vegetation cover areas based on new remote sensing index. Ecol. Inform. 2024, 82, 102786. [Google Scholar] [CrossRef]
- Liang, L.; Wang, Q.; Guan, Q.; Du, Q.; Sun, Y.; Ni, F.; Lv, S.; Shan, Y. Assessing vegetation restoration prospects under different environmental elements in cold and arid mountainous region of China. Catena 2023, 226, 107055. [Google Scholar] [CrossRef]
- Han, Q.; Xue, L.; Liu, Y.; Yang, M.; Chu, X.; Liu, S. Developing a multi-objective simulation-optimization model for ecological water conveyance in arid inland river basins. J. Hydrol.-Reg. Stud. 2023, 50, 101551. [Google Scholar] [CrossRef]
- Li, Y.; Zhang, X.; Cao, Z.; Liu, Z.; Lu, Z.; Liu, Y. Towards the progress of ecological restoration and economic development in China’s Loess Plateau and strategy for more sustainable development. Sci. Total Environ. 2021, 756, 143676. [Google Scholar] [CrossRef]
- Meng, Y.; Hou, B.; Ding, C.; Huang, L.; Guo, Y.; Tang, Z. Spatiotemporal patterns of planted forests on the Loess Plateau between 1986 and 2021 based on Landsat NDVI time-series analysis. Gisci. Remote Sens. 2023, 60, 2185980. [Google Scholar] [CrossRef]
- Wu, Q.; Jiang, X.; Song, M.; Liu, Y.; Shi, X.; Lei, Y.; Nie, T. Study on the development trend of social-ecological systems and the drivers of sustainable development—A case study of the Loess Plateau in China. Ecol. Indic. 2023, 156, 111172. [Google Scholar] [CrossRef]
- Xiao, Y.; Wang, R.; Wang, F.; Huang, H.; Wang, J. Investigation on spatial and temporal variation of coupling coordination between socioeconomic and ecological environment: A case study of the Loess Plateau, China. Ecol. Indic. 2022, 136, 108667. [Google Scholar] [CrossRef]
- Long, Y.; Jiang, F.; Deng, M.; Wang, T.; Sun, H. Spatial-temporal changes and driving factors of eco-environmental quality in the Three-North region of China. J. Arid Land 2023, 15, 231–252. [Google Scholar] [CrossRef]
- Zheng, Z.; Wu, Z.; Chen, Y.; Guo, C.; Marinello, F. Instability of remote sensing based ecological index (RSEI) and its improvement for time series analysis. Sci. Total Environ. 2022, 814, 152595. [Google Scholar] [CrossRef]
- Kang, S.; Jia, X.; Zhao, Y.; Han, L.; Ma, C.; Bai, Y. Spatiotemporal Variation and Driving Factors of Ecological Environment Quality on the Loess Plateau in China from 2000 to 2020. Remote Sens. 2024, 16, 4778. [Google Scholar] [CrossRef]
- Xin, J.; Yang, J.; Yu, H.; Ren, J.; Yu, W.; Cong, N.; Xiao, X.; Xia, J.; Li, X.; Qiao, Z. Towards ecological civilization: Spatiotemporal heterogeneity and drivers of ecological quality transitions in China (2001–2020). Appl. Geogr. 2024, 173, 103439. [Google Scholar] [CrossRef]
- Zhou, M.; Li, Z.; Gao, M.; Zhu, W.; Zhang, S.; Ma, J.; Ta, L.; Yang, G. Revealing the Eco-Environmental Quality of the Yellow River Basin: Trends and Drivers. Remote Sens. 2024, 16, 2018. [Google Scholar] [CrossRef]
- Yang, H.; Yu, J.; Xu, W.; Wu, Y.; Lei, X.; Ye, J.; Geng, J.; Ding, Z. Long-time series ecological environment quality monitoring and cause analysis in the Dianchi Lake Basin, China. Ecol. Indic. 2023, 148, 110084. [Google Scholar] [CrossRef]
- Lv, Y.; Xiu, L.; Yao, X.; Yu, Z.; Huang, X. Spatiotemporal evolution and driving factors analysis of the eco-quality in the Lanxi urban agglomeration. Ecol. Indic. 2023, 156, 111114. [Google Scholar] [CrossRef]
- Aurora, R.M.; Furuya, K. Spatiotemporal Analysis of Urban Sprawl and Ecological Quality Study Case: Chiba Prefecture, Japan. Land 2023, 12, 2013. [Google Scholar] [CrossRef]
- Halder, S.; Bose, S. Comparative study on remote sensing-based indices for urban ecology assessment: A case study of 12 urban centers in the metropolitan area of eastern India. J. Earth Syst. Sci. 2024, 133, 100. [Google Scholar] [CrossRef]
- An, L.; Liao, K.; Zhu, L.; Zhou, B. Influence of river-lake isolation on the water level variations of Caizi Lake, lower reach of the Yangtze River. J. Geogr. Sci. 2021, 31, 551–564. [Google Scholar] [CrossRef]
- Li, C.; Li, H.; Zhang, Y.; Zha, D.; Zhao, B.; Yang, S.; Zhang, B.; de Boer, W.F. Predicting hydrological impacts of the Yangtze-to-Huaihe Water Diversion Project on habitat availability for wintering waterbirds at Caizi Lake. J. Environ. Manag. 2019, 249, 109251. [Google Scholar] [CrossRef]
- Qi, X.; Han, Q.; Li, B.; Chen, X.; Guo, Z.; Ou, Y.; Wang, D. Developing a Multi-Objective Optimization Scheduling Method for the Yangtze to Huaihe River Water Diversion Project Considering Lake Regulation and Storage. Water 2025, 17, 1286. [Google Scholar] [CrossRef]
- Ding, W.; Shi, G.; Zha, H.; Miao, H.; Lu, M.; Jin, J. Ecological impacts and supply demand evolution of the Yangtze to Huaihe water transfer project in Anhui section. Sci. Rep. 2024, 14, 20311. [Google Scholar] [CrossRef] [PubMed]
- Halder, S.; Bose, S. Ecological quality assessment of five smart cities in India: A remote sensing index-based analysis. Int. J. Environ. Sci. Technol. 2024, 21, 4101–4118. [Google Scholar] [CrossRef]
- Hasan, M.M.; Ferdous, M.T.; Talha, M.; Mojumder, P.; Roy, S.K.; Zim, M.N.F.; Akter, M.M.; Nasher, N.M.R.; Hasher, F.F.B.; Boltiziar, M.; et al. Analyzing Ecological Environmental Quality Trends in Dhaka Through Remote Sensing Based Ecological Index (RSEI). Land 2025, 14, 1258. [Google Scholar] [CrossRef]


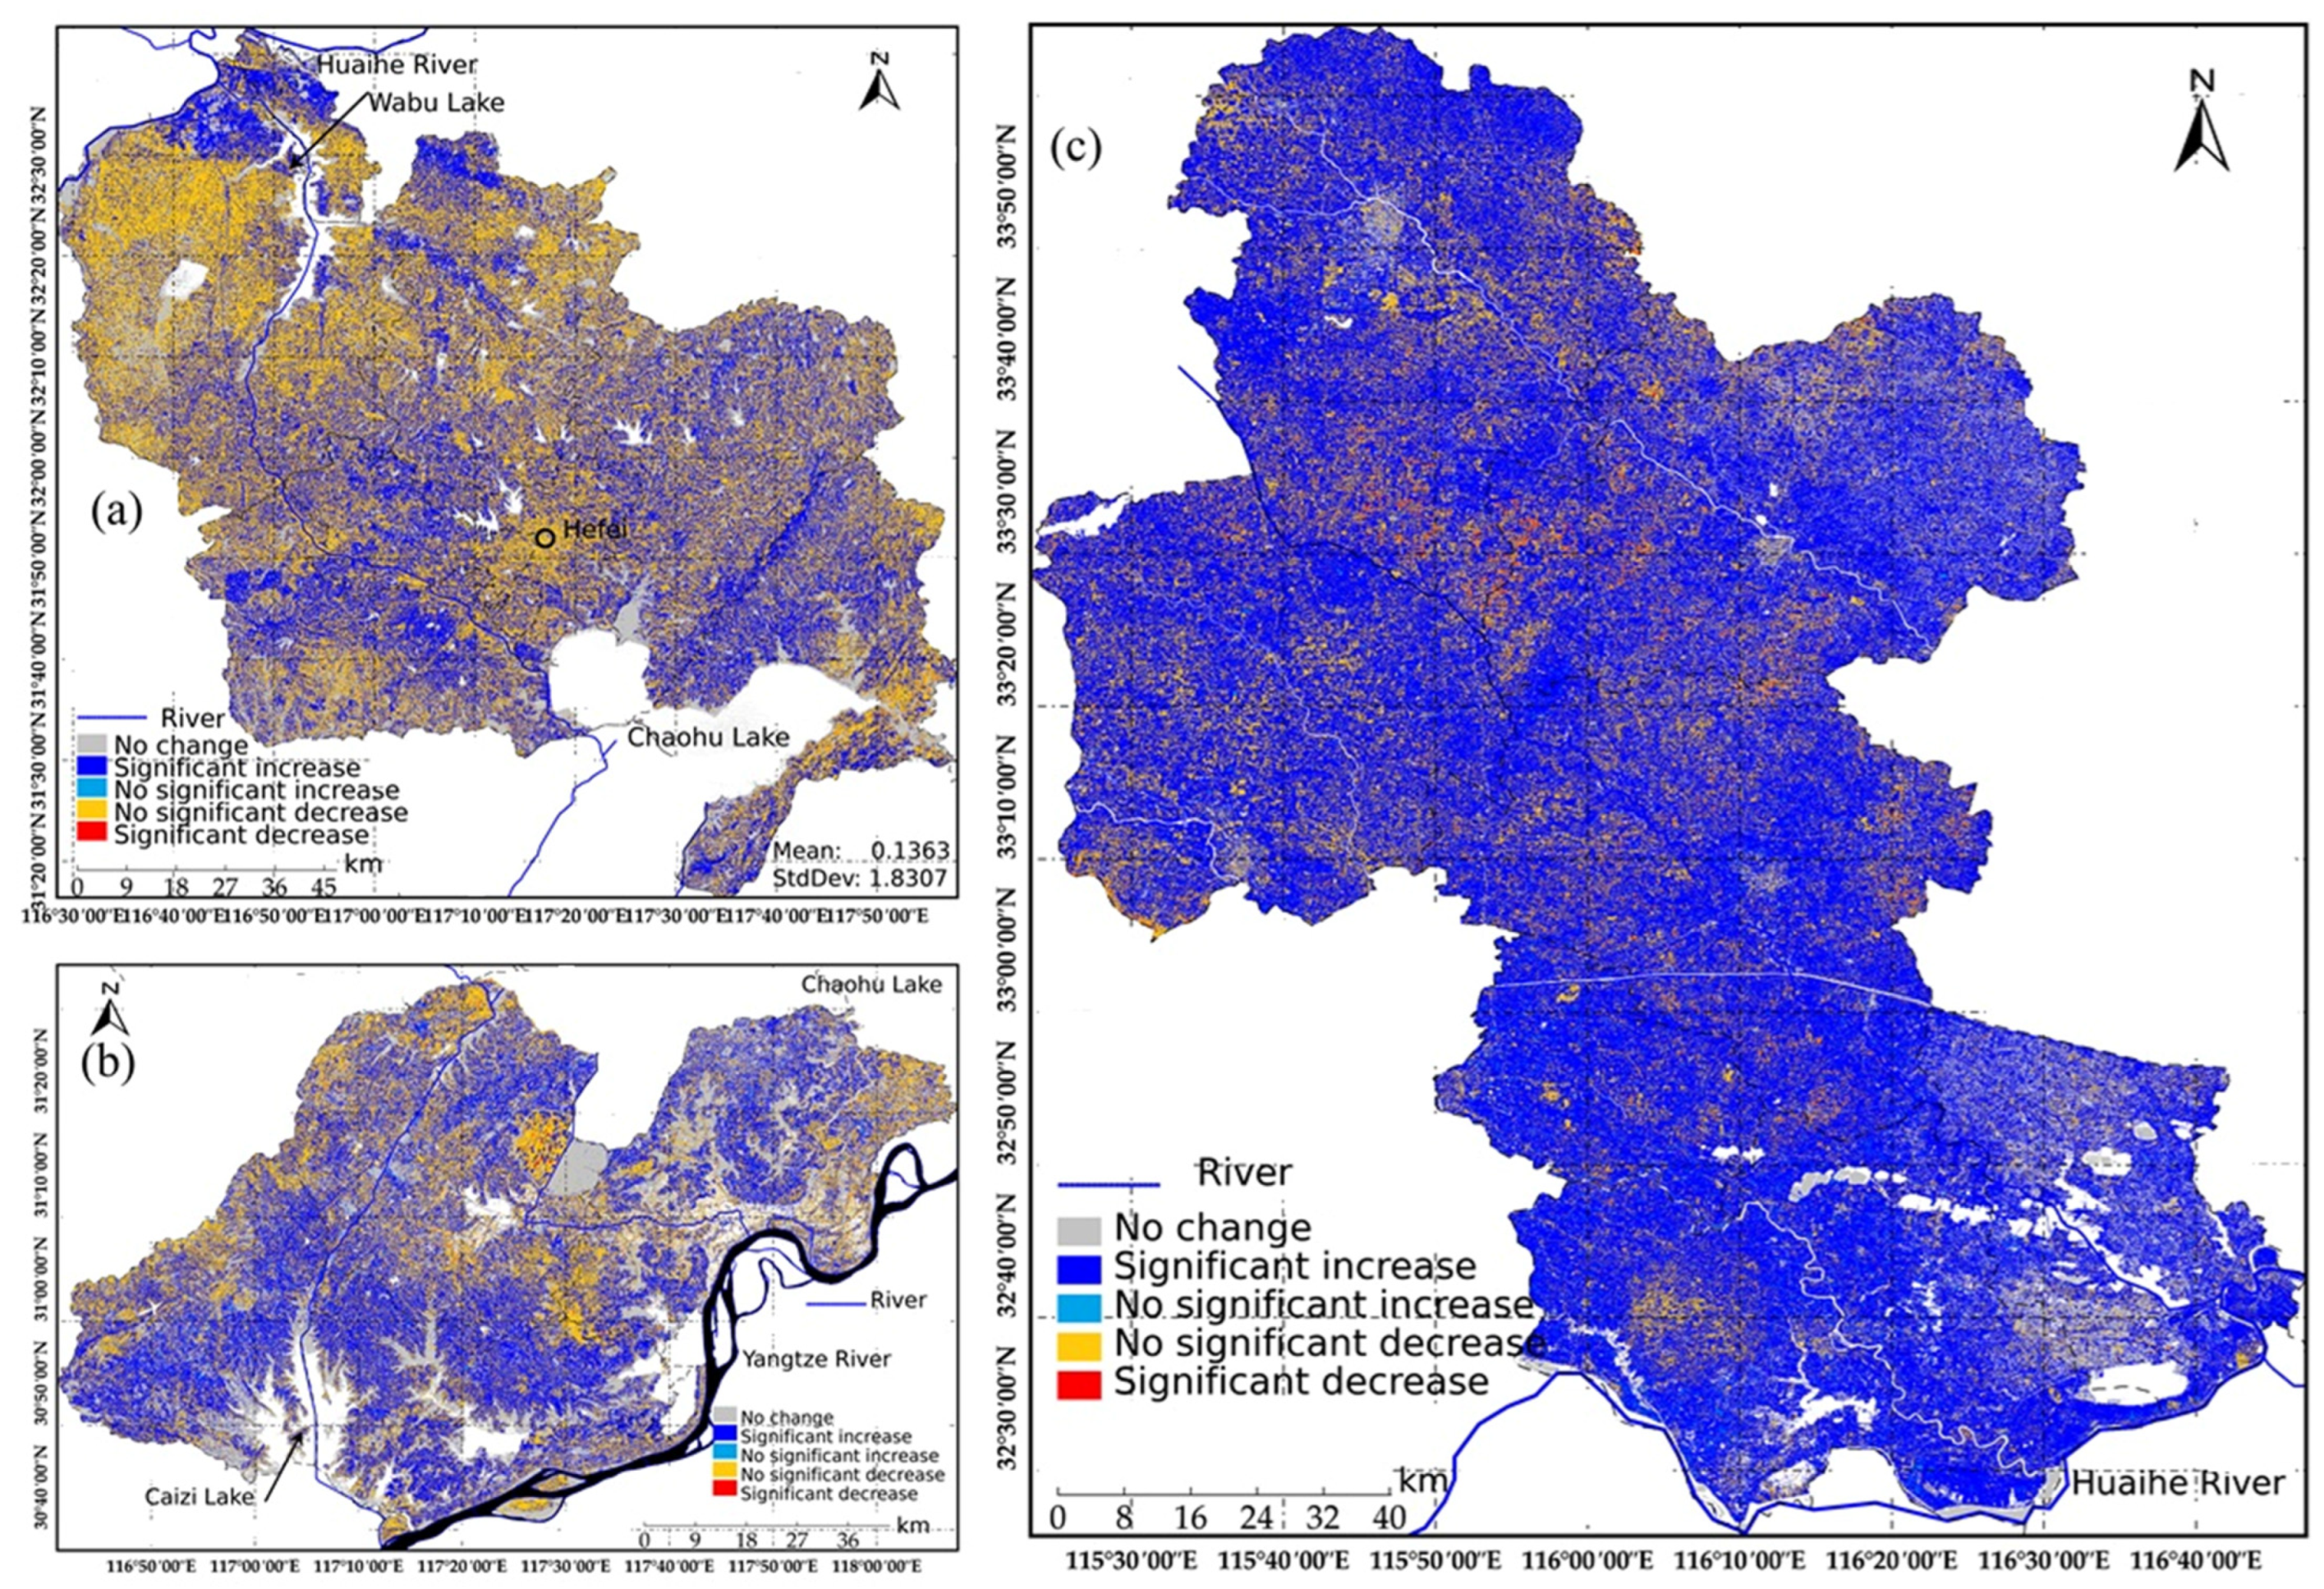
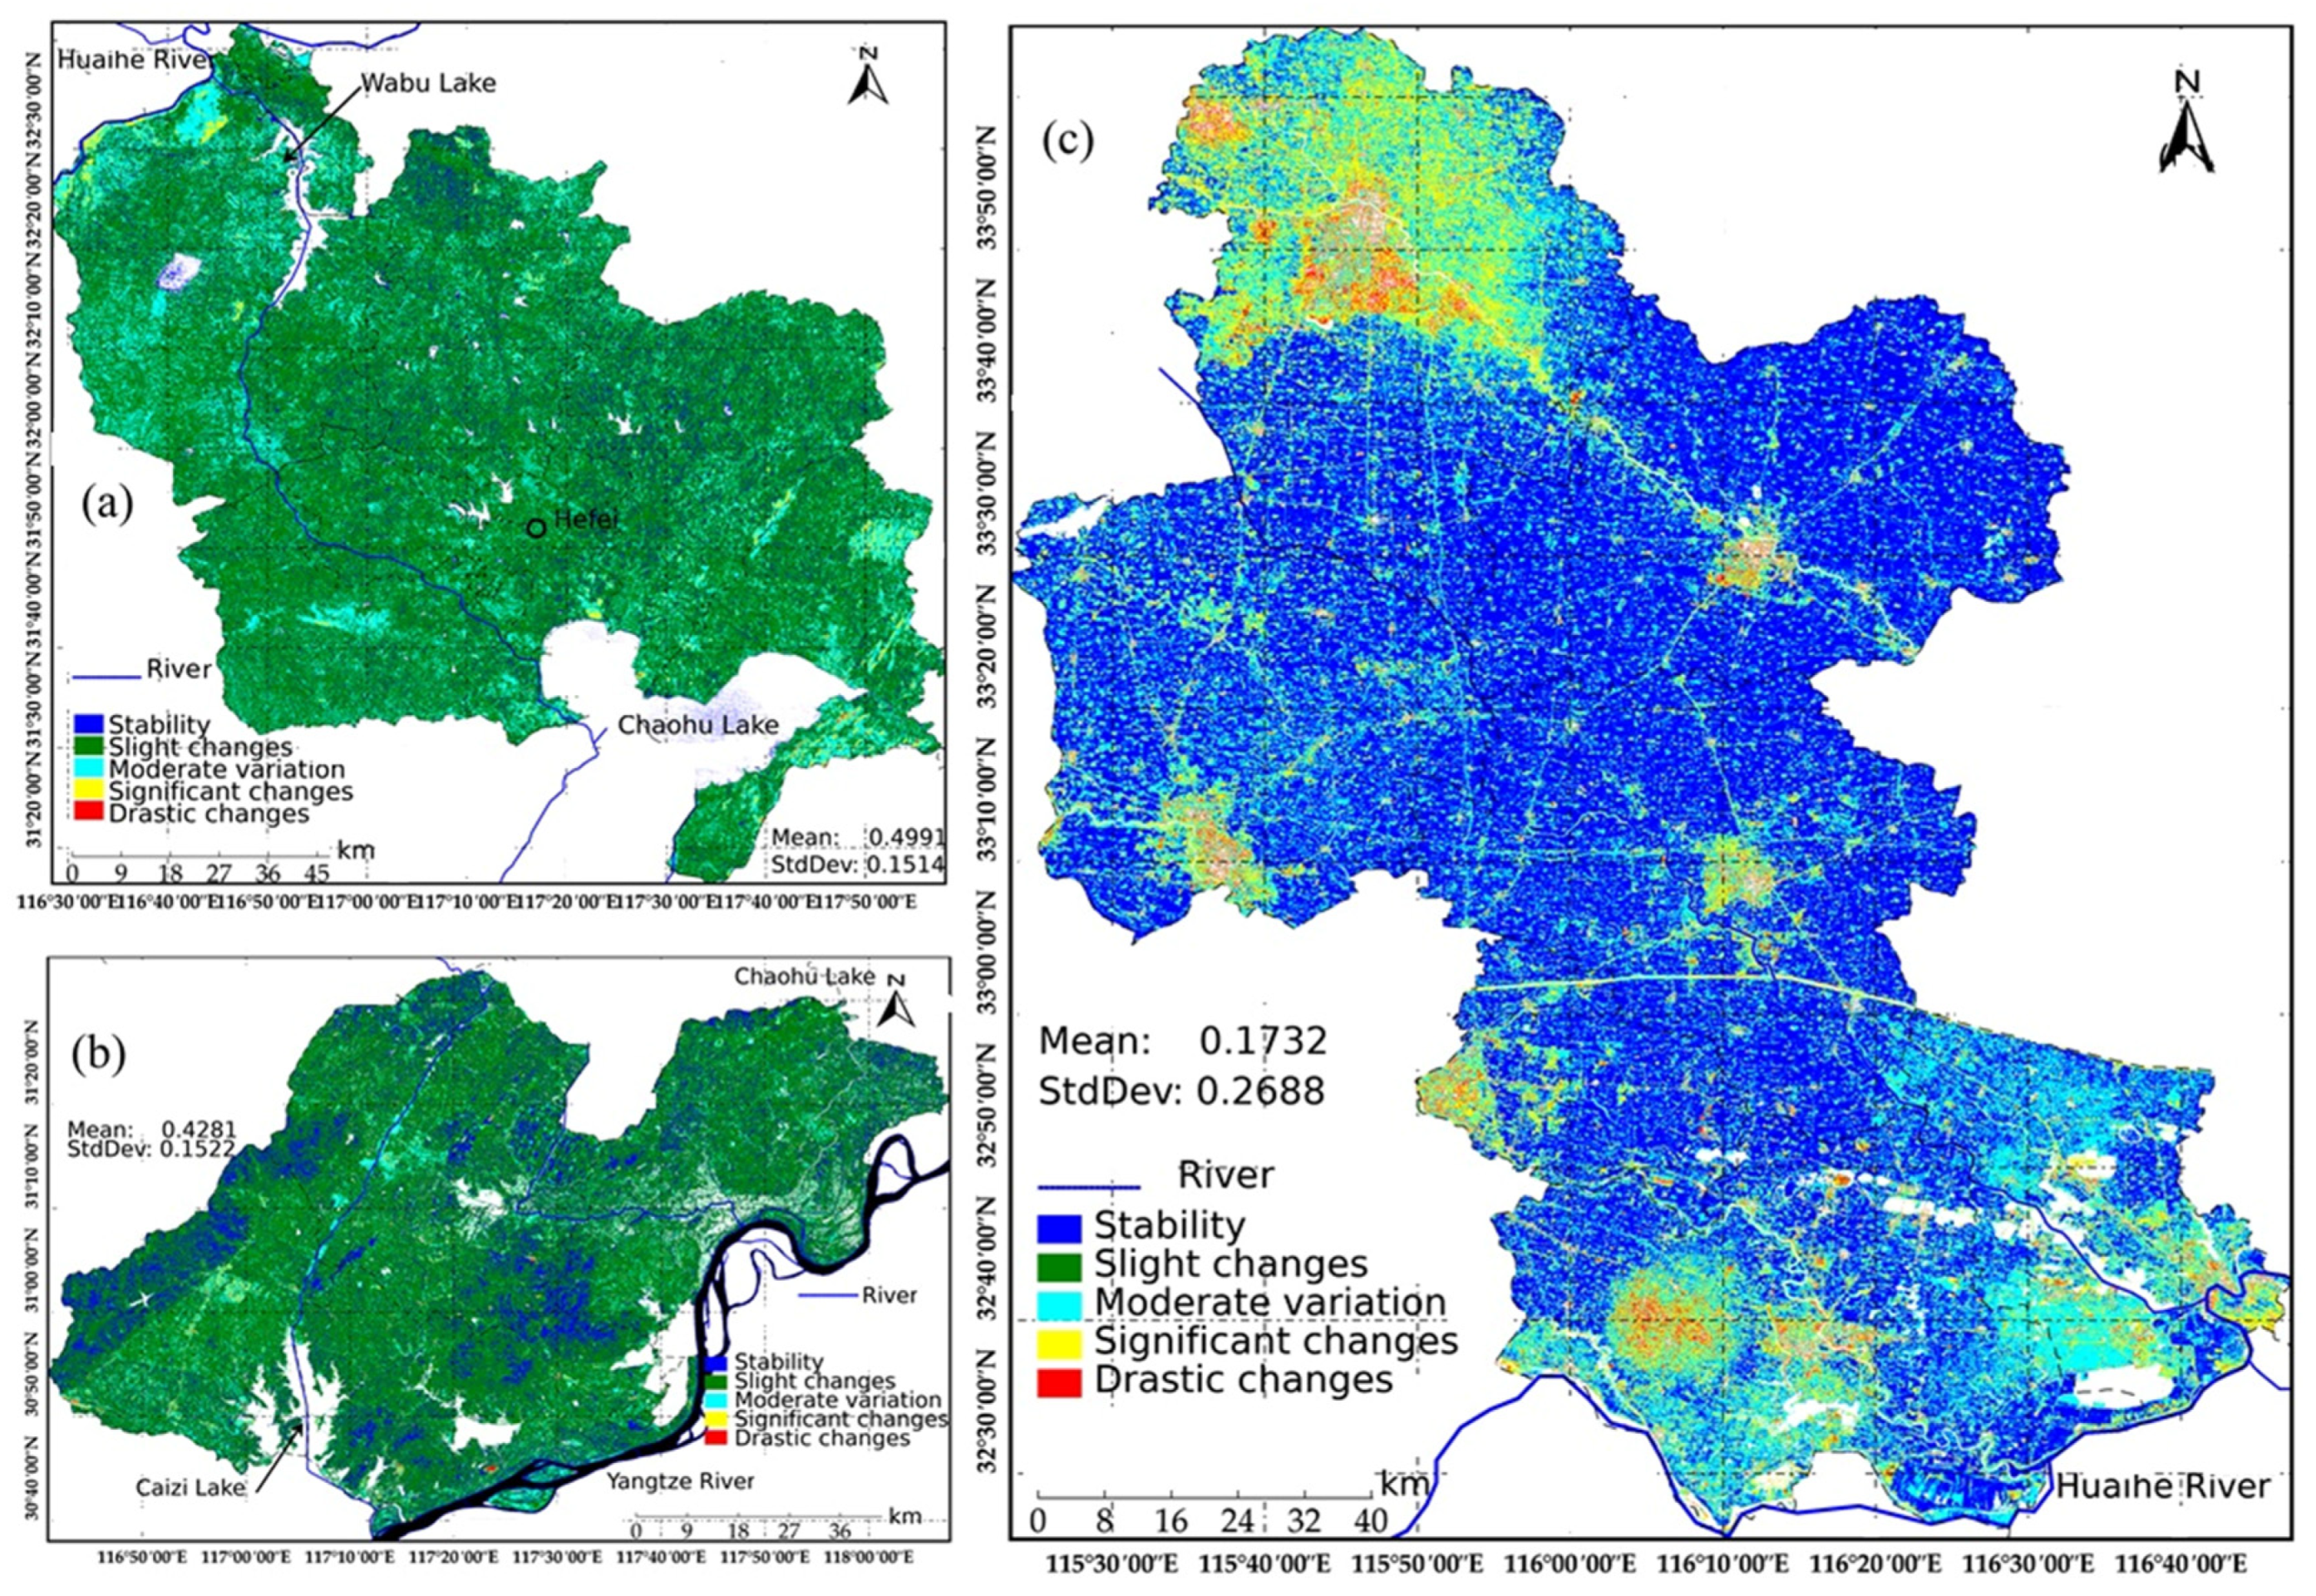

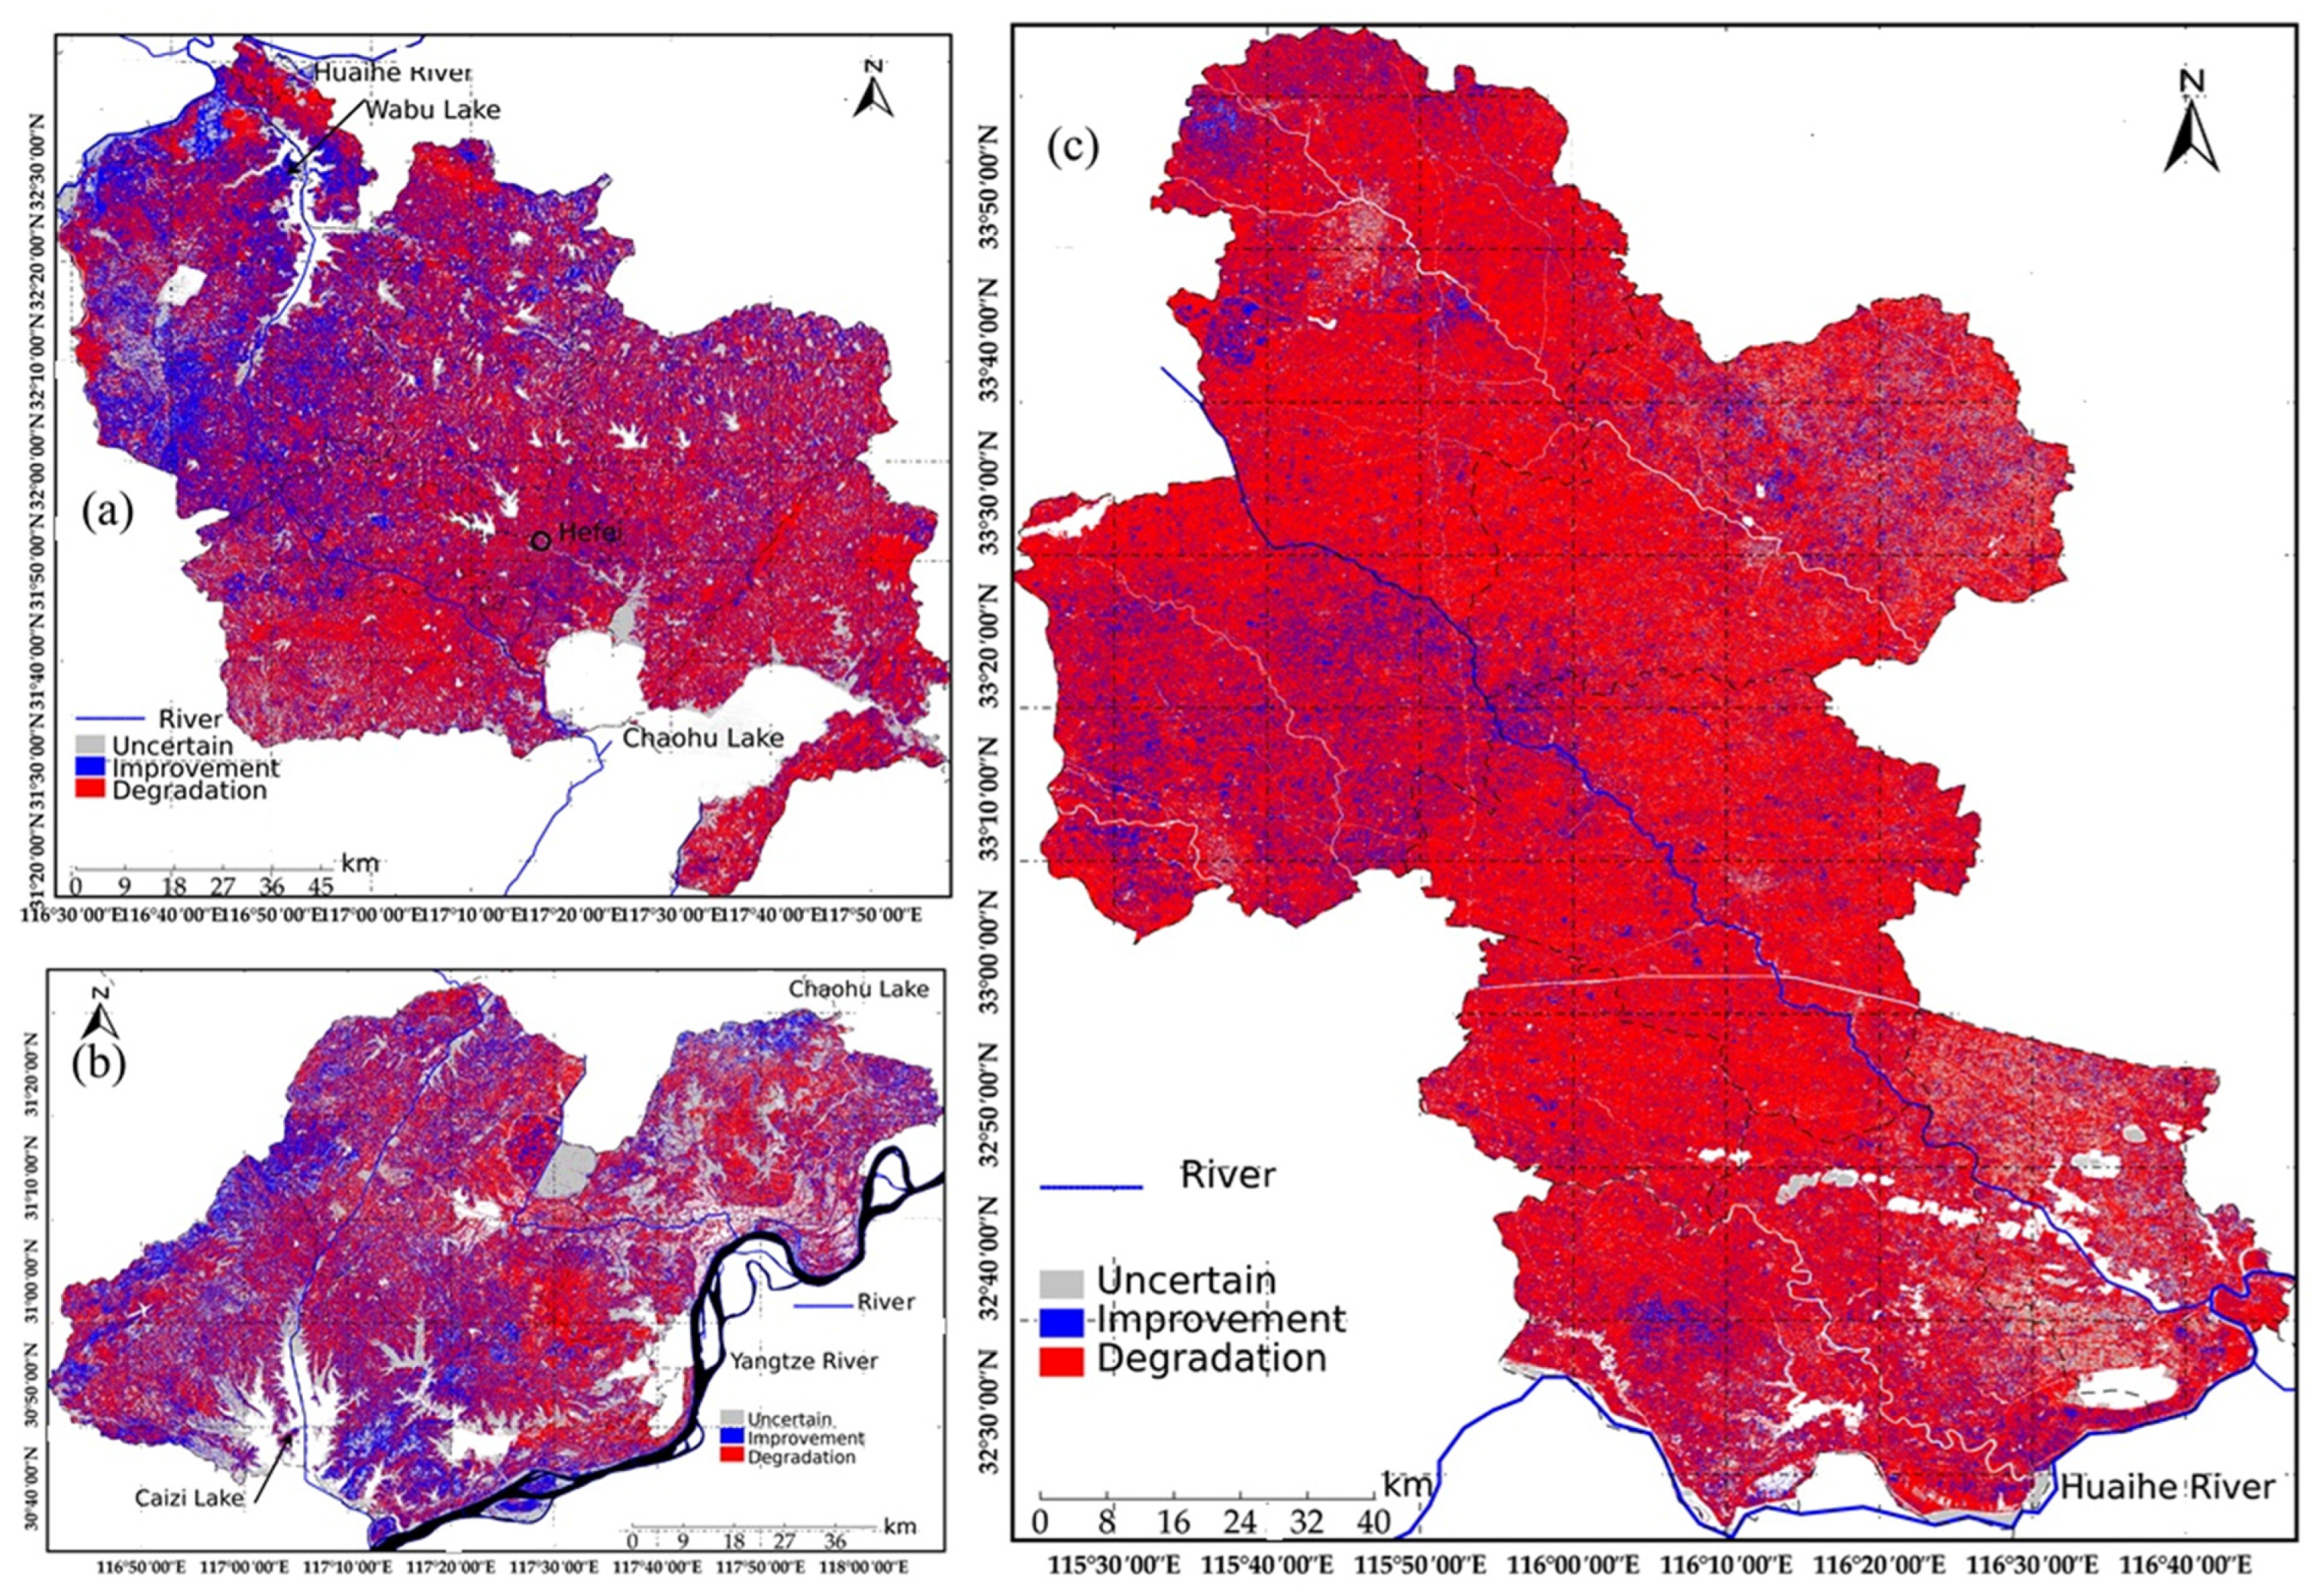
| Z | Trend Type | Trend Features | |
|---|---|---|---|
| <0 | ≤−1.96 | SD | Significant decrease |
| <0 | −1.96 to 1.96 | NSD | No significant decrease |
| 0 | −1.96 to 1.96 | NC | No change |
| >0 | −1.96 to 1.96 | NSI | No significant increase |
| >0 | ≥1.96 | SI | significant increase |
| Hurst | Sen’s Slope | Future Trends |
|---|---|---|
| 0.5 < H < 1 | β > 0 | Improvement |
| β < 0 | Degradation | |
| H = 0.5 | - | Uncertain |
| 0 < H < 0.5 | β > 0 | Improvement |
| β < 0 | Degradation |
| Criteria | Interaction |
|---|---|
| q(X1 ∩ X2) < Min (q(X1), q(X2)) | Nonlinear Weakening |
| Min(q(X1), q(X2)) < q(X1 ∩ X2) < Max(q(X1), q(X2)) | Single-Factor Nonlinear Weakening |
| q(X1 ∩ X2) > Max(q(X1), q(X2)) | Two-Factor Enhancement |
| q(X1 ∩ X2) = q(X1) + q(X2) | Mutual Independence |
| q(X1 ∩ X2) > q(X1) + q(X2) | Nonlinear Enhancement |
| Year | RSEI Value | NDVI Value | WET Value | NDBSI Value | LST Value | PC1 Value | PC1 Contribution Rate |
|---|---|---|---|---|---|---|---|
| 2015 | 0.6232 | 0.4412 | 0.5248 | 0.6984 | 0.6095 | 0.2863 | 79.40% |
| 2020 | 0.5374 | 0.5625 | 0.4815 | 0.6563 | 0.5333 | 0.2605 | 83.74% |
| 2024 | 0.5247 | 0.3879 | 0.4481 | 0.6952 | 0.4757 | 0.2369 | 78.17% |
| Class | Range | RSEI (2015) | RSEI (2020) | RSEI (2024) | |||
|---|---|---|---|---|---|---|---|
| Area (km2) | Proportion (%) | Area (km2) | Proportion (%) | Area (km2) | Proportion (%) | ||
| Excellent | 0.8–1.0 | 10924.20 | 37.44 | 3526.90 | 12.42 | 3637.24 | 12.43 |
| Good | 0.6–0.8 | 6474.50 | 22.19 | 7118.85 | 23.13 | 7608.52 | 26.34 |
| Moderate | 0.4–0.6 | 4637.73 | 15.89 | 8837.25 | 30.31 | 9018.88 | 30.82 |
| Fair | 0.2–0.4 | 4838.39 | 16.58 | 6766.31 | 23.47 | 6444.21 | 21.97 |
| Poor | 0.0–0.2 | 2305.91 | 7.9 | 2930.69 | 10.67 | 2471.84 | 8.45 |
| Segment | Trend Type | 2015–2024 | |
|---|---|---|---|
| Area/km2 | Proportion/% | ||
| Yangtze River–Chaohu Lake Water Diversion | No change | 1968.36 | 25.64 |
| No significant increase | 2936.97 | 38.26 | |
| Significant increase | 57.33 | 0.75 | |
| No significant decrease | 2057.56 | 26.80 | |
| Significant decrease | 26.93 | 0.35 | |
| Yangtze River–Huaihe River Connection | No change | 1896.21 | 15.30 |
| No significant increase | 4633.03 | 37.38 | |
| Significant increase | 34.06 | 0.27 | |
| No significant decrease | 5146.40 | 41.52 | |
| Significant decrease | 41.88 | 0.34 | |
| Yangtze River Water Northward Conveyance | No change | 895.43 | 7.20 |
| No significant increase | 8366.28 | 67.27 | |
| Significant increase | 202.44 | 1.63 | |
| No significant decrease | 2056.50 | 16.53 | |
| Significant decrease | 91.76 | 0.74 | |
| CV | Yangtze River–Chaohu Lake Water Diversion | Yangtze River–Huaihe River Connection | Yangtze River Water Northward Conveyance | |||
|---|---|---|---|---|---|---|
| Area (km2) | Proportion (%) | Area (km2) | Proportion (%) | Area (km2) | Proportion (%) | |
| Stability | 1141.11 | 14.87 | 862.64 | 6.96 | 5928.66 | 47.67 |
| Slight changes | 5109.67 | 66.57 | 8215.37 | 66.28 | 116.11 | 0.93 |
| Moderate variation | 709.46 | 9.24 | 2507.26 | 20.23 | 3705.16 | 29.79 |
| Significant changes | 68.21 | 0.89 | 151.61 | 1.22 | 1486.79 | 11.95 |
| Drastic changes | 15.58 | 0.20 | 5.51 | 0.04 | 282.68 | 2.27 |
| CV | Yangtze River–Chaohu Lake Water Diversion | Yangtze River–Huaihe River Connection | Yangtze River Water Northward Conveyance | |||
|---|---|---|---|---|---|---|
| Area (km2) | Proportion (%) | Area (km2) | Proportion (%) | Area (km2) | Proportion (%) | |
| Uncertain | 1968.36 | 25.64 | 1896.21 | 15.30 | 895.43 | 7.20 |
| Improvement | 2132.66 | 27.78 | 3720.89 | 30.02 | 1754.32 | 14.11 |
| Degradation | 2946.12 | 38.38 | 6134.14 | 49.49 | 8962.36 | 72.06 |
| Driving Factors | Variable | Yangtze River–Chaohu Lake Water Diversion | Yangtze River–Huaihe River Connection | Yangtze River Water Northward Conveyance | |||||||
|---|---|---|---|---|---|---|---|---|---|---|---|
| 2015 | 2020 | 2024 | 2015 | 2020 | 2024 | 2015 | 2020 | 2024 | |||
| natural factors | climatic factors | X1 | 18.20 | 17.60 | 17.40 | 17.50 | 16.30 | 17.40 | 16.00 | 16.60 | 14.80 |
| X2 | 1421.30 | 1877.90 | 1776.30 | 1234.60 | 1634.20 | 1293.10 | 808.60 | 1020.90 | 829.30 | ||
| vegetation factors | X3 | 24.86 | 24.86 | 24.86 | 23.43 | 23.43 | 23.43 | 26.91 | 26.91 | 26.91 | |
| X4 | 0.50 | 0.56 | 0.21 | 0.35 | 0.34 | 0.22 | 0.26 | 0.56 | 0.29 | ||
| topographic factors | X5 | 49.32 | 49.32 | 49.32 | 38.20 | 38.20 | 38.20 | 30.68 | 30.68 | 30.68 | |
| X6 | 5.16 | 5.16 | 5.16 | 2.77 | 2.77 | 2.77 | 2.02 | 2.02 | 2.02 | ||
| surface disturbance factors | X7 | 619.87 | 863.75 | 1015.04 | 1174.01 | 1443.37 | 2100.10 | 1343.59 | 1502.63 | 1623.43 | |
| X8 | 0.44 | 0.48 | 0.75 | 0.51 | 0.48 | 0.54 | 0.60 | 0.56 | 0.60 | ||
| socio-economic | economic factors | X9 | 360.00 | 288.00 | 279.00 | 323.00 | 319.00 | 318.00 | 466.00 | 502.00 | 445.00 |
| population size | X10 | 972.77 | 1471.97 | 2348.36 | 270.74 | 1824.07 | 2580.59 | 1047.92 | 1742.43 | 2495.18 | |
| X1 | X2 | X3 | X4 | X5 | X6 | X7 | X8 | X9 | X10 | |
|---|---|---|---|---|---|---|---|---|---|---|
| q statistic | 0.37 | 0.76 | 0.06 | 0.08 | 0.17 | 0.30 | 0.34 | 0.64 | 0.00 | 0.50 |
| p value | 1.00 | 0.56 | 0.97 | 0.95 | 0.93 | 0.78 | 0.49 | 0.77 | 1.00 | 0.91 |
Disclaimer/Publisher’s Note: The statements, opinions and data contained in all publications are solely those of the individual author(s) and contributor(s) and not of MDPI and/or the editor(s). MDPI and/or the editor(s) disclaim responsibility for any injury to people or property resulting from any ideas, methods, instructions or products referred to in the content. |
© 2025 by the authors. Licensee MDPI, Basel, Switzerland. This article is an open access article distributed under the terms and conditions of the Creative Commons Attribution (CC BY) license (https://creativecommons.org/licenses/by/4.0/).
Share and Cite
Qi, X.; Li, Q.; Han, Q.; Li, B.; Liu, L.; Shi, Z.; Ou, Y.; Wang, D. Remote Sensing-Based Assessment of Eco-Environmental Quality Dynamics and Driving Forces in the Anhui Section of the Yangtze-to-Huaihe Water Diversion Project (2015–2024). Sustainability 2025, 17, 7329. https://doi.org/10.3390/su17167329
Qi X, Li Q, Han Q, Li B, Liu L, Shi Z, Ou Y, Wang D. Remote Sensing-Based Assessment of Eco-Environmental Quality Dynamics and Driving Forces in the Anhui Section of the Yangtze-to-Huaihe Water Diversion Project (2015–2024). Sustainability. 2025; 17(16):7329. https://doi.org/10.3390/su17167329
Chicago/Turabian StyleQi, Xiaoming, Qian Li, Qiang Han, Bowen Li, Le Liu, Zhikong Shi, Yuanchao Ou, and Dejian Wang. 2025. "Remote Sensing-Based Assessment of Eco-Environmental Quality Dynamics and Driving Forces in the Anhui Section of the Yangtze-to-Huaihe Water Diversion Project (2015–2024)" Sustainability 17, no. 16: 7329. https://doi.org/10.3390/su17167329
APA StyleQi, X., Li, Q., Han, Q., Li, B., Liu, L., Shi, Z., Ou, Y., & Wang, D. (2025). Remote Sensing-Based Assessment of Eco-Environmental Quality Dynamics and Driving Forces in the Anhui Section of the Yangtze-to-Huaihe Water Diversion Project (2015–2024). Sustainability, 17(16), 7329. https://doi.org/10.3390/su17167329


