Article

Remote Sensing-Based Assessment of Eco-Environmental Quality Dynamics and Driving Forces in the Anhui Section of the Yangtze-to-Huaihe Water Diversion Project (2015–2024)

1
College of Civil and Hydraulic Engineering, Bengbu University, Bengbu 233000, China
2
Anhui Rural Ecological Environment Protection and Restoration Research Center, Bengbu University, Bengbu 233030, China
3
Anhui Provincial Institute of Ecology and Environmental Sciences, Hefei 230000, China
*
Author to whom correspondence should be addressed.
Sustainability 2025, 17(16), 7329; https://doi.org/10.3390/su17167329
Submission received: 8 June 2025 / Revised: 8 August 2025 / Accepted: 11 August 2025 / Published: 13 August 2025

Abstract

The water source protection areas of the Yangtze-to-Huaihe Water Diversion Project (YHWDP) in Anhui Province serve as crucial ecological barriers to water quality protection. Quantifying their eco-environmental quality (EEQ) dynamics and driving mechanisms is critical for sustainable management. This paper calculated the Remote Sensing Ecological Index (RSEI) for the study area using Landsat satellite data (2015–2024). Temporal and spatial variation characteristics were analyzed using the Theil–Sen estimator, Mann–Kendall test, and coefficient of variation. Future trends were predicted using the Hurst exponent. Finally, the Geodetector model was applied to assess the impact of driving factors. EEQ exhibited a declining trend (p < 0.05), with significant intra-regional heterogeneity. Mean RSEI values ranked as follows: (1) Yangtze River–Huaihe River Connection < Yangtze River Water Northward Conveyance < Yangtze River–Chaohu Lake Water Diversion. (2) From 2015 to 2024, eco-environmental quality improved significantly, showing a spatial pattern of “south > north, east > west.” (3) Overall EEQ changes were characterized by slight to moderate fluctuations. Stability rankings: Yangtze River–Huaihe River Connection > Yangtze River–Chaohu Lake Water Diversion > Yangtze River Water Northward Conveyance. (4) Geodetector analysis identified precipitation, impervious area, and vegetation coverage as the primary factors influencing EEQ in the YHWDP’s water source protection areas. This study reveals ecological changes in the YHWDP region and validates the effectiveness of the comprehensive evaluation method. The findings provide actionable insights for ecological protection in large-scale water diversion projects.

1. Introduction

A favorable ecological environment provides advantageous natural conditions for human survival and development [1]. The rapid economic development has led to increasing conflicts between humans and nature, gradually disrupting the ecological balance. In recent years, a series of ecological issues, such as air pollution and land degradation, have garnered widespread attention among scholars. A comprehensive assessment of regional ecological conditions, coupled with analysis of ecological quality trends and their driving mechanisms, provides a crucial foundation for regional ecological conservation and sustainable socio-economic development [2,3,4].
The Normalized Difference Vegetation Index (NDVI) has become an indispensable analytical tool in the comprehensive assessment of spatiotemporal variations in vegetation and analysis of environmental changes [5,6]. Methods such as the Pressure–State–Response (PSR) [7] and the Ecological Index (EI) [8] have also been applied to evaluate the evolutionary status of regional natural conditions. However, these research methods are relatively limited and have not been able to integrate natural and social factors in a single evaluation. The Remote Sensing Ecological Index (RSEI) [9,10] offers distinct advantages over conventional single-indicator methods and statistical evaluation approaches. By systematically integrating multiple ecological indicators and automatically weighting them according to their principal component contributions, the RSEI provides a more robust and objective framework for assessing spatiotemporal variations in ecological quality. Thus, the RSEI has become the dominant assessment model in recent ecological studies [11,12]. Chinese scholars have adopted the RSEI to assess ecological changes in various climatically representative regions, including the Yellow River Basin in the north [13], the Dianchi Lake Basin in the south [14], and the Lanxi urban agglomeration in the east [15], all yielding highly accurate results. At the same time, there are also good application examples in urban environmental assessment in Japan [16] and the eastern region of India [17]. This method has been widely applied around the world.
Previous studies have primarily focused on ecological assessments within individual river basins, while comprehensive evaluations of ecological impacts in inter-basin water diversion areas have been scarce. The Yangtze-to-Huaihe Water Diversion Project (YHWDP) region serves as a critical corridor connecting eastern and central China. Local water scarcity, coupled with high population density, has intensified the conflict between human development and the natural environment [18,19]. The purpose of this study is to evaluate the spatiotemporal changes in the ecological environment of the inter-basin area using the RSEI, explore the driving factors behind them, and predict future trends. This provides a scientific basis for the local government in the YHWDP region to implement targeted policies for protecting vegetation and the ecological environment

2. Study Area and Datasets

2.1. Study Area

The YHWDP is a major inter-catchment hydraulic engineering initiative that establishes hydrological connectivity between the Yangtze and Huaihe River basins [20]. It provides water supplies to 55 counties and districts across 15 cities in Anhui and Henan provinces. Construction of the YHWDP commenced in December 2016, with the trial operation of Phase I in the Anhui section initiated in December 2023. This project optimizes regional water resource allocation, alleviates water scarcity in parts of the Yangtze River Delta in Anhui, and enhances regional soil–water ecosystems and ecological functions [21].
The Anhui section of the Yangtze-to-Huaihe River Water Diversion Project is systematically divided into three hydraulically and geographically distinct segments (Figure 1), reflecting spatial heterogeneity in water resource allocation and engineering design principles. The Yangtze River–Chaohu Lake Water Diversion spans 7676.16 km2, encompassing critical nodes such as Tongcheng City (Anqing), Zongyang County (Tongling), and Lujiang County (Hefei). Adjacent to this, the Yangtze River–Huaihe River Connection covers 12,394.50 km2, linking Feixi County and Chaohu City (Hefei) with Huainan’s Tianjia’an District, Xiejiaji District, and Shou County. The Yangtze River Water Northward Conveyance extends across 12,437.29 km2, integrating water delivery infrastructure across Bozhou’s Qiaocheng District, Guoyang/Lixin/Mengcheng Counties, Fuyang’s Taihe County/Jieshou City/Linquan County/Yingquan–Yingdong Districts, and Huainan’s Fengtai County/Maoji Experimental Zone/Panji District. This tripartite division optimizes hydraulic efficiency through terrain-adaptive conduit geometries and flow parameter calibration, balancing large-area coverage with localized hydraulic stability while maintaining water transfer capacity across varying topographic gradients.

2.2. Datasets

The remote sensing data utilized in this study comprises Landsat 8 OLI satellite imagery procured from the Geospatial Data Cloud (https://www.gscloud.cn) spanning the vegetation growing season (April to July) from 2015 to 2024. Elevation data were obtained from the ASTER GDEM, which has a 30 m resolution. Using ENVI (5.6 version) software, preprocessing steps such as cloud removal, radiometric correction, atmospheric correction, and cropping were conducted. Additionally, water bodies were masked using the Modified Normalized Difference Water Index (MNDWI). All data were georeferenced to WGS 1984 UTM Zone 49 N with a spatial resolution of 30 m × 30 m to ensure consistency in spatial resolution and projection. Socioeconomic data, collected at the county/district level, were derived from statistical yearbooks and water resources bulletins of Anhui Province and its cities.

3. Methods

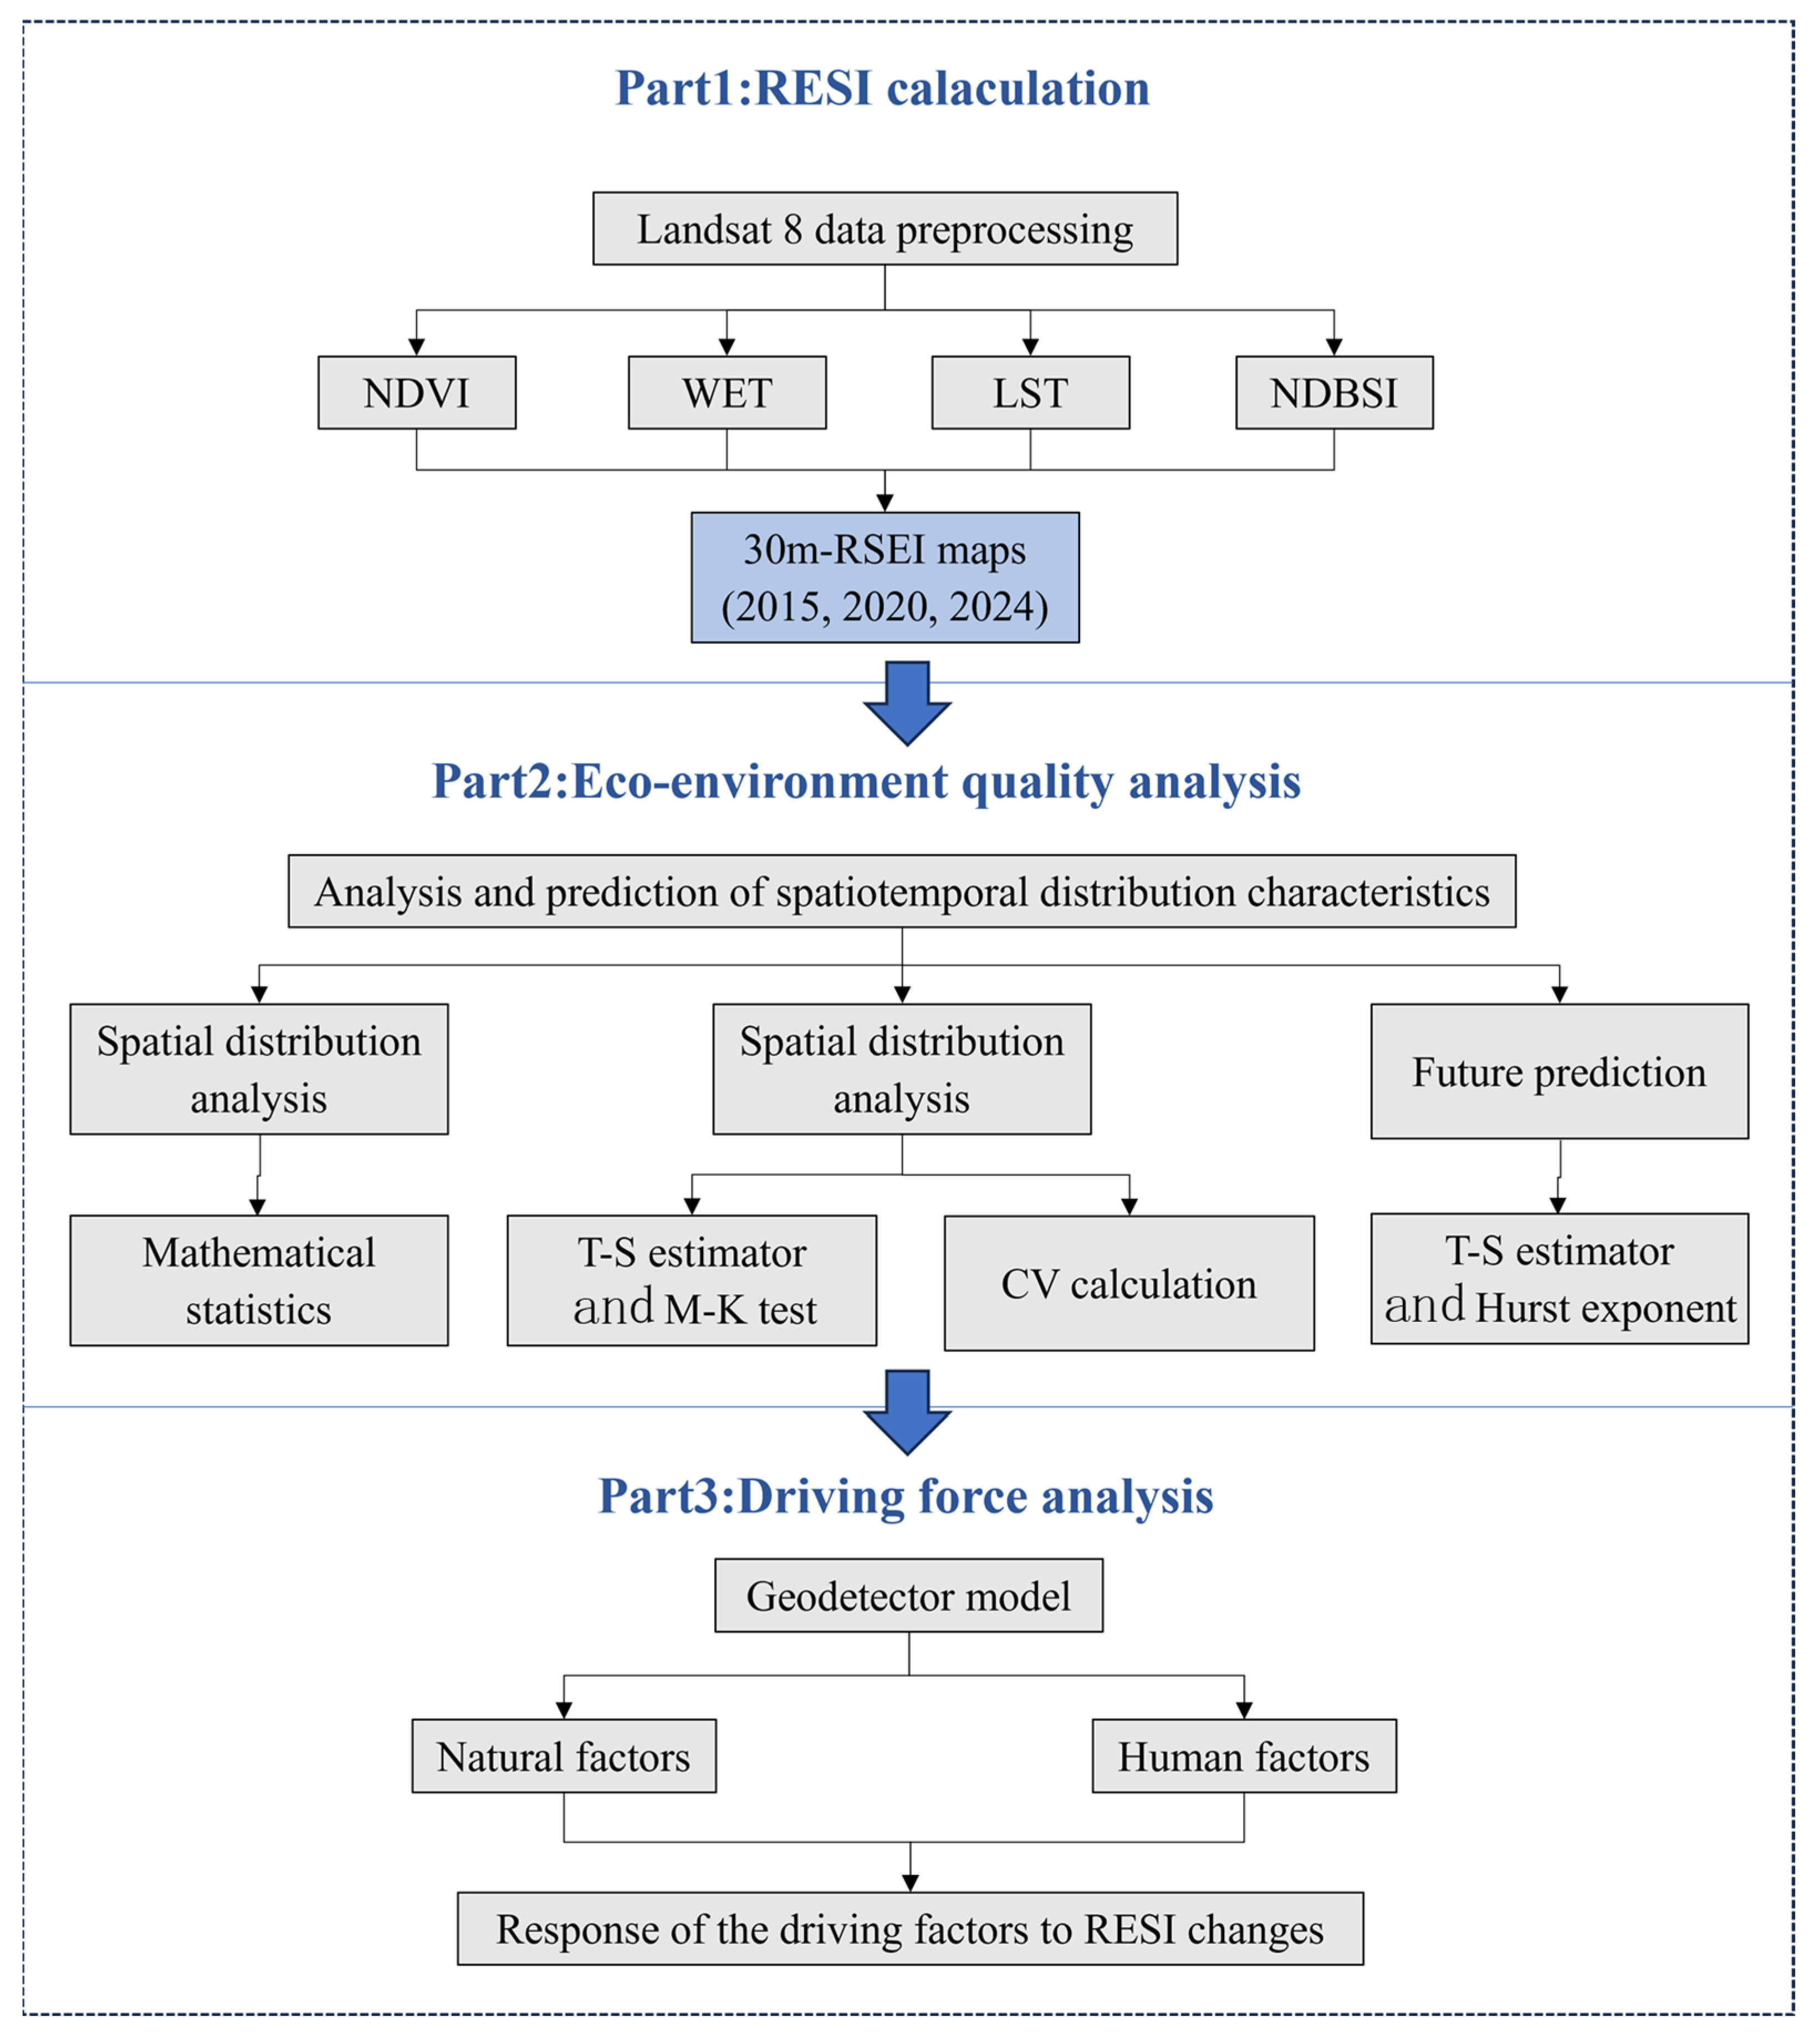
This study employs the Sen slope, Mann–Kendall trend analysis, and Hurst exponent to assess spatiotemporal variations in RSEI from 2015 to 2024 and predict future ecological trends. The geographical detector method was applied to quantitatively identify the spatial heterogeneity and underlying driving mechanisms of RSEI variations (Figure 2).

3.1. RSEI Model

As a comprehensive ecosystem assessment tool, the RSEI algorithm combines four fundamental environmental components: greenness, wetness, dryness, and heat, all of which are directly measurable through spectral analysis of satellite imagery. NDVI serves as an indicator of vegetation greenness and is utilized to demonstrate the state of the environment. WET stands for wetness. The Normalized Difference Built-up and Soil Index (NDBSI) characterizes land surface dryness. Land Surface Temperature (LST) reflects the local climate variations induced by environmental changes.
(1)
Retrieval of vegetation
NDVI serves as a widely adopted remote sensing metric for quantifying and monitoring vegetation growth and coverage status, mathematically defined as follows:
N D V I = ρ N I R ρ R ρ N I R + ρ R
where ρ N I R and ρ R represent the reflectance values in the near-infrared and red spectral bands, respectively.
(2)
Retrieval of land surface moisture
The wetness component serves as a spectral indicator of hydrological conditions, quantitatively characterizing moisture levels in three key surface features: soil matrix water retention, liquid water bodies, and vegetation water content. For Landsat OLI sensors, this component is derived through the following tasseled cap transformation formula:
W E T O L I = 0.151 ρ B + 0.1973 ρ G + 0.3283 ρ R + 0.3407 ρ N I R 0.7117 ρ S W I R 1 0.4559 ρ S W I R 2
(3)
Retrieval of land surface moisture
The accelerated urbanization process and intensive anthropogenic disturbances have triggered land surface modifications. Impervious surfaces and exposed soils progressively supplant natural vegetation cover, which induces ecological degradation. Hu and Xu developed NDBSI through spectral feature fusion, integrating the Index-based Built-up Index (IBI) and Soil Index (SI) as follows:
S I = ρ S W I R 1 + ρ R ρ N I R + ρ B ρ S W I R 1 + ρ R + ρ N I R + ρ B
I B I = 2 × ρ S W I R 1 / ( ρ S W I R 1 + ρ N I R ) ρ N I R / ( ρ N I R + ρ R ) + ρ G / ( ρ G + ρ S W I R 1 ) 2 × ρ S W I R 1 / ( ρ S W I R 1 + ρ N I R ) + ρ N I R / ( ρ N I R + ρ R ) + ρ G / ( ρ G + ρ S W I R 1 )
N D B S I = S I I B I 2
(4)
Retrieval of land surface temperature
LST was evaluated as follows:
L = g a i n × D N + b i a s
T b = K 2 l n K 1 L 1
L S T = T 1 + λ T ρ l n ε
λ denotes the spectral wavelength of terrestrial emitted radiance, ρ represents the first radiation constant (1.438 × 10− 2 m·K), ε characterizes the dimensionless land surface emissivity ranging from 0 to 1, and T indicates the at-satellite brightness temperature (K) measured through atmospheric window channels.
(5)
Acquisition of RSEI
Principal component analysis (PCA) was performed on the four components of the RSEI, namely the NDVI, WET, LST, and NDBSI, and the first principal component was defined as the RSEI0. The RSEI0 was then standardized to obtain the RSEI to facilitate the measurement as follows:
R S E I 0 = 1 P C 1 f N D V I , W E T , N D B S I , L S T
After normalization, RSEI is obtained, which is a unitless value between 0 and 1. The larger the value, the better the ecological quality of the region. The formula is as follows:
R S E I = R S E I 0 R S E I 0 , m i n R S E I 0 , m a x R S E I 0 , m i n
where RSEI0 is the first principal component of the four indicators; RSEI0,min is the minimum value of the RSEI0; and RSEI0,max is the maximum value of the RSEI0.
RSEI adopts a normalized scale ranging from 0 (degraded) to 1(optimal). The numerical magnitude exhibits a positive correlation with ecosystem health status. With an interval of 0.2, the levels of RSEI were classified into five groups: poor (0–0.2), fair (0.2–0.4), moderate (0.4–0.6), good (0.6–0.8), and excellent (0.8–1.0).

3.2. Combined T–S Estimator with M–K Test

The combined application of the Theil–Sen median trend analysis and the Mann–Kendall test provides a robust method for assessing trend changes in time series data. This method exhibits stronger resistance to errors and outliers in the data, thereby enhancing analytical accuracy. It evaluates trends by calculating the median of slopes between all pairwise data points, with the mathematical formula expressed as follows:
β = M e d i a n R S E I j R S E I i j i ,   2015 i < j 2024
where median denotes the median value; β is the slope of RSEI change. When the coefficient β is greater than zero, it indicates an upward (improving) trend in RSEI; conversely, a negative β value (β < 0) suggests a downward trend.
The Mann–Kendall test is a non-parametric statistical method that can be applied to determine the significance of trends in time series data. It imposes no distributional assumptions on the data and is robust against outliers. The test statistic is calculated as follows:
Z = S 1 / v a r S , S > 0 S + 1 / v a r S , S < 0
S = i = 1 n 1 j = i + 1 n s g n R S E I j R S E I i
s g n R S E I j R S E I i = 1 ,   R S E I j R S E I i > 0 0 , R S E I j R S E I i = 0 1 , R S E I j R S E I i < 0
v a r S = n n 1 ) ( 2 n + 5 / 18
where n is the length of the time series, sgn () denotes the sign function; Z is the significance test statistic, whose value ranges from (−∞, +∞).
The trend categories for the Theil–Sen (T–S) estimator and Mann–Kendall (M–K) test are summarized in Table 1.

3.3. Coefficient of Variation (CV)

The coefficient of variation (CV) reflects the relative variation in geographic data and serves as a critical indicator for measuring the stability of a time series. By calculating the ratio of the standard deviation to the mean, it quantifies the relative variability of a variable, making it widely applicable for assessing the degree of variation in time series data. Therefore, the CV is employed to analyze the stability of the RSEI. The calculation formula is as follows:
C V = σ μ
CV denotes the coefficient of variation, σ represents the standard deviation of the RSEI time series, and μ represents the average value of the RSEI time series. A lower CV value indicates more stable interannual variations in the RSEI, while a higher CV value suggests greater volatility in its year-to-year fluctuations.

3.4. Hurst Exponent

The Hurst exponent (H), obtained through rescaled range analysis, serves as a metric for characterizing the long-term dependence and persistence of time series data. The Hurst exponent (H, 0 < H < 1) is generally divided into three cases: 0.5 < H < 1 indicates long-term memory effects, meaning the future trend will align with the past; H = 0.5 indicates that the time series is an independent random sequence; and 0 < H < 0.5 exhibits anti-persistent dynamics, suggesting that the future trend will likely reverse past patterns (Table 2).

3.5. Quantitative Analysis Methods for Geospatial Differentiation

The Geographical Detector (GeoDetector) represents a spatially explicit statistical framework designed to quantify spatial heterogeneity and identify its underlying driving factors. The formula for spatial differentiation and driving force detection is expressed mathematically as follows:
q = 1 h = 1 L N h σ h 2 N σ 2
L denotes the stratification (or classification/partitioning) of either variable Y or explanatory factor X, Nh represents the sample size within stratum h and N corresponds to the total population size, respectively. The terms σh2 and σ2 indicate the variances of Y-values within stratum h and across the entire study region, respectively. The q-statistic spans a range from 0 to 1, where a higher value indicates a greater degree of spatial heterogeneity in Y. If the stratification is based on the independent variable X, elevated q-values further imply greater explanatory capacity of X regarding Y’s spatial distribution. Detailed interaction effects are presented in Table 3.

4. Results

4.1. RSEI Model Applicability Validation

PCA was employed to reduce the dimensionality of the dataset while retaining the most significant variance among the ecological indicators, facilitating a comprehensive assessment of the RSEI framework. The first principal component (PC1) accounts for 78.0% to 84% of the total variance, as shown in Table 4, indicating that it effectively captures the dominant features of the four indicators.

4.2. Spatial Distribution of EEQ

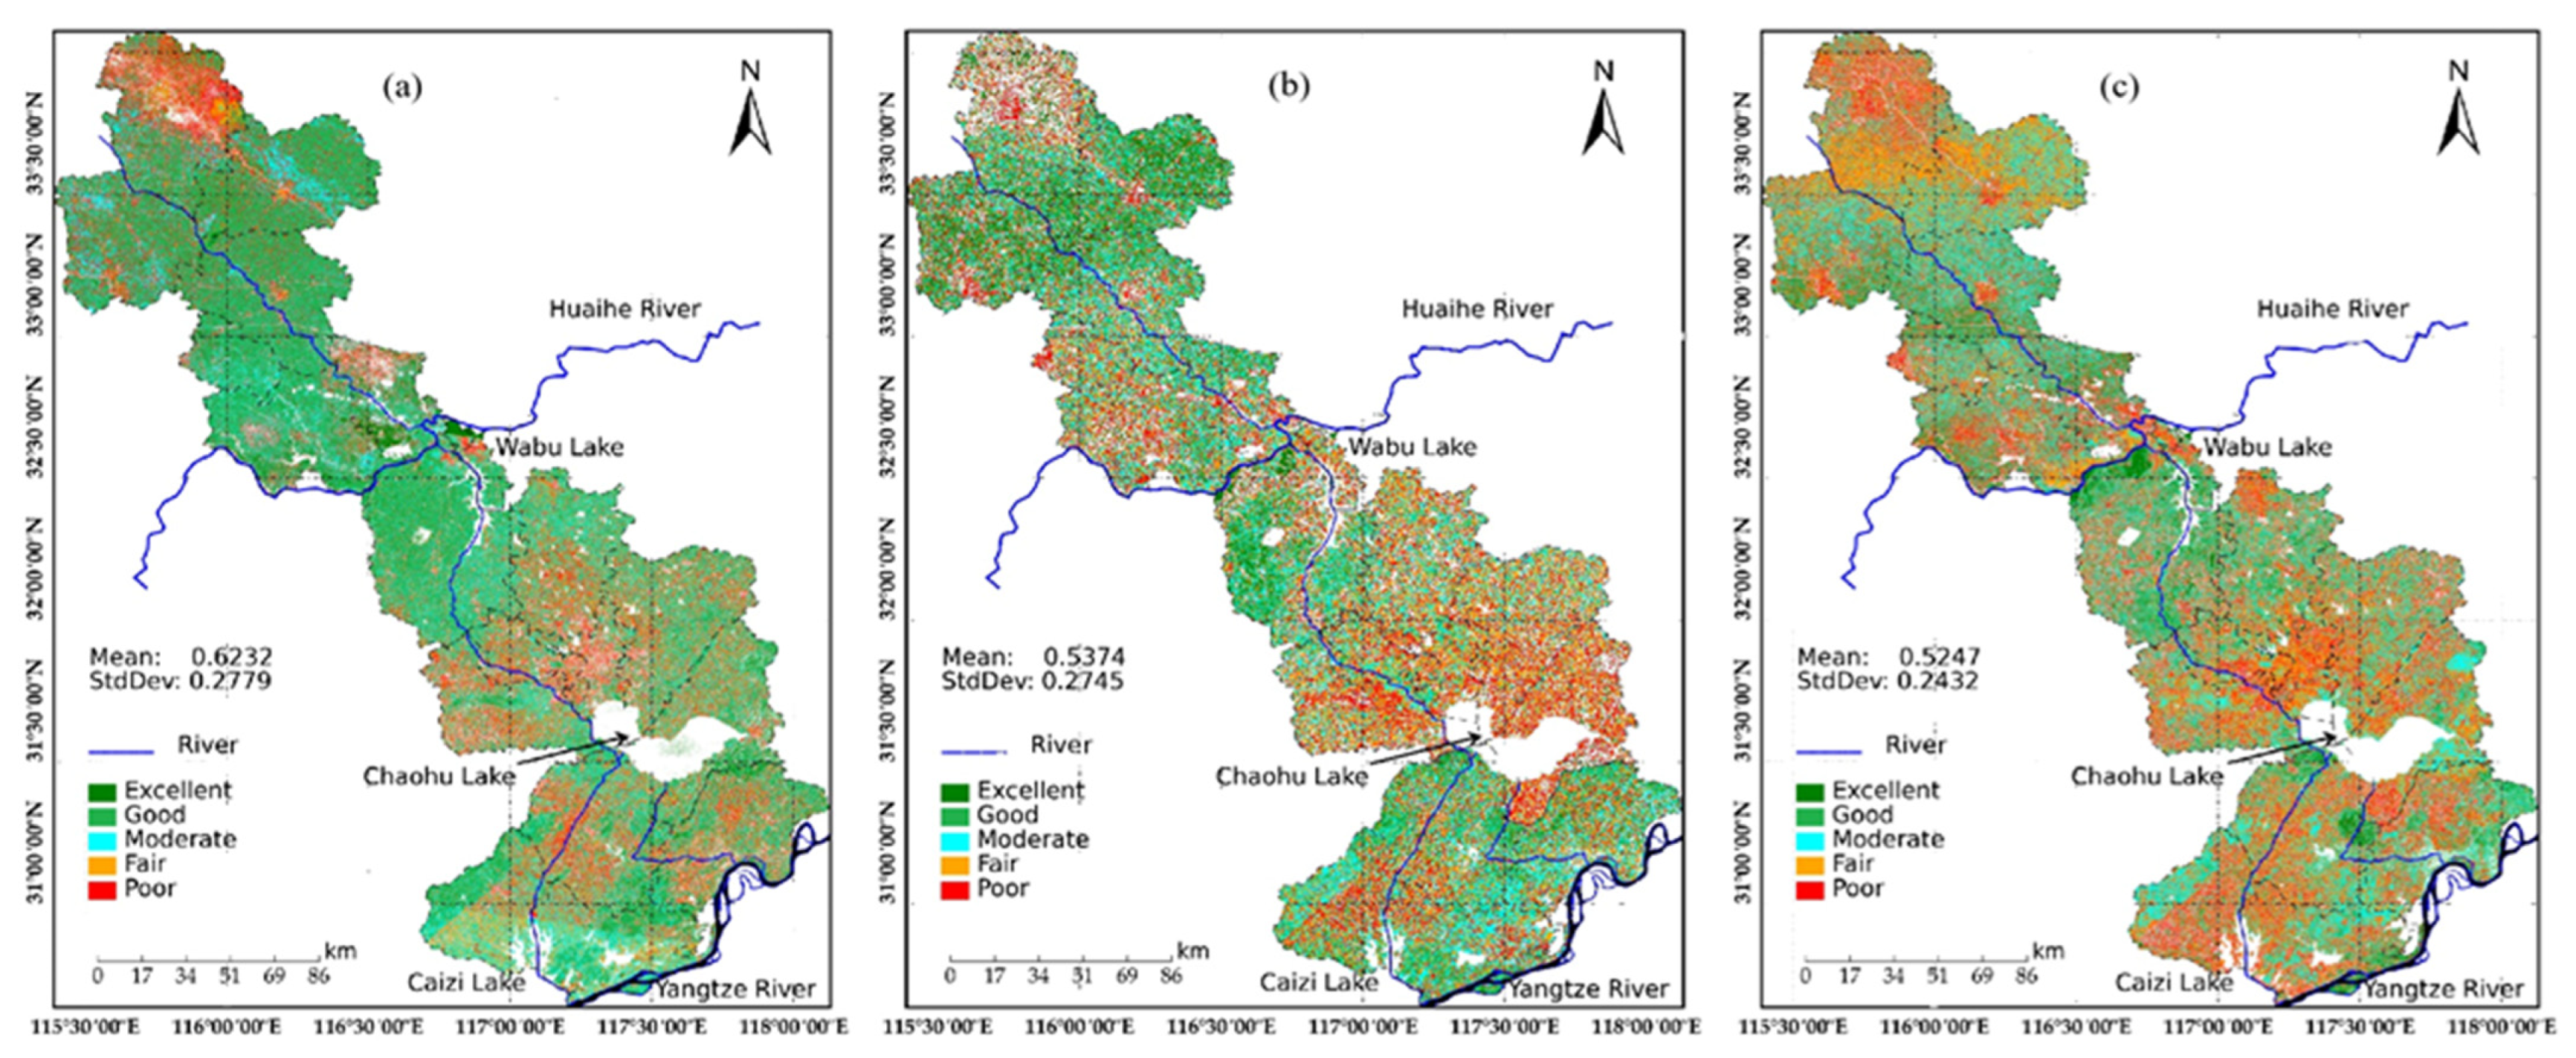
The RSEI values were categorized into five distinct ecological quality tiers using the Jenks optimization method, with the following categorical designations: Poor (0–0.2), Fair (0.2–0.4), Moderate (0.4–0.6), Good (0.6–0.8), and Excellent (0.8–1.0). The RSEI in the water source protection areas along the Anhui section of the YHWDP exhibits a spatial distribution pattern characterized by lower values in the western and northern regions and higher values in the eastern and southern regions (Figure 3).
Significant differences and dynamic trends are observed among the three segments: Yangtze River–Chaohu Lake Water Diversion, the Yangtze River–Huaihe River Connection, and the Yangtze River Water Northward Conveyance. According to Table 5, the proportions of poor and fair RSEI zones in 2024 are 8.45% and 21.97%, respectively, while the combined area of Grade 1–3 zones (representing better ecological conditions) accounts for 65.98%. The mean RSEI values across grades initially increased and then declined over time. For example, Grade 4 (moderate ecological status) shows a decreasing trend: 0.6232 (2015), 0.5374 (2020), and 0.5247 (2024).
The ecological quality assessed by RSEI remains at a median quality level (RSEI = 0.4–0.6), with mean values of 0.4026 in 2015, 0.6917 in 2020, and 0.6917 in 2024. However, the Yangtze River–Chaohu Lake Water Diversion shows an overall improving trend in RSEI-based ecological quality (Figure 4). Spatially, high RSEI values are concentrated along the YHWDP channels, the Yangtze River banks, the southern shore of Chaohu Lake, and surrounding water bodies.
As shown in Figure 5, the ecological quality assessed by RSEI remains at a poor level, though the area with significantly low RSEI in the Yangtze River–Huaihe River Connection shows a shrinking trend. The mean RSEI values for the Yangtze River–Huaihe River Connection are 0.4821 (2015), 0.5147 (2020), and 0.4789 (2024). Notably, Wuwei County, Shushan District, and Xiejiaji District exhibit a yearly decline in RSEI, indicating a persistent deterioration in their ecological environments. Spatially, RSEI degradation is concentrated in the southern regions. For example, the Binhu New District shows fragmented ecological quality distribution (marked by red patches), likely linked to lake reclamation or over-tourism development. In contrast, areas with high ecological quality are predominantly clustered along the southern shore of Lake Wabu.
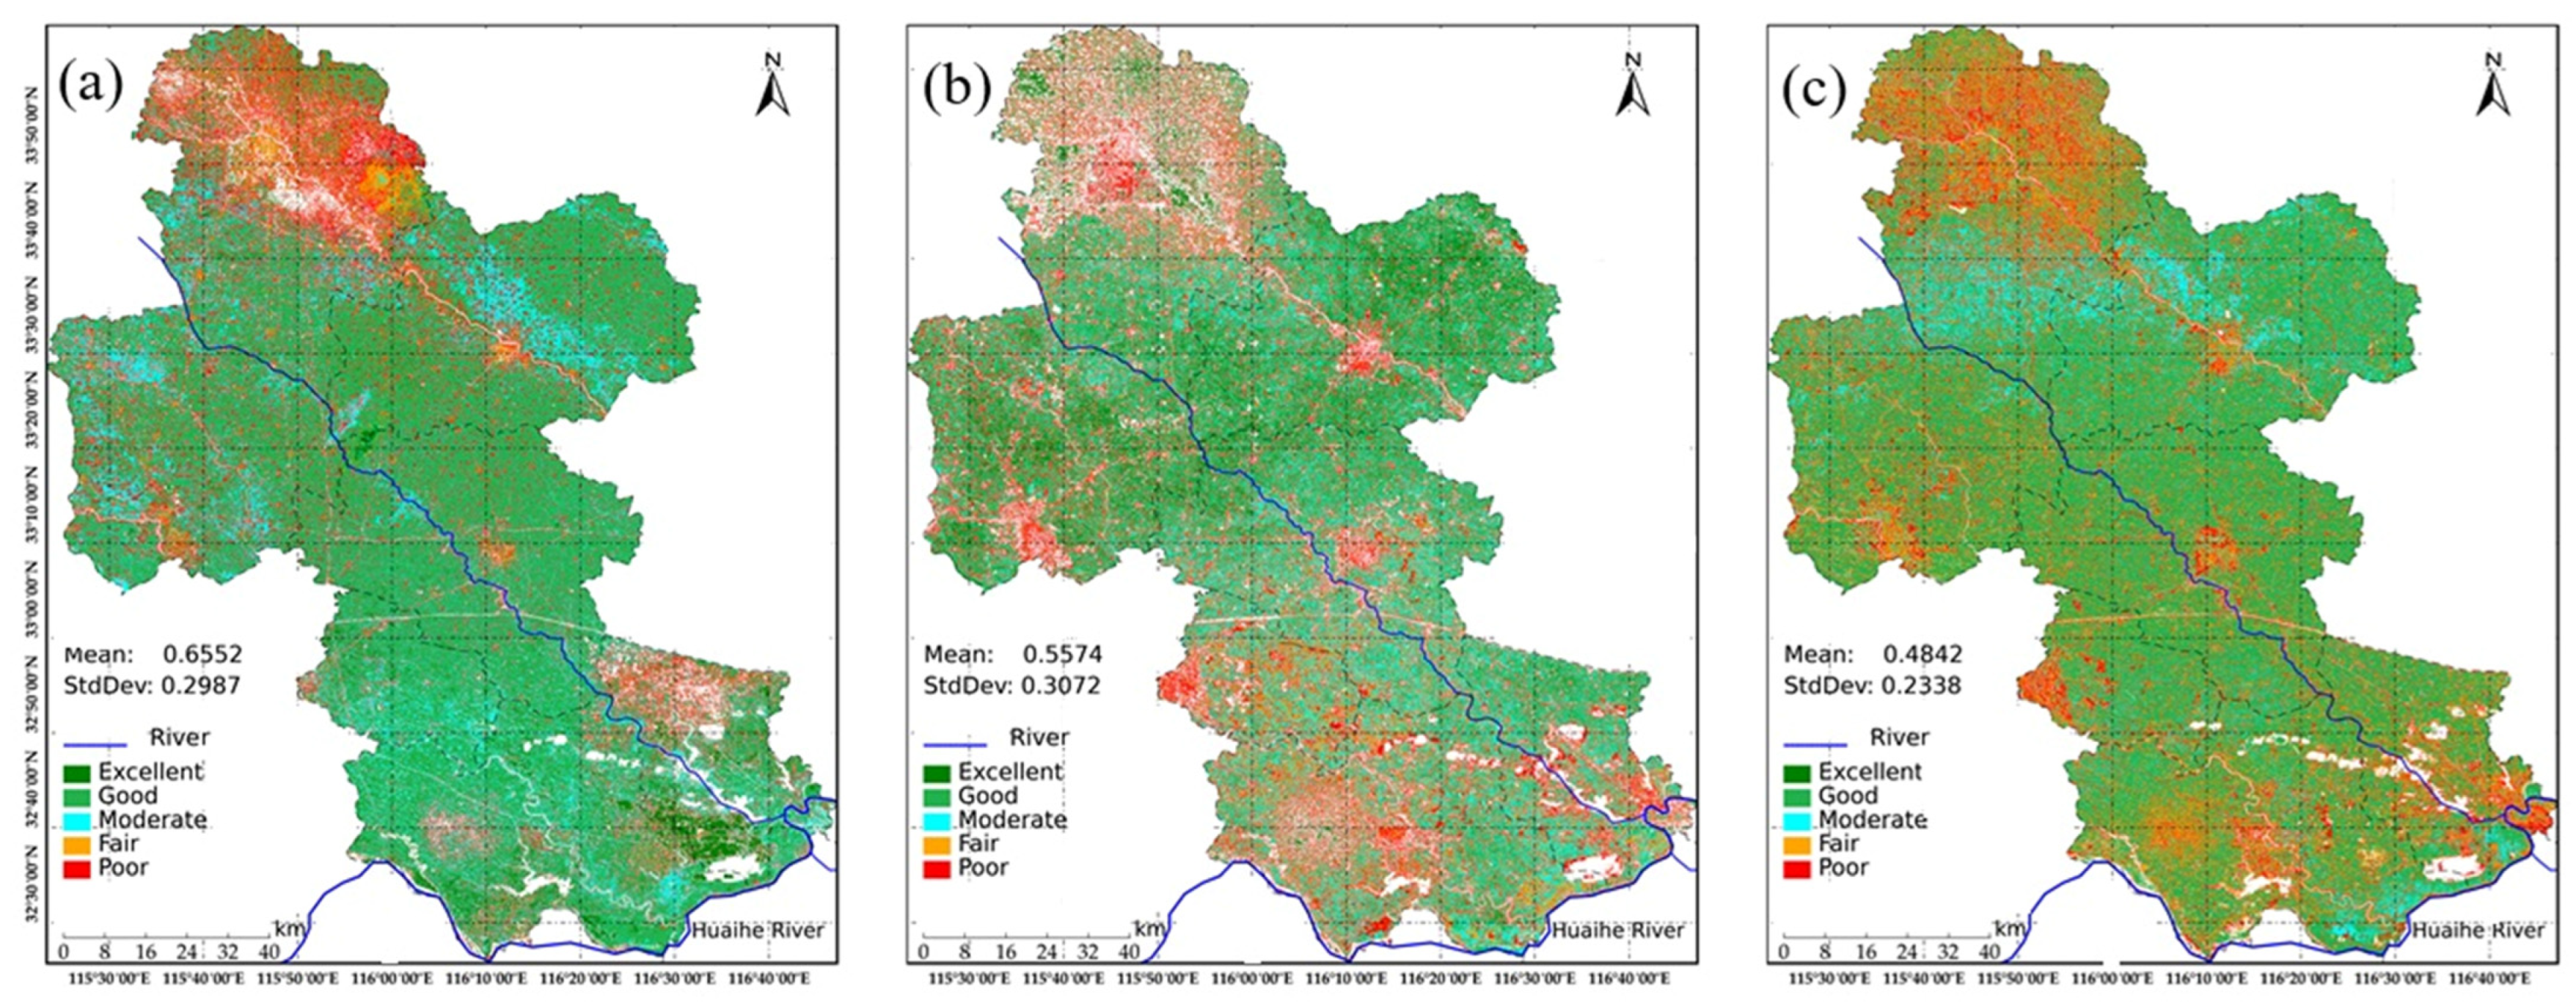
As shown in Figure 6, the RSEI index reflects an overall declining trend in regional ecological quality. The mean RSEI values are 0.6552 (2015), 0.5577 (2020), and 0.4842 (2024), indicating progressive deterioration. However, certain areas still exhibit significantly poor ecological conditions. JiaoCheng District, Wuoyang County, and Yingshang County experienced a transition from “good” to “moderate” and finally to “poor” RSEI levels, signaling sustained degradation in ecological quality. Panji District shows a year-on-year decline in RSEI, with its ecological environment worsening markedly.

4.3. Spatial Change Characteristics of EEQ

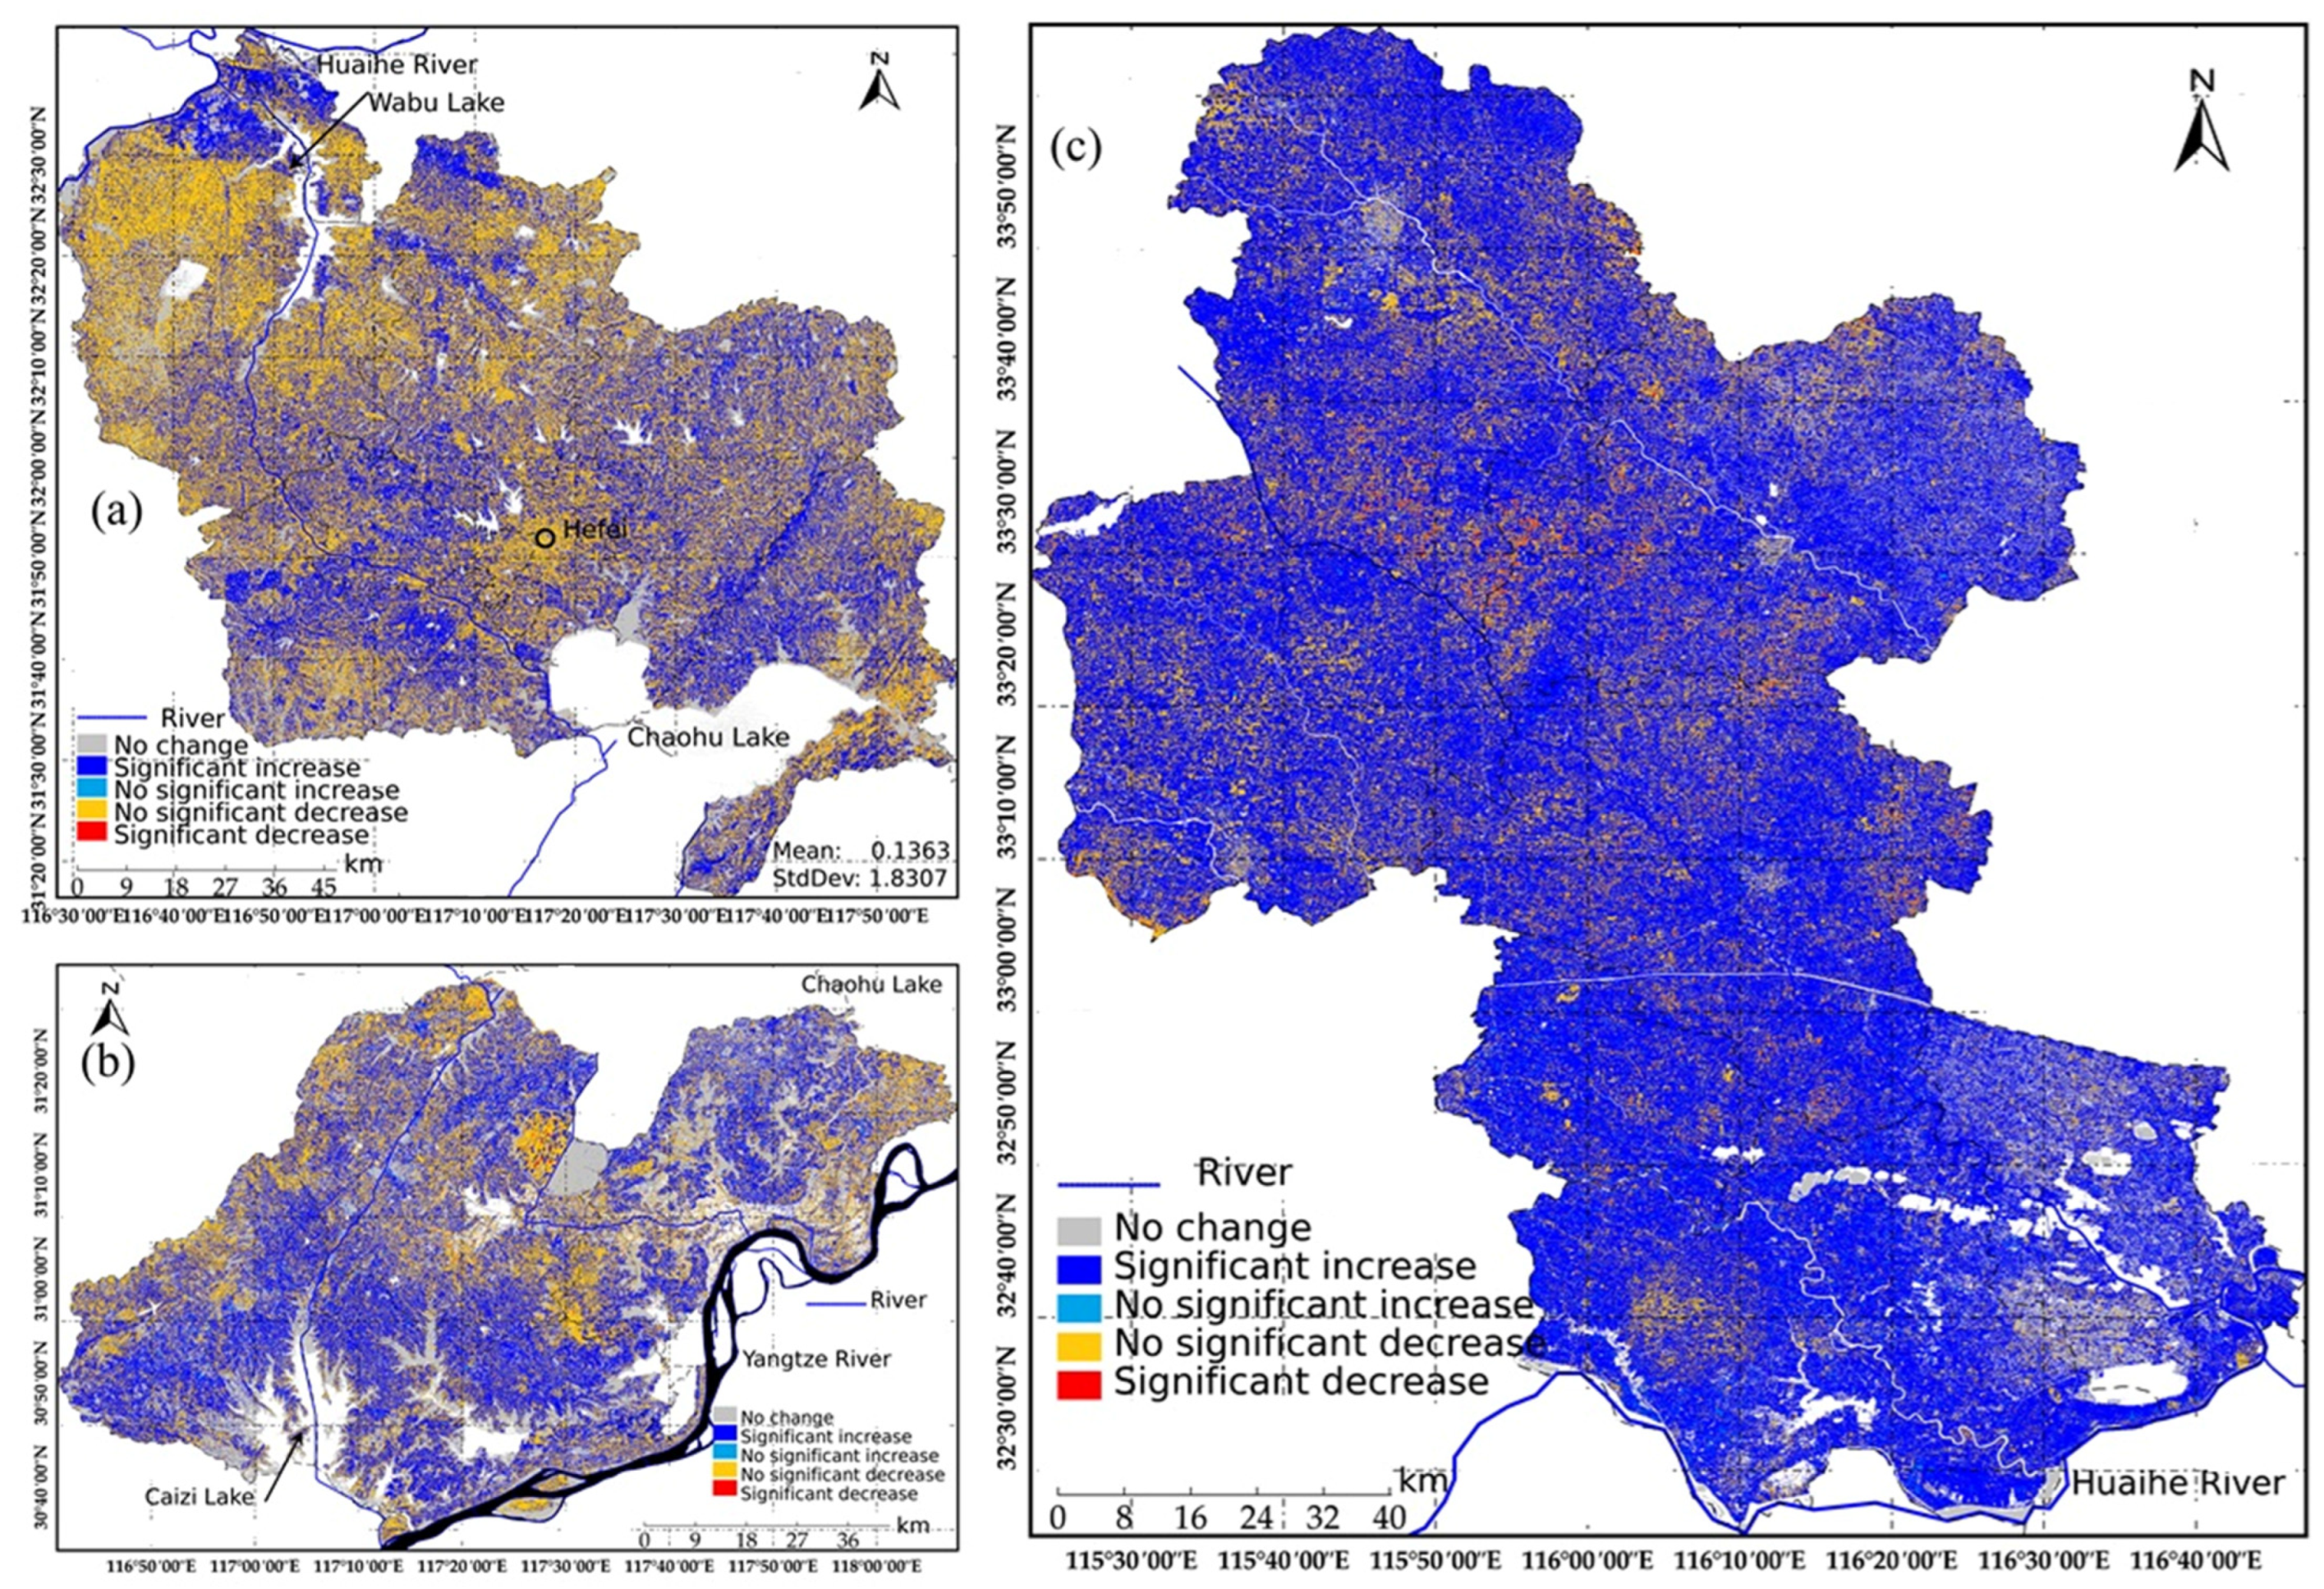
A combined non-parametric approach integrating the T–S estimator and M–K test was systematically applied to investigate spatiotemporal variations in Ecological Environment Quality (EEQ) along the Anhui segment of the YHWDP during the period 2015–2024 (Figure 7, Table 6).

4.4. Spatial Stability of the RSEI

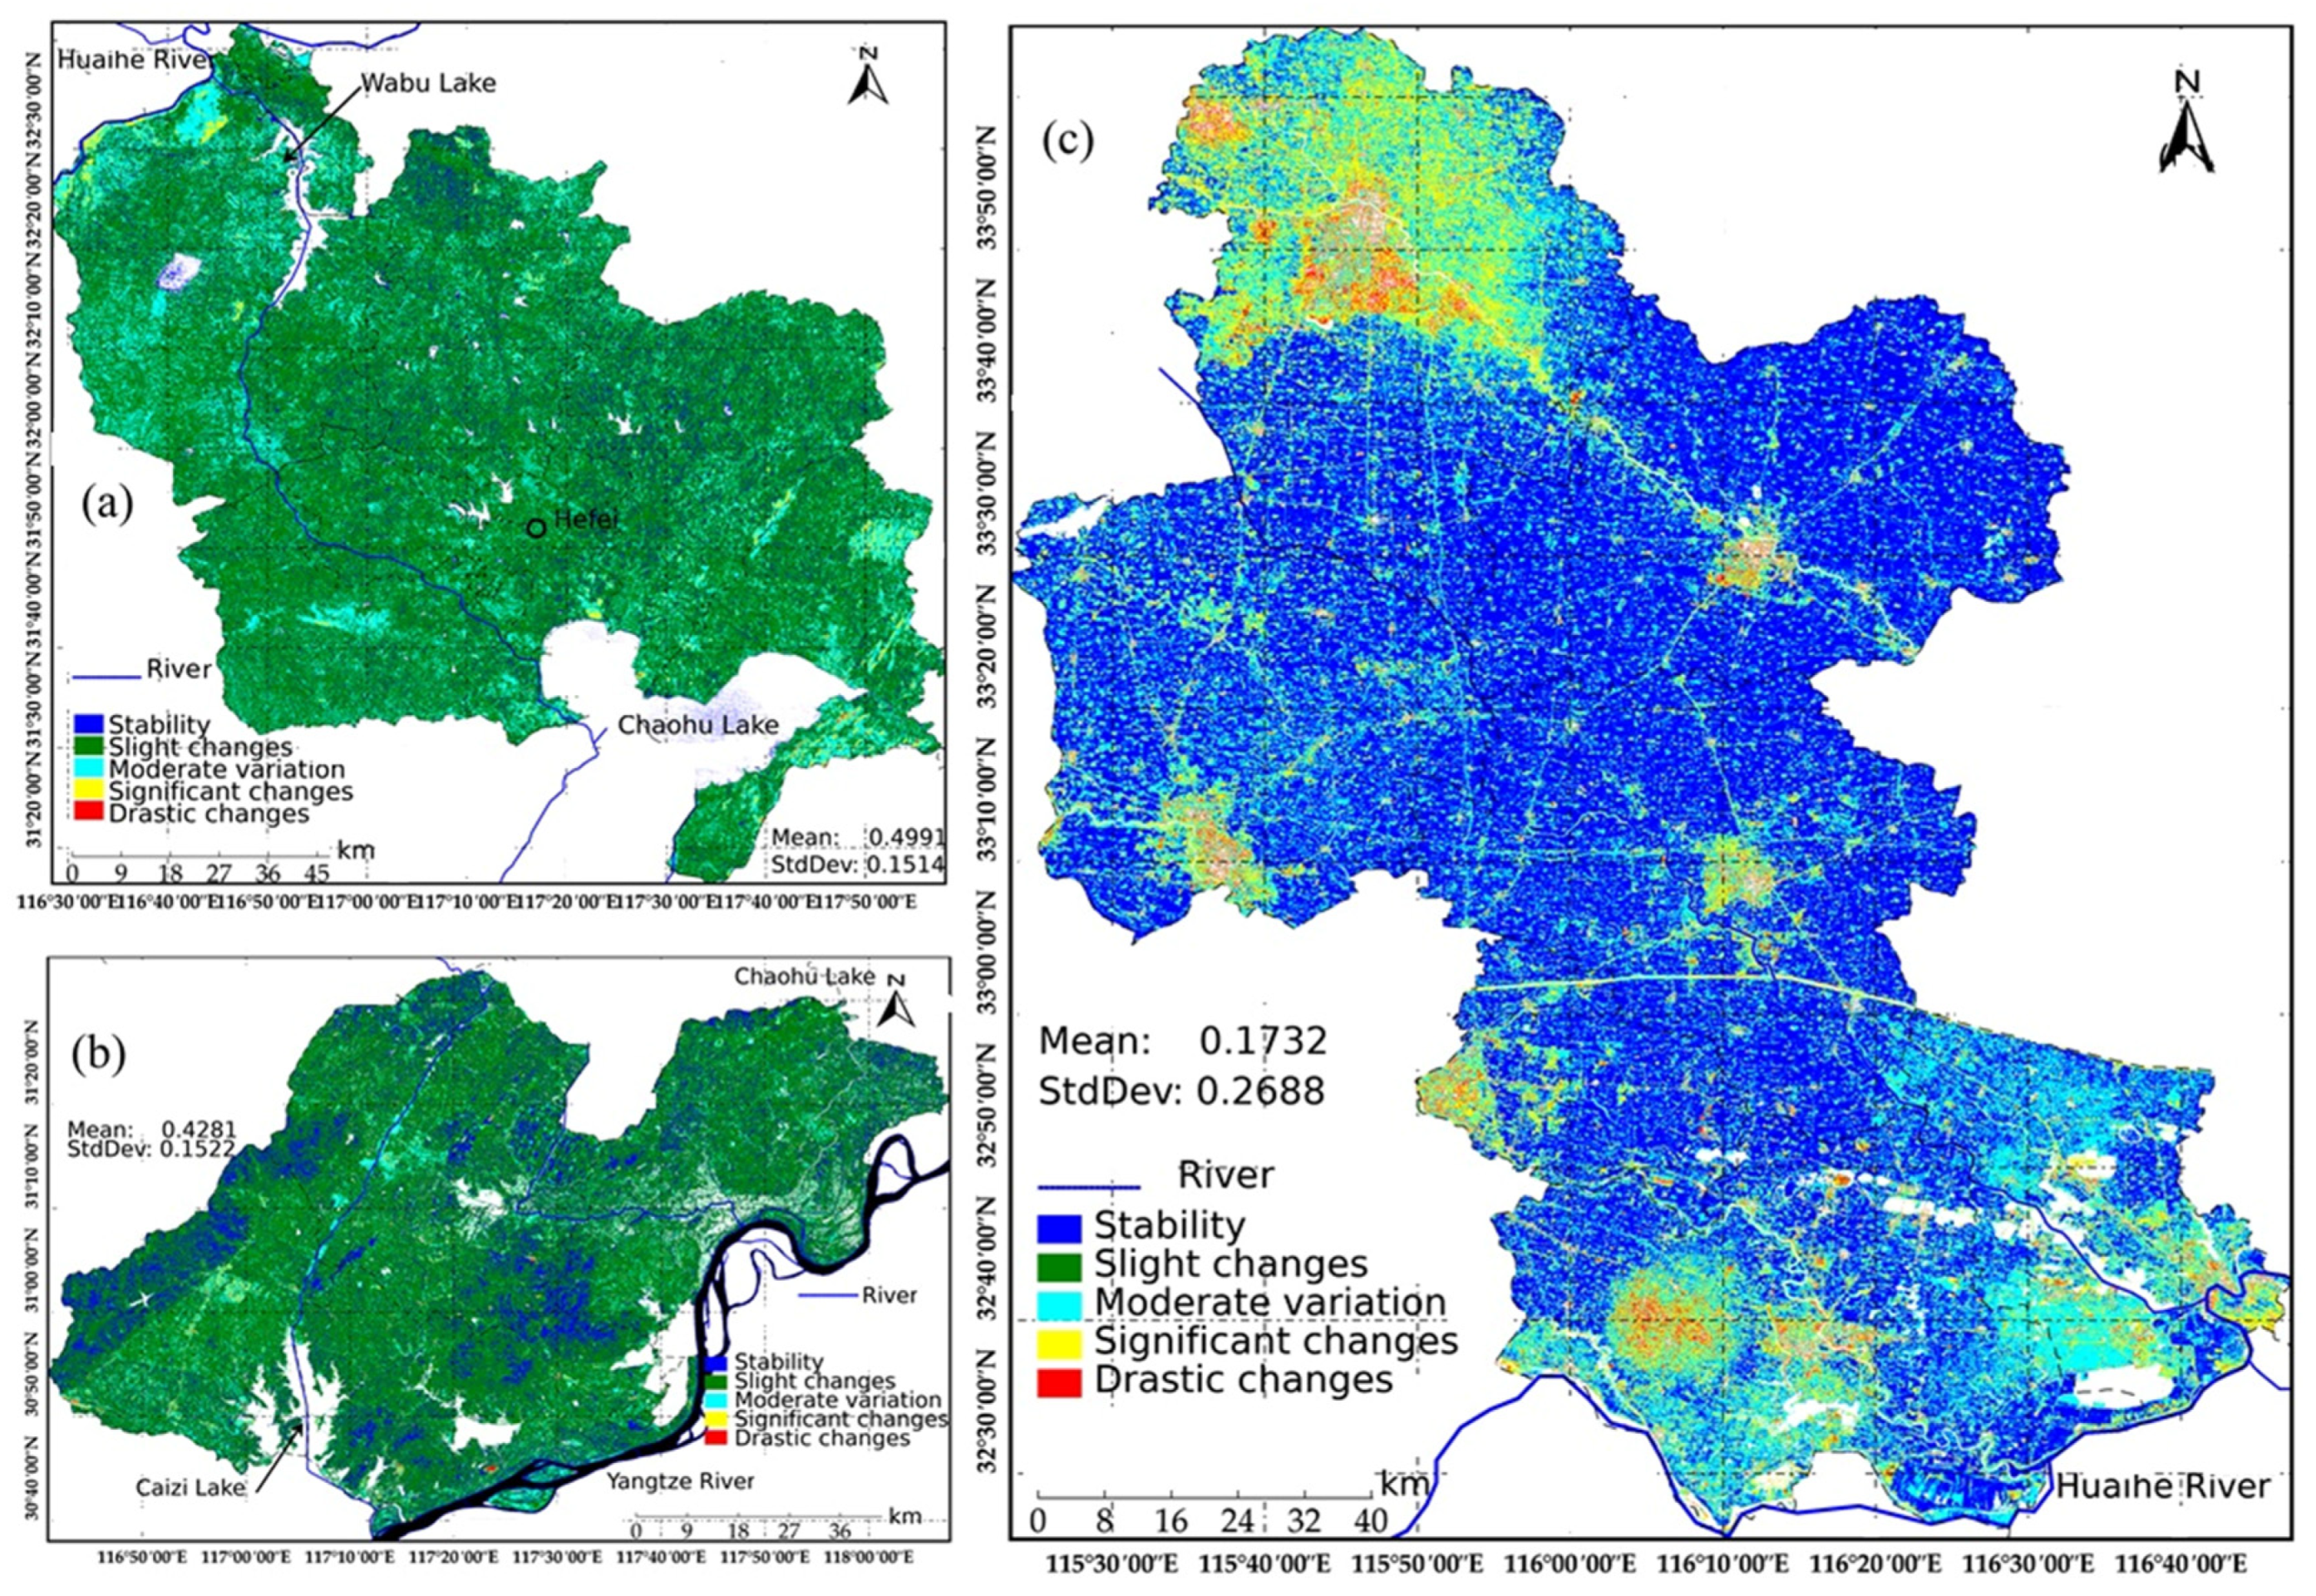
The EEQ fluctuations in the water source protection areas along the Anhui segment of the YHWDP main water conveyance route were analyzed using the coefficient of variation (CV) of the RSEI. The variability was categorized into five levels via the natural breaks method (Jenks): Stability (CV ≤ 0.30); Slight changes (0.30 < CV ≤ 0.60); Moderate variation (0.60 < CV ≤ 0.90); Significant changes (0.90 < CV ≤ 1.20); and Drastic changes (1.20 < CV ≤ 1.50). This classification procedure yielded a comprehensive spatial-temporal visualization of RSEI CV patterns throughout the study region during the period 2015–2024 (Figure 8).
The average coefficient of variation (CV) for RSEI changes was 0.4281, indicating that slight fluctuation (66.57%) and moderate fluctuation (9.24%) dominated the overall variability, collectively accounting for 75.81% of the study area (Table 7). Extreme fluctuation zones (CV > 1.2) represented 0.2% of the total area and were concentrated near Caizi Lake, water conveyance channels, and the north bank of the Yangtze River, particularly in the paddy fields highlighted in Figure 8a.
As shown in Figure 8b, the mean coefficient of variation (CV) for RSEI changes was 0.4991, indicating slight fluctuation (66.28%) as the dominant variability category, followed by moderate fluctuation (20.23%), collectively accounting for 86.51% of the study area. Pronounced RSEI variability was primarily distributed in lake-, river-, and pond-dense regions, particularly around Hefei City. These patterns likely stem from the interplay of topographic complexity, climatic variability, and intense human activities (e.g., urban sprawl).
As shown in Figure 8c, the average coefficient of variation (CV) for RSEI changes was 0.1732, with slight fluctuation, moderate fluctuation, and higher fluctuation collectively accounting for 41.74% of the study region. Pronounced RSEI variability was predominantly found in the northern Huaihe River Basin, where intensive agricultural activities have led to significant anthropogenic disturbances.
The ecological environment quality across the study region predominantly exhibited slight to moderate fluctuations, with coefficient of variation (CV) values of 0.4281 for the Yangtze River–Chaohu Lake Water Diversion, 0.4991 for the Yangtze River–Huaihe River Connection, and 0.1732 for the Yangtze River Water Northward Conveyance. By aggregating stable and slightly fluctuating zones, the stability ranking was: Yangtze River–Huaihe River Connection (86.51%) > Yangtze River–Chaohu Lake Water Diversion (78.81%) > Yangtze River Water Northward Conveyance (29.79%).

4.5. Prediction of Future Trends in Ecological Environment Quality

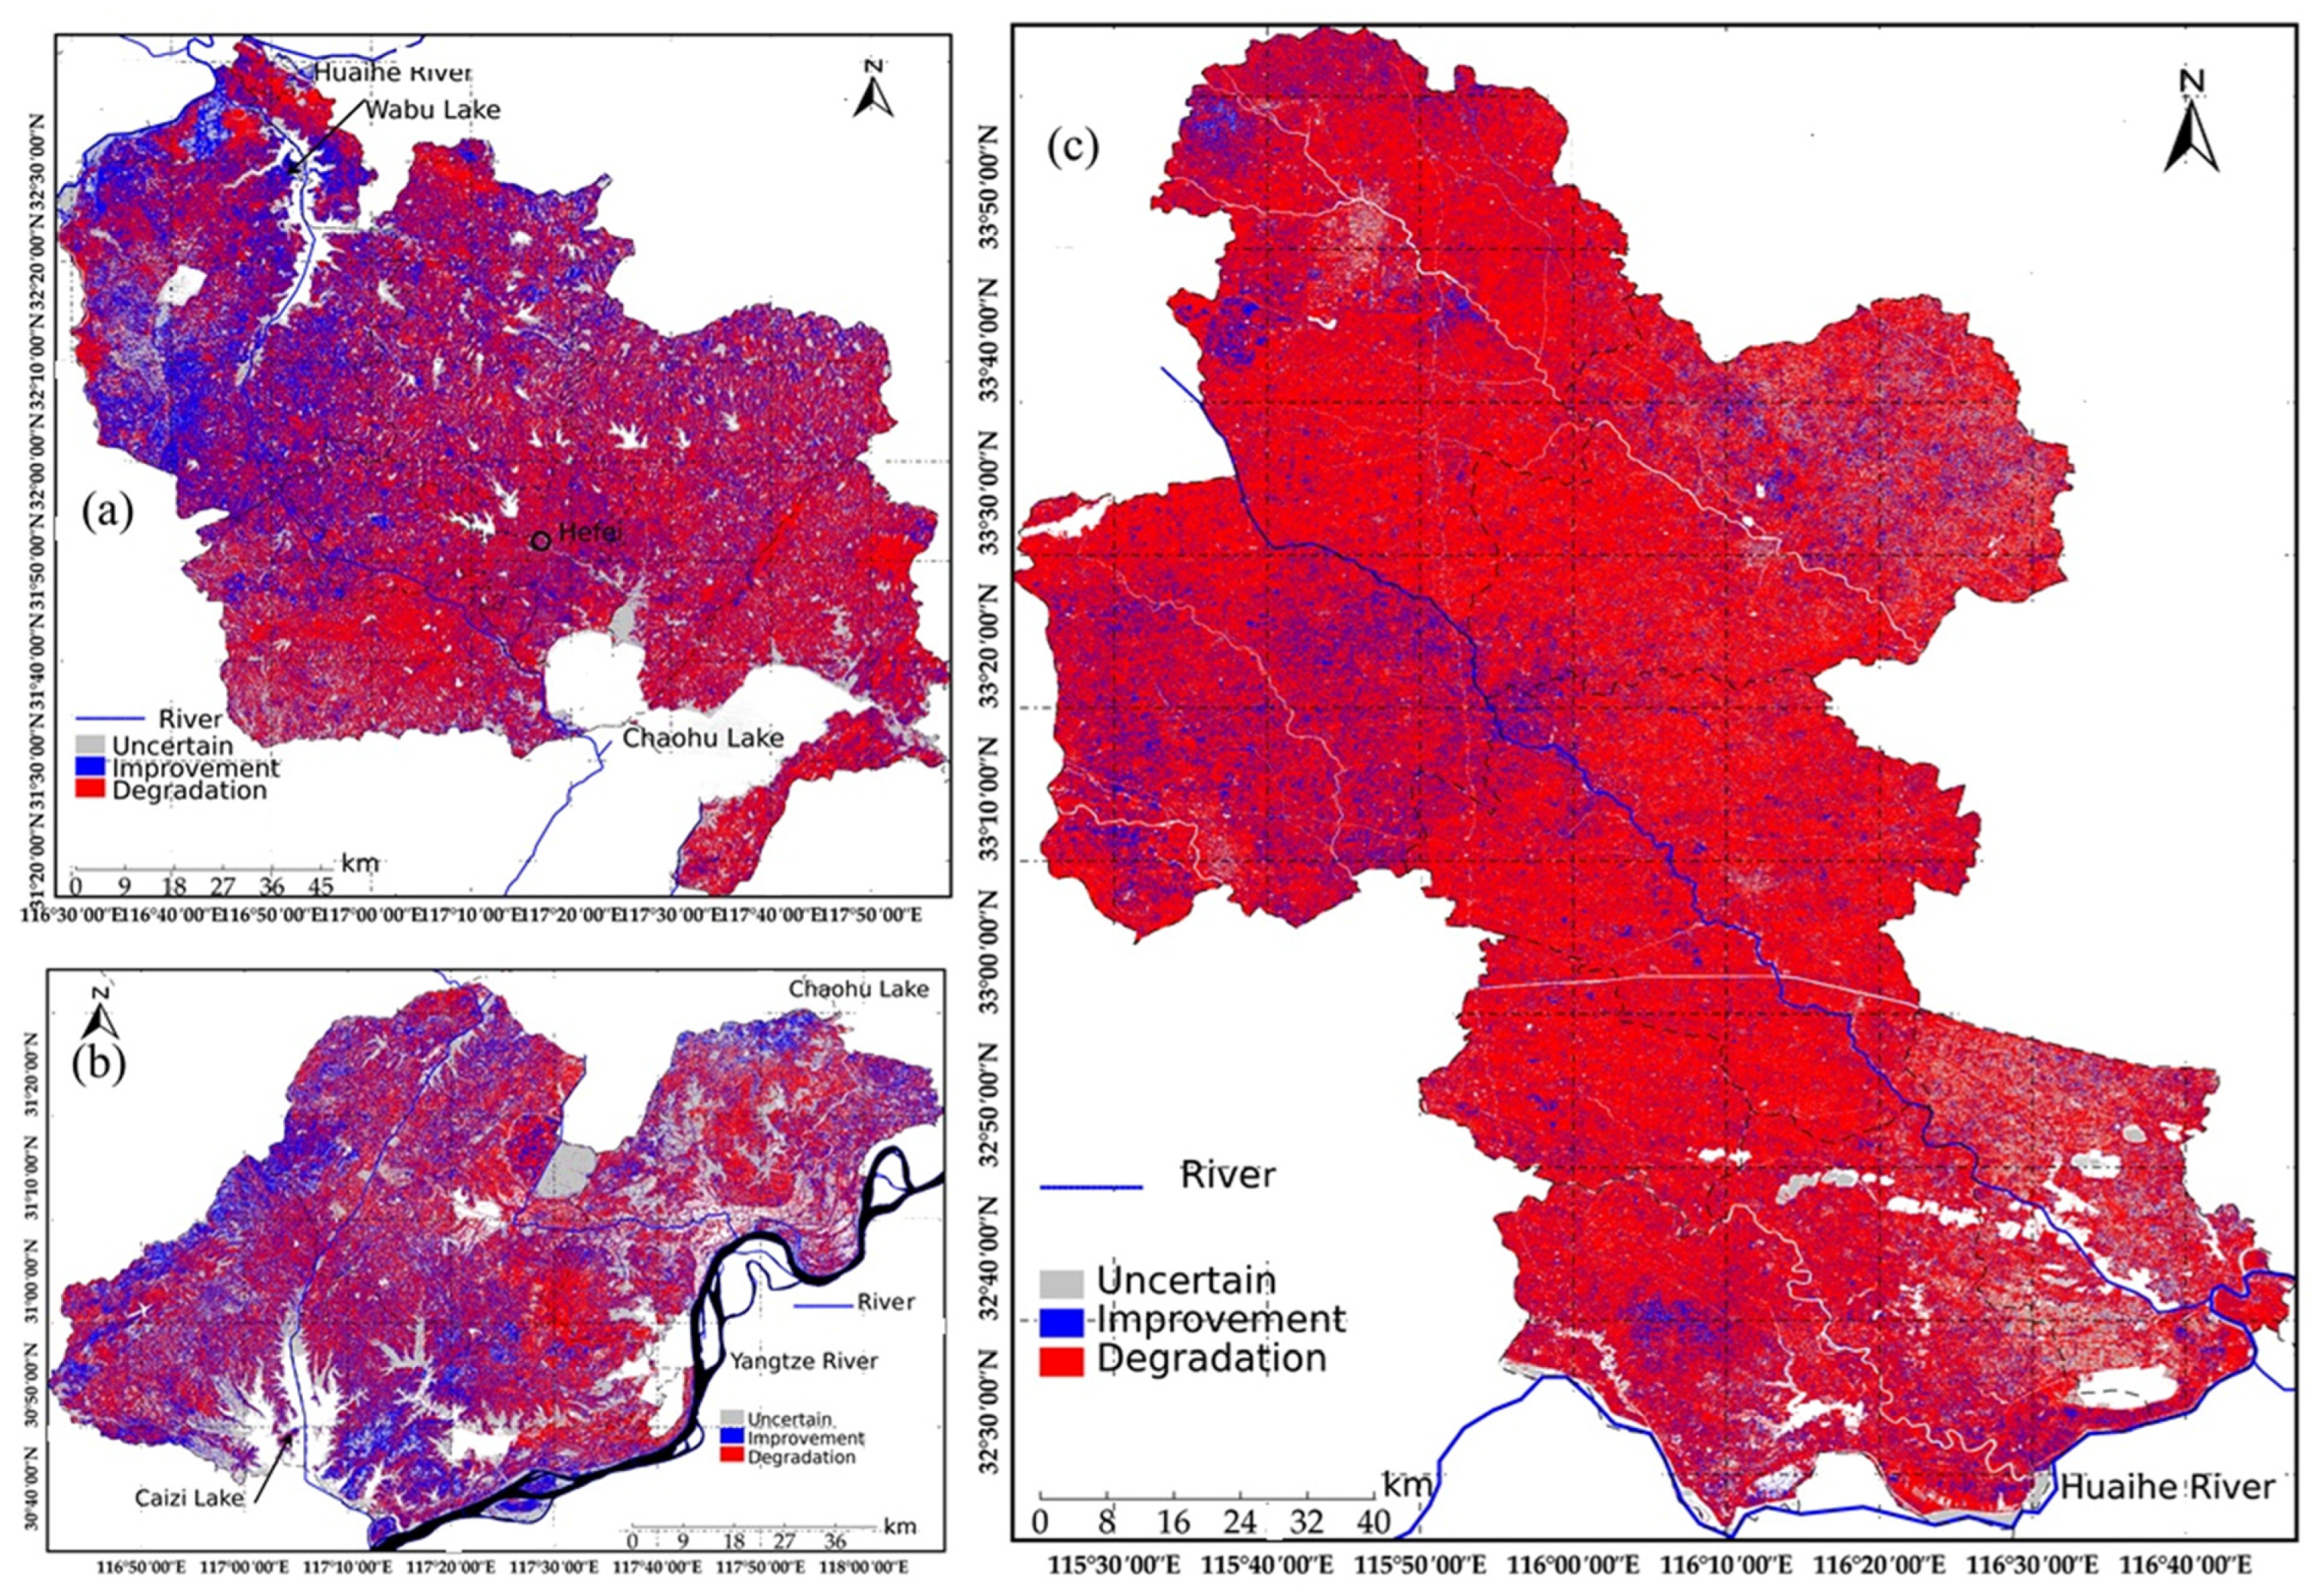
Yangtze River–Chaohu Lake Water Diversion: The RSEI exhibited an average Hurst index of 0.5319, indicating a moderate persistence in ecological quality trends. It suggests that 27.78% of the study area is likely to experience enhanced ecological conditions, while 38.38% may face sustained deterioration (Figure 9).
Yangtze River–Huaihe River Connection: The RSEI analysis reveals an average Hurst index value of 0.5428. Approximately 30.02% of the study area is anticipated to undergo ecological improvement, while a more substantial proportion (49.49%) is expected to experience continued degradation (Table 8).
Yangtze River Water Northward Conveyance: The average Hurst index of RSEI is 0.6327, with only 14.11% of areas likely to improve, while 72.06% are expected to worsen persistently. Significant RSEI variations are concentrated in the northern Huaihe, where intensive farming leads to pronounced human disturbance.
Overall Trend: The future ecological environment quality of the study region is generally pessimistic (Figure 10). The average Hurst indices are 0.5319 for Yangtze River–Chaohu Lake Water Diversion, 0.5428 for Yangtze River–Huaihe River Connection, and 0.6327 for Yangtze River Water Northward Conveyance. The projected deterioration follows this order: Yangtze River Water Northward Conveyance (72.06%) > Yangtze River–Huaihe River Connection (49.49%) > Yangtze River–Chaohu Lake Water Diversion (38.38%).

4.6. Quantitative Attribution Analysis of Driving Factors for Spatial Differentiation of RSEI

Integrating the natural and socioeconomic conditions of the water source conservation areas along the Jianghuai Water Diversion Project’s Anhui Section, this study selected ten variables—including population, GDP (Gross Domestic Product), built-up area, precipitation, and mean NDVI—as influencing factors for correlation analysis with the RSEI. The Geodetector method was employed to analyze the driving mechanisms behind dynamic changes in EEQ. The independent variables (X) include the following: X1: Annual mean temperature (°C); X2: Annual mean precipitation (mm); X3: Vegetation coverage (%); X4: Mean NDVI; X5: Elevation (m); X6: Slope (°); X7: Built-up area; X8: Land Surface Temperature (LST); X9: GDP per unit area (10,000 yuan/km2); X10: Population density (persons/km2).
The analysis of critical topographic parameters across the three major water diversion segments reveals distinct geomorphological characteristics (Table 9). The Yangtze River–Chaohu Lake Water Diversion exhibits the highest mean elevation (49.32 m) and steepest mean slope (5.16°), indicating significant terrain complexity that may influence hydraulic dynamics and sediment transport patterns. In contrast, the Yangtze River–Huaihe River Connection features a moderate elevation (38.20 m) and gentler slope (2.77°), favoring efficient water conveyance over long distances while requiring vigilance against anthropogenic disturbances in low-lying zones. The Yangtze River Water Northward Conveyance, with the lowest elevation (30.68 m) and minimal slope (2.02°), presents a flat terrain profile that heightens flood susceptibility, necessitating engineered safeguards to maintain operational reliability.
The single factor detection results indicated that ecological environment quality (as dependent variable Y) was input into the optimal parameter geographical detector model. A higher q-value signifies a more robust explanatory capacity of the factor influencing ecological environment quality (Table 10). The q-values of factors ranked in descending order were: annual precipitation (0.76), land surface temperature (LST) (0.64), population density (0.50), mean annual temperature (0.37), built-up area (0.34), slope (0.30), elevation (0.17), NDVI mean (0.08), vegetation coverage (0.06), and GDP per unit area (0.00). This ranking demonstrates that annual precipitation and land surface temperature-LST serve as the primary drivers influencing the ecological environment quality in water source conservation areas along the YHWDP Route.
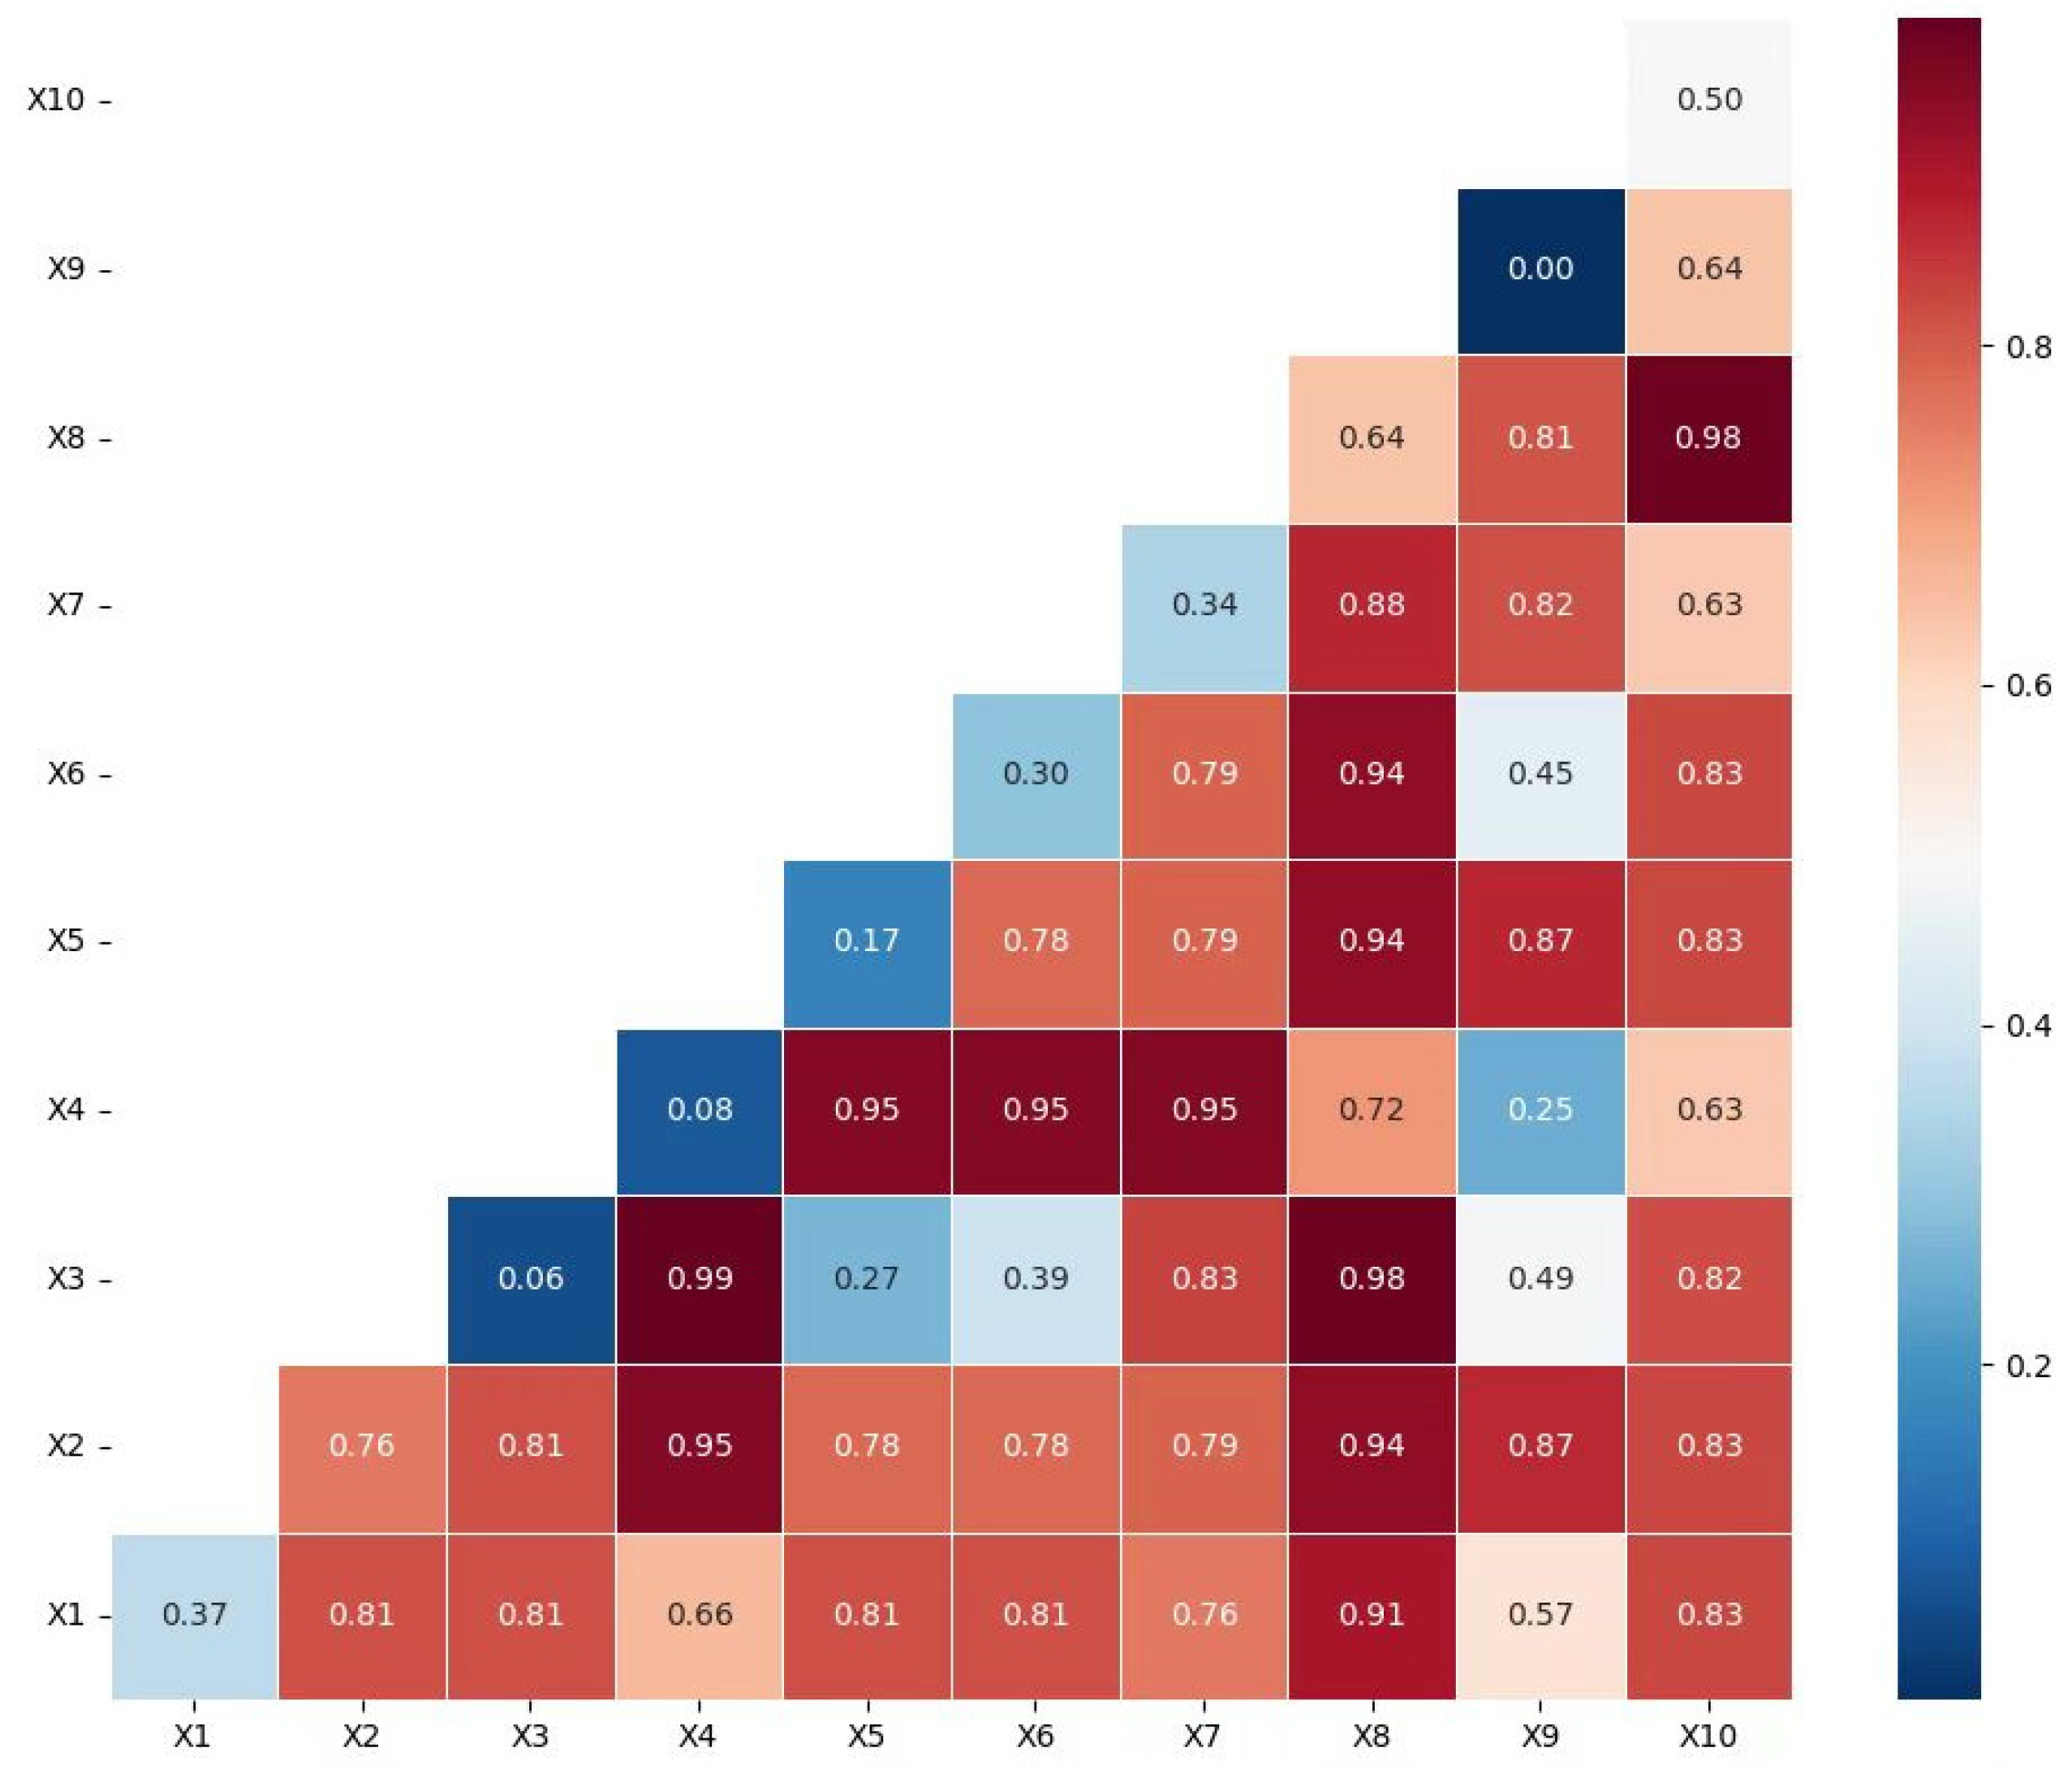
The interaction effects between factors demonstrated significant explanatory power for ecological environment quality. Notably, the interaction between NDVI and elevation, slope, and built-up area yielded the highest synergistic q-value (0.95), indicating their dominant combined influence on ecological conditions. Secondarily, interactions involving land surface temperature (LST) with mean annual temperature, precipitation, vegetation coverage, elevation, and slope all exhibited q-values exceeding 0.91. Other factor interactions consistently showed q-values above 0.5, representing substantial improvements over single-factor q-values. These findings emphasize that ecological restoration strategies must systematically integrate multi-factor spatial distribution patterns, prioritizing precipitation regimes, vegetation dynamics, and thermal conditions (LST) to optimize governance frameworks and enhance intervention efficacy.
As illustrated in Figure 11, ecological drivers operate through synergistic interactions rather than isolated effects. The dominant interaction patterns—nonlinear enhancement (e.g., NDVI × elevation) and bilinear enhancement (e.g., LST × slope)—reveal that spatial heterogeneity in ecosystem quality arises from compounded multi-factor processes. Particularly, vegetation-terrain interactions (NDVI × elevation/slope) demonstrated the strongest explanatory power for RSEI variations, with q-values surpassing 0.9. In contrast, anthropogenic impacts exhibited weaker direct effects, primarily manifesting indirectly through land use/cover modifications.

5. Discussion

During the period 2015–2024, the ecological environment quality of water source conservation areas along the YHWDP route in Anhui Province exhibited a fluctuating yet overall deteriorating trend, necessitating heightened focus on future ecological restoration efforts. Notably, the spatial extent of ecologically degraded zones gradually decreased over this period, reflecting a progressive mitigation of environmental stress. Yangtze River–Huaihe River Connection demonstrated the most unstable Remote Sensing Ecological Index (RSEI) dynamics (mean RSEI = 0.4789), indicating heightened ecological vulnerability. Yangtze River Water Northward Conveyance ranked second in ecological fragility (RSEI = 0.4842), while the Yangtze River–Chaohu Lake Water Diversion showed relatively better conditions (RSEI = 0.6917). The spatial distribution of RSEI exhibited a pronounced latitudinal and longitudinal gradient, with elevated values distinctly clustered in southern and eastern regions, while lower magnitudes prevailed in northern and western areas. Areas with ”significant degradation” dominated the ecological quality classification, particularly in urbanized regions like Hefei City, where vegetation cover was sparse. Higher-quality ecosystems clustered in densely vegetated zones, confirming vegetation coverage as a critical stabilizing factor.
This study classified the ecological environment quality of water source conservation areas along the Anhui section of the YHWDP corridor into five levels from 2015 to 2024. Statistical analysis demonstrated that both vegetation vigor (NDVI) and atmospheric moisture content (WET) significantly enhanced ecological quality indicators, while thermal stress (LST) and dryness (NDBSI) showed significant negative impacts. Single-factor analysis demonstrated the following explanatory power ranking for ecological drivers: LST > NDBSI > NDVI > WET, with LST achieving the highest q-value, highlighting its dominant role in explaining the spatial heterogeneity of the Remote Sensing Ecological Index (RSEI). Dual-factor interaction effects further indicated that LST × NDBSI had the strongest combined influence on RSEI variability, whereas NDVI × WET interactions were comparatively weaker. Overall, natural factors—including precipitation patterns, temperature gradients, and topographic elevation—were identified as primary drivers of spatial differentiation in ecological quality. In contrast, anthropogenic activities indirectly impacted the environment through land use/cover modifications, such as urbanization-driven increases in LST and expansion of built-up areas [16,17]. Meanwhile, the increase in NDVI contributed to the improvement of regional ecological environment quality [22,23]. Therefore, in the process of urban expansion and construction, attention should be paid to the reasonable protection of local natural resources. At the same time, ecological protection policies such as afforestation and water purification should be implemented, as they can help alleviate a series of environmental problems. This study is consistent with the conclusions of previous literature. These findings emphasize the need to integrate natural climatic–topographic dynamics with targeted land-use regulations to mitigate human-induced pressures and enhance ecological resilience in large-scale water diversion systems.

6. Conclusions

This research conducted a comprehensive investigation into the spatiotemporal dynamics and underlying driving mechanisms of the RSEI within water source conservation areas along the Anhui segment of the YHWDP corridor from 2015 to 2024. Key findings include the following:
(1)
The RSEI in these areas exhibited a fluctuating upward trend followed by a decline, with increasing spatial heterogeneity in ecological quality. The ecological quality ranking across subregions was: Yangtze River–Huaihe River Connection (86.51%) < Yangtze River Water Northward Conveyance (78.81%) < Yangtze River–Chaohu Lake Water Diversion (29.79%). Over the nine-year period, areas classified as “Good” and “Moderate” ecological quality significantly expanded, while “Poor” and “Very Poor” categories decreased, indicating overall ecological improvement. However, spatial imbalances persist, with pronounced regional disparities in stability: Yangtze River–Huaihe River Connection (40.66% stable/slight fluctuation) > Yangtze River–Chaohu Lake Water Diversion (30.19%) > Yangtze River Water Northward Conveyance (25.02%).
(2)
Yangtze River Water Northward Conveyance demonstrated relatively high ecological quality but greater RSEI volatility, attributed to vegetation dynamics in cropland protection zones. In contrast, the Yangtze River–Huaihe River Connection exhibited lower baseline ecological quality but milder fluctuations (slight to moderate), with intense ecological changes observed near Hefei City.
(3)
Annual precipitation, impervious surface area, and vegetation coverage emerged as primary drivers of ecological quality, interacting synergistically with annual average temperature and land cover to significantly enhance explanatory power over RSEI variations. Human activities, particularly land-use changes, markedly amplified RSEI dynamics, demonstrating strong collaborative effects with natural factors. All factor interactions exhibited nonlinear enhancement, emphasizing the critical role of coupled natural-anthropogenic processes in shaping ecological patterns.
This study calculated the RSEI for the YHWDP region and analyzed the temporal and spatial characteristics of changes, as well as future trends. Subsequently, the impact of different driving factors was evaluated, providing guidance for future environmental protection policy formulation. These approaches will empower watershed management departments to enhance the precision and scientific rigor of strategy formulation, effectively coordinating farmland protection, urban expansion control, and vegetation restoration. Such coordinated efforts aim to address ecological vulnerabilities in specific areas within large-scale water diversion systems. Due to space constraints, this study did not conduct a detailed analysis of the impact of different spatial scales of Landsat remote sensing data on the computational results. Future research should conduct comparative studies at different scales to better implement the comprehensive ecological environment assessment method developed in this study, and thus apply it to ecological protection in other watersheds and cross-basin water diversion work.

Author Contributions

Conceptualization, X.Q.; methodology, X.Q.; software, X.Q. and Q.H.; validation, X.Q., Q.L. and Q.H.; formal analysis, X.Q. and Q.H.; investigation, B.L., L.L. and Z.S.; resources, Y.O. and D.W.; data curation, Y.O. and D.W.; writing—original draft preparation, X.Q.; writing—review and editing, Q.L. and Q.H.; visualization, X.Q. and Q.H.; supervision, L.L. and Z.S.; project administration, X.Q.; funding acquisition, X.Q. All authors have read and agreed to the published version of the manuscript.

Funding

This research was funded by the Project on Delineation of Water Resource Projection Areas, Early-Warning System for Major Sudden Water Pollution Incidents, and Planning for the Projection of Water Sources Along Water Transmission Routes of the Diversion of Yangtze River to the Huaihe Project (Anhui Section) (No. YJJH-ZT-ZX-20230706545); Key Natural Science Research Project of Bengbu University (No. 2023ZR02zd); Bengbu University Applied Project (High-level Talent Research Fund) (No. 2024YYX66QD; No. 2024YYX65QD; No. 2025GQD039; No. 2025GQD035) and Key Projects of Natural Science Research in Universities of Anhui Province (No. 2023AH052941); and Peak Discipline of Bengbu University (No. 2025GFXK02).

Institutional Review Board Statement

Not applicable.

Informed Consent Statement

Not applicable.

Data Availability Statement

The original contributions presented in this study are included in the article. Further inquiries can be directed to the corresponding author.

Conflicts of Interest

The authors declare no conflict of interest.

References

  1. Zhang, Y.; Chen, X.; Zhang, Y.; Wang, B. Quantitative contribution of climate change and vegetation restoration to ecosystem services in the Inner Mongolia under ecological restoration projects. Ecol. Indic. 2025, 171, 113240. [Google Scholar] [CrossRef]
  2. Zhang, X.; Jia, W.; Lu, S.; He, J. Ecological assessment and driver analysis of high vegetation cover areas based on new remote sensing index. Ecol. Inform. 2024, 82, 102786. [Google Scholar] [CrossRef]
  3. Liang, L.; Wang, Q.; Guan, Q.; Du, Q.; Sun, Y.; Ni, F.; Lv, S.; Shan, Y. Assessing vegetation restoration prospects under different environmental elements in cold and arid mountainous region of China. Catena 2023, 226, 107055. [Google Scholar] [CrossRef]
  4. Han, Q.; Xue, L.; Liu, Y.; Yang, M.; Chu, X.; Liu, S. Developing a multi-objective simulation-optimization model for ecological water conveyance in arid inland river basins. J. Hydrol.-Reg. Stud. 2023, 50, 101551. [Google Scholar] [CrossRef]
  5. Li, Y.; Zhang, X.; Cao, Z.; Liu, Z.; Lu, Z.; Liu, Y. Towards the progress of ecological restoration and economic development in China’s Loess Plateau and strategy for more sustainable development. Sci. Total Environ. 2021, 756, 143676. [Google Scholar] [CrossRef]
  6. Meng, Y.; Hou, B.; Ding, C.; Huang, L.; Guo, Y.; Tang, Z. Spatiotemporal patterns of planted forests on the Loess Plateau between 1986 and 2021 based on Landsat NDVI time-series analysis. Gisci. Remote Sens. 2023, 60, 2185980. [Google Scholar] [CrossRef]
  7. Wu, Q.; Jiang, X.; Song, M.; Liu, Y.; Shi, X.; Lei, Y.; Nie, T. Study on the development trend of social-ecological systems and the drivers of sustainable development—A case study of the Loess Plateau in China. Ecol. Indic. 2023, 156, 111172. [Google Scholar] [CrossRef]
  8. Xiao, Y.; Wang, R.; Wang, F.; Huang, H.; Wang, J. Investigation on spatial and temporal variation of coupling coordination between socioeconomic and ecological environment: A case study of the Loess Plateau, China. Ecol. Indic. 2022, 136, 108667. [Google Scholar] [CrossRef]
  9. Long, Y.; Jiang, F.; Deng, M.; Wang, T.; Sun, H. Spatial-temporal changes and driving factors of eco-environmental quality in the Three-North region of China. J. Arid Land 2023, 15, 231–252. [Google Scholar] [CrossRef]
  10. Zheng, Z.; Wu, Z.; Chen, Y.; Guo, C.; Marinello, F. Instability of remote sensing based ecological index (RSEI) and its improvement for time series analysis. Sci. Total Environ. 2022, 814, 152595. [Google Scholar] [CrossRef]
  11. Kang, S.; Jia, X.; Zhao, Y.; Han, L.; Ma, C.; Bai, Y. Spatiotemporal Variation and Driving Factors of Ecological Environment Quality on the Loess Plateau in China from 2000 to 2020. Remote Sens. 2024, 16, 4778. [Google Scholar] [CrossRef]
  12. Xin, J.; Yang, J.; Yu, H.; Ren, J.; Yu, W.; Cong, N.; Xiao, X.; Xia, J.; Li, X.; Qiao, Z. Towards ecological civilization: Spatiotemporal heterogeneity and drivers of ecological quality transitions in China (2001–2020). Appl. Geogr. 2024, 173, 103439. [Google Scholar] [CrossRef]
  13. Zhou, M.; Li, Z.; Gao, M.; Zhu, W.; Zhang, S.; Ma, J.; Ta, L.; Yang, G. Revealing the Eco-Environmental Quality of the Yellow River Basin: Trends and Drivers. Remote Sens. 2024, 16, 2018. [Google Scholar] [CrossRef]
  14. Yang, H.; Yu, J.; Xu, W.; Wu, Y.; Lei, X.; Ye, J.; Geng, J.; Ding, Z. Long-time series ecological environment quality monitoring and cause analysis in the Dianchi Lake Basin, China. Ecol. Indic. 2023, 148, 110084. [Google Scholar] [CrossRef]
  15. Lv, Y.; Xiu, L.; Yao, X.; Yu, Z.; Huang, X. Spatiotemporal evolution and driving factors analysis of the eco-quality in the Lanxi urban agglomeration. Ecol. Indic. 2023, 156, 111114. [Google Scholar] [CrossRef]
  16. Aurora, R.M.; Furuya, K. Spatiotemporal Analysis of Urban Sprawl and Ecological Quality Study Case: Chiba Prefecture, Japan. Land 2023, 12, 2013. [Google Scholar] [CrossRef]
  17. Halder, S.; Bose, S. Comparative study on remote sensing-based indices for urban ecology assessment: A case study of 12 urban centers in the metropolitan area of eastern India. J. Earth Syst. Sci. 2024, 133, 100. [Google Scholar] [CrossRef]
  18. An, L.; Liao, K.; Zhu, L.; Zhou, B. Influence of river-lake isolation on the water level variations of Caizi Lake, lower reach of the Yangtze River. J. Geogr. Sci. 2021, 31, 551–564. [Google Scholar] [CrossRef]
  19. Li, C.; Li, H.; Zhang, Y.; Zha, D.; Zhao, B.; Yang, S.; Zhang, B.; de Boer, W.F. Predicting hydrological impacts of the Yangtze-to-Huaihe Water Diversion Project on habitat availability for wintering waterbirds at Caizi Lake. J. Environ. Manag. 2019, 249, 109251. [Google Scholar] [CrossRef]
  20. Qi, X.; Han, Q.; Li, B.; Chen, X.; Guo, Z.; Ou, Y.; Wang, D. Developing a Multi-Objective Optimization Scheduling Method for the Yangtze to Huaihe River Water Diversion Project Considering Lake Regulation and Storage. Water 2025, 17, 1286. [Google Scholar] [CrossRef]
  21. Ding, W.; Shi, G.; Zha, H.; Miao, H.; Lu, M.; Jin, J. Ecological impacts and supply demand evolution of the Yangtze to Huaihe water transfer project in Anhui section. Sci. Rep. 2024, 14, 20311. [Google Scholar] [CrossRef] [PubMed]
  22. Halder, S.; Bose, S. Ecological quality assessment of five smart cities in India: A remote sensing index-based analysis. Int. J. Environ. Sci. Technol. 2024, 21, 4101–4118. [Google Scholar] [CrossRef]
  23. Hasan, M.M.; Ferdous, M.T.; Talha, M.; Mojumder, P.; Roy, S.K.; Zim, M.N.F.; Akter, M.M.; Nasher, N.M.R.; Hasher, F.F.B.; Boltiziar, M.; et al. Analyzing Ecological Environmental Quality Trends in Dhaka Through Remote Sensing Based Ecological Index (RSEI). Land 2025, 14, 1258. [Google Scholar] [CrossRef]
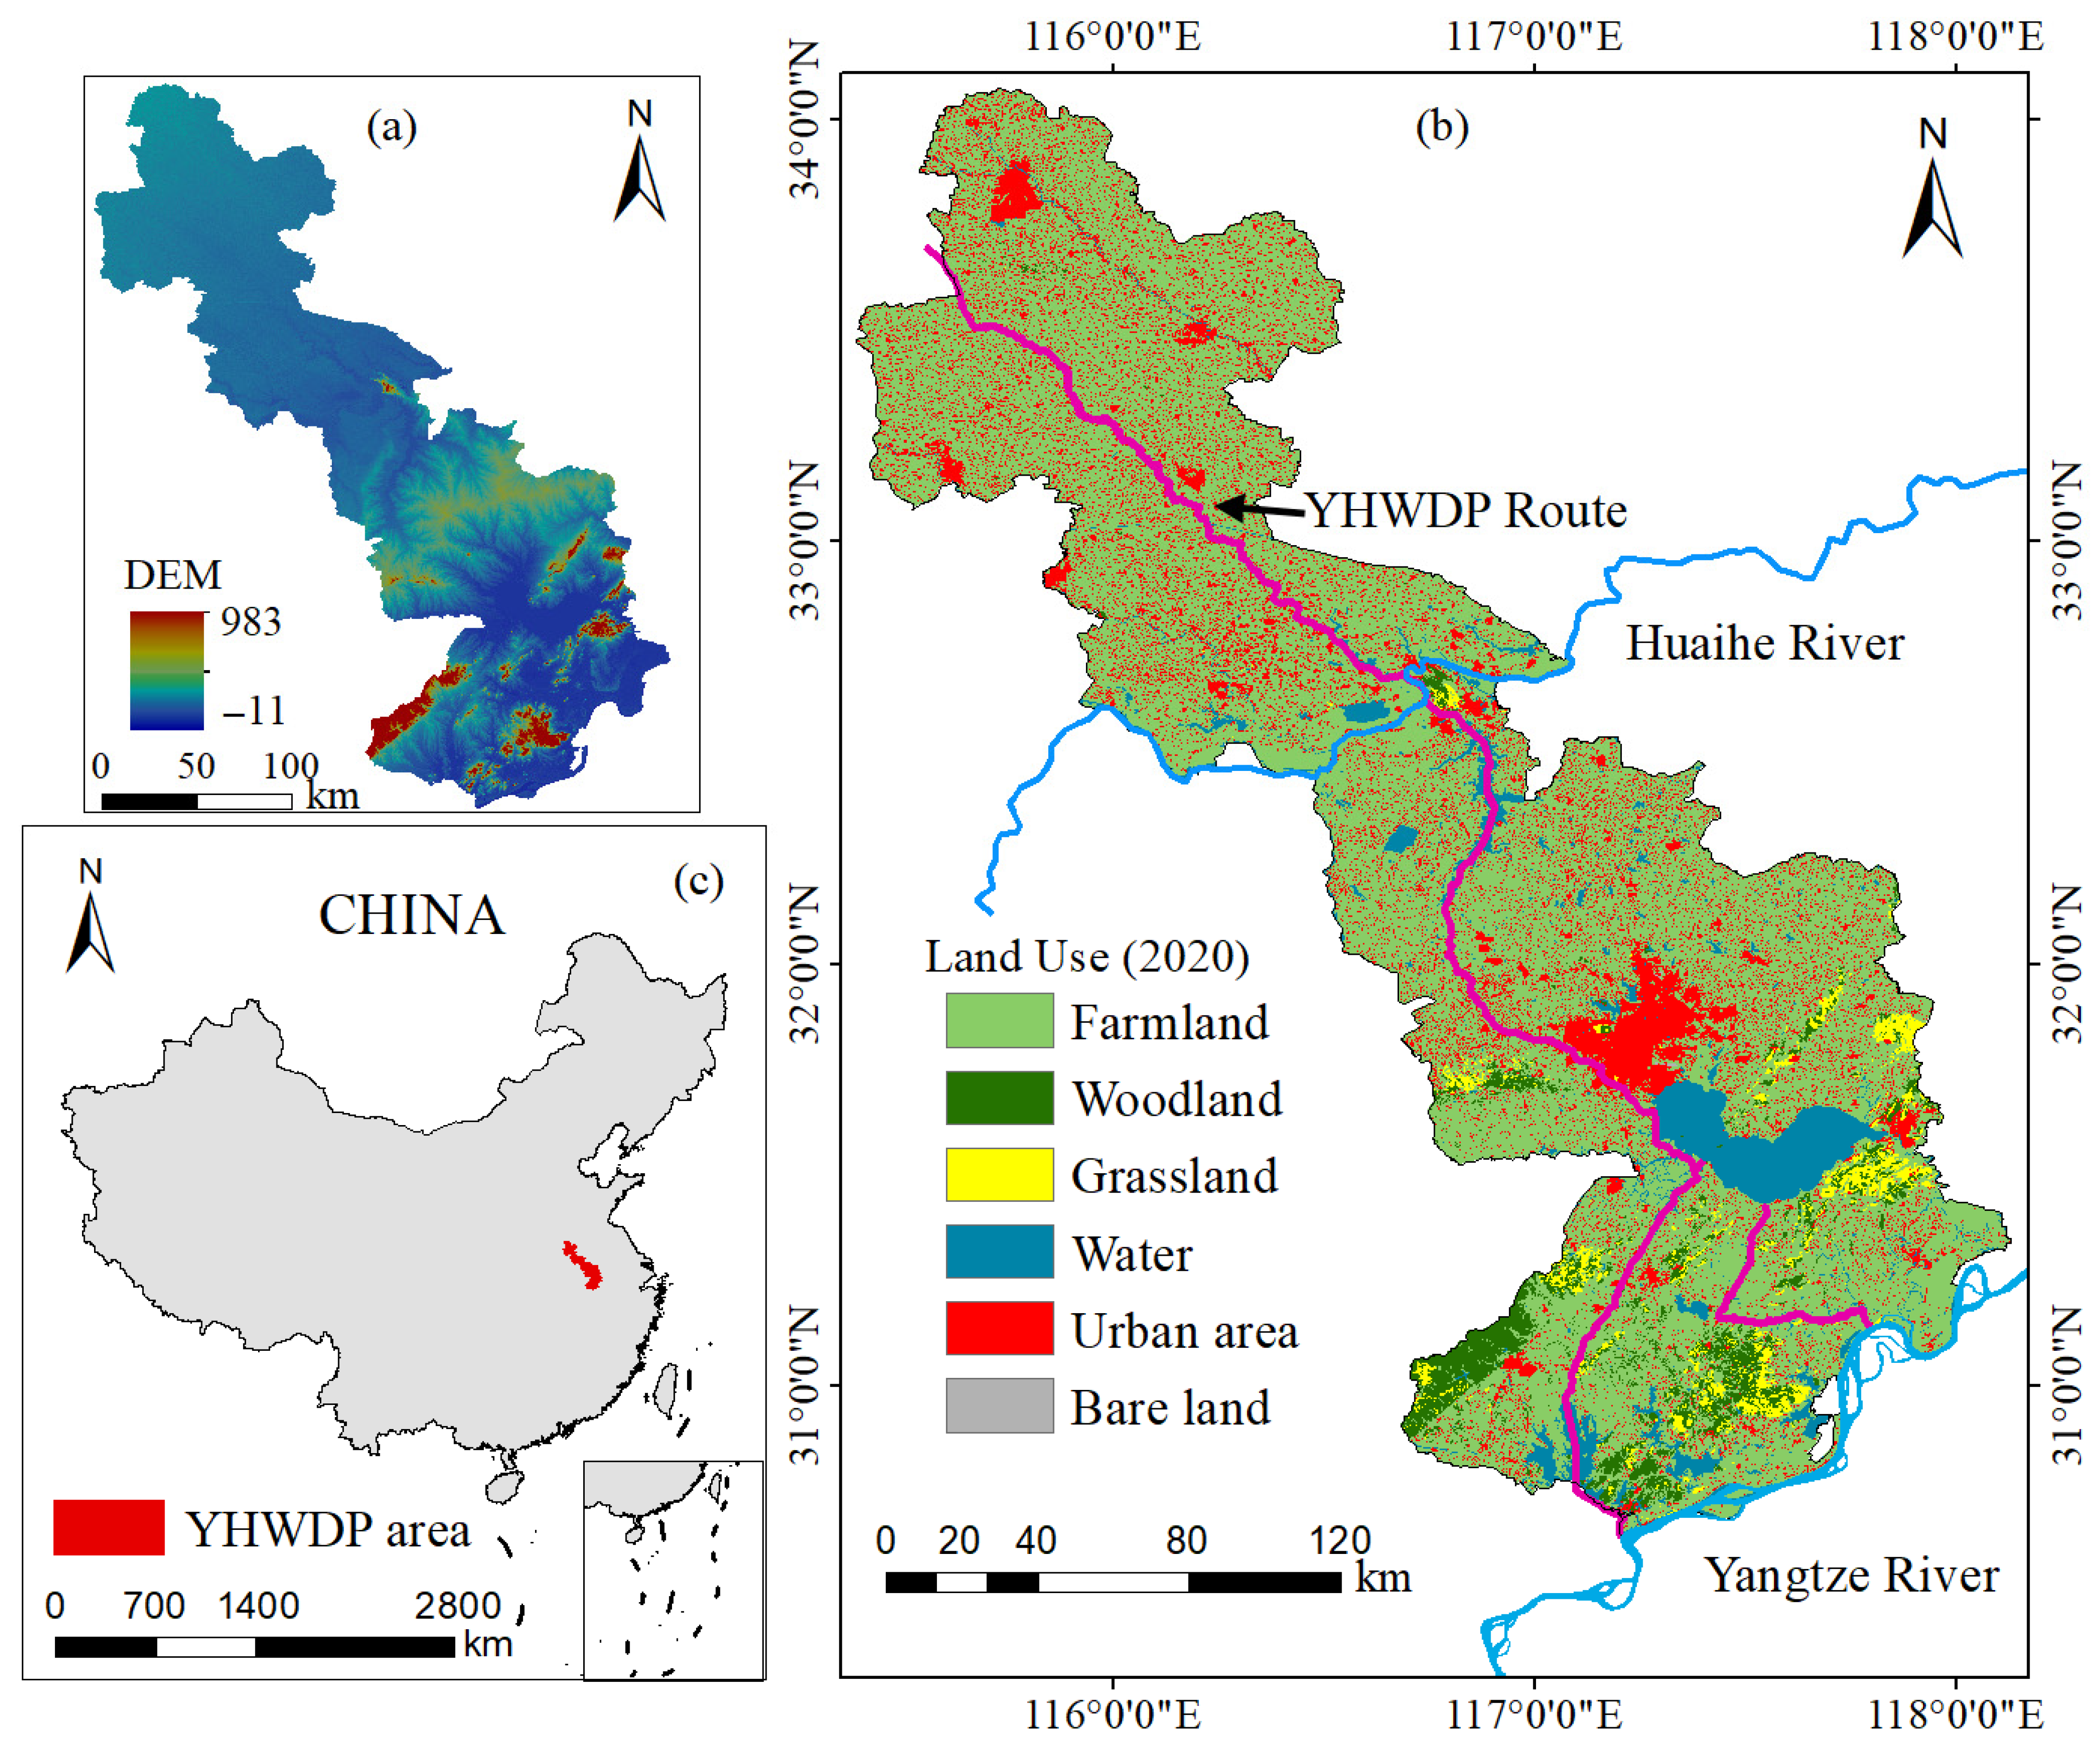
Figure 1. Location of the Anhui section of the Yangtze-to-Huaihe Water Diversion Project: DEM map of the study area (a); route map of the Yangtze-to-Huaihe Water Diversion Project (b); and location of the study area (c).
Sustainability 17 07329 g001
Figure 2. Technology flowchart.
Sustainability 17 07329 g002
Figure 3. Spatial distribution of RSEI in the Anhui section of the Yangtze-to-Huaihe Water Diversion Project: 2015 (a), 2020 (b) and 2024 (c).
Sustainability 17 07329 g003
Figure 4. Spatial distribution of RSEI in the Yangtze River–Chaohu Lake Water Diversion (2015–2024): 2015 (a), 2020 (b) and 2024 (c).
Sustainability 17 07329 g004
Figure 5. Spatial distribution of RSEI in the Yangtze River–Huaihe River Connection (2015–2024): 2015 (a), 2020 (b) and 2024 (c).
Sustainability 17 07329 g005
Figure 6. Spatial distribution of RSEI in the Yangtze River Water Northward Conveyance (2015–2024): 2015 (a), 2020 (b) and 2024 (c).
Sustainability 17 07329 g006
Figure 7. Spatial distribution of RSEI change characteristics in Yangtze River–Huaihe River Connection (a), Yangtze River–Chaohu Lake Water Diversion (b) and Yangtze River Water Northward Conveyance (c) during the period 2015–2024.
Sustainability 17 07329 g007
Figure 8. Spatial distribution of the coefficient of variation (CV) for RSEI in Yangtze River–Huaihe River Connection (a), Yangtze River–Chaohu Lake Water Diversion (b) and Yangtze River Water Northward Conveyance (c) (2015–2024).
Sustainability 17 07329 g008
Figure 9. Spatial distribution of RSEI Hurst index in Yangtze River–Huaihe River Connection (a), Yangtze River–Chaohu Lake Water Diversion (b) and Yangtze River Water Northward Conveyance (c) from 2015 to 2024.
Sustainability 17 07329 g009
Figure 10. Future development trends of RSEI in Yangtze River–Huaihe River Connection (a), Yangtze River–Chaohu Lake Water Diversion (b) and Yangtze River Water Northward Conveyance (c).
Sustainability 17 07329 g010
Figure 11. Interactive detection matrix.
Sustainability 17 07329 g011
Table 1. Trend categories of the Theil–Sen estimator and Mann–Kendall method.
β ZTrend TypeTrend Features
<0≤−1.96SDSignificant decrease
<0−1.96 to 1.96NSDNo significant decrease
0−1.96 to 1.96NCNo change
>0−1.96 to 1.96NSINo significant increase
>0≥1.96SIsignificant increase
NOTE: β is the T–S slope coefficient, which quantifies the magnitude of the temporal trend in RSEI values; Z is the M–K standardized test statistic, which represents the significance level of detected trends following M–K hypothesis testing.
Table 2. Classification of RSEI change trends.
HurstSen’s SlopeFuture Trends
0.5 < H < 1β > 0Improvement
β < 0Degradation
H = 0.5-Uncertain
0 < H < 0.5β > 0Improvement
β < 0Degradation
Table 3. Interaction relation.
CriteriaInteraction
q(X1 ∩ X2) < Min (q(X1), q(X2))Nonlinear Weakening
Min(q(X1), q(X2)) < q(X1 ∩ X2) < Max(q(X1), q(X2))Single-Factor Nonlinear Weakening
q(X1 ∩ X2) > Max(q(X1), q(X2))Two-Factor Enhancement
q(X1 ∩ X2) = q(X1) + q(X2)Mutual Independence
q(X1 ∩ X2) > q(X1) + q(X2)Nonlinear Enhancement
Table 4. Mean values of each indicator and the contribution of PC1 from 2015 to 2024.
YearRSEI
Value
NDVI ValueWET
Value
NDBSI
Value
LST
Value
PC1
Value
PC1 Contribution Rate
20150.62320.44120.52480.69840.60950.286379.40%
20200.53740.56250.48150.65630.53330.260583.74%
20240.52470.38790.44810.69520.47570.236978.17%
Table 5. RSEI classification area and proportion.
ClassRangeRSEI (2015)RSEI (2020)RSEI (2024)
Area
(km2)
Proportion
(%)
Area
(km2)
Proportion
(%)
Area
(km2)
Proportion
(%)
Excellent0.8–1.010924.2037.443526.9012.423637.2412.43
Good0.6–0.86474.5022.197118.8523.137608.5226.34
Moderate0.4–0.64637.7315.898837.2530.319018.8830.82
Fair0.2–0.44838.3916.586766.3123.476444.2121.97
Poor0.0–0.22305.917.92930.6910.672471.848.45
Table 6. Grading table of RSEI change amplitude in the Yangtze-to-Huaihe Water Diversion Project.
SegmentTrend Type2015–2024
Area/km2Proportion/%
Yangtze River–Chaohu Lake Water DiversionNo change1968.3625.64
No significant increase2936.9738.26
Significant increase57.330.75
No significant decrease2057.5626.80
Significant decrease26.930.35
Yangtze River–Huaihe River ConnectionNo change1896.2115.30
No significant increase4633.0337.38
Significant increase34.060.27
No significant decrease5146.4041.52
Significant decrease41.880.34
Yangtze River Water Northward ConveyanceNo change895.437.20
No significant increase8366.2867.27
Significant increase202.441.63
No significant decrease2056.5016.53
Significant decrease91.760.74
Table 7. Statistics of RSEI coefficient of variation (CV) area and proportion in the study area from 2015 to 2024.
CVYangtze River–Chaohu Lake Water DiversionYangtze River–Huaihe River ConnectionYangtze River Water Northward Conveyance
Area (km2)Proportion (%)Area (km2)Proportion (%)Area (km2)Proportion (%)
Stability1141.1114.87862.646.965928.6647.67
Slight changes5109.6766.578215.3766.28116.110.93
Moderate variation709.469.242507.2620.233705.1629.79
Significant changes68.210.89151.611.221486.7911.95
Drastic changes15.580.205.510.04282.682.27
Table 8. Statistics of Sen–Hurst coefficient area and proportion for RSEI in the study area (2015–2024).
CVYangtze River–Chaohu Lake Water DiversionYangtze River–Huaihe River ConnectionYangtze River Water Northward Conveyance
Area
(km2)
Proportion
(%)
Area
(km2)
Proportion (%)Area
(km2)
Proportion
(%)
Uncertain1968.3625.641896.2115.30895.437.20
Improvement2132.6627.783720.8930.021754.3214.11
Degradation2946.1238.386134.1449.498962.3672.06
Table 9. Parameters of driving factors influencing RSEI changes.
Driving FactorsVariableYangtze River–Chaohu Lake Water DiversionYangtze River–Huaihe River ConnectionYangtze River Water Northward Conveyance
201520202024201520202024201520202024
natural factorsclimatic factorsX118.2017.6017.4017.5016.3017.4016.0016.6014.80
X21421.301877.901776.301234.601634.201293.10808.601020.90829.30
vegetation factorsX324.8624.8624.8623.4323.4323.4326.9126.9126.91
X40.500.560.210.350.340.220.260.560.29
topographic factorsX549.3249.3249.3238.2038.2038.2030.6830.6830.68
X65.165.165.162.772.772.772.022.022.02
surface disturbance factorsX7619.87863.751015.041174.011443.372100.101343.591502.631623.43
X80.440.480.750.510.480.540.600.560.60
socio-economiceconomic factorsX9360.00288.00279.00323.00319.00318.00466.00502.00445.00
population sizeX10972.771471.972348.36270.741824.072580.591047.921742.432495.18
Table 10. Single-factor influence contribution.
X1X2X3X4X5X6X7X8X9X10
q statistic0.370.760.060.080.170.300.340.640.000.50
p value1.000.560.970.950.930.780.490.771.000.91
Disclaimer/Publisher’s Note: The statements, opinions and data contained in all publications are solely those of the individual author(s) and contributor(s) and not of MDPI and/or the editor(s). MDPI and/or the editor(s) disclaim responsibility for any injury to people or property resulting from any ideas, methods, instructions or products referred to in the content.