Article

A Multi-Temporal Regulation Strategy for EV Aggregators Enabling Bi-Directional Energy Interactions in Ancillary Service Markets for Sustainable Grid Operation

School of Information and Electrical Engineering, Shandong Jianzhu University, Jinan 250101, China
*
Author to whom correspondence should be addressed.
Sustainability 2025, 17(16), 7315; https://doi.org/10.3390/su17167315
Submission received: 19 June 2025 / Revised: 29 July 2025 / Accepted: 12 August 2025 / Published: 13 August 2025

Abstract

Amid rising load volatility and uncertainty, demand-side resources with regulation capabilities are increasingly engaged at scale in ancillary service markets, facilitating sustainable peak load mitigation and alleviating grid stress while reducing reliance on carbon-intensive peaking plants. This study examines the integration of electric vehicles (EVs) in peak regulation, proposing a multi-stage operational strategy framework grounded in the analysis of EV power and energy response constraints to promote both economic efficiency and environmental sustainability. The model holistically accounts for temporal charging and discharging behaviors under diverse incentive mechanisms, incorporating user response heterogeneity alongside multi-period market peak regulation demands while supporting clean transportation adoption. An optimization model is formulated to maximize aggregator revenue while enhancing grid sustainability and is solved via MATLAB(2021b) and CPLEX(20.1.0). The simulation outcomes reveal that the discharge-based demand response (DBDR) strategy elevates aggregator revenue by 42.6% and enhances peak regulation margins by 19.2% relative to the conventional charge-based demand response (CBDR). The hybridization of CBDR and DBDR yields a threefold revenue increase and a 28.7% improvement in peak regulation capacity, underscoring the efficacy of a joint-response approach in augmenting economic returns, grid flexibility, and sustainable energy management.

1. Introduction

In recent years, propelled by the large-scale deployment of charging infrastructure and integrated parking solutions, the ownership of both private and public electric vehicles (EVs) in China has surged dramatically [1]. Against this backdrop, EVs have increasingly been recognized as strategically vital distributed flexible resources within modern power systems. Leveraging their inherent attributes—such as ultra-low carbon emissions, superior energy efficiency, and high controllability—EVs are emerging as foundational enablers of next-generation green and intelligent mobility ecosystems [2].
Beyond their transportation function, EVs can be regarded as highly flexible mobile energy storage units [3], offering immense potential for load shifting, renewable energy accommodation, and power quality enhancement. Their bidirectional power flow capabilities enable them to function as decentralized storage assets within the grid. When coordinated by aggregators, EVs can be dynamically aggregated and mobilized to participate in ancillary service markets, effectively bridging end-user behavior and system-level dispatch operations.
Within the EV cluster–market interaction paradigm, aggregators (EVAs) can directly procure electricity from energy markets to fulfill heterogeneous user charging requirements. During the implementation of demand response (DR) and ancillary services, EVAs typically adopt two primary dispatch frameworks: charging-oriented and incentive-driven. In this context, aggregators derive revenues by offering energy arbitrage and peak regulation services, while EV users gain economic compensation that offsets charging expenses, thereby jointly enhancing the economic and operational effectiveness of DR initiatives. Nevertheless, the stochasticity and heterogeneity inherent in EV user behavior introduce considerable challenges for real-time resource coordination. To address this, aggregators must engage in both day-ahead and intra-day market transactions to secure sufficient energy procurement while also designing adaptive incentive policies that encourage user participation in peak shaving and demand shifting. Under this operational paradigm, the formulation of robust and adaptive EV charging strategies becomes a critical research priority. In [4], a tri-level hierarchical control framework that coordinates interactions among grid operators, regional dispatch centers, and charging stations was proposed. Their multi-layer optimization structure enables fine-grained management of large-scale EV charging behaviors, effectively mitigating the complexity introduced by high EV penetration. Shern et al. employed a range of artificial intelligence algorithms to predict EV user behavior and designed a hybrid energy distribution mechanism combining priority- and proportion-based strategies. This approach significantly improved the efficiency of energy allocation and user satisfaction [5]. Further, the authors of [6] embedded EV scheduling within a regional integrated energy system (RIES) and developed a bi-level co-optimization model. By incorporating vehicle-to-everything (V2X) energy interaction and a flexible hydrogen-blended gas strategy, their framework enhanced both the utilization of clean energy and the overall dispatchability of the system.
The recent literature has explored a range of approaches for price-responsive demand shaping. For instance, the authors of [7,8] proposed dynamic time-of-use pricing mechanisms to facilitate valley filling and peak clipping, achieving notable reductions in user-side energy costs. A bi-level deep learning framework combining aggregator-side pricing and an EV user strategy was developed in [9], leveraging deep reinforcement learning and deep Q-networks to optimize charging decisions. Meanwhile, Ref. [10] presented a hybrid transfer learning model based on time series to forecast EV charging demand under data-scarce conditions, improving predictive accuracy.
However, these studies generally presuppose full controllability of EV fleets by aggregators, overlooking the granularity and autonomy of EVs as individual decision-making agents. Addressing this gap, Ref. [11] introduced a dynamic pricing model grounded in the internal flexibility of EVs, narrowing the supply–demand mismatch through decentralized response strategies. In [12], a robust microgrid energy management model was proposed, explicitly accounting for the impact of uncertain parameters on technical, economic, and environmental performance metrics in EV scenarios.
Further advancements were made in [13,14] through the application of information-gap decision theory and bi-level stochastic optimization to formulate resilient dispatch schemes under uncertainty, improving the robustness of aggregator strategies and ensuring profit maximization. In the economic domain, the authors of [15,16,17] established stochastic response models considering demand elasticity and price sensitivity, which significantly reduced energy costs for EV users. However, most existing studies fall short in addressing the bidirectional uncertainties in user responsiveness and resource schedulability, often resulting in under- or over-response phenomena. To this end, references [18,19,20,21,22,23] incorporated user behavior modeling and charging habit analytics to construct willingness-aware DR strategies, such as price-sensitive demand response (PSDR) and incentive-based demand response (IBDR), thereby enhancing user participation without compromising comfort or autonomy.
Moreover, references [24,25] integrated the uncertainty arising from user behavior and market volatility into aggregator cost modeling, recognizing that EVA profitability is shaped by multi-agent interactions spanning user, market, and system domains. In reference [26], a ST-CALNet method was proposed, which integrated a neural network and an attention mechanism to capture spatiotemporal dependencies and dynamically weight time steps for handling demand uncertainty. To mitigate these uncertainties, robust optimization techniques were employed in [27,28,29], transforming the dispatch problem into tractable mixed-integer linear programming (MILP) formulations to ensure near-global optimality and computational feasibility in practical scheduling applications.
Finally, the authors of [30,31,32,33,34,35] expanded the analytical landscape by exploring peak-shaving strategies, vehicle-to-grid (V2G) scheduling, and coordinated dispatch between EV clusters and the power grid. These efforts collectively underscore the dual potential of EVs—as both consumers and providers of grid services—to enhance system stability, reduce operational costs, and realize a tightly coupled grid–EV ecosystem under the virtual power plant paradigm. Comparison of methods has been listed in Table 1.
Recent advances in electric vehicle aggregator (EVA) participation in ancillary services have emphasized demand response integration, incentive design, and optimal scheduling, effectively enhancing EV engagement and vehicle-to-grid interaction. However, most studies remain limited to single-market operations, overlook coordinated dispatch across multiple markets, and inadequately model energy boundaries during EV charging cycles. Moreover, user response willingness—marked by heterogeneity and uncertainty—is rarely captured in existing frameworks. Future work should focus on modeling user participation behavior, refining energy boundary representation, and improving dispatch flexibility and robustness under uncertainty.
Overall structure of the paper is shown in Figure 1, and the primary contributions of this paper are as follows:
  • To transcend the limitations of conventional approaches that are typically confined to single-market frameworks, this study pioneers a market-coupled and temporally layered scheduling paradigm for electric vehicle aggregator (EVA) participation in ancillary service markets. This innovative framework enables multi-temporal coordination and cross-market synergy, thereby significantly improving the spatiotemporal orchestration of distributed energy flexibility resources while promoting sustainable grid operation through reduced reliance on carbon-intensive peaking plants and enhanced integration of clean transportation systems.
  • Existing models often inadequately capture the coupling between power and energy constraints during EV charging and discharging. This paper introduces a systematic derivation of individual EV power–energy-feasible regions, yielding closed-form boundary expressions. These formulations serve as analytically tractable yet physically accurate constraints, enhancing the realism and precision of the dispatch optimization model while maximizing energy utilization efficiency and supporting sustainable energy management practices through optimized EV resource deployment.
  • Recognizing the stochastic and heterogeneous nature of user participation, this study incorporates user response willingness via utility-driven functions and probabilistic response modeling. This behaviorally enriched framework enables adaptive scheduling that is both robust and cost-effective under uncertain and dynamic user engagement, marking a substantive advancement over deterministic or fully controllable EV models while fostering widespread adoption of clean transportation technologies through user-centric incentive mechanisms that align economic benefits with environmental sustainability goals.

2. Market Participation Framework for EVs in the EVA Model

During the participation of electric vehicles (EVs) in ancillary service markets, the electric vehicle aggregator (EVA) functions as an intermediary facilitating information exchange between EV users and the power grid, providing an effective mechanism for user-side integration into ancillary service transactions. Given the limited capacity of individual EVs, they are typically unable to independently respond to grid regulation requirements. To address this, the EVA consolidates a large number of dispersed EV resources, dynamically aggregating them into a controllable virtual energy storage system, as shown in Figure 2.
In the day-ahead stage, the EVA designs differentiated charging and discharging pricing schemes, as well as ancillary service offerings, and it signs bilateral cooperation agreements with EV users. These strategies aim to both ensure the fulfillment of user charging needs and control charge/discharge behavior while enabling revenue sharing from grid dispatch services. In the real-time stage, the EVA must respond dynamically to grid instructions by providing peak regulation resources to the ancillary service market, thereby meeting the grid’s real-time load balancing demands. Thus, the EVA must reconcile the dual objectives of satisfying both EV user requirements and power system regulation needs by constructing an integrated day-ahead bidding and intra-day control framework. This transforms the EVA into both a tradable market entity and a dispatchable system resource, ensuring energy availability during load peaks and maximizing operational profits [36].
During the dispatch process, the EVA must first assess the aggregate capacity, flexibility potential, and available response windows of its EV fleet in order to determine the maximum dispatchable capacity for peak regulation. Based on these estimations, the EVA then submits bids in the ancillary service market and signs service contracts. Upon receiving dispatch instructions, the EVA executes real-time control by leveraging both its user communication interface and embedded response strategies, thereby coordinating EV charge–discharge behavior with the power system’s operational needs. The structural representation of this interaction is illustrated in Figure 3.

3. Analysis of EV Response Capability

3.1. Feasible Dispatch Region of EVs

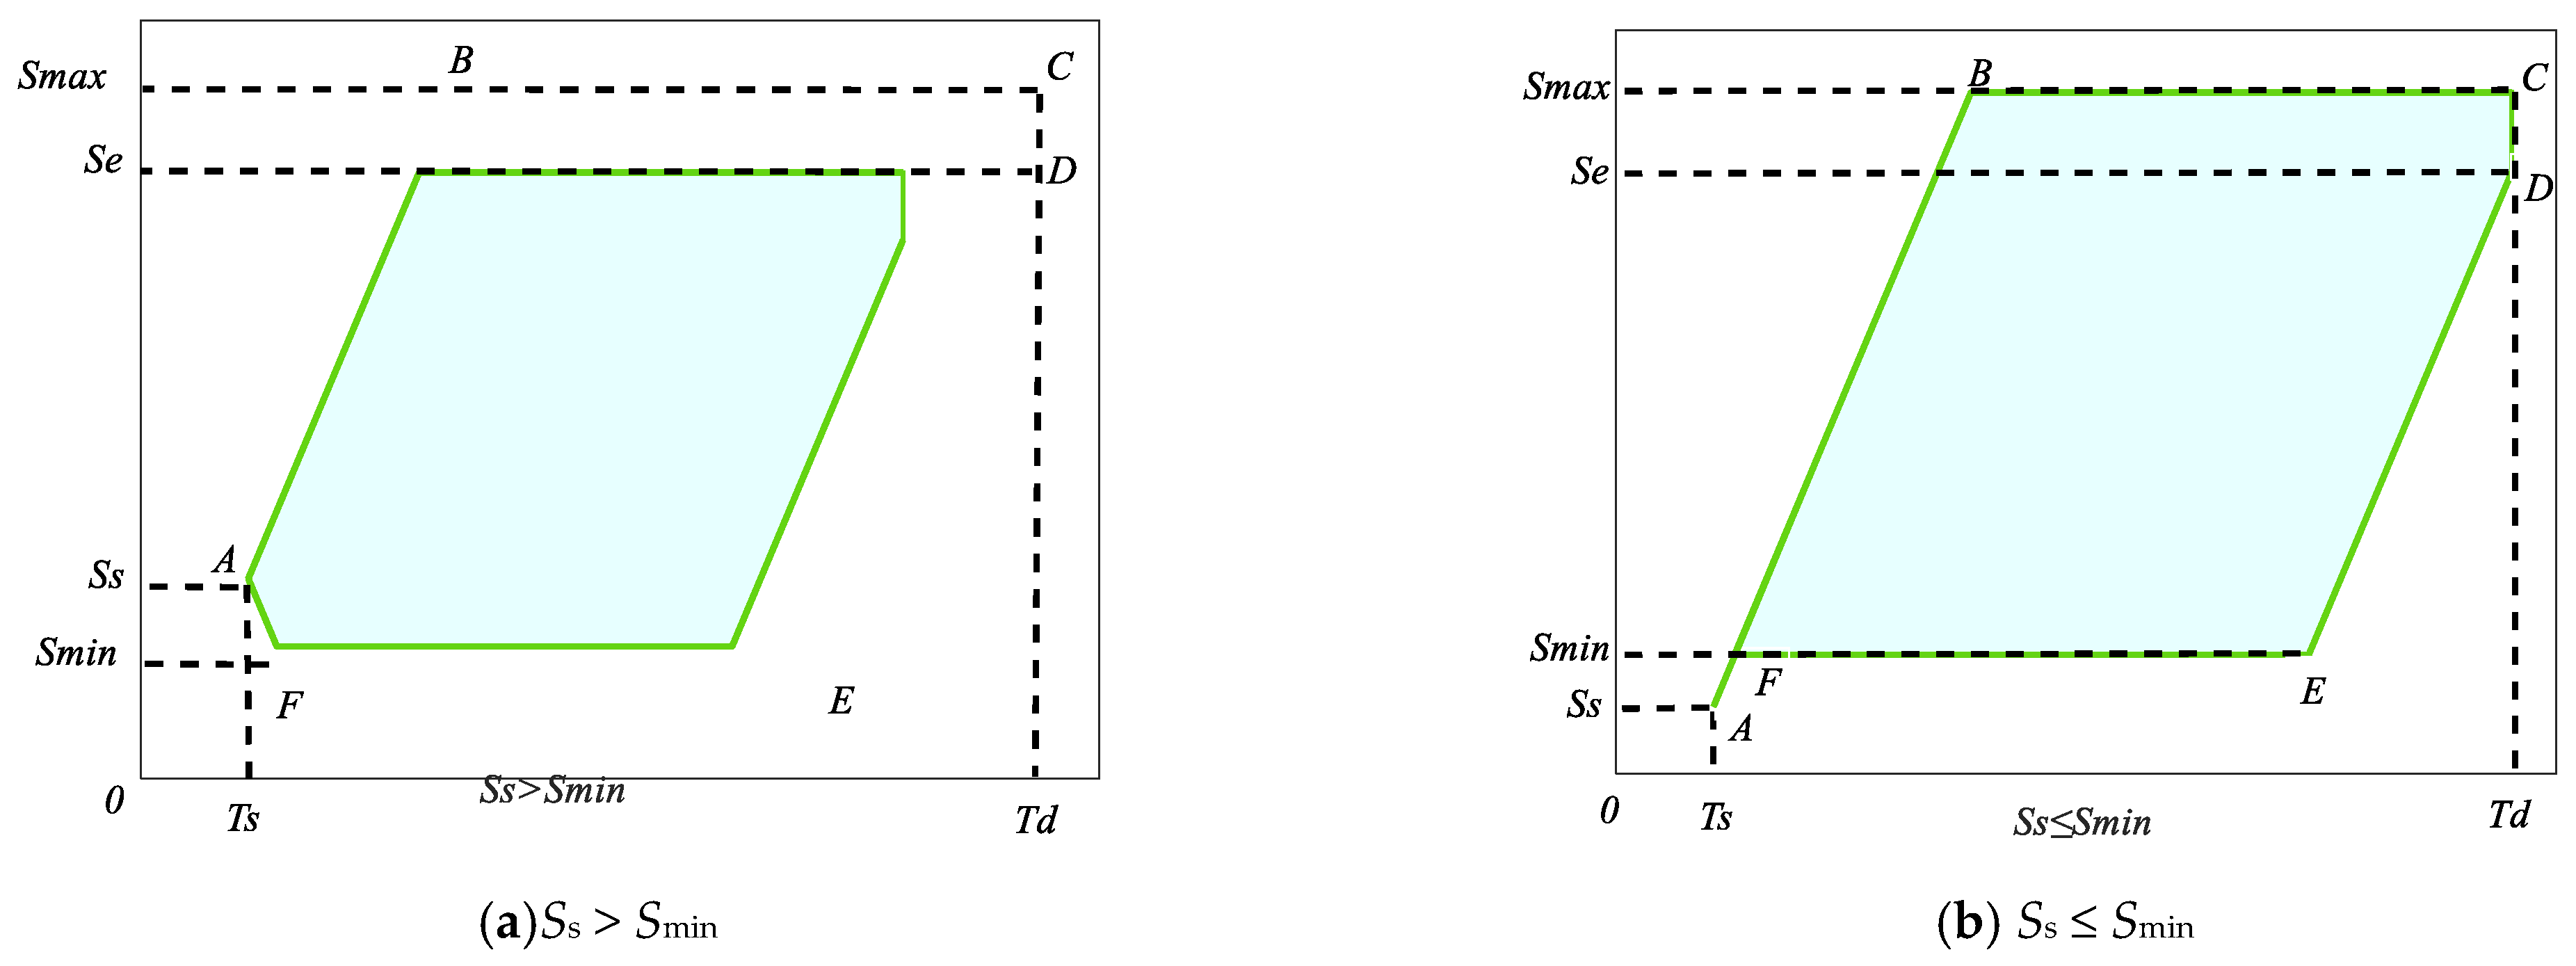
Within the ancillary service framework involving EVAs, it is essential to characterize the feasible dispatch region of EV operations [37,38], as illustrated by the blue-shaded area in Figure 4.
In Figure 4a, when the initial state of charge (SOC) of the EV, denoted as Ss, exceeds the minimum SOC threshold Smin set to prevent excessive battery discharge, the EV begins charging at its rated power immediately upon connecting to the grid at time Ts. Once the SOC reaches the maximum allowable limit Smax, the EV transitions to an idle state. In this scenario, the upper charging boundary is defined by the trajectory A–B–C.
Conversely, if the EV begins discharging at its rated power immediately upon grid connection, it continues until the SOC drops to Smin, at which point it enters an idle state. In this case, the discharging boundary follows the path A–F–E.
In Figure 4b, if the initial state of charge (SOC) Ss is less than or equal to the minimum SOC Smin, the EV enters a state of over-discharge. In this case, the EV must first charge at its rated power until the SOC reaches Smin before it becomes controllable. If charging resumes at rated power once the SOC reaches Smin, the charging boundary is defined by the trajectory A–F–B–C.
To ensure that the EV can meet the minimum SOC Smin required for travel at time Td, the segment D–E represents the mandatory charging boundary before the trip. During this period, the EV is not controllable. The charge/discharge trajectory of the EV after grid connection can shift continuously based on real-time responses, and the response capability at any given moment is closely related to the current charging/discharging state and SOC value.

3.2. Analysis of EV Response Boundaries

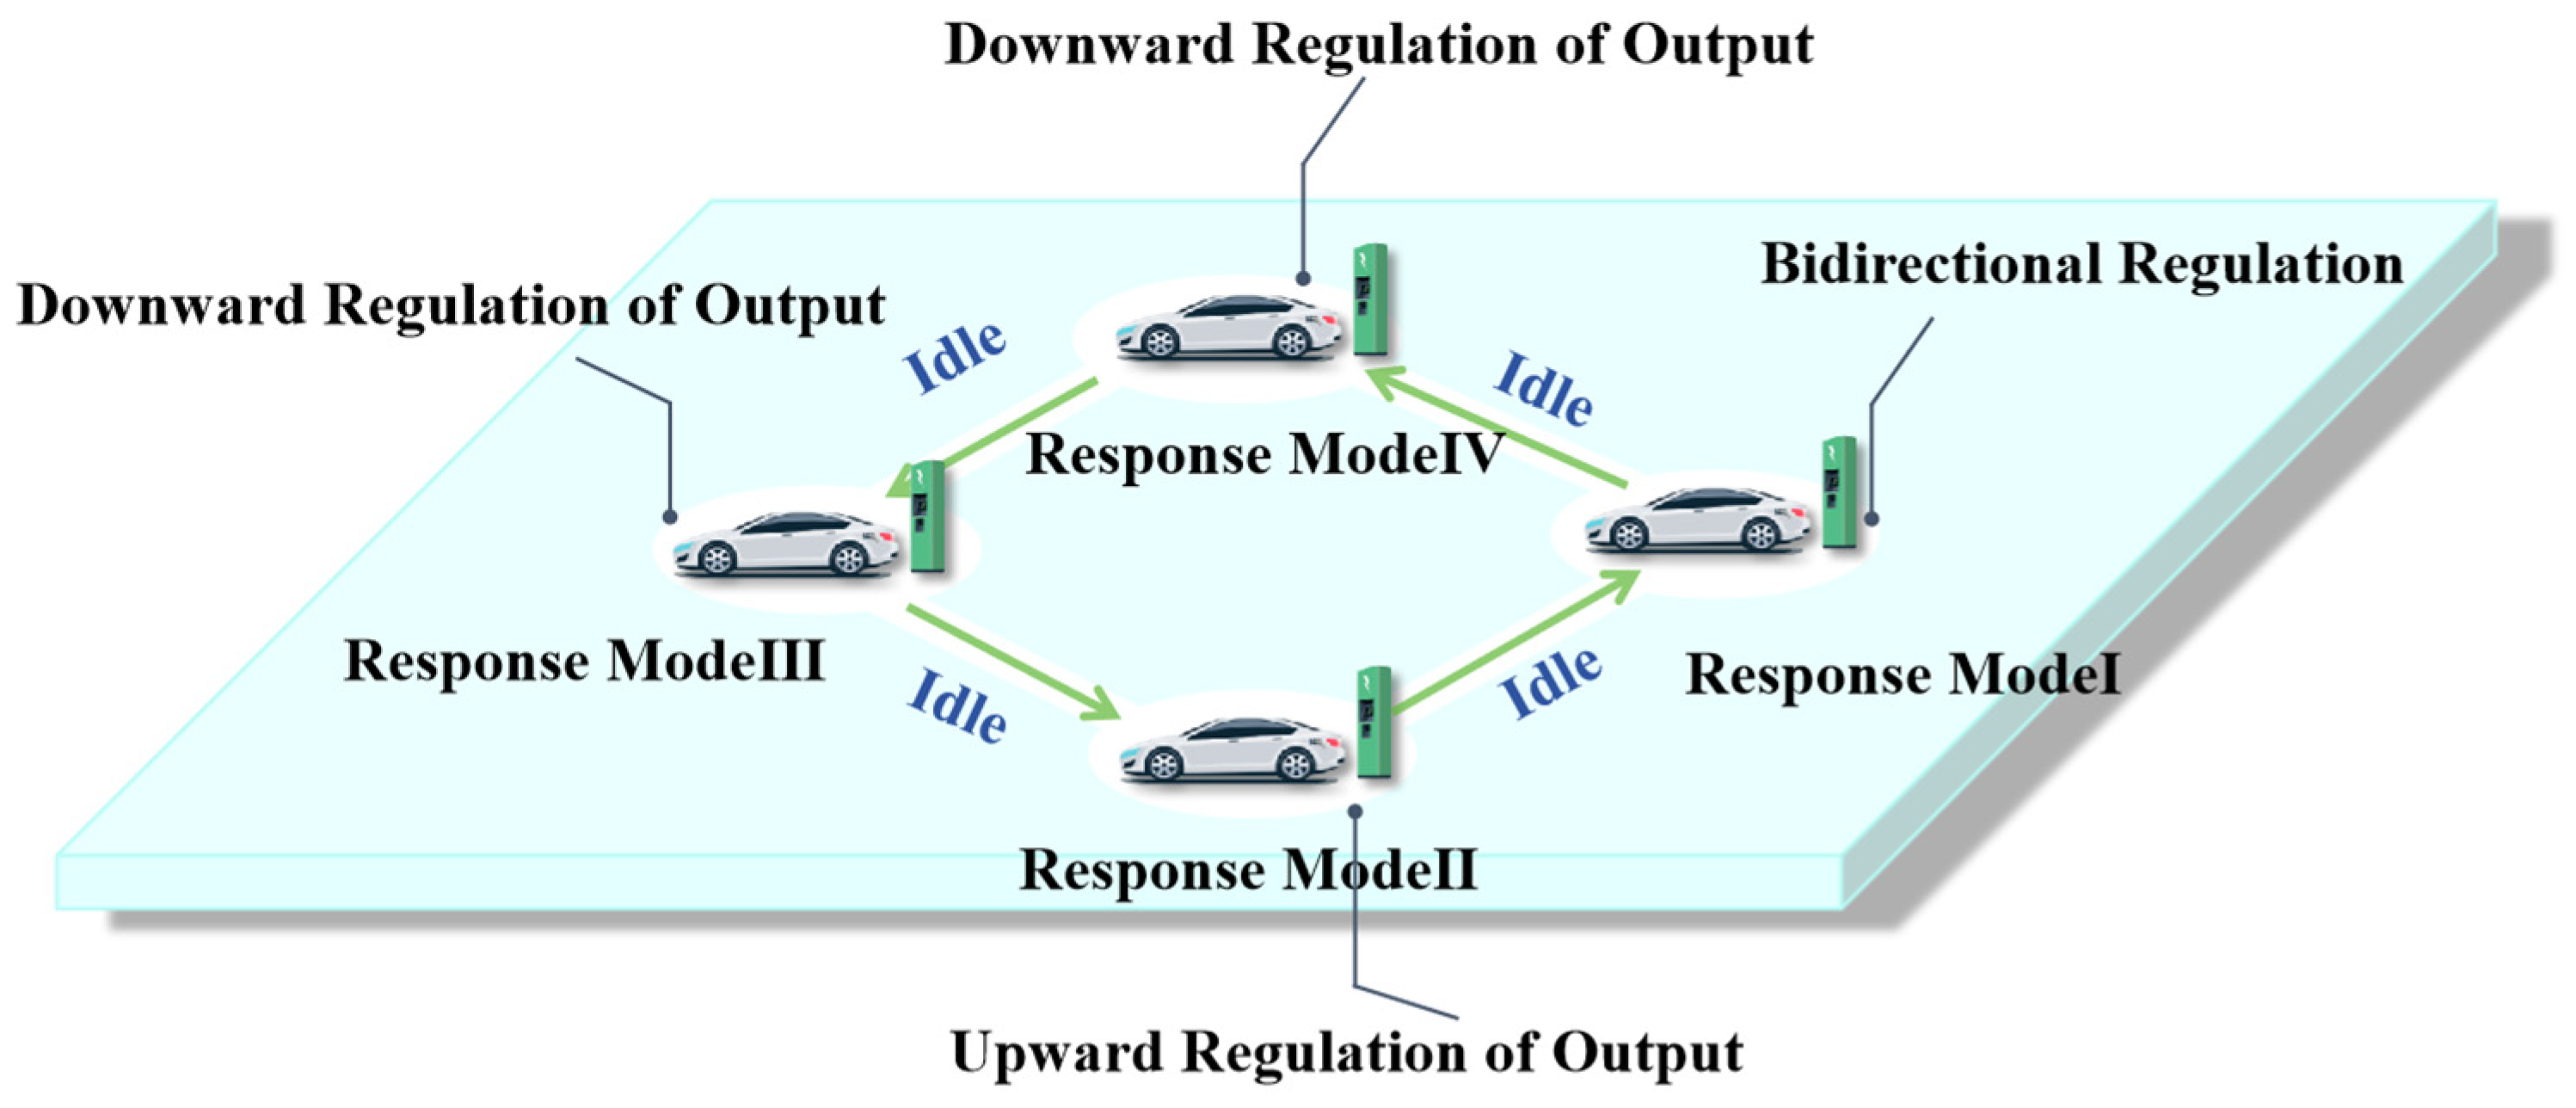
To simplify the response behavior of EVs within the feasible dispatch region, this study imposes constraints on the charging and discharging state transitions of EVs. Specifically, charging and discharging cannot directly switch between each other; the transition must follow the process “Charging→Idle→Discharging.” Based on this, the response modes are classified into four categories, labeled I, II, III, and IV, as shown in Figure 5.
In response mode I, the EV is in a connected state and possesses vehicle-to-grid (V2G) capabilities. It can be regarded as a distributed generation resource on the load side, supporting bidirectional power regulation. In response mode II, the EV is treated as an interruptible load, without discharging capabilities, and its power regulation is achieved mainly through load reduction. In response mode III, the EV is in an off-grid state and is treated as a deactivated load-side resource that does not provide power or energy regulation. In response mode IV, the EV is considered as an energy storage device, and power downregulation is achieved through load increase [39].
Therefore, the regulation capability of the EV can be classified into upward and downward regulation capacities with the following calculation formulas:
P B u p t = P 1 ( t ) + P 2 ( t )
P B d o w n ( t ) = P 3 ( t ) + P 4 ( t )
In the formula, P B u p (t) and P B d o w n (t) represent the upward and downward regulation power of the EV, respectively. P1(t) to P4(t) represent the response power of the EV in response modes I to IV.
(1)
Analysis of Individual EV Response Boundaries
The response boundaries of an EV are closely related to its maximum controllable region. The larger the maximum controllable region, the greater the flexibility of the EV’s response capability [40]. Through the four response modes mentioned above, different response modes have varying impacts on the state of charge (SOC). The SOC variation of the EV in each response state is shown in Equation (3):
S O C i ( t + Δ t ) = S OC i ( t ) + P i c ( t ) η c ( t ) Δ t i R ev ( t ) = 1 S O C i ( t )            R ev ( t ) = 0 S O C i ( t ) + P i d ( t ) Δ t i / η d ( t ) R ev ( t ) = 1
In the equation, SOCi(t) represents the state of charge (SOC) of the i-th EV at time t; Δt is the charging duration of the i-th EV over time interval Δt; Rev takes values of 1, 0, or −1, corresponding to the charging, idle, and discharging states of the EV, respectively. Pic(t) and Pid(t) represent the charging and discharging power of the i-th EV at time t; ηc and ηd denote the charging and discharging efficiency of the i-th EV.
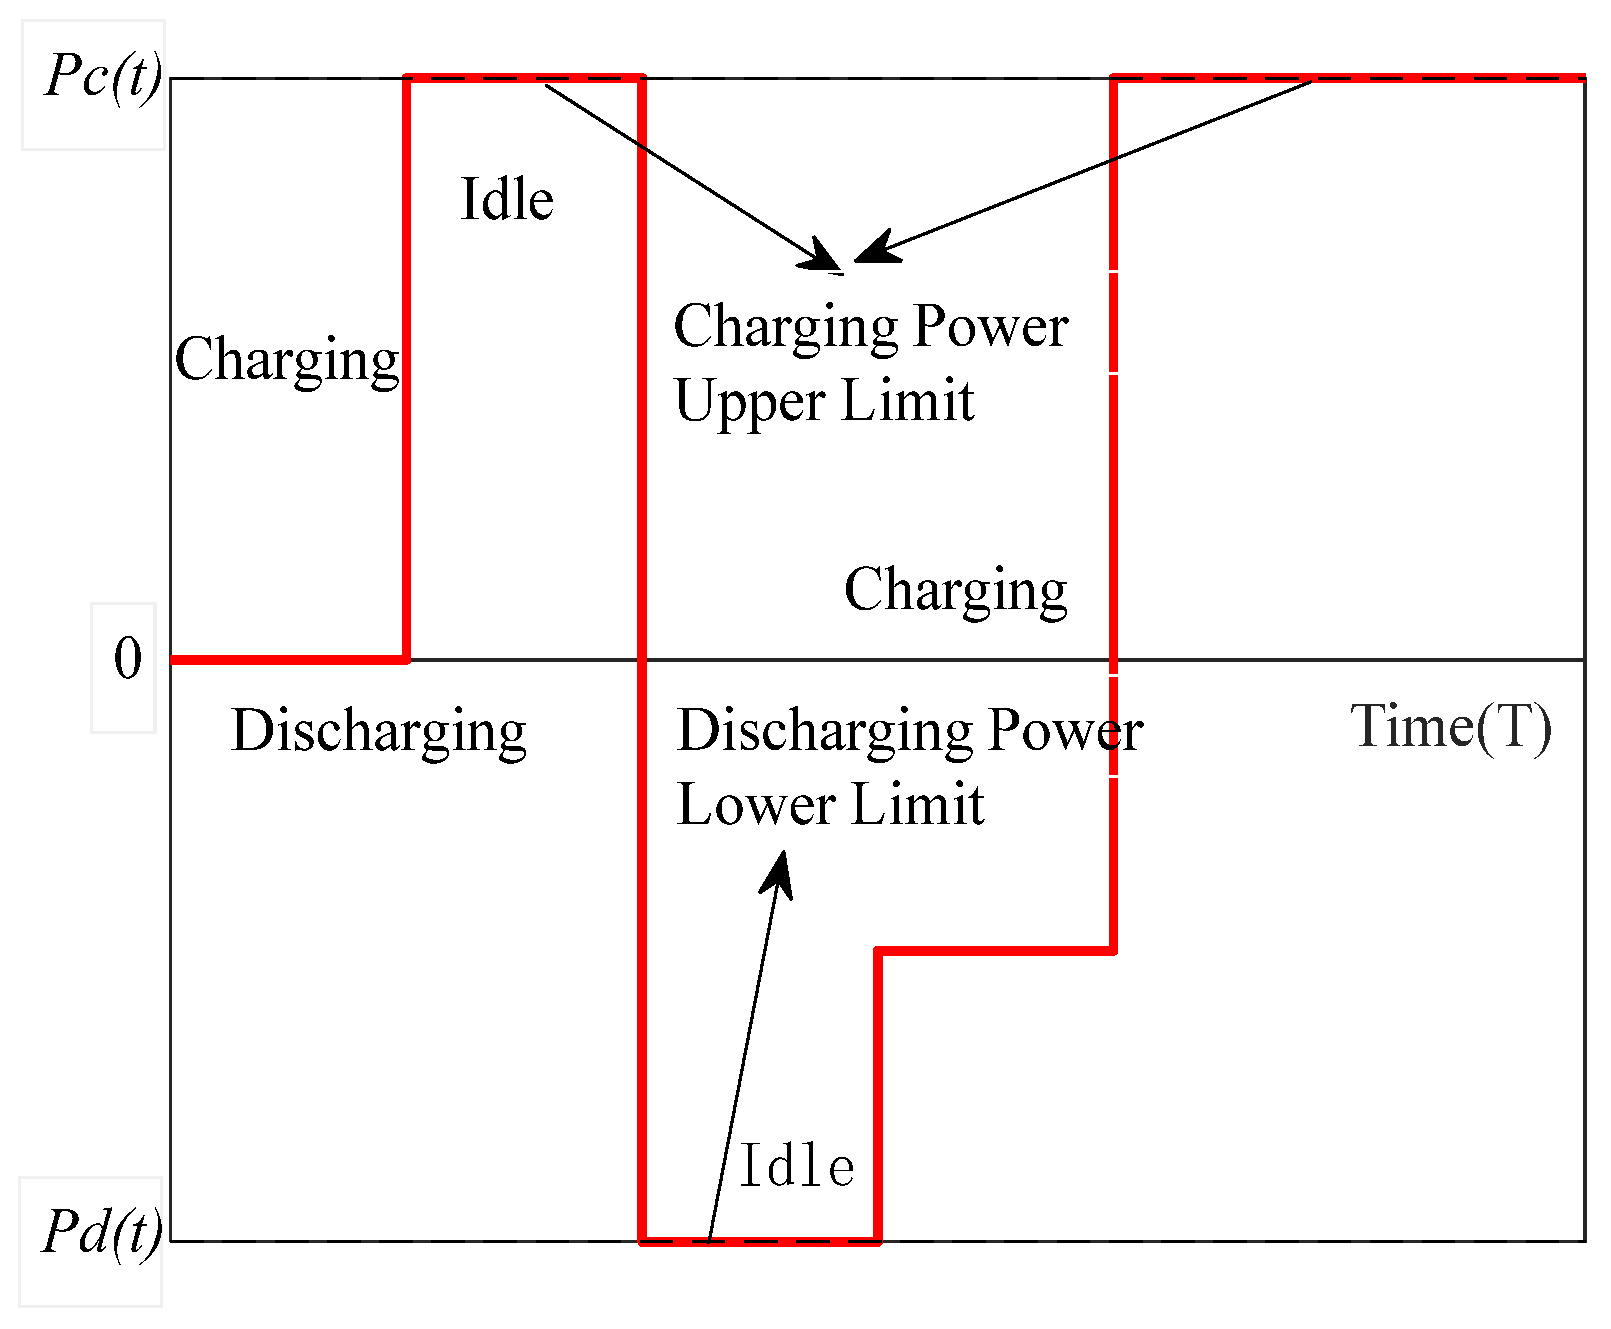
Based on the controllable region of the individual EV in Section 3.1, as shown in Figure 4a, during the time interval [Ts,Td], when the individual EV connects to the grid at point A, the real-time SOC trajectory of the EV can follow the path a→b→c→d→e→f. Once the SOC reaches the point Se, the EV can disconnect from the grid. Here, Se represents the minimum required energy to meet the demand, i.e., the desired SOC at the end of charging. Smax is considered the EV’s battery full capacity Be, and its charging power variation corresponds to the real-time SOC change, as illustrated in Figure 6 and Figure 7. The charging power operating boundary and SOC boundary during the charging period are calculated using Equations (4) and (5).
S O C i + ( t + Δ t ) = min S O C i ( t ) + P i c ( t ) η c Δ t i B e S O C i ( t + Δ t ) = max S O C i ( t ) + P i d ( t ) η d Δ t i S O C min S O C i , d e s P i c ( t ) η c ( t i , d t Δ t )
P i + ( t ) = P c , max , P i ( t ) = P d , max
In the equations, S O C i + represent the upper and lower bounds of the SOC for the i-th EV at time t, respectively; SOCi,des denotes the target SOC of the i-th EV at the end of charging (Se); Be is the full battery capacity; ti,s and ti,d represent the grid connection and disconnection times of the i-th EV, respectively; Pc,max and Pd,max are the upper bounds of the charging and discharging power. P i + (t) denotes the maximum charging power limit of the i-th EV at time t, and P i (t) denotes the maximum discharging power limit of the i-th EV at time t.
(2)
Response Boundaries of EV Aggregation
For the response boundary analysis of EV aggregations, a stochastic sampling approach is employed based on the probabilistic sampling and EVA aggregation model presented in Section 3.2. The specific procedure is as follows:
(a)
According to the probabilistic models of relevant parameters outlined in Section 3.2 on EV uncertainty analysis and modeling, the charging power, SOC capacity, and charging energy of individual EVs are determined, and their charging/discharging status is identified;
(b)
Based on the individual EV response boundaries, the energy boundaries of each EV are calculated using Equations (4) and (5);
(c)
Steps (a)–(b) are iteratively executed until the predefined EV sample size is reached, and the feasible boundaries of energy and power for the EV aggregation are determined based on Equation (6).
E + ( t ) = i = 1 N S O C i + ( t ) , E ( t ) = i = 1 N S O C i ( t ) P + ( t ) = min i = 1 N m i ( t ) p i + ( t ) , E + ( t + Δ t ) E + ( t ) Δ t P ( t ) = max i = 1 N 1 m i ( t ) p i ( t ) , E ( t + Δ t ) E ( t ) Δ t
In the equations, E+(t) and E(t) denote the upper and lower energy boundaries of the EV aggregation at time t, respectively; N is the number of controllable EVs under the EVA; P+(t) and P(t) represent the upper and lower power boundaries of the EV aggregation at time t; mi is a binary variable, where a value of 1 indicates that the i-th EV is in the charging state at time t, and a value of 0 indicates that it is in the discharging state.
By repeatedly sampling a specified number of EVs, two controllable aggregations were formed, and the cumulative sampling boundary results are illustrated in Figure 8a,b. In Aggregation 1, the EV charging behaviors are relatively uniform, with most vehicles charging intensively during nighttime hours. This leads to higher charging/discharging power during the night and a steadily increasing SOC over time, consistent with the trend in charging power. In Aggregation 2, due to differences in initial charging power, charging demand, and driving patterns among individual EVs, the power boundary exhibits greater variability compared to Aggregation 1. Correspondingly, the SOC boundaries show distinct phase-based fluctuations. By comparing the power and SOC boundary characteristics of the two aggregations, it can be observed that Aggregation 1 exhibits more homogeneous charging behavior, whereas Aggregation 2 demonstrates greater diversity. These contrasting boundary features effectively reflect the flexibility of EV aggregations in the dispatch process. Figure 8a,b reveal significant behavioral differences between electric vehicle (EV) user clusters. Cluster 1 exhibits a more concentrated and regular nighttime charging pattern (22:00–06:00), characterized by high synchronicity and strong predictability. This group likely corresponds to private car owners with fixed commuting routines and access to stable overnight charging conditions. Their behavioral characteristics are broadly consistent with users from middle to high income levels, demonstrating greater temporal consistency and stronger coordination in response behavior.
In contrast, Cluster 2 displays more dispersed charging and discharging boundaries, with higher behavioral variability and uncertainty. This pattern may stem from users with more diverse usage scenarios—such as irregular work schedules, more flexible household vehicle use, or shared vehicle access among multiple family members. Their charging behavior is more influenced by daily travel fluctuations, leading to weaker concentration and lower behavioral consistency. These differences reflect natural variations in scheduling and usage preferences across the EV population.

3.3. Modeling of EV User Willingness

In the ancillary service control process involving EVs, whether EV users are willing to participate in charging/discharging responses depends not only on physical feasibility but also on various behavioral factors, such as price incentives, compensation mechanisms, and personal preferences. To more accurately represent the response capability of EV aggregations in ancillary services, this study introduces a user willingness evaluation model based on Monte Carlo sampling to simulate and assess each individual EV’s willingness to participate in dispatch control.
First, the main influencing factors of EV user response willingness are identified, and virtual agents are generated using a multi-agent modeling approach, with each being assigned a specific psychological threshold. Next, the attribute values of each virtual agent—such as the current SOC, expected parking duration, etc.—are compared with its psychological threshold to determine whether the EV is willing to respond at the current incentive level. This process enables the classification of responsive EVs into an effective participant set.
For the probability-based modeling of willingness, let θi denote the psychological threshold of the i-th EV, and let Δp denote the current price incentive level. Then, the probability pi that the EV is willing to participate in control can be expressed as
P i = 1 1 + e a ( Δ p θ i )
Here, α denotes the steepness coefficient of the willingness function, reflecting the user’s sensitivity to price changes. Based on the above probabilistic model, Monte Carlo sampling is conducted for all agent individuals to determine the set of vehicles that actually respond. In this study, the psychological threshold θi is assumed to follow a Beta distribution over [0, 1], with shape parameters α = 2 and β = 5. This distribution is chosen for its flexibility in modeling non-uniform user sensitivity and heterogeneous response behavior.
If the total number of EVs in the aggregation is N, then the overall effective participation rate ρ of the aggregation can be expressed as
ρ = 1 N i = 1 N S i
In the equation, Si represents the participation status of the i-th vehicle; if the sampling result is less than pi, then Si = 1; otherwise, Si = 0.
With the incorporation of user willingness, the actual available upward regulation capacity Pup,eff(t) and downward regulation capacity Pdown,eff(t) for ancillary service control are jointly determined by the physical maximum capacity and the willingness-based response rate:
P u p , e f f ( t ) = ρ u p ( t ) × P u p , max ( t )
P d o w n , e f f ( t ) = ρ d o w n ( t ) × P d o w n , max ( t )
In the equation, ρup(t) and ρdown(t) represent the effective user participation rates under the upward and downward regulation scenarios, respectively. Pup,max(t) and Pdown,max(t) denote the maximum controllable power under the respective physical boundaries.

3.4. Charging-Based Demand Response Strategy (CBDR)

CBDR influences EV user decisions and behaviors by designing reward mechanisms and discount policies, thereby effectively guiding and managing charging activity. In the day-ahead market, the EVA formulates next-day charging schedules based on expected electricity prices and predicted charging demand. In the real-time market, the EVA dynamically adjusts charging prices according to real-time price fluctuations, peak regulation revenues, and the current charging status while incorporating incentive discount mechanisms to optimize its pricing strategy.
In this section, the difference between the real-time electricity price and the EVA’s offered price is defined as the charging incentive discount ΔDE(t) [41]. When an EV user has a charging need, they may choose whether to participate in CBDR based on the incentive price offered during the current time slot. If the user opts to respond to the CBDR, they will benefit from the EVA’s price discount, and the EVA will implement appropriate control over the user’s charging process. If the user does not respond to CBDR, this indicates a lack of sensitivity to the incentive discount price, and the user proceeds with autonomous charging until the SOC reaches the desired target level.
For an EV aggregation, the proportion of users responding to the CBDR, denoted as NCBDR, is expressed as follows [42]:
N C B D R = i m i , C B D R f i C B D R m i , C B D R ( 0 , 1 )
f i C B D R = a l n ( 1 + Δ D E ( t ) ) + b
In the equation, the function f i C B D R represents the response function for the i-th EV participating in CBDR. The parameter a denotes the user’s sensitivity to the incentive price, which is set to 0.2; b represents the baseline response ratio, which is set to 0.05.
If an EV user opts to respond to the CBDR, the controllable time window during which the EVA can regulate the charging behavior of the i-th EV is defined as
t i , min = B e S O C i , d e s S O C i , s p i + ( t ) η c Δ t t i , C B D R = t i , s + t i , min + m i , C B D R ( t i , d t i , s ) , m i { 0 , 1 }
In the equation, ti,min represents the minimum time required for the i-th EV to reach its desired SOC level; ti,CBDR denotes the end time of CBDR-based control for the i-th EV; SOCi,s is the initial SOC of the i-th EV upon grid connection; mi,CBDR is a binary variable indicating the response status to CBDR, where a value of 1 signifies that the i-th EV responds to CBDR, and a value of 0 indicates non-participation.

3.5. Discharging-Based Demand Response Strategy (DBDR)

DBDR primarily guides EV user behavior through discharging subsidies. In actual dispatch operations, the DBDR strategy may lead to battery degradation, which often results in low user willingness to participate. To incentivize broader EV user participation, the EVA must design appropriate discharging compensation prices to attract users to engage in discharging activities. Additionally, to offset the degradation effects caused during discharging, the EVA should offer supplementary compensation mechanisms to alleviate user concerns about battery wear.
During DBDR participation, the EV battery is subject to the effects of the charging/discharging rate, depth of discharge, and the number of charge–discharge cycles. Existing studies have shown that under normal temperature conditions, the impact of the charge/discharge rate on battery lifespan can be considered negligible. Therefore, this study focuses primarily on the influence of the depth of discharge and cycle frequency on battery performance. The relationship between the battery discharge depth D and cycle life can be described by Equations (14)–(16).
f N ( D ) = 2151 × D 2.301 G ( D ) = 2 C D f N ( D ) D [ 0 , 0.9 ]
G ¯ = j = 1 N D G ( D j ) / N D
R l o s s = 2 R c / G ¯
In the equations, D denotes the depth of discharge of an individual EV participating in DBDR; fN is the number of discharge cycles under the DBDR strategy.
G(D) represents the total energy exchanged during charge/discharge operations; the following term is the average depth of discharge; Dj refers to the specific discharge depth set by the EVA during a given time period; ND is the maximum allowable depth of discharge; Rloss represents the cost associated with battery degradation; Rc is the battery replacement cost. The degradation model parameters used in Equation (14) are derived from empirical fitting results obtained through experimental analysis of NCM (nickel–cobalt–manganese) lithium-ion batteries operating under standard ambient temperature conditions (25 °C). These parameters represent typical degradation patterns observed in electric vehicle battery systems and are widely recognized for their applicability in modeling battery performance in demand response scenarios. The model assumes stable thermal conditions and average usage intensity, which reflect common operational environments for EV fleets.
Under the discharging subsidy mechanism, if an EV user opts to participate in DBDR, they are entitled to receive a discharging incentive provided by the EVA. During the grid connection period, the EVA schedules the discharging behavior of the participating EV to provide energy regulation services to the power system. If the user is insensitive to the discharging subsidy price, they may choose not to participate in the EVA’s control process. The specific formula for calculating the discharging subsidy price is given in Equation (17).
R D B D R = R 1 + i = 1 24 R l o s s
In the equation, R1 denotes the day-ahead discharging subsidy price, which serves as the baseline incentive offered to EV users for participating in the DBDR strategy.
Considering the heterogeneity in EV user willingness to respond, the proportion of EVs participating in the DBDR strategy can be derived using Equations (18) and (19) [43].
N D B D R = i n i , D B D R f i D B D R n i , D B D R ( 0 , 1 )
f i D B D R = K ( R e R 1 ) θ
In the equation, the function f i D B D R represents the response function of the i-th EV for the DBDR strategy. Based on electricity price fluctuations, the user response constant K is set to 2.5. The exponential factor θ, which satisfies θ > 1, is taken as 1.5. Re denotes the real-time electricity price after the discharging subsidy is applied. Equations (18) and (19) assume a monotonically increasing relationship between the subsidy level and user participation rate. This assumption is commonly used in short-term response modeling, where user decisions are driven by immediate economic incentives. While platform or threshold effects are acknowledged in behavioral studies, they are beyond the scope of this work. Future extensions will consider such nonlinear response dynamics.
During the EVA’s control process, EV users responding to the CBDR can reduce their charging costs and increase scheduling flexibility through incentive-based price discounts. In contrast, EV users participating in DBDR can autonomously select their charge–discharge behavior based on the real-time subsidized electricity price in order to earn discharging revenue. Therefore, under the premise of ensuring battery safety and meeting travel demands, users are generally more inclined to respond to the DBDR. This is because DBDR not only generates economic returns for EV users but also fully leverages their flexibility for grid regulation.
Based on the above analysis, the EVA can carry out real-time scheduling during the controllable charging period of EVs, as expressed in Equation (20):
t i , D B D R = t i , s + t i , min + n i , D B D R ( t i , d t i , s ) , n i { 0 , 1 } δ i = ( t i , C B D R , t i , D B D R )
In the equation, ti,DBDR denotes the end time of DBDR-based control for the i-th EV; ni is a binary variable, where a value of 1 indicates that the i-th EV has responded to either the CBDR or DBDR, and a value of 0 indicates non-participation in either control strategy. Similarly, δi is used to indicate the response status, with a value of 1 signifying that the i-th EV has responded to the CBDR or DBDR and a value of 0 indicating no response.

4. EVA Peak Regulation Revenue Model

4.1. EVA Operating Costs

During participation in electricity trading markets, the EVA maximizes its operational revenue by dynamically scheduling the charging and discharging behaviors of EVs in real time. In the day-ahead market, the EVA formulates charging and discharging plans for EVs based on predicted market prices and assists users in completing the charging process during the real-time dispatch stage.
Once the day-ahead scheduled power is determined, the EVA must estimate and procure the required amount of electricity based on the adjustable capacity and controllable time window of the EV fleet in order to meet user demand. Accordingly, the electricity purchase cost incurred by the EVA in the day-ahead market, denoted as F1, can be expressed as
F 1 = t = 1 T R D A ( t ) P D A ( t ) Δ t
In the equation, RDA(t) denotes the day-ahead market electricity price at time t; PDA(t) is the scheduled power set by the EVA at time t; T represents the entire dispatch horizon of the EVA; Δt is the time interval between successive periods.
During peak regulation participation, the EVA balances grid demand by modulating the EV charging and discharging power, thereby incurring corresponding regulation costs. These costs consist of upward and downward peak regulation costs, which can be expressed as
F 2 = t = 1 T R n e u p ( t ) P u p ( t ) Δ t t = 1 T R n e d o w n P d o w n ( t ) Δ t
In the equation, R n e u p (t) and R n e d o w n (t) represent the real-time market electricity prices at time t for upward and downward regulation, respectively; Pup(t) denotes the EVA’s real-time upward and downward peak regulation power at time t.
During the regulation process, considering that some EV users respond to the DBDR strategy, the EVA incurs additional expenditures in the form of discharging subsidies and compensation for battery degradation, as expressed in Equation (23):
F 3 = i = 1 N t = 1 T P i c ( t ) R 1 + E i l o s s ( t ) R l o s s
In the equation, E i l o s s (t) denotes the battery energy loss of the i-th EV resulting from discharging during time period t.

4.2. EVA Compensation Revenue

During the peak regulation process, the services provided by the EVA can be categorized into upward and downward regulation capacities. The corresponding compensation mechanisms include both capacity revenue and energy revenue. The capacity revenue earned by the EVA from participating in the peak regulation market can be expressed as
F 4 = t = 1 T R p C a Δ t ω
In the equation, RP denotes the compensation rate per unit of peak regulation capacity; Ca is the amount of regulation capacity that the EVA commits to provide during peak periods; ω is the peak regulation service coefficient.
By adjusting the charging and discharging behavior of EVs, the EVA responds to the power system’s regulation needs, either by supplying additional electricity during peak hours or by storing energy during off-peak periods. The corresponding peak regulation energy is expressed in Equation (25).
E U P ( t ) = i = 1 T m max { A ( i , t ) , 0 } P i c t Δ t E D o w n ( t ) = i = 1 T m min { A ( i , t ) , 0 } P i d t Δ t
In the equation, EUP(t) and EDown(t) represent the upward and downward regulation energy provided by the EV aggregation during time period t, respectively; A(i,t) denotes the i-th peak regulation signal issued by the ancillary service market at time t; Tm is the number of signal intervals within time period t. Based on this, the energy revenue earned by the EVA from participating in peak regulation services in the ancillary service market can be expressed as
F 5 = t = 1 T R m u p ( t ) E U P ( t ) Δ t ω t = 1 T R m d o w n ( t ) E D o w n ( t ) Δ t ω
In the equation, R m u p (t) and R m d o w n (t) represent the real-time energy prices for upward and downward regulation in the intra-day market.

4.3. Objective Function and Constraints

Based on the aforementioned analysis of EVA revenue during the peak regulation process, the optimization objective is to maximize the EVA’s total operational profit F. The objective function can be expressed as
max F = F 4 + F 5 F 1 F 2 F 3
In the equation, the objective function consists of the EVA’s expenditures and revenue streams, as defined in Section 4.1 and Section 4.2.
The constraints are as follows.
(a)
EVA Constraints
The operation of the EVA must satisfy energy balance constraints, power constraints, and energy availability constraints. On this basis, the model must ensure real-time energy and power balance during the EVA dispatch process:
P t eva , + = i N P i c t η c , P t eva , = i N P i d t / η d
E t eva = E t 1 eva + P t 1 eva , + Δ t P t 1 eva , Δ t + E t eva , arr E t eva , dep
0 P t eva , + P t eva , + , max = i N P i + t η c
0 P t eva , P t eva , , max = i N P i t / η d
E t eva , min E t eva E t eva , max
In the equations, Δt denotes the time interval. In Equation (28), P i c (t) and P i d (t) represent the charging and discharging power of the i-th EV at time t, respectively; ηc denotes the charging and discharging efficiencies of the i-th EV.
Equation (29) defines the energy balance constraint. Eeva t − 1 is the EVA’s energy at time t − 1; P t 1 e v a , + and P t 1 e v a , are the total charging and discharging power of the EVA at time t − 1; E t e v a , a r r and E t e v a , d e p represent the energy associated with EVs entering and leaving the EVA at time t; N denotes the set of EVs aggregated under the EVA. Specifically, in Equation (29), the EVA’s energy at time t equals the energy at time t − 1, plus the total energy charged into the EVs and the energy brought by newly connected EVs, minus the energy discharged and the energy removed by EVs that exit at time t. In Equation (30), P t e v a , + , m a x represents the maximum allowable charging power of the EVA at time t, and P i + (t) is the maximum charging power of the i-th EV.
Similarly, in Equation (31), P t e v a , , m a x represents the maximum discharging power of the EVA at time t, and P i (t) is the maximum discharging power of the i-th EV. Equation (32) defines the EVA’s energy availability constraints, where E t e v a , m i n and E t e v a , m a x denote the minimum and maximum allowable energy capacity of the EVA at time t, respectively. This model quantitatively describes the energy dynamics and aggregated response boundaries of EV clusters, ensuring that energy and power balances are maintained within the EVA as individual EVs connect to or disconnect from the system in real time.
(b)
Energy Boundary Constraints
The EV aggregation under EVA control must satisfy energy operation constraints. Specifically, both the scheduled charging energy and the net energy after grid regulation at each time period must remain within the predefined energy boundary limits, as expressed in Equation (33):
E t P ( t ) Δ t E + t E t P + ( t ) Δ t E + t
In the equation, E(t) and E+(t) represent the lower and upper energy boundaries of the EV aggregation at time t, respectively; P+(t) and P(t) denote the upper and lower power limits of the EV aggregation at time t.
(c)
EV Quantity Constraint
Considering the limitations of charging infrastructure and the acceptance capacity of the EVA, the number of EVs aggregated by the EVA at any given time must not exceed its maximum vehicle accommodation capacity:
N a c t N m a x
In the equation, Nact denotes the actual number of EVs engaged in charging and participating in regulation, while Nmax represents the maximum number of EVs that the EVA is permitted to control.
(d)
Battery State Constraint
Since some users participate in the DBDR strategy and EV travel needs must also be considered, it is necessary to ensure that the SOC remains within acceptable limits to avoid compromising user mobility while enabling participation in regulation:
S O C i m i n ( t ) S O C i ( t ) S O C i m a x ( t )
In the equation, S O C i m i n (t) denotes the minimum SOC value that allows the i-th EV to participate in DBDR, while S O C i m a x (t) represents the ideal SOC level after participating in regulation.
(e)
Power Constraint
The EVA must dynamically adjust its power output in real time based on peak regulation signals. At any given time period, the net power P(t) must not fall below the maximum discharging power or exceed the maximum charging power. The specific constraint is defined in Equation (36):
P ( t ) P ( t ) P + ( t ) P u p e v a ( t ) > 0 P d o w n e v a ( t ) > 0
In the equation, P(t) represents the net real-time regulation power of the EVA; P u p e v a (t) and P d o w n e v a (t) denote the EVA’s upward and downward regulation power at time t, respectively, both of which are strictly greater than zero during real-time dispatch.

5. Case Study Analysis

5.1. Multi-Period Real-Time Energy Regulation Analysis of an EVA

The electric vehicle user data utilized in this study are generated via Monte Carlo simulations, rather than being sourced from specific pilot projects or real-world residential trials. A virtual cohort of 100 EV users was constructed to represent typical private vehicle owners in urban environments. Key behavioral parameters—such as arrival and departure times, energy demand, and willingness to participate—were established based on plausible assumptions and carefully designed modeling frameworks. Explanation of relevant terms has been listed in Table 2.
Although the sample is synthetic, it was meticulously crafted to embody realistic variability and heterogeneity in user behavior, encompassing both weekday and weekend usage patterns. This modeling approach ensures that the sample captures representative dynamics of EV users under standard operating conditions. Subsequent research will integrate empirical data from field deployments or regional pilot programs to further validate and refine the behavioral models.
During the control process, all electric vehicles are categorized into two types based on their charging demand: private vehicles and other types of vehicles. The initial state of charge (SOC) distribution is determined according to the usage characteristics of each vehicle category. Based on charging requirements, EVs are further grouped into multiple clusters. It is assumed that all EVs have battery capacities ranging from 30 to 50 kWh, with uniform rated charging/discharging power set at 30 kW, and an energy conversion efficiency of 0.9. Additionally, the incentive discount for CBDR participation and the cost of EV battery degradation are both set to 0.2 $/kWh.
Within the EV clusters, for users responding to CBDR, the EVA can adjust charging prices to encourage their participation in peak regulation. The corresponding response rate can be calculated using Equation (8). For users responding to the DBDR, the EVA can offer time-of-use-based discharging prices and determine user participation ratios at various subsidy levels. The response rate in this case can be computed using Equation (15).
To evaluate the impact of CBDR and DBDR on the peak regulation margin of EV clusters, three experimental scenarios are designed for comparative analysis, as shown in Table 3. In Scenarios 2 and 3, the effect of DBDR is considered. The discharging subsidy directly influences the willingness of EV users to participate; a subsidy that is too low discourages participation, while a subsidy that is too high reduces the EVA’s profit. Therefore, there exists an optimal subsidy price that balances the EVA’s revenue and cost. The discharging subsidy price is taken from [44], and the time-of-use electricity prices are based on [45].
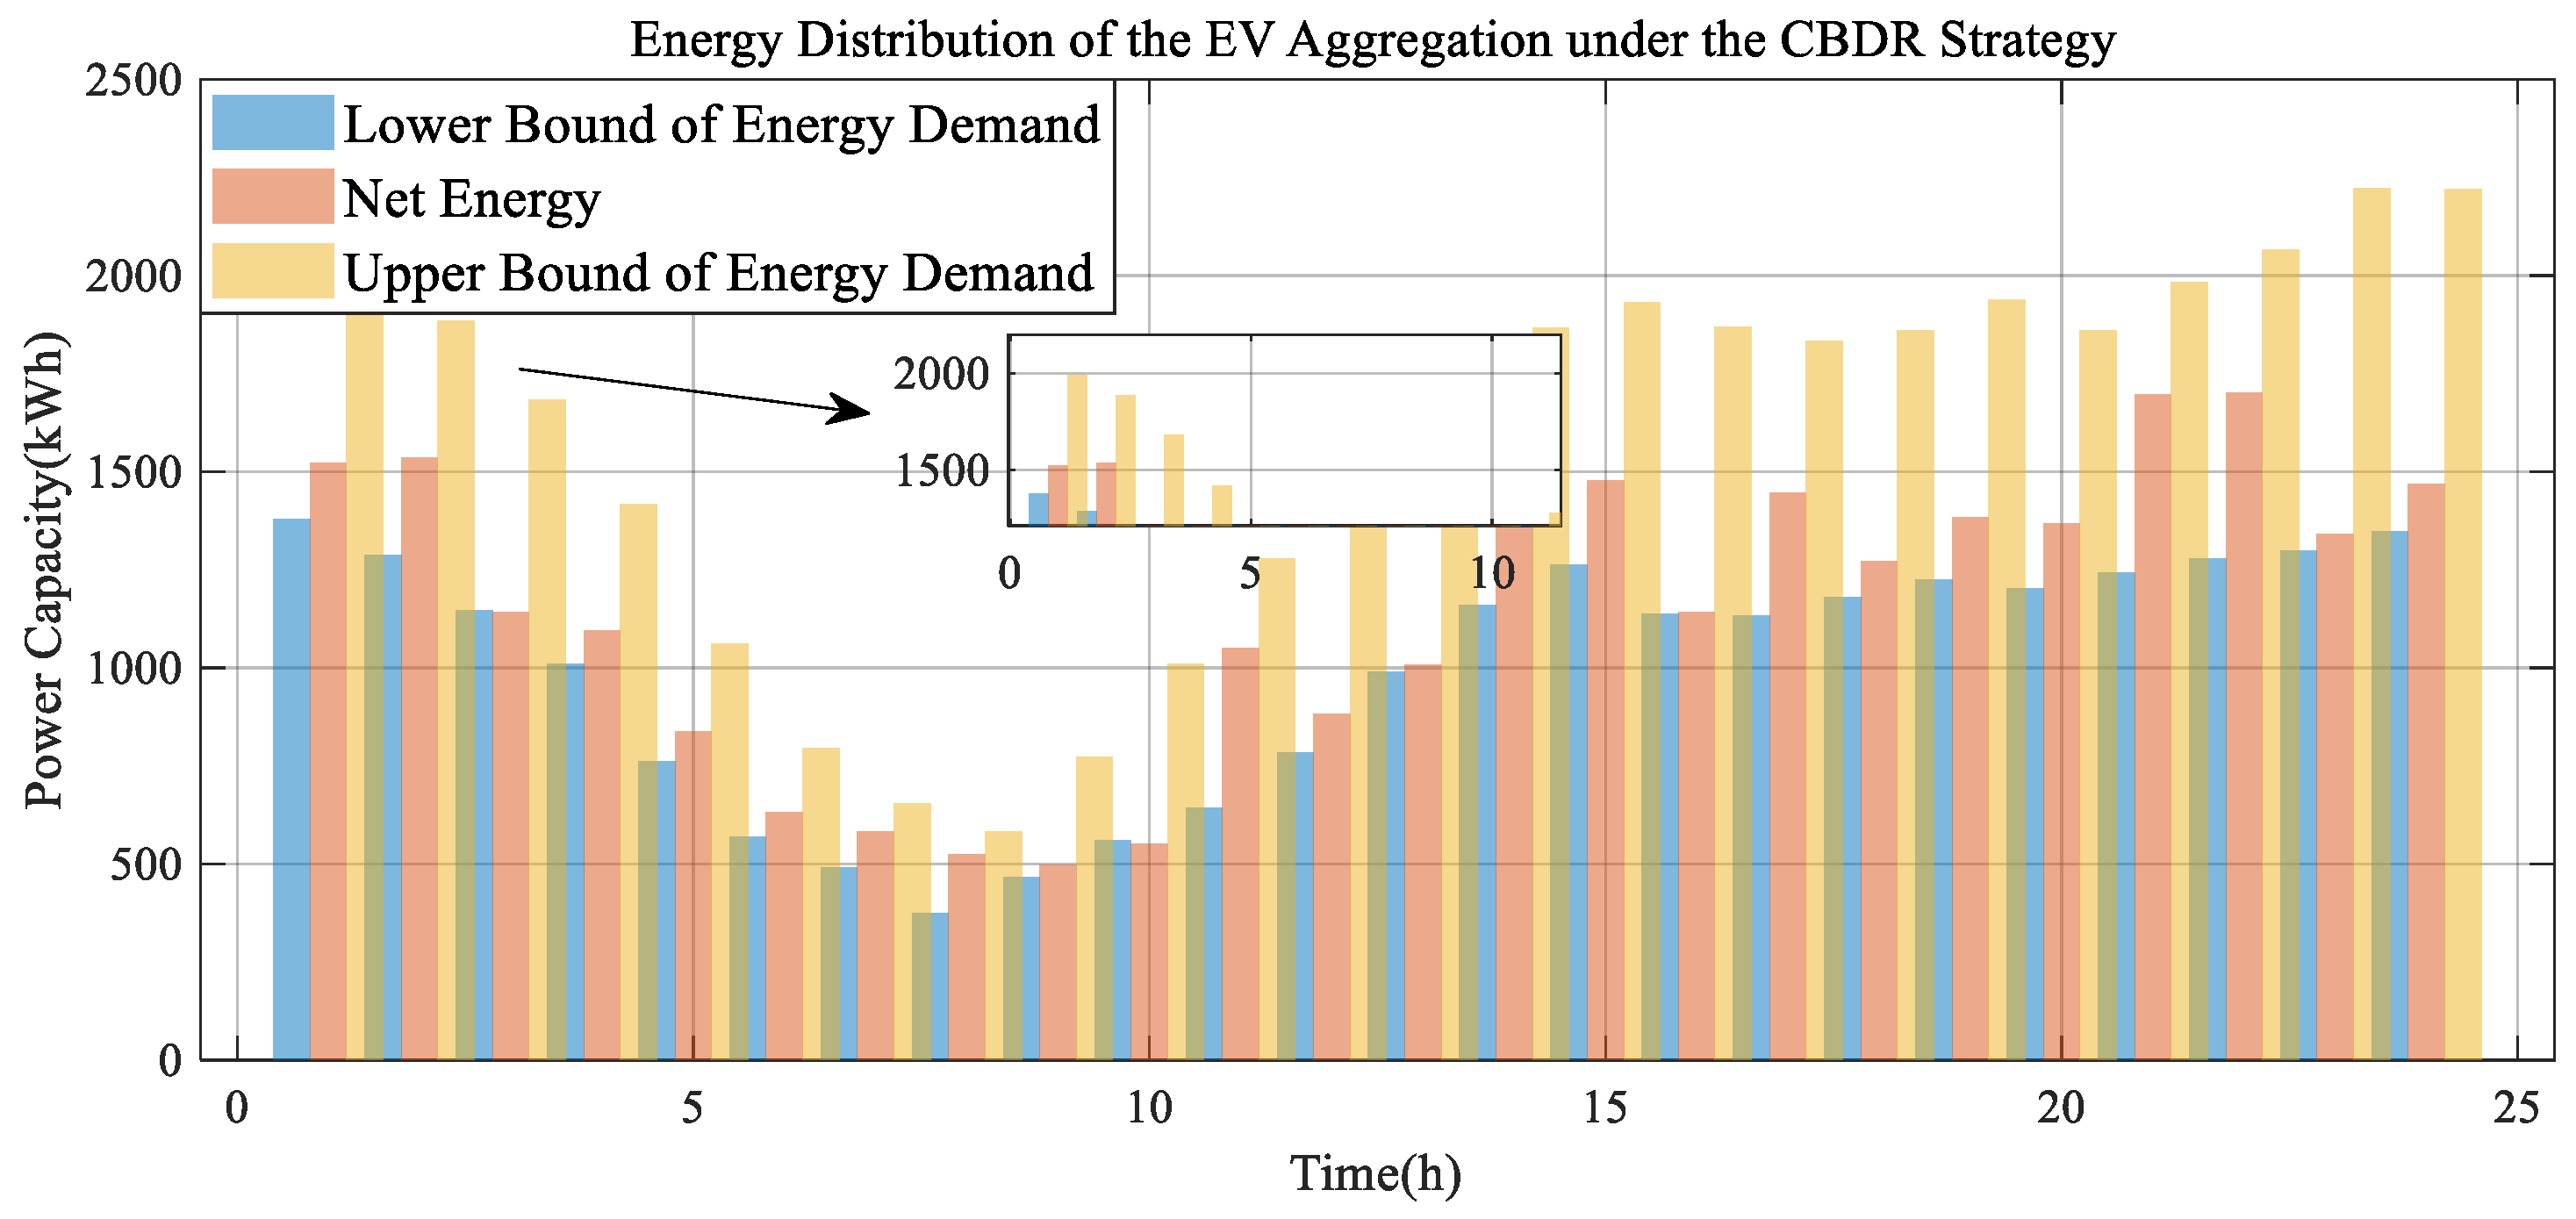
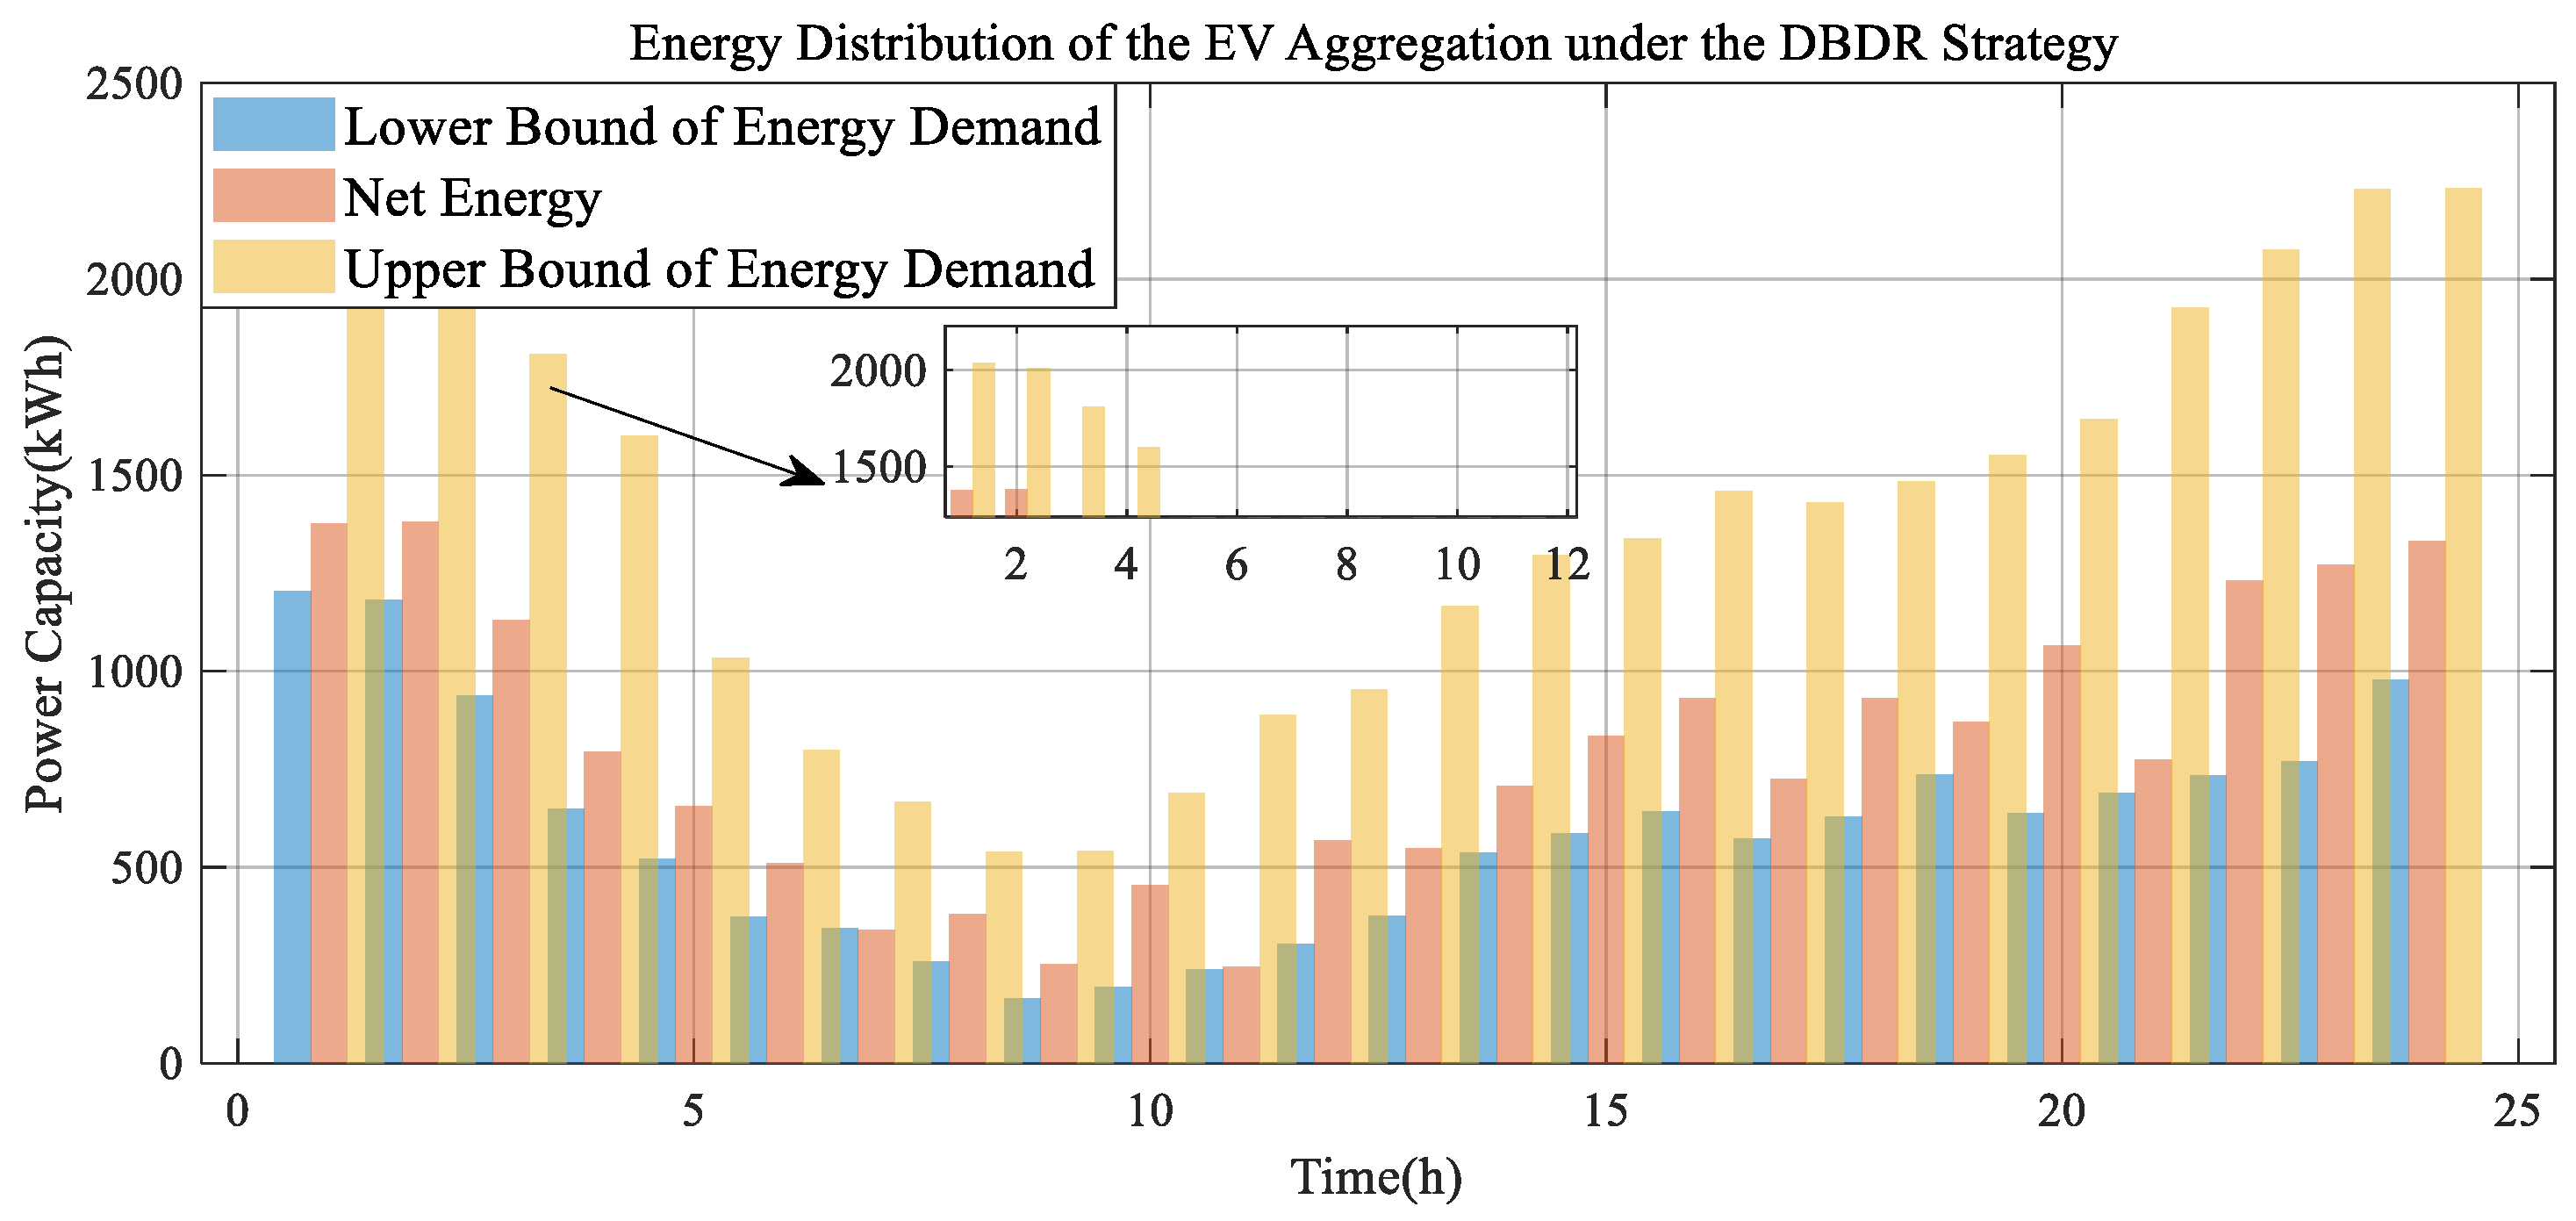
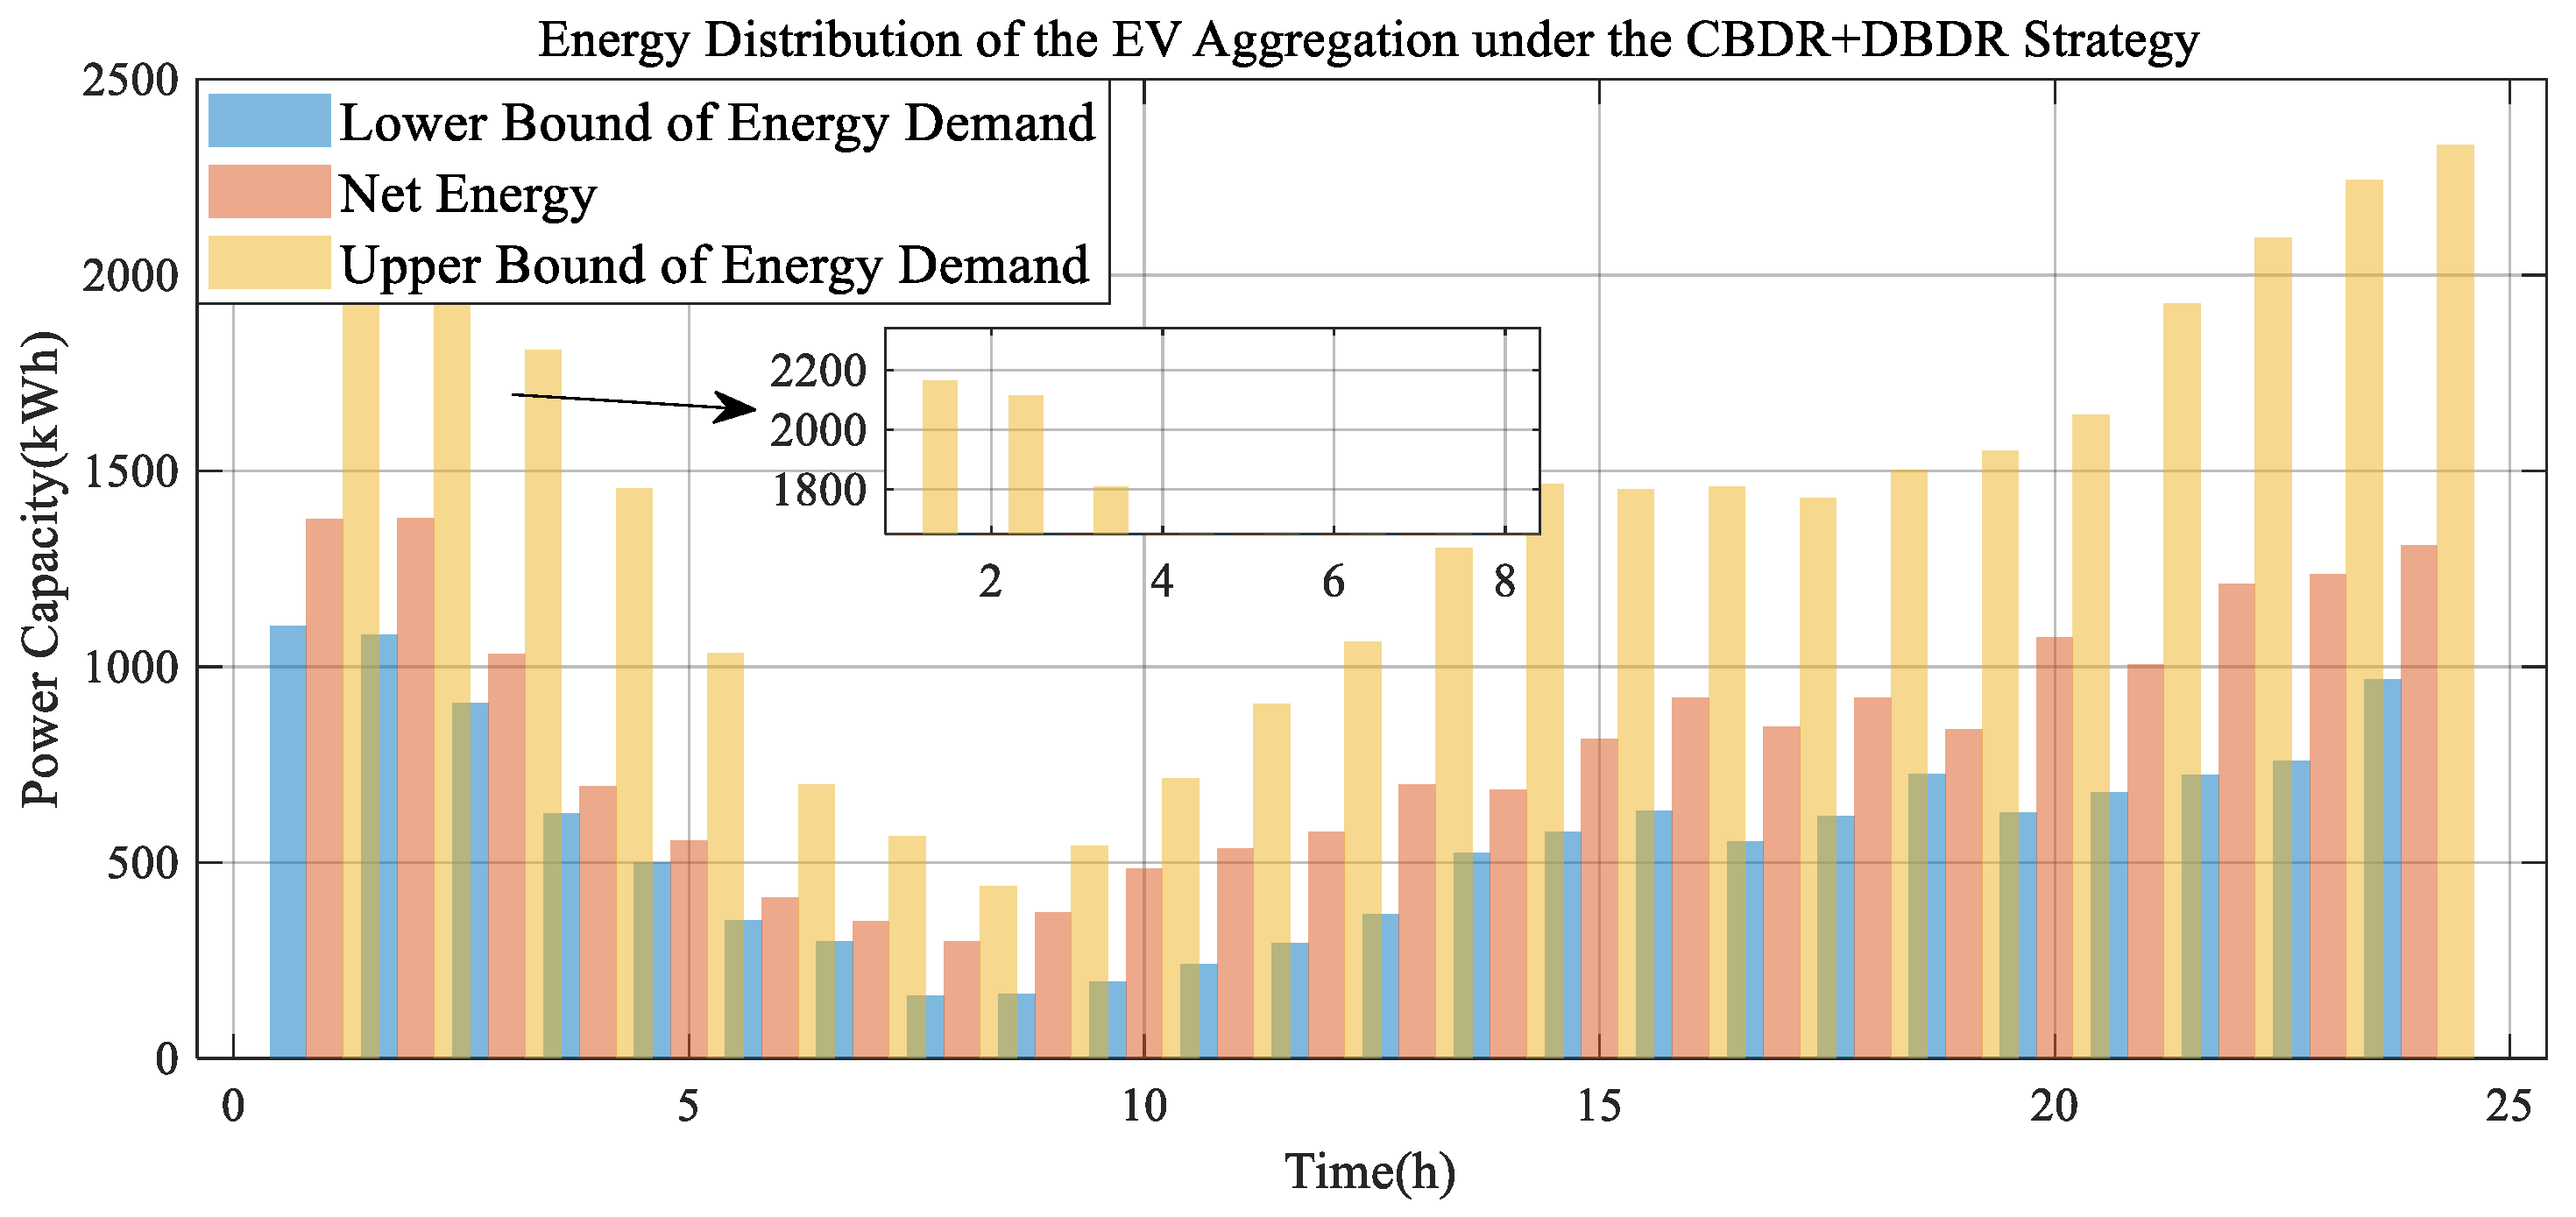
The energy distributions for Scenario 1, Scenario 2 and Scenario 3 are illustrated in Figure 9, Figure 10 and Figure 11. As shown in the figures, during the early morning hours, EV charging demand is relatively low, resulting in a narrower range of energy regulation. In the afternoon and evening periods, due to an increase in the number of connected EVs and rising charging demand, the energy regulation range expands accordingly.
Scenario 1 implements the charge-based demand response (CBDR) strategy. During off-peak periods, the electric vehicle aggregator (EVA) proactively stimulates EV charging to increase the grid load, thereby capitalizing on the comparatively low electricity prices prevalent at these times. This corresponds to Response Mode IV, wherein EVs actively absorb energy, thereby furnishing the grid with downward regulation capacity. By strategically incentivizing charging during off-peak hours, the EVA not only contributes to load leveling but also realizes economic benefits through optimized energy procurement.
Conversely, during peak load intervals, the EVA curtails or suspends EV charging activities to alleviate grid stress. A subset of EVs transition into Response Mode II, offering upward regulation by reducing their power consumption. Although these EVs lack the capability for reverse power flow (i.e., discharging back to the grid), they remain highly effective as controllable loads, possessing significant potential for energy regulation. This dynamic modulation of charging demand enables the EVA to effectively mitigate peak load pressures and support grid stability.
However, the inherent dynamic adjustment of energy consumption in accordance with the charging strategy leads to more pronounced fluctuations in energy profiles. Specifically, the start–stop nature of charging demand induces significant variability in the aggregate load curve, highlighting a trade-off intrinsic to the CBDR approach; while it enhances demand flexibility and regulation capacity, it simultaneously introduces greater energy volatility. This necessitates the integration of complementary strategies to achieve a smoother and more reliable load management.
In summary, Scenario 1 leverages the CBDR strategy to realize flexible load regulation across varying grid conditions, harnessing EVs as responsive controllable loads. This approach not only bolsters grid regulation capabilities and economic efficiency but also exposes challenges related to amplified energy fluctuations, underscoring the need for further holistic optimization.
Scenario 2 considers the implementation of the DBDR strategy. While meeting the minimum energy requirements of EV users, the EVA regulates EV discharging behavior to smooth energy fluctuations in the power system. In this case, EVs operate in Response Mode I, enabling the EVA to deliver upward regulation by feeding power back to the grid. However, considering battery degradation and travel demand constraints, the EVA must carefully manage the discharging duration and depth. As a result, energy fluctuations under DBDR are more moderate compared to those under CBDR.
Scenario 3 incorporates both the CBDR and DBDR strategies. The EVA dynamically adjusts the charging and discharging behavior of EVs in real time based on a combination of charging price discounts and discharging subsidies. This scenario involves Response Modes I, II, and IV. When the grid experiences significant peak regulation demand, the EVA can flexibly dispatch a portion of EVs to provide either upward or downward regulation, depending on the real-time grid operating conditions. Compared to single-response mechanisms, the dual-response strategy offers greater flexibility and adaptability, allowing the EVA to respond promptly to dynamic grid demands. Therefore, Scenario 3 demonstrates superior energy regulation performance, with significantly reduced net energy fluctuations and a substantially expanded feasible energy domain.

5.2. Real-Time Peak Regulation Margin and Revenue Analysis of the EVA

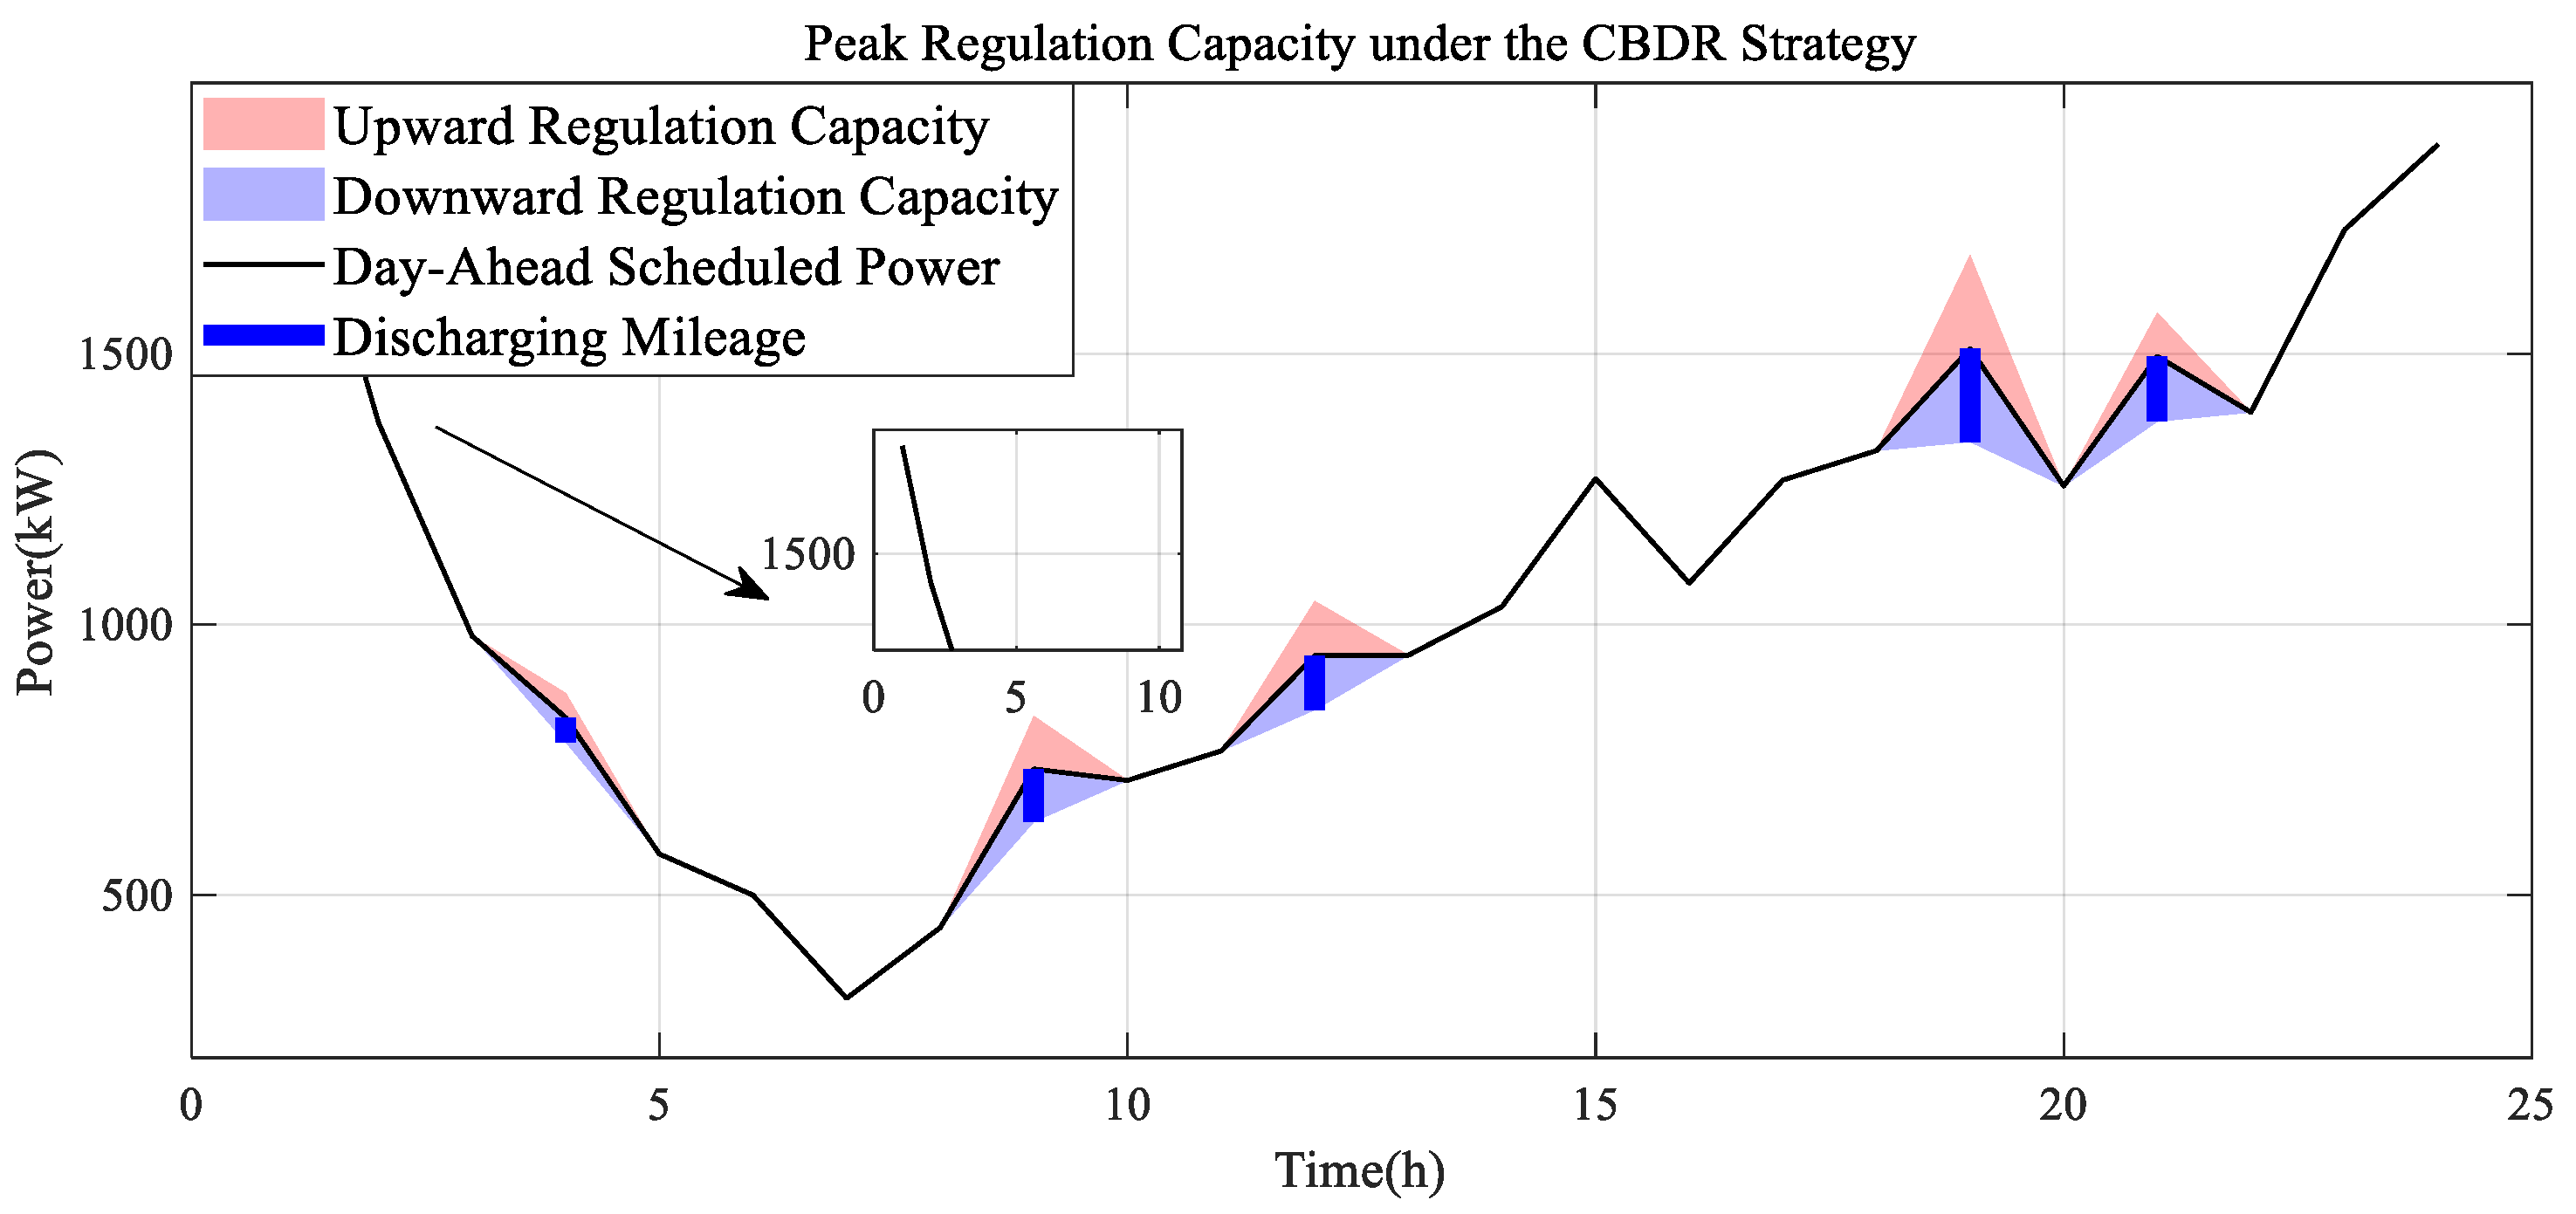
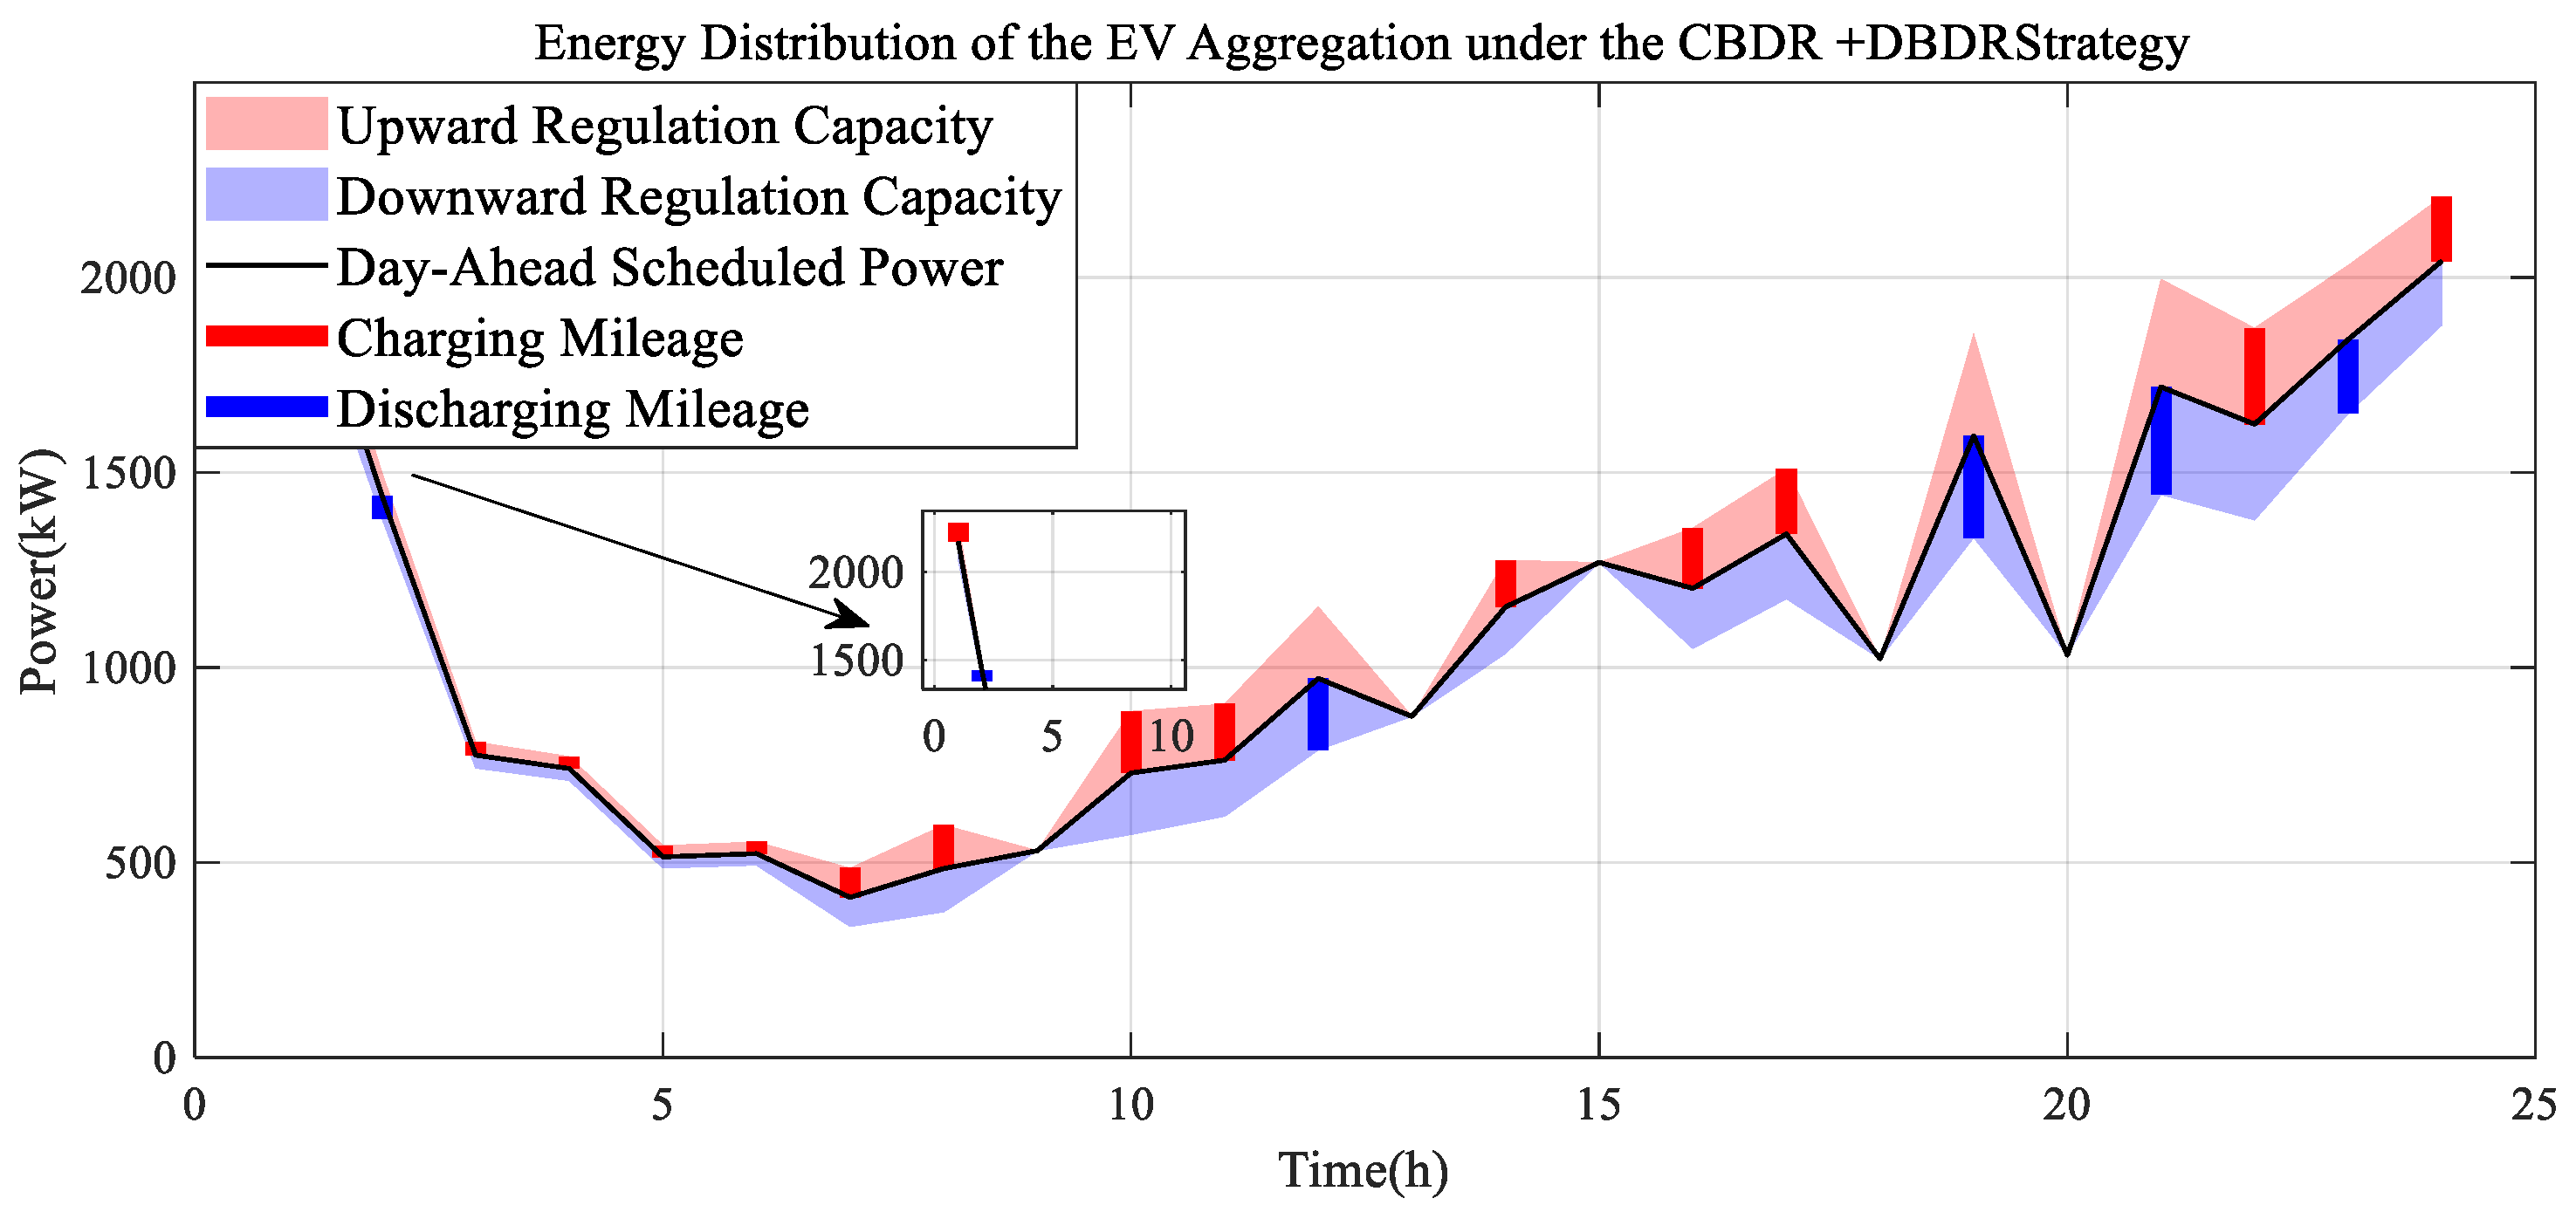
Based on the preceding evaluation of the energy distribution within EV aggregations, this section further analyzes the real-time peak regulation margin in different strategic scenarios, as illustrated in Figure 12, Figure 13 and Figure 14. Scenario 1 considers only the CBDR strategy, where the EVA adjusts charging behavior in certain time periods based on price signals and peak regulation demand, thereby reducing electricity procurement costs and providing a degree of downward regulation margin. Scenario 2 incorporates the DBDR strategy, enabling EVs to discharge in specific time slots and release upward regulation capacity. Scenario 3 integrates both the CBDR and DBDR strategies, allowing the EVA to balance both upward and downward regulation requirements simultaneously.
As shown in Figure 14, with the dual-response strategy, the EV charging demand exhibits a significant impact on peak regulation performance. During the early morning period (00:00–06:00), charging demand is low, resulting in limited regulation capacity. From 09:00 to 13:00, rising electricity prices lead to a reduction in EV charging demand. During this time, the EVA can dispatch a portion of EVs for discharging, thereby releasing an upward regulation margin. Between 13:00 and 18:00, as electricity prices decrease, EV charging demand increases. The EVA responds by moderately increasing charging loads, thus expanding the downward regulation margin to absorb excess grid energy and alleviate system pressure. After 18:00, electricity prices rise again. The EVA can adapt EV charging and discharging behaviors based on real-time system load conditions—by reducing charging or enabling moderate discharging when necessary—to continue providing upward regulation capacity and help balance power system fluctuations.
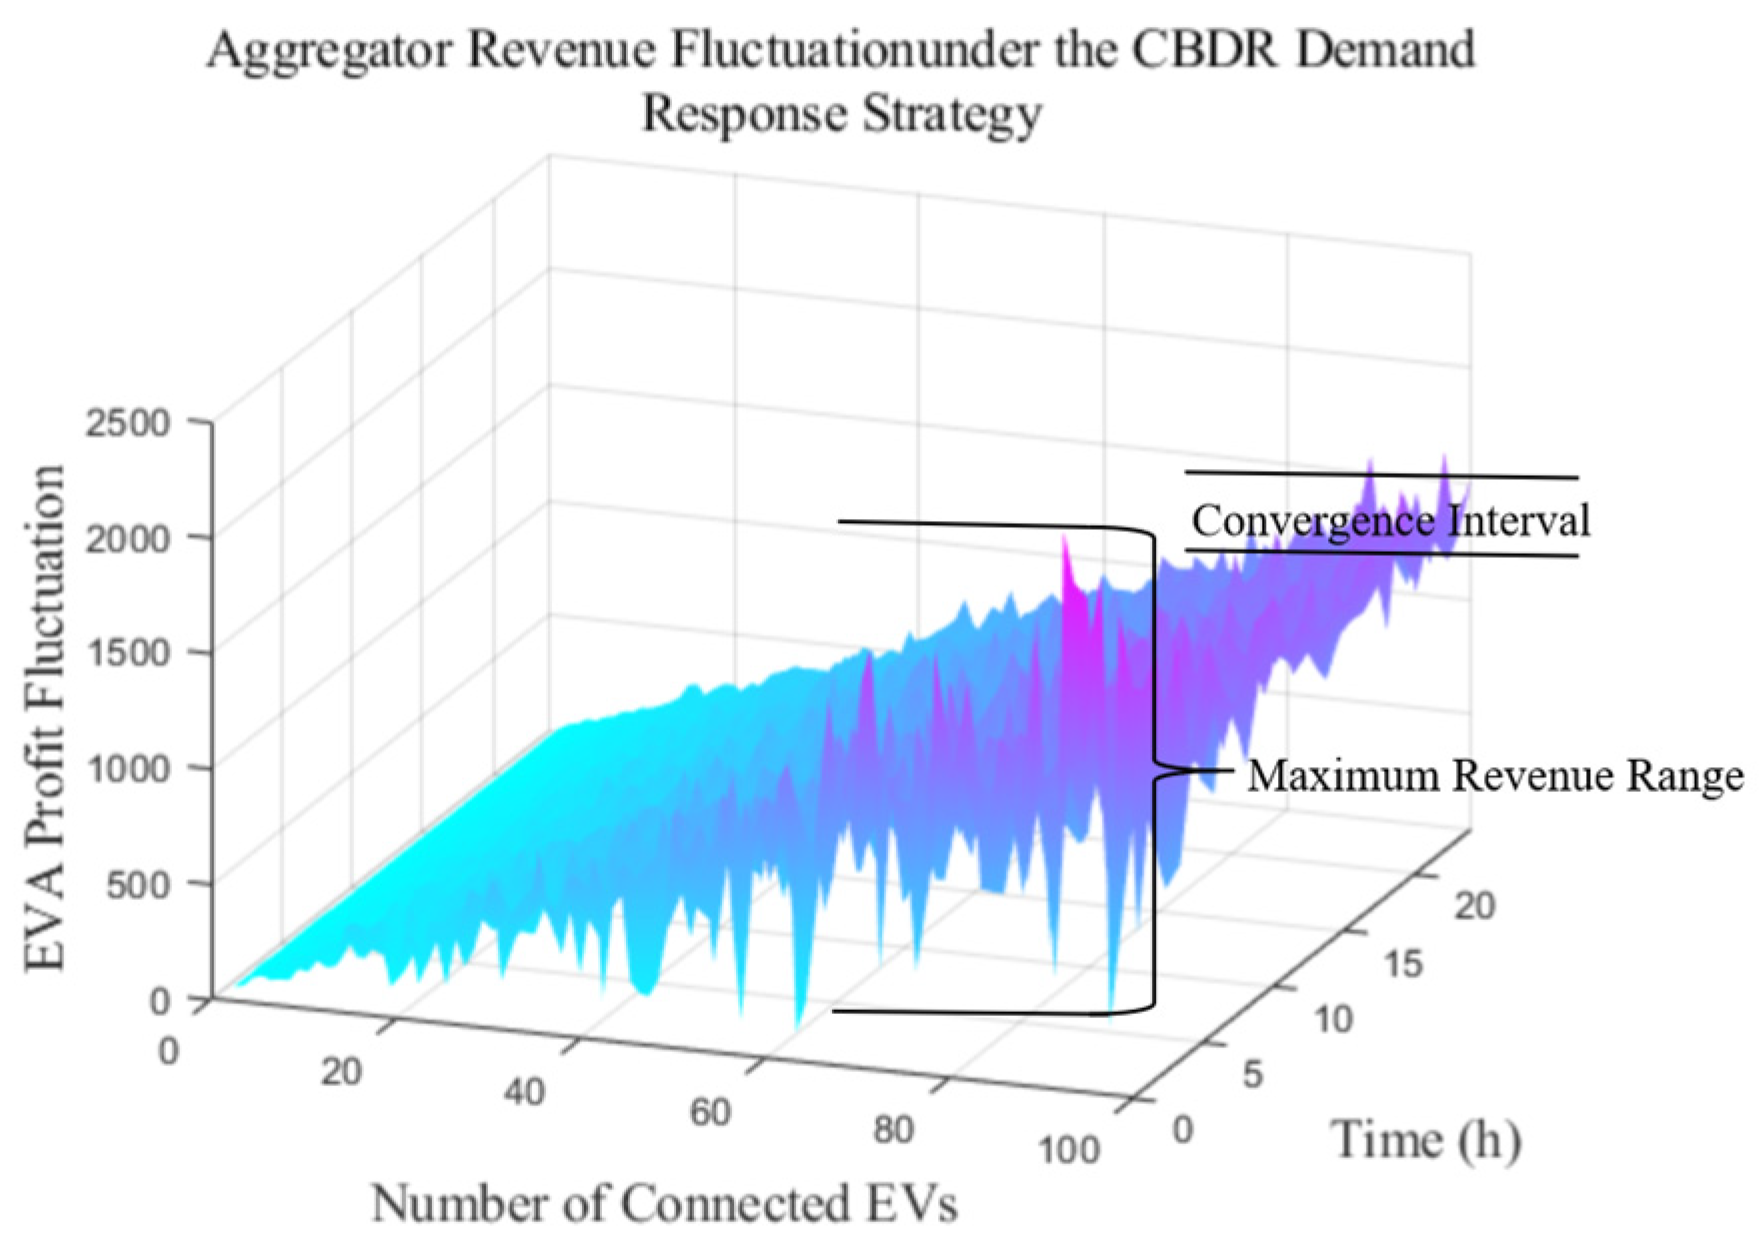
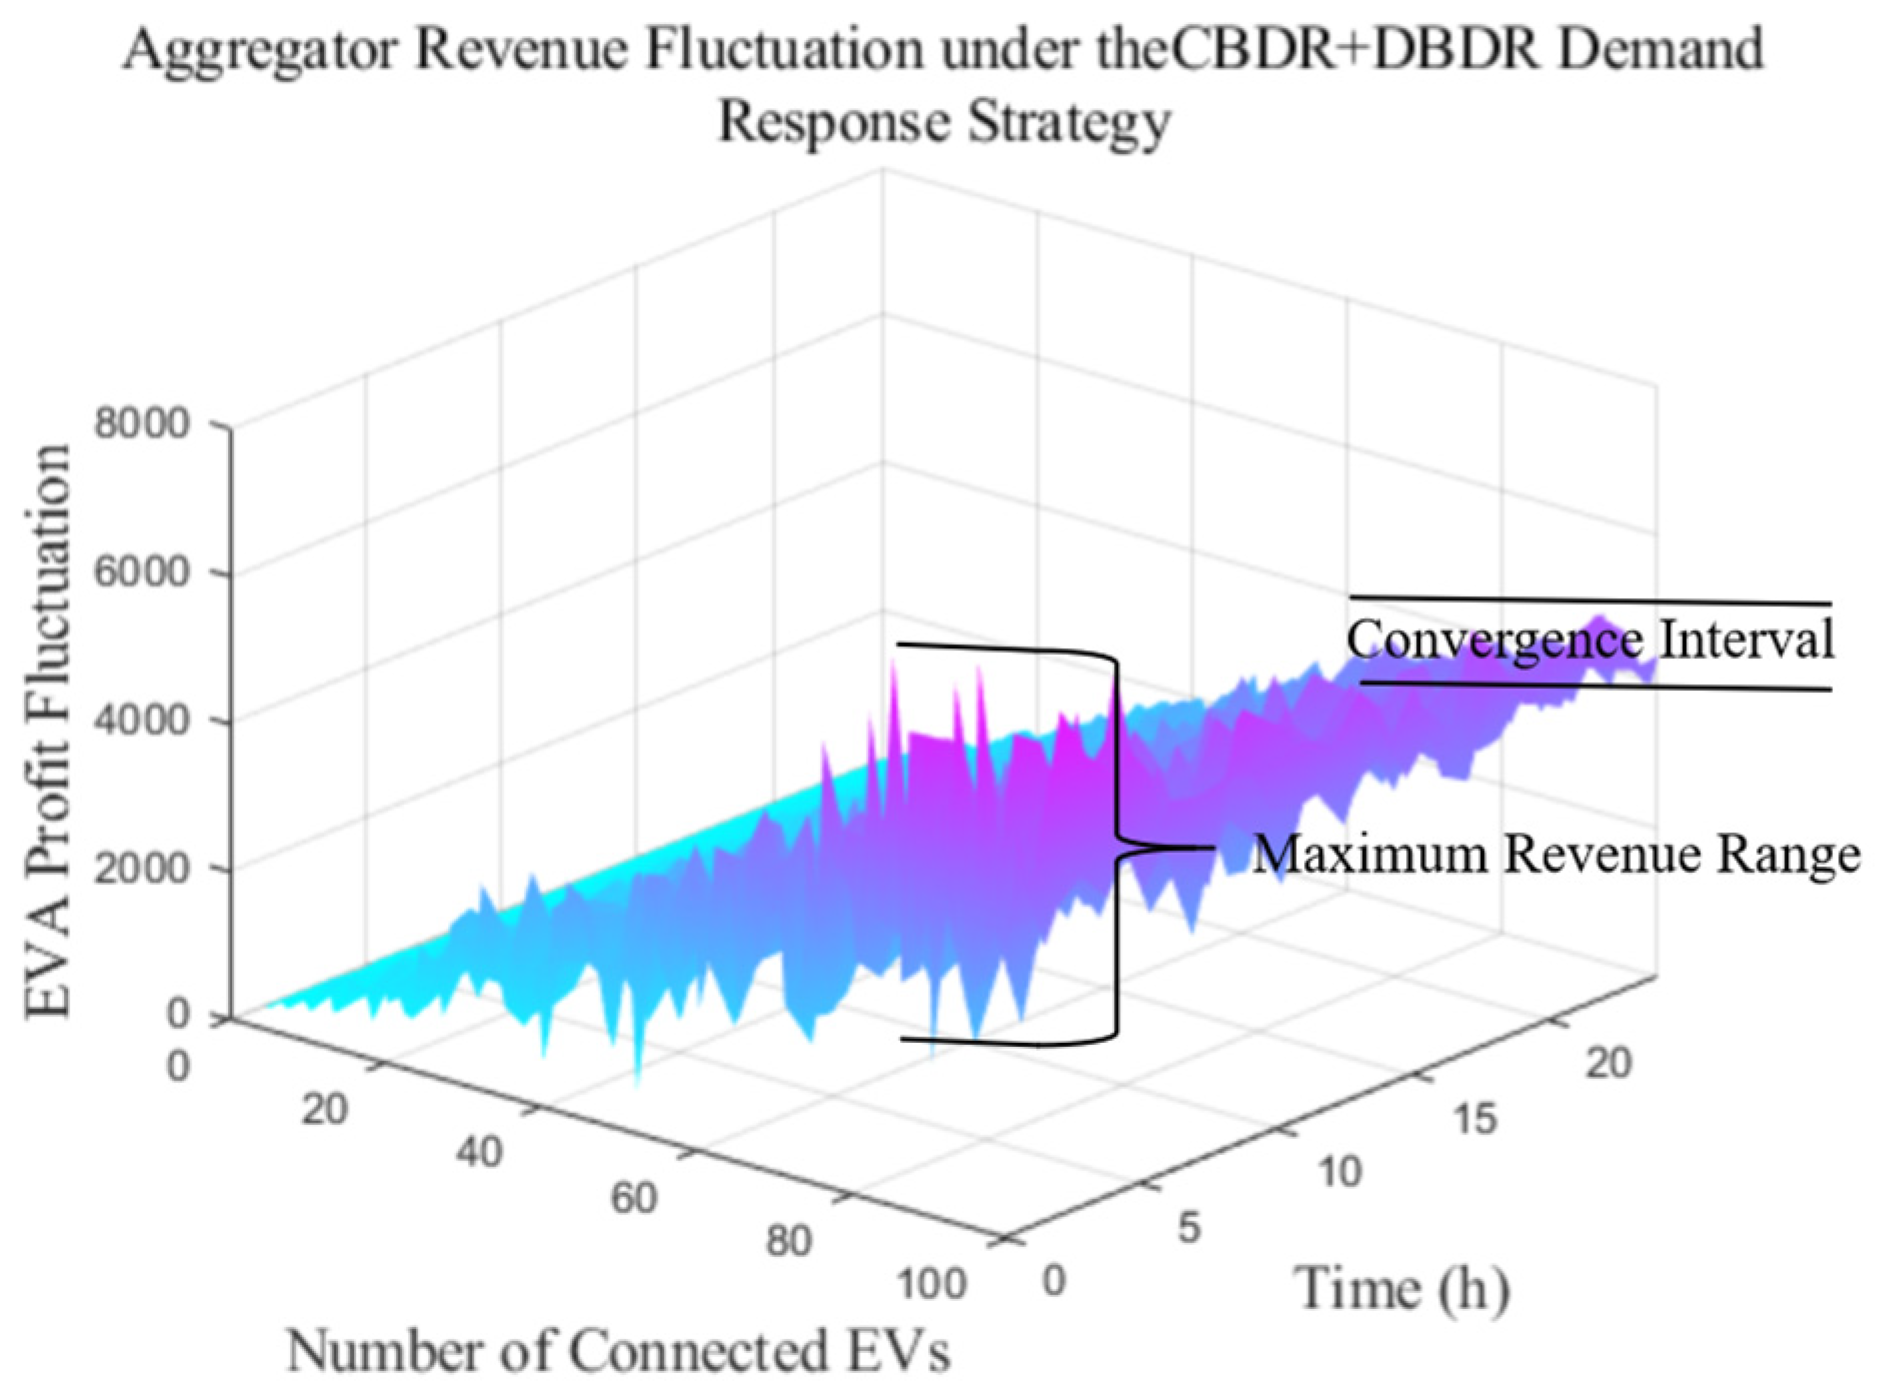
In the three scenarios presented in Table 4, the EVA’s revenue performance varies accordingly. As the number of EVs participating in peak regulation increases, the EVA’s total revenue exhibits an overall upward trend. However, once the number of connected EVs reaches the maximum controllable threshold of the EVA’s management region, further revenue growth becomes constrained by limitations in EV quantity, energy, and power capacity, and thus begins to stabilize. With the different strategies, the overall revenue performance follows the following pattern: CBDR < DBDR < CBDR + DBDR. CBDR relies on predefined price discounts; although it provides stable returns, its growth potential is limited. DBDR, influenced by discharging subsidies, achieves relatively higher user participation and allows the EVA to receive partial compensation through ancillary services, resulting in a wider revenue range than CBDR alone. In the combined CBDR and DBDR scenario, the two mechanisms are complementary, enabling the EVA to achieve more refined regulation and response control. This leads to the highest revenue potential among all strategies. However, revenue growth is still subject to constraints imposed by EV charging/discharging capabilities and the EVA’s energy boundaries. Once the total number of connected EVs reaches saturation, revenue again stabilizes, as illustrated in Figure 15, Figure 16 and Figure 17. Compared with Scenarios 1 and 2, Scenario 3 offers significantly greater revenue potential.

5.3. Analysis of EV User Willingness

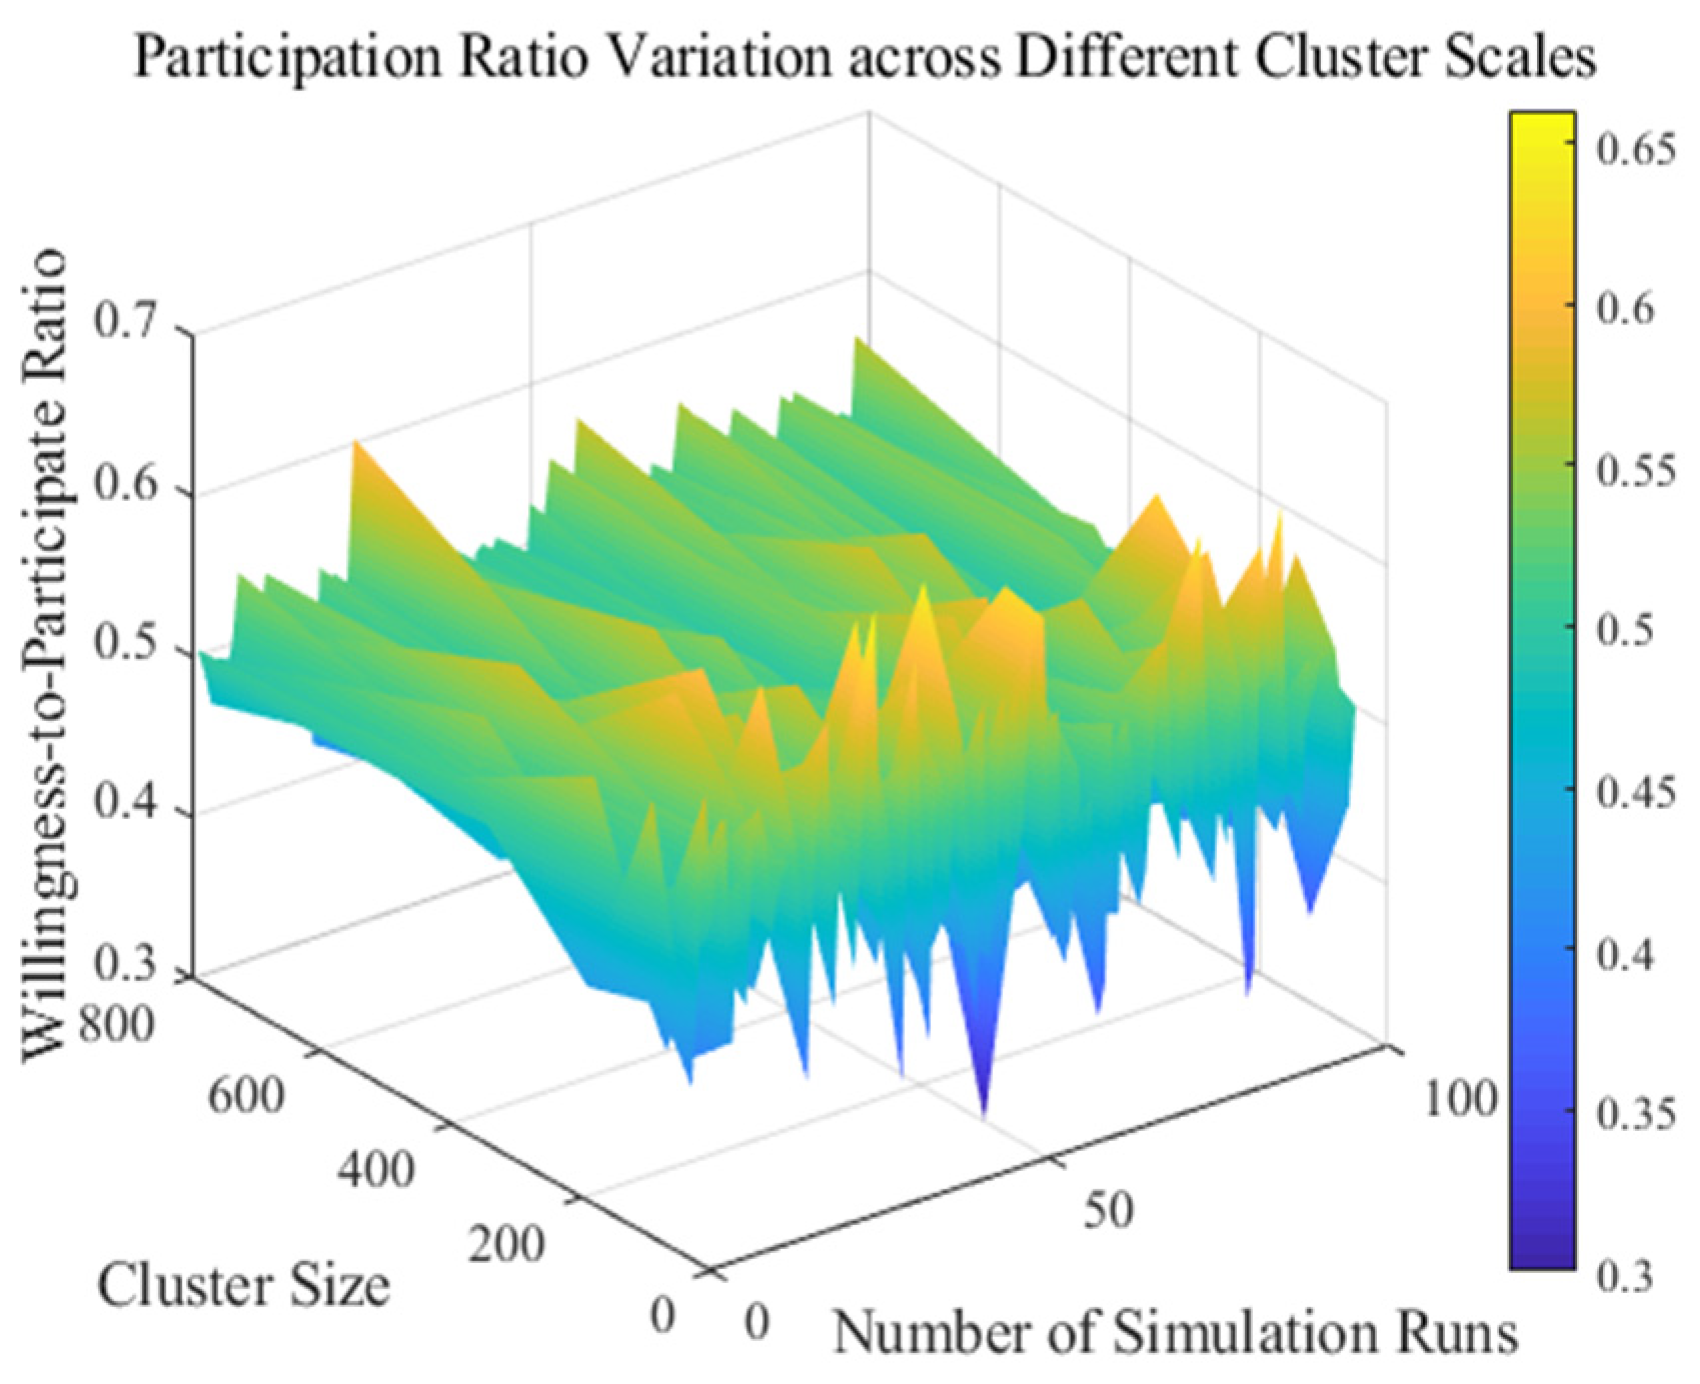
To investigate the response characteristics of electric vehicle users under ancillary service peak regulation strategies, this study constructs a willingness modeling mechanism based on a sample of 100 EVs. The model incorporates user behavioral heterogeneity and response elasticity, and multi-dimensional simulations are conducted with representative price incentive strategies from the perspectives of time, price sensitivity, and battery state. Figure 18 illustrates the behavioral differences and the evolution of overall participation rates under upward and downward regulation commands. The specific analyses are as follows.
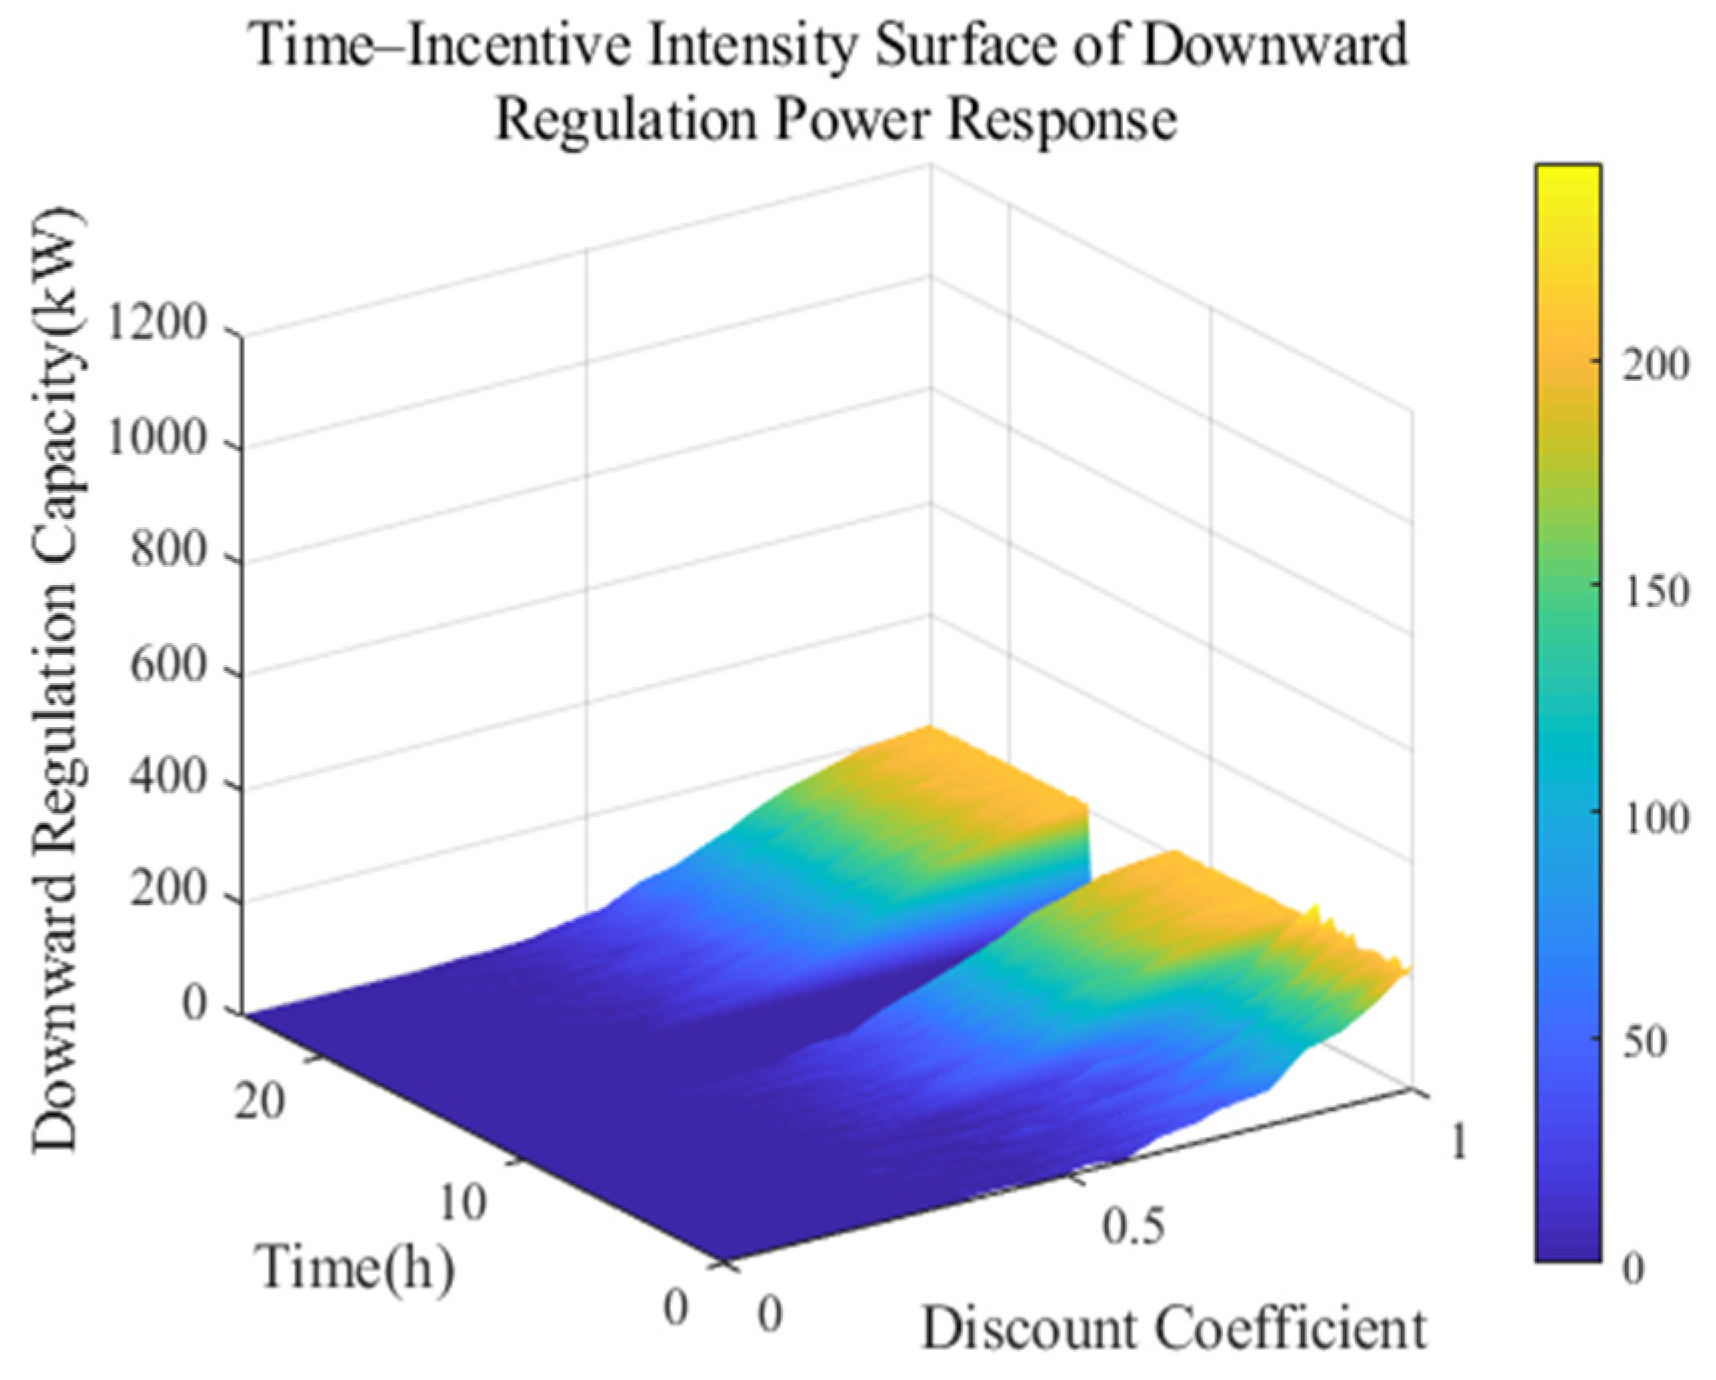
Figure 18 shows the variation in individual response durations when 100 EVs are subjected to upward regulation signals. The results reveal significant differences across users, with an average duration of approximately 0.4 h. The maximum and minimum response times differ by more than a factor of two, indicating strong behavioral heterogeneity. This characteristic provides a modeling basis for the subsequent implementation of tiered incentive mechanisms and precision dispatch strategies. Figure 19 examines the variation in EV aggregation participation rates under different combinations of initial states of charge (SOCs) and incentive pricing. The simulation results show that when the SOC is at a medium to high level and the incentive price aligns closely with user expectations, the overall participation rate increases significantly. Insufficient compensation fails to cover the perceived cost of participation, while overly high compensation may raise concerns about potential risks, causing some users to refrain, resulting in a “mid-range optimum” participation structure. Figure 20 and Figure 21 present the distribution of upward and downward response power, respectively, under varying time intervals and discount coefficients. In the upward regulation scenario, the response power increases rapidly between 10:00 and 16:00, and higher incentive coefficients correlate with stronger response capability. In contrast, downward regulation responses are concentrated between 18:00 and 22:00, with a stepwise increase in power that forms a plateau-like structure. This indicates that downward responses are more dependent on strong price signals and exhibit higher price sensitivity.
In summary, EV users’ willingness to participate in regulation is jointly influenced by multiple interdependent factors, including charging status, electricity price incentives, and dispatch timing. Carefully designed time-of-use pricing schemes and differentiated incentive mechanisms can significantly enhance the peak regulation capabilities of EV aggregations, thereby supporting improved system flexibility and ancillary service provision. To further quantify the effectiveness of the proposed strategies, several key performance indicators (KPIs) are calculated and summarized in Table 4. These indicators include peak load reduction percentage, average cost savings per kWh for participating EVs, and changes in the load factor of the EVA.
Peak load reduction (%): Compared to the baseline (uncoordinated charging), the combined CBDR + DBDR strategy achieves an average peak shaving of 28.7%, whereas CBDR and DBDR alone yield 14.3% and 21.1%, respectively.
Average cost savings per kWh: Participating EV users under the CBDR + DBDR scheme achieve an average cost saving of $0.18/kWh, which is higher than $0.09/kWh (CBDR only) and $0.13/kWh (DBDR only).
Load factor improvement: The load factor of the EVA’s operation improves from a baseline of 0.63 to 0.81 with the joint-response strategy, indicating better utilization of charging capacity and flatter load profiles.

6. Conclusions

First, by analyzing the controllable power region and response boundaries of EVs, this study clarified the upward and downward regulation capabilities of individual EVs and their evolutionary characteristics under aggregation. Using CBDR and DBDR as the entry points, the study explored the impact of single-response and joint-response strategies on EV energy distribution. The results indicate that single-response strategies are inherently limited by unidirectional power regulation, resulting in larger energy fluctuations. In contrast, with the combined CBDR + DBDR strategy, the EVA can flexibly switch between charging and discharging commands based on the system’s real-time operating state, thereby coordinating upward and downward regulation capabilities while reducing reliance on carbon-intensive peaking plants. This results in significantly smoother energy profiles and more stable overall system operation.
Second, considering the temporal characteristics of EV charge/discharge behavior and the multi-period peak regulation requirements of ancillary service markets, an optimal scheduling model was constructed with the objective of maximizing EVA operational revenue while promoting sustainable energy management. The model integrates EV users’ willingness to respond to price incentives at different times by introducing a discount coefficient–satisfaction mapping, which dynamically adjusts the controllable load boundaries. This reflects the nonlinear nature of user participation. The model was solved using the CPLEX solver, and the simulation results demonstrate that with the CBDR strategy, the EVA mainly undertakes downward regulation tasks; with the DBDR strategy, the focus shifts to upward regulation. In the combined response scenario, the EVA can achieve bidirectional regulation, showcasing enhanced load-tracking capabilities and improved dispatch flexibility.
Furthermore, a comparative analysis of EVA revenue fluctuations with different response strategies reveals that as EV penetration increases, total revenue consistently improves while supporting clean transportation adoption. However, due to uncertainties in user response behavior—affected by price incentives, battery state, and usage habits—system revenues exhibit non-negligible fluctuations. In particular, user willingness shows segmented sensitivity; for instance, high SOC levels combined with attractive price incentives yield higher response probabilities. This highlights the need for dynamic compensation strategies tailored to user profiles that align economic benefits with sustainability goals.
Despite these promising results, several limitations of this study should be acknowledged. First, the simulations rely on synthetic data and assumed behavioral models, without validation from real-world EV operation datasets. Second, the model assumes full knowledge of electricity prices and vehicle availability, which may not hold under practical grid conditions with inherent uncertainties. Third, the battery degradation cost is simplified and does not reflect variation across battery types, ambient temperatures, or usage cycles. Socioeconomic dimensions—such as income level, vehicle ownership patterns, or seasonal demand shifts—are also not explicitly captured. Moreover, while the proposed scheduling strategy performs well on the 100 EV testbed, its scalability and real-time efficiency in large-scale applications remain to be tested.
Moreover, although this study primarily focuses on the temporal coordination strategy of EV aggregators within ancillary service markets, it is imperative to recognize that large-scale deployment of EVAs introduces additional operational complexities and systemic dynamics that merit further investigation. As the penetration level of EVs increases, the aggregation size expands accordingly, leading to amplified challenges in accurately forecasting user behavior, maintaining real-time communication reliability, and managing computational scalability in dispatch optimization. Moreover, spatial–temporal diversity across a larger population exacerbates uncertainties in energy availability and response consistency, potentially diluting the overall effectiveness of incentive-based demand response schemes. From a system perspective, high-density EVA deployment may also influence local grid stability, transformer loading, and congestion management, particularly in distribution-level networks. These phenomena suggest that EVA performance metrics—such as regulation capacity, economic return, and user participation rates—may exhibit nonlinear or saturation effects in high-adoption scenarios. Therefore, future research should extend the current model to incorporate grid-constrained EVA coordination, peer-to-peer interactions among EV clusters, and adaptive learning mechanisms for real-time control. Despite these prospective extensions, this paper remains centered on developing a tractable and behaviorally grounded scheduling framework tailored to medium-scale aggregation scenarios. The presented methodology establishes foundational insights that can be incrementally scaled and validated in follow-up studies targeting ultra-large EVA networks.
Overall, the revenue performance with different strategies follows the trend of CBDR < DBDR < CBDR + DBDR, confirming that composite response mechanisms can not only unlock greater regulation capacity but also enhance revenue stability and user engagement. Future work will incorporate real-world data and stochastic modeling and explore distributed or hierarchical architectures to improve scalability and practical deployment.

Author Contributions

Conceptualization, X.M.; methodology, Y.L.; software, X.M.; validation, Y.L.; formal analysis, X.M.; investigation, C.T.; resources, B.P.; data curation, Y.L.; writing—original draft preparation, X.M.; writing—review and editing, B.P.; visualization, Y.L.; supervision, B.P.; project administration, C.T.; funding acquisition, B.P. All authors have read and agreed to the published version of the manuscript.

Funding

This research was funded by the Technology Project of State Grid Corporation of China and State Grid Shandong Electric Power Company (Grant Number: 5400-202316582A-3-2-ZN). The APC was funded by the same project.

Institutional Review Board Statement

Not applicable.

Informed Consent Statement

Not applicable.

Data Availability Statement

The data used in this study were provided by the State Grid Corporation of China. Although no new data were generated, and the existing data cannot be shared publicly due to privacy and ethical restrictions, this statement is provided in accordance with the journal’s data availability policy.

Conflicts of Interest

This manuscript has not been published or presented elsewhere, in whole or in part, and is not under consideration by any other journal. The journal’s policies have been read and understood, and the manuscript and underlying study are in full compliance. No conflicts of interest are declared.

References

  1. Mohiti, M.; Monsef, H.; Lesani, H. A decentralized robust model for coordinated operation of smart distribution network and electric vehicle aggregators. Int. J. Electr. Power Energy Syst. 2019, 104, 853–867. [Google Scholar] [CrossRef]
  2. Nie, X.P.; Mansouri, S.A.; Jordehi, A.R.; Tostado-Véliz, M. A two-stage optimal mechanism for managing energy and ancillary services markets in renewable-based transmission and distribution networks by participating electric vehicle and demand response aggregators. Int. J. Electr. Power Energy Syst. 2024, 158, 109917. [Google Scholar] [CrossRef]
  3. Ireshika, M.A.S.T.; Kepplinger, P. Uncertainties in model predictive control for decentralized autonomous demand side management of electric vehicles. J. Energy Storage 2024, 83, 110194. [Google Scholar] [CrossRef]
  4. Aljohani, T.; Mohamed, M.A.; Mohammed, O. Tri-level hierarchical coordinated control of large-scale EVs charging based on multi-layer optimization framework. Electr. Power Syst. Res. 2024, 226, 109923. [Google Scholar] [CrossRef]
  5. Shern, S.J.; Sarker, M.T.; Haram, M.H.S.M.; Ramasamy, G.; Thiagarajah, S.P.; Al Farid, F. Artificial intelligence optimization for user prediction and efficient energy distribution in electric vehicle smart charging systems. Energies 2024, 17, 5772. [Google Scholar] [CrossRef]
  6. Liu, Z.-F.; Liu, Y.-Y.; Jia, H.-J.; Jin, X.-L.; Liu, T.-H.; Wu, Y.-Z. Bi-level energy co-optimization of regional integrated energy system with electric vehicle to generalized-energy conversion framework and flexible hydrogen-blended gas strategy. Appl. Energy 2025, 390, 125868. [Google Scholar] [CrossRef]
  7. Daneshzand, F.; Coker, P.J.; Potter, B.; Smith, S.T. Ev smart charging: How tariff selection influences grid stress and carbon reduction. Appl. Energy 2023, 348, 121482. [Google Scholar] [CrossRef]
  8. Yong, J.Y.; Tan, W.S.; Khorasany, M.; Razzaghi, R. Electric vehicles destination charging: An overview of charging tariffs, business models and coordination strategies. Renew. Sustain. Energy Rev. 2023, 184, 113534. [Google Scholar] [CrossRef]
  9. Lin, H.; Zhou, Y.; Li, Y.; Zheng, H. Aggregator pricing and electric vehicles charging strategy based on a two-layer deep learning model. Electr. Power Syst. Res. 2024, 227, 109971. [Google Scholar] [CrossRef]
  10. Banda, P.; Bhuiyan, M.A.; Hasan, K.N.; Zhang, K. Assessment of hybrid transfer learning method for forecasting EV profile and system voltage using limited EV charging data. Sustain. Energy Grids Netw. 2023, 36, 101191. [Google Scholar] [CrossRef]
  11. Yadav, K.; Singh, M. Implementation of DC net metering scheme in off-board EV charging systems with a time of usage capability. Electr. Power Syst. Res. 2023, 224, 109690. [Google Scholar] [CrossRef]
  12. Rezaei, N.; Khazali, A.; Mazidi, M.; Ahmadi, A. Economic energy and reserve management of renewable-based microgrids in the presence of electric vehicle aggregators: A robust optimization approach. Energy 2020, 201, 117629. [Google Scholar] [CrossRef]
  13. Gao, X.; Chan, K.W.; Xia, S.; Zhou, B.; Lu, X.; Xu, D. Risk-constrained offering strategy for a hybrid power plant consisting of wind power producer and electric vehicle aggregator. Energy 2019, 177, 183–191. [Google Scholar] [CrossRef]
  14. Alipour, M.; Mohammadi-Ivatloo, B.; Moradi-Dalvand, M.; Zare, K. Stochastic scheduling of aggregators of plug-in electric vehicles for participation in energy and ancillary service markets. Energy 2017, 118, 1168–1179. [Google Scholar] [CrossRef]
  15. Park, S.-W.; Cho, K.-S.; Hoefter, G.; Son, S.-Y. Electric vehicle charging management using location-based incentives for reducing renewable energy curtailment considering the distribution system. Appl. Energy 2022, 305, 117680. [Google Scholar] [CrossRef]
  16. Li, F.; Gao, Y.; Wu, Y.; Xia, Y.; Wang, C.; Hu, J.; Huang, Z. Incentive learning-based energy management for hybrid energy storage system in electric vehicles. Energy Convers. Manag. 2023, 293, 117480. [Google Scholar] [CrossRef]
  17. Anqi, W. Economic efficiency of high-performance electric vehicle operation based on neural network algorithm. Comput. Electr. Eng. 2023, 112, 109026. [Google Scholar] [CrossRef]
  18. He, Z.; Hou, H.; Hou, T.; Fang, R.; Tang, J.; Xie, C. Multi-objective optimization for improving EV users’ adhesion with hybrid demand response strategy. Energy Rep. 2023, 9, 316–322. [Google Scholar] [CrossRef]
  19. Dokuchaev, N.; Zolotarevich, V. Optimal energy storing and selling in continuous time stochastic multi-battery setting. Sustain. Energy Grids Netw. 2020, 22, 100340. [Google Scholar] [CrossRef]
  20. Zhou, X.; Liu, X.; Liu, H.; Ji, Z.; Li, F. Optimal dispatching strategy for residential demand response considering load participation. Glob. Energy Interconnect. 2024, 7, 38–47. [Google Scholar] [CrossRef]
  21. Ren, H.; Zhang, A.; Wang, F.; Yan, X.; Li, Y.; Duić, N.; Shafie-Khah, M.; Catalão, J.P. Optimal scheduling of an EV aggregator for demand response considering triple level benefits of three-parties. Int. J. Electr. Power Energy Syst. 2021, 125, 106447. [Google Scholar] [CrossRef]
  22. Golmohamadi, H.; Keypour, R.; Bak-Jensen, B.; Pillai, J.R. A multi-agent based optimization of residential and industrial demand response aggregators. Int. J. Electr. Power Energy Syst. 2019, 107, 472–485. [Google Scholar] [CrossRef]
  23. Li, K.; Wang, F.; Mi, Z.; Fotuhi-Firuzabad, M.; Duić, N.; Wang, T. Capacity and output power estimation approach of individual behind-the-meter distributed photovoltaic system for demand response baseline estimation. Appl. Energy 2019, 253, 113595. [Google Scholar] [CrossRef]
  24. Shafie-Khah, M.; Heydarian-Forushani, E.; Golshan, M.E.H.; Siano, P.; Moghaddam, M.; Sheikh-El-Eslami, M.; Catalão, J. Optimal trading of plug-in electric vehicle aggregation agents in a market environment for sustainability. Appl. Energy 2016, 162, 601–612. [Google Scholar] [CrossRef]
  25. Lu, X.; Li, K.; Xu, H.; Wang, F.; Zhou, Z.; Zhang, Y. Fundamentals and business model for resource aggregator of demand response in electricity markets. Energy 2020, 204, 117885. [Google Scholar] [CrossRef]
  26. Cavus, M.; Allahham, A. Spatio-Temporal Attention-Based Deep Learning for Smart Grid Demand Prediction. Electronics 2025, 14, 2514. [Google Scholar] [CrossRef]
  27. Li, H.; Liu, H.; Ma, J.; Li, D.; Zhang, W. Distributionally robust optimal dispatching method of integrated electricity and heating system based on improved Wasserstein metric. Int. J. Electr. Power Energy Syst. 2023, 151, 109120. [Google Scholar] [CrossRef]
  28. Mazidi, M.; Monsef, H.; Siano, P. Robust day-ahead scheduling of smart distribution networks considering demand response programs. Appl. Energy 2016, 178, 929–942. [Google Scholar] [CrossRef]
  29. Mohiti, M.; Monsef, H.; Anvari-Moghaddam, A.; Lesani, H. Two-Stage Robust Optimization for Resilient Operation of Microgrids Considering Hierarchical Frequency Control Structure. IEEE Trans. Ind. Electron. 2019, 67, 9439–9449. [Google Scholar] [CrossRef]
  30. Zheng, Y.; Niu, S.; Shang, Y.; Shao, Z.; Jian, L. Integrating plug-in electric vehicles into power grids: A comprehensive review on power interaction mode, scheduling methodology and mathematical foundation. Renew. Sustain. Energy Rev. 2019, 112, 424–439. [Google Scholar] [CrossRef]
  31. Yi, Z.; Scoffield, D.; Smart, J.; Meintz, A.; Jun, M.; Mohanpurkar, M.; Medam, A. A highly efficient control framework for centralized residential charging coordination of large electric vehicle populations. Int. J. Electr. Power Energy Syst. 2020, 117, 105661. [Google Scholar] [CrossRef]
  32. Jian, L.; Zheng, Y.; Shao, Z. High efficient valley-filling strategy for centralized coordinated charging of large-scale electric vehicles. Appl. Energy 2017, 186 Pt 1, 46–55. [Google Scholar] [CrossRef]
  33. Flores, R.J.; Shaffer, B.P.; Brouwer, J. Electricity costs for an electric vehicle fueling station with Level 3 charging. Appl. Energy 2016, 169, 813–830. [Google Scholar] [CrossRef]
  34. Liu, Y.; Wu, L.; Li, J. A fast LP-based approach for robust dynamic economic dispatch problem: A feasible region projection method. IEEE Trans. Power Syst. 2020, 35, 4116–4119. [Google Scholar] [CrossRef]
  35. Li, S.; Gu, C.; Zeng, X.; Zhao, P.; Pei, X.; Cheng, S. Vehicle-to-grid management for multi-time scale grid power balancing. Energy 2021, 234, 121201. [Google Scholar] [CrossRef]
  36. Jiang, Y.; Dong, J.; Huang, H. Optimal bidding strategy for the price-maker virtual power plant in the day-ahead market based on multi-agent twin delayed deep deterministic policy gradient algorithm. Energy 2024, 306, 132388. [Google Scholar] [CrossRef]
  37. Wang, M.; Mu, Y.; Jiang, T.; Jia, H.; Li, X.; Hou, K.; Wang, T. Load curve smoothing strategy based on unified state model of different demand side resources. J. Mod. Power Syst. Clean Energy 2018, 6, 540–554. [Google Scholar] [CrossRef]
  38. Deng, R.; Xiang, Y.; Huo, D.; Liu, Y.; Huang, Y.; Huang, C.; Liu, J. Exploring flexibility of electric vehicle aggregators as energy reserve. Electr. Power Syst. Res. 2020, 184, 106305. [Google Scholar] [CrossRef]
  39. Lu, C.; Gu, N.; Jiang, W.; Wu, C. Sample-adaptive robust economic dispatch with statistically feasible guarantees. IEEE Trans. Power Syst. 2023, 39, 779–793. [Google Scholar] [CrossRef]
  40. Song, M.; Amelin, M. Purchase bidding strategy for a retailer with flexible demands in day-ahead electricity market. IEEE Trans. Power Syst. 2016, 32, 1839–1850. [Google Scholar] [CrossRef]
  41. Fang, D.; Tang, H.; Hatziargyriou, N.; Zhang, T.; Chen, W.; Zhang, Q. Dual-center control scheme and FF-DHRL-based collaborative optimization for charging stations under intra-day peak-shaving demand. Appl. Energy 2024, 368, 123453. [Google Scholar] [CrossRef]
  42. Ali, M.U.; Zafar, A.; Nengroo, S.H.; Hussain, S.; Alvi, M.J.; Kim, H.-J. Towards a smarter battery management system for electric vehicle applications: A critical review of lithium-ion battery state of charge estimation. Energies 2019, 12, 446. [Google Scholar] [CrossRef]
  43. Shi, Q.; Chen, C.F.; Mammoli, A.; Li, F. Estimating the profile of incentive-based demand response (IBDR) by integrating technical models and social-behavioral factors. IEEE Trans. Smart Grid 2019, 11, 171–183. [Google Scholar] [CrossRef]
  44. Watson, D.; Hastie, C.; Rodgers, M. Comparing different regulation offerings from a battery in a wind R&D park. IEEE Trans. Power Syst. 2017, 33, 2331–2338. [Google Scholar] [CrossRef]
  45. Guo, S.; Li, P.; Ma, K.; Yang, B.; Yang, J. Robust energy management for industrial microgrid considering charging and discharging pressure of electric vehicles. Appl. Energy 2022, 325, 119846. [Google Scholar] [CrossRef]
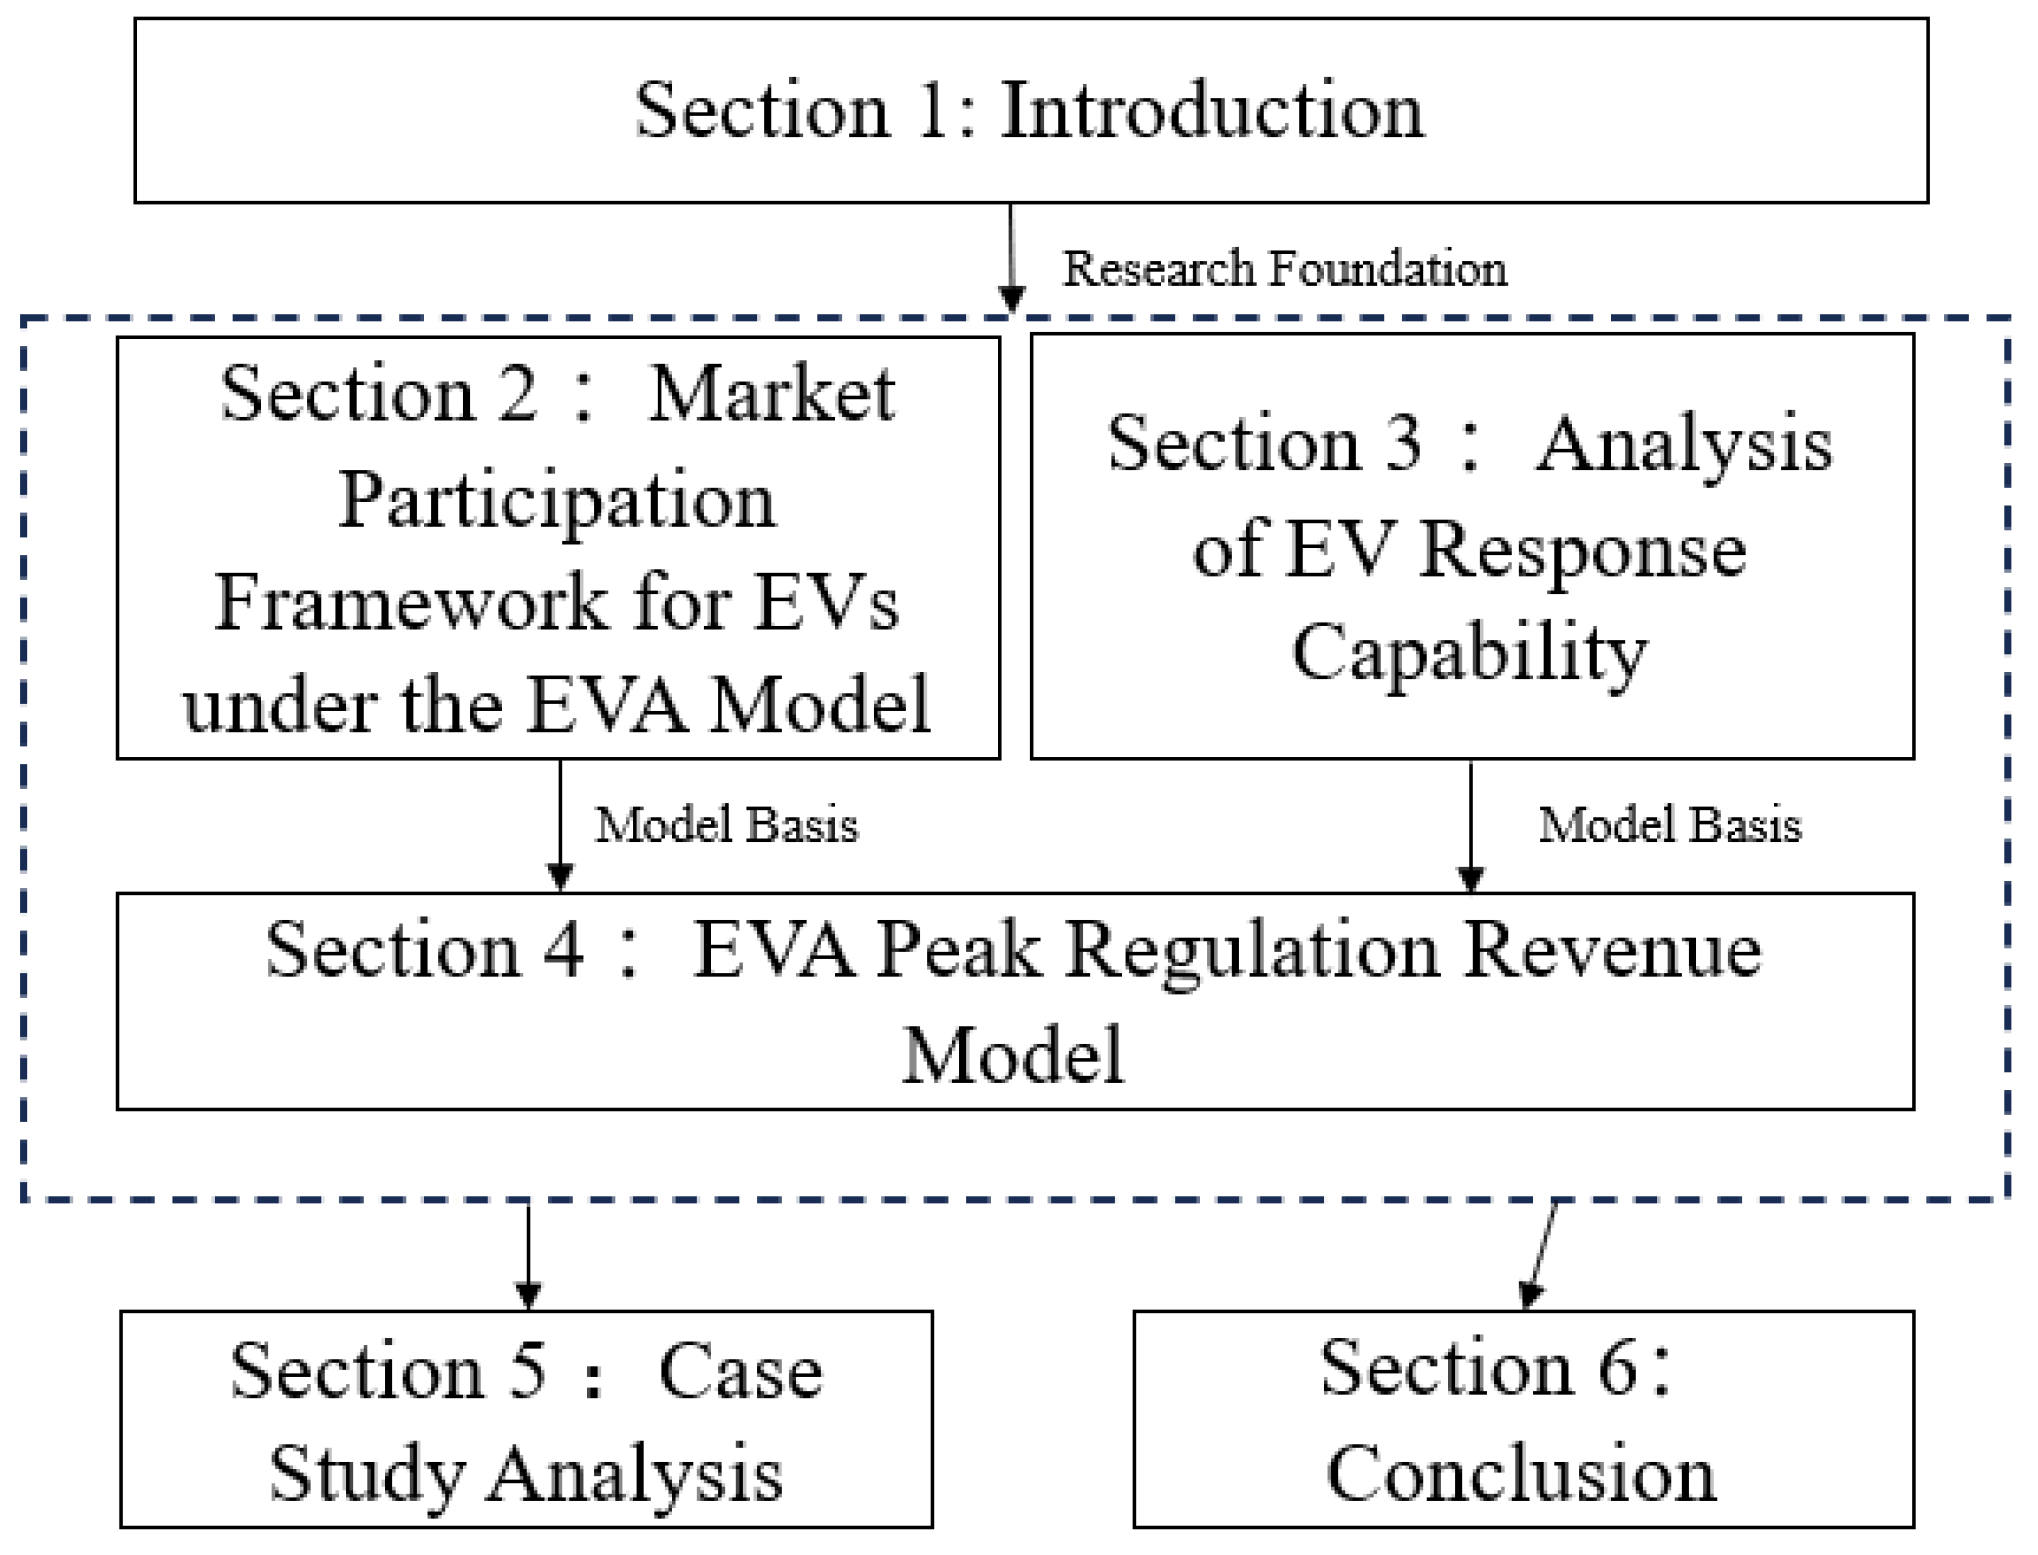
Figure 1. Overall structure of the paper.
Sustainability 17 07315 g001
Figure 2. EVA aggregation mechanism.
Sustainability 17 07315 g002
Figure 3. Framework for EVA participation in the ancillary service market.
Sustainability 17 07315 g003
Figure 4. Maximum controllable operating region of an EV.
Sustainability 17 07315 g004
Figure 5. Four response modes of EVs.
Sustainability 17 07315 g005
Figure 6. SOC operating region of a single EV.
Sustainability 17 07315 g006
Figure 7. Power operating region of a single EV.
Sustainability 17 07315 g007
Figure 8. Power boundaries of the EV aggregation.
Sustainability 17 07315 g008
Figure 9. EVs’ aggregated energy distribution with the CBDR strategy.
Sustainability 17 07315 g009
Figure 10. EVs’ aggregated energy distribution with the DBDR strategy.
Sustainability 17 07315 g010
Figure 11. EVs’ aggregated energy distribution with the combined CBDR + DBDR strategy.
Sustainability 17 07315 g011
Figure 12. Peak regulation margin with the CBDR strategy.
Sustainability 17 07315 g012
Figure 13. Peak regulation margin with the DBDR strategy.
Sustainability 17 07315 g013
Figure 14. Peak regulation margin with the CBDR + DBDR strategy.
Sustainability 17 07315 g014
Figure 15. EVA revenue fluctuation with the CBDR strategy.
Sustainability 17 07315 g015
Figure 16. EVA revenue fluctuation with the DBDR strategy.
Sustainability 17 07315 g016
Figure 17. EVA revenue fluctuation with the CBDR + DBDR strategy.
Sustainability 17 07315 g017
Figure 18. Participation rate of a 100 EV cluster.
Sustainability 17 07315 g018
Figure 19. Participation rate of a 100 EV cluster under different SOC and price conditions.
Sustainability 17 07315 g019
Figure 20. Upward regulation power response: Time vs. incentive intensity surface.
Sustainability 17 07315 g020
Figure 21. Downward regulation power response: Time vs. incentive intensity surface.
Sustainability 17 07315 g021
Table 1. Comparison of methods.
No.MethodologyCore Techniques/ModelsKey Features and AdvantagesLimitations and ChallengesRepresentative References
1Dynamic Time-of-Use PricingTime-segmented pricing, price response modelsFacilitates valley filling and peak clipping, significantly reduces user energy costsAssumes full user compliance with price signals, neglects behavioral autonomy[4,5]
2Bi-level Deep Learning FrameworkDeep Reinforcement Learning (DRL), Deep Q-Networks (DQNs)Joint optimization of aggregator pricing and EV charging strategies, enhances intelligent charging decisionsComplex training, requires extensive data[6]
3Hybrid Transfer Learning ModelTransfer learning, time-series forecastingAddresses data scarcity, improves accuracy of EV charging demand predictionHeavily dependent on model generalization capability[7]
4Flexibility-Driven Dynamic Pricing ModelDecentralized response strategies, flexibility modelingReduces supply–demand mismatch, considers EV autonomy, improves response precisionRequires accurate characterization of individual flexibility[8]
5Robust Microgrid Energy Management ModelRobust optimization, uncertainty modelingBalances technical, economic, and environmental performance; enhances dispatch reliabilityComputationally intensive, uncertainty in parameters remains[9]
6Info-gap Decision Theory and Bi-level Stochastic OptimizationInfo-gap theory, bi-level stochastic programmingEnhances dispatch resilience and profit maximization under uncertaintyHigh model complexity and solving difficulty[10,11]
7Stochastic Response ModelsDemand elasticity and price sensitivity modelingReduces user energy costs, improves economic responsivenessOften neglects user heterogeneity and bidirectional uncertainty[12,13,14]
8User Behavior Modeling and Charging Habit AnalysisWillingness-aware demand response (PSDR, IBDR)Increases user participation while preserving comfort and autonomyComplex behavioral modeling, high data requirements[15,16,17,18,19,20]
9Multi-agent Uncertainty-Integrated Aggregator Cost ModelingMulti-agent game theory, integrated market and system uncertaintyRealistically reflects EVA profitability considering multi-level interactionsRequires precise multi-layer uncertainty modeling[21,22,23]
10Robust Optimization and Mixed-Integer Linear Programming (MILP)Robust optimization, MILP formulationEnsures near-global optimality and computational feasibilityHigh computational demand for large-scale problems[24,25]
11Demand Forecasting
and Deep Learning
ST-CALNet, CNN + LSTM + attentionSpatiotemporal capture; better accuracy, interpretabilityRegional bias; opaque LSTM; high complexity[26]
12Peak Shaving, Vehicle-to-Grid (V2G) Scheduling and Coordinated Dispatch StrategiesGrid–EV interaction, virtual power plant dispatchEnhances system stability, reduces operating costs, promotes tightly coupled grid–EV ecosystemsRequires complex coordination mechanisms, challenges in real-time dispatch[27,28,29,30,31,32]
Table 2. Explanation of relevant terms.
AbbreviationFull Name
EVAElectric Vehicle Aggregator
EVElectric Vehicle
CBDRCharging-Based Demand Response
DBDRDischarging-Based Demand Response
DRDemand Response
V2GVehicle-to-Grid
SOCState of Charge
AS MarketAncillary Services Market
R_DADay-Ahead Market Price
R_up/R_downRegulation Prices
Table 3. Scenario Description for the Case Study.
ScenarioResponse Strategy
Scenario 1Only the effect of the CBDR is considered. The EVA sets charging incentive discounts, and EVs responding to the CBDR are controlled by the EVA to participate in ancillary service peak regulation.
Scenario 2Only the effect of the DBDR is considered. The EVA sets appropriate discharging subsidies, and EVs responding to the DBDR are controlled by the EVA to participate in ancillary service peak regulation.
Scenario 3Both CBDR and DBDR effects are considered. The EVA simultaneously sets charging incentive discounts and discharging subsidies. EVs respond to CBDR and DBDR across multiple time periods and are coordinated by the EVA to participate in ancillary service peak regulation.
Table 4. Comparison of EVA response strategies in three scenarios.
ItemCBDRDBDRCBDR + DBDR
Subsidy Cost1410.585842279.02056
Electricity Purchase Cost1260.984581153.632281350.06435
Peak Regulation Cost800.54838702.058451003.54826
Energy Revenue2287.268433202.975816587.89309
Capacity Revenue1260.977571630.617582700.11592
Total Operating Revenue1486.713041567.316824655.37584
Disclaimer/Publisher’s Note: The statements, opinions and data contained in all publications are solely those of the individual author(s) and contributor(s) and not of MDPI and/or the editor(s). MDPI and/or the editor(s) disclaim responsibility for any injury to people or property resulting from any ideas, methods, instructions or products referred to in the content.