Article

Intelligent Management of Integrated Energy Systems with a Stochastic Multi-Objective Approach with Emphasis on Demand Response, Energy Storage Devices, and Power-to-Gas

by
Hossein Faramarzi
1,*,
Navid Ghaffarzadeh
1 and
Farhad Shahnia
2
1
Faculty of Technical and Engineering, Imam Khomeini International University, Qazvin 34148-96818, Iran
2
School of Engineering and Energy, Murdoch University, Perth, WA 6150, Australia
*
Author to whom correspondence should be addressed.
Sustainability 2025, 17(7), 3001; https://doi.org/10.3390/su17073001
Submission received: 30 November 2024 / Revised: 21 March 2025 / Accepted: 25 March 2025 / Published: 27 March 2025

Abstract

Optimal scheduling of integrated PV/wind energy systems (IESs) is a complex task that requires innovative approaches to address uncertainty and improve efficiency. This paper proposes a novel multi-objective optimization framework for IES operation, incorporating demand response (DR), a comprehensive set of components, and innovative techniques to reduce computational complexity. The proposed framework minimizes total losses, cost, and emissions while meeting energy demands, offering significant advantages in terms of sustainability and cost reduction. The optimization model is implemented using steady-state energy analysis and non-dominated sorting genetic algorithm-III (NSGA-III) heuristic optimization, while uncertainty analysis and scenario reduction techniques enhance computational efficiency. To further reduce the computational burden, the proposed framework incorporates a novel clustering strategy that effectively reduces the number of scenarios from 1000 to 30. This innovation significantly improves the computational efficiency of the proposed framework, making it more practical for real-world applications. The effectiveness of the proposed approach is validated against multi-objective seagull optimization algorithm (MOSOA)- and general algebraic modeling system (GAMS)-based methods, demonstrating its superior performance in various scenarios. The improved management system, enabled by the proposed algorithms, facilitates informed operational decisions, enhancing the system’s installed capacity and overall flexibility. This optimization framework paves the way for more efficient and sustainable operation of integrated PV/wind energy systems. Reducing gas and heat network losses, considering both electric and thermal load response, simultaneously utilizing electricity, gas, and heat storage devices, and introducing a new clustering strategy to reduce scenarios are the specific innovations that are mentioned in this paper.

1. Introduction

Today, the contrast between financial growth and energy spending is becoming more serious. While the widespread use of advanced technologies such as distributed generation, energy storage devices, and various converters has partially developed the current energy structure, researchers are still searching for an original method to further increase overall energy productivity and improve economic efficiency, especially regardless of the uncertainty of parameters. The IES, benefiting from the improvement of energy conversion applied science and the concept of the energy hub, is introduced to resolve this conflict more effectively. The energy management system (EMS), as the main component of the IES, collects data and solves an optimization problem to determine the set point for the parts. It obtains the essential information from the system components to appropriately allocate the power of energy resources. By solving some desired objective function, the EMS decision is made. This may be minimizing losses or costs associated with air pollution, operation, start-up, and shutdown of facilities in all subsystems. To achieve these goals, the EMS should be designed optimally. Unlike a conventional separate energy system, the IES is more complicated and offers more flexibility in energy supply. Because of the different energy combinations, an IES can perform better to achieve optimal technical goals. Many researchers have conducted significant studies in this regard. These works are in different fields and have different objectives. The differences include different infrastructures, different paths to optimal operation, and differences in time frames. Some of this work is presented as follows. In Ref. [1], a new optimization framework is proposed in light of the Stackelberg game, which considers the demand response program and renewable energy generations to maximize profits and minimize energy costs. It addresses renewable energy generation uncertainties and considers district heating network characteristics while maintaining user thermal comfort. While demonstrating enhanced renewable energy consumption through simulations, the study acknowledges limitations including model complexity, regional specificity, implementation challenges, forecasting dependence, and potential inequities. In Ref. [2], the cooperation framework of an IES is discussed to ensure the safety of the system. In the cooperation model, the proposed algorithm is based on the alternating direction method of multipliers. It introduces novel heat pump modeling and a decentralized algorithm for independent thermal and electrical network management. While promising, the approach acknowledges simplifications, data dependency, and implementation complexities that may hinder real-world application. In Ref. [3], an optimization problem is introduced focusing on reducing the operating cost and increasing the efficiency of the system. It demonstrates cost reductions and enhanced flexibility through detailed modeling, and its complexity and computational demands, along with limited scalability and reliance on P2G efficiency, pose challenges. Ref. [4] proposes an effective energy management model for optimal 24 h operation that takes into account the uncertainty of production and consumption units. It demonstrates economic benefits through reduced costs and increased revenue, validated with real-world data and compared against a pattern search method. However, the model’s complexity, computational burden, and reliance on accurate forecasting limit its scalability and real-world applicability due to simplifying assumptions. In Ref. [5], a novel operation method is presented that can consider the behavior of loads to limit the total cost in IESs. The optimization of operations is achieved by taking into account the dynamic model of heat loads and the customers’ heat satisfaction model, with the aim of minimizing the total cost. However, the increased model complexity requires advanced optimization tools, has limited scalability, and relies on simplifying assumptions about water tank behavior. In Ref. [6], an optimization model is introduced to reduce the cost and improve the performance of the IES under uncertainty conditions. It suggests incorporating power-to-gas and demand responses into the economic dispatch model to enhance its flexibility. However, it overlooks the important objectives of reducing losses and air pollution. In Ref. [7], different energy consumption sectors of the energy hub and their properties in the optimization problems were studied. It provides an overview of different energy hub systems and explores ways to improve their efficiency. It also examines various renewable energy systems and demand response programs. However, it only focuses on reviewing the current methods used in optimizing energy hubs. In Ref. [8], based on the control of power grids, a mathematical programming problem is created to meet the system demand with the lowest production cost, lowest emissions, and lowest voltage deviation. It addresses various methods of optimal power flow (OPF), categorizes the main objectives posed in problem-solving, and ultimately delves into different intelligent algorithms employed in problem-solving. Ref. [9] considers the coupling of various system components along with the impact of carbon emissions in optimizing integrated energy systems. It considers the quantification of the dispatch flexibility of the power system. Furthermore, it explores the simultaneous investigation of power-to-gas (P2G) and demand response. Ref. [10] proposes an optimal operating scheme considering the reconstruction potential of the grid. In this paper, the objective function introduced in the problem is solely the cost function, which is optimized to its possible minimum through the utilization of optimal scheduling of combined heat and power (CHP), various energy converters, and hourly topology of the sub-systems. The article offers cost-effective day-ahead scheduling, enhanced flexibility, and resource utilization and supports renewable energy integration through comprehensive modeling of interconnected energy systems. However, its complexity may increase computational demand, and simplifications like neglecting the heat network and reliance on forecasting can introduce inaccuracies. Ref. [11] presented a novel stochastic model for the optimal operation of an energy hub in terms of minimizing electricity and gas costs. In the proposed model, energy demand and electricity price are considered stochastic variables, and by considering these factors, the problem of optimal energy flow is addressed using the minimum operational cost objective function. This model integrates multiple energy carriers, considers uncertainty in renewables and load, and incorporates demand response, carbon trading, and power-to-gas technology. While it enhances energy hub flexibility and uses multi-objective optimization with clustering for efficiency, it also presents complexities in real-time implementation, computational burden, and reliance on accurate forecasting. In Ref. [12], considering the technical and economic relationships between electricity and natural gas systems (NGSs), a mixed-integer linear programming (MILP) model is presented for optimal scheduling of microgrids (MG). The mentioned reference suggests utilizing microgrid benefits to lower system operational expenses. Additionally, the new modeling method incorporates real-time network constraints to guarantee secure network performance. However, it simplifies the natural gas network and heat transfer, relying on accurate input data and potentially introducing linearization errors. Despite these limitations, it demonstrates economic savings and flexibility in various operational scenarios. In Ref. [13], the model for optimal operation is formulated as a nonlinear optimization problem that takes into account the network constraints in both the electric and thermal systems of the IES in urban areas. In this reference, the objective is to minimize the operational costs for both electrical and heating systems while at the same time maximizing the renewable energy consumed, and optimization is done using the proposed decomposition–coordination algorithm. It facilitates renewable energy integration by utilizing excess wind power for heating, reducing curtailment and emissions. However, the system’s complexity requires careful coordination due to its closed-loop configuration and potential heat losses, with further considerations needed for long-term storage, heat loss coefficient accuracy, and heat pump placement. In Ref. [14], with respect to the energy hub concept (EH), a day-ahead operation scheme is proposed to reduce operating costs and increase customer benefits through an optimization strategy. Its hierarchical optimization strategy minimizes day-ahead operational costs for both the EH and the overall IES, incorporating renewable energy sources like wind power for economic and environmental benefits. While reliance on accurate demand forecasts is crucial, the model demonstrates its potential for practical engineering application. Ref. [15] introduces a stochastic multi-objective scheduling framework for a hybrid PV/WT/Batt system in distribution networks. The proposed method employs an improved escaping-bird search algorithm (IEBSA) and the unscented transformation (UT) to optimize system configuration considering generation and demand uncertainties. It minimizes losses, voltage deviations, and cost, outperforming other configurations and algorithms. This method provides an optimal framework for integrating renewable energy and storage into distribution networks while considering uncertainty. Ref. [16] presents a novel stochastic power management strategy for interconnected multi-microgrid (MMG) systems. The authors propose a UT-multi-objective JAYA (MJAYA) algorithm, combining UT for uncertainty modeling with the MJAYA algorithm for optimization. This approach aims to minimize operational costs and emissions by considering uncertainties in renewable energy, load, and electricity prices, also focusing on reducing grid dependency. Simulation results demonstrate the algorithm’s effectiveness in achieving these objectives in both deterministic and probabilistic scenarios. Ref. [17] presents a stochastic multi-objective energy management approach for CHP-based microgrids, focusing on enhancing resilience alongside economic and environmental objectives. The authors develop a model incorporating renewable resources, storage, and capacitive banks and employ a Pareto front-based genetic algorithm to minimize operational costs, pollution, power losses, and resilience costs. The proposed method integrates resilience considerations, leading to a reduction in overall costs by minimizing outage expenses. The multi-objective approach enhances performance across all objectives. This study presents a comprehensive economic-resilience framework for optimizing the operation of hybrid microgrids. Ref. [18] introduces a novel multi-objective robust optimization model for an integrated energy system with hydrogen storage, specifically considering source–load uncertainty to enhance low-carbon economic operation. The model aims to minimize total system cost and carbon emissions through compromise planning and a max–min fuzzy method to derive Pareto solutions. To handle uncertainty, a robust optimization (RO) approach is employed, which, compared to stochastic optimization, offers faster solution speeds. The study demonstrates that the proposed HIES can significantly reduce system costs, emissions, and renewable energy curtailment while balancing economic and environmental objectives through adjustable robustness coefficients. Ref. [19] addresses a research gap by proposing a comprehensive stochastic energy hub optimization model that integrates design, operation planning, ESS, and the uncertainties of distributed renewable energy resources. The authors introduce a novel clustering algorithm for multi-attribute time series data and a data-driven method for renewable energy uncertainty, alongside an efficient demand data size reduction technique. Case studies demonstrate the superiority of stochastic over deterministic approaches and normal clustering over sequence clustering. This work offers a general and practical framework for multiscale energy systems by combining previously disparate research aspects into a single model. However, all the aforementioned studies rely on optimization approaches that do not consider the energy analysis to calculate all the state variables of the three subsystems in the IES, and the optimization process is only performed to find an approximate solution to the problem without load flow analysis for all three power, heat, and gas networks through the optimization packages. This paper proposes a novel model for the optimal management of an IES, encompassing a comprehensive set of objective functions, including total IES loss and cost. Unlike prior studies that primarily considered electrical load response programs, the proposed model incorporates both electric and thermal demand response programs. Since the objective functions considered in this paper are based on the total state variables of the IES, it is evident that the load flow analysis should be performed to calculate the loss function and the cost function. In addition, it should be noted that in all the above studies, the IES did not use CHP, P2G, electric storage system (ESS), heat storage system (HSS), gas storage (GS), renewable energy sources (RES), or electric boiler (EB) and gas storage (GS) simultaneously, and the uncertainty of the sun irradiance, wind velocity, and load demand were not considered simultaneously. To address the inherent uncertainty of renewable energy sources (RES), electrical load demand, and the correlation between random variables, we introduce a novel clustering technique that considers the interaction between stochastic variables. This technique significantly improves the computational efficiency of the model and enhances its reliability. Moreover, we employ an accurate model of district heating systems (DHSs) and NGSs to accurately calculate total heat loss and power loss, which depend on temperature and pressure drops, respectively. This point was not considered in previous works. The proposed model is implemented using NSGA-III, a multi-objective optimization algorithm, to determine the optimal operation of the IES under short-term stochastic conditions. The effectiveness of the model is evaluated using the MOSOA method, and the correctness and feasibility of the proposed strategy are confirmed by comparing the two optimization algorithms. The key contributions of this paper include the following:
  • Reduction of gas and heat network losses: The proposed framework includes a comprehensive set of components that help to reduce gas and heat network losses. These components include CHP, P2G, ESS, HSS, and GS.
  • Consideration of both electric and thermal load response: The proposed framework incorporates a DR program for both electric and thermal loads. This helps address the inherent uncertainty of RES and electrical load fluctuations.
  • Simultaneous use of electricity, gas, and heat storage devices: The proposed framework allows for the simultaneous use of electricity, gas, and heat storage devices. This helps improve the flexibility and efficiency of the system.
  • New clustering strategy to reduce scenarios: The proposed framework incorporates a novel clustering strategy that effectively reduces the number of scenarios from 1000 to 30. This significantly improves the computational efficiency of the proposed framework.
The remainder of the paper is organized as follows: Section 2 introduces the IES model, Section 3 presents a 24 h operating model and its solution procedure, Section 4 conducts contextual studies, and, finally, Section 5 summarizes the conclusion.

2. The IES Modeling

The interconnection of an electric distribution system, a natural gas system, and a district heating system meets a broad definition of an IES. This paper aims to coordinate these three sectors considering the uncertainty of RES units and load demand. In this study, energy exchange is done through different types of common coupling devices such as P2G, boilers, CHP, and storage devices, and all the state variables of the IES are calculated based on the load flow analysis, heat flow analysis, and gas flow analysis in the electric power system (EPS), DHS, and NGS, respectively.

2.1. Mathematical Modeling of EPS in IES

To supply the load, the power flow study must be performed to obtain the state variables of the EPS. This is done by Equations (1) and (2). These equations form equality constraints, which are shown in (3)–(4). To further extend the equation for power flow balance with respect to CHP, P2G, solar photovoltaic (SPV), and wind turbines, (5) is presented with the corresponding operating constraint in (6).
PG i PD i = V i j = 1 n V i Y ij cos ( δ i δ j θ ij )
QG i QD i = V i j = 1 n V i Y ij sin ( δ i δ j θ ij )
P Gi min PG i P Gi max
V i min V i V i max
k = 1 G P k ( t ) +   P CHP + P Wt + P PV + P ESS D EB D P 2 G D L D Loss = j = 1 n V n V m Y nm cos ( δ n δ n θ nm )
0 P WT P Wt max
0 P PV P PV max
where DL (t) represents the electric load of the EPS. The voltage magnitude and phase angle at bus i are denoted as Vi and δi, respectively. Active and reactive power injections at bus i are represented by Pi and Qi, with consumption indicated by a negative sign and generation by a positive sign in the equations. Yij is the admittance between bus i and j [20,21,22].

2.2. The Probabilistic Model of RES

In energy hub optimization, probabilistic models enhance prediction accuracy, improve system stability, reduce costs, and optimize operations by accounting for uncertainties in weather and demand, ultimately leading to more efficient and sustainable energy hubs. Unlike the previous studies that did not consider simultaneous consideration of uncertainty in renewable generation and load variables or the implementation of electric and thermal demand response programs, in this context, the effect of demand-side management (DSM) and a hybrid renewable energy storage system on the performance of the IES is studied. The model of these technologies is introduced below:

2.2.1. Stochastic Photovoltaic Unit Model

The stochastic photovoltaic model captures the randomness of solar irradiance using a beta distribution, reflecting real-world variability in sunlight intensity. This is critical because solar power output (PPV) directly affects the IES’s electrical supply, influencing loss and cost objectives. In this way, sun irradiance must be defined as a random variable. By modeling uncertainty with this variable, the framework ensures robust planning under fluctuating conditions, enhancing reliability and reducing dependency on backup systems. As stated in the literature, this is achieved by Equations (8)–(11).
f (   r     ) = Γ ( α + β ) Γ ( α ) Γ ( β ) (   r     ) α 1 ( 1 r ) β 1   , 0   r   1 0   ,                                       otherwise
β = ( 1 μ ) ( μ ( 1 μ ) σ 2 1 )
α = μ β ( 1 μ )
P PV = P rated × ( r 2 r STD × r C )   ,   r r C P rated × ( r r STD ) ,               r C < r r STD P rated ,                             r r STD  
where α and β are the shape parameters, and r’ denotes solar irradiance, which is considered a random variable. f r is determined as the beta distribution function of r . The mean and standard deviation of the random variable r are μ and σ , respectively. In addition, Γ ( 0 ) is described as a gamma function. More information is provided in references [3,4]. The PV output power is calculated by Equation (11), and the SPV power is denoted by PPV. It is mainly related to the light intensity in each time window.

2.2.2. Stochastic Wind Turbine Unit Model

Wind turbine performance has uncertainties because of the observed wind speed. To model the wind turbine, the wind speed model and the production function of the turbine should be fully determined [23,24]. To represent the probability distribution function of wind speed, the Weibull distribution is often used; this model captures wind speed variability, and it excels at modeling the skewed, long-tailed nature of wind speeds.
f ( ν ) = u / z ( ν / z ) u 1 exp [ ( ν / z ) u ]
The actual wind speed, shape parameter, and scale parameter are denoted by v, u, and z, respectively. The wind turbine output power, PWT, is governed by a piecewise function as follows:
P WT = 0                               ν ν in   ,   ν ν out P e × ( ν ν in ν e ν in ) ν in ν ν e P e ν e ν ν out  
The parameters of this equation are defined as follows: Pe represents the wind turbine power output, ve denotes the rated wind speed, vin is the cut-in wind speed, and vout represents the cut-out wind speed. The probability density function (PDF) of PWT is given as
f ( P WT ) = 0   P WT 0 1 exp { [ ( 1 + hP WT / P e )   v in / z ] u + exp [ ( v out / z ) ] u   0 P WT P e 1 ν P e  
where h = (ve/vin) − 1. The PDF of PWT quantifies generation uncertainty, which is essential for short-term scheduling. The significance of this model is twofold: it enables the EMS to mitigate the intermittent nature of wind, reducing curtailment, and provides the necessary inputs for optimizing the objective functions of loss reduction and cost minimization. In an IES context, this ensures that wind power integrates seamlessly with other sources, enhancing system stability and renewable penetration.

2.2.3. Stochastic Electrical Load Model

Generally, the attributes of uncertainty of different load demands can be taken as the normal probability distribution function (PDF). In this paper, it is used to model the load demand randomness as follows (15):
f ( L ) = 1 2 π π L exp ( L μ L ) 2 2 σ L 2  
where L, σ, and µ represent electrical loads, the mean, and the standard deviation of the loads, respectively [23,24]. The significance of the model lies in its capacity to quantify demand-side uncertainty, which directly affects the EPS’s load flow and the demand response strategy. By integrating probabilistic load profiles into the EMS, it ensures a balance between generation and consumption. Unlike deterministic models, this stochastic approach provides a more realistic simulation of real-world demand fluctuations, making it essential for effective short-term IES planning.

2.2.4. Demand Response Program

Demand response (DR) programs are a way to improve coordination among system components, compensate for insufficient production capacity, and increase system efficiency by coordinating load shifting across EPS, DHS, and NGS, reducing peak demand. DR programs mitigate RES uncertainty and generation shortfalls by adjusting electrical and thermal loads. These are implemented by reducing unnecessary loads at certain times, which can save energy and reduce peak demand on the grid. DR programs can be classified into two main categories: price-based and incentive-based. Price-based DR programs incentivize consumers to reduce their energy consumption by adjusting the price of electricity during peak demand periods. Incentive-based DR programs reward consumers for participating in demand response events by offering financial incentives. The proposed edition focuses on the execution of DR in the form of electrical and thermal load shifting [6,25,26]. This model leads to a reduction in losses costs.
s h = 1 24 DR up ( h , s ) = s h = 1 24 DR dn ( h , s )
0 D R up ( h , s ) D R up ( h , s ) max
0 D R dn ( h , s ) D R dn ( h , s ) max
DR up ( h , s ) max = γ DR d ( h , s )
DR dn ( h , s ) max = γ DR d ( h , s )
d RD ( h , s ) = d ( h , s ) DR dn ( h , s ) + DR up ( h , s )
The constraints governing the relationship between the maximum adaptive load and load consumption are formulated in Equations (19) and (20). γDR represents the adaptable load factor. Ultimately, Equation (21) is employed to determine the total load demand of the EH following its engagement in the DRP. The mathematical modeling of the DR program is essential for transforming the EMS into a robust, practical tool. It quantifies the impact of load shifting on system state variables and provides the foundation of the optimization process. Integrated with uncertainty models and coupling equipment, it smooths load profiles, optimizes energy use and flexibility, and ultimately improves short-term planning for the IES. This ensures that the IES adapts to variable conditions while maintaining a balance between technical and economic objectives.

2.2.5. Ramp Rate Constraints

In optimal management programs, unit commitment should be performed due to the nature of multi-level planning. In this way, ramp rate constraints should be considered as the following inequalities for each TP unit and each CHP unit:
r TP d , i P TP i , t P TP i , t 1 r TP u , i
r CHP d P CHP t P CHP t 1 r CHP u
where rTPd,i and rTPu,i are, respectively, the ramp-down and ramp-up rates of thermal power (TP) unit i, and rCHPd and rCHPu are, respectively, the ramp-down and ramp-up rates of the CHP unit [27].

2.3. Mathematical Modeling of District Heating System in IES

District heating systems (DHSs) transport thermal energy between sources and consumers using networks of supply and return pipelines. Each node in the DHS has three distinct temperatures: supply, return, and ambient temperatures. The return temperature is always lower than the supply temperature due to energy consumption. Thermal and hydraulic modeling is essential to analyze the DHS. The hydraulic model ensures the continuity of mass flow, and the thermal model governs heat balance, temperature drop, and temperature mixing at the nodes. Equation (27) quantifies the temperature reduction within a pipe, which is influenced by the heat transfer coefficient and the pipe diameter. It is important to acknowledge that heat loss along the pipe inevitably occurs owing to the disparity between the water temperature and the ambient temperature. In this study, the total heat loss of the DHS is defined as the summation of individual heat losses across all pipes [25,28,29]. Operational limits are determined by Equations (24)–(31).
m Λ n m mn , t = 0 ,   m , n Λ DHS , t T
H CHP + ( H HS in H HS out ) + H GB + H EB H L H Loss = Cp .. m mn . ( τ mn in τ mn out )   ,   m , n Λ DHS
τ mn in τ mn a = e λ mn . L mn C p . m mn . ( τ mn out τ mn a ) ,   m , n Λ DHS
τ mn out m Λ n m mn = m Λ n ( m mn . τ mn in ) ,   m , n Λ DHS
τ mn in / out , min τ mn in / out τ mn in / out , max
H CHP min H CHP H CHP max
m mn min m mn m mn max
where HL (t) represents the heat load of the DHS. The temperature at node i is denoted as τi. Heat injection at node i is represented by Hi, with consumption indicated by a negative sign and generation by a positive sign in Equation (26). Cp is the specific heat capacity, while Lmn and λmn denote the length and heat transfer coefficient of the pipeline mnm, respectively.

2.4. Mathematical Modeling of NGS in IES

Loads, pipelines, gas compressors (GCs), storage devices, and P2G units make up the NGS network. The following equations were used for the NGS modeling. In the first step, the pipeline flow equation with a fixed gas pressure is given by Equation (32). In addition, the gas flow balance at each node was obtained by Equation (33). Equation (33) provides the GC gas consumption, and the constraints on the NGS variables are introduced in (34)–(35).
P n , t 2 P m , t 2 = Z nm . ( S nm , t 2 )   ,   m , n Λ NGS , t T
g Ω n GS Q GS g , t + ( Q GS in Q GS out ) Q GB Q CHP Q GC + Q P 2 G Q L = m Λ n S mn , t   ,   m , n Λ NGS , t T
H k GC = B k . S k ( P out P in ) Z k 1
( P n , t 2 ) min P n , t 2 P n , t 2 ) max
S nm min S nm S nm max
where S m n is the gas flow in a pipe of length m-n, P m and P n are the pressures at nodes m and n, and Z n m is a fixed number. In addition, Z k and B k are constants related to the compression factor and the working conditions of the compressor, respectively. S k is the gas flow through the compressor k, and P i n and P o u t are the compressor inlet and outlet pressures. For gas compressors, τ represents the gas flow consumed by compressor k and can be expressed as follows (36):
τ k = α + β H k + γ H 2 k
where α, β, and γ are compressor consumption coefficients [30,31,32].
In this paper, load flow equations are crucial for the electric power system (EPS), district heating system (DHS), and natural gas system (NGS) within an integrated energy system (IES). For the EPS, these equations (Equations (1)–(7)) enable power flow analysis to optimize voltage and power distribution, minimizing losses. In the DHS, they model heat flow and temperature dynamics (Equations (24)–(30)), ensuring efficient heat delivery and loss reduction. For the NGS, they govern gas flow and pressure (Equations (31)–(36)), supporting stable supply under varying demand. Together, these equations facilitate coordinated operation and multi-objective optimization across the IES, balancing technical and economic goals.

2.5. Modeling of Coupling Components

The mathematical modeling of coupling equipment is crucial for optimizing the IES within the EMS framework. It enhances performance simulation and optimizes operational strategies. These models integrate the EPS, DHS, and NGS, enabling efficient energy conversion and storage. CHP links gas consumption to electricity and heat outputs, reducing losses through co-optimization of EPS and DHS. P2G converts surplus renewable electricity into gas, enhancing flexibility and minimizing EPS curtailment while stabilizing NGS supply. Storage units buffer stochastic supply-demand mismatches, optimizing energy use across subsystems and reducing costs by shifting loads to off-peak periods. This results in more efficient and flexible energy hubs.

2.5.1. CHP

CHP is the first linking element of an IES, where electricity and heat are generated through the consumption of natural gas. It optimizes electricity and heat production, reducing losses via efficiencies. Thus, a link exists between the development of electricity and heat. Moreover, the gas consumption of the CHP plant can be calculated as shown in (37)–(38).
P CHP j , t = D CHP j , t     η e j   , j Ω CHP ,   t T
H CHP j , t = D CHP j , t     η h j   , j Ω CHP ,   t T
where PCHP and HCHP represent the power and heat generated by the CHP system, respectively, and DCHP denotes the gas consumed by the CHP system. ηe and ηh are the electrical and thermal efficiencies of the CHP, respectively.

2.5.2. P2G Unit

P2G produces hydrogen by consuming electricity in two processes, electrolysis and methanation, which can be used to supply methane to gas consumers [33]. In this device, gas production and electricity consumption are calculated using Equation (39).
Q P 2 G k , t = D P 2 G k , t     η P 2 G k   , k Ω P 2 G ,   t T
P2G converts electricity to gas, storing surplus energy to enhance flexibility and stabilize the NGS. Undoubtedly, energy storage devices significantly enhance system performance. Storage units manage charging and discharging processes, mitigating supply-demand mismatches to reduce losses and costs. These models facilitate energy flow simulation, supporting loss reduction and cost optimization.

2.5.3. ESS Unit

Due to the optimized charge and discharge control algorithm, the ESS is used to optimize power production in the EPS, which is a solution to this optimization problem.
SOC ESS ( t + 1 ) = SOC ESS ( t )   η ESS ( t ) P ESS ( t )   C ESS  
SOC min ESS ( t   ) SOC ESS ( t + 1 ) SOC max ESS ( t   )
P min ESS ( t )   P max ESS ( t )   P max ESS   ( t )  
where P m i n E S S t and P m a x E S S t are the lower and upper charge/discharge powers of ESS devices, respectively. This constraint denotes the limits set by the manufacturer for the charging and discharging power of energy storage devices. S O C E S S t , η E S S and CESS are the state of charge, charge/discharge efficiency, and storage capacity, respectively. The limits of SOC are defined by S O C m i n E S S t and S O C m a x E S S t , and Equation (41) is used to define the dynamics of SOC during charge and discharge modes [33].

2.5.4. HSS Unit

Heat can be stored in thermal storage. This storage is used to optimize heat production. Equations (43)–(47) are constraints for its operation, where η H S defines the charging and discharging efficiency of the unit. Z H S r represents the charging and discharging state used to integrate the storage model into the network model [2].
E HS r , t + 1 = E HS r , t + h HS + η Hs η HS h HS r , t
0 h HS + r , t Z HS r h Hs r
0 h HS r , t ( 1 Z HS ) r h Hs r
0 E HS r , t E HS
E HS r , l = E HS r , T = E HS r 0

2.5.5. GS Unit

As mentioned earlier, gas storage is used to optimize gas production. Similar to heat storage, the equations for gas storage operation are presented below:
sog ( t ) = sog ( t 1 ) + Q in s ( t ) . η ch g . Δ t S cap n Q out s ( t ) . Δ t S cap n . η dis g
sog min sog sog max
sog T = sog 0
where QinS and QoutS are the gas input and output to and from the storage, respectively, ηch,g and ηdis,g are the charging/discharging efficiency of the unit, where Scap,n is the storage capacity, and sogmin and sogmax are the lower and upper sogs of the gas storage, respectively [30].

3. Optimal Operation Model and Solution

Based on the optimal day-ahead operation method of the IES, the optimization problem is formulated as a multi-objective problem tackled by (NSGA-III). The information required to formulate the problem is as follows:
  • Power and heat demand profiles.
  • Wind and solar power production.
  • Electricity and gas prices.
  • IES data.

3.1. Multi-Objective Optimization (MOO) Definition

The MOO emerges as a method for solving an optimization problem with more than one objective:
Minimize ( F ( x ) ) = min [ f 1 ( x ) , f 2 ( x ) , , f n ( x ) ] T h i ( x ) = 0             i = 1   ,   2   ,     ,   m g i ( x ) 0               i = 1   ,   2   ,     ,   p  
where x = [x1, x2,…, xk] T is the vector of decision variables, gi is the ith unequal condition, hi is the ith equality condition, m is the number of unequal conditions, and p is the number of equality conditions [34,35,36]. The objective functions are formulated as follows:

3.2. Objective Functions

This study formulates the optimization problem for minimizing losses and total cost in the optimal operation of the IES as a multi-objective problem. Different scenarios for loads and generating units are considered. The formulations for minimizing total losses and total costs are presented in [27,34,36,37,38].

3.2.1. The Loss Reduction Objective Function

The first objective function of the IES is defined to minimize the total losses of the system, as shown in Equation (52).
F 1 = t = 1 24 ( Loss E + Loss G + Loss H )
where LossE is the active power loss in the electrical power network; LossH is the total heat loss in the thermal energy network; and LossG is the loss due to pressure drop in the gas energy network.
Loss E = k = 1 Nl g k ( V i 2 + V j 2 2 V i V j cos ( δ i δ j )
Loss H = l = 1 Npipe Q s , Loss + l = 1 Npipe Q r , Loss
Q s , Loss = C p   m ˙   ( T s , i T s , j )
Q r , Loss = C p   m ˙   ( T r , i T r , j )
Loss G = i = 1 Npipe Δ P ij . F l
The parameters of these equations are classified into the following three groups:
  • The electrical network parameters, including the conductance of the branch k ( g k ), the magnitudes of the voltages at the sending and receiving buses ( V i and V j ), the phase angle at the ith bus ( δ i ), the number of ( N b ), and the number of lines ( N l ).
  • The heat network parameters, including the supply and return temperatures of the node ( T s and T r ), the specific heat capacity of water ( C P ), the mass flow rate in the pipe ( m ˙ ), and the number of lines ( N p i p e ).
  • The gas network parameters, including the pressures at the sending and receiving nodes of the pipe ( P i and P j ), which denote the gas flow rate in the pipe number l ( F l ), and the number of lines ( N p i p e ).

3.2.2. The Economic Objective Function

This function models the economic aspect of the problem, and the formulation of this function is as follows.
F 2 = t = 1 24 ( Cos t fuel + Cos t EDRP + Cos t TDRP + Cos t WT + Cos t PV + Cos t P 2 G + Cos t ES + Cos t HS + Cos t GS + Cos t CHP + Cos t GB + Cos t EB + Cos t E m ission )
In the EPS, the costs from power plants and CHPs form the operation cost of the power generation units. In addition, in the DHN, the operation cost consists of the heat generation cost from the CHP, boilers, and thermal storage devices. C o s t E D R P is the cost of the electrical power in the demand response program; C o s t T D R P is the cost of the heat power in the demand response program; C o s t W T is the operating cost of the wind turbine; C o s t W T P V is the operating cost of the solar array; C o s t P 2 G is the operating cost of the P2G; C o s t E S S is the operating cost of the electric storage device; C o s t H S is the operating cost of the heat storage device; and CostGS is the operating cost of the gas storage device. In the calculation procedure of C o s t f u e l , the fuel cost function of the different units is defined as follows:
C i ( P i ) = α i + β i P i + γ i P i
C j ( O j , H j ) = α j + β j O j + γ j O j 2 + δ j H j + θ j H j 2 + ξ j O j H j
C k ( T k ) = α k + δ k T k + θ k T k 2
Cos t fuel = i = 1 Np C i ( P i ) + j = 1 Nc C j ( O j , H j ) + k = 1 Nh C k ( T k )
where α i , β i , and γ i are the generator cost function parameters; α j , β j , γ j , δ j , θ j ,   ξ j are CHP cost function parameters; and α k , δ k , θ k are heat-only unit cost function parameters [22]. Energy hubs can assume a significant role in the emission of greenhouse gases such as nitrogen oxide (NOx), carbon monoxide (CO), and sulfur dioxide (SO2). Energy efficiency can reduce climate change caused by emissions [27]. In this regard, the cost function related to air pollution is defined according to the following equations:
Cos t E m ission = E s + E c
E c = i = 1 Np τ i P i + j = 1 Nc ψ j O j + k = 1 Nh T k σ k
E S = i = 1 Np [ α i + β i P i + γ i P i 2 + ξ i e ( λ i P i ) ] + j = 1 Nc O j ( θ j , η j ) + k = 1 Nh T k ( π k + ρ k )
The aim is to achieve the most economic and technical operation scheme. Due to the reduction in peak load and the purchase of cheaper electricity and gas with emissions, the ratio of peak load to average load (PAR) is used to reflect the reduction in energy sources used. It is defined as the ratio between the maximum input power and the average total input power during a given time slot. Reducing PAR increases system stability and reduces consumer costs. During the unscheduled operation of the energy hub, the peak load may reduce the reliability of the system. It is calculated based on Equation (66).
P A R = max P i n α ( t ) τ P i n α ( t ) / 24
To compare the performance of different optimization algorithms, the improvement percentage is used. This metric quantifies the relative change in the quality of solutions obtained by one algorithm compared to another. It is calculated based on Equation (67), where R1, R2 represent the obtained results of two algorithms.
I P = R 2 R 1 R 1

3.3. Proposed Optimization Approach

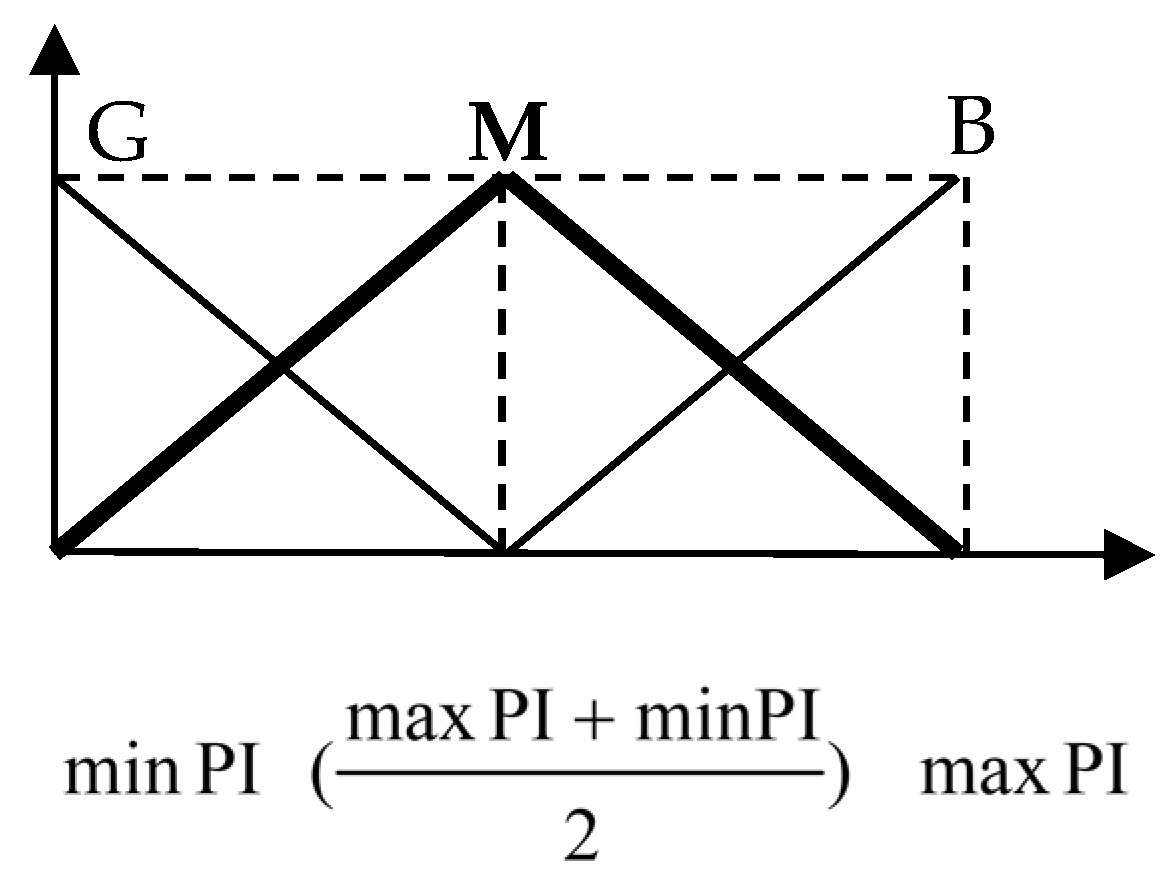
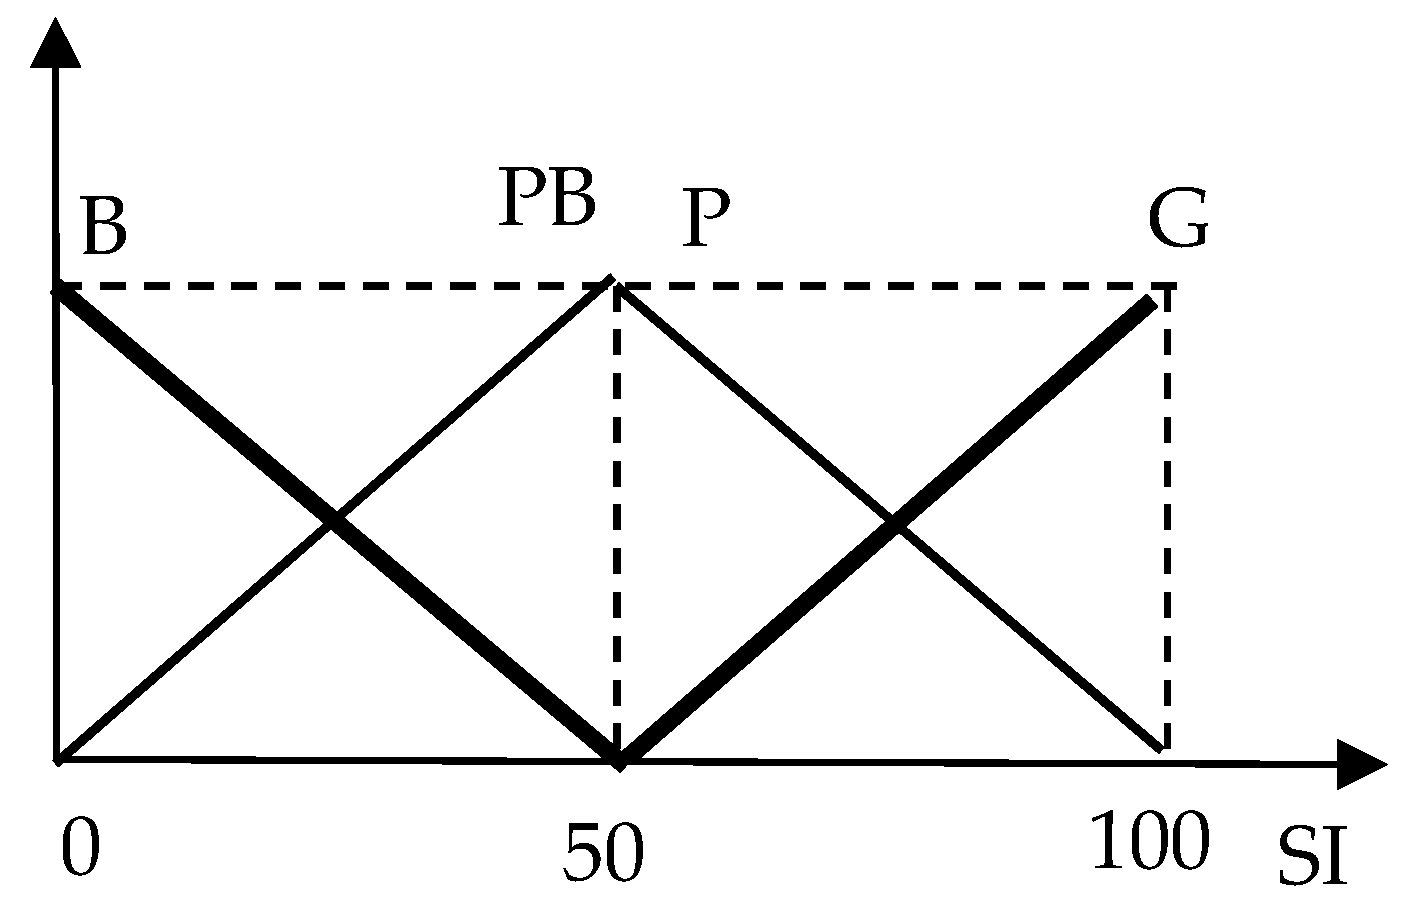
The proposed EMS aims to ensure safe, optimal 24 h ahead operation of the IES from a technical perspective, addressing uncertainties in renewable energy, electrical loads, and demand response for both electrical and thermal loads. It employs a multi-objective optimization technique to generate a set of optimal solutions, with a fuzzy inference system (FIS) introduced to select the best compromise solution using fuzzy logic to balance conflicting objectives. The process involves two steps: first, deriving Pareto optimal solutions, and then, calculating the preference index (PI) and cost index (CI) as inputs for the FIS, which outputs a satisfaction index (SI). These are illustrated in Figure 1, Figure 2 and Figure 3, with fuzzy rules defined in Table 1 (e.g., “G” for good, “B” for bad). The solution with the highest SI is chosen as the optimal compromise, balancing technical (low PI, e.g., minimal losses) and economic (low CI) merits, enhancing decision-making flexibility for decision-makers (DMs).
Considering the importance of this goal, these parameters are calculated based on the functions outlined below.
P I ( X i ) = j = 1 M m o j ( X j )
m o j ( X j ) = 0                 ,                                       F j ( X i ) F j m i n     F j ( X i ) F j m i n F j m a x F j m i n                                                                         1                                                   F j ( X i ) F j m a x     ,       F j m i n < F j ( X i ) < F j m a x
C I = F 2

3.3.1. Scenario Generation

This study employed a scenario generation method that involved randomly defining 1000 scenarios of the variables within a 24 h period for uncertainty analysis. To enhance the efficiency of optimization algorithms and reduce computational time, the proposed strategy utilizes a multi-objective optimization technique and a clustering algorithm.

3.3.2. NSGA-III Algorithm

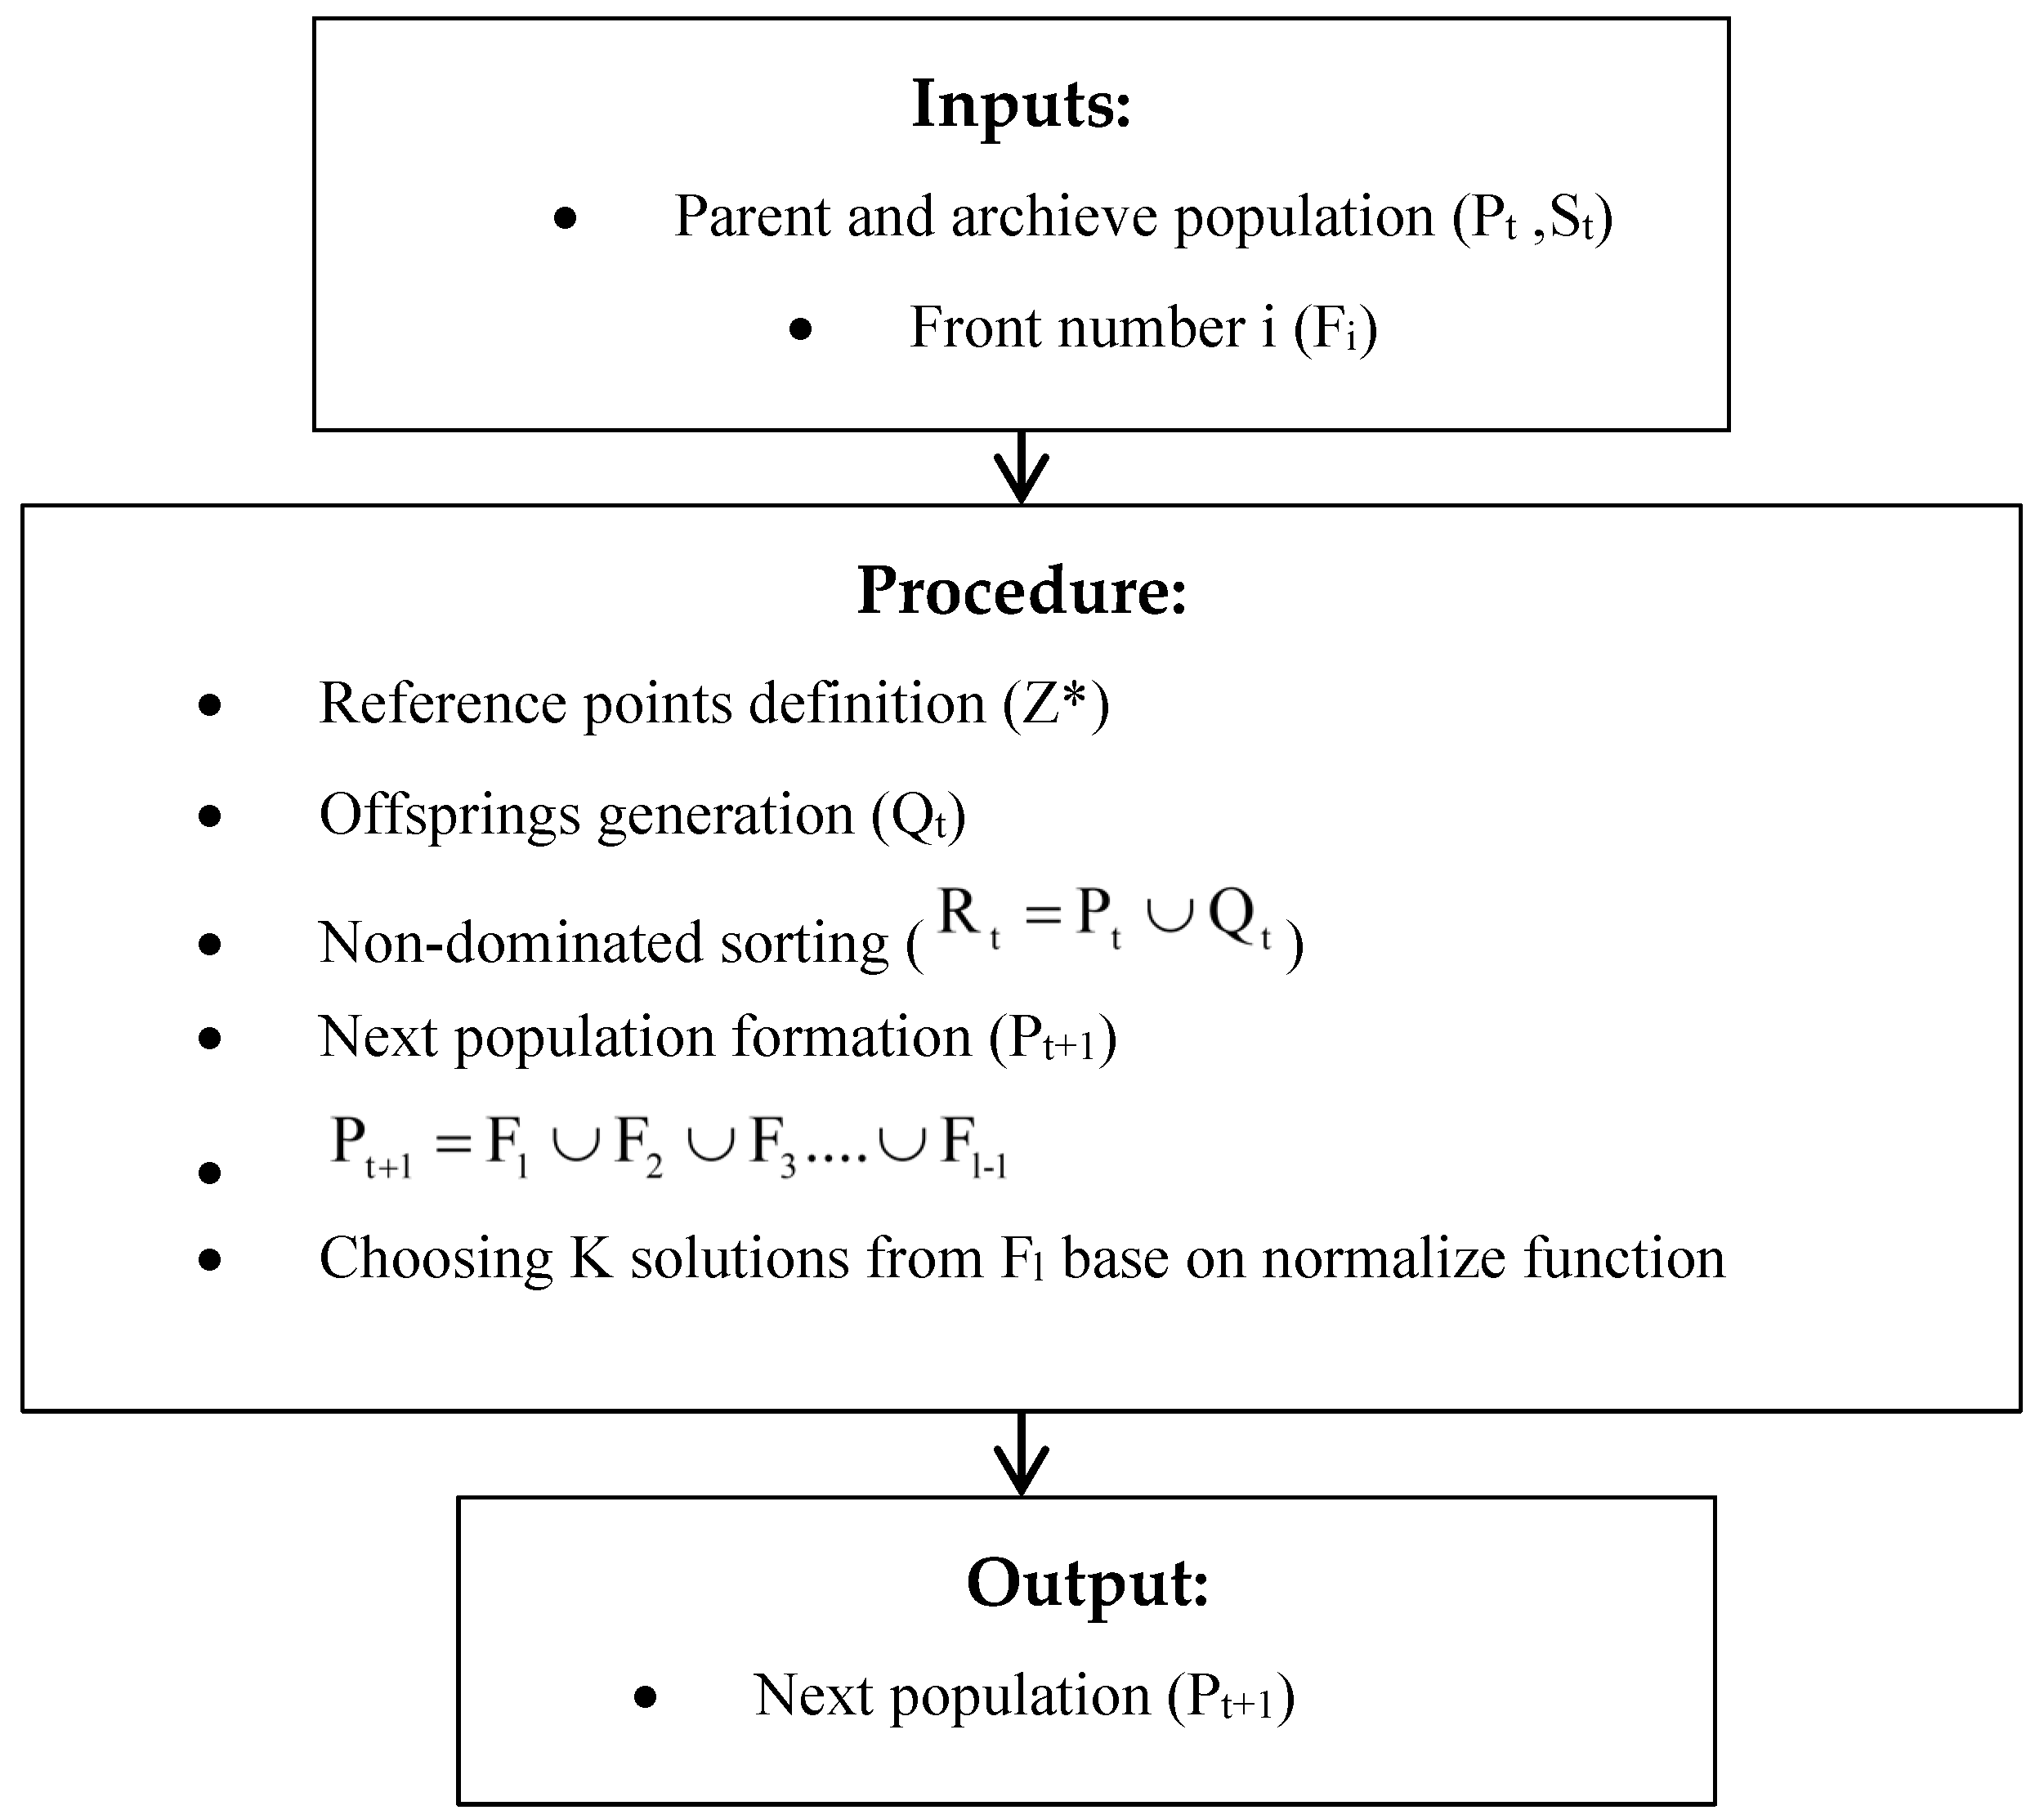
In this study, NSGA-III is used to solve the optimal management problem of IES, which is formulated in Section 4. NSGA-III is a multi-objective evolutionary algorithm for many-objective problems [37,39]. It generates a pool of diverse solutions through non-dominated sorting and reproduction processes. This algorithm is an extension of NSGA-II and was proposed with the aim of improving the performance of NSGA-II. It adds the idea of reference points to improve the efficiency of NSGA-II [37], which is mainly used to handle multi-objective problems. The detailed flow of NSGA-III is shown in Figure 4. This algorithm has been described in detail in [37].

3.3.3. MOSOA Algorithm

MOSOA is a metaheuristic algorithm in the field of overall optimization that has improved the global optimum convergence. Its whole detailed process is described in more detail in [33].

3.4. Sim&Corrloss Clustering Method

A Sim&Corrloss-based scenario analysis is used to increase the reliability of decision making [40]. Unreliability is the result of interaction between random variables and their correlation. None of the mentioned studies consider the correlation of random variables, but this study considers it. The used clustering algorithm is based on the similarity and dependence of the saved scenarios after the decrease process of them. The clustering method should be maintained in such a way that the correlation of several random variables is well preserved. In the Sim&Corrloss clustering method, the objective function is developed based on the correlation loss and similarity functions as follows:
max m = 1   N ˜ 1 i Im [ Sim ( ξ i ξ m ) β corrloss ( ξ i ξ m ) ] s . t . m = 1   N ˜   1 I m = Ω 1 , i Ω 1 p i = 1 I m I m = 0 , m   m     ,   m ,   m   1 , 2 , ,   N ˜ 1
Sim ( ξ i , ξ j ) = 1 d k = 1 d ( 1 p i p j p i + p j ) ξ i k ξ j k max ξ l k min ξ l k + ε 1 l N           1 l N  
corloss ( ξ i , ξ j ) = i = 1 d 1 j = i + 1 d ( Δ ρ ij ) 2
In the Sim&Corrloss clustering algorithm, the parameters are choosen based on a balance between maintaining similarity between the original scenario set and minimizing correlation loss during the scenario reduction process. In this algorithm, the ratio β is crucial, as it controls the trade-off between the correlation loss and the similarity during scenario reduction, and the objective is to find an optimal value of β that yields the best performance while ensuring stability in the reduced scenario set. In this paper, the β is tested one by one from 0 to 1 with a 0.1 interval through a large number of simulation tests. This method is explained in more detail in [40]. To lessen the scenarios, the average value of solar irradiance, wind speed, and load demand during 24 h is calculated, and then the Sim&Corrloss clustering method is used to reduce the scenarios. The clustering method used makes the proposed approach fast and reliable.

4. Results and Discussion

In order to validate the contributions of this work, a test IES was studied, including several electrical power sources, a CHP plant, a P2G unit, two heat boilers, and three storage devices. In this section, a simulation is performed to illustrate the validity and effectiveness of our model of operation

4.1. The Test IES

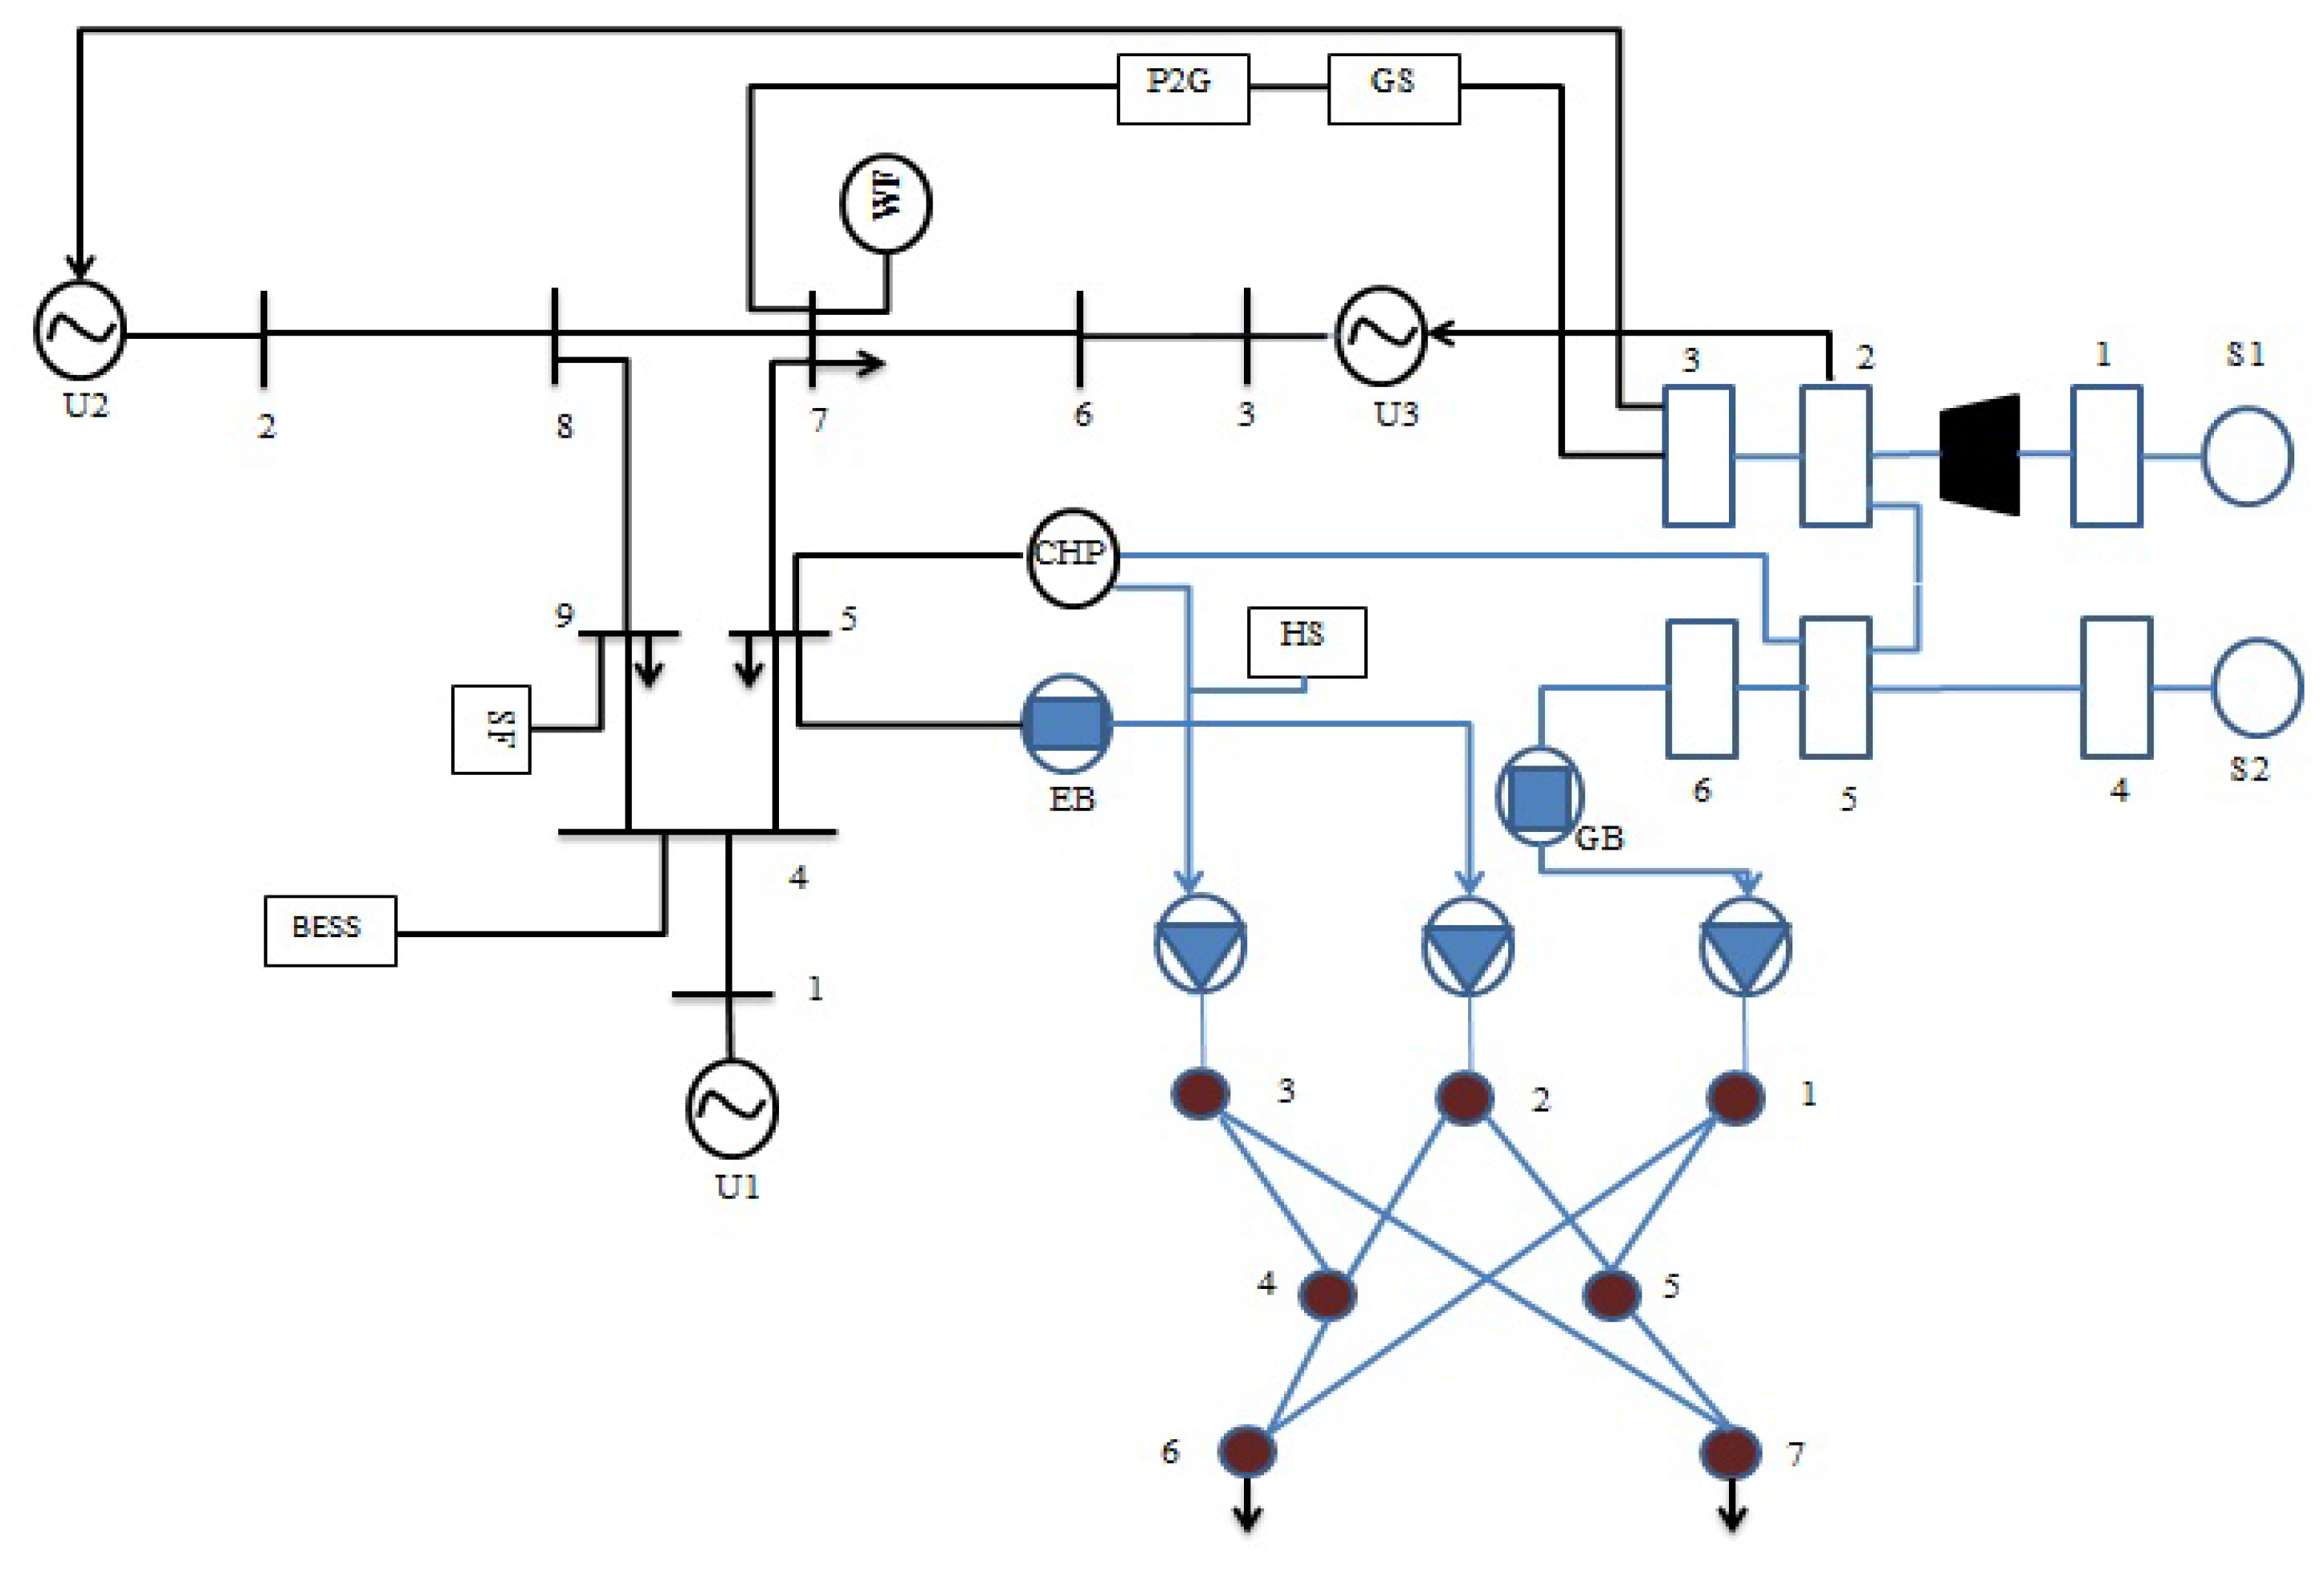
The test IES used to verify the proposed optimal management is shown in Figure 5. All the applied data can be found in [28]. The simulation is performed over a period of 1 day, and the results of the energy analysis are obtained in a period of 1 h. The parameters of the algorithms are listed in Table 2. As shown in Figure 5, the test case system contains different types of energy components, namely electric boiler, gas boiler transformer, CHP, ESS, HSS, GS, P2G, wind turbine, SPV unit, hot water pipeline, compressor, and gas pipeline. Each subsystem in the IES has its own converters with different energy dispatch coefficients and different energy conversion efficiencies. The required parameters of the components are listed in Table 3. In summary, the electric loads and heat loads are included in the demand response program. The maximum generation of the wind turbine is set to 50 MW, and the capacity of the SPV unit is set to 27 MW. The additional data required for these sources can be found in [28]. To show the validity of the proposed technique, the number of scenarios in terms of random variables is set to 1000 scenarios, which are reduced to 30 scenarios by applying the clustering algorithm (Table 4, Table 5, Table 6, Table 7, Table 8, Table 9, Table 10 and Table 11).
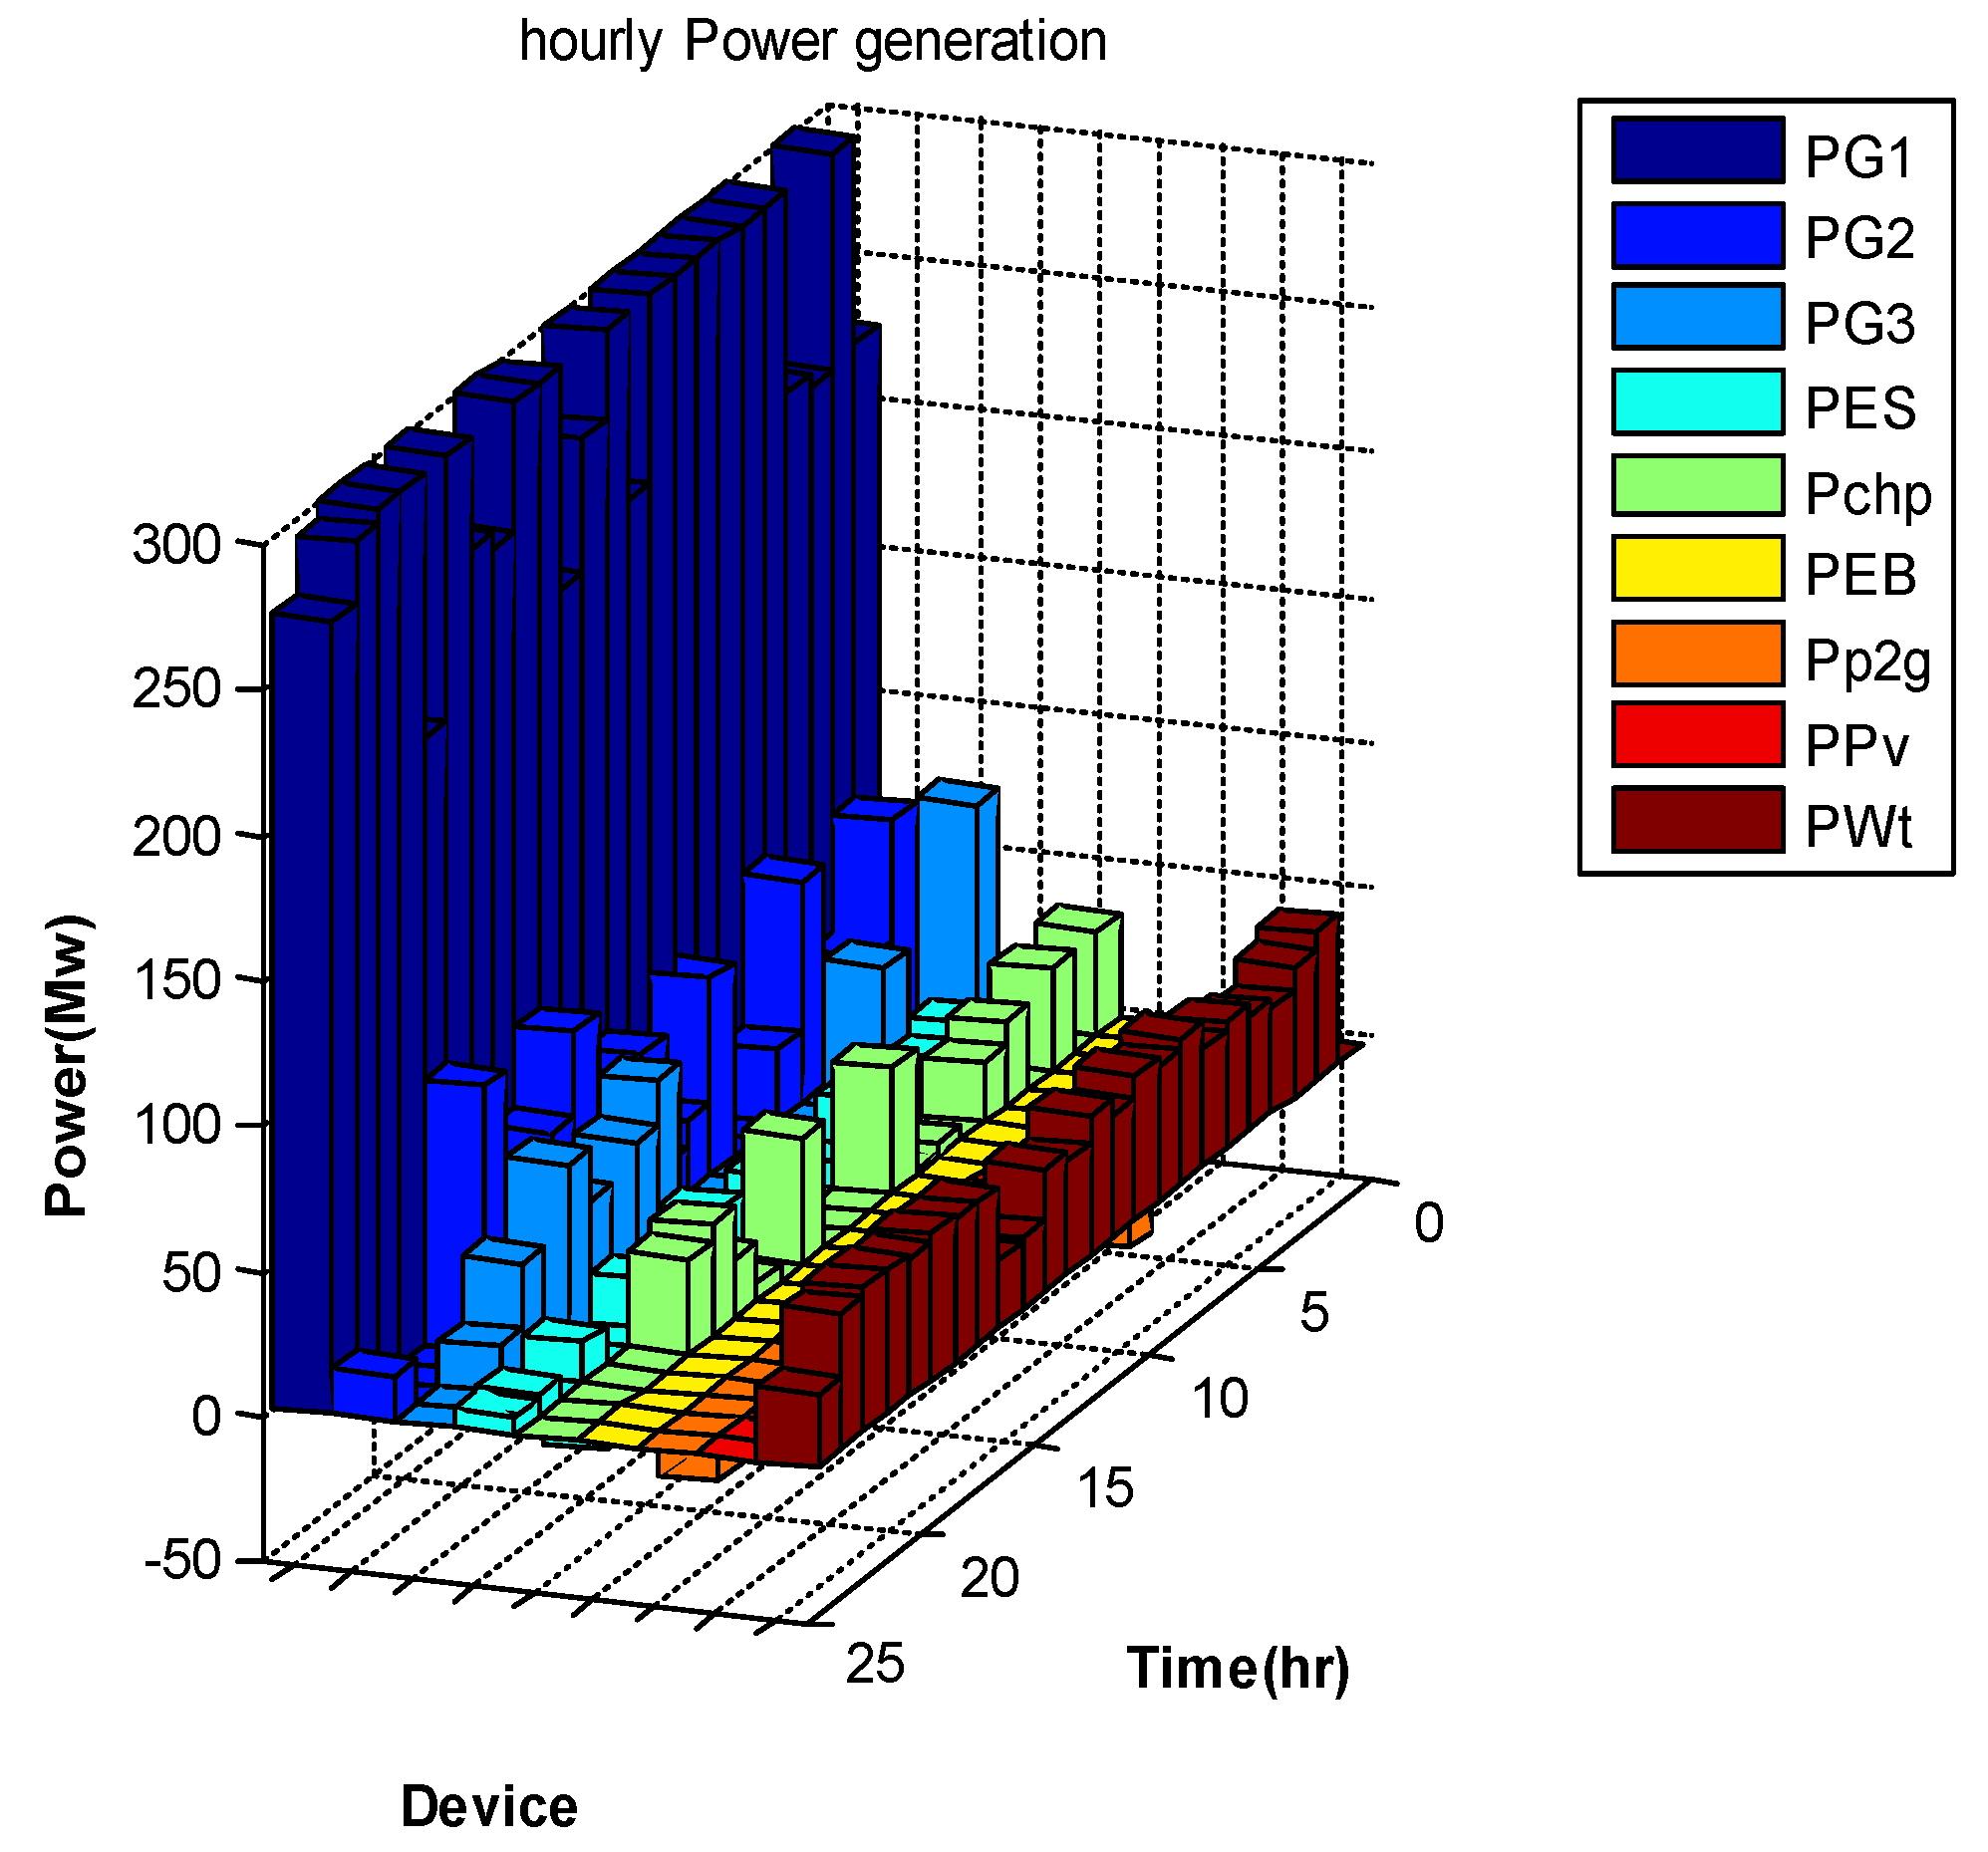
The optimal scheduling of the IES in the most probable scenario, aiming to minimize total losses and total operating and emission costs, is presented in Figure 6, Figure 7, Figure 8 and Figure 9. Power generation units such as the SPV unit, wind turbines, and CHP plant are assumed to be capable of injecting both active (P) and reactive (Q) power, and their installation location is considered to be the PQ bus. The optimal Pareto front obtained in the scenario with the highest probability of occurrence is shown in Figure 10, which depicts the total losses and total operating costs of the system over a 24 h period. The statistical analysis of the objective functions defined in the optimization process is presented in Table 12. These results indicate that the changes in the objective functions remain within the specified range when the load demand, wind speed, and solar irradiance change. This suggests that the proposed method can effectively handle changes in input variables and their impact on output variables. Additionally, it emphasizes the importance of considering all aspects of the problem in short-term studies. Finally, the obtained statistical values are compared to the results obtained using MOSOA. The optimal Pareto front presented in Figure 10 shows the compromise point determined by NSGA-III for the optimization problem. The total operating and emission costs are 1.1602 × 10⁵ $, and the total loss value is 0.1188 × 10² MW. The corresponding values for the objective functions obtained using MOSOA are 1.1593 × 10⁵ $ and 0.1189 × 10² MW. When it comes to reducing loss value for a true operating point, NSGA-III demonstrates superior performance, while MOSOA performs better in reducing total costs. As a result, a trade-off must be struck between minimizing loss and minimizing cost in operational optimization.
As can be seen from Figure 6, the wind turbine has the highest power generation in the early morning and late at night. During the time intervals [01:00, 07:00] and [21:00, 24:00], the SPV plant does not generate any electricity, and the electricity demand is met by other power sources, while the ESS is charged. This means that electric storage is used in hours when electricity demand is high and renewable energy sources generate less power. The CHP plant also supplies electricity during these periods. When the SPV plant generates more electricity, the net consumption of the electric boiler and P2G increases to meet the heat and gas demand. During the periods of low wind power generation, the load on the P2G decreases, but the output of thermal power plants increases. The operational results of the heat generation units and storage device are depicted in Figure 7. As shown, the gas boiler has the highest thermal energy production in the early morning and late at night. Heat storage is used in hours when heat load demand is high and heat sources generate less thermal energy. In another sense, moving away from gas boilers, increased heat generation from a dispatchable unit, like a CHP, compensates for their reduced output. Consequently, expansions in both gas and electricity generation are necessary. This shift to diversified heat sources also requires heat storage facilities to manage diurnal surpluses and deficits.
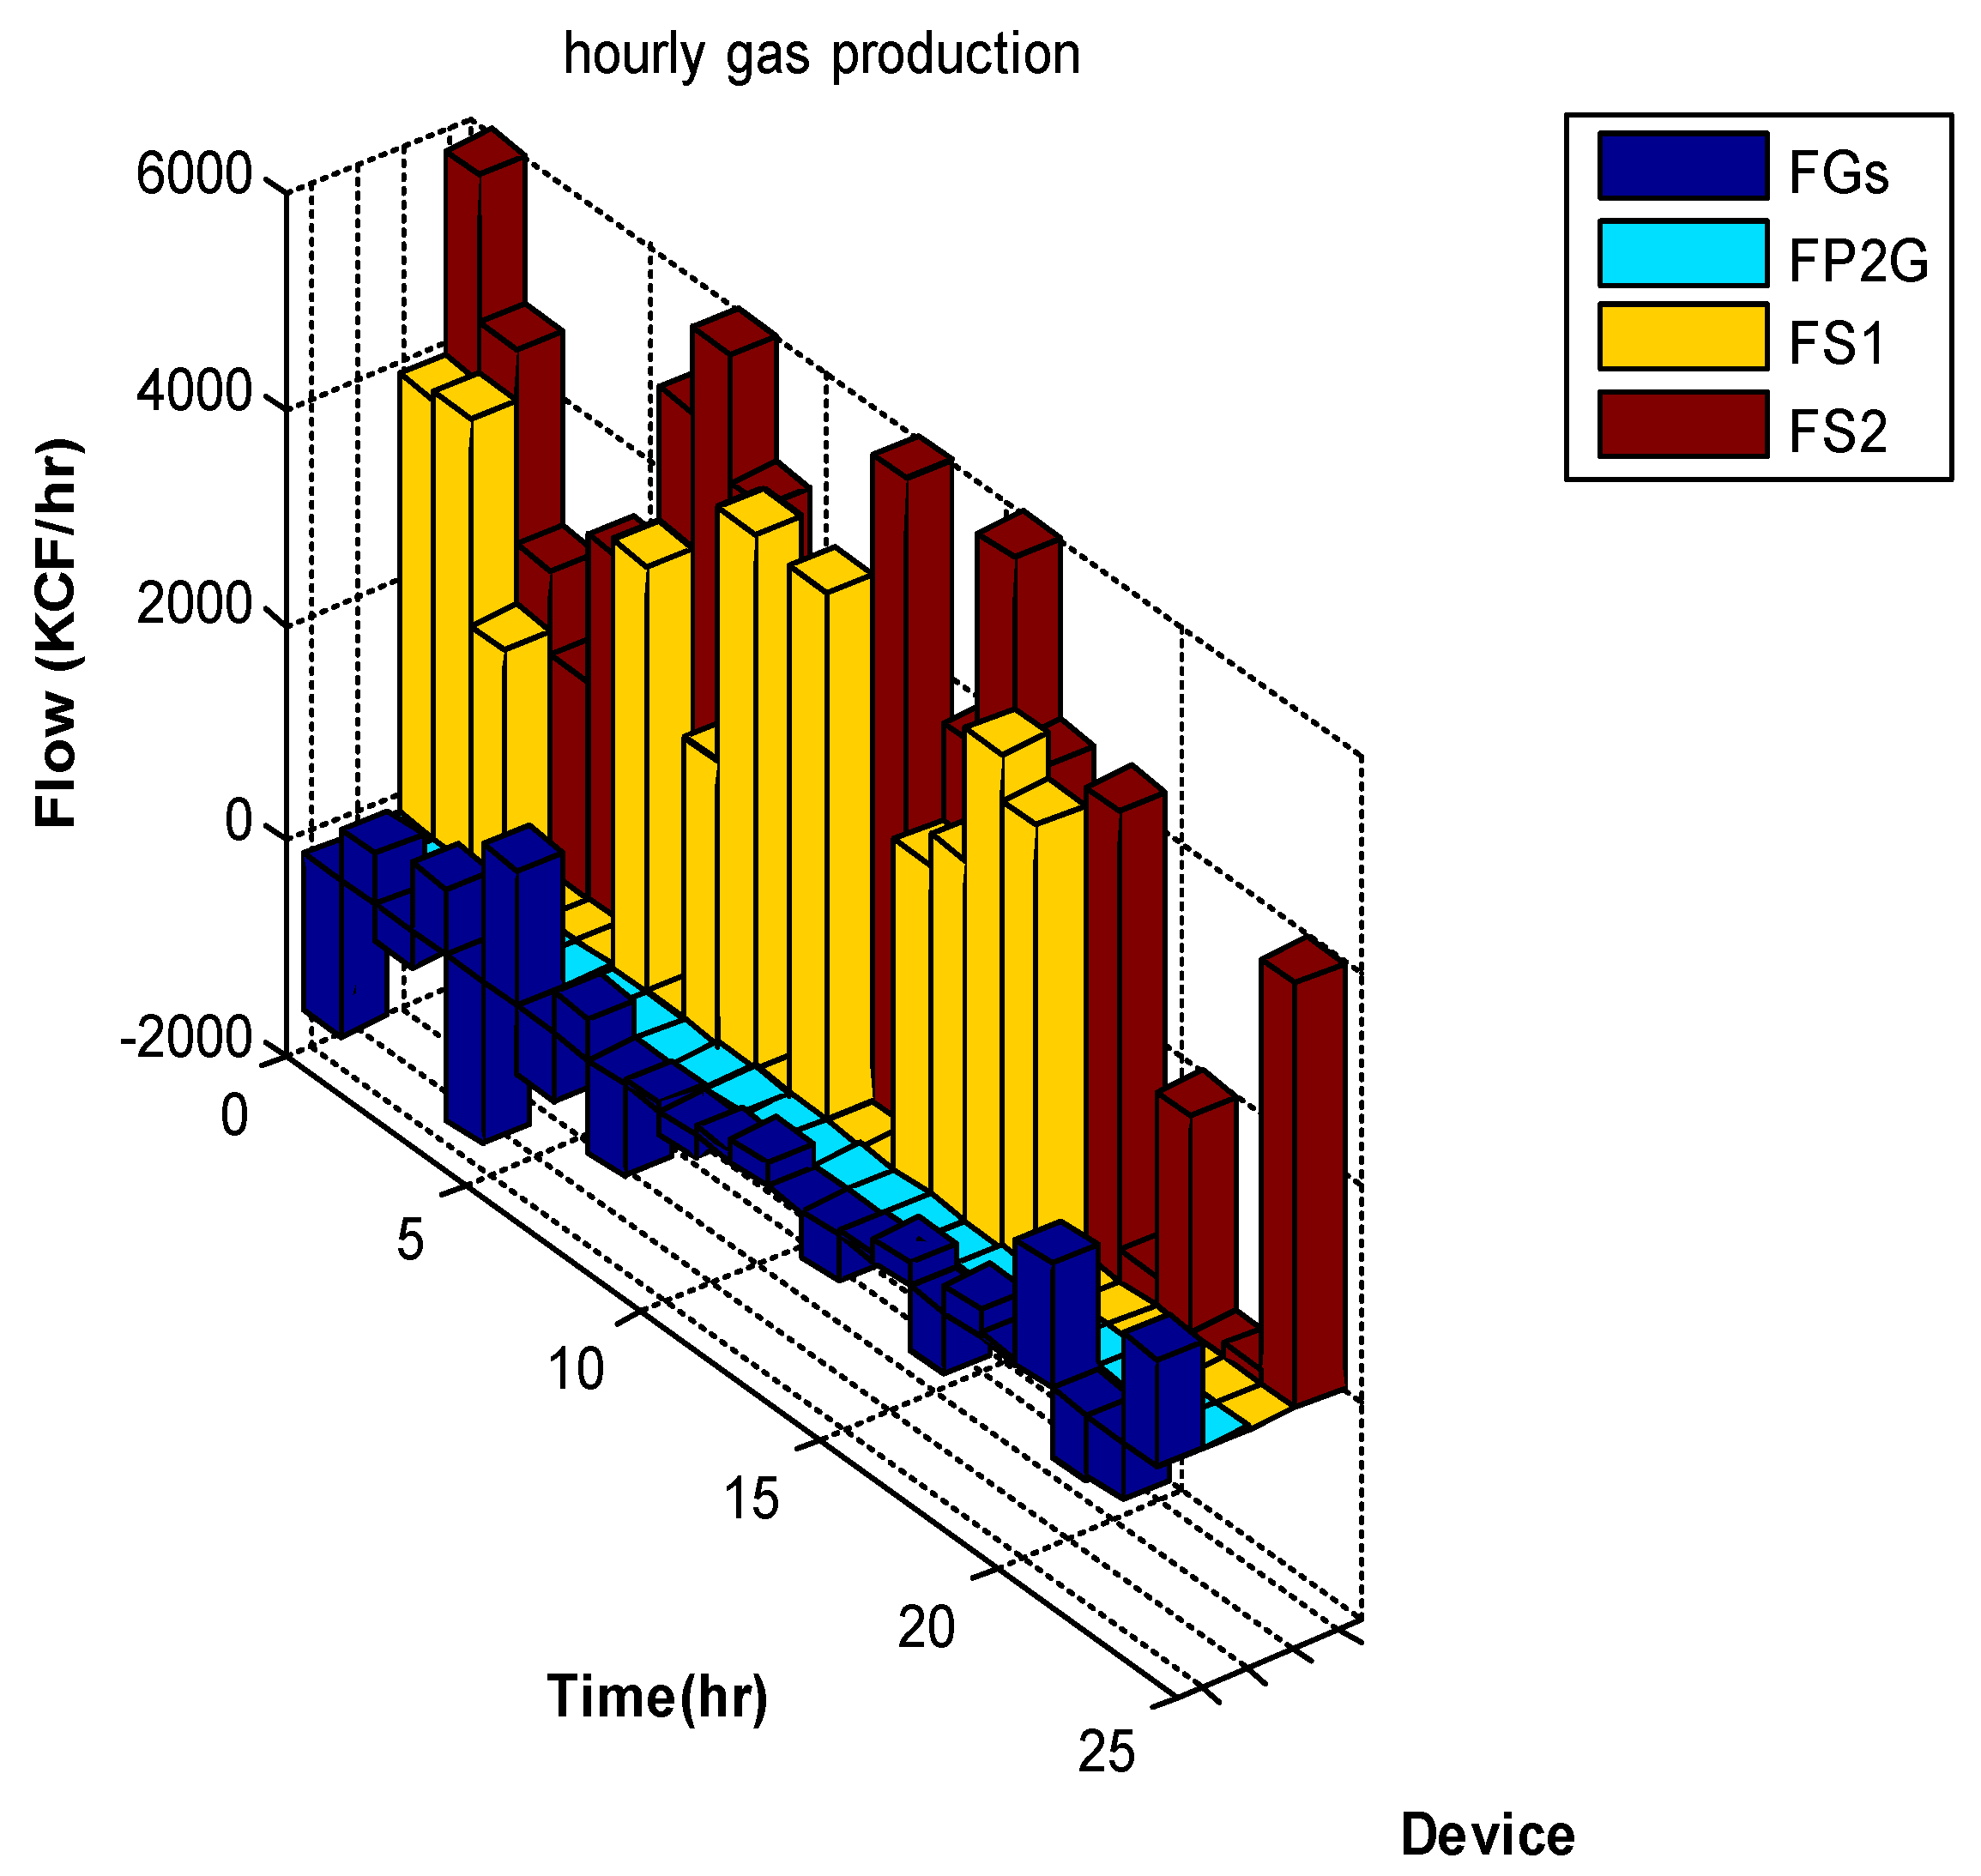
As can be seen from Figure 8, natural gas resources have the highest gas production in the early morning and late at night, and gas storage is used in hours when gas resources produce less gas.
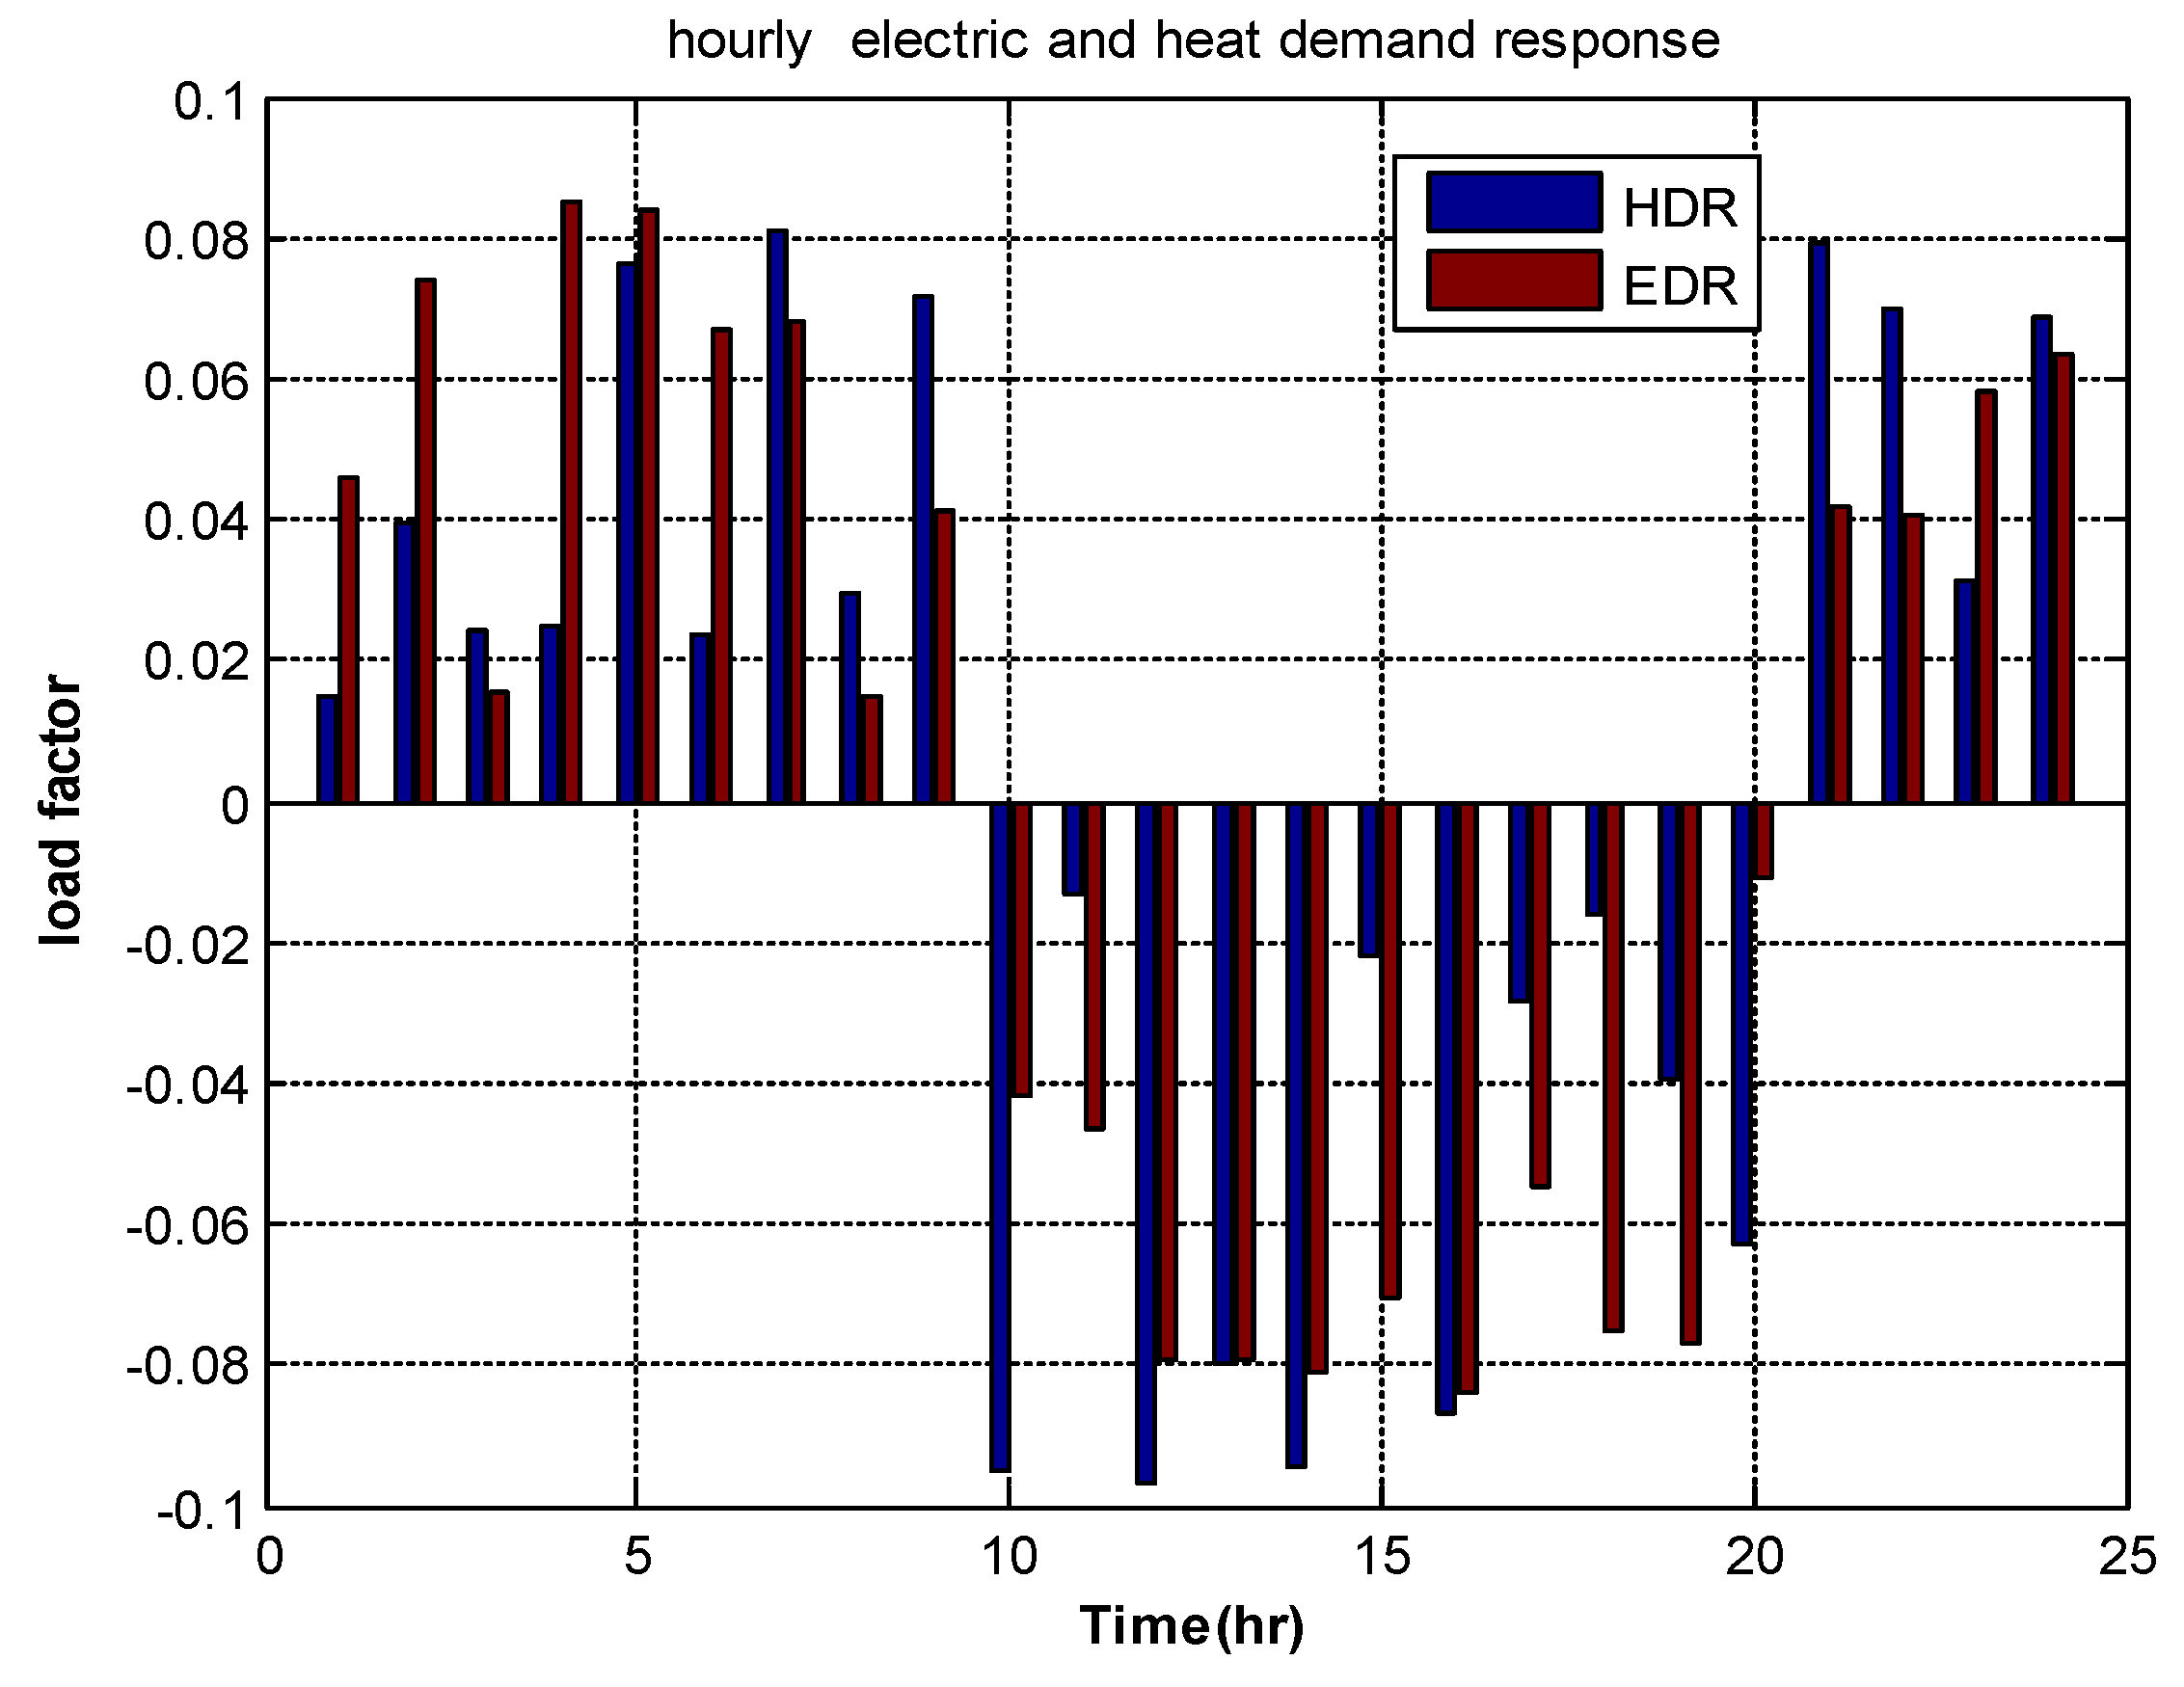
The power generated by the RES is proportional to wind speed and solar irradiance, and this is taken into account in the optimization process. However, the charging and discharging of storage devices are generally proportional to energy consumption, considering the type of load in each subsystem. This means that storage devices should be charged when energy consumption is low and discharged when consumption is high. Optimal management is implemented with a demand response program for electrical and thermal loads. As can be seen from Figure 9, electrical demand response programs are used in hours when electric load demand is high to reduce demand. Additionally, heat demand response programs are used in hours when heating and cooling loads are at their maximum levels. Load shifting is employed to smooth the load profile.
A statistical analysis of the objective functions defined in the optimization process is presented in Table 12. The minimum and maximum values of the objective functions for total loss and total cost are found to be within the ranges [0.1178–0.1581] and [1.1521–1.5095], respectively. Statistical analysis of the optimization process reveals that the objective functions, total loss and total cost, are constrained within specified ranges. It is important to note that in statistical analysis, the average value represents the central tendency of the data, while the standard deviation quantifies the dispersion of the data around the mean value. Correspondingly, the average values for the loss function and the total cost function are found to be 0.1389 and 1.3319, respectively. The standard deviations for the loss function and the total cost function are 0.0116 and 0.1034, respectively. These results suggest that the changes in the objective functions, namely, total loss and total cost, will be constrained within the specified ranges when the load demand, wind speed, and sun irradiance undergo variations. This indicates the effective capture of input-output relationships by the proposed method. Moreover, the inherent complexity of energy problems underscores the significance of statistical analysis in short-term studies for optimal energy management systems. The obtained statistical values are compared with those obtained via the MOSOA algorithm and GAMS solver.
A comparative analysis was conducted among NSGA-III, MOSOA, and the GAMS solver. The findings clearly indicate that NSGA-III is superior to MOSOA in minimizing the cost function. Conversely, as the cost function decreases, the loss function tends to increase, suggesting a trade-off between these two objectives.
However, it is important to note that the performance of both algorithms may vary depending on the specific characteristics of the problem. Table 13 shows this conclusion. As shown in Table 14, in the scenario with the highest probability of occurrence, PAR is decreased by 5.4247% and 0.1691% in the electrical and gas networks, respectively.

4.2. The Sensitivity Analysis

To evaluate the impact of varying the number of reduced scenarios on the optimization results, the number of scenarios is decreased from 1000 to 10, and the objective functions are calculated. The analysis results are presented in Table 15. The system maintains an effective balance down to 20 scenarios, with energy loss rising to 0.107 pu (+7%) and cost rising to 1.145 pu (+2.51%), both within acceptable thresholds. At 10 scenarios, the steep increases to 0.126 pu and 1.175 pu indicate a loss of balance, reinforcing NSGA-III’s suitability for higher scenario counts and identifying 20 as a practical lower limit for scenario reduction in IES optimization.
This analysis assesses the robustness of the proposed energy management system. It seeks to identify the threshold at which scenario reduction compromises the balance between technical and economic aspects, thereby validating the effectiveness of proposed approach.

4.3. Highlighted Preferences of the Proposed Approach

  • Most conventional EMSs do not fully consider the state variables of the three subsystems in the integrated energy system (IES). In contrast, the proposed approach comprehensively captures all the state variables based on load flow analysis, heat flow analysis, and gas flow analysis in the EPS, DHS, and NGS, respectively. This enables the optimization of loss function and cost function.
  • The IES model in existing studies does not incorporate all the components simultaneously, including CHP, P2G, ESS, HSS, GS, RES, EB, and GS. However, the proposed model integrates these components simultaneously for a more comprehensive and holistic representation of the IES.
  • None of the previous studies employed minimization of heat losses and reduction of power losses associated with pressure drop as objective functions.
  • While previous studies focused primarily on electrical load control, the proposed model extends to both electrical and thermal load control. This broader perspective enables more effective optimization of the system’s performance.
  • The uncertainty of solar radiation, wind speed, and electric load demand is simultaneously considered in the proposed EMS. This sets it apart from existing studies that only treat these variables individually. The comprehensive treatment of uncertainty enhances the robustness and adaptability of the proposed model to real-world conditions.
  • None of the mentioned studies considered the correlation between random variables. The proposed model addresses this gap by employing the Sim&Corrloss clustering method. This clustering method facilitates efficient and reliable optimization, making the proposed approach more robust.
  • The optimization problem of EMS is defined as a stochastic multi-objective model, allowing for considering multiple objective functions simultaneously. NSGA-III is employed due to its efficiency and ability to find optimal solutions.

5. Conclusions

This paper introduces an optimal energy management system for an integrated energy system (IES) utilizing the NSGA-III algorithm. The utilization of NSGA-III aided in identifying Pareto-optimal solutions, offering a range of non-dominated choices for scheduling and energy storage operation. In this paper, the criterion for selecting the final solution of the problem takes into account both the technical and economic aspects of the problem simultaneously. Thus, the optimal solution is chosen in such a way that a kind of balance is established between these aspects. The objective functions encompass the reduction of overall system losses, minimizing operational costs and decreasing environmental pollution associated with energy units. The proposed method considers the uncertainty of RES units and power consumption in the EPS. By applying the Sim&Corrloss clustering technique, the number of scenarios in the optimization problem was diminished. To control the uncertainty of the parameters, different storage devices were used. In addition, to compensate for the lack of generation capacity, a demand response program (DR) was used to save energy and cost. Numerical studies show that the PAR index has decreased by 5.4247% and 0.1691% in the electrical and gas networks, respectively, which implies a reduction in peak load and the procurement of energy at a lower cost with minimal environmental pollution. Furthermore, EEI has increased by 10.4844%, which signifies an increase in system efficiency.
The obtained results have exhibited impressive use of RES units and storage devices. The obtained simulation results have been compared with the MOSOA- and GAMS-based solution. From the numerical results based on the test system, the following conclusions can be drawn:
  • Exact solutions can be generated with the proposed model.
  • The proposed optimization technique can lead to a near optimal solution by making a suitable tradeoff between the goals of the problem.
  • The flexibility of the power system can be improved by using the IES.
  • The RES power constraint can be reduced by converting energy to converter units.
  • In conclusion, the findings of this study are generalizable and applicable for mid-term and long-term network planning.

Author Contributions

Conceptualization, H.F.; methodology, H.F.; validation, N.G. and F.S.; resources, F.S.; supervision, N.G.; funding acquisition, F.S. All authors have read and agreed to the published version of the manuscript.

Funding

This research received no external funding.

Institutional Review Board Statement

Not applicable.

Informed Consent Statement

Not applicable.

Data Availability Statement

Data are contained within the article.

Conflicts of Interest

The authors declare no conflicts of interest.

Abbreviations

The following abbreviations are used in this manuscript:
IESintegrated energy system
NSGA-IIInon-dominated sorting genetic algorithm III
DRdemand response
MOSOAmulti-objective seagull optimization algorithm
GAMSgeneral algebraic modeling system
NGSnatural gas system
EPSelectric power system
EMSenergy management system
OPFoptimal power flow
P2Gpower-to-gas
CHPcombined heat And power
MILPmixed-integer linear programming
MGmicrogrids
EHenergy hub
ESSelectric storage system
HSSheat storage system
GSgas storage
RESrenewable energy sources
EBelectric boiler
GBgas boiler
DHSdistrict heating systems
SPVsolar photovoltaic
DSMdemand-side management
PDFprobability distribution function
WTwind turbine
TPthermal power
GCgas compressors
SOCstate of charge
MOOmulti-objective optimization
DRPdemand response
NOxnitrogen oxide
COcarbon monoxide
SO2sulfur dioxide
PARpeak-to-average Ratio
IPimprovement percentage
Corrlosscorrelation loss
Simsimilarity
IEBSAimproved escaping-bird search algorithm
UTunscented transformation
MMGmulti-microgrid
MJAYAmulti-objective JAYA algorithm
ROrobust optimization

References

  1. Li, Y.; Wang, C.; Li, G.; Chen, C. Optimal Scheduling of Integrated Demand Response-Enabled Integrated Energy Systems with Uncertain Renewable Generations: A Stackelberg Game Approach. Energy Convers. Manag. 2020, 235, 113996. [Google Scholar] [CrossRef]
  2. Chen, Y.; Zhang, Y.; Wang, J.; Lu, Z. Optimal Operation for Integrated Electricity–Heat System with Improved Heat Pump and Storage Model to Enhance Local Energy Utilization. Energies 2020, 13, 6729. [Google Scholar] [CrossRef]
  3. Turk, A.; Zeng, Q.; Wu, Q.; Nielsen, A.H. Optimal operation of integrated electrical, district heating and natural gas system in wind dominated power system. Int. J. Smart Grid Clean Energy 2020, 9, 237–246. [Google Scholar]
  4. Wu, H.; Li, H.; Gu, X. Optimal Energy Management for Microgrids Considering Uncertainties in Renewable Energy Generation and Load Demand. Processes 2020, 8, 1086. [Google Scholar] [CrossRef]
  5. Lv, J.; Zhang, S.; Cheng, H.; Fang, S. Optimal day-ahead operation of user-level integrated energy system considering dynamic behaviour of heat loads and customers’ heat satisfaction. IET Smart Grid 2019, 2, 320–326. [Google Scholar]
  6. Duan, J.; Liu, F.; Yang, Y.; Jin, Z. Flexible Dispatch for Integrated Power and Gas Systems Considering Power-to-Gas and Demand Response. Energies 2021, 14, 5554. [Google Scholar] [CrossRef]
  7. Mohammadi, M.; Noorollahi, Y.; Mohammadi-ivatloo, B.; Hosseinzadeh, M.; Yousefi, H.; Khorasani, S.T. Optimal management of energy hubs and smart energy hubs–A review. Renew. Sustain. Energy 2018, 89, 33–57. [Google Scholar]
  8. Naderi, E.; Narimani, H.; Pourakbari-Kasmaei, M.; Cerna, F.V.; Marzband, M.; Lehtonen, M. State-of-the-Art of Optimal Active and Reactive Power Flow: A Comprehensive Review from Various Standpoints. Processes 2021, 9, 1319. [Google Scholar] [CrossRef]
  9. Jiang, T.; Deng, H.; Bai, L.; Zhang, R.; Li, X.; Chen, H. Optimal energy flow and nodal energy pricing in carbon emission-embedded integrated energy systems. CSEE J. Power Energy Syst. 2018, 4, 179–187. [Google Scholar]
  10. Jin, X.; Mu, Y.; Jia, H.; Wu, J.; Xu, X.; Yu, X. Optimal day-ahead scheduling of integrated urban energy systems. Appl. Energy 2016, 180, 1–13. [Google Scholar]
  11. Thang, V.V.; Zhang, Y.; Ha, T.; Liu, S. Optimal operation of energy hub in competitive electricity market considering uncertainties. Int. J. Energy Environ. Eng. 2018, 9, 351–362. [Google Scholar]
  12. Shekari, T.; Gholami, A.; Aminifar, F. Optimal energy management in multi-carrier microgrids: An MILP approach. J. Mod. Power Syst. Clean Energy 2019, 7, 876–886. [Google Scholar]
  13. Li, J.; Fang, J.; Zeng, Q.; Chen, Z. Optimal operation of the integrated electrical and heating systems to accommodate the intermittent renewable sources. Appl. Energy 2016, 167, 244–254. [Google Scholar]
  14. Zhong, Y.; Xie, D.; Zhai, S.; Sun, Y. Day-Ahead Hierarchical Steady State Optimal Operation for Integrated Energy System Based on Energy Hub. Energies 2018, 11, 2765. [Google Scholar] [CrossRef]
  15. Abdulwahid, A.H.; Al-Razgan, M.; Fakhruldeen, H.F.; Arellano, M.T.C.; Mrzljak, V.; Nowdeh, S.A.; Moghaddam, M.J.H. Stochastic Multi-Objective Scheduling of a Hybrid System in a Distribution Network Using a Mathematical Optimization Algorithm Considering Generation and Demand Uncertainties. Mathematics 2023, 11, 3962. [Google Scholar] [CrossRef]
  16. Javidsharifi, M.; Pourroshanfekr Arabani, H.; Kerekes, T.; Sera, D.; Guerrero, J.M. Stochastic Optimal Strategy for Power Management in Interconnected Multi-Microgrid Systems. Electronics 2022, 11, 1424. [Google Scholar] [CrossRef]
  17. Azarinfar, H.; Khosravi, M.; Sabzevari, K.; Dzikuć, M. Stochastic Economic–Resilience Management of Combined Cooling, Heat, and Power-Based Microgrids in a Multi-Objective Approach. Sustainability 2024, 16, 1212. [Google Scholar] [CrossRef]
  18. Zhao, Y.; Wei, Y.; Zhang, S.; Guo, Y.; Sun, H. Multi-Objective Robust Optimization of Integrated Energy System with Hydrogen Energy Storage. Energies 2024, 17, 1132. [Google Scholar] [CrossRef]
  19. Alkatheri, M.; Alhameli, F.; Betancourt-Torcat, A.; Almansoori, A.; Elkamel, A. Clustering Approach for the Efficient Solution of Multiscale Stochastic Programming Problems: Application to Energy Hub Design and Operation under Uncertainty. Processes 2023, 11, 1046. [Google Scholar] [CrossRef]
  20. Dong, Q.; Sun, Q.; Huang, Y.; Li, Z.; Cheng, C. Hybrid Possibilistic-Probabilistic Energy Flow Assessment for Multi-Energy Carrier Systems. IEEE Access 2019, 7, 176115–176126. [Google Scholar]
  21. Leung, T. Coupled Natural Gas and Electric Power Systems. Ph.D. Thesis, Massachusetts Institute of Technology, Cambridge, MA, USA, 2015. [Google Scholar]
  22. Yu, J.; Guo, L.; Ma, M.; Kamel, S.; Li, W.; Song, X. Risk assessment of integrated electrical, natural gas and district heating systems considering solar thermal CHP plants and electric boilers. Int. J. Electr. Power Energy Syst. 2018, 103, 277–287. [Google Scholar]
  23. Li, Y.; Zio, E. Uncertainty analysis of the adequacy assessment model of a distributed generation system. Renew. Energy 2012, 41, 235–244. [Google Scholar] [CrossRef]
  24. Quan, H.; Yang, D.; Khambadkone, A.M.; Srinivasan, D. A Stochastic Power Flow Study to Investigate the Effects of Renewable Energy Integration. In Proceedings of the 2018 IEEE Innovative Smart Grid Technologies–Asia (ISGT Asia), Singapore, 22–25 May 2018. [Google Scholar]
  25. Ghaffarpour, R. Stochastic optimization of operation of power to gas included energy hub considering carbon trading, demand response and district heating market. J. Energy Manag. Technol. (JEMT) 2020, 4, 7–14. [Google Scholar]
  26. Nojavan, S.; Majidi, M.; Zare, K. Optimal scheduling of heating and power hubs under economic and environment issues in the presence of peak load management. Energy Convers. Manag. 2016, 156, 34–44. [Google Scholar] [CrossRef]
  27. Shaabani, Y.A.; Seifi, A.R.; Kouhanjani, M.J. Stochastic multi-objective optimization of combined heat and power economic/emission dispatch. Energy 2017, 141, 1892–1904. [Google Scholar] [CrossRef]
  28. Klinkel, K. Combined Simulation of District Heating and Electrical Power Networks. Master Thesis, TU/e, Eindhoven University and Technology, Eindhoven, The Netherlands, 2020. [Google Scholar]
  29. Liu, X. Combined Analysis of Electricity and Heat Networks. Ph.D. Thesis, Institute of Energy, Cardiff University, Cardiff, UK, 2013. [Google Scholar]
  30. Wei, W.; Wang, J. Modeling and Optimization of Interdependent Energy Infrastructures; Springer Nature: Cham, Switzerland, 2020; ISBN 978-3-030-25958-7. [Google Scholar]
  31. Li, Q.; An, S.; Gedra, T.W. Solving Natural Gas Loadflow Problems Using Electric Loadflow Techniques. In Proceedings of the North American Power Symposium, Rolla, MI, USA, 20–21 October 2003. [Google Scholar]
  32. Woldeyohannes, A.D.; Majid, M.A.A. Simulation model for natural gas transmission pipeline network system. Simul. Model. Pract. Theory 2021, 19, 196–212. [Google Scholar] [CrossRef]
  33. Xiaonan, D.; Qun, G.; Tian, Q.; Kittisak, J. Economic and environmental assessment of multi-energy microgrids under a hybrid optimization technique. Sustain. Cities Soc. 2021, 102630. [Google Scholar]
  34. Dhiman, G.; Singh, K.K.; Soni, M.; Nagar, A.; Dehghani, M.; Slowik, A.; Kaur, A.; Sharma, A.; Houssein, E.H.; Cengiz, K. MOSOA: A New Multi-objective Seagull Optimization Algorithm. Expert Syst. Appl. 2021, 167, 114150. [Google Scholar] [CrossRef]
  35. Zhang, H.; Wang, G.-G.; Dong, J.; Gandomi, A.H. Improved NSGA-III with Second-Order Difference Random Strategy for Dynamic Multi-Objective Optimization. Processes 2021, 9, 911. [Google Scholar] [CrossRef]
  36. Bhesdadiya, R.H.; Trivedi, I.N.; Jangir, P.; Jangir, N.; Kumar, A. An NSGA-III algorithm for solving multi-objective economic/environmental dispatch problem. Cogent Eng. 2016, 3, 1269383. [Google Scholar] [CrossRef]
  37. Chen, S.; Wang, S. An Optimization Method for an Integrated Energy System Scheduling Process Based on NSGA-II Improved by Tent Mapping Chaotic Algorithms. Processes 2020, 8, 426. [Google Scholar] [CrossRef]
  38. Pansota, M.S.; Javed, H.; Muqeet, A.; Irfan, M.; Shehzad, M.; Liaqat, R. Scheduling and Sizing of Campus Microgrid Considering Demand Response and Economic Analysis. Energy Sustain. Soc. 2021. [Google Scholar] [CrossRef]
  39. Niu, B.; Duan, Q.; Liu, J.; Tan, L.; Liu, Y. A population-based clustering technique using particle swarm optimization and k-means. Nat. Comput. 2016, 16, 45–59. [Google Scholar] [CrossRef]
  40. Hu, J.; Li, H. A New Clustering Approach for Scenario Reduction in Multi-Stochastic Variable Programming. IEEE Trans. Power Syst. 2019, 34, 3813–3825. [Google Scholar] [CrossRef]
Figure 1. Cost index membership function.
Sustainability 17 03001 g001
Figure 2. Preference index membership function.
Sustainability 17 03001 g002
Figure 3. Satisfaction index membership function.
Sustainability 17 03001 g003
Figure 4. NSGA-III flowchart.
Sustainability 17 03001 g004
Figure 5. Test case of IES (IEEE 9-node system, NGS 6-node system, and DHS 7-node system).
Sustainability 17 03001 g005
Figure 6. Optimal daily dispatch of the power generation units.
Sustainability 17 03001 g006
Figure 7. Optimal daily dispatch of the heat generation units.
Sustainability 17 03001 g007
Figure 8. Optimal daily dispatch of the gas generation units.
Sustainability 17 03001 g008
Figure 9. Optimal electrical and heat load factors in the presence of DRP.
Sustainability 17 03001 g009
Figure 10. Pareto front obtained through NSGA-III and MOSOA.
Sustainability 17 03001 g010
Table 1. Fuzzy rules.
PI
GMB
CIGGPGB
MPGPGB
BPGPBB
Table 2. The parameters of NSGA-III, MOSOA.
SymbolMeaningValue
NSize of population 50
MaxitMaximum iteration100
DNumber of decision variables11
RNumber of run10
SNumber of scenarios1000
SrNumber of scenarios after reduction30
Table 3. Values and limits of variables and parameters in the test IES.
Parameter/VariableValue
(soc,soh,sog,QP2G)min0
(soc,soh,sog,QP2G)max(45 Mwh,15 Mwh,37.5 KCF,2000 KCF)
(V,Ts,Tr,P)min(0.95 pu, 85, 40, Ref. [28])
(V,Ts,Tr,P)max(1.05 pu, 110, 50, Ref. [28])
(m,Q)min(Ref. [23], Ref. [28])
(m,Q)max(500, Ref. [28])
Za, ηGC, EGC, KGC, Ck, CR(0.95, 0.85, 0.99, 0.0854, 1.3, 1.414)
ηeCHP, ηhCHP, ηGB, ηEB(0.4, 0.5, 0.85.0.85)
ηESch, ηGSch, ηHSch0.9
ηESdis, ηGSdis, ηHSdis0.9
(soc,soh,sog)initial(9 Mwh, 10 Mwh, 0 KCF)
λ0.4
Ta10 °C
H/P1.286
COP3
Table 4. Generator cost function parameters.
Unitαβδσλ
12520.0080.042100
2601.80.0030.040140
31002.10.0010.038180
Table 5. CHP cost function parameters.
Unitαβδσθξ
1265014.50.03454.20.030.031
Table 6. Heat-only cost function parameters.
Unitαδθ
19502.01090.038
Table 7. Emission cost parameters of the power-only units.
Unitτλξσβα
10.00640.028572 × 10−46.49 × 10⁻⁴−0.027770.04091
20.00520.03335 × 10−45.63 × 10⁻⁴−0.030230.02534
30.00760.081 × 10−64.58 × 10⁻⁴−0.025470.04258
Table 8. Emission cost parameters of the CHP.
Unitθηψ
11.56 × 10−61.5 × 10−50.2
Table 9. Emission cost parameters of the heat-only units.
Unitσρπ
10.0081 × 10−58 × 10−6
Table 10. Values of marginal cost of each generating unit and storage.
ParameterCCHPCinGSCoutGSCP2GCinHSCoutHS
Marginal Cost ($/MWh)132102216
Table 11. Start-up and shut-down costs.
CSUCHPCSDCHPCSUGiCSDGi
10 ($)10 ($)10 ($)10 ($)
Table 12. Statistical analysis of the objective functions.
AlgorithmNSGA-IIIMOSOAGAMS
ParameterMeanStdMaxMinMeanStdMaxMinMeanStdMaxMin
Total Loss0.13890.01160.15810.11780.13940.01180.15960.11880.13780.01130.15880.1163
Total Cost1.33190.10341.50951.15211.33080.10311.50941.15221.34480.10531.50581.1639
Table 13. Improvement percentage (IP).
AlgorithmNSGA-IIIMOSOA
IP in Loss0.007980.01161
IP in Cost−0.00959−0.01041
Table 14. PAR index.
PAR IndexIn Electric NetworkIn Gas Network
Unscheduled operation1.24801.5961
Scheduled operation with NSGA-III1.18031.5934
Scheduled operation with GAMS1.19341.5917
Table 15. The sensitivity analysis results.
Number of ScenariosLossCost
10000.1001.117
5000.1021.125
1000.1041. 135
500.1061.142
300.1071.145
100.1261.175
Disclaimer/Publisher’s Note: The statements, opinions and data contained in all publications are solely those of the individual author(s) and contributor(s) and not of MDPI and/or the editor(s). MDPI and/or the editor(s) disclaim responsibility for any injury to people or property resulting from any ideas, methods, instructions or products referred to in the content.