Article

Assessing the Limits of Sustainable Agriculture Intensification Using a Spatial Model Framework †

by
Bruno A. Lanfranco
1,*,
Magdalena Borges
2,
Enrique G. Fernández
1,
Catalina Rava
2 and
Bruno Ferraro
1
1
Unidad de Economía Aplicada, Instituto Nacional de Investigación Agropecuaria (INIA), Montevideo 11500, Uruguay
2
Independent Researchers, Montevideo 11600, Uruguay
*
Author to whom correspondence should be addressed.
This article is a revised and expanded version of a paper entitled “Assessing the limits of sustainable intensification for agriculture using a spatial model framework”, which was presented at the 32nd International Conference of Agricultural Economists, 2–7 August 2024, New Delhi, India.
Sustainability 2025, 17(16), 7304; https://doi.org/10.3390/su17167304
Submission received: 26 May 2025 / Revised: 29 July 2025 / Accepted: 30 July 2025 / Published: 13 August 2025

Abstract

In a collaborative effort with private agents of the oilseed industry, INIA conducted a research study to determine the feasibility of framing soybean production in Uruguay into a sustainable development pathway. A spatial model based on land suitability analysis and the imposition of other soil restrictions (risk erosion, current regulations, and permanent soil uses) was adopted to estimate potential soybean yields and the most suitable cropping areas in the country. Assuming a national average production cost for soybeans, total costs were calculated by adding location-specific logistics and land rent costs. Crop economic margins were estimated using a combination of price, technology, and climate-change scenarios. Only areas exhibiting non-negative margins were considered suitable for sustainable cultivation. With all restrictions imposed, the potential soybean area on rotation with other crops and pastures in Uruguay would range between 2.1 and 2.9 million hectares, depending on the prevailing producer price level. Climate change effects did not show significant differences on their own. This ad-hoc approach can be useful for private and public decision-makers. It can be applied to any crop situation or region where the objective is to define how far it is possible to expand and intensify production sustainably, without compromising the environment.

1. Introduction

Soybeans are the most widely planted oilseed in the world. Worldwide production attained nearly 420 million metric tons in 2024/25 [1]. It offers various food and technical uses, highlighting its use in animal feed [2]. A large proportion of soy production is not consumed where it is produced. While 86% of the world’s soybean production in the last three years originated in the Americas, about 95% of the oilseeds traded in the international market (more than 40% of the global output) comes from this region [1]. Brazil and the USA are the main worldwide producers and exporters. As shown in Table 1, the top six world exporters in 2021–2023 came from South America (Brazil, Paraguay, Argentina, and Uruguay) and North America (USA and Canada). In terms of monetary value, Ukraine was the first non-American exporter during this period [3].
Uruguay enjoys an important reputation as a sustainable food and fiber producer for the rest of the world. For decades, crop production has been carried out mainly in rotation with pastures and other commercial crops. In addition, Uruguayan legislation establishes that farmers must accomplish a mandatory “land use and management plan” [4]. They are expected to identify realistic and sustainable crop rotation sequences that optimize yields and profits while preserving natural resources, maintaining soil structure, avoiding erosion, and maximizing natural control of weeds, pests, and diseases, among other things.
Over the last decade, Uruguay positioned itself between 9th and 12th in the ranking of the largest soybean producers [1]. In 2021, it was the 12th producer and the 6th worldwide exporter in terms of monetary value [2]. However, the country’s history regarding this crop is relatively recent. After being a very small producer during the last Quarter of the 20th century, the area devoted to the oilseed was boosted at the beginning of the new century with the growth of Chinese demand. On the farmer’s side, the development was driven largely by foreign producers coming to Uruguay, especially from Argentina. These farmers commanded the new “soy boom”, bringing state-of-the-art technology, particularly no-tillage cultivation, and GM varieties [5].
The high price quotes recorded during the global “commodity boom” made soy cultivation feasible in marginal agricultural areas, offering very high rents. Soon after, in 2013, the area planted in Uruguay was attaining one million hectares annually, peaking at more than 1.3 million hectares in 2014–2015. The subsequent decline in international prices led to a reduction in the following years, to around one million hectares in 2021–22 and 2022–23 [6].
Even when Uruguay represents around 1% of the global market, both in quantity and value, the area devoted to this crop and the production levels are nevertheless substantial, economically. More than 90% of the national production is exported with a very low degree of processing, mostly to China (85–90%) and the European Union (9%). In 2022, the monetary value of soybean exports reached a peak of roughly USD 2 billion, ranking as one of the top three export products, alongside beef and cellulose pulp [7].
Considering a crop rotation of soybeans and winter crops, the transfer to the rest of the economy reached USD 181 out of a total benefit of USD 408 (44%) per metric ton of soybeans exported to the rest of the world. The GDP of the oilseed complex was estimated at USD 783 million in the 2021 harvest [8]. This represented 1.4% of Uruguay’s total GDP, a 3.4% growth compared to the previous year. In 2022, this contribution doubled, reaching 2.8% (USD 1.7 billion), the highest value since records are available [9].
The soybean boom as a regional phenomenon in South America [10], starting in the last decade of the 20th century, caught the attention of scientists, governments, and private stakeholders concerned about the potential negative social and environmental effects of an uncontrolled or excessive expansion of the area destined to the oilseed in these countries [11,12,13,14,15,16,17,18,19,20,21,22,23].
In Uruguay, the Instituto Nacional de Investigación Agropecuaria, INIA (https://www.inia.uy/; accessed on 1 January 2025, National Institute for Agricultural Research), started a new research study in 2021, as part of a broader collaboration project with the Mesa Tecnológica de Oleaginosos, MTO (https://mto.org.uy/; accessed on 1 January 2025, Oilseeds Technological Board), and the Conglomerado Oleaginosos Uruguay; accessed on 1 January 2025, COU (https://oleaginosos.org.uy/; accessed on 1 January 2025, Uruguayan Oilseeds Conglomerate), the two entities that gather the private agents that make up the oilseed chain in Uruguay.
This project aims to determine the capacity to frame soybean production in a path of sustainable development and to define how far it is possible to grow and intensify production without compromising natural resources and the environment. It points directly to target 2.4 of the United Nations Sustainable Development Goals: “By 2030, ensure sustainable food production systems and implement resilient agricultural practices that increase productivity and production, that help maintain ecosystems, that strengthen capacity for adaptation to climate change, extreme weather, drought, flooding, and other disasters and that progressively improve land and soil quality” [24].
The proposal of an ad-hoc procedure to empirically determine the limits for an economically and environmentally sustainable expansion of cropping systems is another important contribution of this research. The use of spatial models in combination with modern analytical tools to evaluate the productive capacity of agricultural lands, alongside land-use restrictions, helps to identify proper public policies and regulations. The information provided by such models can also help private stakeholders’ strategies. With these objectives in mind, this article presents the main results obtained.

2. Materials and Methods

2.1. General Framework and Land Suitability Analysis

This study adopted a five-step spatial model framework to estimate the area and potential yields of soybean cultivation, ensuring the viability and profitability of the production system, including the sustainability of resources (Figure 1).
Based on a land suitability analysis (LSA), the model calculated potential soybean yields on land with good aptitude for production (step 1). The model imposed several constraints to refine crop potential, based on erosion risk and current and alternative land uses (step 2). Additional restrictions were considered by estimated transportation and logistics costs (step 3), which constrained the possible outcomes to non-negative economic margins (step 4). A set of economic margins was estimated using price and yield scenarios given likely expected technological improvements (step 5).
Environmental dimensions were considered throughout the entire process, particularly but not exclusively in step 2 (erosion). The model accounts for a complete nutrient balance and other relevant factors such as fragmentation, habitat loss, and ecosystem services. However, these variables are in a validation phase and were not explicitly included in this version (yellow, Figure 1). This limitation does not affect the current use of the model. They will be fully incorporated as soon as the validation process is complete, which will provide a significant improvement.
The LSA method is useful for determining the appropriateness of soils for a specific end [25,26]. Combined with GIS tools, it provides a powerful decision support tool to inform land-use planning. Together, both techniques have been applied in different situations and contexts [27,28]. This research compares crop water, nutrient, and soil characteristics requirements with observed values for those variables. Where ideal conditions are met, the potential yields can be reached. The farther the actual conditions are from those required, the lower the yield will be. This study evaluated single-crop soybeans (no preceding winter crop), which was the predominant situation in the past decade.
The original model developed by Borges et al. [29] was revised and adjusted for the present study, considering valuable contributions and recommendations made by several INIA specialists. In practice, each constraint was applied independently, resulting in a set of separate layers, each corresponding to an independent map. The final composed area, all restrictions applied, was obtained by over-imposing all the layers simultaneously to subtract the restricted areas from the potential area without restrictions. The choice of variables and the calibration of the model (weightings and ratings) were based on expert opinions, which were consistent with the literature [29].
The calculations were performed using a web-based geographic information system developed by INIA (SIGRAS), which includes geographic information on climate conditions, water, soils, and evapotranspiration, alongside basic cartography (district limits, roads, waterways, urban areas, and other general data) [30]. SIGRAS provides diverse georeferenced data, both from INIA itself and from various public and private sources. The platform offers simple and cross-referenced searches and queries within and across the available databases, covering the Uruguayan territory. Access to SIGRAS is completely free for all types of users, and the shapefiles can be downloaded freely, subject to the terms of use [31].
The validity of the proposed model is independent of the data sources. However, the rapid advances in data-driven technologies constitute valuable analytic tools for substantially improving research in this area and making relevant contributions to achieving SDGs (including Target 2.4) by making information more reliable, supporting better-informed decision-making, implementing data-based policies, prioritizing actions, and optimizing the allocation of resources [32].
Scientists have emphasized the role of remote sensing in accurately and frequently gathering scientific information or environmental data over large areas, something that was not possible just a few years ago. Moreover, ground-based data is best utilized when combined with remote data and multiscale models, especially when using the SDG framework as a principal axis for developing their research concerning relevant goals, targets, and indicators [33,34].

2.2. Model Variables

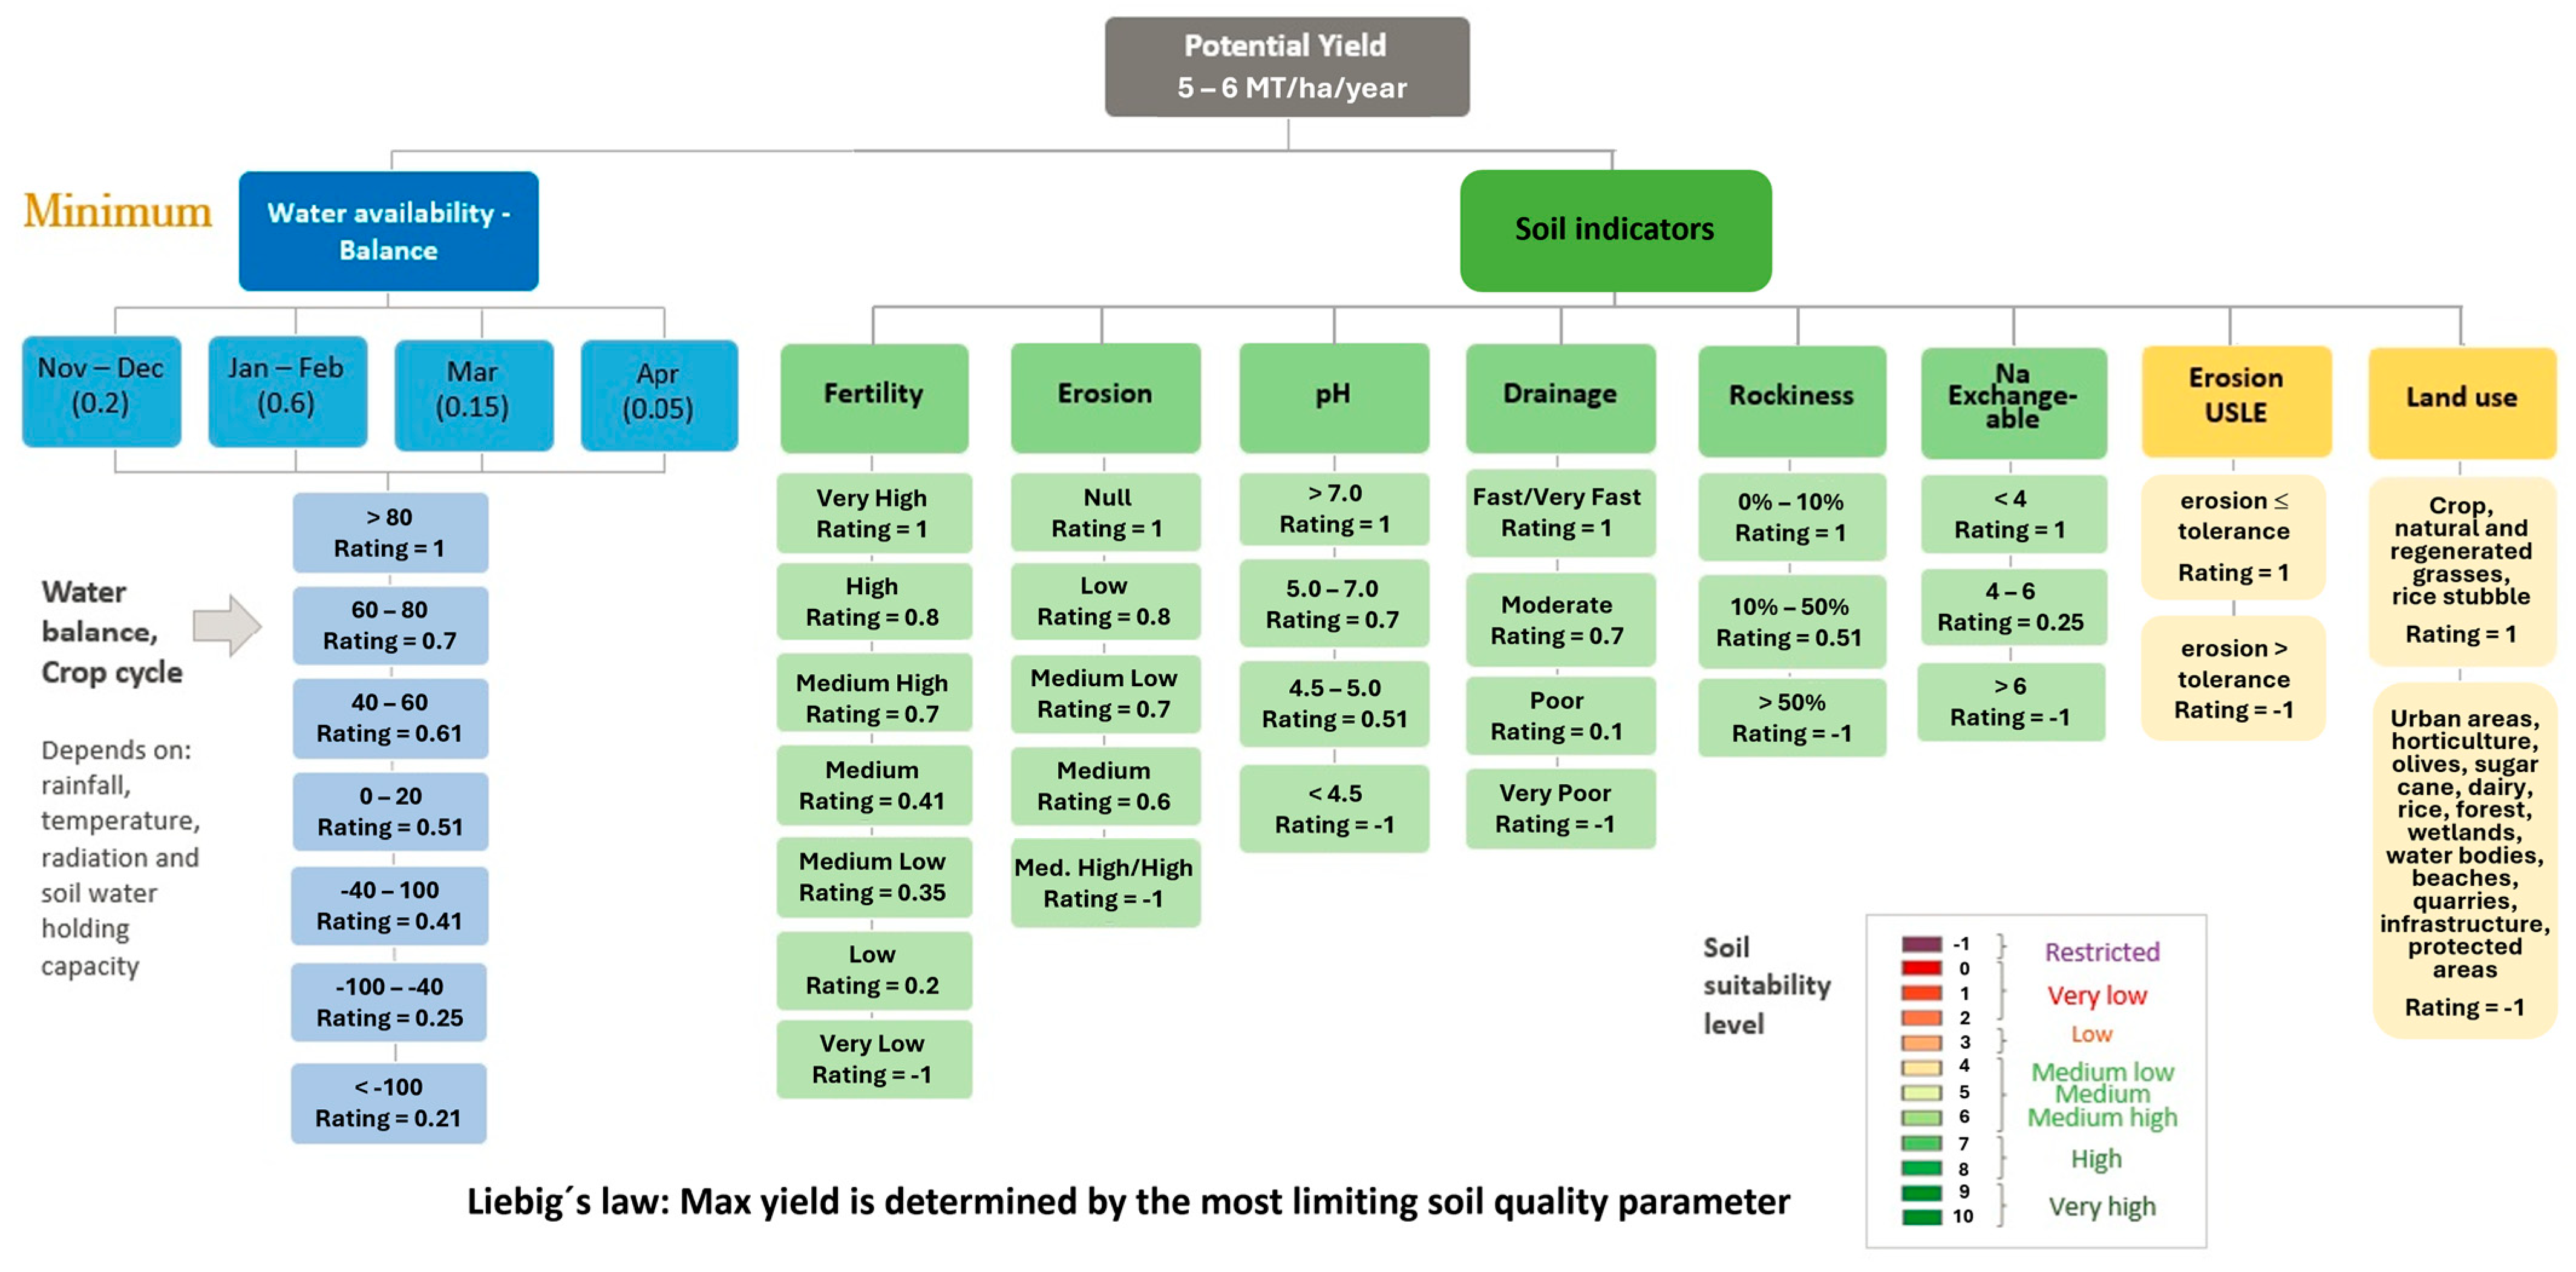
The maximum potential soybean yield for Uruguay was set at 5.5 tons per hectare [35] and defined as the dependent variable. The explanatory variables were split into water availability balance and soil indicators. The former states the balance between water entry into and losses from the soil’s profile, setting the water-holding capacity of the soil. The latter reflects different soil characteristics and nutrient availability (Figure 2).
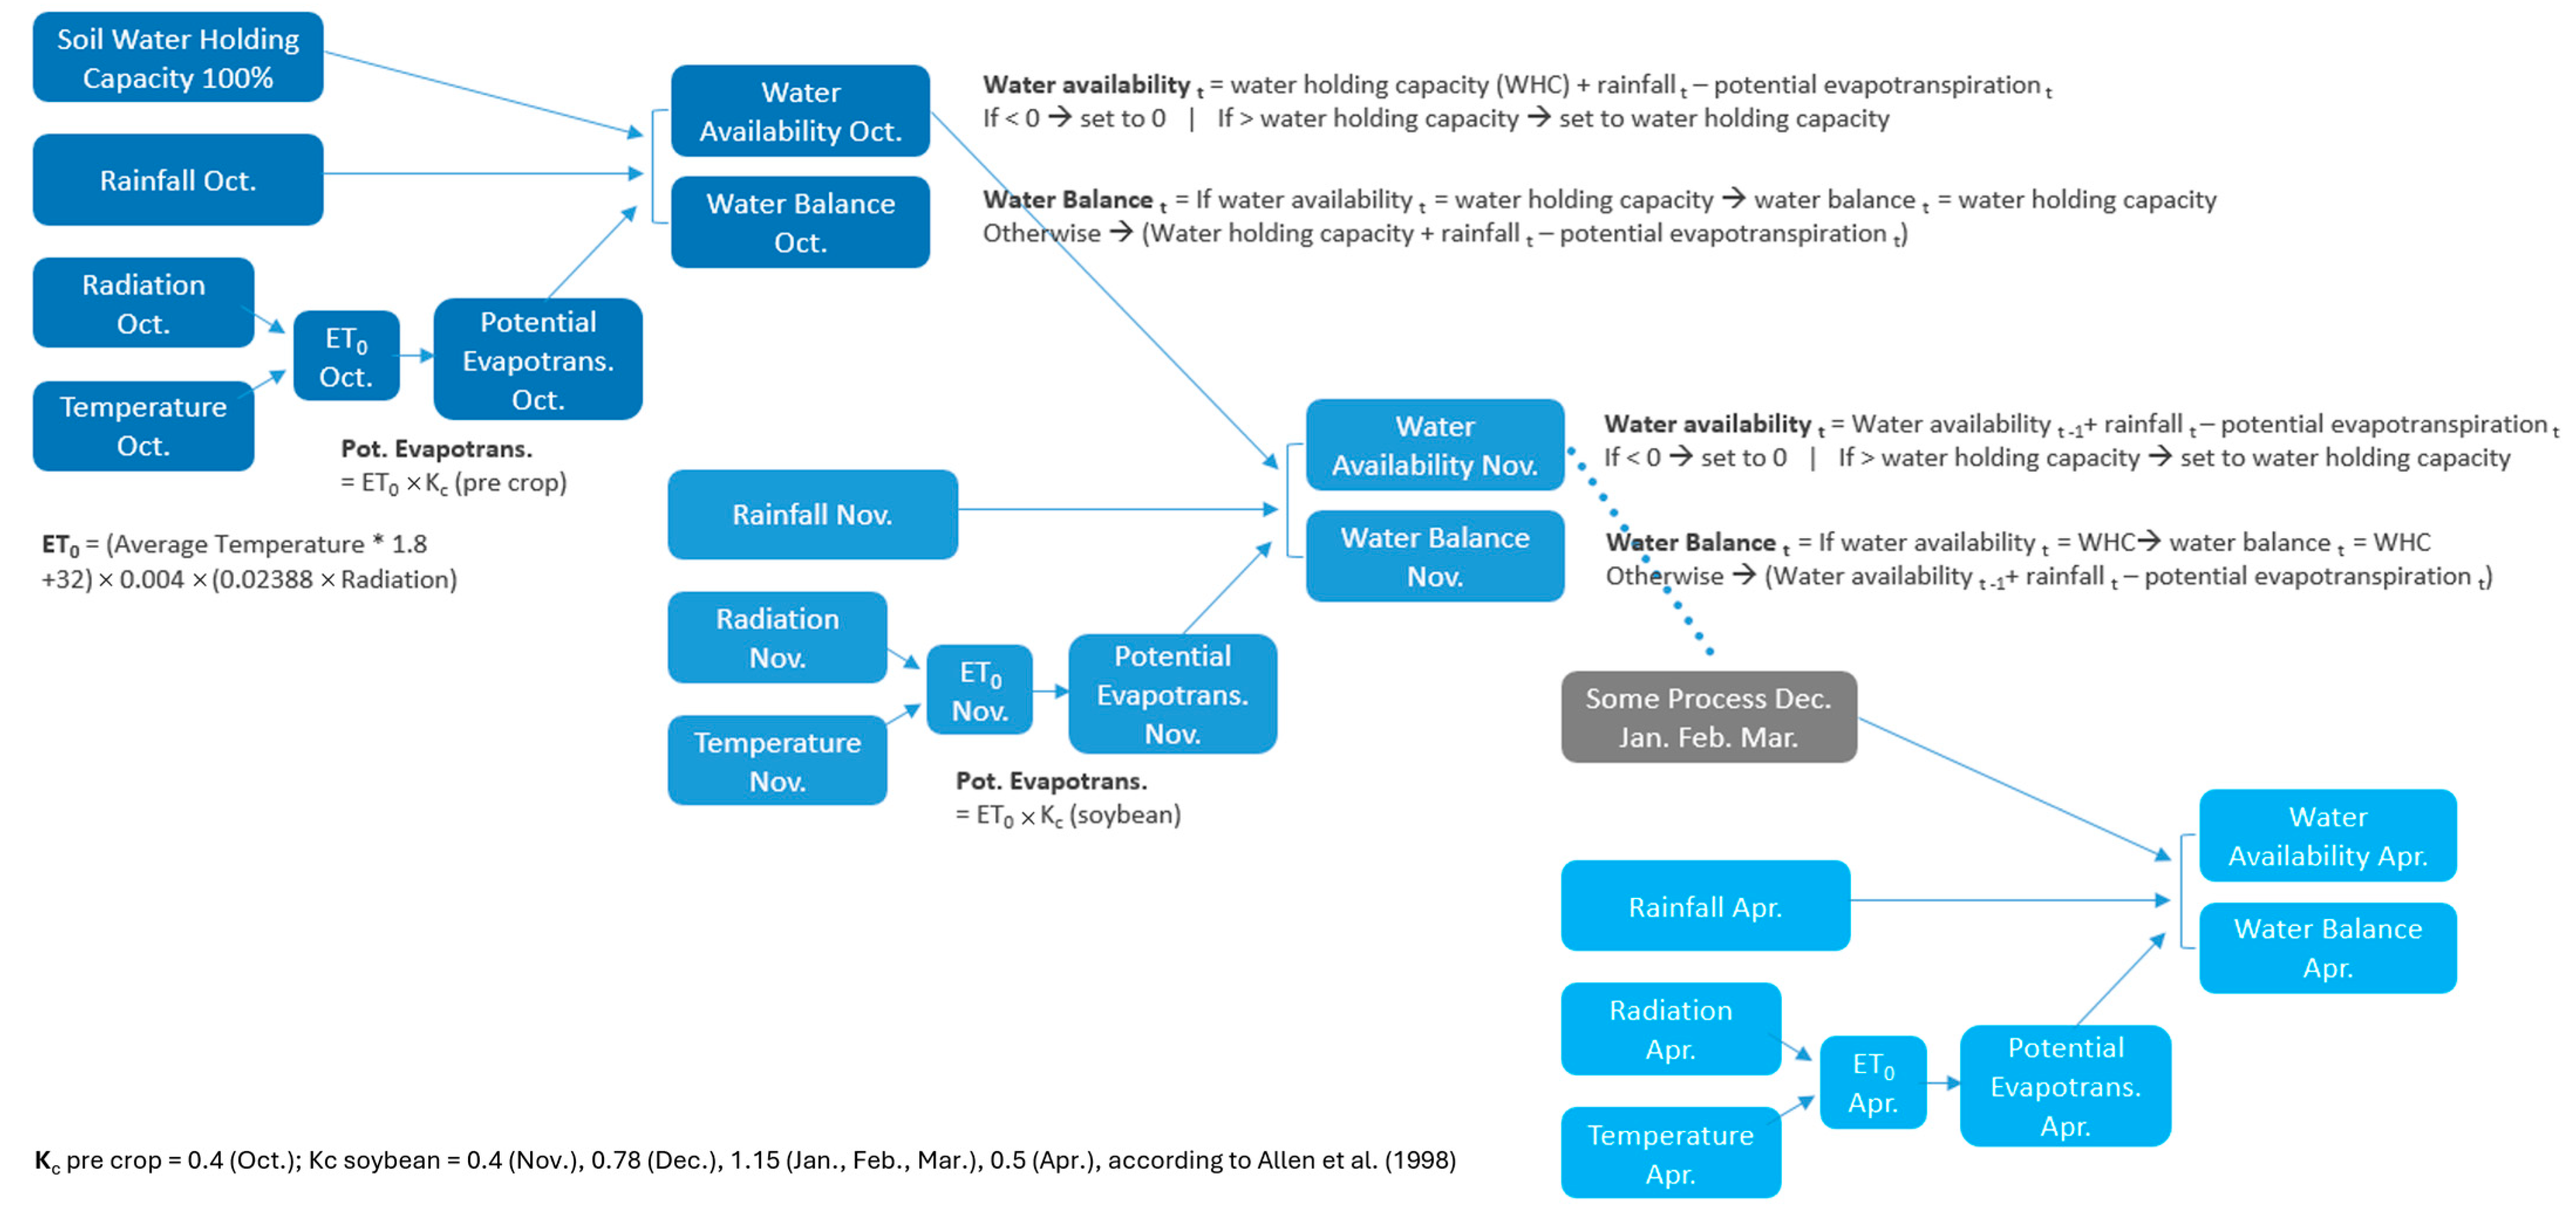
A simplified water balance model to estimate water availability [36] considers that
WAt = WAt−1 + Rt + It − PETt − Lt t = 1, 2, …, T.
WA is water availability, R is rainfall, I denotes irrigation, PET is potential evapotranspiration (given temperature and radiation), L corresponds to water losses, and subscript t denotes time. With WHC standing for water-holding capacity, WA admits two possibilities:
If WA < 0 → WA is brought to 0 | If WA > WHC → WA takes the value of WHC.
As it truncates at zero, Equation (1) tells whether a water deficit exists. However, it does not quantify the deficit when it occurs. Since soybeans’ water demand is generally greater than the available supply, a second Equation (2) is needed to measure the magnitude of the deficit. Defining water balance as WB and allowing for negative values, at time t:
WBt = WAt−1 + Rt + It − PETt − Lt If WB > WHC ⇒ WB takes the value of WHC
The water balance model was run monthly, from October to April, to cover all phenological stages: emergence (November–December), flowering (January–February), grain filling (March), and maturity (April). After calculating the water balance for each month, it was aggregated for the entire crop cycle in a weighted manner. According to the last two crop seasons considered in this research (2021/22 and 2022/23), 98% of the soybeans were planted without irrigation (rainfed), which makes this coefficient almost negligible (It ≈ 0) [37]. The highest weights are assigned to January and February (60%), the most critical period for the crop. The period from November to December accounts for 20%, March for 15%, and April for the remaining 5% (see Figure 3). Climate information was obtained from INIA-GRAS [38], while soil water-holding capacity information was obtained from Molfino [39]. Evapotranspiration coefficients adjusted by phenological stage were taken from Allen et al. [40].
The “soil indicators” variables included soil fertility, erosion risk, pH, drainage, rockiness, and exchangeable sodium (Figure 2). Data is available for every soil unit present in the country, based on field surveys conducted over many years, from both the SIGRAS [30] and MGAP SIG public platforms [41]. After determining the variables, the model assigned rating scores to different ranges of values, reflecting that the closer the actual conditions are to the ideal ones, the higher the yield and vice versa. For instance, a soil with a pH higher than 7 is most adequate for soybeans, and therefore, it receives a score rating of 1, meaning that in those cases, a 100% potential yield would be reached. When pH is between 5 and 7, only 70% of the potential yield would be achieved, ceteris paribus, and the rating drops to 0.7. Between 4.5 and 5, there is another decline in yields, and the rating drops to 0.51. Finally, if pH is lower than 4.5, it would be practically unfeasible to produce soybeans on that soil, and hence, a score of −1 is assigned, signifying that the area is restricted for this crop. The same reasoning also applies to the remaining variables.
Later, the model verifies the rating obtained in each variable for each pixel in the map and takes the lowest value as the result of the LSA, reflecting the well-known Liebig’s Law of the Minimum [42]. The latter states that crop yield is determined by the nutrient element found in the lowest quantity. Finally, the index is re-expressed in terms of yields. As mentioned, a rating of 1 indicates that 100% of the potential yield is achieved (5.5 metric tons/ha). A score of 0.9 means that 90% of the potential could be obtained (5 metric tons/ha). Any land where at least one of the variables receives a rating value of minus one (−1) is considered unsuitable for the soybean crop and excluded.
The model assured compliance with environmental regulations established by the Ministerio de Ganadería, Agricultura y Pesca, MGAP (https://www.gub.uy/ministerio-ganaderia-agricultura-pesca/, Ministry of Livestock, Agriculture, and Fisheries of Uruguay). The so-called “Plan de Uso y Manejo Responsable de Suelos” (In English, it would translate as Responsible Land Use and Management Plan. PUMS) [43] is mandatory for rainfed cropping on farms over 50 hectares since 2013 [44]. In general terms, this plan defines a production unit that can only carry out rotations that imply soil loss due to erosion below the tolerance level, determined by the type of soil unit. For this reason, the model estimates the potential erosion that would be generated if soybeans were planted throughout the territory, using data from García-Préchac [45], Clérici and García-Préchac [46], and Pérez-Bidegain et al. [47]. These values were compared with the corresponding tolerance levels of each type of soil. In those cases where the threshold would be exceeded, the area is restricted or unavailable for soybean production.
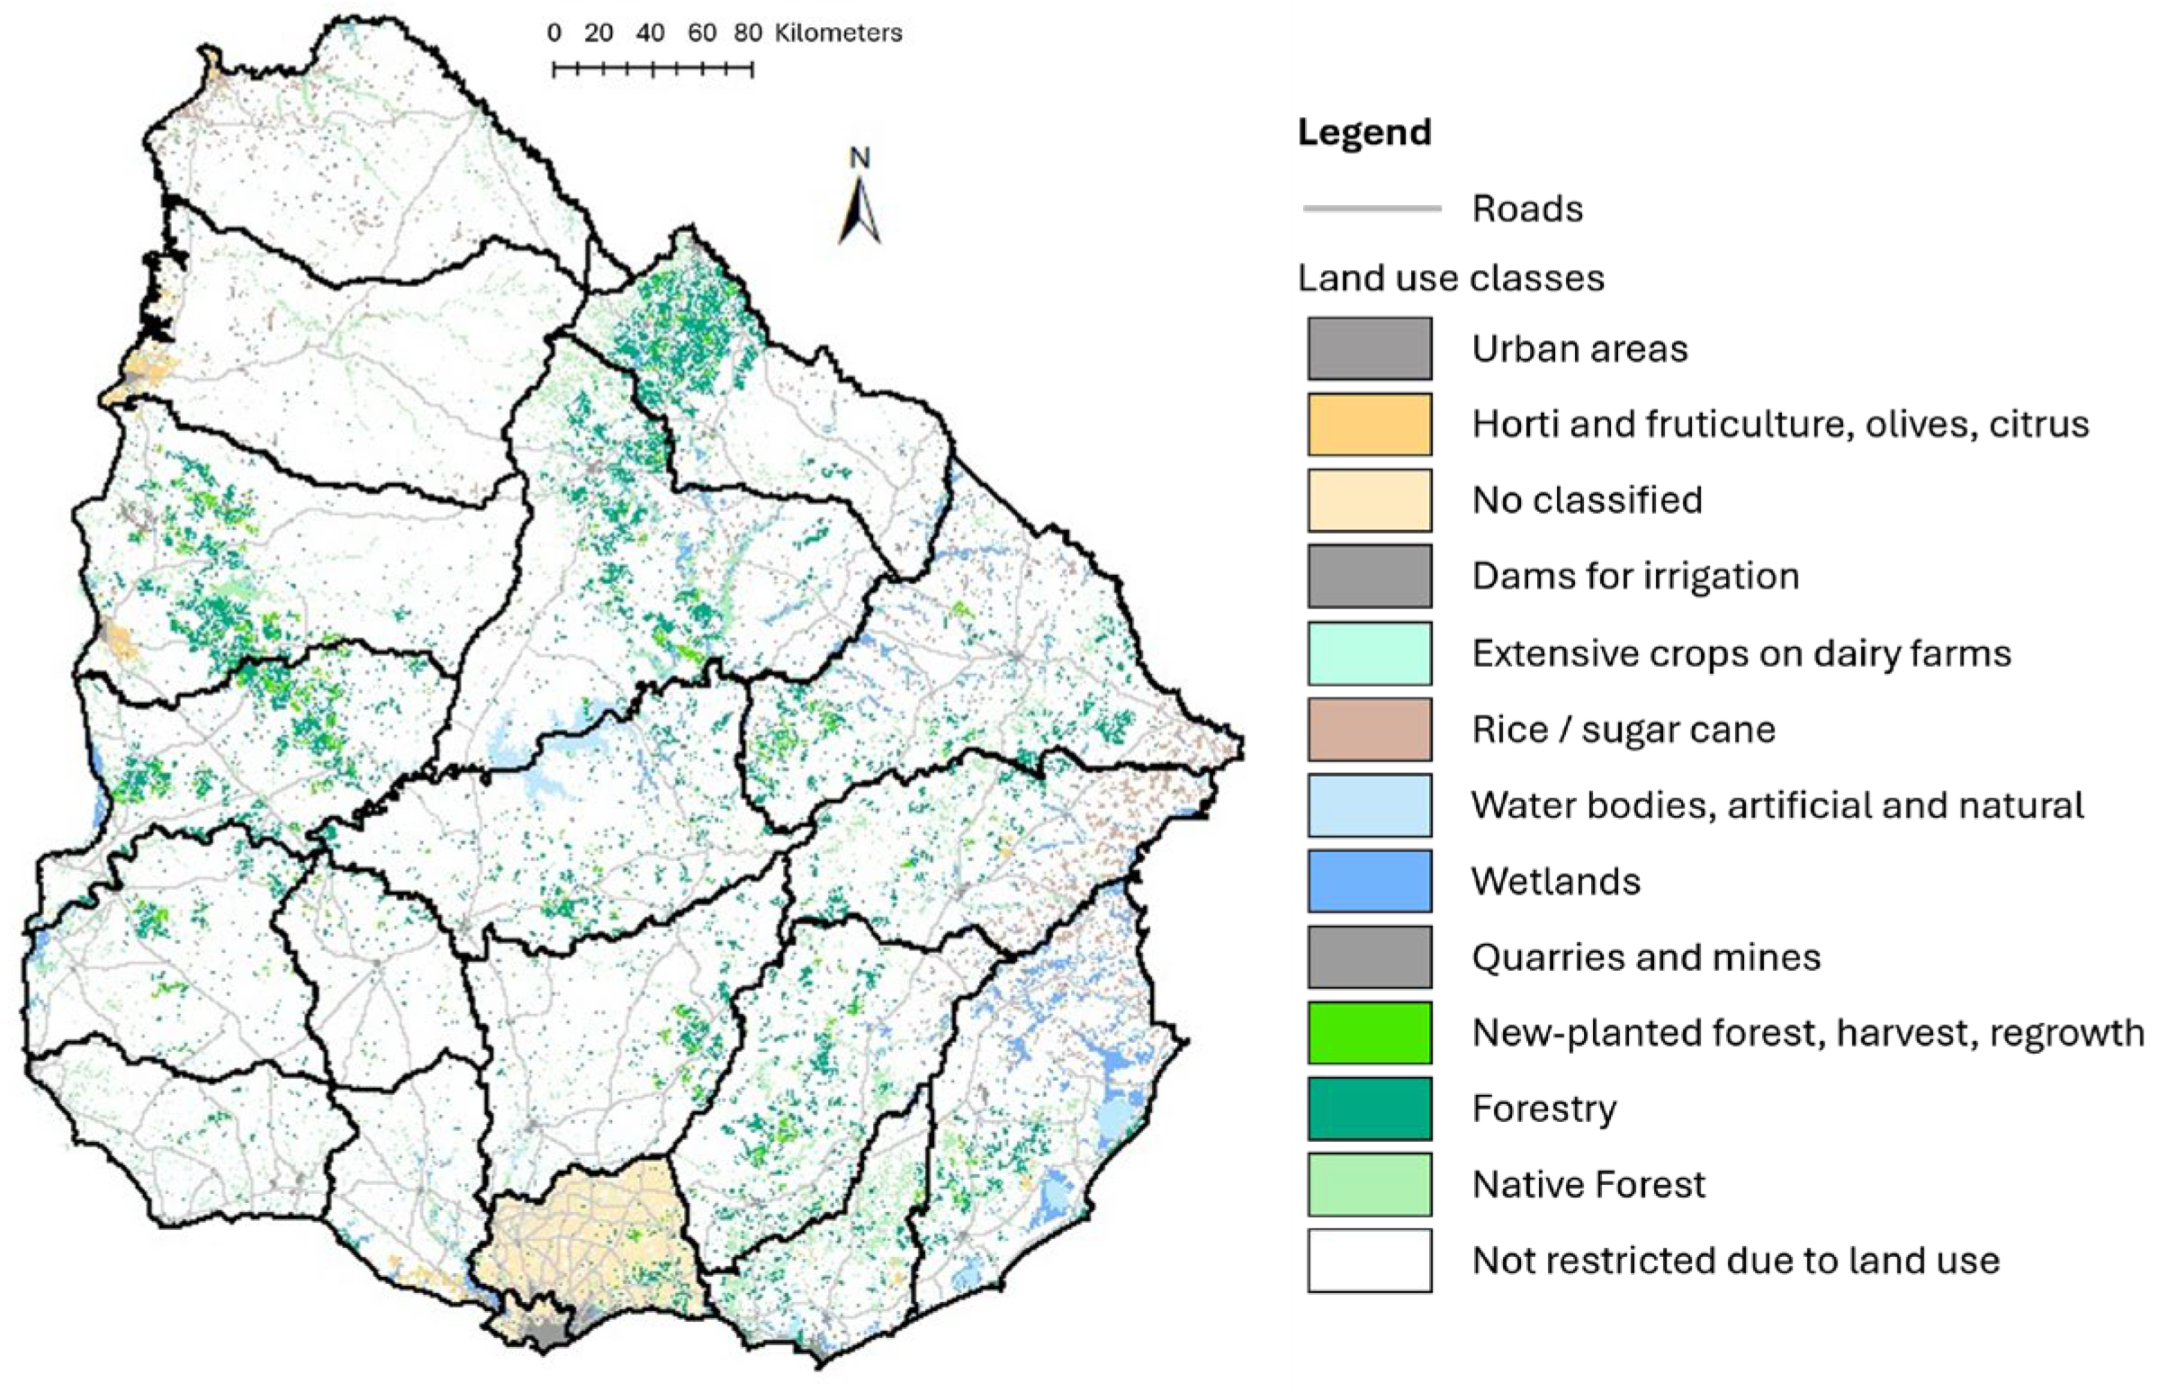
Additionally, current land uses [48] impose restrictions on soybean expansion in areas where it is impossible or highly unfeasible to convert land from one use to another, consistent with the expected growth of other productive activities. This is the case for urban areas, infrastructure, water bodies, horticulture, dairy, native forest, olives, sugarcane, and rice. Wetlands and protected areas are also excluded.

2.3. Model Setup

Given the insufficient information to pursue a complete calibration analysis, a simplified evaluation was performed instead. First, the LSA index outcomes for the current rainfed agricultural area from 2015–16 to 2018–19 were compared to national average yields [49]. As a result, some model parameters, variable ranges, and ratings (especially those linked to water availability) were subsequently changed until the simulated results were as close as possible to the actual ones.
The economic information was added to the biophysical model. Soybean production costs (seeds, fertilizers, phytosanitary, salaries, etc.) were computed using data provided by the MTO [50] and other public sources [49,51]. The same figures were assumed for all farmers nationwide. The only distinction made was regarding transportation costs, which were based on distances from the farms to the storehouses [52] and from the storehouses to the closest port (Nueva Palmira or Montevideo). Income was computed by multiplying physical yields by soybean prices. Afterward, “margins before rent” were calculated as the difference between income and operating costs.
Different possible scenarios for 2050 were discussed with the COU’s board of directors, considering soybean prices and technology pathways. Finally, the analysis included six scenarios emerging from three price levels and two technological pathways.
By analyzing the average prices received by farmers in the past 20 years for their grain [53], through a histogram of frequencies, 58% of the time they ranged from USD 309 to USD 409 per metric ton, 32% of the time from USD 409 to USD 509, and 11% of the time between USD 509 and USD 609. The average price for the whole period was USD 410 per metric ton. Under the subjective assumption that the average of yearly prices from 2025 to 2050 would not exceed the average of the past 20 years, three possible price levels were considered. The initial level was USD 310 (average producer price in the 2018–19 season). The two alternative levels were USD 350 and USD 400 per metric ton.
To complete the six scenarios toward 2050, the model considered the possible effects of technological improvement on the basic situation of no technological change. The technical coefficients used to calculate the changes in average yields (0.78% of annual growth due to genetic and management improvement) were agreed upon with the UOC.
The different feasible prices and productive combinations applied to the disposable land from previous steps determined the maximum achievable area for planting the oilseed in each scenario. Only those lands that allowed non-negative economic margins were considered in the definition of the final area. The model discarded any land for which the margins were expected to be negative.
Even when the outcome obtained following those steps complied with PUMS’ requirements and current land uses (see Section 2.2), a further restriction was imposed to improve the results. Soybeans are becoming part of a crop–crop or crop–pasture rotation since the latter offers better environmental conditions, disease control, and economic outcomes. Soybeans do not occupy the whole rotation area every year. Therefore, a discount rate was applied considering the predominant rotation systems in the country. According to data from currently approved PUMS, the predominant system is a 3-year rotation including corn/cover crop, soybeans/cover crop, and soybeans/cover crop (two soybean crops in 3 years). This would determine that the most accurate estimate of the potential effective soybean area would be 67% of the available area.
According to sector experts and historical data, future expansion of soybeans will be driven by an increase in single-crop soybeans. Given current prices and midterm market predictions, it is unlikely that winter crops (before double-crop soybeans in the same year) will reach cropping areas higher than their historical records. Therefore, above one million hectares of soybean crop area, any additional area would be managed under a pasture-crop rotation, with 2 years of single-crop soybeans and 3 years of pasture. Thus, the correction factor to apply above this level is 40% of the potential area to the oilseed.
Three additional scenarios (one for each price level, without technological change) were built to assess the possible effects of climate change. This was a primary attempt to introduce this dimension to the analysis. The analysis considered a specific climate model projection using the Representative Concentration Pathway 8.5 (RCP 8.5) emission scenario [54], also known as “business as usual” (BAU), and the Community Climate System Model version 4 (CCSM4) [55]. Although there is growing acceptance that RCP 8.5 is implausible [56], the decision was to subject the model to the most extreme climate effects, as a first approximation to the problem. The water balance was recalculated accordingly with the future climate parameters. The temperature and rainfall data for modeling CCSM4, RCP 8.5 BAU, were downloaded from the WorldClim platform [57].
Additional efforts were made to integrate environmental restrictions into the LSA model. However, some of them were not included and will be fully incorporated in forthcoming updates, since they may have repercussions on ecosystems and, consequently, on future soil productivity. These indicators include biomass residue, surface nutrients runoff (nitrogen and phosphorus), nitrous oxide emissions, energy consumption, water use, phytosanitary toxicity, and nitrogen balance. Although not integrated into the model, they are being individually assessed to evaluate their potential impact by the projected scenarios.
Before closing this section, it is worth highlighting some methodological considerations that can be seen as limitations of the model, at least in its current version. Some of them are part of the ongoing improvements being tested:
  • There is a need to move to a dynamic model to identify suitable pathways for achieving goals. It must consider a wider range of productive, economic, environmental, and climate change scenarios to provide improved probabilistic sensitivity analysis.
  • Although the study considered technological improvements in some scenarios (genetic growth trend, new management practices), it did not include associated incremental costs in the model. That is, the same operative costs were assumed for all locations and scenarios. The only distinction in costs was made regarding logistics, transportation costs, and land tenure (rent).
  • The logistics variables are being improved by incorporating new information, such as storage capacity, road and railroad infrastructure, and cultural aspects of farmers.
  • The final area estimated by the model, after imposing all the restrictions, considered null and positive economic margins (≥0). This implies some overestimation as farmers may require a minimum non-zero positive margin, at least equivalent to the foregone benefits from other productive land uses.
  • The rating scores used to weight the soil indicators were subject to expert opinion offered by specialists in the field. However, they exhibited a high degree of consistency and homogeneity.
  • There were some highly productive areas in relatively isolated places, where logistics are scarce or difficult to develop. Those areas are visualized as scattered points in the GIS; quantifying these areas involves some difficulties due to their size and distribution. For that reason, they were not excluded from potential cropping land in this study if crop margins were positive.
  • Although the model conceptually follows the steps shown in Figure 1, we obtained the final area by over-imposing the independently estimated restriction maps.

3. Results and Discussion

3.1. Land Suitability Analysis and Potential Yields

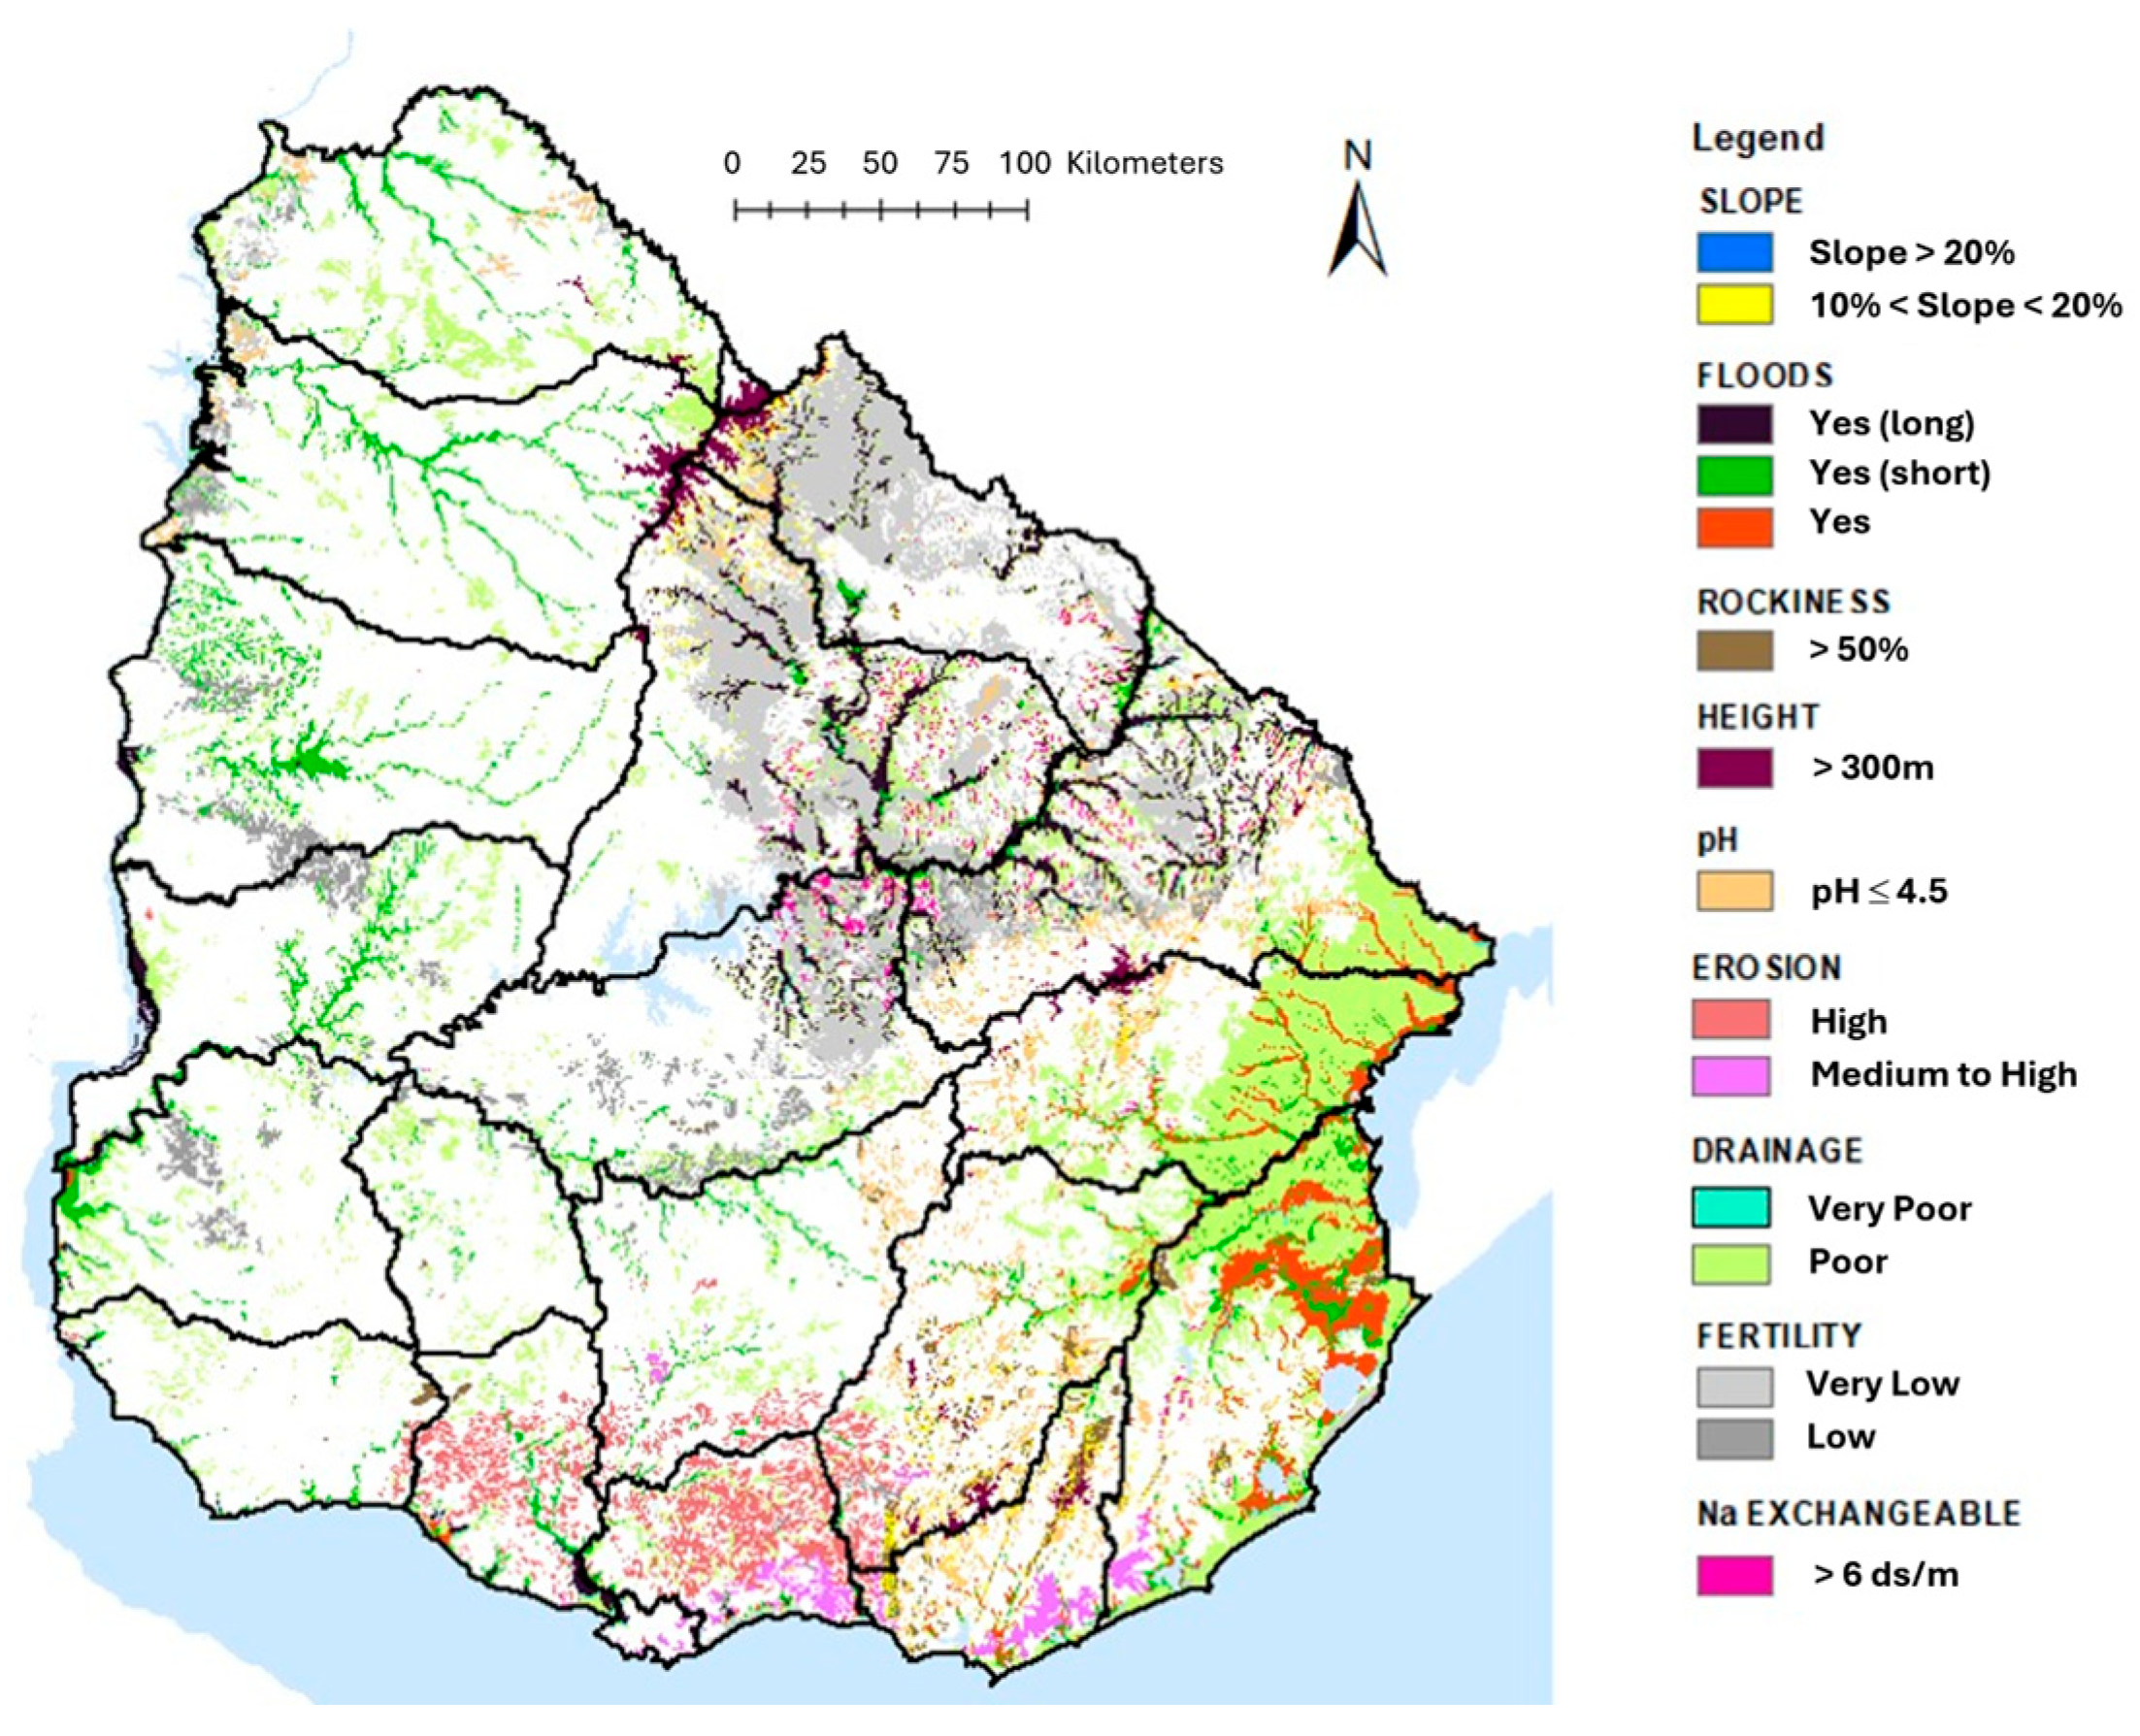
In this first step, agronomic restrictions, including slope, flooding risk, rockiness, height, soil pH, past erosion, drainage, fertility, and exchangeable sodium, were simultaneously applied to identify unsuitable areas for cultivation. Excluded areas correspond to lowlands, main river basins, steep hills, and soils with a long agricultural history, low fertility, high degree of rockiness, and pH problems (Figure 4).
At this stage, the expected potential yields were calculated for non-restricted areas, applying the LSA method, which considers yields depending on water and nutrient restrictions and soil characteristics.

3.2. Erosion and Other Land Use Restrictions

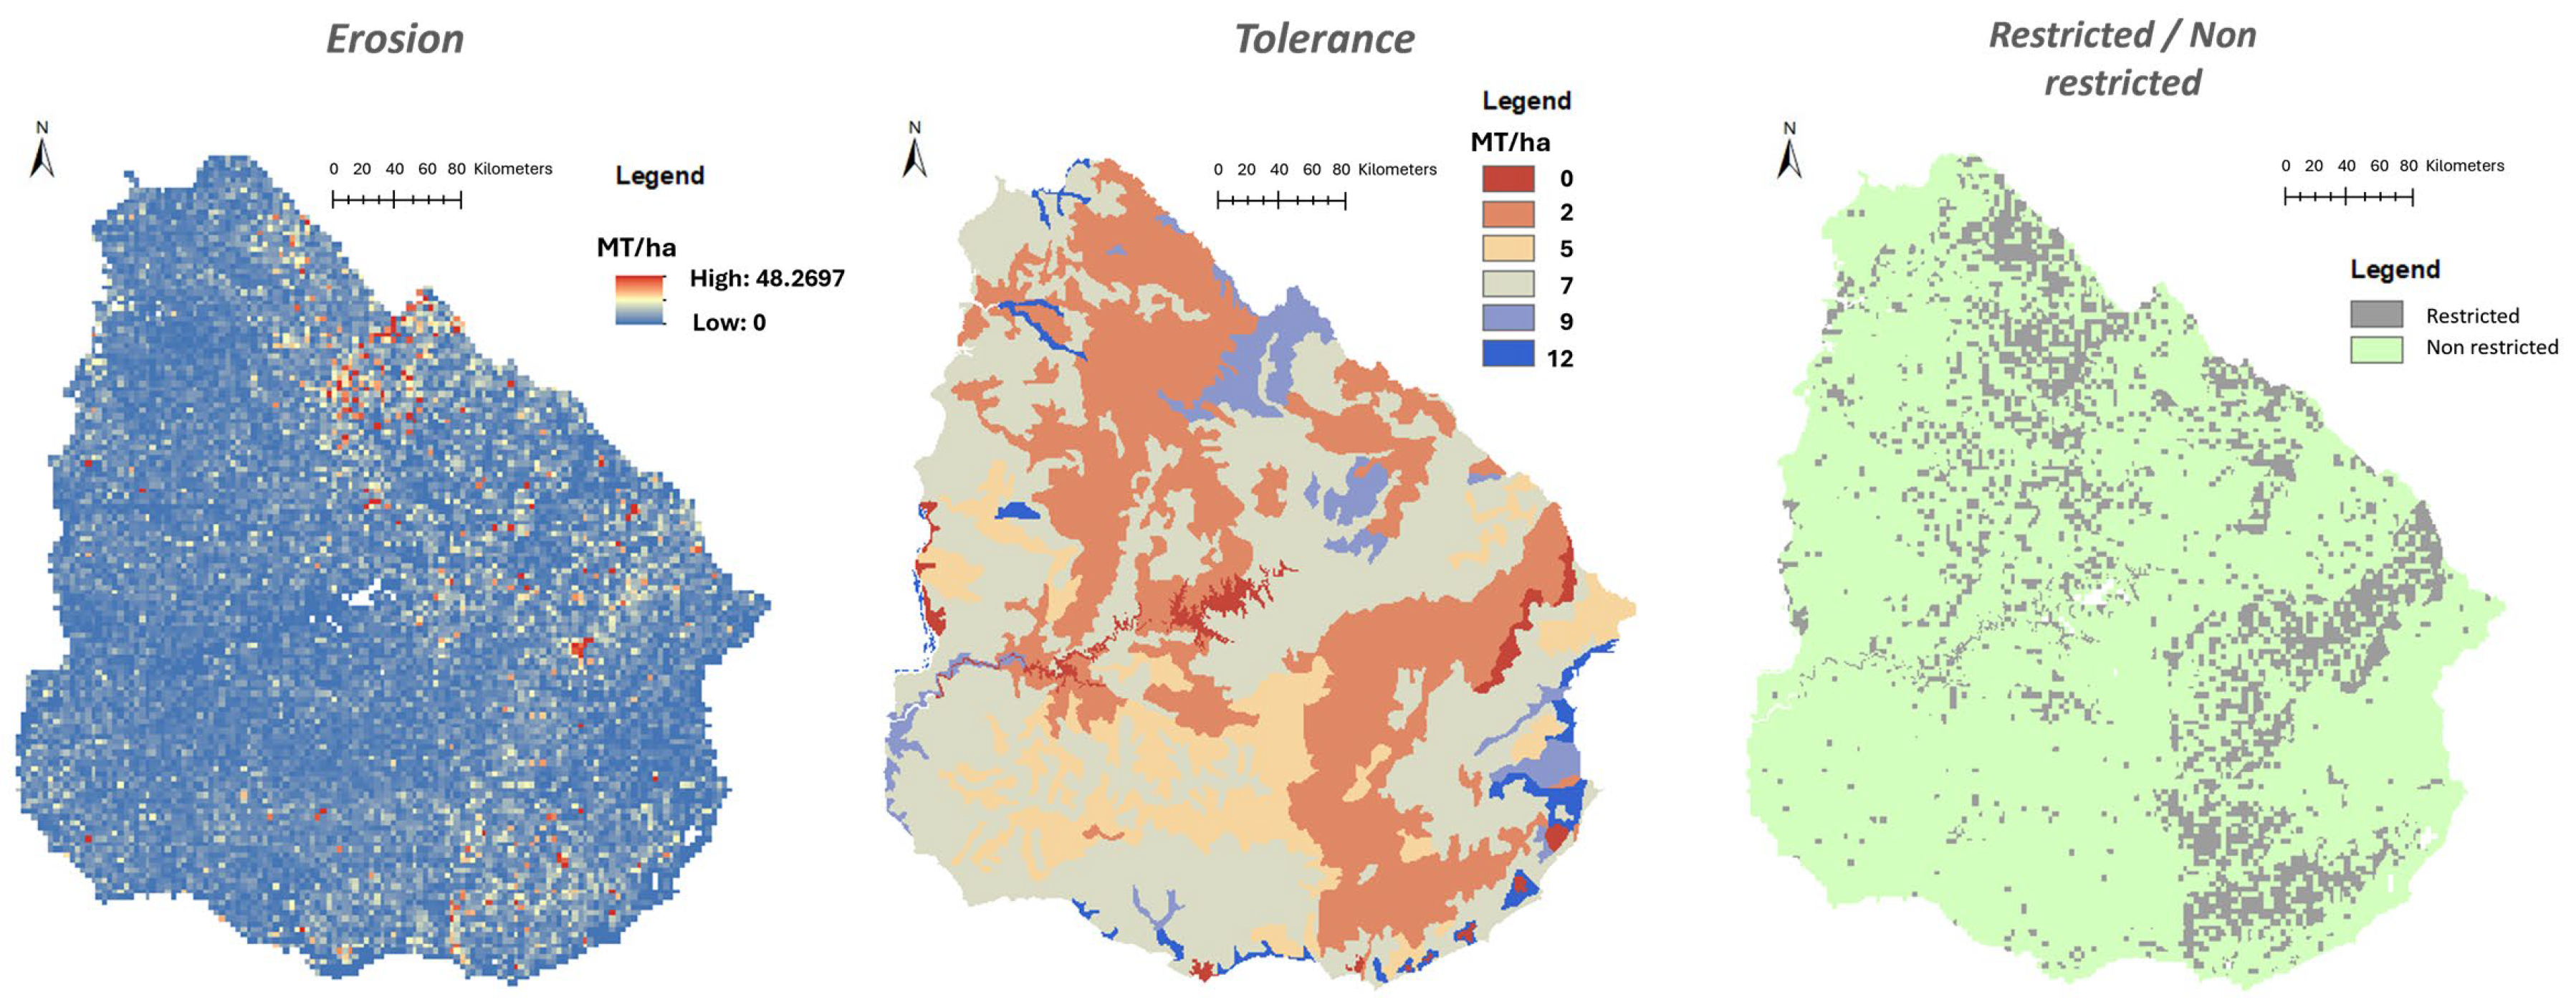
Calculated erosion rates for different soybean production systems were compared to soil loss tolerance rates established by PUMS for the types of soil units on the total area. Soil erosion potential was calculated using the Universal Soil Loss Equation, USLE [58], which considers rainfall erosivity, soil erodibility, topography, and crop management. It does not take the current soil condition due to past usage. As a result of combining both factors (left and center maps), it was possible to identify suitable and unsuitable areas for soybeans (right map), as shown in Figure 5.
Figure 6 shows restricted areas due to current land uses that make them unsuitable for agricultural production (urban areas, sandy coastal areas, water surfaces, roads, highways, etc.). Given their history, comparative and competitive advantages in certain production sectors (i.e., milk, horticulture, fruits, forestry, and traditional rice production), some areas are not expected to change under the scenarios considered in this study and were therefore excluded by the model.
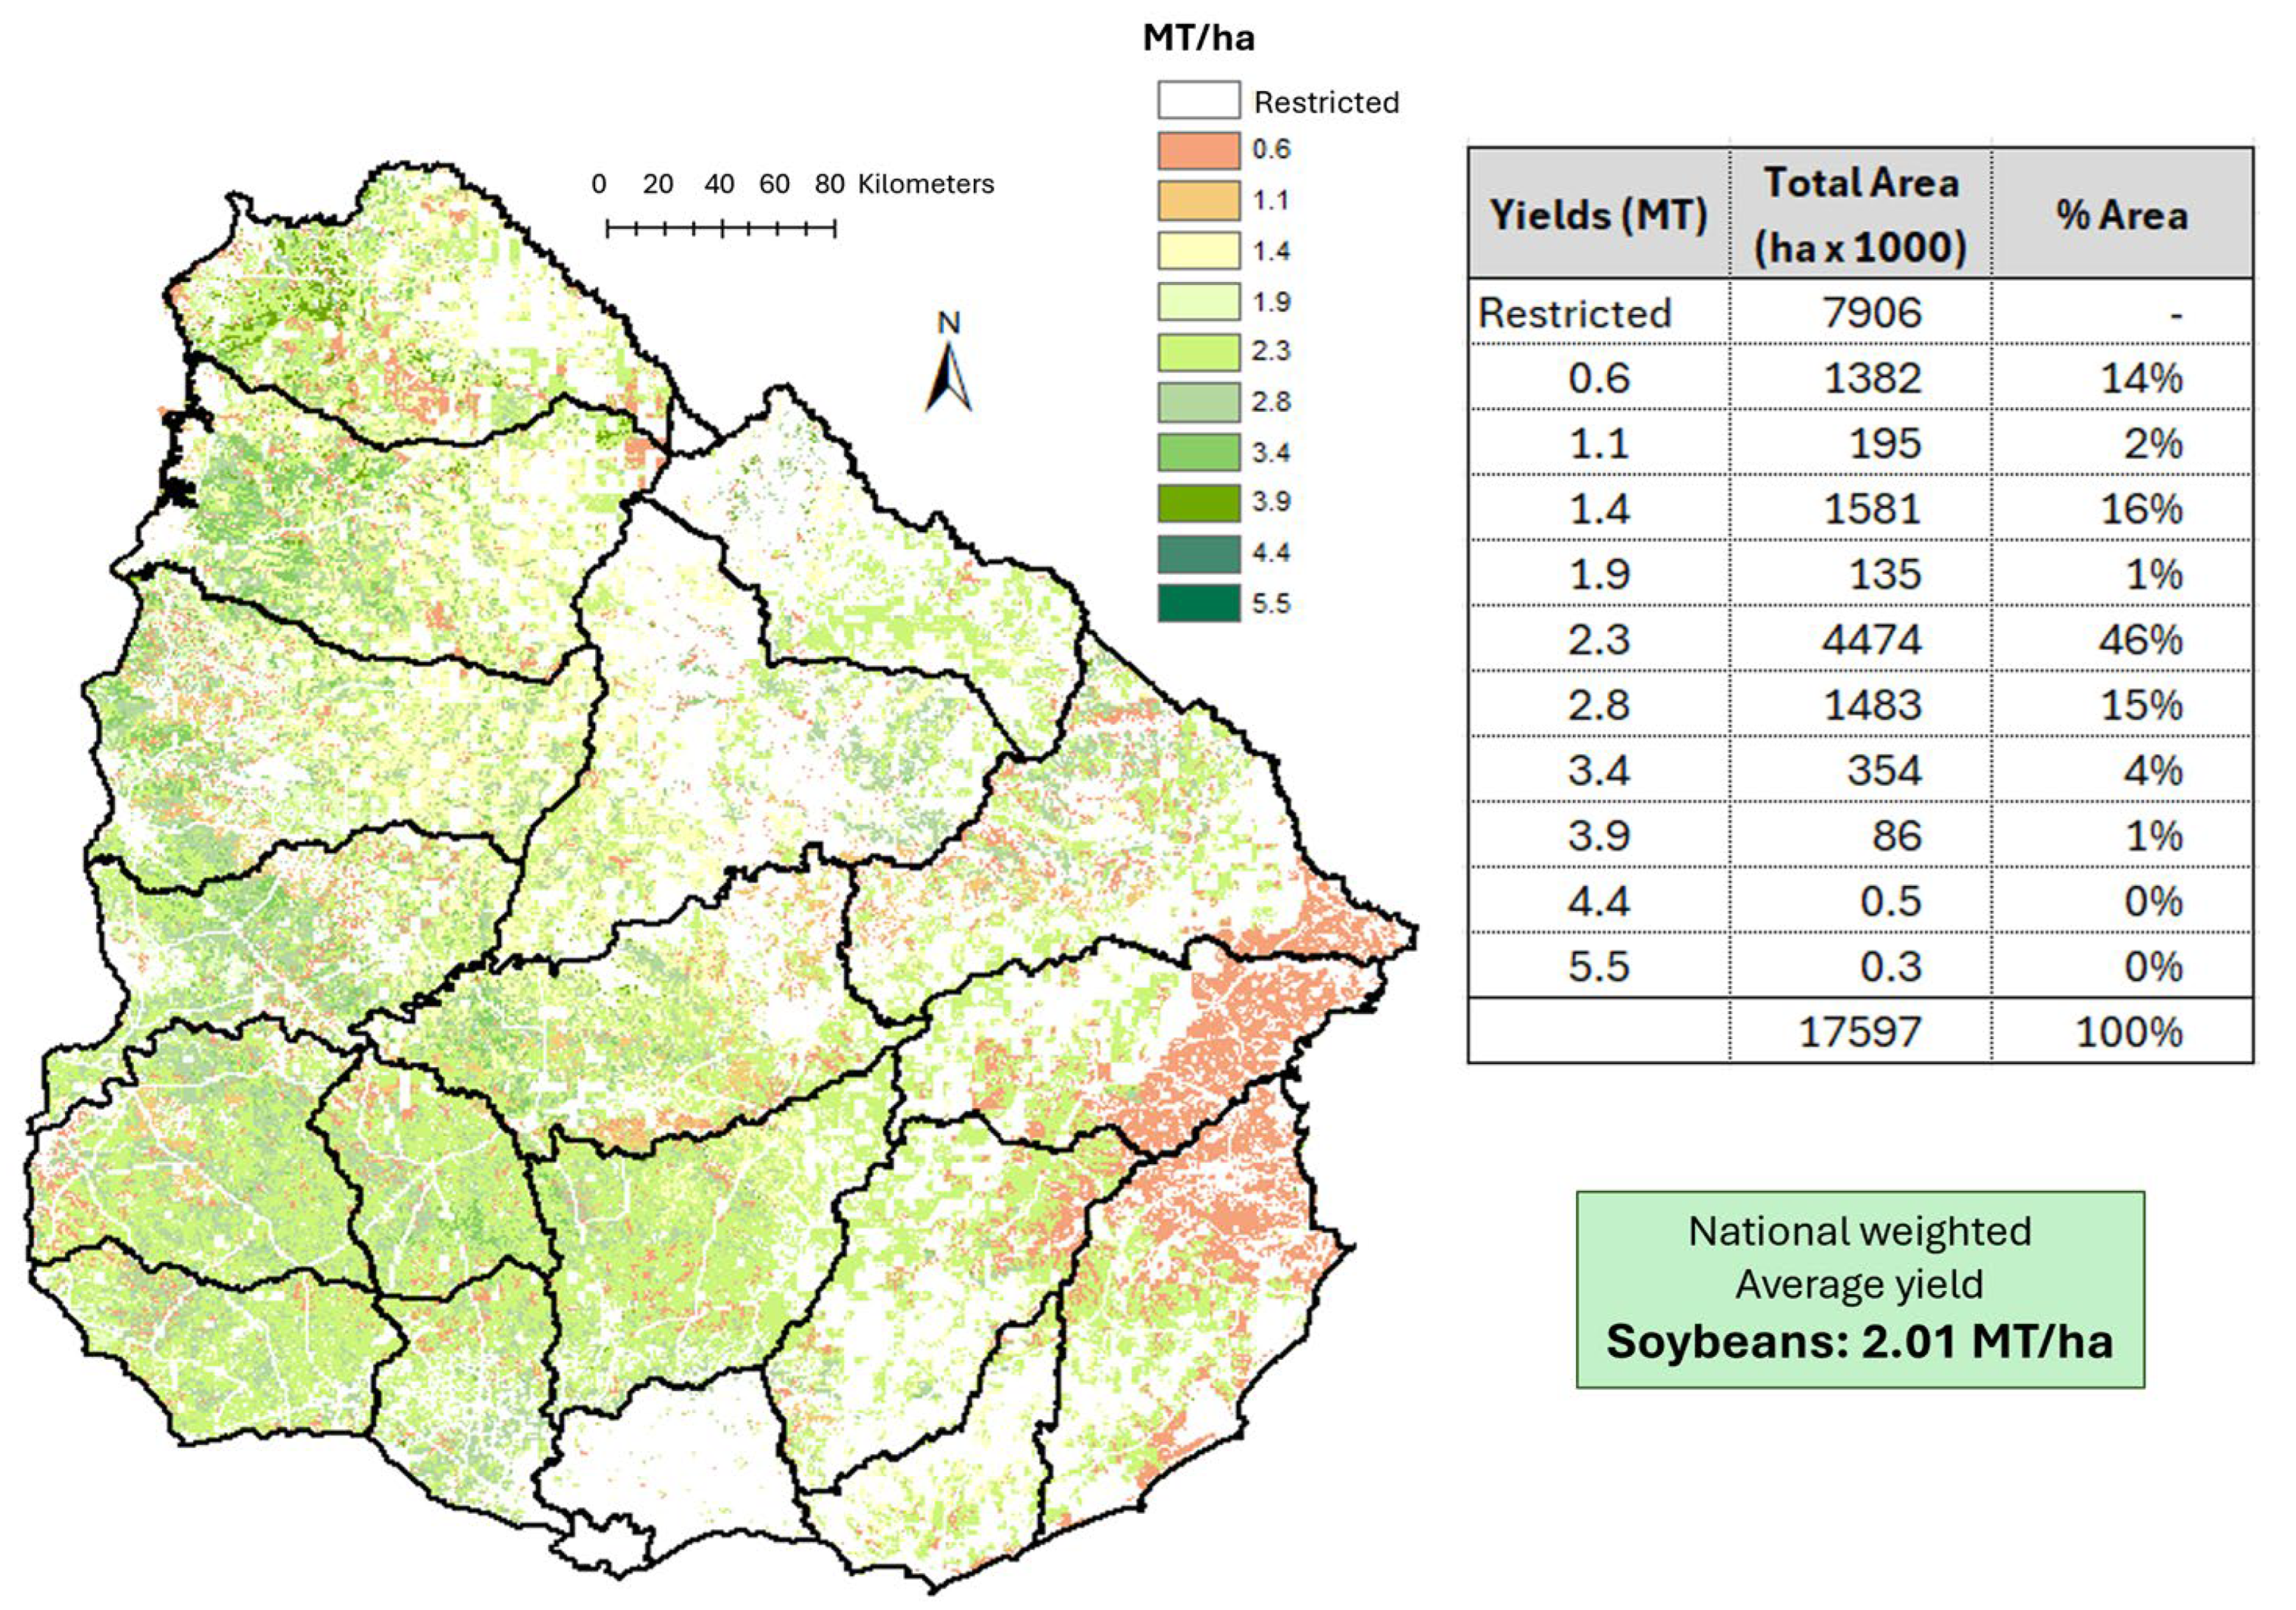
The total potential cropping area is 9.69 million hectares (Figure 7), which represents 45% of the total rural area (17.6 million), with a weighted average soybean yield estimated at 2.0 metric tons/ha. It should be noted that the non-restricted areas with expected average yields above 2.8 metric tons/ha represent less than 1%. The total potential cropping area includes grazing native pastures currently used for extensive cattle production. After imposing all the previous restrictions, some rangelands still qualify as potential croplands. However, other factors can also make land-use changes difficult. For example, cattle production has a long tradition in Uruguay. It is a highly competitive activity, and beef has always been an important export product [59].
Subtracting the area with lower yields (≤1.4 tons/ha) from this potential cropping land, assuming it is marginal productive land, the total potential cropping area is now 6.53 million ha. This figure agrees with the 6.57 million hectares of “moderately suitable” (2.51 million ha) and “suitable and most suitable” (4.06 million ha) land for rainfed crop production calculated by Souto and Tommasino [60]. These authors applied a land use classification scheme based on agronomic and topographic soil properties.

3.3. Expected Economic Margins

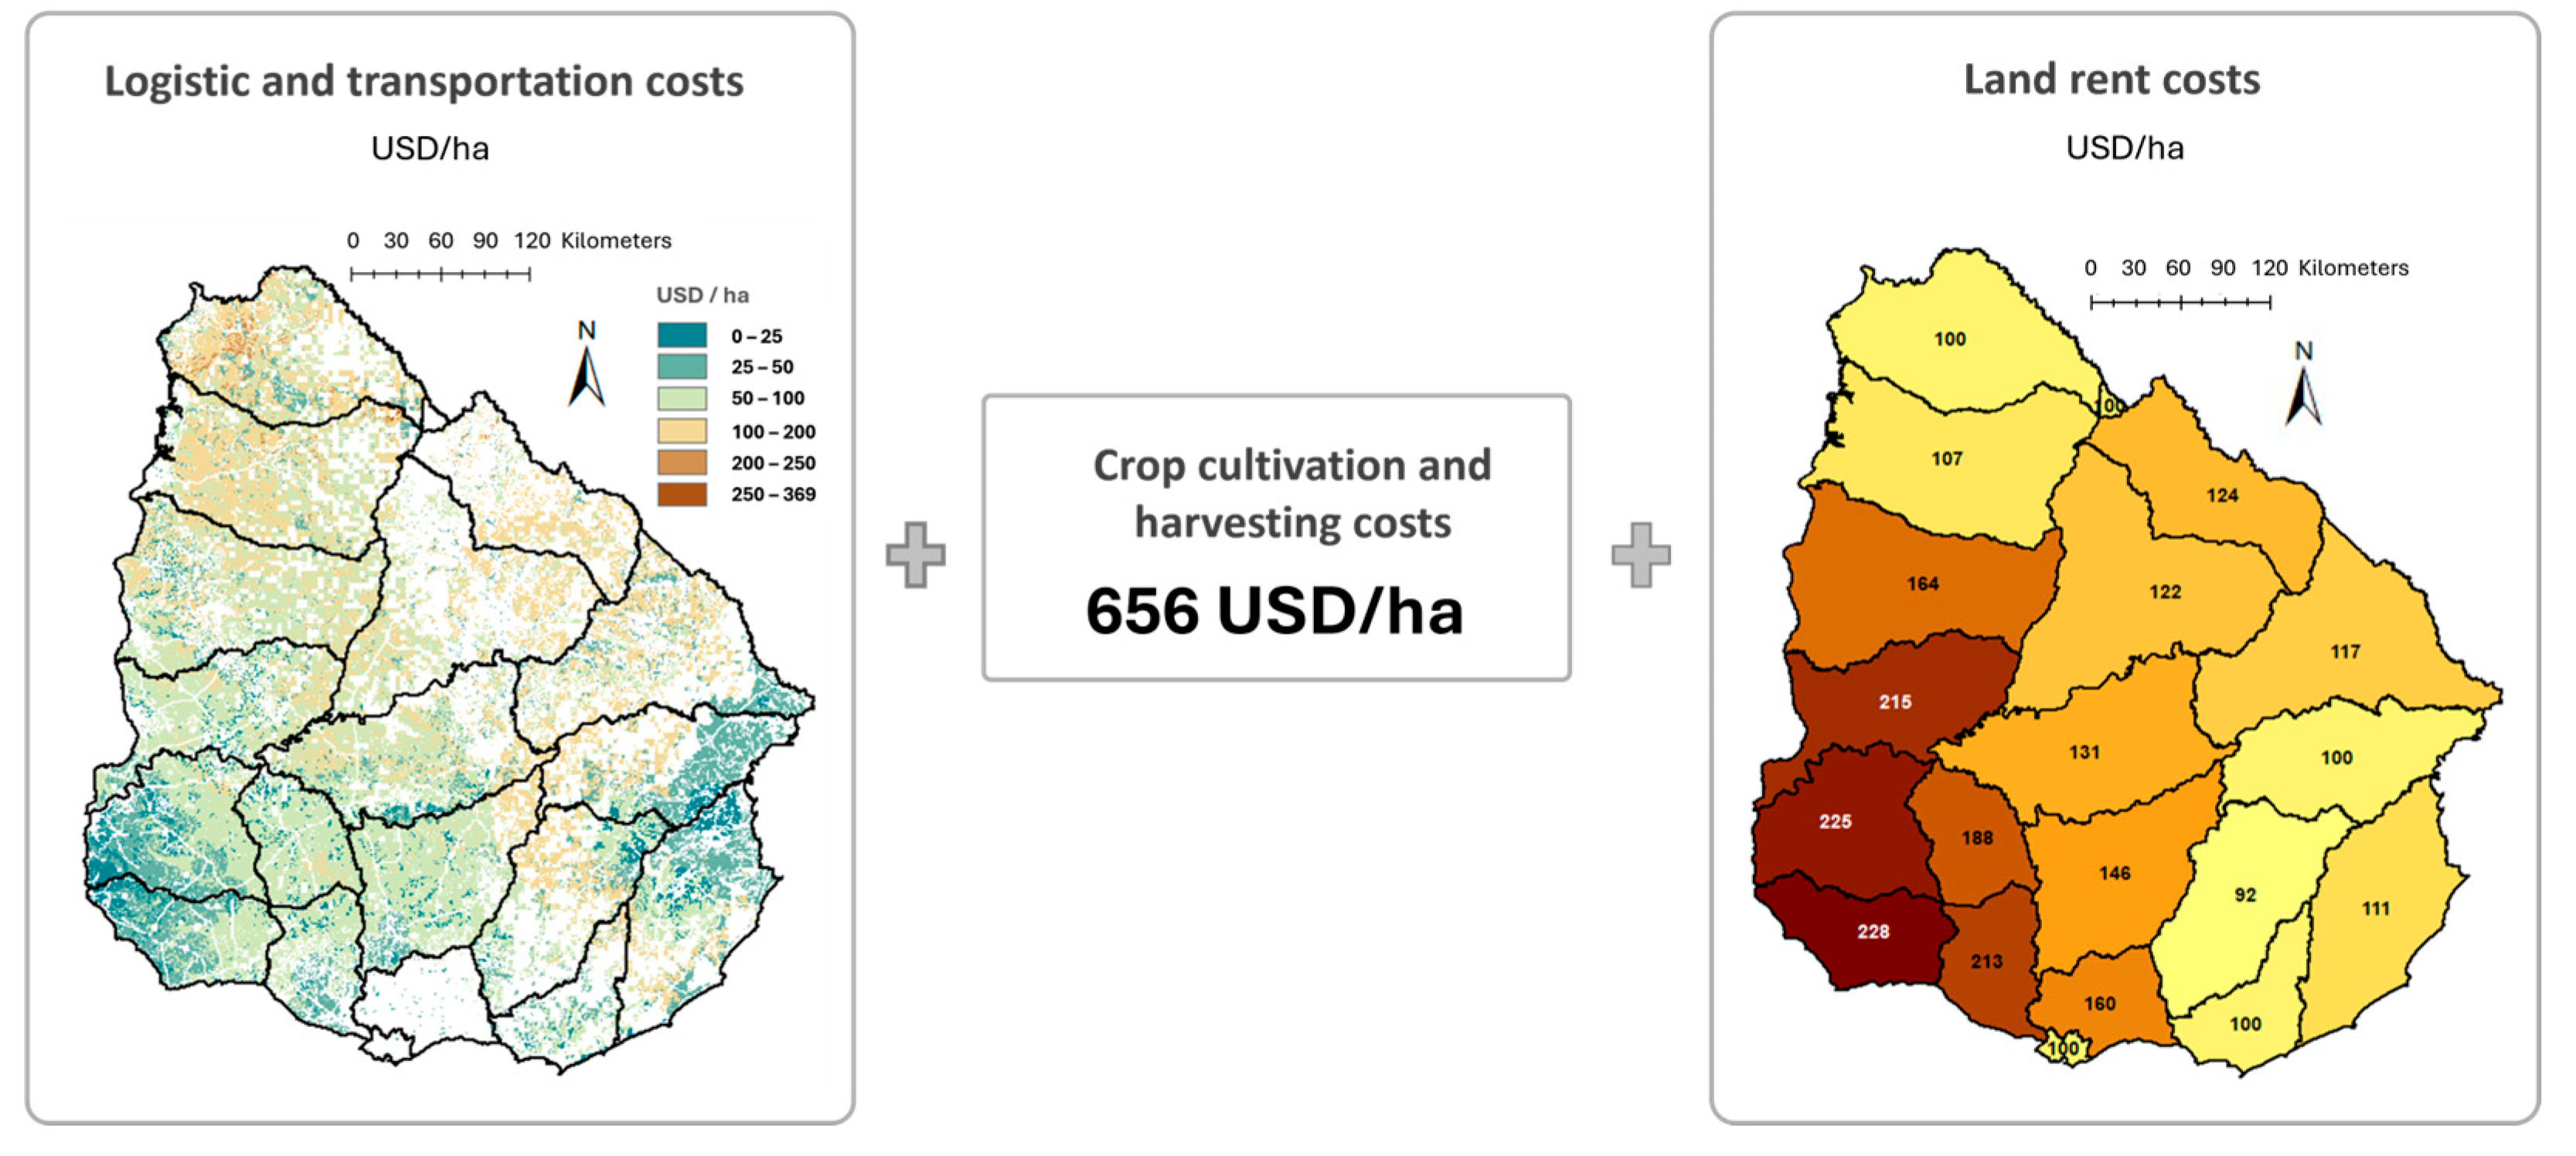
The total costs were calculated by adding location-specific logistics and transportation costs, a national average crop operation cost, and the average land rent cost by department (country’s administrative division). Figure 8 shows the outcome for each cost category.
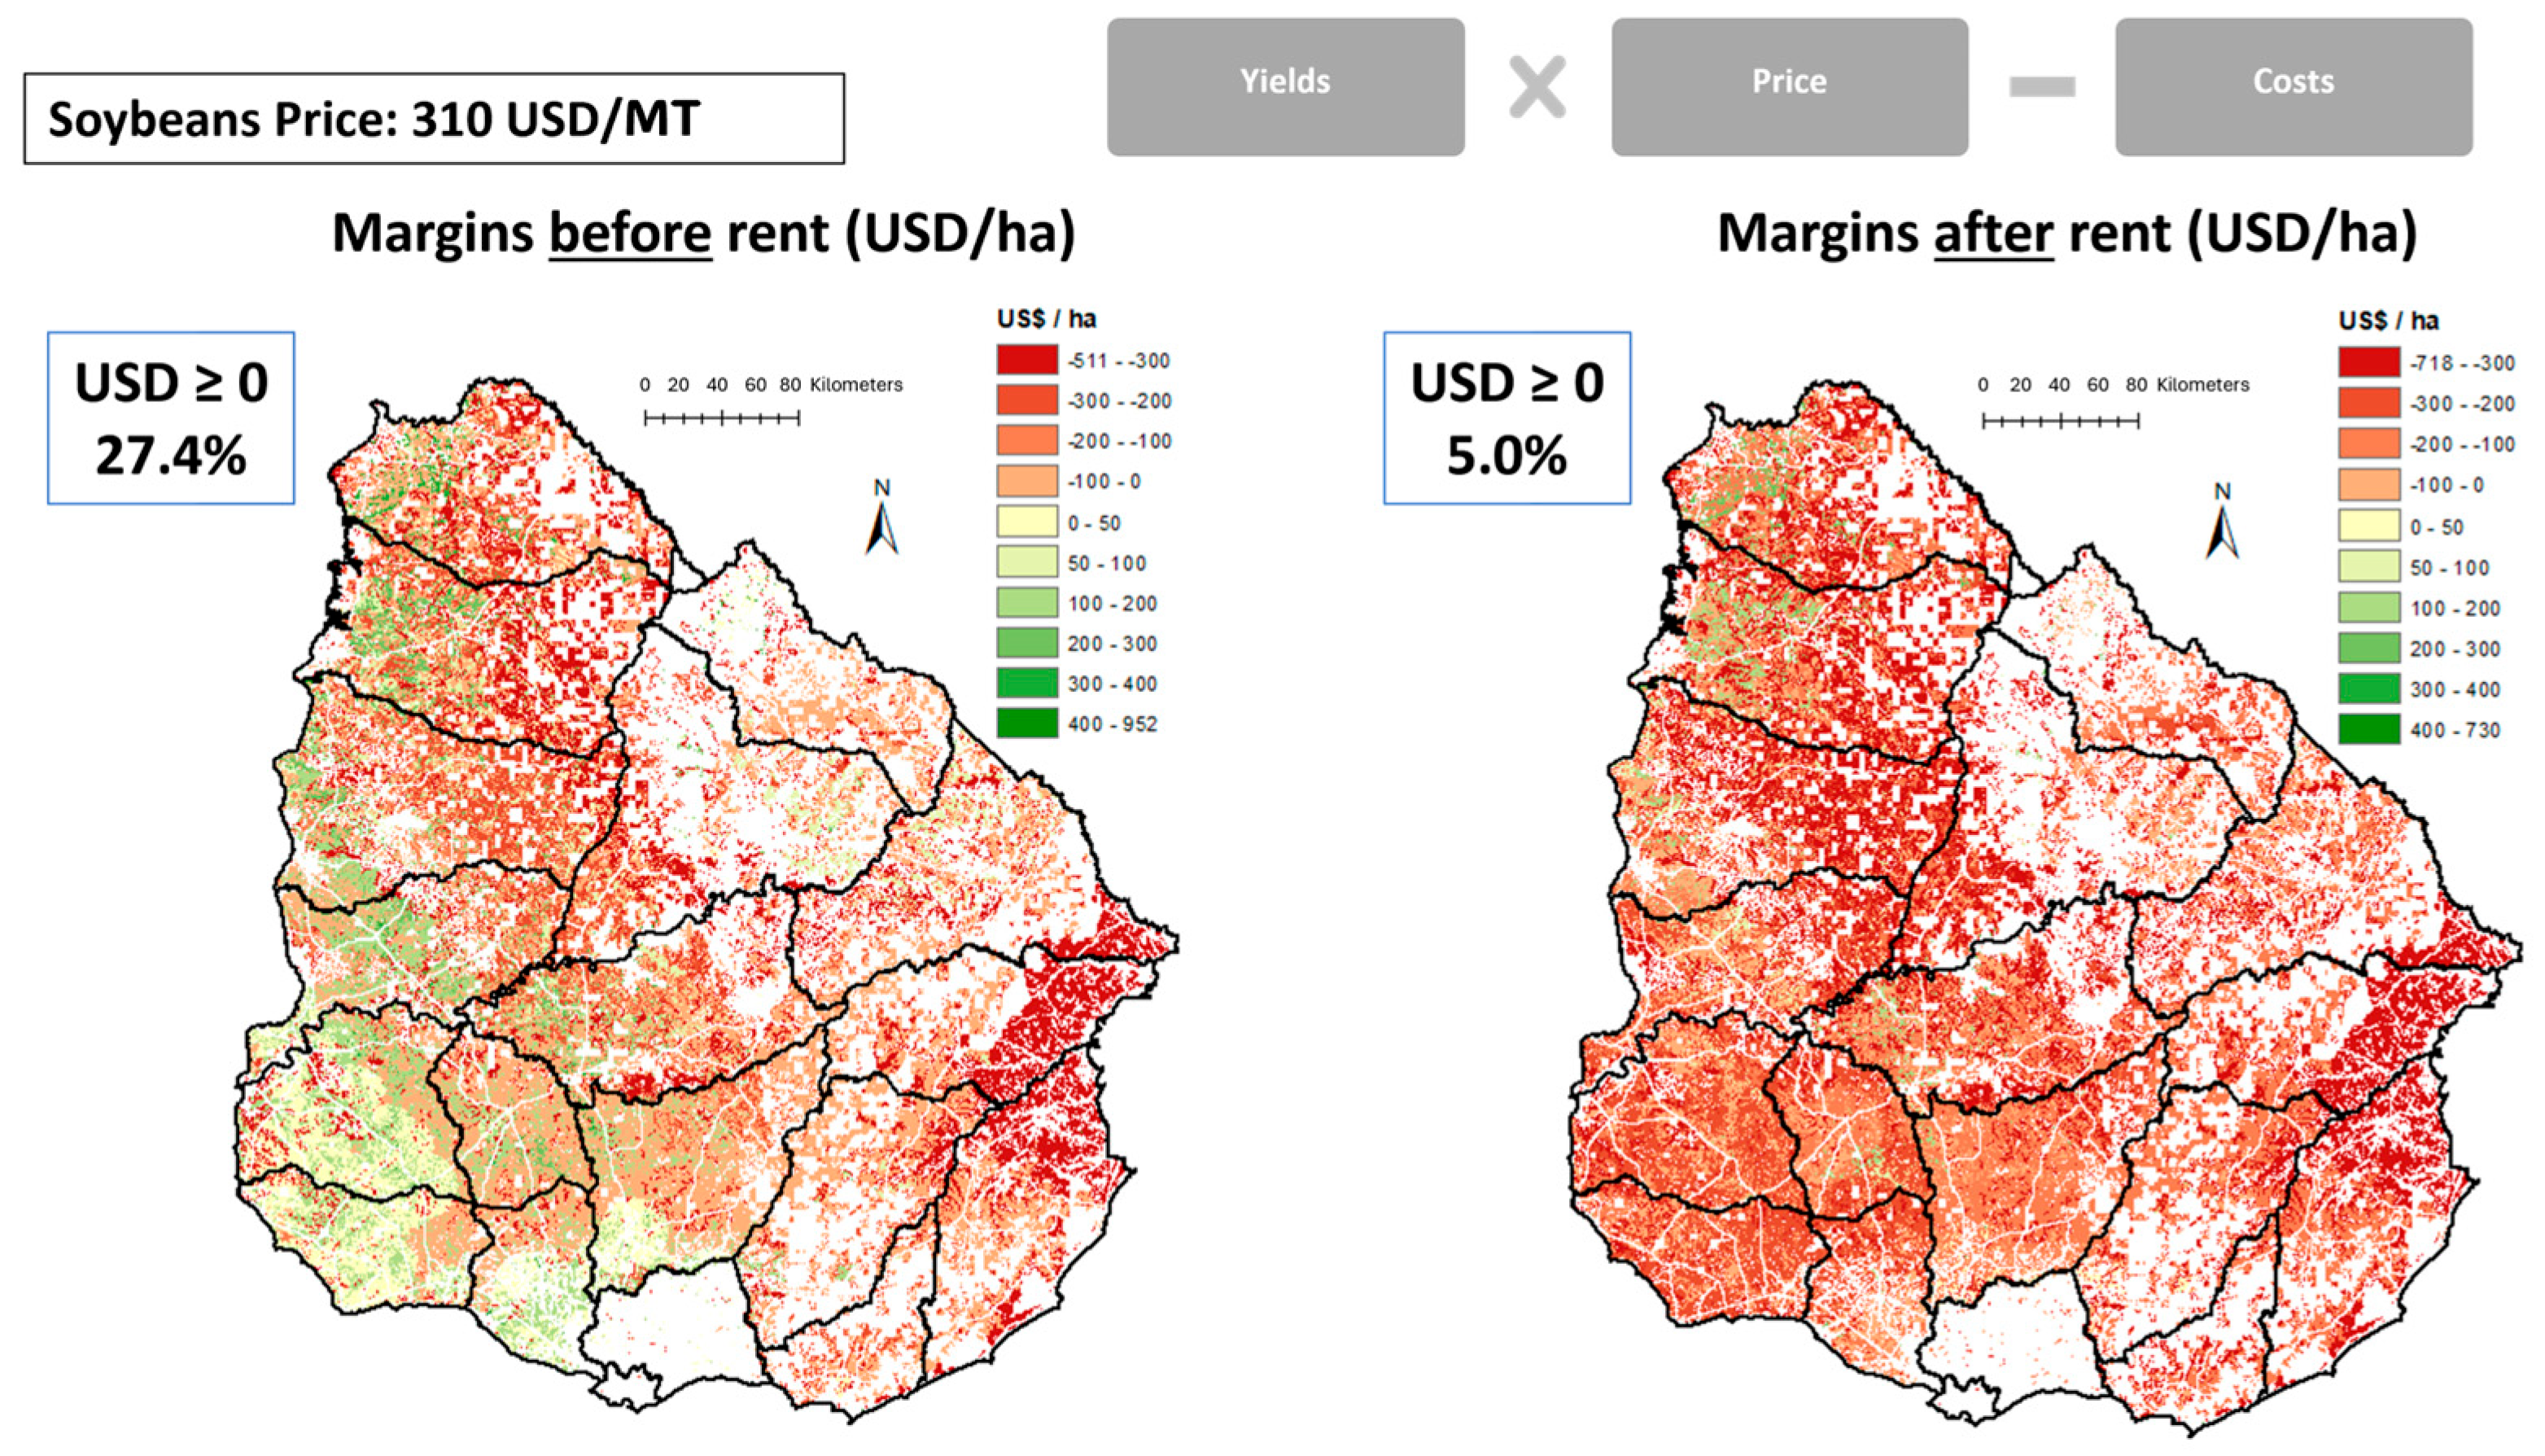
With soybean prices at USD 310/ton and applying the calculated costs and yields for the potential cropping area, the economic margins were computed before and after rent (Figure 9). Margins after rent assume that the total crop pays rent for the land. Red areas on the maps correspond to negative crop margins at the given price. Areas exhibiting positive margins represent 40.6% and 7.5% before and after rent, respectively, of the potential cropping area (6.53 million hectares), without considering technological change.

3.4. Projected Scenarios

The results of the projected scenarios are depicted in Table 2. According to the spatial model, the potential area would range from 0.49 to 2.65 million hectares in the less favorable scenario (soybean price = USD 310/ton with no technological change), depending on whether rent must be paid. The breakeven yields would be 3.43 tons/ha if rent must be paid in full and 2.78 tons/ha if not. In the best scenario (soybean price = USD 400/metric ton and technological change), this range will fall between 6.53 and 6.59 million hectares (Table 2), with breakeven yields of 3.16 tons/ha and 3.14 tons/ha, respectively. These maximum potential areas do not mean that they would be planted simultaneously. It only shows the area where the crop is feasible and could be carried out, expecting some positive economic margin for a given price, if the yields achieve at least the break-even point.
Under the scenario where soybean price remains at 310 USD/ton and productivity increases at its historical trend rate (0.78% per year), the potential area would be between 6.46 and 3.41 million hectares, with or without paying full rent, respectively. However, as explained earlier, soybeans must be included in a crop–crop or crop–pasture rotation, and the potential area for the crop needs to be adjusted to estimate the effective rotation area because the oilseed only occupies a proportion of the total area.
Under this scenario, this potential area would fall respectively to roughly 2.9 and 1.6 million hectares by considering the rotation adjustment factors discussed in Section 2.3 (upper limit: 1 million ha × 67% + 5.46 million ha × 40% = 2.85 million ha; lower limit: 1 million ha × 67% + 2.41 million ha × 40% = 1.63 million ha). The minimum average yields under this scenario would be 3.17 and 3.39 metric tons per hectare. Additionally, considering the proportion of landowners (40%) and tenants (60%), who plant soybeans in Uruguay, the adjusted potential soybean area on rotation would be 2.1 million hectares by 2050 (2.9 × 40% + 1.6 × 60% = 2.12), with a national average breakeven yield of 3.3 metric tons/ha (Table 3).
These figures were not very different than those found during this research using an alternative model based on soil aptitude for crop production [60], achievable soybean yields limited only by water availability [61], and imposing similar subsequent economic and infrastructure restrictions. The estimated potential area for 2050 was 1.58 million hectares, with a total production of 5.6 million tons and an average yield of 3.5 metric tons per hectare to obtain non-negative economic margins, for the most restricted scenario, using the same cost structure and soybean prices. In this case, some areas of the country were excluded from the potential area since storage facilities, logistics, and infrastructure are not currently available. This probably accounts for the difference in the estimates.
Focusing on the maximum achievable area (in million hectares) for planting soybeans as a monocrop or part of a crop–crop or crop–pasture rotation, and considering three rent situations (no rent paid, full rent paid, and rent paid according to the proportion of landowners and tenants), Table 4 shows the results for each selected price-level/technology scenario:
  • Scenario 1: USD 310/MT—no technological change;
  • Scenario 2: USD 350/MT—no technological change;
  • Scenario 3: USD 400/MT—no technological change;
  • Scenario 4: USD 310/MT—with technological change;
  • Scenario 5: USD 350/MT—with technological change;
  • Scenario 6: USD 400/MT—with technological change.
Setting aside the case of planting soybeans as a monocrop (not allowed by PUMS) and concentrating only on soybeans under rotation, the maximum annual area would range from 0.93 million hectares (scenario 1) to 2.89 million (scenario 6). Considering the history of the prices received by Uruguayan farmers for their grain (58% of the time between USD 300 and USD 400, with a mean of USD 356), the most plausible scenarios would be between 1.74 million hectares (scenario 2) and 2.85 million hectares (scenario 5).
The model estimates the maximum potential areas subject to the specific restriction imposed in this case. Not all will necessarily be planted. There could be other restrictive factors, different than those considered in this study, which can limit the area dedicated to this crop.
Finally, soybean yields, crop area, and production were estimated again, now according to the climate effects considered in this study (RCP 8.5, BAU-CCSM4). The results did not show significant differences with the “no technological changes” scenario at any of the three price levels, as observed in Table 5.

4. Conclusions

The ad-hoc model developed in this study provides an approximation for evaluating a potential expansion of the crop considering agronomic, economic, and environmental aspects. As a general contribution, it points directly to Target 2.4 of the United Nations SDGs and the 2030 Agenda. Particularly in the case of Uruguay, the empirical results of the model have fostered discussion among private and public agents related to the industry about national strategy, potential scenarios, and research and development needs. This is one of the main strengths of this study.
New indicators and restrictions to be tested in the model include factors related to local and regional infrastructure (grain storage capacity, roads, transportation, and available services), environmental issues (nitrogen, phosphorus, potassium, and carbon balance, as well as nutrient runoff estimates), cultural aspects, technology learning costs, and others. This will raise the limitations of the current model. Moreover, integrating an ecological module into the model to explicitly account for soybean growth processes could further expand its optimization potential. In that sense, using data from sample points rather than relying solely on national yield statistics might substantially improve the calculations.
The model can be parameterized for any crop, region, or soil system. Moreover, it would allow the analysis of the potential of the entire rotation rather than one component. Additionally, assessing the potential effect of ecosystem services would allow a significant advance in determining the net economic return of an agricultural expansion. With these improvements, this ad-hoc approach could be useful to researchers and decision-makers.

Author Contributions

Conceptualization, B.A.L., M.B., E.G.F., C.R. and B.F.; methodology, M.B., E.G.F. and C.R.; software, M.B.; validation, M.B., E.G.F., C.R. and B.F.; formal analysis, B.A.L., M.B., E.G.F., C.R. and B.F.; investigation, B.A.L., M.B., E.G.F., C.R. and B.F.; resources, E.G.F. and B.F.; data curation, M.B., E.G.F. and C.R.; writing—original draft preparation, B.A.L.; writing—review and editing, B.A.L.; visualization, M.B.; supervision, E.G.F. and B.F.; project administration, B.F. All authors have read and agreed to the published version of the manuscript.

Funding

This study was fully funded by the Instituto Nacional de Investigación Agropecuaria (INIA) of Uruguay as part of its normal research activity. No external funding was received.

Institutional Review Board Statement

Not applicable.

Informed Consent Statement

Not applicable.

Data Availability Statement

The information used in this study is publicly available from the sources cited in this manuscript. Most of the shapefiles available at SIGRAS can be downloaded free of charge, except for some third-party private databases requiring a paid subscription. Additional information regarding the study conditions is available on request.

Acknowledgments

This article is a revised and expanded version of a paper [62], which was presented at the 32nd International Conference of Agricultural Economists, 2–7 August 2024, New Delhi, India.

Conflicts of Interest

The authors declare no conflicts of interest.

Abbreviations

The following abbreviations are used in this manuscript:
BAUBusiness As Usual
CCSM4Community Climate System Model version 4
COUConglomerado Oleaginosos Uruguay
FAOFood and Agriculture Organization of the United Nations
GDPGross Domestic Product
GISGeographic Information System
GMGenetically Modified
INIAInstituto Nacional de Investigación Agropecuaria, Uruguay
LSALand Suitability Analysis
MGAPMinisterio de Ganadería, Agricultura y Pesca, Uruguay
MTMetric Ton
MTOMesa Tecnológica de Oleaginosos
PUMSPlan de Uso y Manejo Responsable de Suelos
RCPRepresentative Concentration Pathway
SDGSustainable Development Goals
SIGRASSistema de Información Geográfica web, Unidad de Agroclima y Sistemas de Información (GRAS) de INIA
UNUnited Nations
USLEUniversal Soil Loss Equation
USAUnited States of America
USDUS Dollar

References

  1. PS&D Online. Custom Query. United States Department of Agriculture, Foreign Agricultural Service. Available online: https://apps.fas.usda.gov/psdonline/app/index.html#/app/advQuery (accessed on 20 May 2025).
  2. Ritchie, H. Drivers of Deforestation. Published Online at OurWorldinData.org. Available online: https://ourworldindata.org/drivers-of-deforestation (accessed on 20 May 2025).
  3. FAOSTAT. Crops and Livestock Products. Food and Agriculture Organization of the United Nations. Available online: https://www.fao.org/faostat/en/#data/ (accessed on 20 May 2025).
  4. Hill, M.; Clérici, C. Planes de uso y manejo de suelos. Rev. Inst. Nac. Investig. Agropecu. 2011, 26, 65–69. Available online: https://www.inia.uy/sites/default/files/publications/2024-06/revista-INIA-26.pdf (accessed on 15 March 2025).
  5. Hopkins, M. Uruguay: Soybeans up on Argentine Investments. Published Online on 29 April 2008 at AgriBusiness GLOBAL. Available online: https://www.agribusinessglobal.com/markets/uruguay-soybeans-up-on-argentine-investments/ (accessed on 30 June 2025).
  6. de Ganadería, M.; Pesca, A.Y. Anuario Estadístico Agropecuario 2024. Available online: https://www.gub.uy/ministerio-ganaderia-agricultura-pesca/diea/anuario2024 (accessed on 20 May 2025).
  7. LatAm, D.D. Make Global Trade Data. Available online: https://www.datamyne.com/ (accessed on 20 May 2025).
  8. Ferraro, B.; Rava, C.; Borges, M.; Fernández, E.; Lanfranco, B. El complejo oleaginoso en Uruguay: Análisis zafra 2020/2021 y perspectivas. In Proceedings of the 10° Encuentro Nacional de la Mesa Tecnológica de Oleaginosos, Montevideo, Uruguay, 25 November 2021. [Google Scholar]
  9. Fernández, E.; Rava, C.; Borges, M.; Ferraro, B.; Lanfranco, B. El complejo oleaginoso en Uruguay: Análisis zafra 2021/2022 y perspectivas. In Proceedings of the 11° Encuentro Nacional de la Mesa Tecnológica de Oleaginosos, Montevideo, Uruguay, 13 October 2022. [Google Scholar]
  10. WWF. El Crecimiento de la Soja: Impactos y Soluciones; World Wide Fund for Nature: Gland, Switzerland, 2014. [Google Scholar]
  11. Dossa, D.; Chia, E. Cambio técnico y desarrollo económico: El caso de la cultura de soya en Brasil. In Agriculturas y Campesinados de América Latina: Mutaciones y Recomposiciones, 1st ed.; Linck, T., Ed.; Institut Français de Recherche Scientifique pour le Développement en Coopération, Fondo de Cultura Económica: Ciudad de México, México, 1994; pp. 105–115. (In Spanish) [Google Scholar]
  12. Seguy, L.; Bouzinac, S. Fronteras agrícolas del oeste de Brasil. Agric. Dev. 1994, 54–57. Available online: https://agritrop.cirad.fr/387437/1/document_387437.pdf (accessed on 15 May 2025).
  13. Conte, A.S. Expansión territorial del cultivo de soja en Argentina. In Proceedings of the I Jornadas de Geografía de la UNLP, Universidad Nacional de La Plata, La Plata, Argentina, 12–15 October 1993; pp. 315–331. [Google Scholar]
  14. LART-FAUBA. Patrones espaciales y temporales de la expansión de soja en Argentina. In Relación con Factores Socioeconómicos y Ambientales; Laboratorio de Análisis regional y Teledetección, Facultad de Agronomía, Universidad de Buenos Aires: Buenos Aires, Argentina, 2004. [Google Scholar]
  15. Paruelo, J.M.; Guerschman, J.P.; Piñeiro, G.; Jobbágy, E.G.; Verón, S.R.; Baldi, G.; Baeza, S. Cambios en el uso de la tierra en Argentina y Uruguay: Marcos conceptuales para su análisis. Agrociencia 2006, 10, 47–61. [Google Scholar] [CrossRef]
  16. Castillo, P. Expansión regional del cultivo de soja en Argentina. Doc. CIEA 2007, N°3, 119–132. Available online: https://www.ciea.com.ar/web/wp-content/uploads/2016/11/Doc3_5.pdf (accessed on 1 June 2025).
  17. OEA. Evaluación Regional del Impacto en la Sostenibilidad de la Cadena Productiva de la Soja: Argentina, Uruguay y Paraguay; Organización de los Estados Americanos: Washington, DC, USA, 2009. [Google Scholar]
  18. Gibbs, H.K.; Rausch, L.L.; Munger, J.; Schelly, I.; Morton, D.C.; Noojipady, P.; Soares-Filho, B.; Barreto, P.; Micol, L.; Walker, N.F. Brazil’s soy moratorium: Supply chain governance is needed to avoid deforestation. Science 2015, 347, 377–378. [Google Scholar] [CrossRef]
  19. Páez, S.M. Soja en Argentina a principios del siglo XXI: El Sistema agropecuario y la competencia por el uso del suelo. Cuad. Econ. Crítica 2016, 3, 135–169. [Google Scholar]
  20. Pierri, J.; Wesz, V.J., Jr. La sojización en Argentina y Brasil (1984/2014): Influencia de las políticas públicas, de las empresas transnacionales y de la estructura económica dependiente. Extensão Rural 2017, 24, 20–41. [Google Scholar] [CrossRef]
  21. Rausch, L.L.; Gibbs, H.K.; Schelly, I.; Brandão, A., Jr.; Morton, D.C.; Carneiro Filho, A.; Strassburg, B.; Walker, N.F.; Noojipady, P.; Barreto, P.; et al. Soy expansion in Brazil’s Cerrado. Conserv. Lett. 2019, 12, e12671. [Google Scholar] [CrossRef]
  22. Gutiérrez, N.; Ferraro, B.; Patrouilleau, M.M.; Alonso, I.; Rodas, C.; Carrasco, J.; Cordeiro, L.A.M. Políticas públicas e institucionalidad para la intensificación sostenible en los países del Cono Sur. Programa Cooperativo para el Desarrollo Tecnológico Agroalimentario y Agroindustrial del Cono Sur (PROCISUR). 2020. Available online: http://www.iica.int (accessed on 1 July 2025).
  23. Strada, J.; Vila, I.A. La Producción de Soja en Argentina: Causas e Impactos de su Expansión. Centro Cultural de la Cooperación, 2022. Estudios de Economía Política y Sistema Mundial, Ed.: 23. Available online: https://www.centrocultural.coop/revista/23/la-produccion-de-soja-en-argentina-causas-e-impactos-de-su-expansion (accessed on 1 July 2025).
  24. UN Sustainable Development. The 17 Goals. United Nations Department of Economic and Social Affairs. Available online: https://sdgs.un.org/goals/goal2#targets_and_indicators (accessed on 1 June 2025).
  25. FAO. A Framework for Land Evaluation. FAO Soils Bulletin 1976, 32. Available online: https://www.fao.org/3/x5310e/x5310e00.htm (accessed on 30 November 2024).
  26. Faggian, R.; Johnson, M.M.; Sposito, V.; Romeijn, H. Climate Smart Agricultural Development Technical Report: Fruit Production; Deakin University, CeRRF: Melbourne, VIC, Australia, 2016. [Google Scholar]
  27. Duc, T.T. Using GIS and AHP Technique for Land-Use Suitability Analysis; International Symposium on Geoinformatics for Spatial Infrastructure Development in Earth and Allied Sciences: Ho Chi Min, Vietnam, 2006; Available online: https://www.geoinfo-lab.org/gisideas06/papers/USING%20GIS%20AND%20AHP%20TECHNIQUE%20FOR.pdf (accessed on 1 July 2025).
  28. Akinci, H.; Ozalp, A.Y.; Turgut, B. Agricultural land use suitability analysis using GIS and AHP technique. Comput. Electron. Agric. 2013, 97, 71–82. [Google Scholar] [CrossRef]
  29. Borges, M. Climate Change and Variability Impacts on Soybean Production in Uruguay. M. Science (Research) Thesis, School of Life and Environmental Sciences and Centre for Regional and Rural Futures, Deakin University. Available online: https://dro.deakin.edu.au/articles/thesis/Climate_change_and_variability_impacts_on_soybean_production_in_Uruguay/21113308?file=37457113 (accessed on 15 May 2025).
  30. SIGRAS. Sistema de Información Geográfica Web. Instituto Nacional de Investigación Agropecuaria, Unidad de Agro-Clima y Sistemas de Información (INIA-GRAS). Available online: https://inia.uy/sigras/ (accessed on 30 November 2024).
  31. Cal, A.; Giménez, A.; Tiscornia, G. Sistema de información geográfica web “SIGRAS”. Rev. Inst. Nac. Investig. Agropecu. 2013, 33, 66–69. [Google Scholar]
  32. Bachmann, N.; Tripath, S.; Brunner, M.; Jodlbauer, H. The contribution of data-driven technologies in achieving the Sustainable Development Goals. Sustainability 2022, 14, 2497. [Google Scholar] [CrossRef]
  33. Varotsos, C.A.; Cracknell, A.P. Contribution to the success of the Sustainable Development Goals—UN 2030 agenda. Remote Sens. Lett. 2020, 11, 715–719. [Google Scholar] [CrossRef]
  34. Kulmala, M.; Lintunen, A.; Ylivinkka, I.; Mukkala, J.; Rantanen, R.; Kujansuu, J.; Petäjä, T.; Lappalainen, H.K. Atmospheric and ecosystem big data providing key contributions in reaching United Nations’ Sustainable Development Goals. Big Earth Data 2021, 5, 277–305. [Google Scholar] [CrossRef]
  35. Rizzo, G. Estimación y Análisis Espaciotemporal del Rendimiento y las Brechas de Rendimiento de soja en Uruguay. Master’s Thesis, Facultad de Agronomía, Universidad de la República, Montevideo, Uruguay, 2018. [Google Scholar]
  36. Steduto, P.; Hsiao, T.; Fereres, E.; Raes, D. Crop Yield Response to Water; FAO, Land and Water Division: Rome, Italy, 2012; 503p, Available online: https://openknowledge.fao.org/items/acb0049f-3ea4-4e7d-b149-587bbea84a96 (accessed on 30 April 2024).
  37. MGAP. Ministerio de Ganadería, Agricultura y Pesca. Encuesta Agrícola Invierno 2023; Serie Encuestas N°370. Available online: https://www.gub.uy/ministerio-ganaderia-agricultura-pesca/comunicacion/noticias/diea-presenta-resultados-encuesta-agricola-invierno-2023#:~:text=DIEA%20presenta%20los%20resultados%20de%20la%20Encuesta%20Agr%C3%ADcola%20%E2%80%9CInvierno%202023%E2%80%9D,-03/07/2023&text=La%20intenci%C3%B3n%20de%20siembra%20de,de%20forraje%20para%20el%20ganado (accessed on 30 June 2025).
  38. INIA-GRAS. Banco de Datos Agroclimático. Instituto Nacional de Investigación Agropecuaria, Unidad de Agro-Clima y Sistemas de Información. Available online: http://www.inia.uy/gras/Clima/Banco-datos-agroclimatico (accessed on 30 November 2024).
  39. Molfino, J. Estimación del Agua Disponible en los Grupos CONEAT, Metodología Empleada. Ministerio de Ganadería, Agricultura y Pesca: Montevideo, Uruguay, 2009; Available online: https://www.gub.uy/ministerio-ganaderia-agricultura-pesca/comunicacion/publicaciones/estimacion-agua-disponible-grupos-coneat-metodologia-empleada (accessed on 30 November 2020).
  40. Allen, R.G.; Pereira, L.S.; Raes, D.; Smith, M. Evapotranspiración del cultivo: Guías para la determinación de los requerimientos de agua de los cultivos. In Riesgo y Drenaje; FAO: Roma, Italy, 1998. [Google Scholar]
  41. MGAP-DGRN. Coneat, Carta de Suelos y Cartografía de Campo Natural. Ministerio de Ganadería, Agricultura y Pesca. Dirección General de Recursos Renovables. Available online: https://dgrn.mgap.gub.uy/js/visores/dgrn/ (accessed on 30 November 2024).
  42. Liebig, V. Principles of agricultural chemistry with special reference to the late research made in England. In Cycles of Essential Elements 2009; Benchmark Papers in Ecology; Pomeroy, L.R., Dowden, Hutchinson, Ross, Eds.; Van Nostrand Reinhold: London, UK, 1855; Volume 1, pp. 11–28. [Google Scholar]
  43. MGAP-DGRN. Sistema de Gestión de Planes de Uso. Ministerio de Ganadería, Agricultura y Pesca, Dirección General de Recursos Renovables. Available online: https://planesdeuso.mgap.gub.uy/planesdeuso/App/index.aspx (accessed on 30 November 2020).
  44. Moreira, A.L.; Rovira, P. Cartografía de suelos del Uruguay: Historia y estado actual. Anu. OPYPA 2017, 297–302. Available online: https://www.gub.uy/ministerio-ganaderia-agricultura-pesca/comunicacion/publicaciones/anuario-opypa-2017 (accessed on 30 November 2024).
  45. García-Préchac, F. Guía para la toma de Decisiones en Conservación de Suelos, 3rd ed.; Serie Técnica N°26; Instituto Nacional de Investigación Agropecuaria: Montevideo, Uruguay, 1992; 63p. [Google Scholar]
  46. Clérici, C.; García-Préchac, F. Aplicaciones del modelo USLE/RUSLE para estimar pérdidas de suelo por erosión en Uruguay y la región sur de la cuenca del Río de la Plata. Agrociencia Urug. 2001, 5, 92–103. [Google Scholar]
  47. Pérez-Bidegain, M.; Piaggio, J.M.; Baethgen, W.B.; García-Préchac, F. Actualización del factor erosividad de la lluvia en Uruguay. Agrociencia Urug. 2017, 12 N°2, 91–99. [Google Scholar] [CrossRef]
  48. Petraglia, C.; Dell’Aqua, M.; Pereira, G.; Yussim, E. Mapa integrado de cobertura y uso del suelo del Uruguay, año 2018. In Anuario OPYPA 2019; Oficina de Programación y Política Agropecuaria; Ministerio de Ganadería, Agricultura y Pesca: Montevideo, Uruguay, 2019; pp. 509–517. [Google Scholar]
  49. DIEA. Anuario de Estadísticas Agropecuarias 2022. Oficina de Estadísticas Agropecuarias, Ministerio de Ganadería, Agricultura y Pesca. Available online: https://www.gub.uy/ministerio-ganaderia-agricultura-pesca/comunicacion/publicaciones/anuario-estadistico-agropecuario-2022 (accessed on 30 January 2023).
  50. MTO. Observatorio Oleaginosos Uruguay. Informes. Available online: http://oleaginosos.org.uy/observatorio (accessed on 29 July 2025).
  51. MTOP. Precios de Referencia, Servicios de Transporte. Ministerio de Transporte y Obras Públicas. Available online: https://www.gub.uy/ministerio-transporte-obras-publicas/comunicacion/publicaciones/precios-referencia-servicios-transporte (accessed on 15 March 2025).
  52. REOPINAGRA. Instalaciones de Acopio de Granos 2017. Available online: https://web.snig.gub.uy/arcgisprtal/apps/webappviewer/index.html?id=7d03e2adc6b24ae89499659408ec8a6b (accessed on 30 November 2024).
  53. MGAP. Datos y Estadísticas. Ministerio de Ganadería, Agricultura y Pesca. Available online: https://www.gub.uy/ministerio-ganaderia-agricultura-pesca/datos-y-estadisticas/datos (accessed on 15 March 2024).
  54. Riahi, K.; Rao, S.; Krey, V.; Cho, C.; Chirkov, V.; Fischer, G.; Kindermann, G.; Nakicenovic, N.; Rafaj, P. RCP 8.5—A scenario of comparatively high greenhouse gas emissions. Clim. Change 2011, 109, 33–57. [Google Scholar] [CrossRef]
  55. Gent, P.; Danabasoglu, G.; Donner, L.; Holland, M.M.; Hunke, E.C.; Jayne, S.; Lawrence, D.; Neale, R.; Rasch, P.J.; Vertenstein, M.; et al. The Community Climate System Model Version 4. J. Clim. 2011, 24, 4973–4991. [Google Scholar] [CrossRef]
  56. Curry, J.A. Climate Under Uncertainty and Risk: Rethinking Our Response, 1st ed.; Anthem Press: New York, NY, USA, 2023; pp. 296–297. [Google Scholar]
  57. WorldClim. Global Climate and Weather Data. Available online: https://www.worldclim.org/data/cmip6/cmip6_clim2.5m.html (accessed on 30 April 2025).
  58. Wischmeier, W.H.; Smith, D.D. Predicting rainfall erosion losses. In A Guide to Conservation Planning; Agriculture Handbook N°537; United States Department of Agriculture: Washington, DC, USA, 1978; 67p. [Google Scholar]
  59. Uruguay XXI. Sector Ganadero en Uruguay. 2024. Available online: https://www.uruguayxxi.gub.uy/uploads/informacion/94b50e8850ce20033e048c8c3b15f37823d2454b.pdf (accessed on 1 July 2024).
  60. Souto, G.; Tommasino, H. La expansión de la agricultura y su relación con la aptitud agrícola de los suelos. In Anuario OPYPA 2011; Oficina de Programación y Política Agropecuaria, Ministerio de Ganadería, Agricultura y Pesca: Montevideo, Uruguay, 2011; pp. 339–352. [Google Scholar]
  61. Rizzo, G.; Monzon, J.P.; Ernst, O. Cropping system-imposed yield gap: Proof of concept on soybean cropping systems in Uruguay. Field Crops Res. 2021, 260, 107944. [Google Scholar] [CrossRef]
  62. Fernández, E.G.; Borges, M.; Ferraro, B.; Rava, C.; Lanfranco, B. Assessing the limits of sustainable intensification for agriculture using a spatial model framework. In Proceedings of the 32nd International Conference of Agricultural Economists, New Delhi, India, 2–7 August 2024. [Google Scholar]
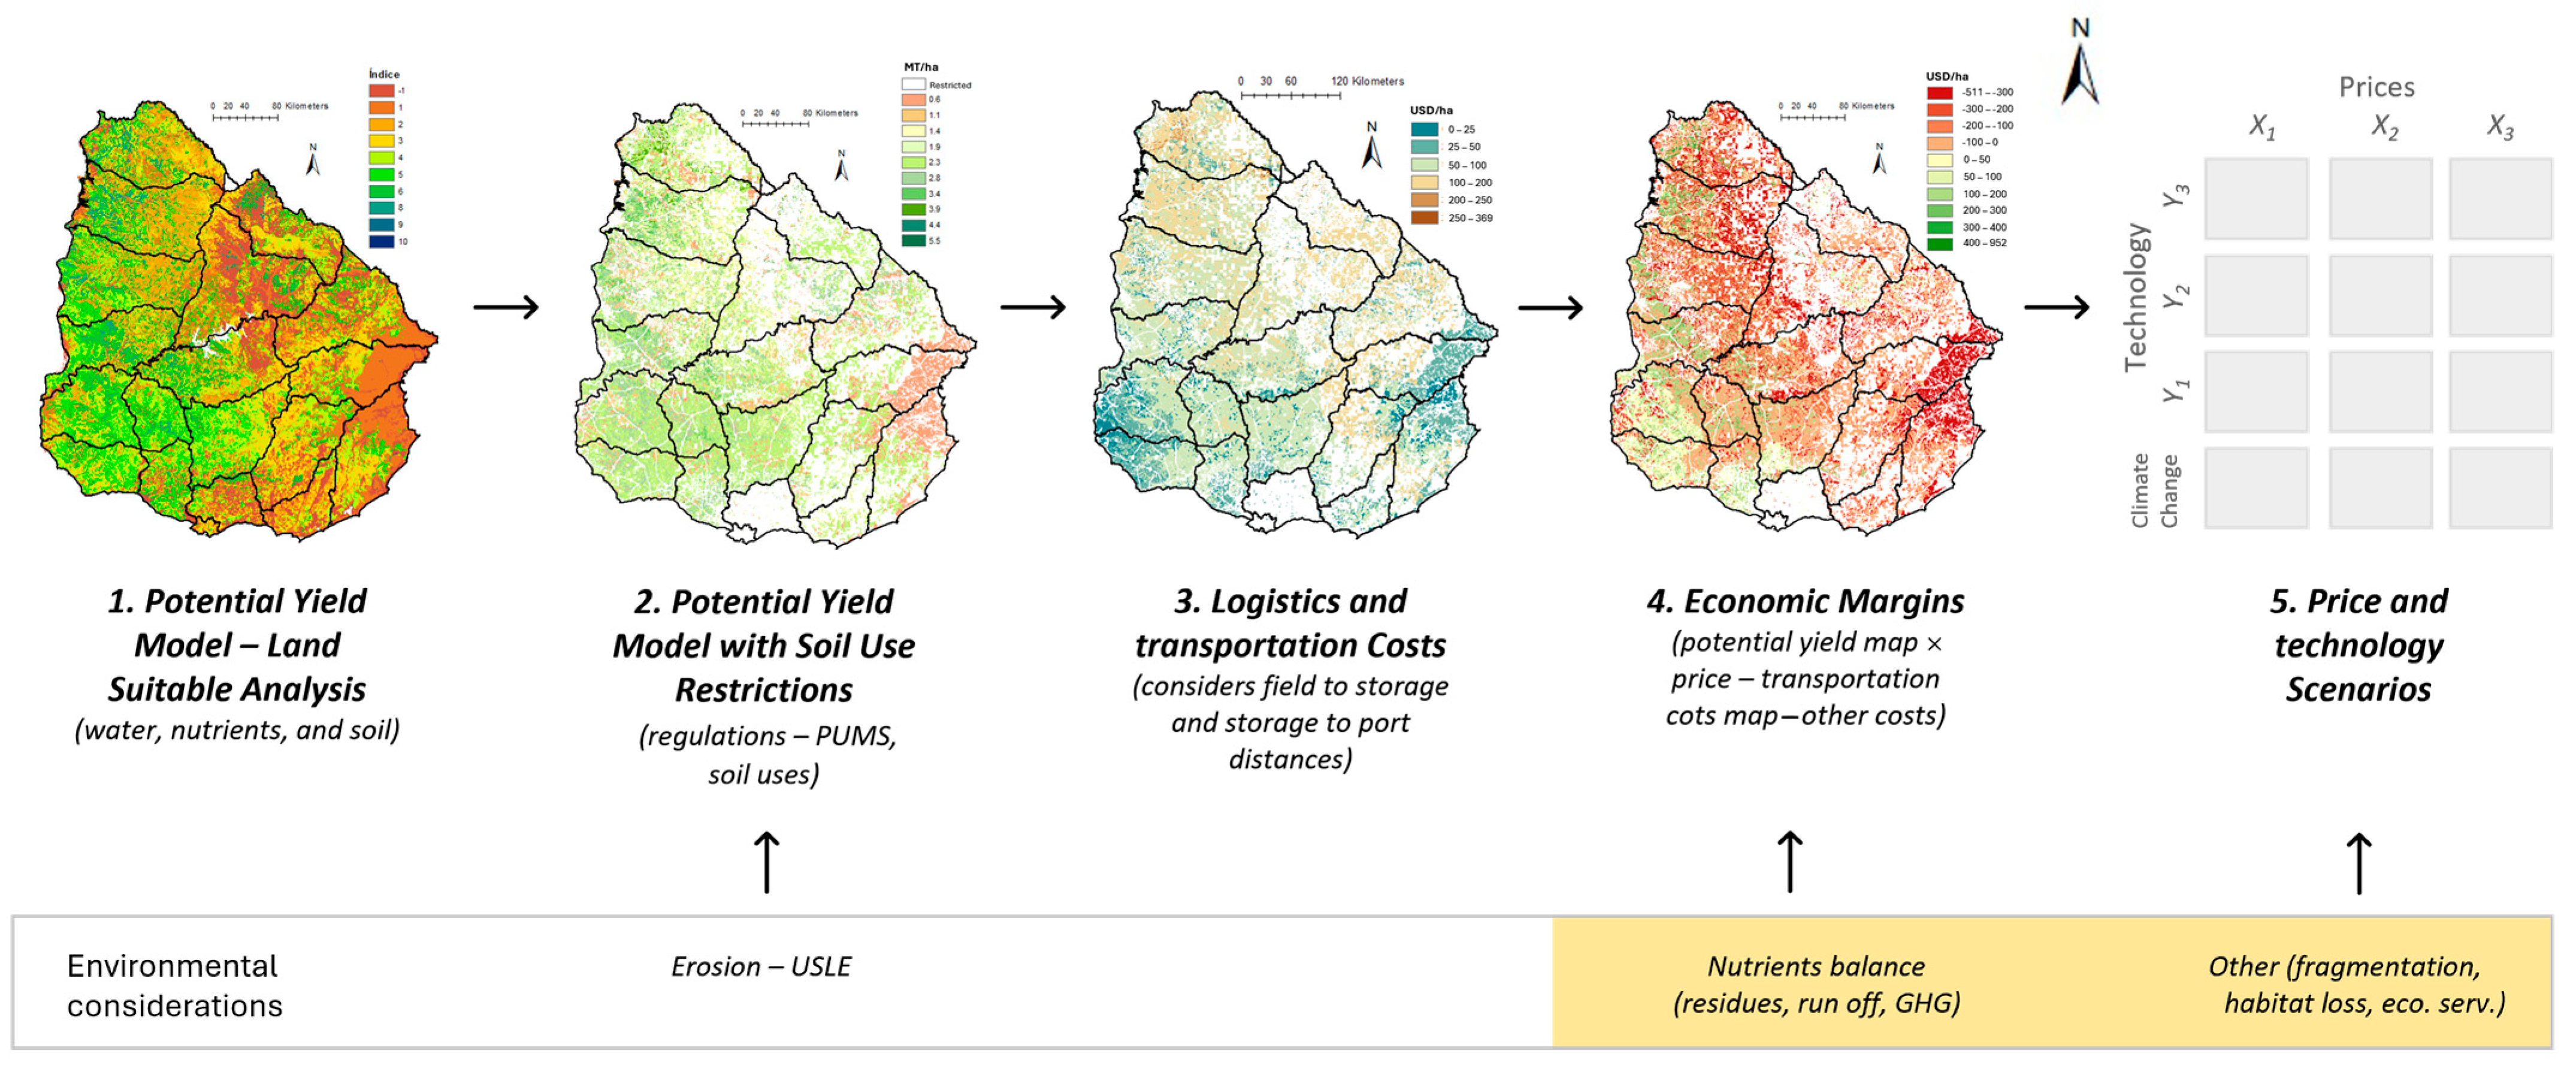
Figure 1. Main steps of the spatial model framework.
Sustainability 17 07304 g001
Figure 2. LSA model, including water availability balance and soil suitability level.
Sustainability 17 07304 g002
Figure 3. LSA model—water balance component [40].
Sustainability 17 07304 g003
Figure 4. Discarded lands due to unsuitable agronomic and topographic characteristics.
Sustainability 17 07304 g004
Figure 5. Calculated erosion risks, erosion rate tolerance, and erosion restricted area.
Sustainability 17 07304 g005
Figure 6. Land use restricted areas.
Sustainability 17 07304 g006
Figure 7. Total potential productive areas and expected yields.
Sustainability 17 07304 g007
Figure 8. Per-hectare soybean production costs by category.
Sustainability 17 07304 g008
Figure 9. Expected economic margins by region.
Sustainability 17 07304 g009
Table 1. Main worldwide soybean exporters, average 2021–2023.
Country/RegionQuantityMonetary ValueRanking 1
Metric Tons%USD × 1000%
Brazil88,970,60254.246,182,56152.31st
United States53,033,75132.330,006,35834.02nd
Canada4,419,1492.72,596,3172.93rd
Paraguay5,032,3493.12,541,9752.94th
Argentina3,777,8022.32,112,6352.45th
Uruguay1,869,6521.11,077,8511.26th
Ukraine2,211,8211.3922,6641.07th
Americas, all157,493,30296.084,730,11295.9---
World total164,080,587100.088,352,456100.0---
1 Position as the world’s exporters, according to monetary value. Source: FAOSTAT [3].
Table 2. Maximum potential area, average yield, and total production under six scenarios.
Tech. ChangeVariable 2USD/MT 310USD/MT 350USD/MT 400
No RentFull RentNo RentFull RentNo RentFull Rent
NoArea2.650.496.371.896.535.26
Yield2.783.432.502.962.492.54
Prod.7.41.715.95.616.213.4
Yes 1 Area6.463.416.536.396.596.53
Yield3.173.393.163.173.143.16
Prod.20.411.620.620.320.720.6
1 implies a 0.78% annual increase in average yields due to genetic and improved management. 2 Area: million hectares; yields: metric tons per hectare; production: million metric tons.
Table 3. Soybeans: maximum potential area, average yield, and total production under rotation, without rent, with full rent, and with rent according to land ownership.
VariablesSoybean Included in a Rotation 1
No RentFull RentLand Ownership 2
Area (million hectares)2.851.632.1
Yields (tons per hectare)3.173.393.3
Production (million tons)9.25.46.9
1 Frequency of soybeans in rotation: 67% in the first million hectares and 20% above one million. 2 Land ownership: 40% landowners (do not pay rent) and 60% tenants (pay rent).
Table 4. Maximum potential area (monocrop and under rotation), six price-technology scenarios.
TechnologyNo Technological ChangeWith Technological Change
Price levelUSD 310/MTUSD 310/MT
Rent 2No FullWeightedNo FullWeighted
Monocrop2.650.491.356.463.414.63
Rotation 11.330.670.932.851.632.12
Price levelUSD 350/MTUSD 350/MT
Rent 2No FullWeightedNo FullWeighted
Monocrop6.371.893.686.536.396.45
Rotation 12.821.031.742.882.832.85
Price levelUSD 400/MTUSD 400/MT
Rent 2No FullWeightedNo FullWeighted
Monocrop6.535.265.776.596.536.55
Rotation 12.882.372.582.912.882.89
1 Frequency of soybeans in rotation: 67% in the first million hectares and 40% above one million. 2 Land ownership in soybean area: 40% landowners (do not pay rent) and 60% tenants (pay rent).
Table 5. Maximum potential area, average yield, and total production considering climate change.
Climate ChangeVariable 3USD 310/MTUSD 350/MTUSD 400/MT
No RentFull RentNo RentFull RentNo RentFull Rent
No 1Area2.650.496.371.896.535.26
Yield2.783.432.502.962.492.54
Prod.7.41.715.95.616.213.4
Yes 2Area2.680.506.211.926.365.09
Yield2.773.362.502.952.492.55
Prod.7.41.715.65.615.813.0
1 Same as no technological change in Table 2. 2 Applying RPC 8.5 BAU scenario, CCSM4. 3 Area: million hectares; yields: metric tons per hectare; production: million metric tons.
Disclaimer/Publisher’s Note: The statements, opinions and data contained in all publications are solely those of the individual author(s) and contributor(s) and not of MDPI and/or the editor(s). MDPI and/or the editor(s) disclaim responsibility for any injury to people or property resulting from any ideas, methods, instructions or products referred to in the content.