3.1. Research Framework
Drawing on the definition of the concept of green transformation by the Institute of Industrial Economics of the Chinese Academy of Social Sciences [
25], it is considered that green transformation is oriented towards the intensive use of resources and environmental friendliness, with green innovation at its core, adhering to the road of new industrialization, realizing the greening of the entire process of industrial production, sustainable development, and obtaining a win–win situation in terms of both economic and environmental benefits. Green transformation is not a simple static process, but a complex dynamic process involving innovative technologies, production factors, product structure, and other dimensions, the essence of which is to adopt new technologies, new ideas, and new systems to promote the overall improvement of resource allocation, innovation level, and organizational efficiency [
26]. At present, many views in the academic community suggest that the key to promoting green transformation of enterprises lies in improving their ability and willingness for green transformation [
15]. Therefore, combined with previous research [
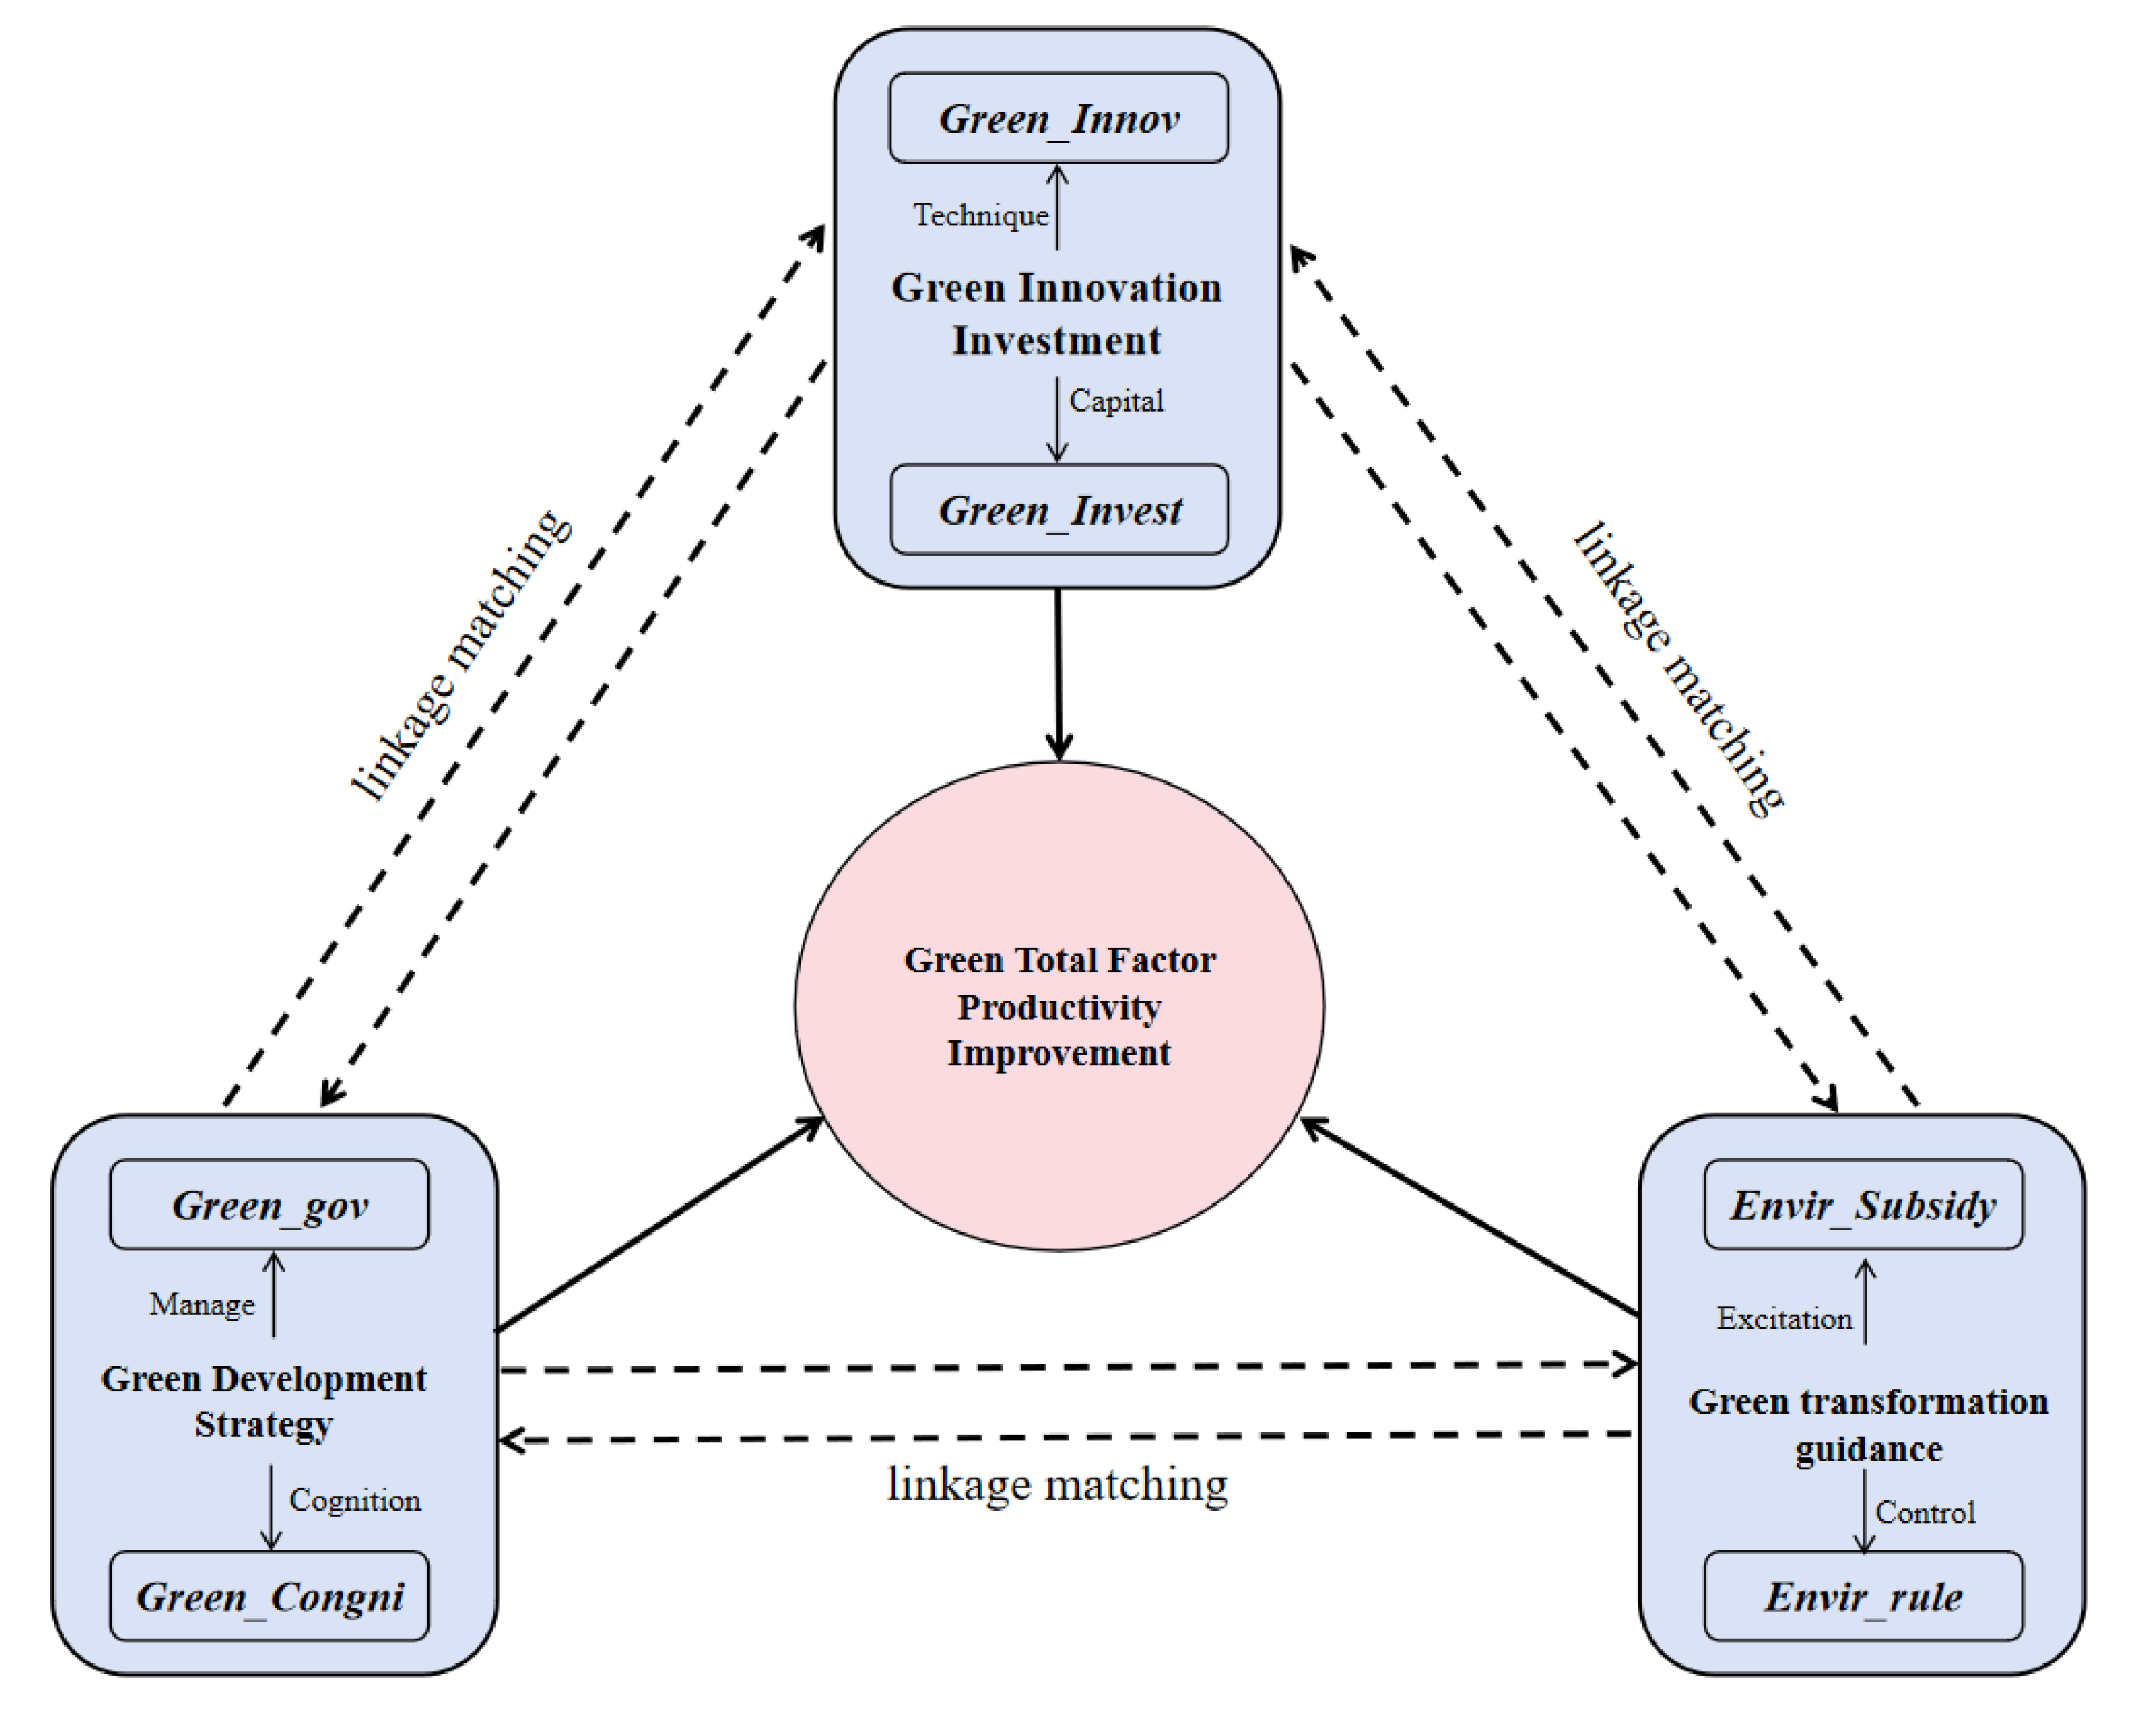
27], with green development as the goal, green innovation as the driving force, and green regulation as the guideline, this research framework is constructed from the three dimensions of green development strategy, green innovation inputs, and external guidance for green transformation. Among these, green innovation input is divided into green technology innovation (
Green_Innov) and green investment (
Green_Invest) from the perspectives of capital and technology; green development strategy is divided into green governance level (
Green_gov) and green cognition (
Green_Congni) from the perspectives of management and cognition; and green transformation guidance is divided into environmental subsidies (
Enviral_Subsidy) from the perspectives of incentives and regulation, divided into environmental subsidies (
Envir_Subsidy) and environmental regulations (
Envir_rule). The research framework of green total factor productivity improvement in the context of green transformation of resource-based enterprises is shown in
Figure 1.
3.2. Research Methodology
- (1)
Panel Data QCA
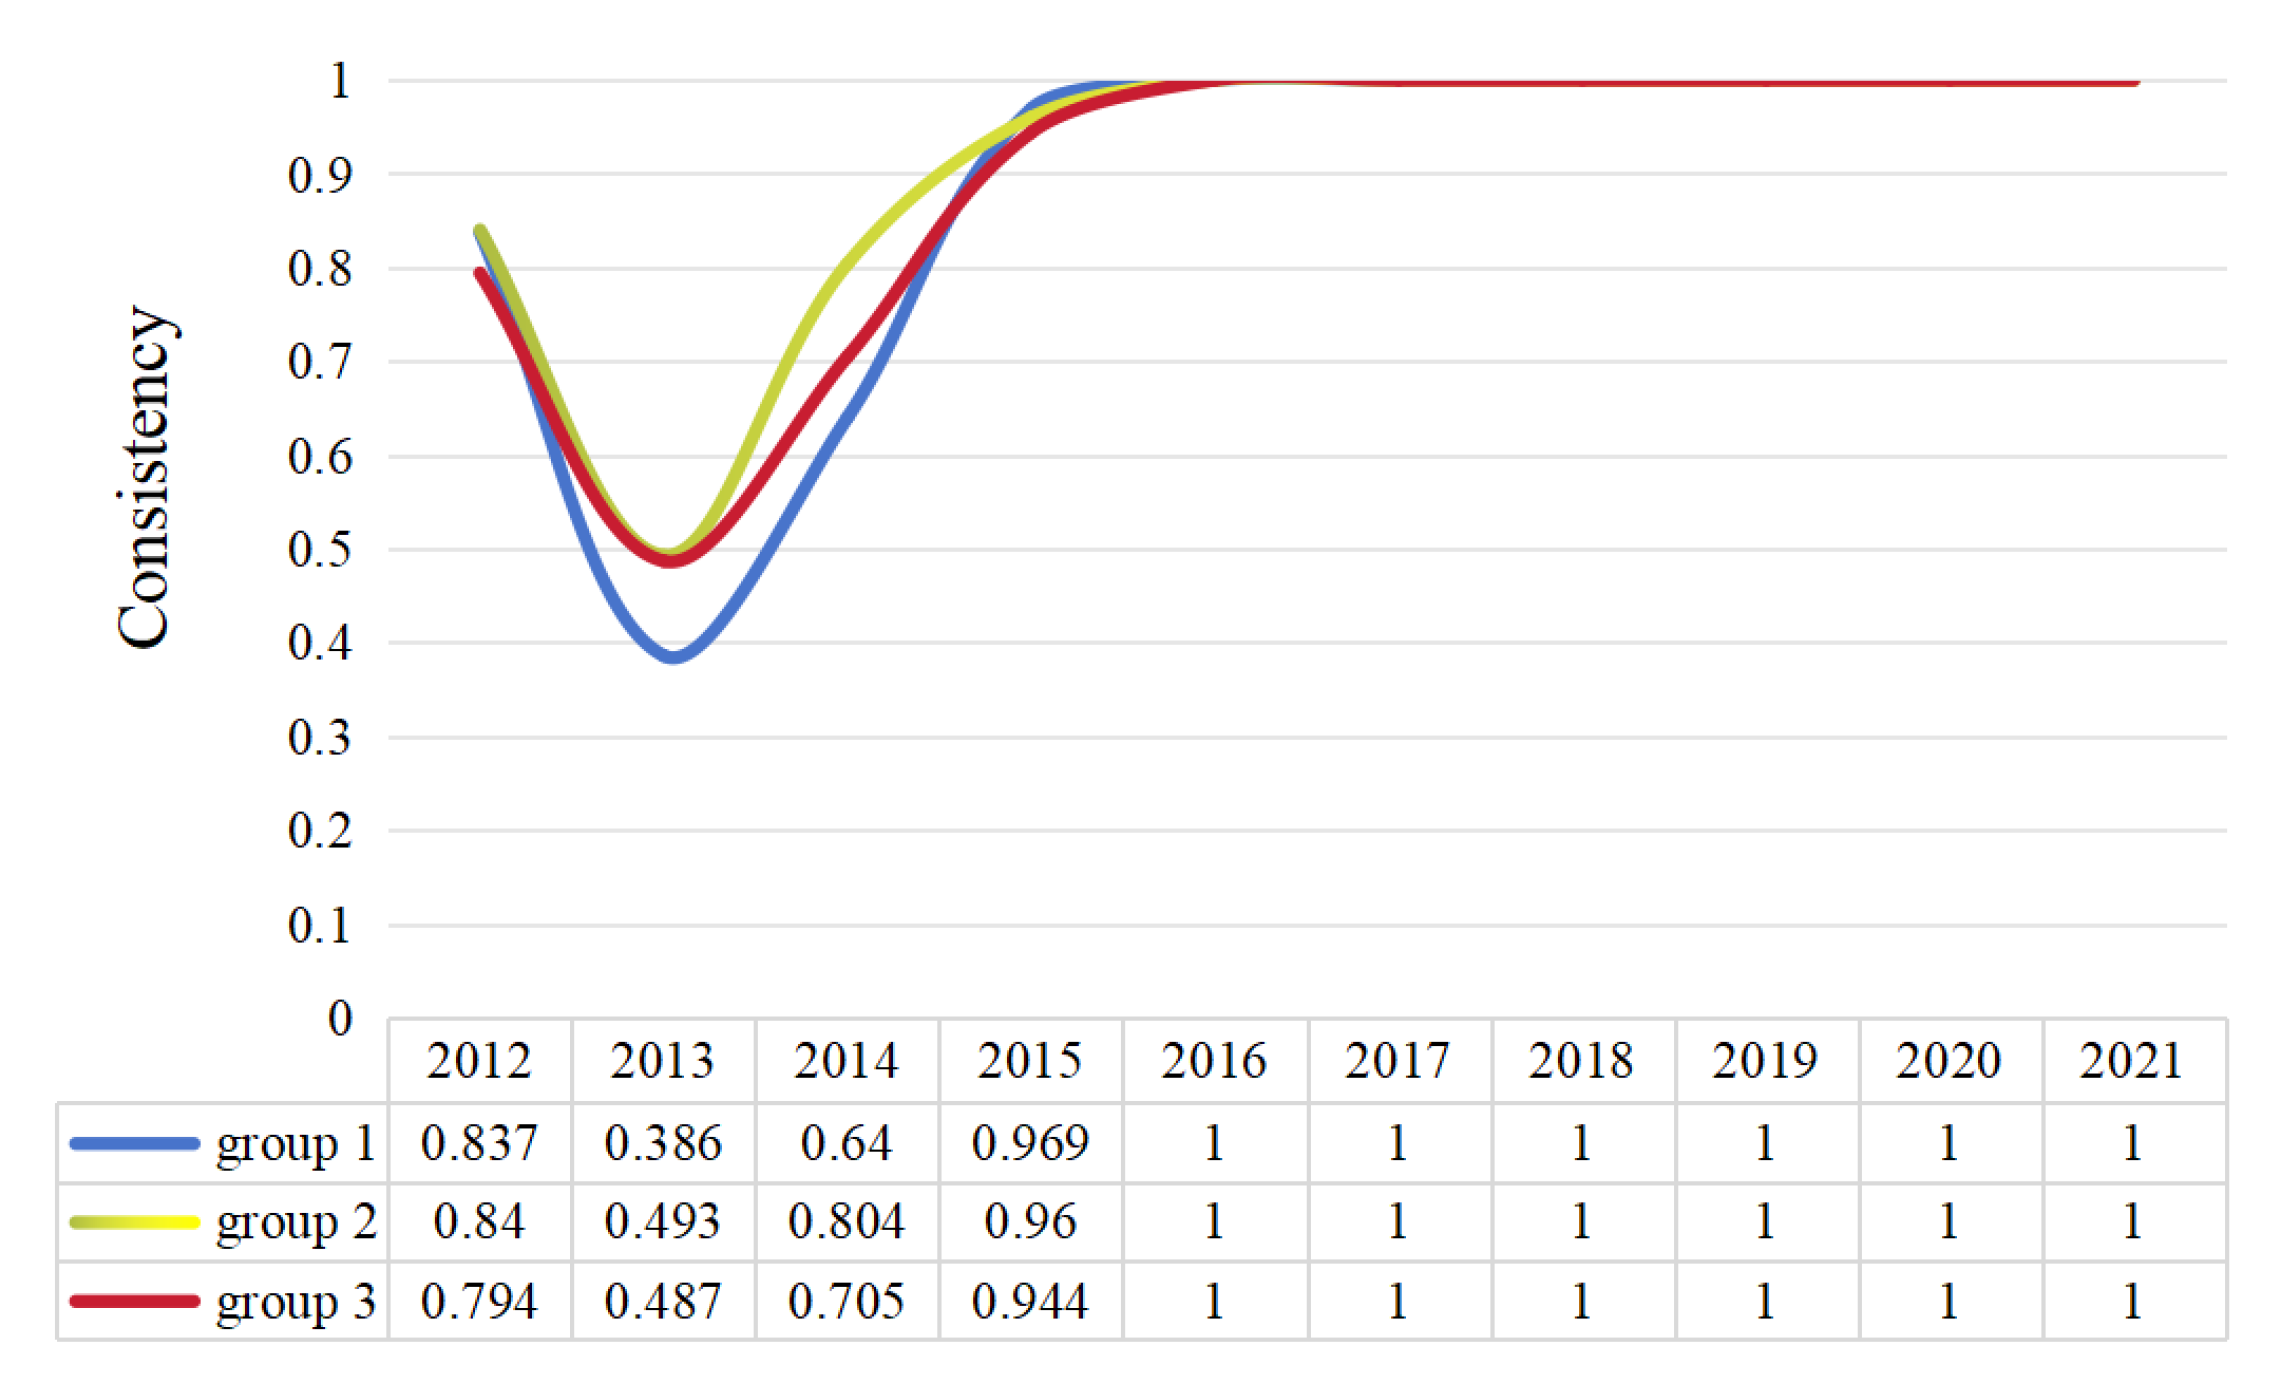
Panel data-based dynamic qualitative comparative analysis (PD-QCA), also called dynamic QCA, is a more cutting-edge research method within the field of QCA methodology. Distinguished from traditional non-dynamic QCA and econometric methods based on statistical theory as the mathematical foundation, PD-QCA takes set theory as the mathematical foundation, introduces the idea of ecological evolution and coupling, and runs in the R language environment to realize dynamic analysis. Green total factor productivity enhancement of resource-based enterprises is a multifactor concurrent coupling problem. Introducing the perspective of grouping through the PD-QCA method can allow us to explore the grouping effect formed by the intertwined action of multiple factors, and find the minimum sufficiency condition by running in the R language environment. Using panel data to analyze the dynamic evolution process of group states can break the shackles of QCA methodology cross-section data, creatively demonstrate the different changes in multiple group states in continuous time from the three dimensions of between, within, and pooled, empirically study the panel data, and, through the “Between Consistency Adjustment Distance and Within Consistency Adjustment Distance”, reflect individual and temporal differences in consistency.
- (2)
Necessary condition analysis
Necessary condition analysis (NCA) is a methodology for assessing causality and determining the significance of the impact of certain variables in a given outcome. QCA, although it involves necessary condition analysis (NCA), is unable to answer questions such as the degree of necessity of conditions, i.e., “to what extent are the conditions of the green transition binding green total factor productivity” or “constraining green total factor productivity”. NCA not only identifies the necessary conditions, but also further analyzes the intensity of the conditions’ impact on the outcomes and the thresholds required to achieve the goals, which can help researchers to more accurately grasp the key drivers and enhance the causal inferences. NCA employs Ceiling Regression (CR) and Ceiling Envelopment (CE) analyses to deal with sample variables, combining the necessity effect value and its significance (p-value) to determine the necessary conditions, and measuring the degree of necessity of the conditions in terms of the bottleneck level. Therefore, in studies involving complex social phenomena and policy evaluation, NCA can serve as an effective complement to QCA necessity conditions, providing new insights that cannot be found by traditional QCA methods.
- (3)
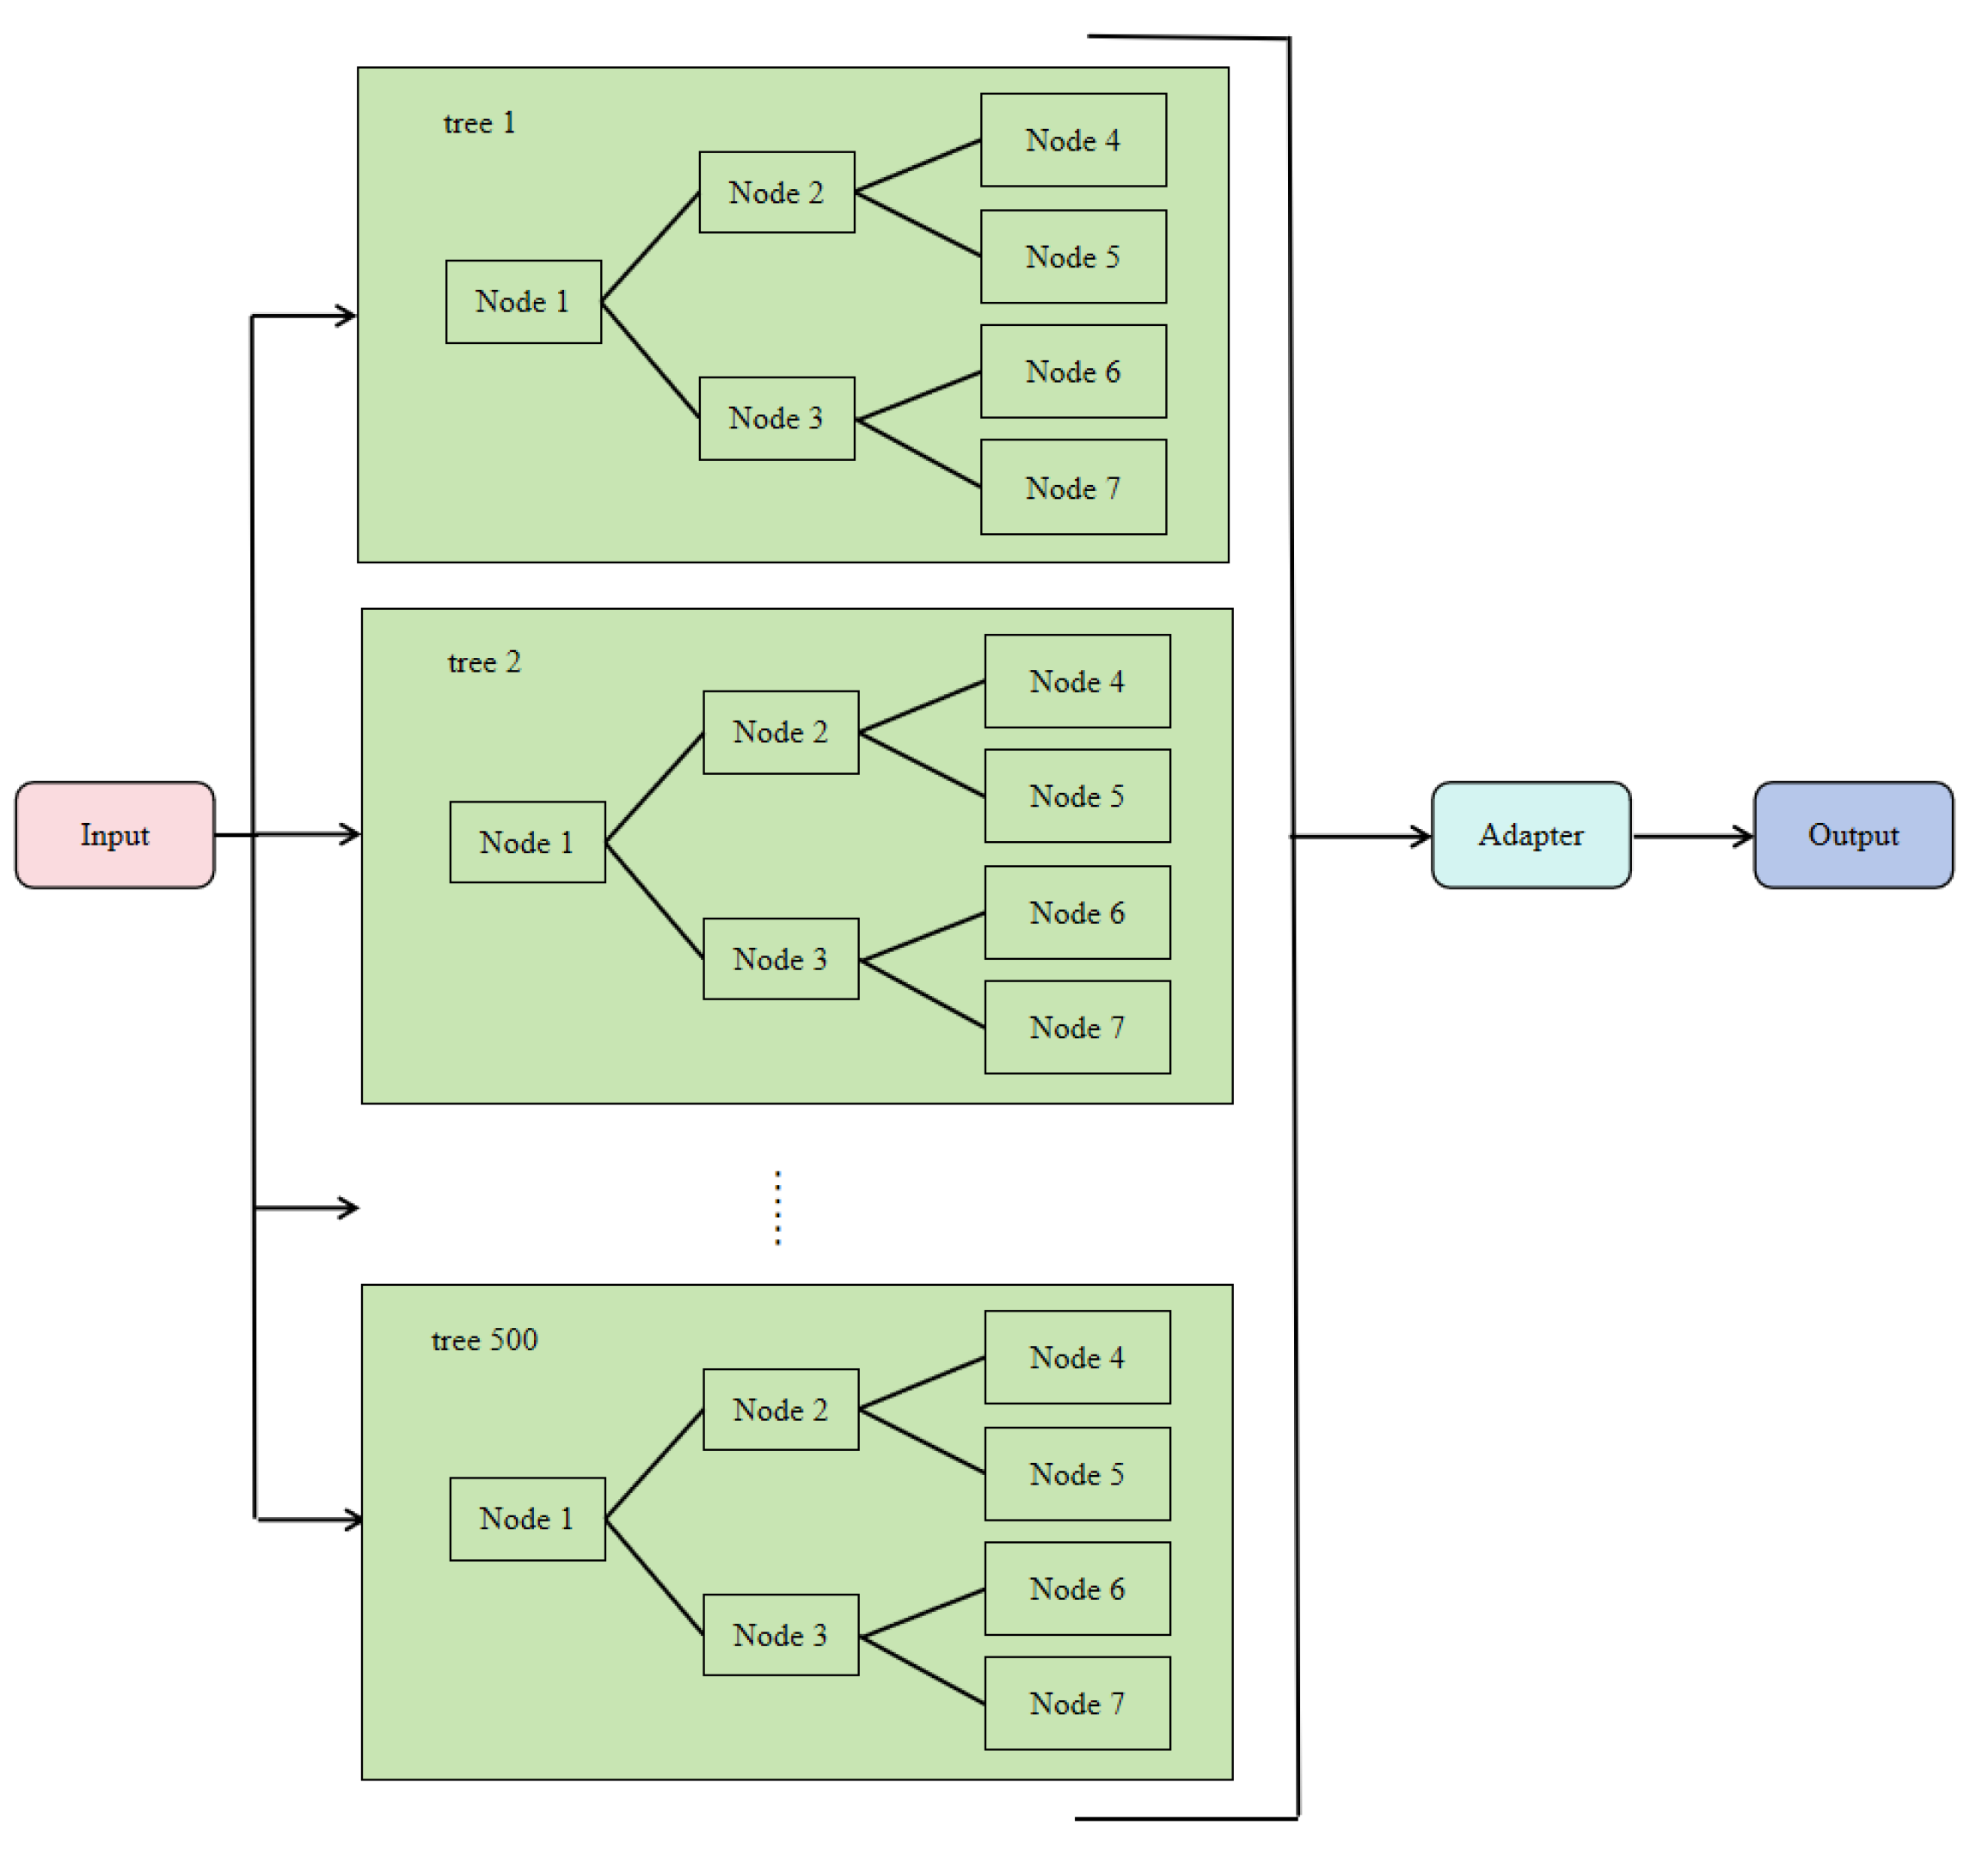
Random Forest Algorithm
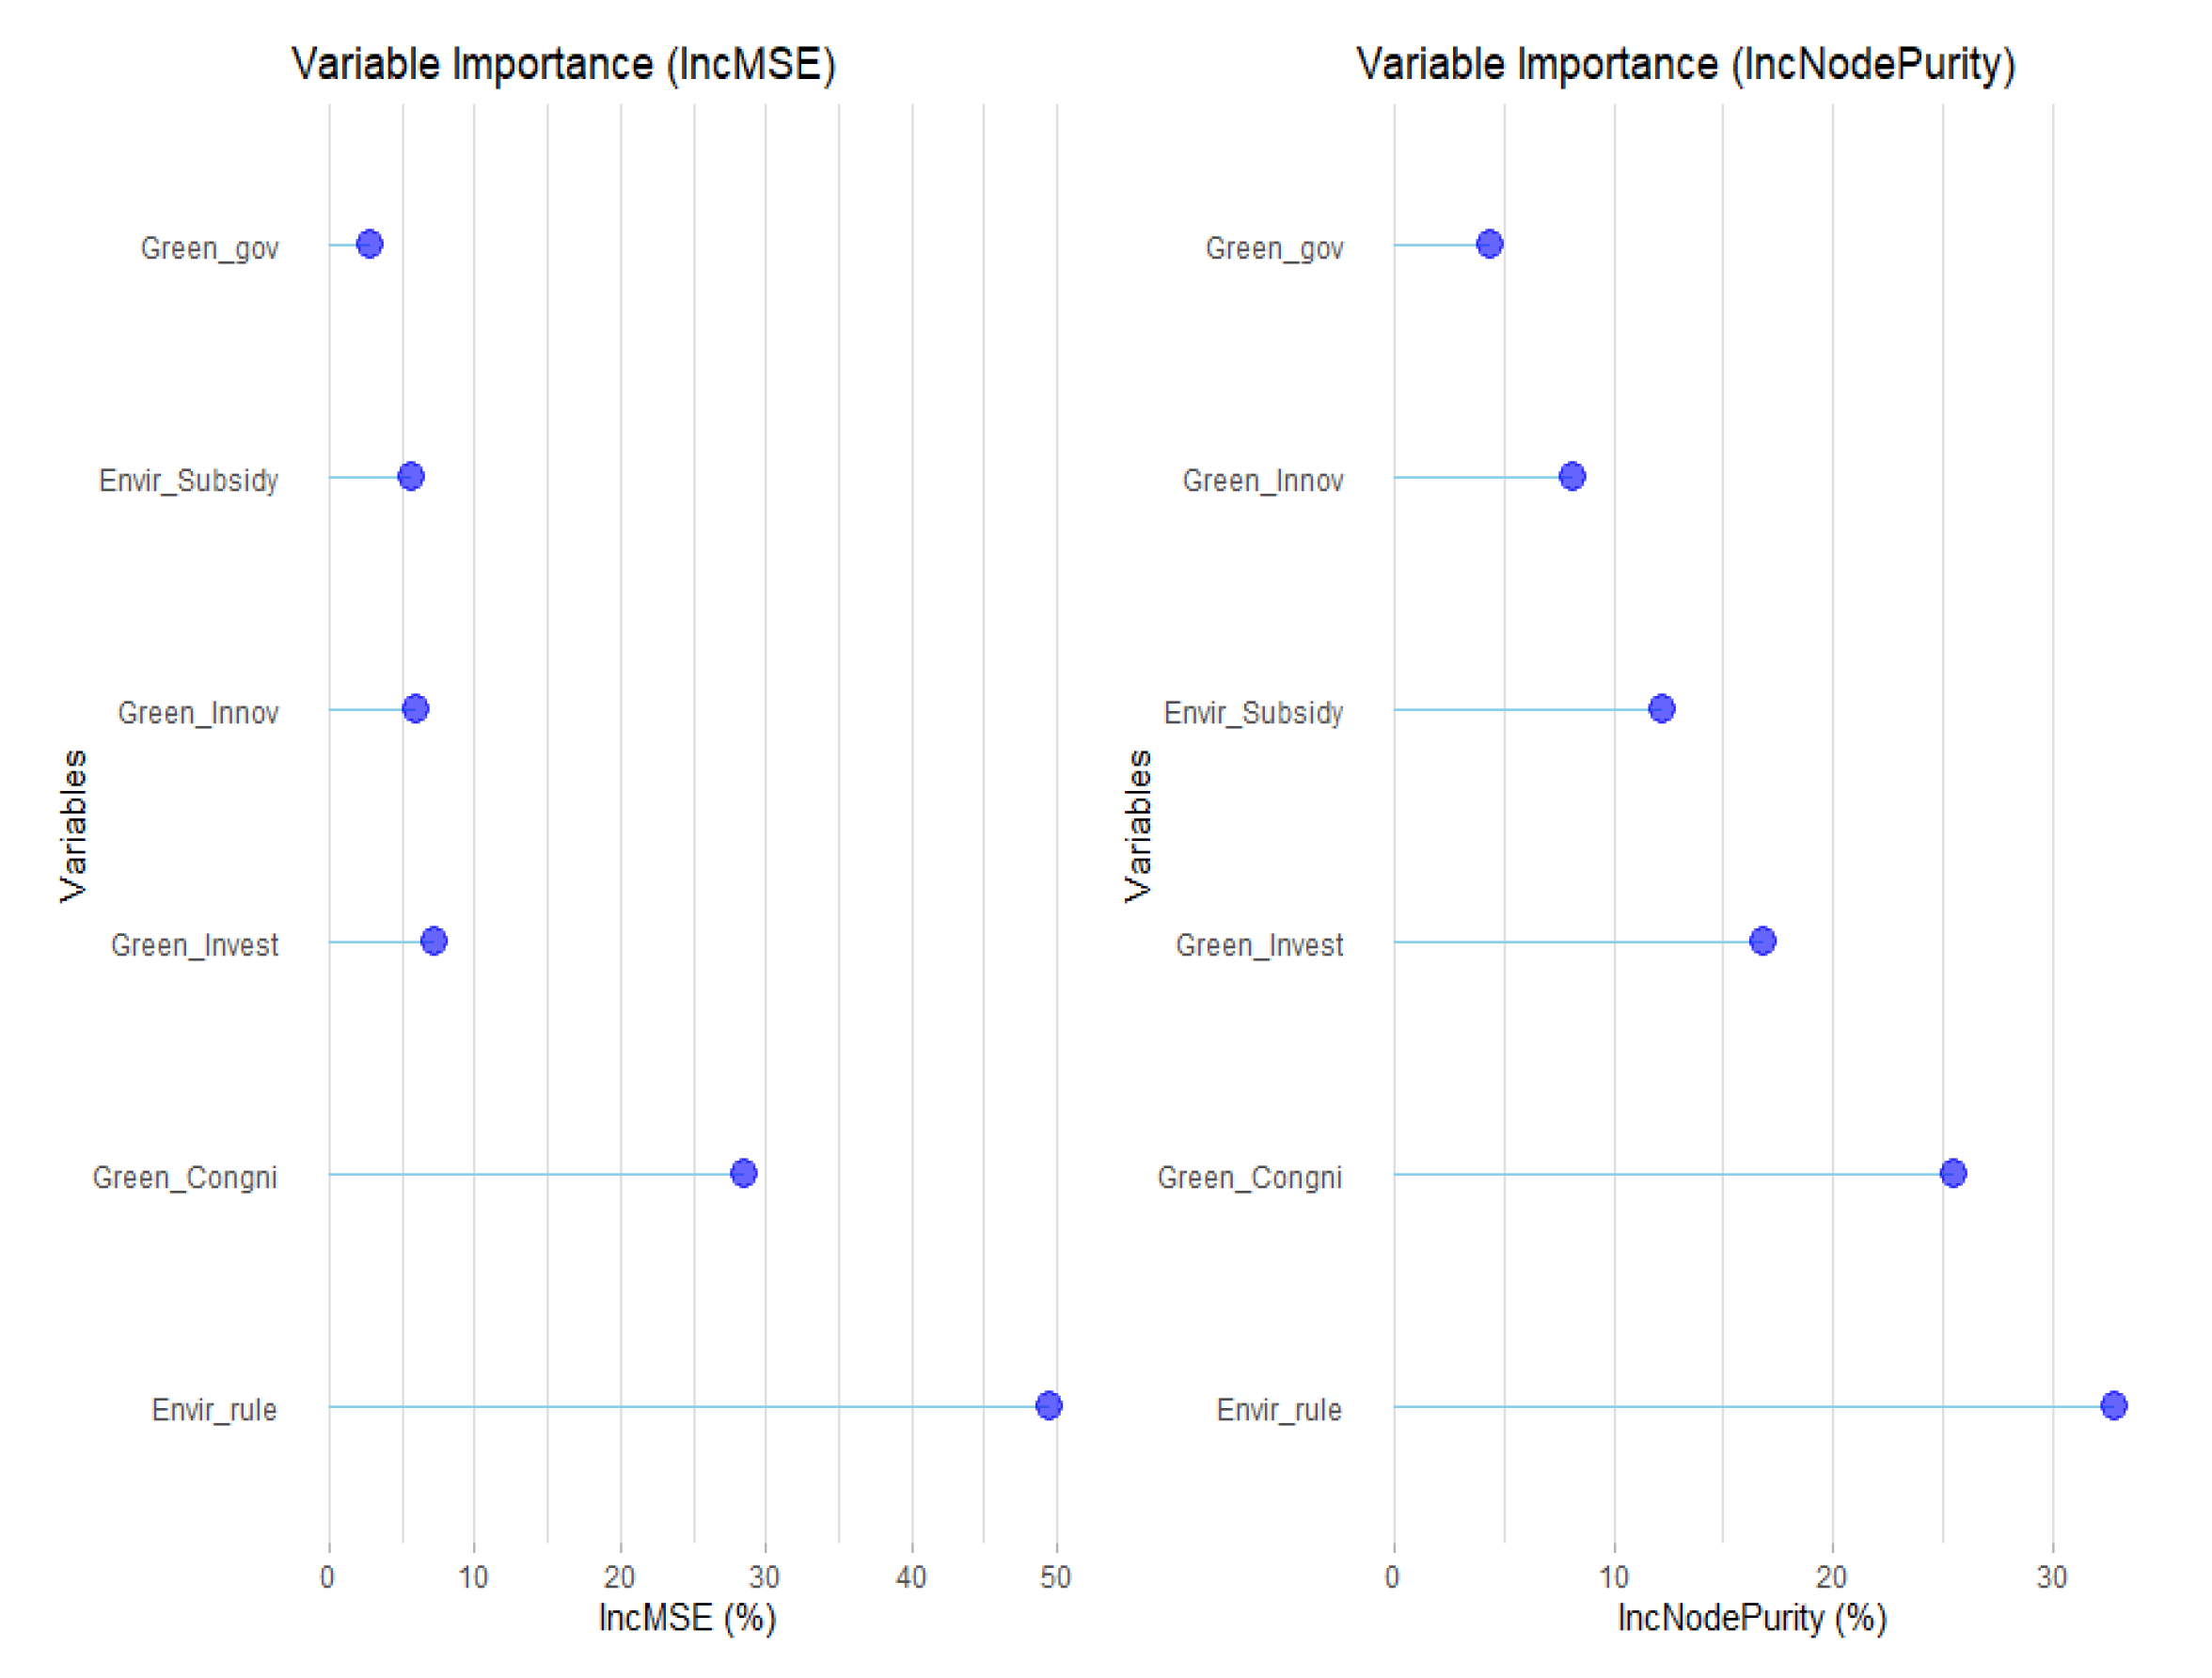
Random forest (RF) is a proposed machine learning algorithm based on decision trees and integrated learning that has the ability to influence factor importance assessment and identify factors that significantly affect output results. The random forest model realizes the assessment of the importance of influencing factors by constructing multiple decision trees and training them based on different subsets of features. The influence mechanism of the green transformation process of resource-based enterprises on the improvement of green total factor productivity is complex. With the help of the random forest model, research and analysis can scientifically and accurately explore the mechanism of different factors and capture the nonlinear relationship between independent variables and dependent variables, which is crucial in the study of the green transformation process involving multiple complex internal and external factors. In addition, in reality, data are often subject to various disturbances, while random forests are robust to outliers and noise, meaning that errors and fluctuations in the actual data will not significantly affect the final results. Random forests can effectively handle high-dimensional data, and discover a large number of variables and complex nonlinear interactions among them. Thus, this model effectively supplements the QCA method.
3.3. Variables and Measures
Green cognition (
Green_Congni) refers to knowledge systems and cognition of resources and the environment formed by enterprises on the basis of their understanding of resource and environmental issues [
28]. Such cognition reflects managers’ perception and understanding of resource and environmental issues based on their own knowledge structure and values when assuming responsibility for resource conservation and environmental protection. The green cognition of an enterprise determines, to a certain extent, whether the enterprise is able to make a sustainable green transformation, and it also promotes the innovation of green management methods within the enterprise, thus promoting the improvement of green total factor productivity. The wording of “Management Discussion and Analysis” in the annual report can largely reflect the future outlook of the enterprise and the strategic characteristics it implements, as well as the business philosophy it upholds and the development path guided by this philosophy. We referred to [
29,
30], who conducted a study using machine learning text analysis to analyze and measure the “management discussion and Analysis” in annual reports.
Environmental subsidies (
Envir_Subsidy) are compensatory or incentivized financial support provided by the government to promote the active participation of enterprises in environmental governance, controlling pollutant emissions, and reducing environmental pollution, or encouraging them to improve their products and processing techniques to enhance resource efficiency [
31]. Referring to the previous study [
32], the government environmental subsidies were measured by dividing the number of government environmental subsidies by the proportion of the total assets of the enterprise and then multiplying it by 100 based on the details of government subsidy items in the notes of the annual report disclosed by the enterprise.
Green technological innovation (
Green_Innov) refers to technological innovation that effectively reduces environmental loads, reduces resource consumption, and improves resource utilization efficiency [
33]. In order to promote the international exchange and transformation of green technology patents and provide a standardized basis for domestic green patent identification, four departments of China’s National Development and Reform Commission (NDRC), the Ministry of Science and Technology (MOST), the Ministry of Industry and Information Technology (MIIT), and the Ministry of Ecology and Environment (MOE) issued the Catalogue for the Promotion of Green Technology (CPGT) in 2020, and the State Intellectual Property Office (SIPO) issued the Classification System of Patents on Green Technology (CSGT) in 2023. Green technology innovation not only optimizes production processes, reduces costs, improves product quality, and enhances market competitiveness, but it also helps enterprises achieve the unity of economic, social, and environmental benefits [
34]. Drawing on [
35], this study measures firms’ green innovation capabilities through their number of green patent applications. The reason for using the number of patent applications rather than the number of patent authorizations is that patent authorizations need to go through testing and require paying annual fees, and there are many non-technical factors such as administrative approval that interfere. However, patent technology is very likely to have an impact on enterprise performance at the application stage. Therefore, patent application data can reflect the level of innovation more reliably and promptly than authorization data.
Green governance (
Green_gov) refers to the management capability of enterprises in environmental protection and sustainable development, including monitoring and assessing the impact of production activities on environmental quality, responding quickly to environmental emergencies, and taking measures to mitigate damage. The level of green governance reflects an enterprise’s ability to respond to environmental emergencies, and its level of disposal and its strength or weakness have a bearing on the effectiveness of environmental protection and the realization of sustainable development [
36]. The impact of an enterprise’s level of green governance on green total factor productivity is mainly focused on environmental risk management and reducing compliance costs. A higher level of green governance can help enterprises to identify and assess environmental risks, reduce potential environmental damages through preventive measures, avoid increased costs due to environmental problems, and reduce fines due to non-compliance, thus enhancing green total factor productivity. Referring to [
37], the Janis–Fadner coefficient (J-F coefficient) was applied to measure the level of green governance based on the positive and negative scores obtained by the company in green governance. The specific formula is as follows:
where
is the positive score for the level of green governance, which is scored based on the number of items that the sample company meets in the positive score criteria, with each item counting for one point;
is the negative score for the level of green governance, which is based on the number of items that the sample company meets in the negative score criterion, with each item being scored as −1; and
is the sum of the absolute values of
and
; that is,
=
+
.
Environmental regulation (
Envir_rule) mainly refers to command-and-control environmental regulation, which is a type of government intervention based on administrative rather than market instruments [
38] and considers that the number of policies does not directly reflect the intensity of implementation and that there are differences in per capita income levels between regions, which have a nonlinear relationship with environmental control. In addition, the unit pollution emissions of different products are also affected by their heterogeneity. This study focuses more on environmental control, so we chose to measure the intensity of environmental control by the proportion of funds invested in controlling three types of waste pollution in the region where the listed company is located in that year to the industrial output value of that year [
39].
Green investment (
Green_Invest) refers to the investment in environmental governance, environmental protection inputs, green technological transformation, innovation, etc. by enterprises in order to reduce environmental costs and improve environmental performance [
40]. Referring to the study by [
41], in the annual reports of listed companies in resource-based enterprises, the expenditure items directly related to environmental protection, including desulfurization, denitrification, wastewater treatment, exhaust gas treatment, dust removal, and energy conservation, were extracted as the detailed items of the construction-in-progress account, and the data were summarized to obtain the increase in the enterprises’ environmental protection investment in the current year. In order to control for the effect of differences in company size, the total assets of enterprises at the end of the year are standardized to facilitate the analysis of their environmental protection investment. At the same time, in order to enhance the readability of the subsequent regression coefficients, the standardized environmental protection investment data are multiplied by 100 for processing.
Green total factor productivity (
GTFP) makes up for the shortcomings of TFP in environmental pollution and ensures that the evaluation results are more in line with the concepts of sustainable development and green development. In analyzing the relationship between inputs, desired outputs, and undesired outputs, the concept of green total factor productivity has clear advantages over traditional total factor productivity [
42]. This paper draws on [
17] to solve the directional distance function for the non-radial slack-based measure (SBM) in conjunction with the non-expected output SBM model. The Undesired Output SBM model is a Data Envelopment Analysis (DEA) modeling approach for measuring relative efficiency and is suitable for situations where undesired outputs (e.g., environmental pollution) are considered. The basic form of this model is set up with n decision units (DMUs). The inputs and outputs of each DMU are defined as, respectively, input vectors:
; the expected output vector:
; and the non-expected output vector:
. In the mathematical expression of the SBM model for the kth decision-making unit (DMU_k), its efficiency can be solved by the following linear programming:
When
< 1, or
are not all 0, decision-making units are weakly effective; there is a loss of efficiency, which suggests that there is room for improvement in the input–output ratio at this point. Input inefficiencies and output inefficiencies are expressed as
where
represents the efficiency level of the DMU, with a value between 0 and 1;
denotes the weight of each DMU on the target DMUs; and
AAA denotes slack variables for inputs, desired outputs, and undesired outputs, respectively. The input and output indicators of green total factor productivity are shown in
Table 1, where the undesired outputs are converted using the industrial sulfur dioxide, industrial wastewater, and industrial soot emissions of the enterprise in the city where it is located [
43].
