Article

Biofilm-Based Biomonitoring of Treated Wastewater Using Bacillus thuringiensis: Toward Sustainable Water Reuse

by
Bidisha Sengupta
1,*,
Olabisi Ogunlewe
1,
Robert Friedfeld
2,
Cephus Bess-Grunewald
1,
Philip Baker
1 and
Kefa Onchoke
1
1
Department of Chemistry and Biochemistry, Stephen F. Austin State University, The University of Texas System, Nacogdoches, TX 75962, USA
2
Department of Physics, Engineering and Astronomy, Stephen F. Austin State University, The University of Texas System, Nacogdoches, TX 75962, USA
*
Author to whom correspondence should be addressed.
Sustainability 2025, 17(16), 7272; https://doi.org/10.3390/su17167272
Submission received: 1 July 2025 / Revised: 1 August 2025 / Accepted: 10 August 2025 / Published: 12 August 2025
(This article belongs to the Special Issue Sustainable Wastewater Management)

Abstract

Ensuring the safe reuse or discharge of treated wastewater is critical to achieving environmental sustainability, particularly in regions facing growing water stress. This study introduces a biological approach using Bacillus thuringiensis (Bt) biofilm formation as an indicator of treated wastewater quality from three wastewater treatment plants (WWTPs) in Deep East Texas. Treated wastewater samples were collected from chlorine and sulfur dioxide treatment stages at WWTPs in Nacogdoches, San Augustine, and San Jacinto counties. We assessed biofilm development through optical density and scanning electron microscopy (SEM) and evaluated changes in key anions (F, Cl, NO2, Br, NO3, PO43−, and SO42−) using ion chromatography (IC). A two-tailed Student’s t-test was used to evaluate statistical significance (p ≤ 0.05). Remarkably, biofilm formation occurred in all samples, including those treated with chemical disinfectants, suggesting that microbial activity can still occur post-disinfection. Ion shifts, particularly the depletion of F, NO3, and SO42− and the release of Cl, NO2, and PO43−, highlighted active microbial processes. These findings suggest that Bt biofilms can serve as sensitive, low-cost tools to monitor treated wastewater, offering critical insights into potential reuse risks and supporting more sustainable water management.

Graphical Abstract

1. Introduction

Sustainable water management increasingly depends on the safe and effective reuse of treated municipal wastewater, particularly in regions where freshwater resources are under pressure. As the demand for clean water rises globally, treated effluent is seen no longer solely as a byproduct but as a potential resource for agricultural irrigation, industrial processes, and ecological restoration efforts [1,2]. However, the success of water reuse strategies hinges on the reliability of both treatment and monitoring systems to ensure that discharged or repurposed water is safe for human and environmental exposure.
Wastewater treatment plants (WWTPs) are designed to remove a wide range of contaminants through a series of physical, chemical, and biological processes. These typically include preliminary screening, primary sedimentation, secondary biological treatment, and, in some cases, tertiary treatment steps such as nutrient removal or membrane filtration [3,4]. Disinfection is commonly applied at the final stage to reduce pathogenic microorganisms before effluent discharge or reuse. Numerous studies have examined the removal efficiencies of physicochemical parameters (including total suspended solids (TSS) and chemical and biological oxygen demand (COD and BOD)), along with a range of anion-, metal-, and inorganic-based pollutants, by WWTPs [5,6,7,8]. These investigations often also look at the lingering risks to aquatic life, especially fish, posed by metals and other residual compounds that can remain even after treatment [9].
WWTPs in the Deep East Texas region were intentionally selected for this study due to their representative rural character, decentralized infrastructure, and socio-environmental relevance. This region is predominantly rural, with small municipalities and utility districts operating under constrained resources—conditions that mirror those found in many rural communities globally [10]. Unlike metropolitan systems, which benefit from high-capacity centralized treatment and advanced technological integration, rural WWTPs often operate at lower capacities, with aging infrastructure and limited funding for upgrades [11]. Yet, they remain critical for safeguarding local water quality, public health, and ecological balance.
By examining WWTPs in Deep East Texas, we gain insight into how small-scale facilities adapt to these constraints while maintaining essential pollutant removal functions, such as reducing BOD, TSS, nutrients, and pathogens. Moreover, these plants are embedded in ecologically sensitive watersheds, where untreated or under-treated effluents can quickly impact downstream aquatic systems and human water use. Studying their performance under real-world limitations provides valuable, scalable lessons for other rural and semi-rural areas worldwide, particularly in how bioaugmentation or cost-effective microbial interventions (such as using Bacillus thuringiensis) can enhance treatment efficacy without major capital investment [12,13,14]. Hence, Deep East Texas WWTPs serve not only as a testbed for low-cost innovations but also as practical models of sustainable operation under rural constraints—helping bridge the gap between environmental engineering research and the infrastructural realities of under-resourced communities.
Bacillus thuringiensis (Bt), a well-characterized, environmentally resilient, and non-pathogenic bacterium, offers a robust platform for biofilm formation under diverse environmental conditions [15]. In this study, we utilized Bt-based biofilms as sensitive biological probes to evaluate contaminant levels in influent and effluent water from WWTPs in Deep East Texas. The rationale for this selection lies in Bt’s innate capacity to adsorb and respond to a wide spectrum of physicochemical stressors, including heavy metals, residual nutrients, and organic pollutants. Biofilms inherently amplify microbe–environment interactions, making them ideal for capturing subtle shifts in contaminant profiles that may escape conventional monitoring. Given the regional variability in treatment efficacy and the ecological vulnerability of Deep East Texas water systems, Bt biofilms served as an effective biological matrix to assess the persistence, transformation, or partial removal of pollutants through the treatment process. This approach aligns with current trends in using biofilm-based biosensors for real-time, integrative environmental monitoring.
Current monitoring efforts often focus on chemical and microbiological parameters such as nitrogen and phosphorus levels, BOD, TSS, and coliform bacteria counts [3,16]. However, these conventional metrics provide only a snapshot of treatment efficacy and may not fully reflect residual microbial activity or long-term microbial resilience, particularly after disinfection [17]. Biofilms—structured communities of microbial cells embedded in a self-produced extracellular polymeric matrix—are increasingly recognized as sensitive and integrative bioindicators of water quality [18]. Biofilm development is influenced by nutrient availability, surface conditions, and environmental stressors, making them useful tools for monitoring post-treatment ecological impacts.
While biofilms have valuable applications in environmental monitoring, they also raise serious concerns for public health. The extracellular matrix of a biofilm protects bacteria from chemical disinfectants and antibiotics, allowing opportunistic pathogens like Pseudomonas aeruginosa and Legionella pneumophila to persist in treated water systems [19,20,21]. In addition to harboring pathogens, biofilms can act as hotspots for horizontal gene transfer, including the spread of antibiotic resistance genes. They also contribute to biofouling, leading to increased chlorine demand, clogged filters, corrosion in pipelines, and higher maintenance costs in distribution networks [18,22]. Given these challenges, monitoring biofilm behavior in treated wastewater is essential not only for ensuring environmental compliance but also for protecting public health in systems designed for water reuse.
We hypothesized that if Bt could form biofilms in chemically disinfected effluent, it would indicate that conventional monitoring methods might underestimate residual biological activity. To test this, we exposed Bt to treated wastewater from three WWTPs in East Texas located in Nacogdoches, San Augustine, and San Jacinto counties. Its strong biofilm-forming capacity enabled us to monitor environmental responses to treated water. Biofilm formation was assessed using microscopy and quantified ion exchanges via ion chromatography. Special emphasis was placed on tracking changes in anion concentrations (F, NO2, SO42−, Cl, Br, NO3, and PO43−) before and after biofilm formation to explore how microbial processes interact with water chemistry. This integrative approach offers a low-cost, scalable, and biologically relevant method for assessing treated wastewater quality. It supports global sustainability goals by improving our ability to monitor microbial resilience, nutrient dynamics, and potential environmental impacts associated with effluent reuse.

2. Materials and Methods

2.1. Sample Collection

Treated wastewater samples were collected from three counties: Nacogdoches, San Augustine, and San Jacinto, Texas. Samples were taken from the chemical disinfection stages in each wastewater treatment plant during the months of April through June of 2024. In Nacogdoches and San Jacinto, samples were collected from both the chlorine and sulfur dioxide contact chambers. In San Augustine WWTP, only chlorine is used for treatment; thus, samples were obtained solely from the chlorine contact chamber. In addition, sterilized deionized water (ST) and tap water (TW) samples were gathered for control studies for comparative analysis alongside the treated wastewater samples from the WWTPs. TW was collected from a running faucet in the Biochemistry Laboratory at Stephen F. Austin State University, Nacogdoches, Texas, USA, after the tap was allowed to run continuously for 10 min. To prevent external contamination, the tap and surrounding work area were thoroughly disinfected with 75% isopropanol prior to sample collection.
To characterize the water quality of the collected samples, key physicochemical parameters were compiled from routine monitoring data provided by the wastewater treatment facilities for the months of April through August 2024. These parameters included carbonaceous biochemical oxygen demand (CBOD), chemical oxygen demand (COD), total suspended solids (TSS), dissolved oxygen (DO), ammonia-nitrogen (NH3–N), and pH for both the influent and effluent stages of treatment. The summary of average values, standard deviations, and removal efficiencies is presented in Table 1, alongside corresponding U.S. EPA effluent standards for contextual comparison.

2.2. Preparation of Bacillus thuringiensis Culture

Bacillus thuringiensis (Bt) ATCC 33679 (Lot No. 70032312) was obtained from the American Type Culture Collection (ATCC). Bt belongs to the bacillus family and is known to be friendly to the environment. A 2% solution of Luria–Bertani broth (LB, obtained from Research Products International (RPI)) was used to grow Bt at 37 °C with shaking at 109 rpm (revolutions per minute) to ensure uniform growth. Spectroscopic analysis of the optical density at 600 nm (OD600) is a widely used method for estimating bacterial growth and biomass in culture, as it provides a rapid and non-destructive measure of cell density based on light scattering by bacterial cells suspended in liquid media [24].
To initiate biofilm formation, Bacillus thuringiensis (Bt) cultures were first grown overnight in Luria–Bertani (LB) broth to reach an OD600 of ~0.9 ± 1 at 600 nm, indicating the late exponential phase [25,26]. This stage was selected to standardize the inoculum for all biofilm experiments.

2.3. Biofilm Formation Assay

In order to initiate biofilm growth under controlled, low-density conditions, overnight Bt cultures were diluted to OD600 ≈ 0.03 in LB mixed 1:1 with each of the seven water samples as given below:
(i)
Sterilized deionized water (ST);
(ii)
Tap water (TW);
(iii)
San Augustine Cl2-treated wastewater (SAC);
(iv)
Nacogdoches Cl2-treated wastewater (NC);
(v)
Nacogdoches SO2-treated wastewater (NS);
(vi)
San Jacinto Cl2-treated wastewater (SJC);
(vii)
San Jacinto SO2-treated wastewater (SJS).
For each condition, 3 mL of the diluted bacterial suspension was added to sterile Petri dishes (60 mm × 15 mm) containing sterile mica disks as the surface for biofilm attachment. Cultures were incubated statically at 37 °C for 24 h to promote surface-associated biofilm growth allowing for the observation of initial attachment and structured biofilm development.
This 50:50 (v/v) ratio was selected to maintain minimal but consistent nutrient levels that allowed controlled biofilm development without overwhelming the influence of the water matrix. The ST sample (sterilized deionized water) was used as the negative control, while tap water (TW) served as the positive control. In addition, 100% LB medium and each water sample were tested without Bacillus thuringiensis (Bt) to confirm that the observed biofilm structures were attributable solely to Bt activity. All water samples tested without Bt were also screened for background microbial contamination and found to be free of any detectable microbial presence.

2.4. Microscopy Analysis

After incubation, biofilm-covered mica discs were examined by scanning electron microscopy (SEM), which employs a focused beam of high-energy electrons to interact with the surface of specimens, providing detailed topographical and morphological information at nanometer-scale resolution [27]. SEM was performed using a JEOL JSM-6100 system at a working distance of 15 mm, accelerating voltage of 20 kV, filament current of ≈2 Amps, and emission current of ≈200 µAmps. Vertical and horizontal biofilm architectures were studied through angled imaging at 0°, 45°, and 65° and magnifications of 1000×, 4000×, 5000×, and 8000×. Using an IXRF EDS system with a silicon drift detector (SDD), energy-dispersive X-ray spectroscopy (EDS) was performed to analyze the elemental makeup of mature biofilms, providing insights into nutrient assimilation and ion accumulation during microbial colonization. The imaging and analysis parameters included magnification = 4000×; accelerating voltage = 20 kV; takeoff angle = 35°; filament current ≈ 2 Amps; emission current ≈ 200 µAmps; EDS elapsed lifetime = 60 s.

2.5. Ion Chromatography (IC)

Ion chromatography (IC) is a liquid chromatography-based analytical method where the liquid mobile phase and ion exchange resin-based stationary phase are used to separate and quantify ions in a complex mixture [28,29]. Supernatants from each biofilm culture (after 24 h) were filtered (0.2 μm syringe filters) and diluted 800-fold with sterilized deionized water. Anions (F, Cl, NO2, Br, NO3, PO43−, and SO42−) were analyzed using a Dionex ICS-2100 system (Thermo Scientific, Sunnyvale, CA, USA). For calibration, Thermo Scientific Dionex Seven Anion Standard II containing anions F, Cl, NO2, Br, NO3, PO43−, and SO42− was diluted to 50×, 40×, and 20× concentrations to generate a standard calibration curve (see Table S1). The Dionex ICS-2100 was equipped with a DS6 heated conductivity detector maintained at 35 °C. For the current study, separation was performed using a Dionex IonPac AS19 (Thermo Scientific, Sunnyvale, CA, USA) analytical column and a Thermo Scientific IonPac AG19 (Thermo Scientific, Sunnyvale, CA, USA) guard column with a flow rate of 0.25 mL/min and back pressure of 1000–3000 psi. A column temperature of 30 °C and a runtime of 30 min. were maintained as discussed elsewhere [29]. Quantification was performed by comparison with the calibration curves generated from standard solutions. To isolate microbial effects, background ion contributions from LB were subtracted from final readings.
Anion concentrations in the original, undiluted samples were determined by multiplying the measured values by the dilution factor (800×). To account for background ionic contributions from the LB medium and isolate changes attributable to the water samples and Bacillus thuringiensis (Bt) activity, a background correction was applied. Specifically, 50% of the ion concentrations measured in pure LB with Bt (i.e., the values from 100% LB cultures divided by 2) were subtracted from the corresponding ion concentrations in the 50:50 (v/v) LB–water mixtures. This correction enabled more accurate estimations of net anion changes driven by Bt biofilm formation in the seven water sources, as described in Section 2.3.

2.6. Statistical Analysis

Statistical comparisons of ion concentrations before and after biofilm growth were conducted using a two-tailed Student’s t-test by the online 2025 version of GraphPad Software (https://www.graphpad.com/quickcalcs/ttest1/, (accessed on 20 February 2025)) by Dotmatics), with p ≤ 0.05 considered significant. Three independent replicates were performed per sample. Statistical analysis was conducted to compare ion levels before and after biofilm formation, allowing for the evaluation of meaningful differences in ion behavior between treatment groups.

3. Results

All data used for the statistical analysis were derived from three independent experimental replicates, incorporating results from both scanning electron microscopy (SEM) and ion chromatography (IC). Mean values and standard deviations were calculated to assess reproducibility and variability. While SEM imaging provided visual confirmation of the biofilm structure and surface attachment under different effluent conditions, these morphological observations alone could not account for the underlying chemical drivers of microbial growth. To better understand the role of residual dissolved ions in sustaining or influencing biofilm development, we subsequently performed ion chromatography (IC) analyses on the treated wastewater samples. Together, these complementary techniques provided a comprehensive evaluation of biofilm formation, serving as an effective probe for assessing the environmental suitability of treated wastewater discharge.

3.1. Biofilm Formation in Treated Wastewater

Biofilm formation with Bt was observed after 24 h of incubation. The OD600 of the supernatant of the biofilm that formed (Figure S1) was measured to determine bacterial growth in each water sample after biofilm formation. This depicted the growth of detached viable bacterial cells in the liquid after biofilm formation. The OD increased from 0.03 to ST/0.62 ± 0.02, TW/0.97 ± 0.10, SAC/1.07 ± 0.07, NC/1.07 ± 0.17, NS/0.94 ± 0.15, SJC/1.18 ± 0.03, and SJS/0.983 ± 0.17. The OD600 readings confirmed increased bacterial growth leading to biofilm development in all water samples, including SO2- and Cl2-treated samples.

3.2. Scanning Electron Microscopy/Energy-Dispersive X-Ray Spectroscopy (SEM/EDS) Analysis

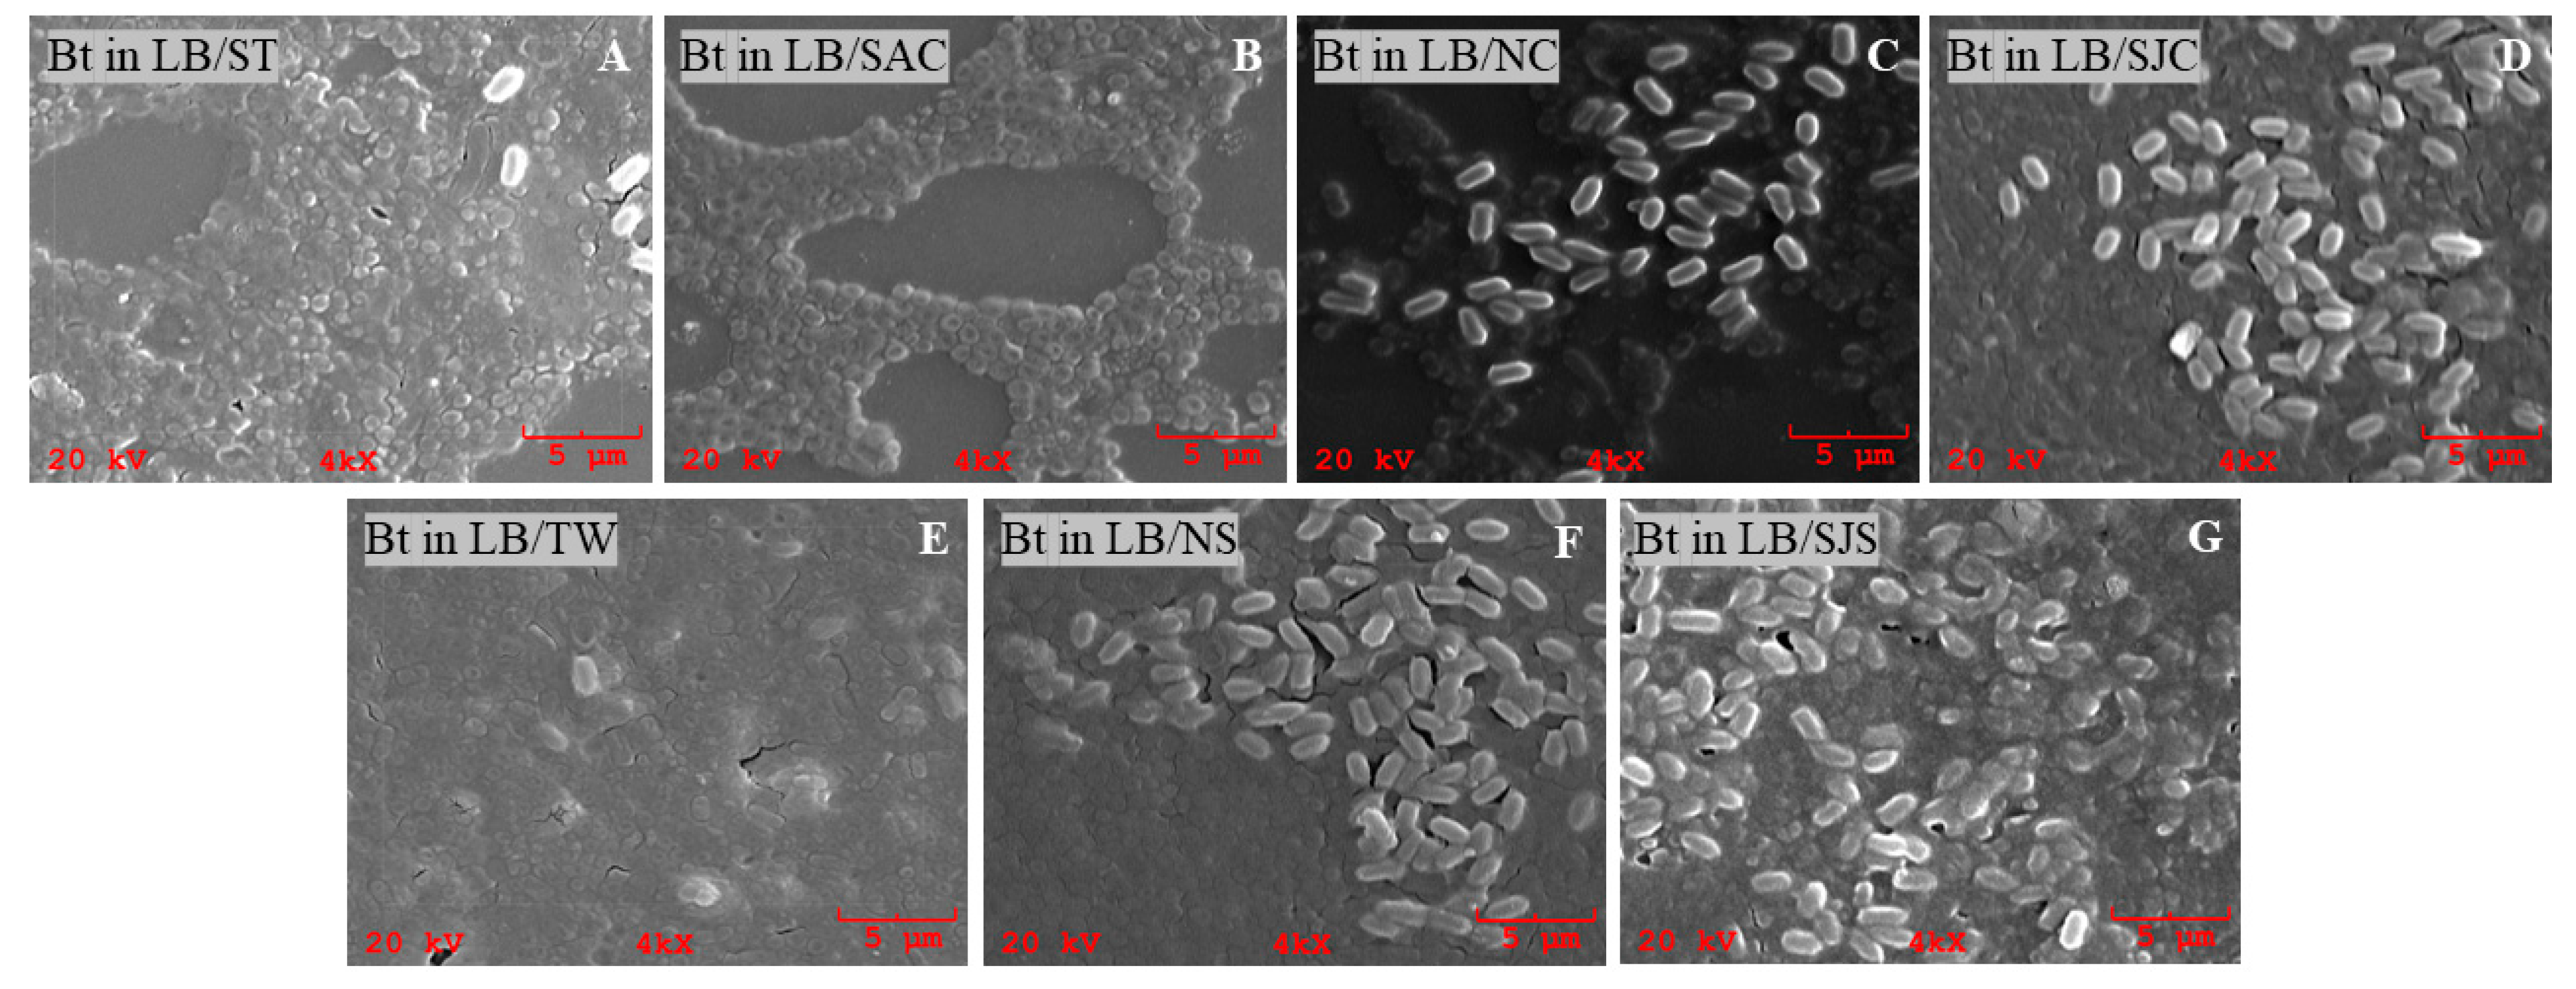
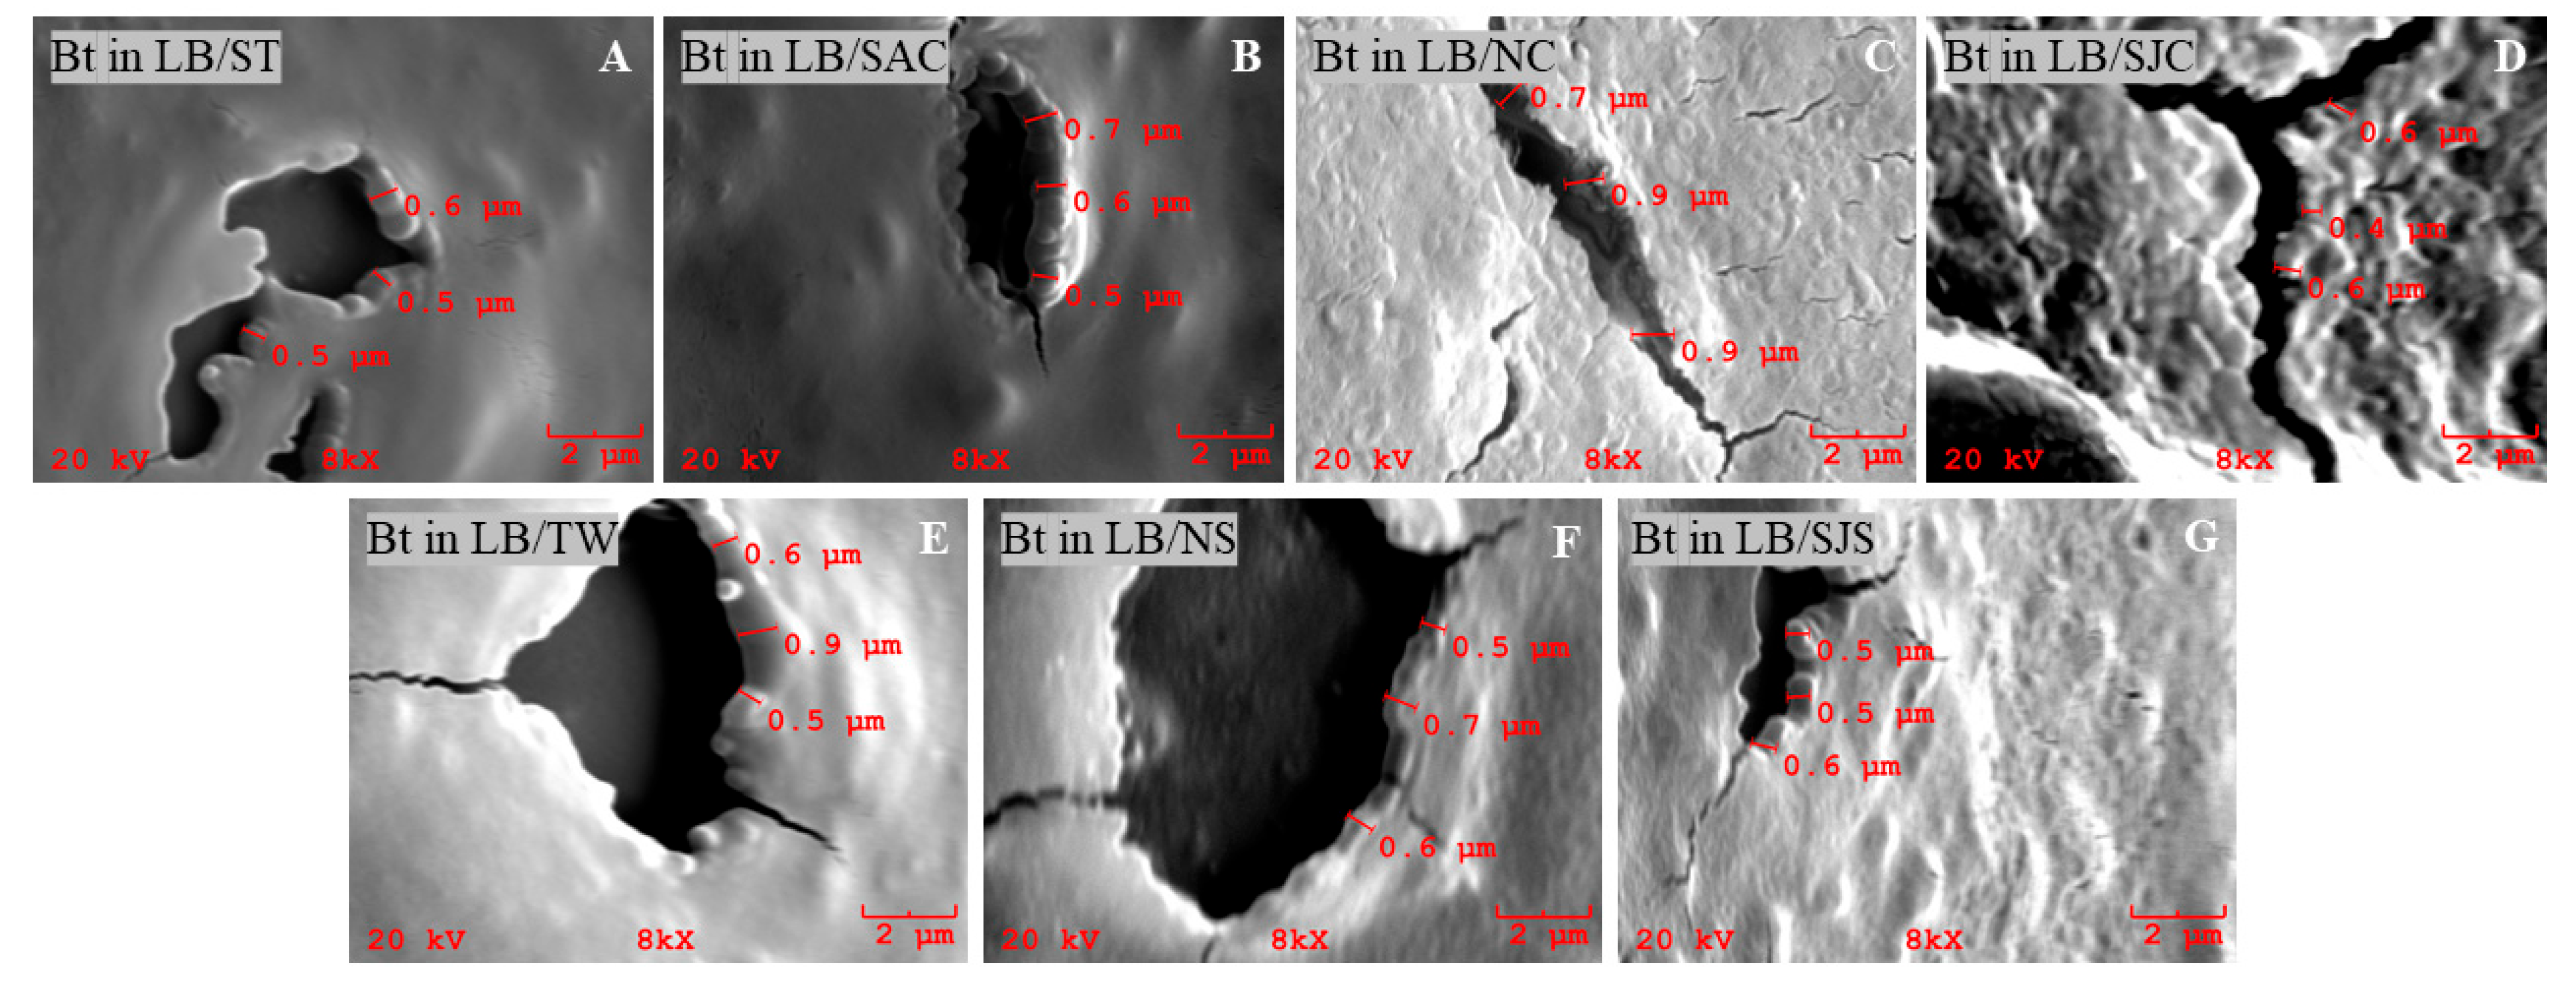
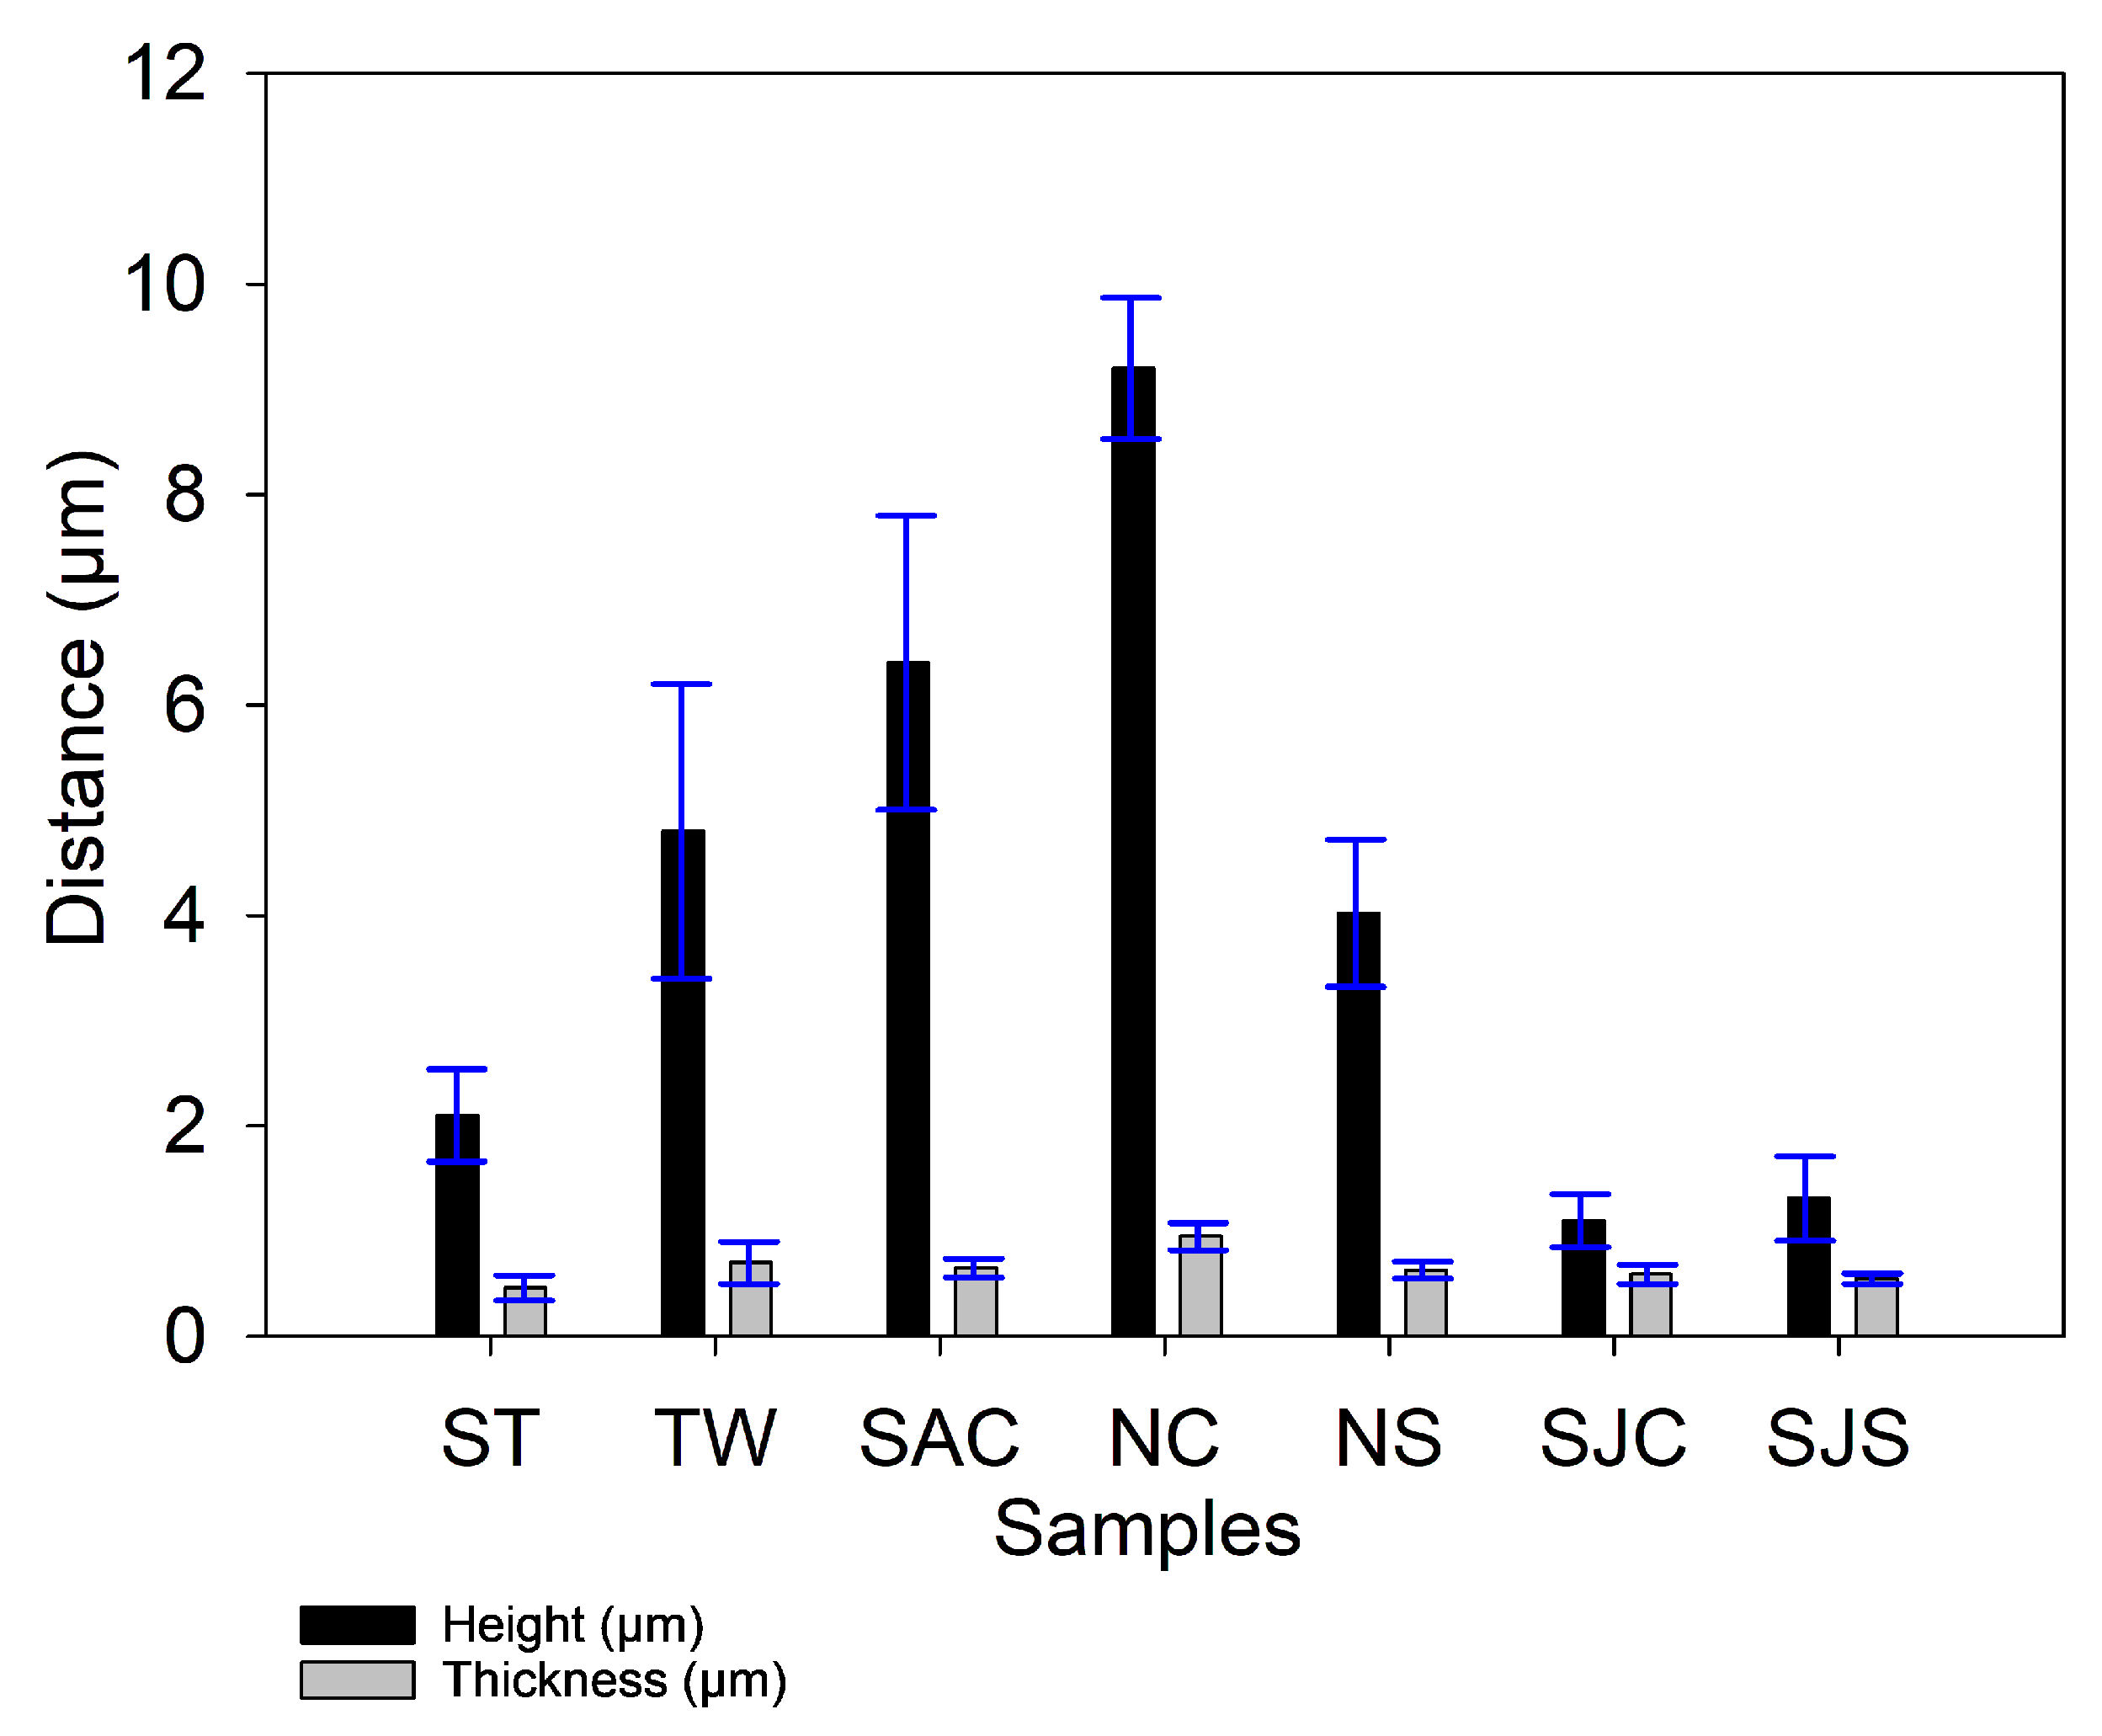
Imaging studies were conducted using scanning electron microscopy. Figure 1 and Figure 2 display SEM micrographs captured at 1000× and 4000× magnification, respectively. These micrographs reveal both horizontal surface coverage and vertical growth, indicating the early stages of biofilm development and spatial expansion across the substrate. This preliminary observation necessitated further imaging at higher magnifications and angled views to better characterize the three-dimensional structure, including biofilm height and thickness. The distinction between biofilm height and thickness became evident in the angled SEM micrographs which are provided in Figure 3 and Figure 4, respectively. Height refers to the maximum vertical extension of the biofilm from the substrate surface, often visualized in side-angle SEM views, while thickness represents the average vertical depth of the biofilm across a broader surface area. In Figure 3 (65° angle, 5000× magnification), the slanted view enabled visualization of the biofilm’s height profile, highlighting peak structures and uneven vertical accumulation due to localized bacterial colonization and extracellular matrix deposition. By contrast, Figure 4 (45° angle, 8000× magnification) provided higher-resolution details of biofilm thickness, revealing a more continuous and layered matrix, suggestive of mature biofilm development. Together, these micrographs illustrate that while both metrics describe aspects of biofilm architecture, height captures peak formation and structural protrusions, whereas thickness conveys an average measure of biofilm depth over the surface, contributing to a more comprehensive understanding of spatial development during Bt biofilm formation. Figure 5 provides a comparison of the extent of biofilm growth among the water samples. SEM analysis revealed that the biofilm thickness was generally comparable across all the Bt samples, indicating a consistent biofilm-forming capacity of Bt in all samples. NC exhibited the highest biofilm height, while SJC/SJS samples showed the lowest. These differences reflect variations in the physicochemical properties (see Table 1 for the ambient/control values) of the Bt-treated waters that can modulate (promote or inhibit) bacterial adhesion and EPS production.
Table 2 and Table S2 present the elemental composition of the biofilms studied by SEM/EDS. Elemental differences among these samples provide insights into the biofilm composition and environmental interactions associated with each water source. The results for the elemental composition confirmed the presence of macroelements (C, N, O, Na, P, S, Cl, Br). Carbon had the highest atomic percentage composition of 72.6% in NC. NS had the highest nitrogen content at 8.7%. Although the nitrogen composition in all water samples was lower than that of carbon, it had potential for biofilm formation. Sterilized deionized water had the highest oxygen content at 36.4%. Although other elements (F, Na, P, S, Cl, Br) were present in low concentrations, they play a crucial role in bacterial metabolism, leading to biofilm formation [30]. The variations in this elemental composition might lead to the formation of a thicker and more complex biofilm structure.

3.3. Ion Chromatography Studies of Supernatants After Biofilm Formation

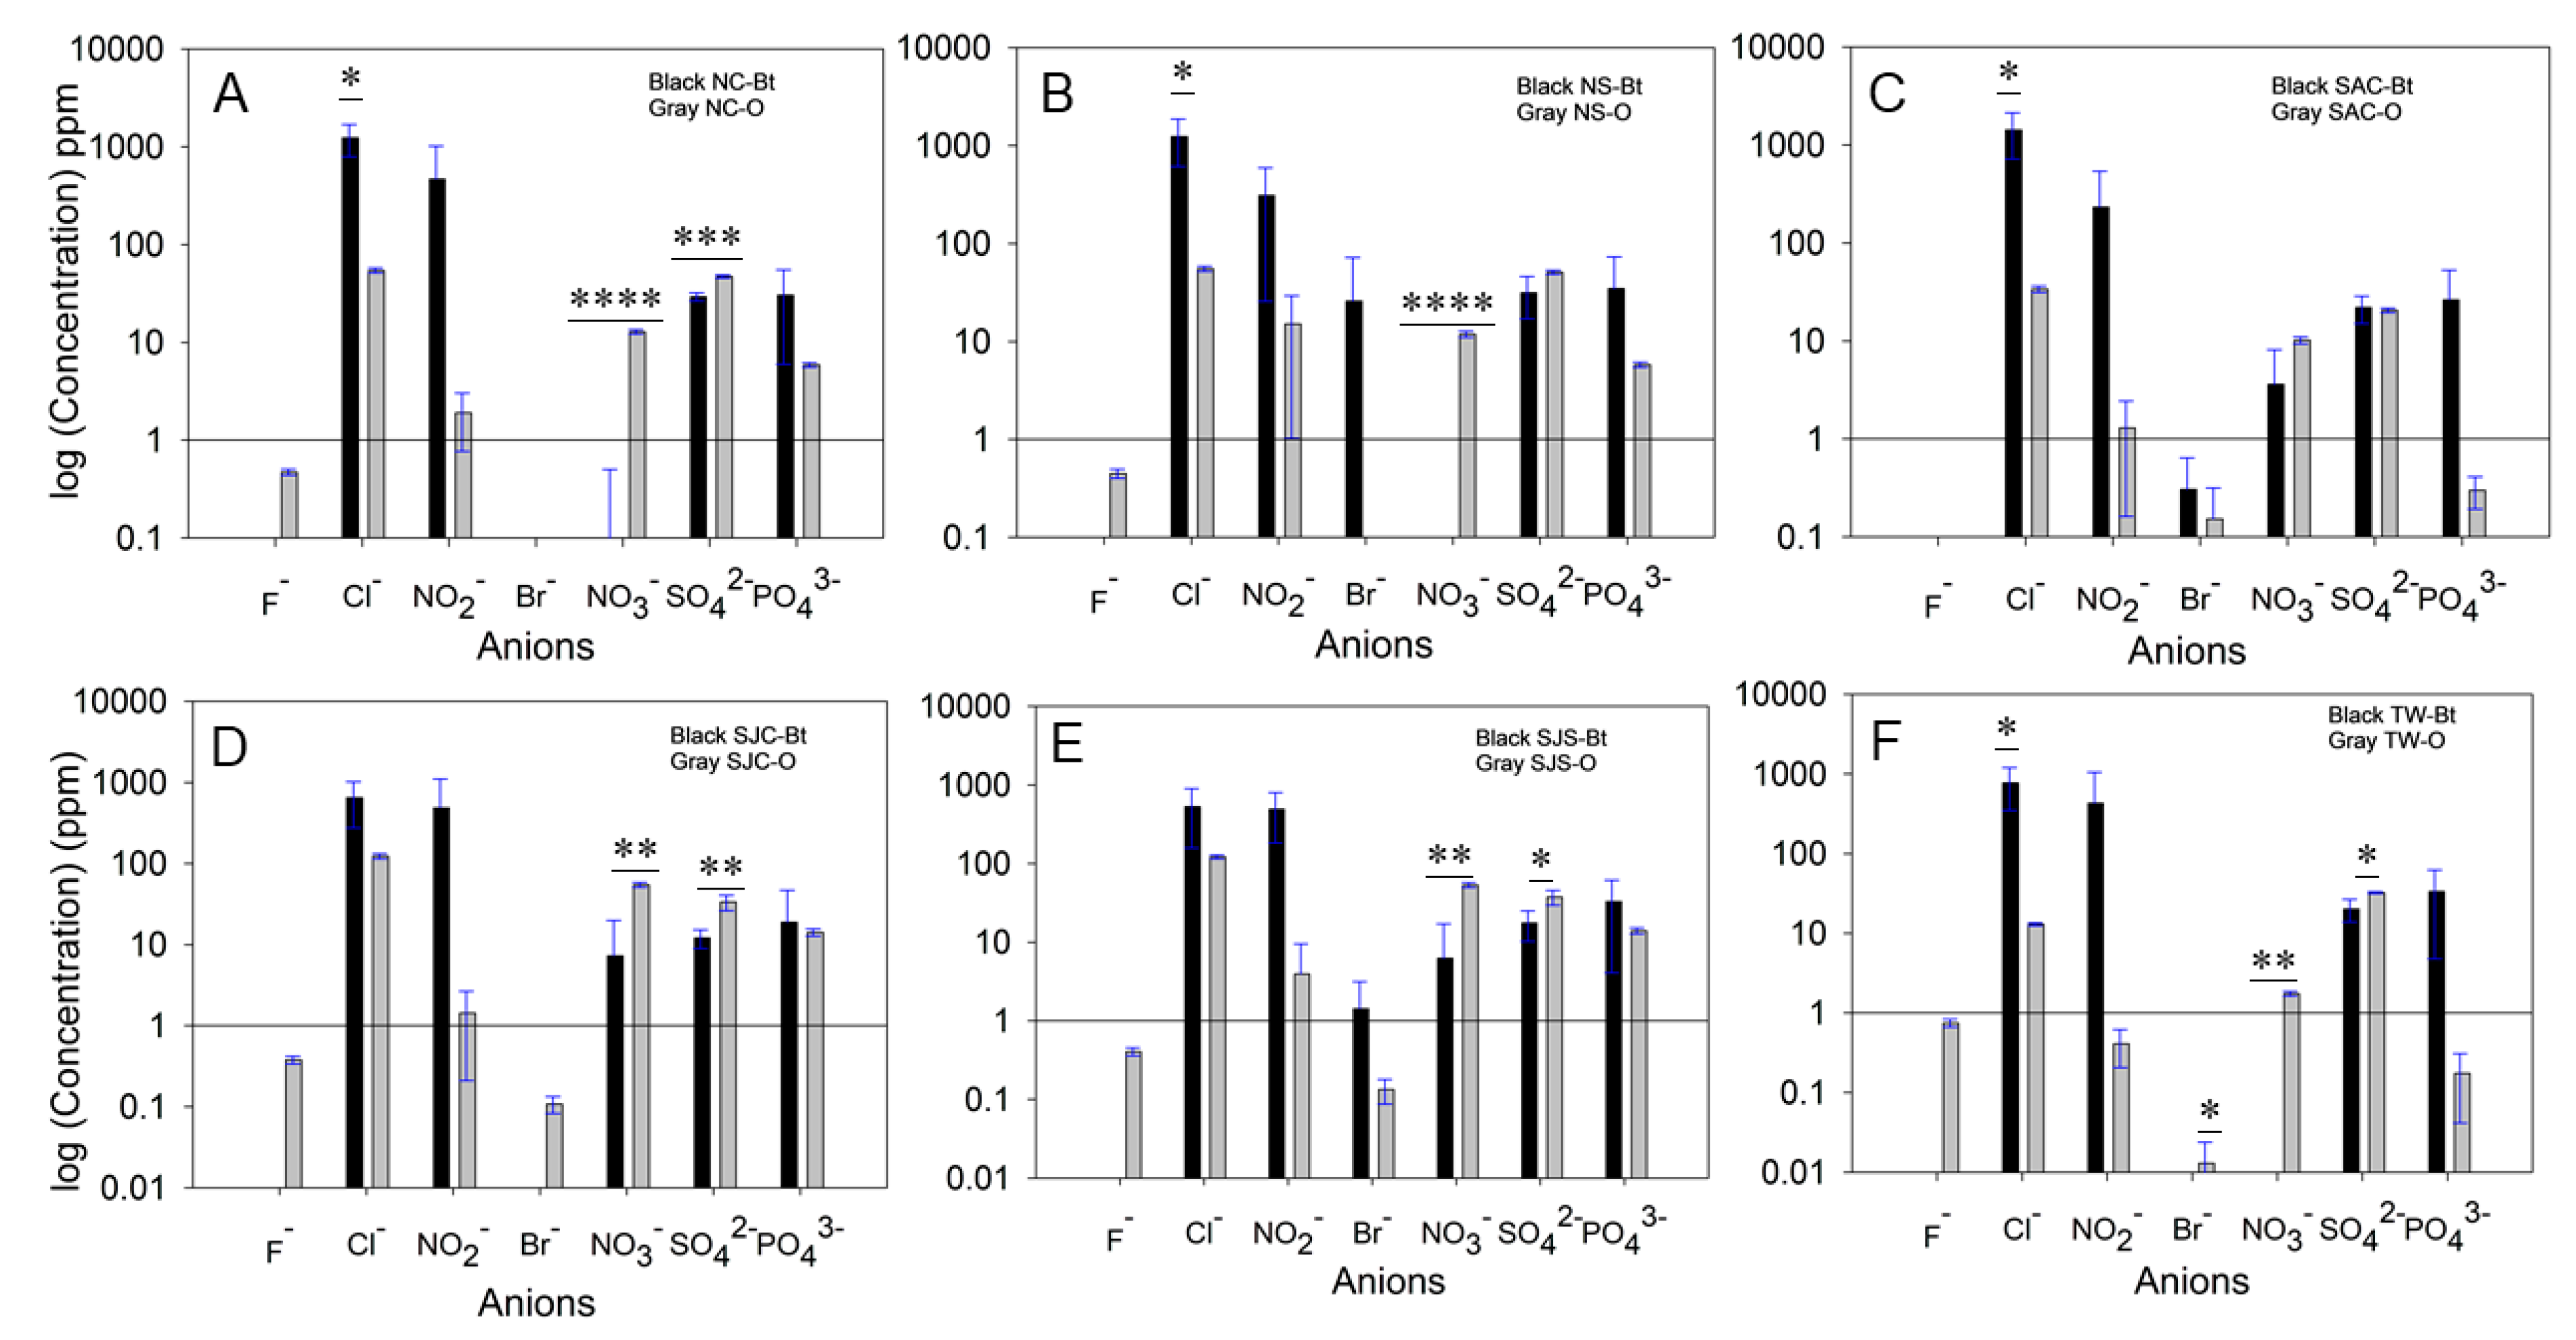
To further explore the chemical factors potentially influencing the observed biofilm formation, we conducted ion chromatography (IC) analysis. The chromatographic profile of the anions (F, Cl, NO2, Br, NO3, SO42−, PO43−) is displayed in Figure S2A. The peak area of the chromatogram was plotted against the concentration to develop calibration curves (Figure S2Ba–g). These curves had a great correlation value of 1.000, and all anions of interest were detected upon analysis of the anions in the experimental samples. Tables S3 and S4 present the mean concentrations (in ppm) of anions in the water samples before biofilm formation (ambient conditions) and after biofilm development (measured from the post-incubation supernatant), respectively. Statistical comparisons of these concentrations revealed significant differences for certain anions, indicating their potential involvement in promoting biofilm formation. As illustrated in Figure 6, these differences highlight that specific anions may play a more critical role than others in influencing Bacillus thuringiensis biofilm development.
Figure S3 presents a comparison between the ion concentrations of Bt-treated ST and ST-only samples where statistically significant differences were not observed. The influence of Bt biofilm formation on the ion composition of all other water samples is presented in Figure 6. The log-scale presentation highlights the broad range of ion responses between untreated and Bt-treated water samples. It also emphasizes the selective and source-dependent role of anions in Bt-mediated biofilm processes, offering insight into microbially influenced chemical transformations in treated wastewater environments. Ions with negative or lesser (compared to untreated samples) mean differences suggest net uptake or consumption during biofilm development. Among these, NO3 and SO42− showed highly significant decreases (p ≤ 0.5/≤0.01/≤0.001/≤0.0001) in most water samples, except for SAC for both the ions and NS for SO42−. Br showed a significant decrease only in the TW sample. F exhibited consistent declines in all samples except but did not reach statistical significance (p ≤ 0.05) in any sample.
In contrast, chloride (Cl), nitrite (NO2), and phosphate (PO43−) displayed positive mean differences, indicating net release or accumulation. Cl increases were statistically significant or highly significant in NC, NS, SAC, and TW, but not in SJC, SJS, or the ST control. NO2 and PO43−, though consistently elevated in Bt-treated samples, were not statistically significant across any water source, suggesting variability or a limited role in biofilm-associated ionic release under the tested conditions.

4. Discussion

This study highlights the potential application of Bacillus thuringiensis (Bt) biofilm formation as a sensitive and integrative biomonitoring tool to assess the quality of treated municipal wastewater. Biofilm development was consistently observed within 24 h in effluent samples obtained from chlorine and sulfur dioxide contact chambers of WWTPs in Nacogdoches, San Augustine, and San Jacinto, Texas. The rapid colonization by Bt suggests that residual organic matter or insufficient microbial inactivation persists post-disinfection, enabling microbial growth despite chemical treatment [31,32].
Quantitative measurements using the optical density (OD600) revealed significant increases in viable suspended cells following biofilm maturation, particularly in effluent from the Nacogdoches and San Jacinto facilities. Scanning electron microscopy confirmed the presence of dense bacterial communities and vertically stratified biofilm structures. The tallest and thickest biofilms were observed in samples from Nacogdoches, indicating variability in treatment effectiveness among the three WWTPs—a factor previously reported in regional wastewater quality assessments [33,34].
Ion chromatography (IC) further elucidated the biochemical dynamics associated with biofilm development. Notably, reductions in fluoride (F), nitrate (NO3), and sulfate (SO42−) concentrations post-biofilm growth suggest active microbial uptake for metabolic processes or extracellular polymeric substance (EPS) synthesis [18]. In contrast, increases in chloride (Cl), nitrite (NO2), and phosphate (PO43−) concentrations in the supernatant may reflect metabolic byproducts, cellular leakage, or biofilm-mediated ion exchange, consistent with previous studies on microbial transformation of wastewater constituents [35,36]. The statistically significant reductions in NO3 and SO42− support their role as key electron acceptors or co-factors in Bt-associated biofilm processes.
The parallel analysis between SEM and IC results suggests that the ionic composition of the treated effluents directly influenced microbial growth and surface colonization. Moreover, the remaining ion load in the supernatant implies that some nutrients were either partially assimilated by the forming biofilms or remained unutilized, possibly due to the selective uptake or stress adaptation mechanisms of Bacillus thuringiensis. Together, these findings highlight a strong coupling between residual water chemistry and biofilm development, underscoring the value of integrating IC and SEM to assess post-treatment microbial risks. The SEM analysis revealed notable differences in biofilm structure—particularly in thickness and height—across samples treated with wastewater from Nacogdoches (N), San Augustine (SA), and San Jacinto (SJ), with variation further influenced by the disinfection method (Cl2 or SO2). For example, biofilms formed in LB medium supplemented with chlorine-treated effluents (e.g., NC, SAC, SJC) generally exhibited more developed structures compared to their SO2-treated counterparts. Correspondingly, ion chromatography of the post-incubation supernatants showed that samples with denser biofilms (such as SAC-Bt and NC-Bt) retained higher levels of key anions—nitrate, sulfate, and phosphate—than did those with thinner biofilms, like TW or sterile controls.
From an environmental and public health standpoint, the persistence of viable bacteria capable of biofilm formation in disinfected effluent raises concerns about long-term impacts. Biofilms are known reservoirs of antimicrobial resistance genes and opportunistic pathogens, and they can accelerate biological fouling in reuse or distribution systems [37,38]. Despite prior disinfection with chlorine (Cl2) and sulfur dioxide (SO2), biofilm growth was observed in several water samples. This can be attributed to the well-documented phenomenon of microbial regrowth and recolonization following disinfection, particularly in environments where residual nutrients or surface niches remain. While Cl2 and SO2 are effective in reducing planktonic (free-floating) microbial populations, they may not fully eliminate resistant bacterial spores, persister cells, or early-stage biofilm communities embedded within surface-associated matrices [39,40]. Moreover, chlorine-tolerant bacteria and oxidative stress-adapted strains—such as some Bacillus species—can survive disinfection and later initiate new biofilm formation when favorable conditions re-emerge. Additionally, disinfection can disrupt microbial competition and create an ecological space that allows more resilient or opportunistic biofilm-forming bacteria to thrive. These findings are consistent with previous studies showing that disinfection, while essential, does not guarantee long-term prevention of biofilm formation in treated water systems [41,42].
The use of Bt as a model organism offers a cost-effective, reproducible, and scalable approach for wastewater surveillance. When paired with IC profiling, biofilm assays can serve as early-warning tools to detect residual contaminants, monitor nutrient fluxes, and evaluate the relative efficacy of treatment processes across facilities [43,44]. This kind of combined biological and chemical analysis offers a valuable addition to standard monitoring practices, with the potential to strengthen wastewater treatment oversight and support more sustainable reuse strategies.

5. Conclusions

This study presented a combined approach using ion chromatography, scanning electron microscopy (SEM), and Bacillus thuringiensis (Bt)-based biofilm formation as a tool for assessing the microbial and chemical characteristics of treated wastewater. While this method offers detailed insights, it is important to consider its practical value, especially if it is to be used beyond the research setting.
Scalability is one of the main limitations. SEM imaging, although powerful for visualizing biofilm structures and surface interactions at the micro-scale, is time-intensive and requires access to high-end instrumentation and trained personnel. This makes it less suitable for day-to-day monitoring in most wastewater treatment plants, particularly in rural or resource-limited areas. Similarly, ion chromatography, though highly accurate, requires laboratory infrastructure and technical expertise. For routine monitoring, simplified versions of these analyses or surrogate markers may need to be developed.
From a cost-effectiveness standpoint, the microbial biofilm assay using Bt and LB medium is relatively inexpensive and easy to set up. This component of the method could be used more widely in field settings to detect biofilm-forming potential, particularly when combined with simple turbidity or absorbance measurements. When compared to conventional monitoring tools—such as residual chlorine testing, turbidity, or total coliform counts—the proposed method offers more detailed and mechanistic information. Rather than simply detecting microbial presence, it reveals how microbial activity interacts with chemical conditions (e.g., ion concentrations) and results in biofilm formation. This depth of analysis is particularly useful for early-stage detection of water quality deterioration and understanding post-treatment microbial dynamics. However, unlike rapid field kits or in-line sensors, this method does not offer immediate results and is best suited as a complementary strategy rather than a replacement.
Regarding ease of implementation, the microbial assay offers a user-friendly approach to assess biological activity post-disinfection. Its ability to indicate regrowth potential and residual biofilm risk adds value to conventional water quality testing. The findings showed that treated effluents still supported measurable biofilm growth and chemical changes, underscoring the potential for residual contamination and microbial regrowth. As a complementary approach to conventional testing, this integrated framework can enhance early detection of water quality deterioration and inform safer, more sustainable reuse practices. Future efforts should aim to simplify the analytical components and validate the biofilm assay using environmentally and clinically relevant microorganisms across diverse treatment scenarios.

Supplementary Materials

The following supporting information can be downloaded at: https://www.mdpi.com/article/10.3390/su17167272/s1, Figure S1: Bacterial growth chart showing final optical density (OD at 600 nm) of the supernatants from biofilm formed by Bacillus thuringensis grown in Luria broth and water samples at a 50:50 v/v ratio; Figure S2: (A) Representative ion chromatography (IC) chromatogram showing the retention profiles of seven anions: (a) fluoride (F), (b) chloride (Cl), (c) nitrite (NO2), (d) bromide (Br), (e) nitrate (NO3), (f) sulfate (SO42), and (g) phosphate (PO43), (B) Calibration curves for all seven anions (a–g) were generated using 50×, 40×, and 20× dilutions of the Thermo Scientific Dionex combined anion ion chromatography standard; Figure S3: A comparative analysis of ion concentrations in Bacillus thuringiensis (Bt)-treated (ST-Bt, black) versus untreated (ST-Only, gray) water sample of sterilized deionized water; Table S1: Concentrations (ppm) of anions in the seven-anion combined standard solution (Thermo Scientific Dionex product). The standard includes the following anions: fluoride (F), chloride (Cl), nitrite (NO2), bromide (Br), nitrate (NO3), phosphate (PO43), and sulfate (SO42); Table S2: Atomic percentage composition (%) of elements in water samples from SEM/EDS analysis; Table S3: Mean concentration (ppm) of ambient level of ions in all water samples before the experiment (number of data points = 3); Table S4: Mean (ppm) concentration of ions in all water samples after the experiment and subtraction of LB/2 effect (number of data point = 3).

Author Contributions

Conceptualization, B.S.; methodology, B.S.; K.O. and R.F. software, B.S., K.O. and R.F.; validation, B.S., K.O. and R.F.; formal analysis, B.S.; K.O., C.B.-G., P.B., and R.F.; investigation, B.S., O.O., R.F., P.B., K.O.; resources, B.S., K.O. and R.F.; data curation, B.S.; writing—original draft preparation, B.S. and O.O.; writing—B.S., and editing, B.S.; visualization, B.S.; supervision, B.S.; project administration, B.S.; funding acquisition, B.S. All authors have read and agreed to the published version of the manuscript.

Funding

BS is thankful for support from The Center for Applied Research and Rural Innovation (CARRI) grant at SFA. This work was also supported by the Welch Foundation Grant (AN-0008) at the Department of Chemistry and Biochemistry of SFA and the Summer Undergraduate Research Experience program at the College of Sciences and Mathematics of SFA.

Institutional Review Board Statement

Not applicable.

Informed Consent Statement

Not applicable.

Data Availability Statement

The data presented in this study are available on request from the corresponding author.

Acknowledgments

We sincerely thank the reviewers for their constructive and insightful comments, which have significantly improved the quality and clarity of our manuscript. We also gratefully acknowledge the personnel of the Nacogdoches Wastewater Treatment Plant, the San Jacinto Wastewater Treatment Plant, and the San Augustine Wastewater Treatment Plant for generously providing the physicochemical data of the treated water. Their support and collaboration have been invaluable to this research.

Conflicts of Interest

The authors declare no conflicts of interest.

References

  1. WHO. Water, Sanitation and Hygiene for Health: Guidelines on Safe Use of Wastewater in Agriculture; World Health Organization: Geneva, Switzerland, 2022. [Google Scholar]
  2. UNESCO. UN World Water Development Report 2021: Valuing Water; United Nations Educational, Scientific and Cultural Organization: Paris, France, 2021. [Google Scholar]
  3. Fernandes, J.; Ramísio, P.J.; Puga, H. A Comprehensive Review on Various Phases of Wastewater Technologies: Trends and Future Perspectives. Eng 2024, 5, 2633–2661. [Google Scholar] [CrossRef]
  4. Tchobanoglous, G.; Stensel, H.; Tsuchihashi, R.; Burton, F. Wastewater Engineering: Treatment and Resource Recovery, 5th ed.; Metcalf & Eddy, Inc., McGraw-Hill Education: Columbus, OH, USA, 2014. [Google Scholar]
  5. Chan, A.; Salsali, H.; McBean, E. Heavy Metal Removal (Copper and Zinc) in Secondary Effluent from Wastewater Treatment Plants by Microalgae. ACS Sustain. Chem. Eng. 2014, 2, 130–137. [Google Scholar] [CrossRef]
  6. Westgate, P.J.; Park, C. Evaluation of Proteins and Organic Nitrogen in Wastewater Treatment Effluents. Environ. Sci. Technol. 2010, 44, 5352–5357. [Google Scholar] [CrossRef] [PubMed]
  7. Zeiner, M.; Rezić, T.; Santek, B.; Rezić, I.; Hann, S.; Stingeder, G. Removal of Cr, Mn, and Co from textile wastewater by horizontal rotating tubular bioreactor. Environ. Sci. Technol. 2012, 46, 10690–10696. [Google Scholar] [CrossRef]
  8. Onchoke, K.K.; Janusa, M.A.; Sasu, S.A. Evaluation of the performance of a rural municipal wastewater treatment plant in Nacogdoches, East Texas (USA). Chem. Ecol. 2015, 31, 567–582. [Google Scholar] [CrossRef]
  9. Barber, L.B.; Keefe, S.H.; Antweiler, R.C.; Taylor, H.E.; Wass, R.D. Accumulation of contaminants in fish from wastewater treatment wetlands. Environ. Sci. Technol. 2006, 40, 603–611. [Google Scholar] [CrossRef]
  10. Kulwant, M.; Yadav, A. Challenges and Opportunities for Water Quality Monitoring and Management in India. In Integrated Management of Water Resources in India: A Computational Approach; Springer: Cham, Switzerland, 2024; pp. 121–137. [Google Scholar]
  11. USDA, U.S.E.P. Agency. Rural and Small Systems Guidebook to Sustainable Water and Wastewater Utility Management; EPA: Washington, DC, USA, 2025; pp. 1–40. [Google Scholar]
  12. Bernal, D. A conceptual model for decentralized municipal wastewater management. Water Pract. Technol. 2018, 13, 134–142. [Google Scholar] [CrossRef]
  13. Chirisa, I.; Bandauko, E.; Matamanda, A.; Mandisvika, G. Decentralized domestic wastewater systems in developing countries: The case study of Harare (Zimbabwe). Appl. Water Sci. 2017, 7, 1069–1078. [Google Scholar] [CrossRef]
  14. Tchobanoglous, G.; Burton, F.L.; Stensel, H.D. Wastewater Engineering, Treatment and Reuse, 4th ed.; McGraw-Hill: Boston, MA, USA, 2003. [Google Scholar]
  15. Sengupta, B.; Sinha, S.S.; Garner, B.L.; Arany, I.; Corley, C.; Cobb, K.; Brown, E.; Ray, P.C. Influence of Aptamer-Enclosed Silver Nanocluster on the Prevention of Biofilm by Bacillus thuringiensis. Nanosci. Nanotechnol. Lett. 2016, 8, 1054–1060. [Google Scholar] [CrossRef]
  16. Ianes, J.; Cantoni, B.; Polesel, F.; Remigi, E.U.; Vezzaro, L.; Antonelli, M. Monitoring (micro-)pollutants in wastewater treatment plants: Comparing discharges in wet- and dry-weather. Environ. Res. 2024, 263, 120132. [Google Scholar] [CrossRef]
  17. Guo, X.; Jiang, S.; Wang, Y.; Wang, Y.; Wang, J.; Huang, T.; Liang, H.; Tang, X. Effects of pre-treatments on the filtration performance of ultra-low pressure gravity-driven membrane in treating the secondary effluent: Flux stabilization and removal improvement. Sep. Purif. Technol. 2022, 303, 122122. [Google Scholar] [CrossRef]
  18. Flemming, H.-C.; Wingender, J.; Szewzyk, U.; Steinberg, P.; Rice, S.A.; Kjelleberg, S. Biofilms: An emergent form of bacterial life. Nat. Rev. Microbiol. 2016, 14, 563–575. [Google Scholar] [CrossRef] [PubMed]
  19. Costerton, J.W.; Stewart, P.S.; Greenberg, E.P. Bacterial biofilms: A common cause of persistent infections. Science 1999, 284, 1318–1322. [Google Scholar] [CrossRef]
  20. Mah, T.F.; O’Toole, G.A. Mechanisms of biofilm resistance to antimicrobial agents. Trends Microbiol. 2001, 9, 34–39. [Google Scholar] [CrossRef] [PubMed]
  21. Falkinham, J.O., 3rd; Hilborn, E.D.; Arduino, M.J.; Pruden, A.; Edwards, M.A. Epidemiology and Ecology of Opportunistic Premise Plumbing Pathogens: Legionella pneumophila, Mycobacterium avium, and Pseudomonas aeruginosa. Environ. Health Perspect. 2015, 123, 749–758. [Google Scholar] [CrossRef]
  22. Declerck, P. Biofilms: The environmental playground of Legionella pneumophila. Environ. Microbiol. 2010, 12, 557–566. [Google Scholar] [CrossRef]
  23. USEPA. Secondary Treatment Regulation: 40 CFR §133.102; Federal Register, U.S. Government Publishing Office: Washington, DC, USA, 1984. Available online: https://www.ecfr.gov/current/title-40/chapter-I/subchapter-D/part-133/section-133.102 (accessed on 31 July 2025).
  24. Madigan, M.T.; Bender, K.S.; Buckley, D.H.; Sattley, W.M.; Stahl, D.A. Brock Biology of Microorganisms, 16th ed.; Pearson: Boston, MA, USA, 2021. [Google Scholar]
  25. Beal, J.; Farny, N.G.; Haddock-Angelli, T.; Selvarajah, V.; Baldwin, G.S.; Buckley-Taylor, R.; Gershater, M.; Kiga, D.; Marken, J.; Sanchania, V.; et al. Robust estimation of bacterial cell count from optical density. Commun. Biol. 2020, 3, 512. [Google Scholar] [CrossRef]
  26. Wacogne, B.; Belinger Podevin, M.; Vaccari, N.; Koubevi, C.; Codjiová, C.; Gutierrez, E.; Davoine, L.; Robert-Nicoud, M.; Rouleau, A.; Frelet-Barrand, A. Concentration vs. Optical Density of ESKAPEE Bacteria: A Method to Determine the Optimum Measurement Wavelength. Sensors 2024, 24, 8160. [Google Scholar] [CrossRef]
  27. Goldstein, J.; Newbury, D.; Joy, D.; Lyman, C.; Echlin, P.; Lifshin, E.; Sawyer, L.; Michael, J. Scanning Electron Microscopy and X-ray Microanalysis, 4th ed.; Springer: Berlin/Heidelberg, Germany, 2018. [Google Scholar]
  28. Small, H.; Stevens, T.S.; Bauman, W.C. Novel ion exchange chromatographic method using conductimetric detection. Anal. Chem. 1975, 47, 1801–1809. [Google Scholar] [CrossRef]
  29. Onchoke, K.K.; Sasu, S.A. Determination of Hexavalent Chromium (Cr(VI)) Concentrations via Ion Chromatography and UV-Vis Spectrophotometry in Samples Collected from Nacogdoches Wastewater Treatment Plant, East Texas (USA). Adv. Environ. Chem. 2016, 2016, 3468635. [Google Scholar] [CrossRef]
  30. Perelomov, L.; Rajput, V.D.; Gertsen, M.; Sizova, O.; Perelomova, I.; Kozmenko, S.; Minkina, T.; Atroshchenko, Y. Ecological features of trace elements tolerant microbes isolated from sewage sludge of urban wastewater treatment plant. Stress Biol. 2024, 4, 8. [Google Scholar] [CrossRef]
  31. Learbuch, K.L.G.; Smidt, H.; van der Wielen, P. Water and biofilm in drinking water distribution systems in the Netherlands. Sci. Total Environ. 2022, 831, 154940. [Google Scholar] [CrossRef]
  32. Sharma, V.K.; Johnson, N.; Cizmas, L.; McDonald, T.J.; Kim, H. A review of the influence of treatment strategies on antibiotic resistant bacteria and antibiotic resistance genes. Chemosphere 2016, 150, 702–714. [Google Scholar] [CrossRef]
  33. Maurya, A.; Kumar, R.; Raj, A. Biofilm-based technology for industrial wastewater treatment: Current technology, applications and future perspectives. World J. Microbiol. Biotechnol. 2023, 39, 112. [Google Scholar] [CrossRef]
  34. Rizzo, L.; Manaia, C.; Merlin, C.; Schwartz, T.; Dagot, C.; Ploy, M.C.; Michael, I.; Fatta-Kassinos, D. Urban wastewater treatment plants as hotspots for antibiotic resistant bacteria and genes spread into the environment: A review. Sci. Total Environ. 2013, 447, 345–360. [Google Scholar] [CrossRef]
  35. Hasan, H.A.; Rahim, N.F.M.; Alias, J.; Ahmad, J.; Said, N.S.M.; Ramli, N.N.; Buhari, J.; Abdullah, S.R.S.; Othman, A.R.; Jusoh, H.H.W.; et al. A Review on the Roles of Extracellular Polymeric Substances (EPSs) in Wastewater Treatment: Source, Mechanism Study, Bioproducts, Limitations, and Future Challenges. Water 2024, 16, 2812. [Google Scholar] [CrossRef]
  36. Zhang, H.; Yuan, X.; Wang, H.; Ma, S.; Ji, B. Performance and Microbial Community of Different Biofilm Membrane Bioreactors Treating Antibiotic-Containing Synthetic Mariculture Wastewater. Membranes 2020, 10, 282. [Google Scholar] [CrossRef] [PubMed]
  37. Proia, L.; von Schiller, D.; Sànchez-Melsió, A.; Sabater, S.; Borrego, C.M.; Rodríguez-Mozaz, S.; Balcázar, J.L. Occurrence and persistence of antibiotic resistance genes in river biofilms after wastewater inputs in small rivers. Environ. Pollut. 2016, 210, 121–128. [Google Scholar] [CrossRef]
  38. Wingender, J.; Flemming, H.C. Biofilms in drinking water and their role as reservoir for pathogens. Int. J. Hyg. Environ. Health 2011, 214, 417–423. [Google Scholar] [CrossRef] [PubMed]
  39. Bridier, A.; Briandet, R.; Thomas, V.; Dubois-Brissonnet, F. Resistance of bacterial biofilms to disinfectants: A review. Biofouling 2011, 27, 1017–1032. [Google Scholar] [CrossRef] [PubMed]
  40. LeChevallier, M.W.; Babcock, T.M.; Lee, R.G. Examination and characterization of distribution system biofilms. Appl. Environ. Microbiol. 1987, 53, 2714–2724. [Google Scholar] [CrossRef]
  41. Berry, D.; Xi, C.; Raskin, L. Microbial ecology of drinking water distribution systems. Curr. Opin. Biotechnol. 2006, 17, 297–302. [Google Scholar] [CrossRef]
  42. Williams, D.T.; LeBel, G.L.; Benoit, F.M. Disinfection by-products in Canadian drinking water. Chemosphere 1997, 34, 299–316. [Google Scholar] [CrossRef]
  43. Hammes, F.; Berger, C.; Köster, O.; Egli, T. Assessing biological stability of drinking water without disinfectant residuals in a full-scale water supply system. J. Water Supply Res. Technol. AQUA 2010, 59, 31–40. [Google Scholar] [CrossRef]
  44. Li, S.; Duan, L.; Zhao, Y.; Gao, F.; Hermanowicz, S.W. Analysis of Microbial Communities in Membrane Biofilm Reactors Using a High-Density Microarray. Membranes 2023, 13, 324. [Google Scholar] [CrossRef] [PubMed]
Figure 1. Scanning electron micrographs of biofilms formed by Bacillus thuringiensis (Bt) after 24 h of incubation in Luria broth (LB) diluted 1:1 (v/v) with water samples grown on mica discs. Biofilm development is characterized by a darker region representing horizontal film growth. Lighter regions indicate vertical biofilms. Water sources and corresponding panels: (A) ST = sterilized deionized water, (B) SAC = San Augustine Cl2 contact chamber sample, (C) NC = Nacogdoches Cl2 contact chamber sample, (D) SJC = San Jacinto Cl2 contact chamber sample, (E) TW = tap water, (F) NS = Nacogdoches SO2 contact chamber sample, (G) SJS = San Jacinto SO2 contact chamber sample. These micrographs highlight the variable biofilm architecture of Bt in response to different treated wastewater sources, with samples from disinfection contact chambers showing distinct biofilm height and density.
Sustainability 17 07272 g001
Figure 2. Scanning electron micrographs of biofilms formed by Bacillus thuringiensis (Bt) after 24 h of growth on mica discs in Luria broth (LB) diluted 1:1 (v/v) with different water sources. The biofilm structure varies by water type, reflecting the influence of residual components from treated wastewater on microbial colonization. Water sources and corresponding panels: (A) ST = sterilized deionized water, (B) SAC = San Augustine Cl2 contact chamber sample, (C) NC = Nacogdoches Cl2 contact chamber sample, (D) SJC = San Jacinto Cl2 contact chamber sample, (E) TW = tap water, (F) NS = Nacogdoches SO2 contact chamber sample, (G) SJS = San Jacinto SO2 contact chamber sample. These micrographs show horizontal and vertical components of biofilm growth. Darker regions represent basal film layers, and lighter zones correspond to vertical extension and microcolony formation.
Sustainability 17 07272 g002
Figure 3. Scanning electron micrographs of biofilms formed by Bacillus thuringiensis (Bt) after 24 h of incubation in Luria broth (LB) diluted 1:1 (v/v) with various water sources and grown on mica discs. The rotation angle is 65°. These micrographs capture the vertical architecture and height of biofilms following maturation (see Figure 5 for quantitative measurements). Water sources and corresponding panels: (A) ST = sterilized deionized water, (B) SAC = San Augustine Cl2 contact chamber sample, (C) NC = Nacogdoches Cl2 contact chamber sample, (D) SJC = San Jacinto Cl2 contact chamber sample, (E) TW = tap water, (F) NS = Nacogdoches SO2 contact chamber sample, (G) SJS = San Jacinto SO2 contact chamber sample. The variation in film height and density across panels reflects differential biofilm development in response to water quality and disinfection treatment history.
Sustainability 17 07272 g003
Figure 4. Scanning electron micrographs of biofilms formed by Bacillus thuringiensis (Bt) after 24 h of growth on mica discs in Luria broth (LB) diluted 1:1 (v/v) with various water sources. The rotation angle is 45°. These micrographs highlight the thickness of mature biofilms (see Figure 5 for quantitative measurements), providing insights into vertical biofilm development under different water quality conditions. Water sources and corresponding panels: (A) ST = sterilized deionized water, (B) SAC = San Augustine Cl2 contact chamber sample, (C) NC = Nacogdoches Cl2 contact chamber sample, (D) SJC = San Jacinto Cl2 contact chamber sample, (E) TW = tap water, (F) NS = Nacogdoches SO2 contact chamber sample, (G) SJS = San Jacinto SO2 contact chamber sample.
Sustainability 17 07272 g004
Figure 5. The height and thickness of biofilms formed by Bacillus thuringiensis (Bt) were measured using scanning electron microscopy (SEM) after 24 h of incubation on mica discs. The bacteria were grown in Luria broth (LB) that was diluted 1:1 with different water samples to assess how the water source affects biofilm development. For each condition, the average and standard deviation were calculated from 10 measurements. The water sources included sterilized deionized water (ST), tap water (TW), and treated effluent from chlorine (Cl2) and sulfur dioxide (SO2) contact chambers at three locations: San Augustine (SAC), Nacogdoches (NC and NS), and San Jacinto (SJC and SJS).
Sustainability 17 07272 g005
Figure 6. A comparative analysis of ion concentrations in Bacillus thuringiensis (Bt)-treated (black profiles) versus untreated (gray profiles) water samples across six sources: (A) Nacogdoches Cl2-treated (NC), (B) Nacogdoches SO2-treated (NS), (C) San Augustine Cl2-treated (SAC), (D) San Jacinto Cl2-treated (SJC), (E) San Jacinto SO2-treated (SJS) and (F) tap water (TW). Each panel shows the mean levels (in ppm) of selected anions measured from three independent replicates, plotted on a logarithmic y-axis. Error bars represent standard deviations, and statistical significance was evaluated using a two-tailed Student’s t-test with thresholds set at p > 0.05 (not significant), p ≤ 0.05 (significant, *), p ≤ 0.01 (very significant, **), p ≤ 0.001 (highly significant, ***), and p ≤ 0.0001 (extremely significant, ****).
Sustainability 17 07272 g006
Table 1. Average physicochemical parameters of influent and effluent wastewater collected from three municipal wastewater treatment plants (WWTPs) between April and August 2024. Values are expressed as the mean ± standard deviation (SD). The number of samples analyzed was approximately n ≈ 140–150 for pH and dissolved oxygen (DO) and n ≈ 25–100 for carbonaceous biological oxygen demand (CBOD), ammonia nitrogen (NH3-N), and total suspended solids (TSS) over the five-month period. ND = not determined; BD = below detection limit.
Parameter /WWTPNacogdoches WWTPSan Augustine WWTPSan Jacinto WWTP
InfluentEffluentInfluentEffluentInfluentEffluentUSEPA Standard aPercentage
Removal
CBOD (mg/L)ND3.06 ± 0.17ND2.95 ± 0.58189.88 ± 21.913.15 ± 0.15≤25 mg/L (30-day avg),
≤40 mg/L (7-day avg)
98.34% (SJ)
COD (mg/L)NDNDNDND517.5 ± 3.5451.35 ± 39.95 90.08% (SJ)
TSS (mg/L)-3.34 ± 0.36 2.87 ± 1.63196.75 ± 21.352.90 ± 0.54≤30 mg/L (30-day avg),
≤45 mg/L (7-day avg)
98.53%
DO (mg/L)ND8.18 ± 0.16BD5.47 ± 0.45ND7.42 ± 0.01--
NH3-N (mg/L)ND0.94 ± 0.55ND0.38 ± 0.2935.69 ± 2.290.15 ± 0.07-99.58%
pH 7.2 ± 0.12 6.50 ± 0.15ND7.13 ± 0.06.0–9.0
a [23].
Table 2. The weight-to-weight percentage (% w/w) of elemental components within biofilms formed by Bacillus thuringiensis (Bt) was assessed using scanning electron microscopy coupled with energy-dispersive X-ray spectroscopy (SEM/EDS). Biofilms were cultivated in Luria broth (LB) diluted 1:1 (v/v) with various water sources and then analyzed for their elemental composition. The detected elements included carbon (C), nitrogen (N), oxygen (O), fluorine (F), sodium (Na), phosphorus (P), sulfur (S), chlorine (Cl), and bromine (Br). The water sources used for biofilm development included ST: sterilized deionized water, TW: tap water, SAC: San Augustine Cl2 contact chamber sample, NC: Nacogdoches Cl2 contact chamber sample, NS: Nacogdoches SO2 contact chamber sample, SJC: San Jacinto Cl2 contact chamber sample, and SJS: San Jacinto SO2 contact chamber sample.
ElementsSTTWSACNCNSSJCSJS
C42.360.050.259.959.149.359.9
N1.94.83.34.58.47.24.2
O38.116.730.513.916.230.216.1
F0.00.00.20.00.00.00.0
Na4.04.23.05.24.23.25.1
P5.05.66.07.75.64.34.9
S2.42.52.82.81.92.31.6
Cl1.62.90.73.72.70.75.2
Br4.83.43.32.31.92.93.1
Disclaimer/Publisher’s Note: The statements, opinions and data contained in all publications are solely those of the individual author(s) and contributor(s) and not of MDPI and/or the editor(s). MDPI and/or the editor(s) disclaim responsibility for any injury to people or property resulting from any ideas, methods, instructions or products referred to in the content.