Article

Why Does the Water Color in a Natural Pool Turn into Reddish-Brown “Pumpkin Soup”?

1
Institute of Geography and Tourism, Qujing Normal University, Qujing 655011, China
2
Institute for Ecological Research and Pollution Control of Plateau Lakes, School of Ecology and Environmental Science, Yunnan University, Kunming 650504, China
3
College of Life Science, Hubei Normal University, Huangshi 435002, China
*
Authors to whom correspondence should be addressed.
Sustainability 2025, 17(16), 7255; https://doi.org/10.3390/su17167255
Submission received: 1 July 2025 / Revised: 31 July 2025 / Accepted: 7 August 2025 / Published: 11 August 2025

Abstract

Inland aquatic ecosystems, encompassing lakes, reservoirs, and ponds, serve as vital repositories of water resources and provide essential ecological, social, and cultural services. Water color, a key indicator of water quality, reflects the complex interactions among physicochemical, biological, and environmental drivers. Heilong Pool (HP) in Southwest China, which consists of a Clear Pool (CP) and a Turbid Pool (TP), has recently exhibited an anomalous reddish-brown “pumpkin soup” phenomenon in the CP, while the TP remains unchanged. This unusual phenomenon has raised widespread public concern regarding water resource security and its potential association with geological disasters. To elucidate the ecological and geochemical mechanisms of this phenomenon, we employed a multifaceted analytical approach that included assessing nutrient elements, quantifying heavy metal concentrations, analyzing dissolved substances, characterizing algal community composition, and applying δD-δ18O isotope analytical models. Our findings illustrated that while Bacillariophyta predominate (>79.3% relative abundance) in the algal community of HP, they were not the primary determinant of water color changes. Instead, Fe(OH)3 colloidal particles, originating from groundwater–surface water interactions and controlled by redox environment dynamics periodically, emerged as the principal factors of the reddish-brown discoloration. The genesis of the “pumpkin soup” water coloration was attributed to the precipitation-induced displacement of anoxic groundwater from confined karst conduits. Subsequent exfiltration and atmospheric exposure facilitate oxidative precipitation, forming authigenic rust-hued Fe(OH)3 colloidal complexes. This study provides new insights into the geochemical and hydrological mechanisms underlying water color anomalies in karst-dominated catchments.

1. Introduction

Lakes, ponds, reservoirs, and rivers, as crucial components of inland water bodies, not only provide essential water resources for human survival but also play irreplaceable ecological roles in maintaining biodiversity and delivering cultural services [1,2,3,4]. However, the combined stresses of industrialization and urbanization, including land-use changes, pollutant inputs, and climate warming, are accelerating the degradation of aquatic ecosystems [5]. Water quality monitoring and the investigation of the causes of water quality decline are prerequisites for understanding these changes and formulating relevant policies [2]. “Water color” refers to the apparent color of a water body. Under standard conditions, water is a colorless and transparent liquid, whereas its true color is caused by the chromaticity produced by dissolved substances (<0.45 μm), which is determined by the quantity of suspended particles such as clay, phytoplankton, and colloidal particles [6]. The color of water, determined by the scattering and absorption of various components in the water, represents the comprehensive result of the interaction between sunlight and substances in the water. Water color is considered to be a core parameter reflecting the health diagnosis of aquatic environments [7].
Based on the Forel–Ule color scale, water body colors are classified into 21 levels, ranging from deep blue to yellow-brown, known as the Forel–Ule Index (FUI). The FUI is an important indicator of water quality in lakes, reservoirs, rivers, and oceans, showing a significant negative correlation with water body cleanliness and eutrophication status. Existing studies indicate that the spatiotemporal variability of the FUI is primarily controlled by multiple mechanisms, including mineral particle sedimentation [8], atmospheric shortwave scattering [9], humic substance concentration gradients [10], and phytoplankton community succession [11]. Leveraging visible and near-infrared spectral information captured by satellite or aerial sensors, scientists can retrieve key water quality parameters such as chlorophyll concentration, suspended particle content, and colored dissolved organic matter. This non-contact, large-scale monitoring approach provides unprecedented technological support for tracking water environment dynamics at scales ranging from coastal areas and lakes to the global level. For example, Shen et al. (2025) [10] analyzed the color changes of 67,579 lakes globally over a 40-year time series using Landsat-5, -7, and -8 datasets, identifying factors such as basin normalized difference vegetation index (NDVI), population, water volume changes, and lake area that may influence lake color variations. Ying et al. (2024) [12] conducted an FUI study on Chinese lakes, revealing a spatial pattern of “lower in the west and higher in the east, lower in the south and higher in the north.” The variation in FUI across different lake regions is driven by various factors, responding to seasonal changes in temperature, wind speed, and runoff [13]. Although satellite remote sensing technology has achieved global-scale dynamic monitoring of water color through multi-source spectral fusion [9], significant knowledge gaps remain in understanding the driving mechanisms of water color anomalies in special geological units (e.g., karst landscapes) and micro water bodies (e.g., ponds and wetlands). In particular, the color response differences between urban artificial water bodies and natural water systems, as well as the coupling effects of human activities and natural hydrological processes [13], urgently require interdisciplinary research for resolution.
In a typical karst landscape area in Southwest China, two adjacent pools, namely, the Clear Pool (CP, connected to groundwater, with an average depth of approximately 11 m) and Turbid Pool (TP, shallower, with an average depth of approximately 1 m), have been observed (Figure 1). Since 2010, the CP has abnormally exhibited a reddish-brown “pumpkin soup” phenomenon, while the adjacent TP has consistently maintained a stable, light yellow hue. Moreover, the abnormal color changes of the water bodies do not follow a clear annual pattern but are concentrated in the early to mid-rainy season (May to August) on a monthly scale. This unique landscape contrast has sparked public attention and cognitive conflicts, even leading to unscientific speculations such as earthquake precursors. Numerous water environment experts have attempted to analyze the phenomenon from the perspectives of water quality, tectonics, and hydrological patterns, but a systematic explanatory framework for the cause of water coloration has yet to be established.
This study focuses on Heilong Pool (HP) as a case study, aiming to (1) reveal the key factors of water color changes through water quality monitoring, the analysis of algal community structure succession, δD-δ18O isotope tracing to elucidate hydrological connectivity mechanisms, and the development of a conceptual hydrodynamic–solute transport framework to characterize groundwater–surface water interactions; (2) elucidate the biogeochemical processes that drive water color anomalies under unique karst geological conditions, and explore the interactions between small-scale water bodies and regional water cycles; and (3) contribute to improving water quality protection and management strategies in karst human settlements. Furthermore, this study offers new perspectives for the ecological management of similar landscape water bodies and provides reference insights for interpreting water color patterns under complex terrain conditions using remote sensing.

2. Study Area and Methods

2.1. Overview of the Study Area

Heilong Pool (HP), a karst spring, comprises two distinct water bodies: a Clear Pool (CP) and a Turbid Pool (TP). The eastern fault zone of HP features an extensive and deep geological structure that interconnects Carboniferous and Permian aquifers, forming a multi-stratigraphic aquifer complex where groundwater emerges to create the CP. These aquifers are primarily composed of coarse-crystalline dolomite, fine-crystalline dolomite, and micritic limestone. During periods of normal water color, this spring-fed pool exhibits notably higher clarity compared to the TP, covering an area of approximately 600 m2, with a maximum depth of 15 m, demonstrating discharge rates ranging between 82.78 and 365.5 L/s. In contrast, the TP is primarily recharged by shallow fissure water originating from the northeastern basaltic hills, which emerges as slope runoff in the foothill depression and accumulates to form the pool. Characterized by a shallower phreatic system than the CP, the TP displays yellowish-tinged waters spanning 2600 m2, with an average depth of 1 m. Due to its wide and shallow morphology and limited recharge, the TP exhibits weak water turnover capacity, with its discharge diminishing to as low as 3.75 L/s during drought periods.
HP (25°8′26′′ N, 102°44′46′′ E; 1914 m a.s.l.) is located at the foot of Wulao Mountain in Panlong District, Kunming City, Yunnan Province, Southwest China (Figure 1). It is one of the most renowned scenic spots in Kunming, attracting numerous visitors due to the striking contrast in water color between its two pools (CP and TP), which resemble the yin–yang symbol of Daoist philosophy. In addition to its aesthetic appeal, the site also holds potential value for exploration and utilization. HP lies within a subtropical plateau monsoon climate zone characteristic of low-latitude regions. This region is predominantly influenced by the warm and moist southwest monsoon originating from the Indian Ocean. Climatic features include ample solar radiation, a brief frost period, and a mean annual temperature of 15 °C. The long-term average annual precipitation in Kunming is 1006.7 mm, with an average monthly precipitation of 54.6 mm in 2023.

2.2. Sample Collection and Identification

Algal sampling collection was conducted at HP in response to observed water color variations. Two sampling campaigns were carried out in July 2021 (during the abnormal water color period) and July 2022 (during the normal water color period) at both the CP and TP. In the CP, sampling points were set at depths of 0.5 m below the water surface, at the 1/2 light penetration layer (with transparency depth measured as three times the transparency depth), and at the bottom of the light penetration layer, from which mixed samples were collected. In the TP, sampling was only conducted at the surface water depth of 0.5 m.
For phytoplankton community analysis, 1000 mL aqueous samples were fixed with Lugol’s iodine solution (1% final concentration) and gravimetrically concentrated to a standardized 30 mL volume following established sedimentation protocols [14]. Taxonomic enumeration was performed using calibrated Sedgewick-Rafter counting chambers under 400× magnification with an Olympus CX31 compound microscope [15]. The phytoplankton was identified to the species or genus level according to the book of Freshwater Algae of China–Systematics, Taxonomy and Ecology [16].
Based on the collection of relevant data from the study area and previous research, a total of four spring water samples were collected from the study area in July 2021 and July 2022. A multi-parameter water quality monitor (YSI-EXO2, Ltd., Xylem, Yellow Springs, OH, USA) was used to measure water quality parameters, including pH, water temperature (WT), dissolved oxygen (DO), and Oxidation–Reduction Potential (ORP). All probes were calibrated immediately prior to measurement, and the pH and ORP electrodes were stored in a 3 M potassium chloride solution when not in use [17]. Field measurements of pH and ORP (converted to Eh in volts) were plotted as individual data points, with each point corresponding to a specific sampling depth. The distribution of these points within different stability domains was then used to infer the dominant Fe species.
Nutrient analysis followed standardized spectrophotometric protocols: Total nitrogen was quantified via alkaline potassium persulfate digestion (120 °C, 30 min) followed by UV-Vis determination at 220 nm and 275 nm wavelengths (GB11894-89). Total phosphorus determination employed persulfate-assisted acid digestion (0.15 MPa, 120 °C, 30 min) with subsequent molybdenum blue reaction measured at 700 nm (GB 11893-89).
The analytical protocols for nitrate nitrogen (NO3-N) and orthophosphate (PO43−-P) shared the same UV spectrophotometry system as total nitrogen (TN) and total phosphorus (TP), but they differed in that filtered water samples (0.45 μm GF/C) were analyzed directly without digestion. NO3-N was determined by dual-wavelength correction (220 nm and 275 nm) to eliminate dissolved organic matter interference, while PO43−-P was quantified via molybdenum blue reaction (700 nm) using ascorbic acid reduction.
Chlorophyll-a (Chl-a) extraction utilized cold acetone (90% v/v, 4 °C, 24 h) with centrifugation (4000× g, 10 min), quantified through tetrachromatic equations with absorbance measurements at 664, 647, 630, and 750 nm using a Shimadzu UV-2600 spectrophotometer (HJ 897-2017). The dissolved organic carbon (DOC) in the samples was filtered (<0.45 μm membrane) and determined by a TOC–L CPN CN200. Standard samples were prepared from potassium hydrogen phthalate (KHP > 99.99%) in Milli-Q water [18].
Meanwhile, the stable hydrogen and oxygen isotopes in the water samples were measured via cavity ring-down spectroscopy, using an isotopic water analyzer (Picarro L2140, Ltd., Picaro Inc., Santa Clara, CA, USA). To ensure data accuracy, one isotopic standard material was measured simultaneously for every ten samples. Each sample and standard was analyzed seven times, with the first three measurements discarded to avoid the memory effect. Subsequently, the last four measurements were averaged to obtain the final value for each sample or standard. Data for the δD and δ18O composition of the Local Meteoric Water Line (LMWL) were sourced from the Chinese online isotope database, as compiled by [19], using the Vienna Standard Mean Ocean Water (VSMOW) as the reference:
δ = R s R V S M O W R V S M O W
where R s represents the 18O/16O or 2H/1H ratio of the sample, and R V S M O W refers to the Vienna Standard Mean Ocean Water. The δ18O and δD test accuracies were less than 0.8‰ and 0.1‰, respectively, within 24 h.

2.3. Species Diversity Analysis

The following indicators were used to characterize species diversity:
(1) Margalef Richness Index [20]:
d = S 1 ln N
(2) Shannon Index [21]:
H = i = 1 s N i N ln N i N
(3) Simpson Dominance Index [22]:
λ = 1 i = 1 s N i N i 1 N N 1
(4) Pielou Evenness Index [23]:
J = H ln S
where S is the total number of species in the sample plot, N is the total number of individuals of all species in the sample plot, and N i is the total number of individuals of species i in the sample plot.

3. Results and Discussion

3.1. Phytoplankton Community Structure and Dominant Species

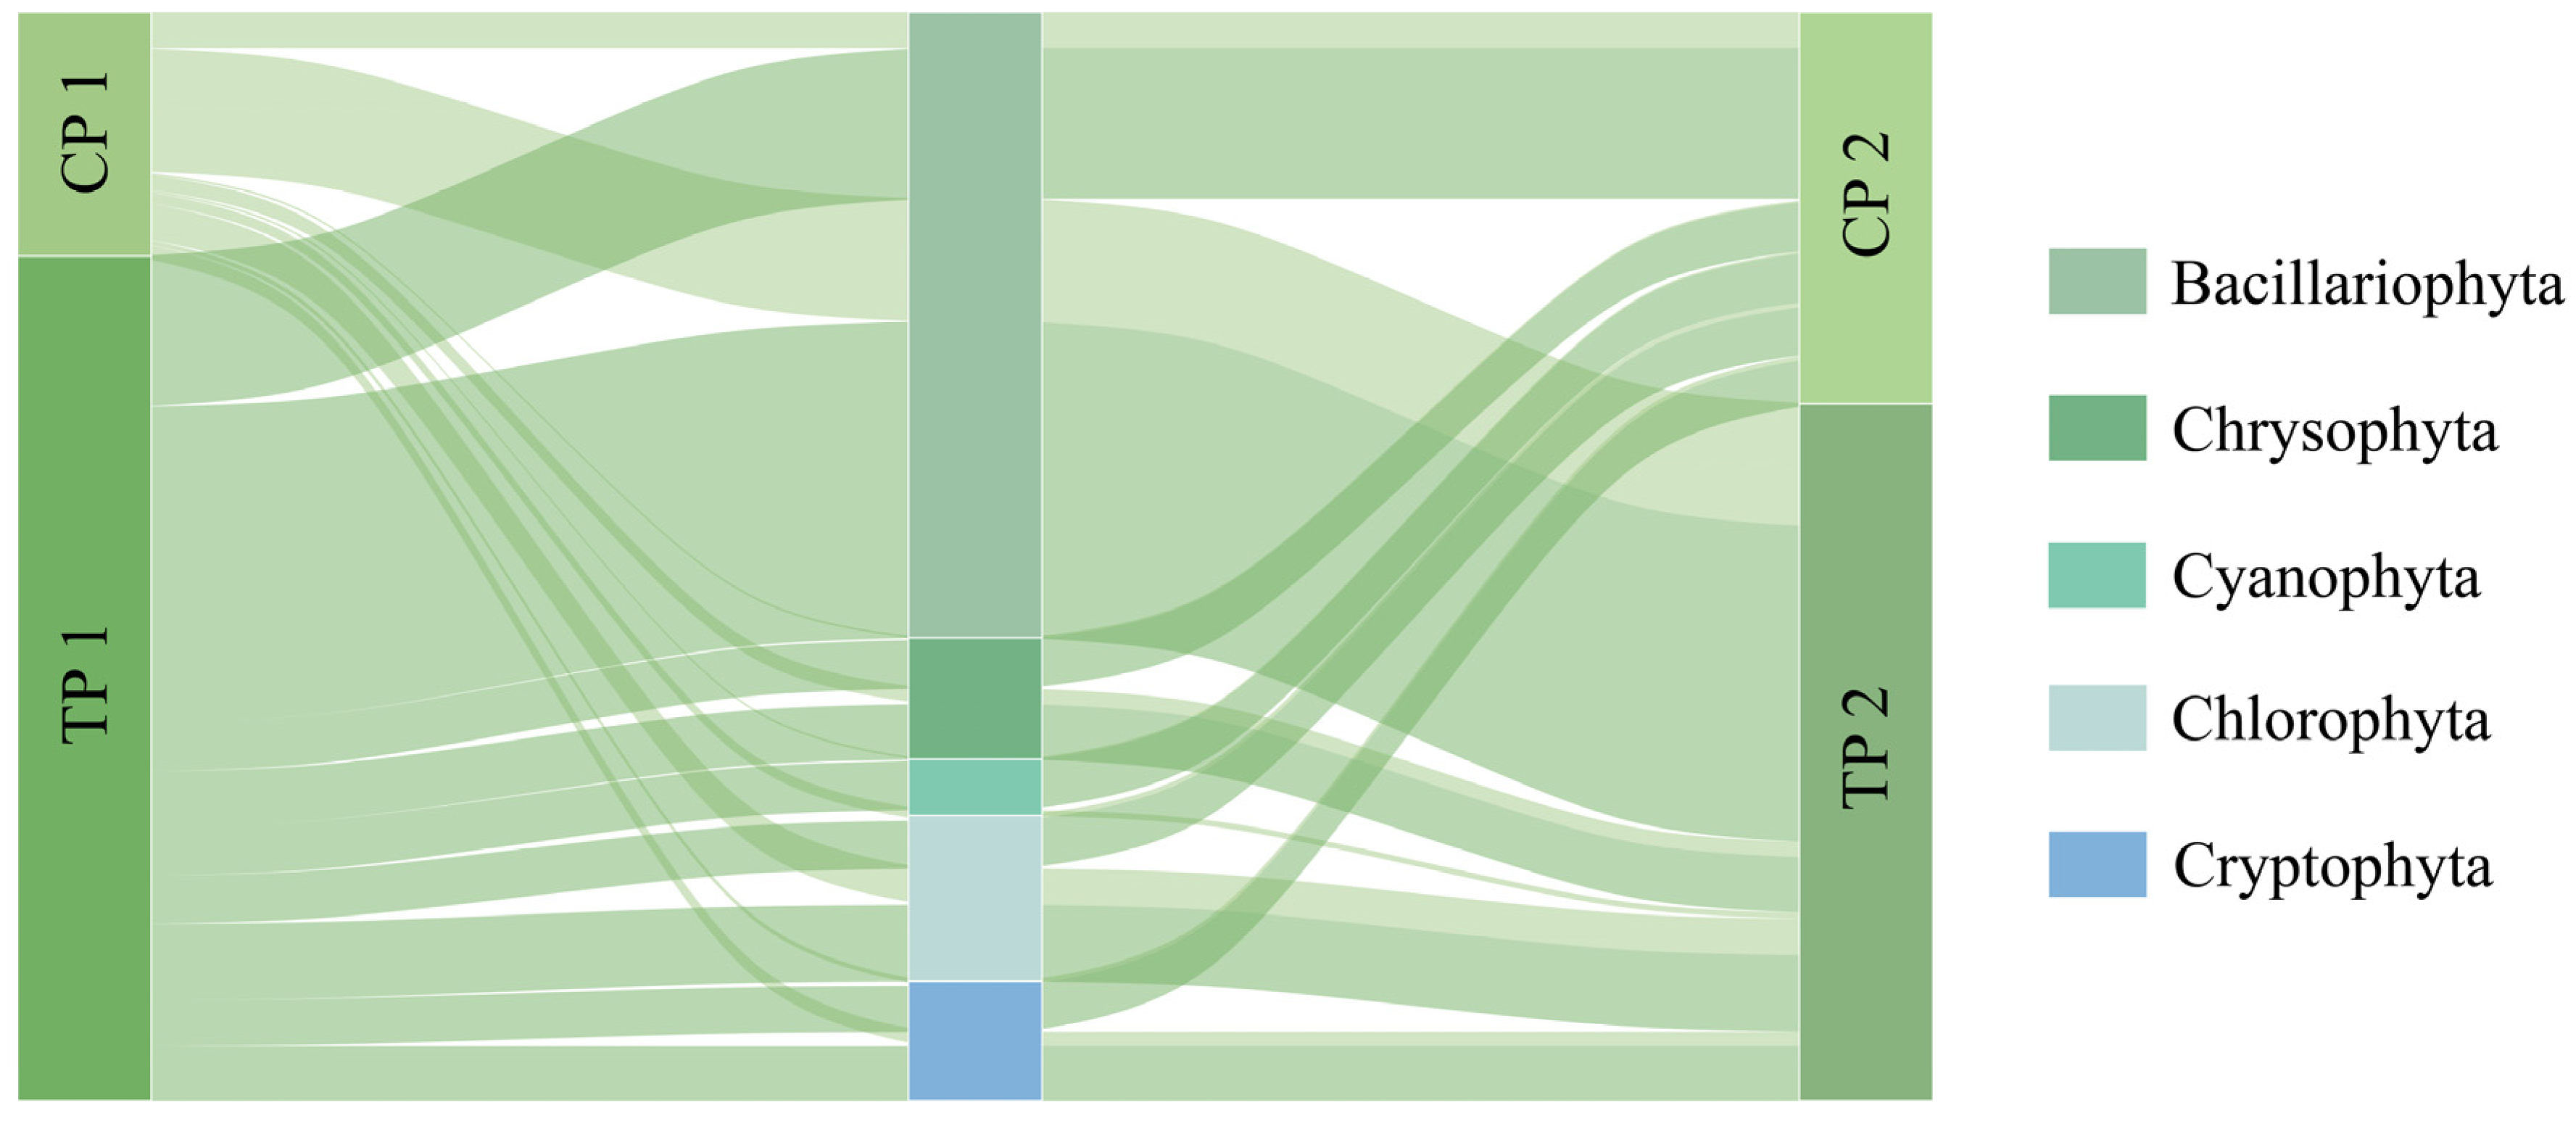
The phytoplankton assemblage in HP demonstrates moderate biodiversity (Table S1), encompassing 53 morphospecies distributed across 39 genera from 7 phyla. Taxonomic composition analysis revealed the following phylogenetic distribution: Cyanophyta (3 genera), Bacillariophyta (7 genera, dominance contributors), Chlorophyta (19 genera), Euglenophyta (2 genera), Chrysophyta (5 genera), Cryptophyta (2 genera), and Dinophyta (1 genus). Community structure exhibited pronounced phylum-level dominance, with Bacillariophyta constituting 79.3% of the total biomass, followed by Chlorophyta at 14.4% (Figure 2). Comparative interannual analysis showed significantly elevated algal cellular densities in July 2021 (8.17 × 10⁶ ± 1.2 × 10⁶ cells L−1) versus July 2022 (2.95 × 10⁶ cells L−1). The 2021 bloom event featured extraordinary proliferation of Aulacoseira (Bacillariophyta), reaching peak densities of 72.2 × 10⁶ cells L−1, which exceeded the contemporary co-occurring taxa by two orders of magnitude (Table S1). Subsequent monitoring revealed a 96.3% reduction in Aulacoseira biomass by 2022 (2.69 × 10⁶ cells L−1), though it maintained its ecological dominance within restructured communities (Table S1).
The diversity analysis results showed that the Margalef and Shannon indices of TP1 were significantly higher than those of CP2 (CP1: 1.01 vs. TP1 = 1.52; CP1: 1.77 vs. TP1: 2.07). The Simpson index of TP1 was also relatively higher than that of CP1 (CP1: 0.74 vs. TP1: 0.78). Although the Pielou index of CP1 was slightly higher than that of TP1 (CP1: 0.63 vs. TP1: 0.62), the difference was minimal. These results suggest that TP1 harbored a greater richness of algal species compared to CP1, whereas the algal community in CP1 exhibited a more even distribution of individuals. The Margalef index between CP2 and TP2 showed no significant difference, while the Shannon, Simpson, and Pielou indices of CP2 were slightly higher than those of TP2. This indicates that CP2 may have a slightly higher algal richness with a more even distribution. Aulacoseira was identified as the dominant genus in the HP ecosystem.
Based on the analysis of algal community structure in HP (Table S1), the total algal abundance in the TP was consistently much higher than in the CP and remained at a relatively elevated level. Although the diversity indices between the CP and TP showed no substantial overall differences across the two sampling periods (Table 1), the CP exhibited a notably low algal diversity index in 2021, followed by a marked recovery in 2022. This pattern may suggest the influence of certain external factors—such as inflow of subterranean floodwaters or inputs of heavy metal contaminants—that led to a short-term decline in algal species richness in the CP. However, the specific mechanisms behind this phenomenon require further investigation.
The TP has a larger surface water area and a shallower depth compared to the CP. A large number of ornamental fish and turtles are kept in the TP, and tourists feed them bait all year round. As a result, the primary productivity in the water body is relatively high. Human intervention in the form of frequent feeding by tourists significantly boosts the nutrient load in the TP. The respiration of fish and the decomposition of organic matter, in turn, accelerate the consumption of DO. Moreover, the TP’s lower water exchange rate limits its self-purification capacity. Consequently, it experiences a much higher level of eutrophication than the CP, accompanied by increased water turbidity. Generally, the water in the TP is cloudier in color and has lower transparency compared to that in the CP.
Aulacoseira is a major dominant genus in both the CP and TP (Table 1). Aulacoseira is a genus of the family Aulacoseiraceae within the phylum Bacillariophyta, widely distributed across freshwater ecosystems worldwide [24]. Its high diversity and dominant population abundance have been frequently reported in various aquatic environments, including rivers, lakes, reservoirs, and estuaries [25,26,27,28]. Wang et al. (2020) further demonstrated that the morphological characteristics of Aulacoseira can serve as indicators of eutrophic conditions in aquatic environments [29].
In aquatic ecosystems, dominant algal species often serve as important environmental indicators [30,31]. Particularly in waters experiencing algal blooms, changes in water color are frequently attributed to algal factors. From a landscape perspective, when the density of dominant algae reaches a certain threshold, their characteristic pigments selectively absorb and diffract light, causing the water to exhibit specific colors [32]. For instance, waters dominated by cyanobacteria often appear blue-green, while dinoflagellates or euglenophytes may result in reddish-brown waters. However, it is important to note that existing studies have not found significant effects of Aulacoseira on water color. In contrast, algae commonly associated with significant reddening phenomena, such as Euglena, Alexandrium, Gymnodinium, and Peridinium, were either absent or present in extremely low quantities in HP. This makes it unlikely that they play a significant role in the water color change. Therefore, we can infer that the dominant algal species in HP did not play a major role in the development of the “pumpkin soup” phenomenon.

3.2. Comparison of Water Quality Physicochemical Parameters

Algal-induced color changes are generally a significant cause of water color variation, making the in-depth analysis of the water quality environment in HP crucial for verifying the impact of algae on water color changes. Previous studies have demonstrated that external pollution, leading to nutrient overloads of nitrogen and phosphorus, can significantly increase the primary productivity of aquatic ecosystems, resulting in eutrophication and abnormal algal blooms [33]. However, our research found that, during the period of abnormal reddening in the CP, the concentrations of total nitrogen, total phosphorus, dissolved total nitrogen, and dissolved total phosphorus were all lower than in the TP (Table 2). Furthermore, the TP exhibited a relatively stable water color. In addition, there were higher Chl-a concentrations in the TP in both observation periods compared to the CP, suggesting higher phytoplankton biomass and a more stable eutrophic state in the TP. In contrast, the lower nutrient levels during the period of water color change in the CP further indicated that algal biomass was not the dominant factor driving the water color change in the CP. Therefore, based on the low nutrient concentrations (Table 2), low algal abundance (Table S1), and the striking decline in algal diversity indices during the discoloration period in the CP (Table 1), we can infer that environmental factors specific to the karst terrain played a critical role in driving the water color changes observed in the CP.
In addition, the CP and TP exhibit pronounced differences in both WT and DO levels. Specifically, the WT in the CP is significantly lower than that in the TP, which reflects their distinct recharge sources—the CP is recharged by karst groundwater, while the TP is primarily fed by surface runoff. This distinction contributes to a more comprehensive understanding of the unique karst geomorphological characteristics of the HP region.
Algae are commonly considered to be a key driver of water color changes [34], but water color variation is influenced by a variety of factors [35,36]. Environmental factors such as groundwater recharge, fluctuations in mineral content, and redox reactions can significantly impact the color of spring waters [37,38], especially under karst topography. This finding underscores the importance of integrating hydrogeochemical processes into the interpretation of water color dynamics in karst environments.
Numerous previous studies have demonstrated that dissolved substances, including mineral ions, humic substances, and Chl-a, can lead to changes in water color [39,40,41]. To identify whether sediment particles in the water, such as minerals like iron oxide and manganese oxide, cause water discoloration, we analyzed the dissolved heavy metal ions in the water. The results are shown in Table 3. Among them, iron minerals, which are most likely to cause discoloration, had concentrations of 4.85 × 10² μg L−1 in the CP and 6.01 × 10² μg L−1 in the TP. The results indicated that the concentration of dissolved Fe in the CP, which turned “pumpkin soup”-colored, was lower than that in the TP. There were no significant differences in other dissolved heavy metal ions between the CP and the TP. The results suggested that the dissolved particulate matter in the water body (<0.45 μm) was not responsible for the observed color change.

3.3. Role of Fe(OH)3 Colloids in Water Coloration

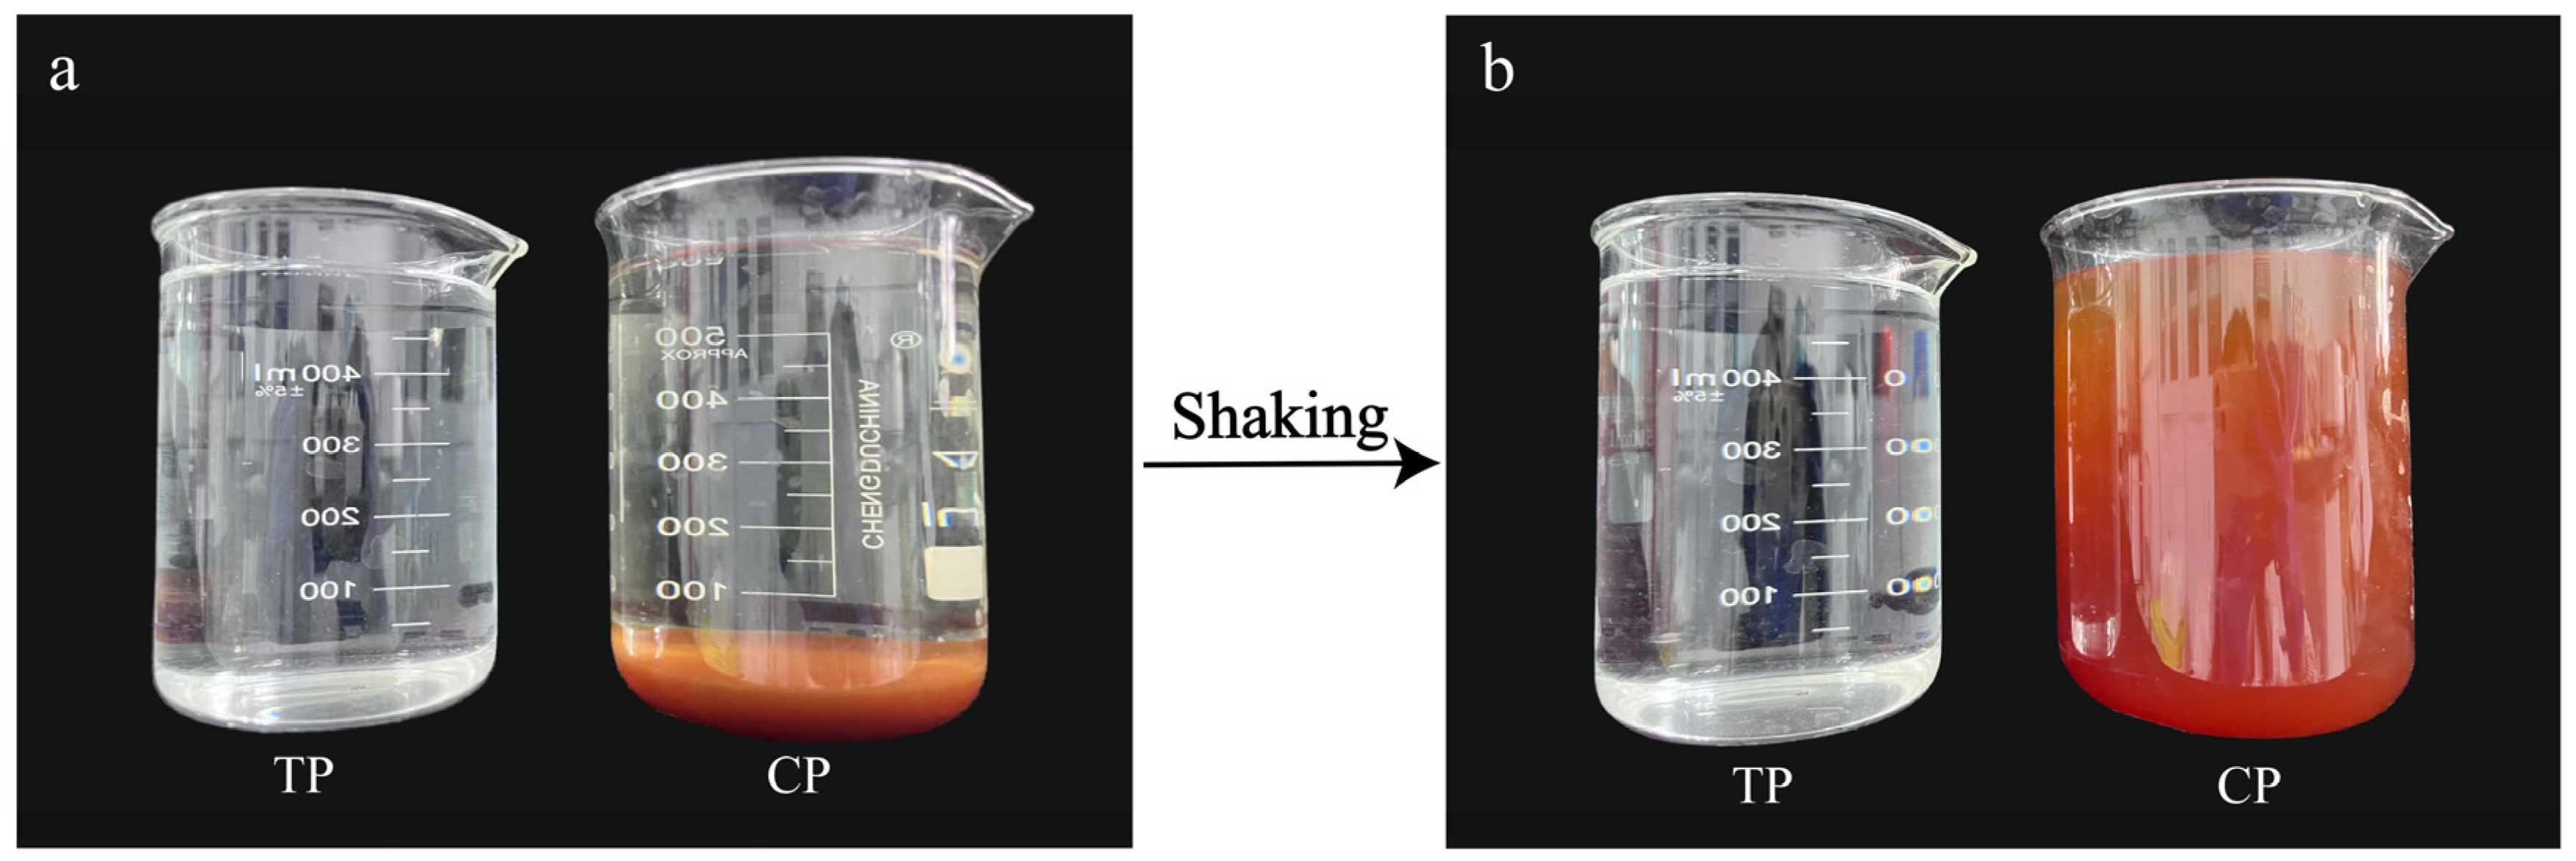
Solid particulate matter in the water body could potentially cause changes in the water color. In 2021, water samples collected from the CP and the TP precipitated within 24 h, with the water color changing from reddish-brown to transparent. When the water samples were shaken or stirred, the solid particulate matter was resuspended, making the water turbid and reddish-brown, consistent with the “pumpkin soup” color (Figure 3). Previous studies have shown that Fe and Mn ions could lead to the accumulation of sediments in water supply systems, thereby affecting the color and turbidity of groundwater [42]. In summary, the “pumpkin soup”-like color in the CP may have resulted from the generation of a large amount of solid particulate matter in the water body, most likely Fe(OH)3 colloidal precipitates.
To verify the above hypothesis, we simulated this process in the laboratory. That is, we injected FeCl2 solution into the uncolored water body in a reducing environment (DO = 0 mg L−1) and found no obvious changes. On the other hand, in an oxidizing environment, we observed reddish-brown colloidal precipitates similar to the “pumpkin soup” color. Based on this finding, we can infer that the groundwater in HP, which interacts with the underlying rock layers through cracks or channels, may have undergone redox changes, which affect the species and migration of Fe in the groundwater. During this process, Fe2+ is oxidized to Fe3+ in an oxidizing environment, forming Fe(OH)3 precipitates suspended in the water, resulting in a reddish-brown color change.
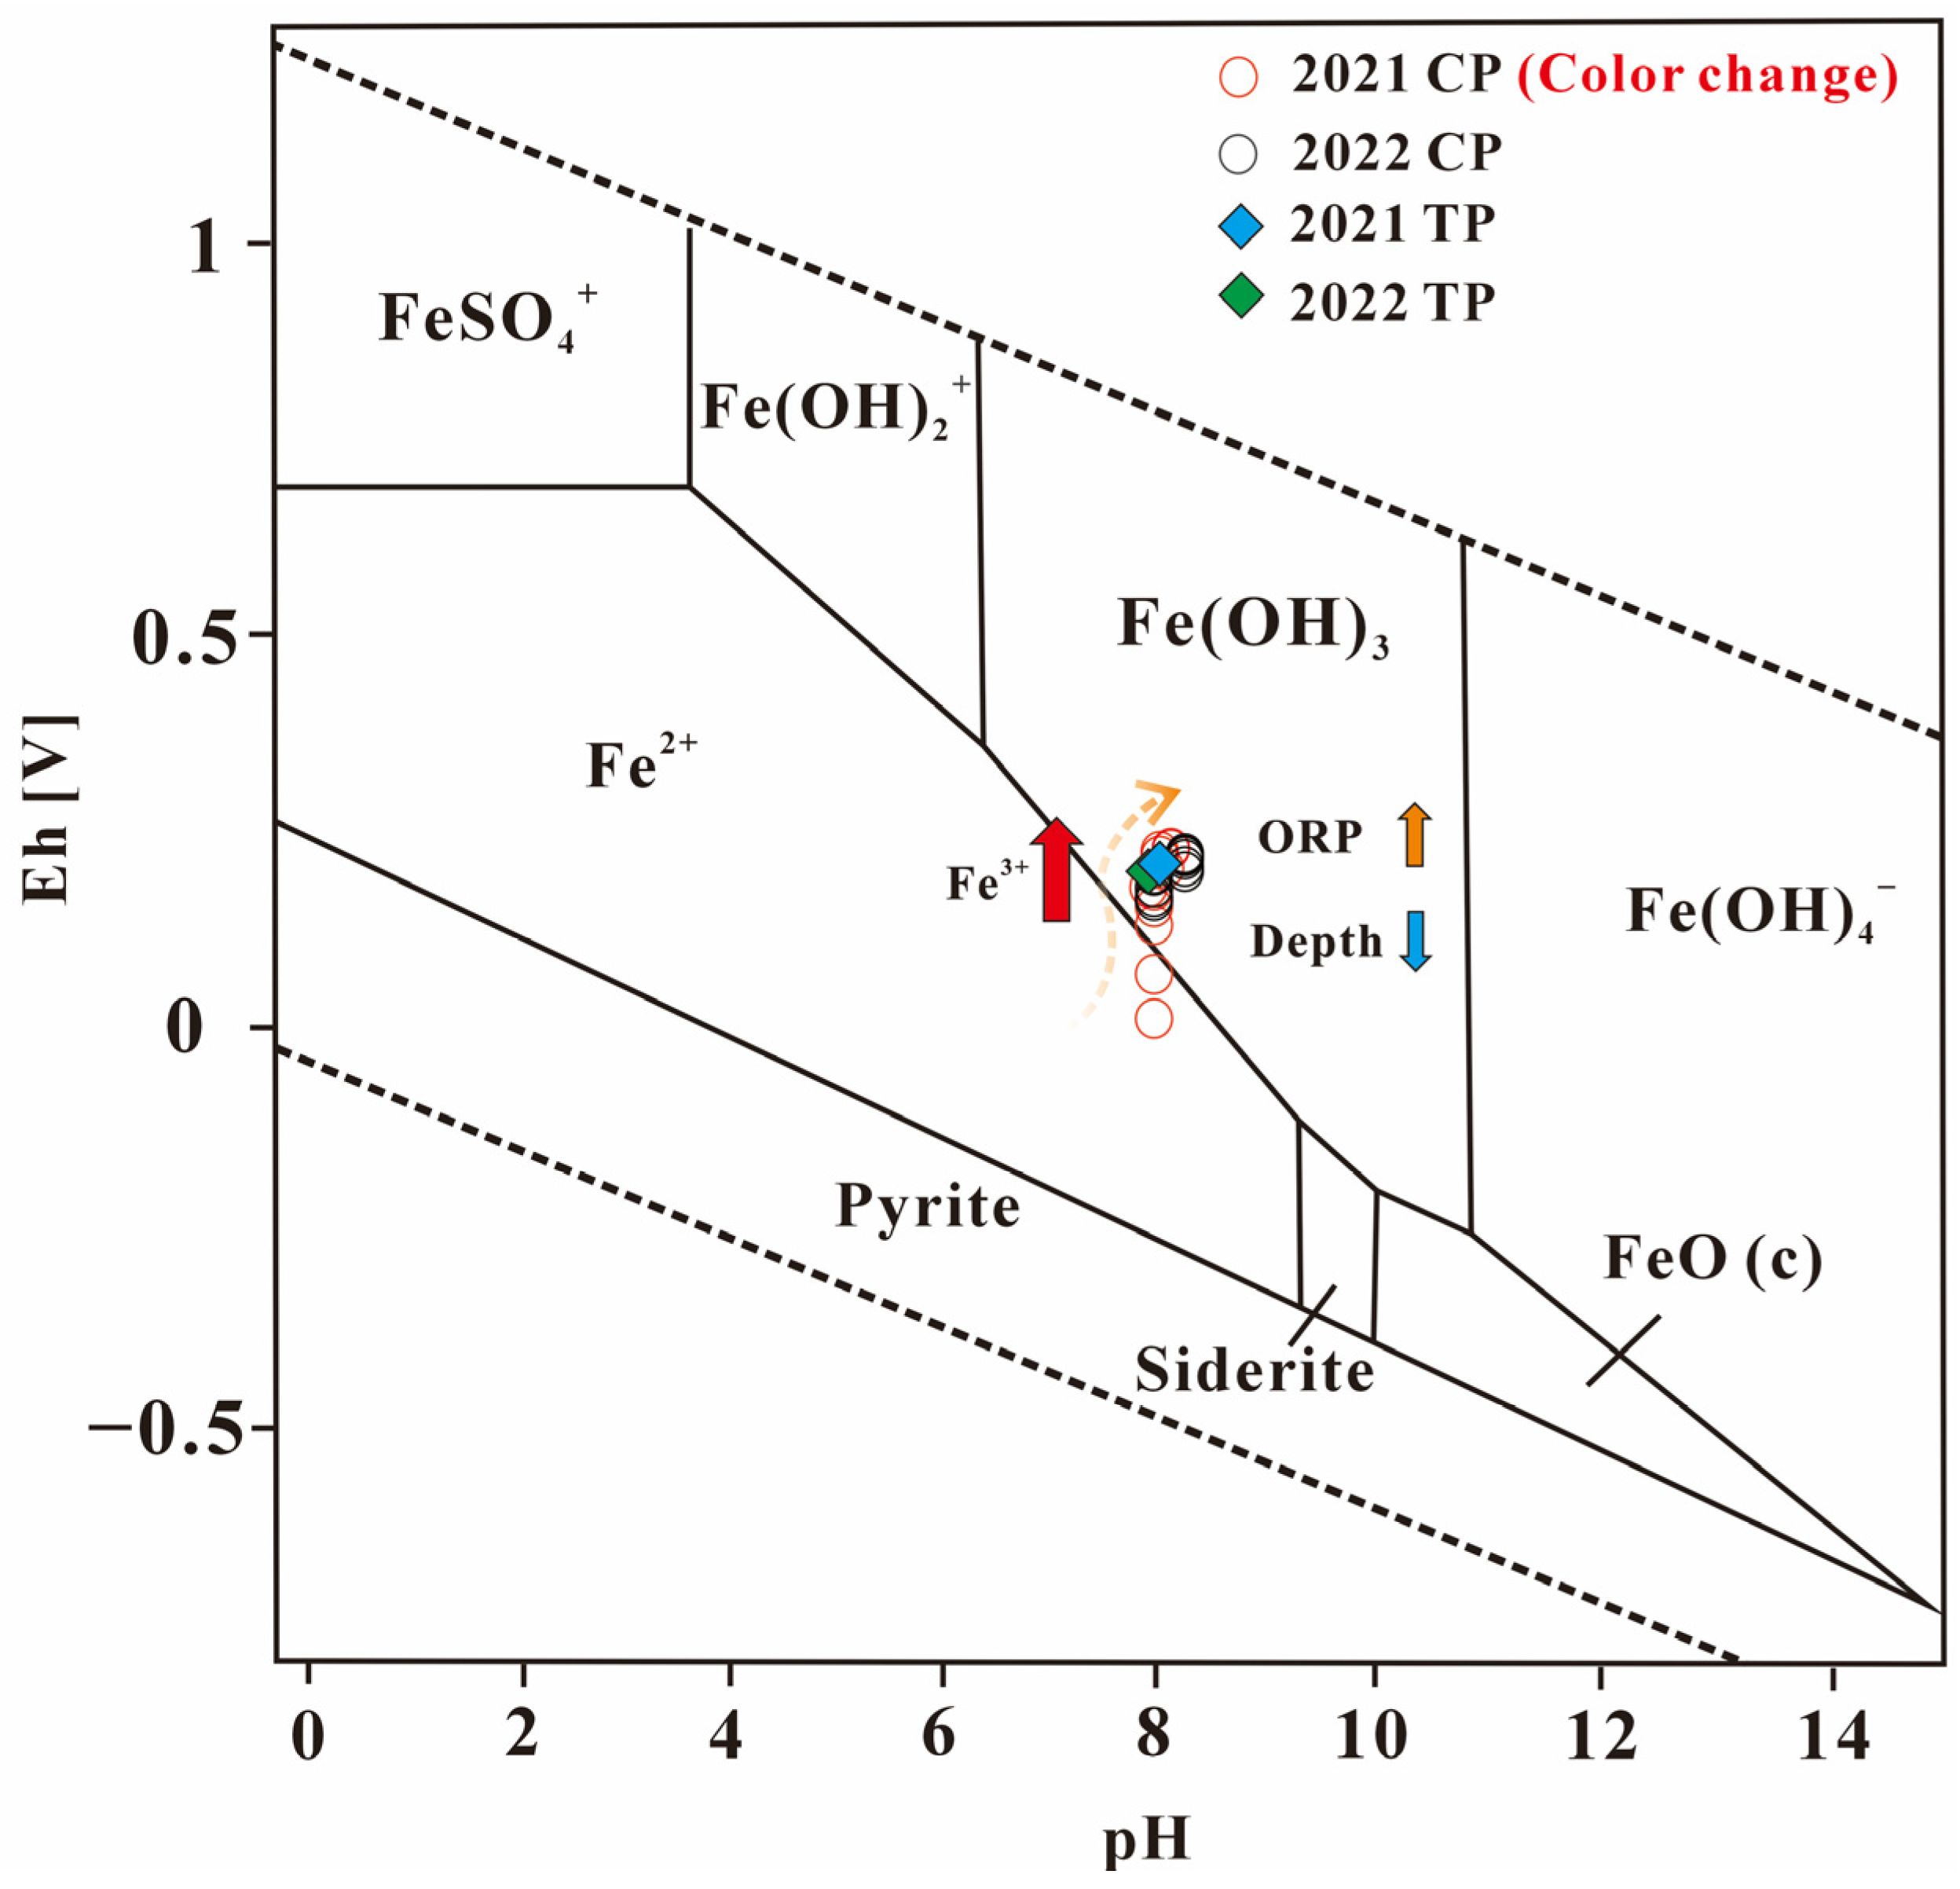
To further verify whether the water color changes in the CP were caused by the formation of Fe(OH)3, an Eh–pH phase diagram of the Fe–H2O system was constructed, with the vertical profile data of CP1 and CP2 projected (Figure 4). Most of the data points fell within the stability field of Fe(OH)3, indicating that the hydrochemical conditions in the CP were favorable for ferric hydroxide precipitation, which explains the reddish-brown coloration of the water. Notably, several CP1 points were plotted within the Fe2+ stability field and showed a depth-dependent transition toward the Fe(OH)3 domain from deeper to shallower layers. This distribution suggests that, during the discoloration period, the deeper waters of CP1 provided redox conditions favorable for the stability and upward migration of Fe2+, which was subsequently oxidized to form Fe(OH)3. In contrast, all CP2 samples were confined to the Fe(OH)3 stability field, with no evidence of conditions favoring Fe2+. This implies that, under normal circumstances, reductive processes in the aquifer were insufficient to mobilize ferrous iron, thereby preventing the initiation of the Fe2+ oxidation–precipitation pathway and maintaining a stable water color. In other words, prolonged hydraulic retention in karst conduits—inducing progressive DO depletion—establishes the essential geochemical prerequisite for water discoloration by facilitating the reductive dissolution of Fe-bearing minerals and subsequent Fe2+ mobilization. Under dynamic flow conditions lacking sustained stagnation, iron remains predominantly in the oxidized Fe3+ state due to aerobic conditions, thereby suppressing the formation of reddish-brown ferric oxyhydroxide colloids. This redox-controlled mechanism conclusively explains the stochastic occurrence of discoloration events in the CP, which are triggered by episodic stagnation anomalies rather than periodic hydrological fluctuations.
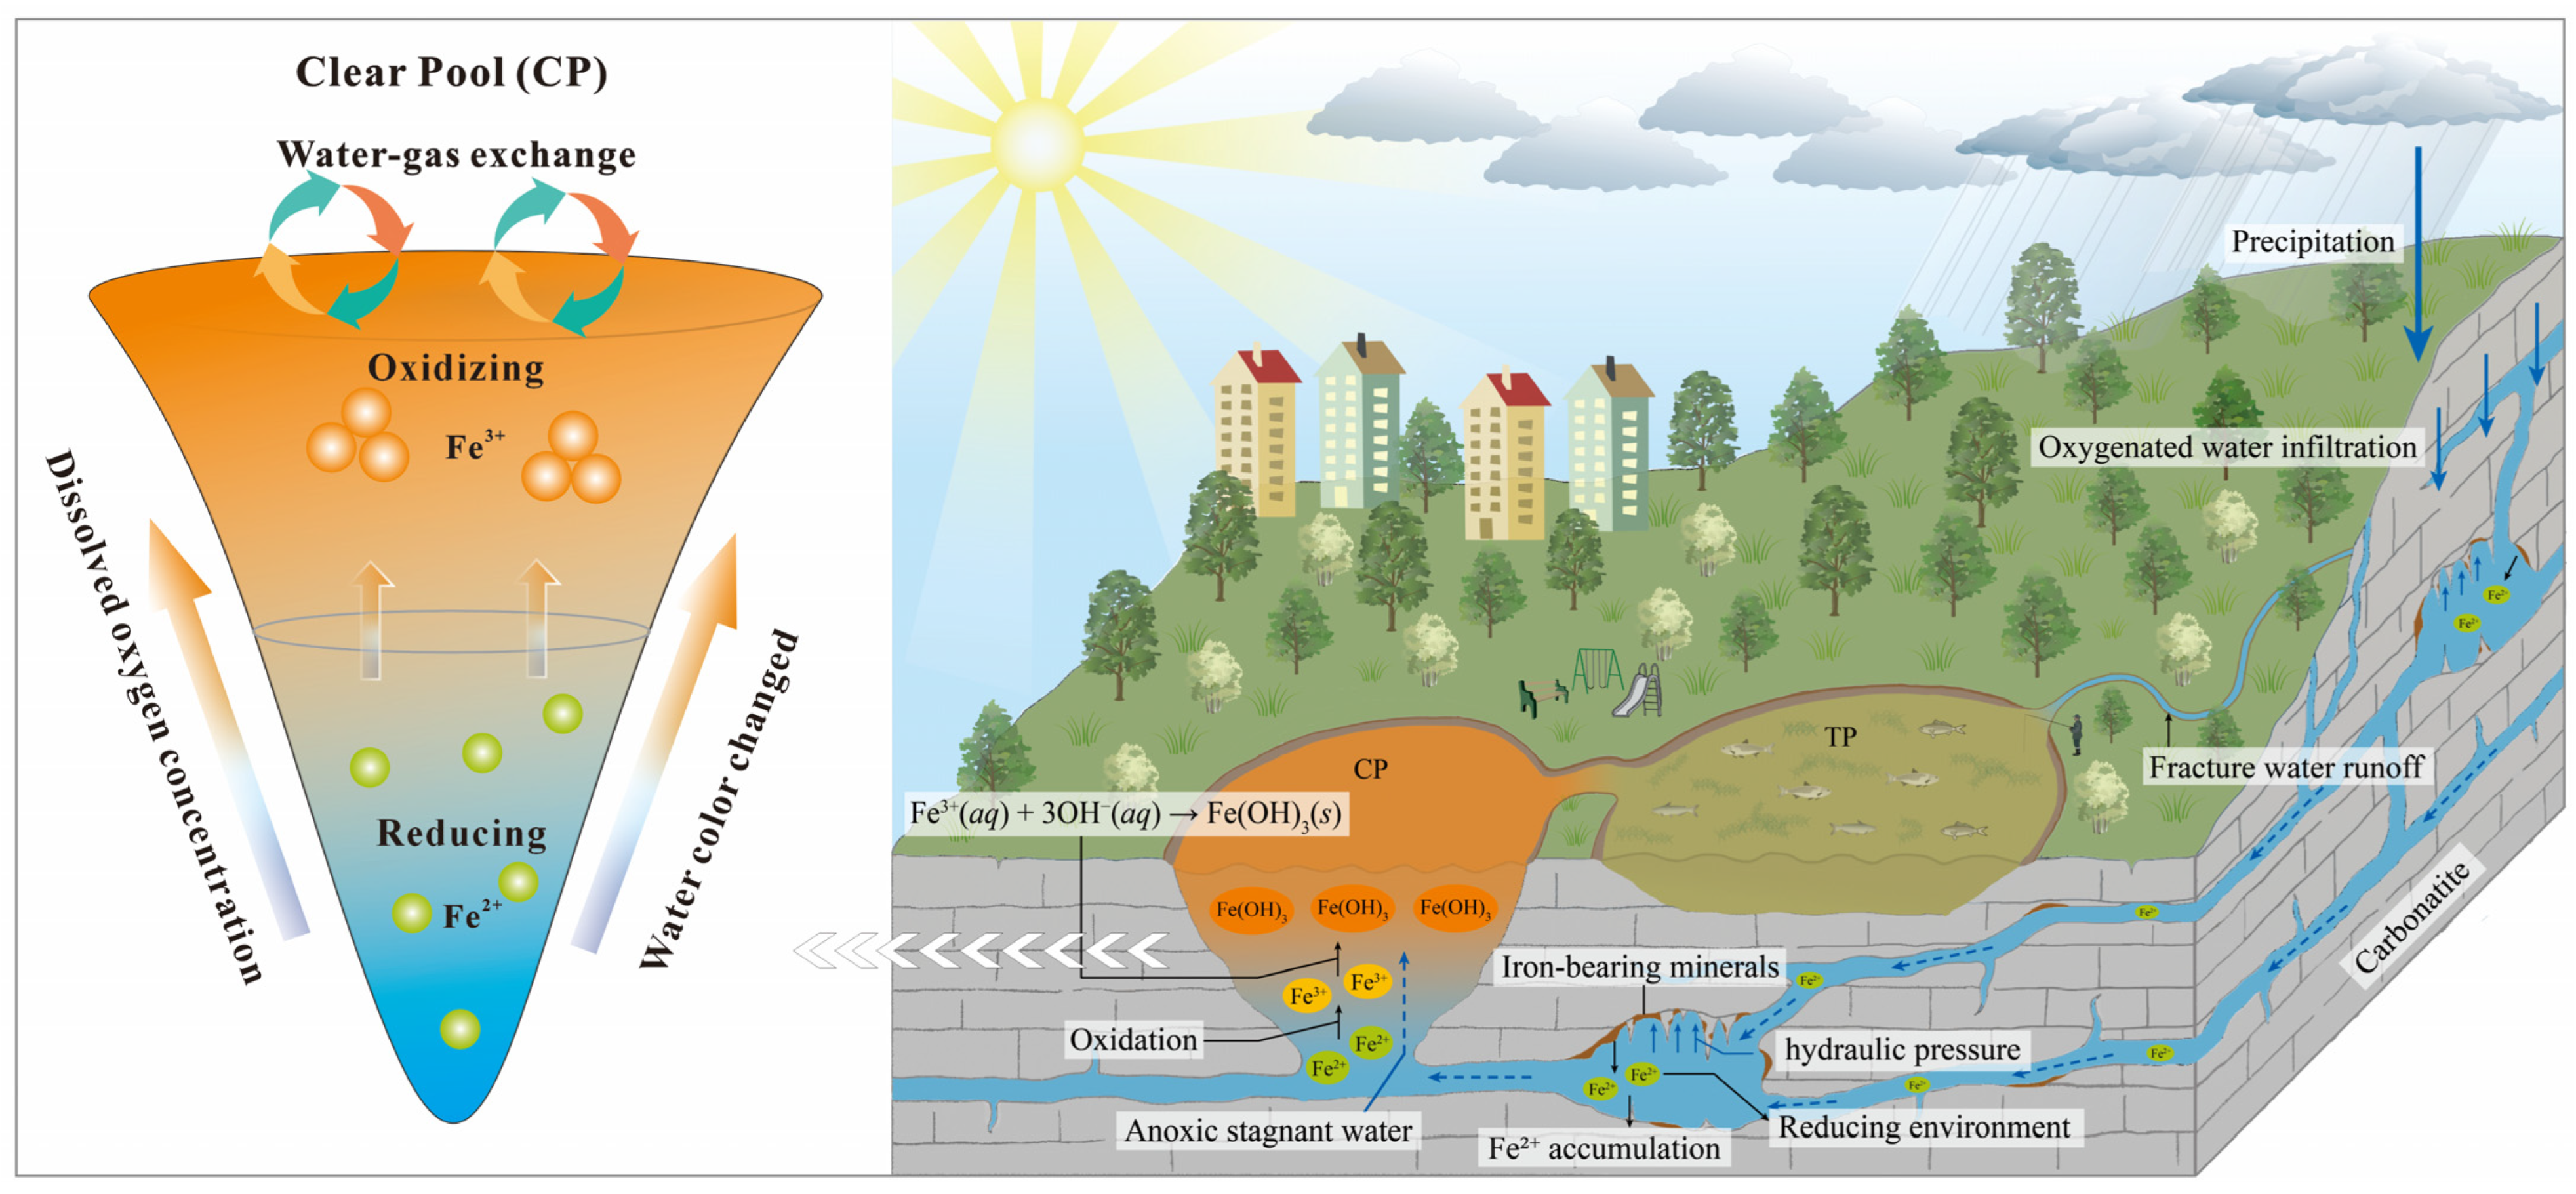
These results reveal a periodic mechanism of Fe release in CP groundwater. In confined and anoxic karst environments, iron-bearing minerals undergo continuous reductive dissolution, gradually releasing and accumulating dissolved Fe2+, considered here as a “subsurface Fe reservoir”. Over time, as Fe2+ accumulation approaches the reservoir’s storage capacity, fluctuations in groundwater levels induced by rainfall or hydraulic pressure mobilize Fe2+-rich waters into the ascending spring. Upon exposure to oxygenated conditions, Fe2+ is rapidly oxidized and precipitates as Fe(OH)3 colloids, producing the characteristic “pumpkin soup” phenomenon. Following this release, the aquifer returns to a relatively Fe-poor state and begins a new cycle of Fe2+ accumulation. This dual control of redox processes and groundwater dynamics represents the fundamental driver of the periodic water color anomalies observed in the CP.

3.4. Mechanistic Exploration of Water Color Variations in HP

Based on the above analysis, we have ascertained that Fe(OH)3 precipitation is the principal cause of the “pumpkin soup” phenomenon. However, its formation is not solely contingent upon redox conditions but is also substantially influenced by groundwater dynamics. The contrasting hydrological systems of the CP and TP—shaped by HP’s distinctive karst topography—highlight the independence of their recharge sources and flow pathways. Specifically, the CP is primarily sustained by deep confined karst aquifers, while the TP is mainly sustained by slope runoff resulting from the emergence of shallow fissure water. Groundwater flow through karst fractures and conduits serves as the primary pathway for solute transport into the water body. This hydrological separation governs the differences in water quality and mineral distribution between the two pools, and it serves as a key driver of the landscape and water color disparities observed at HP.
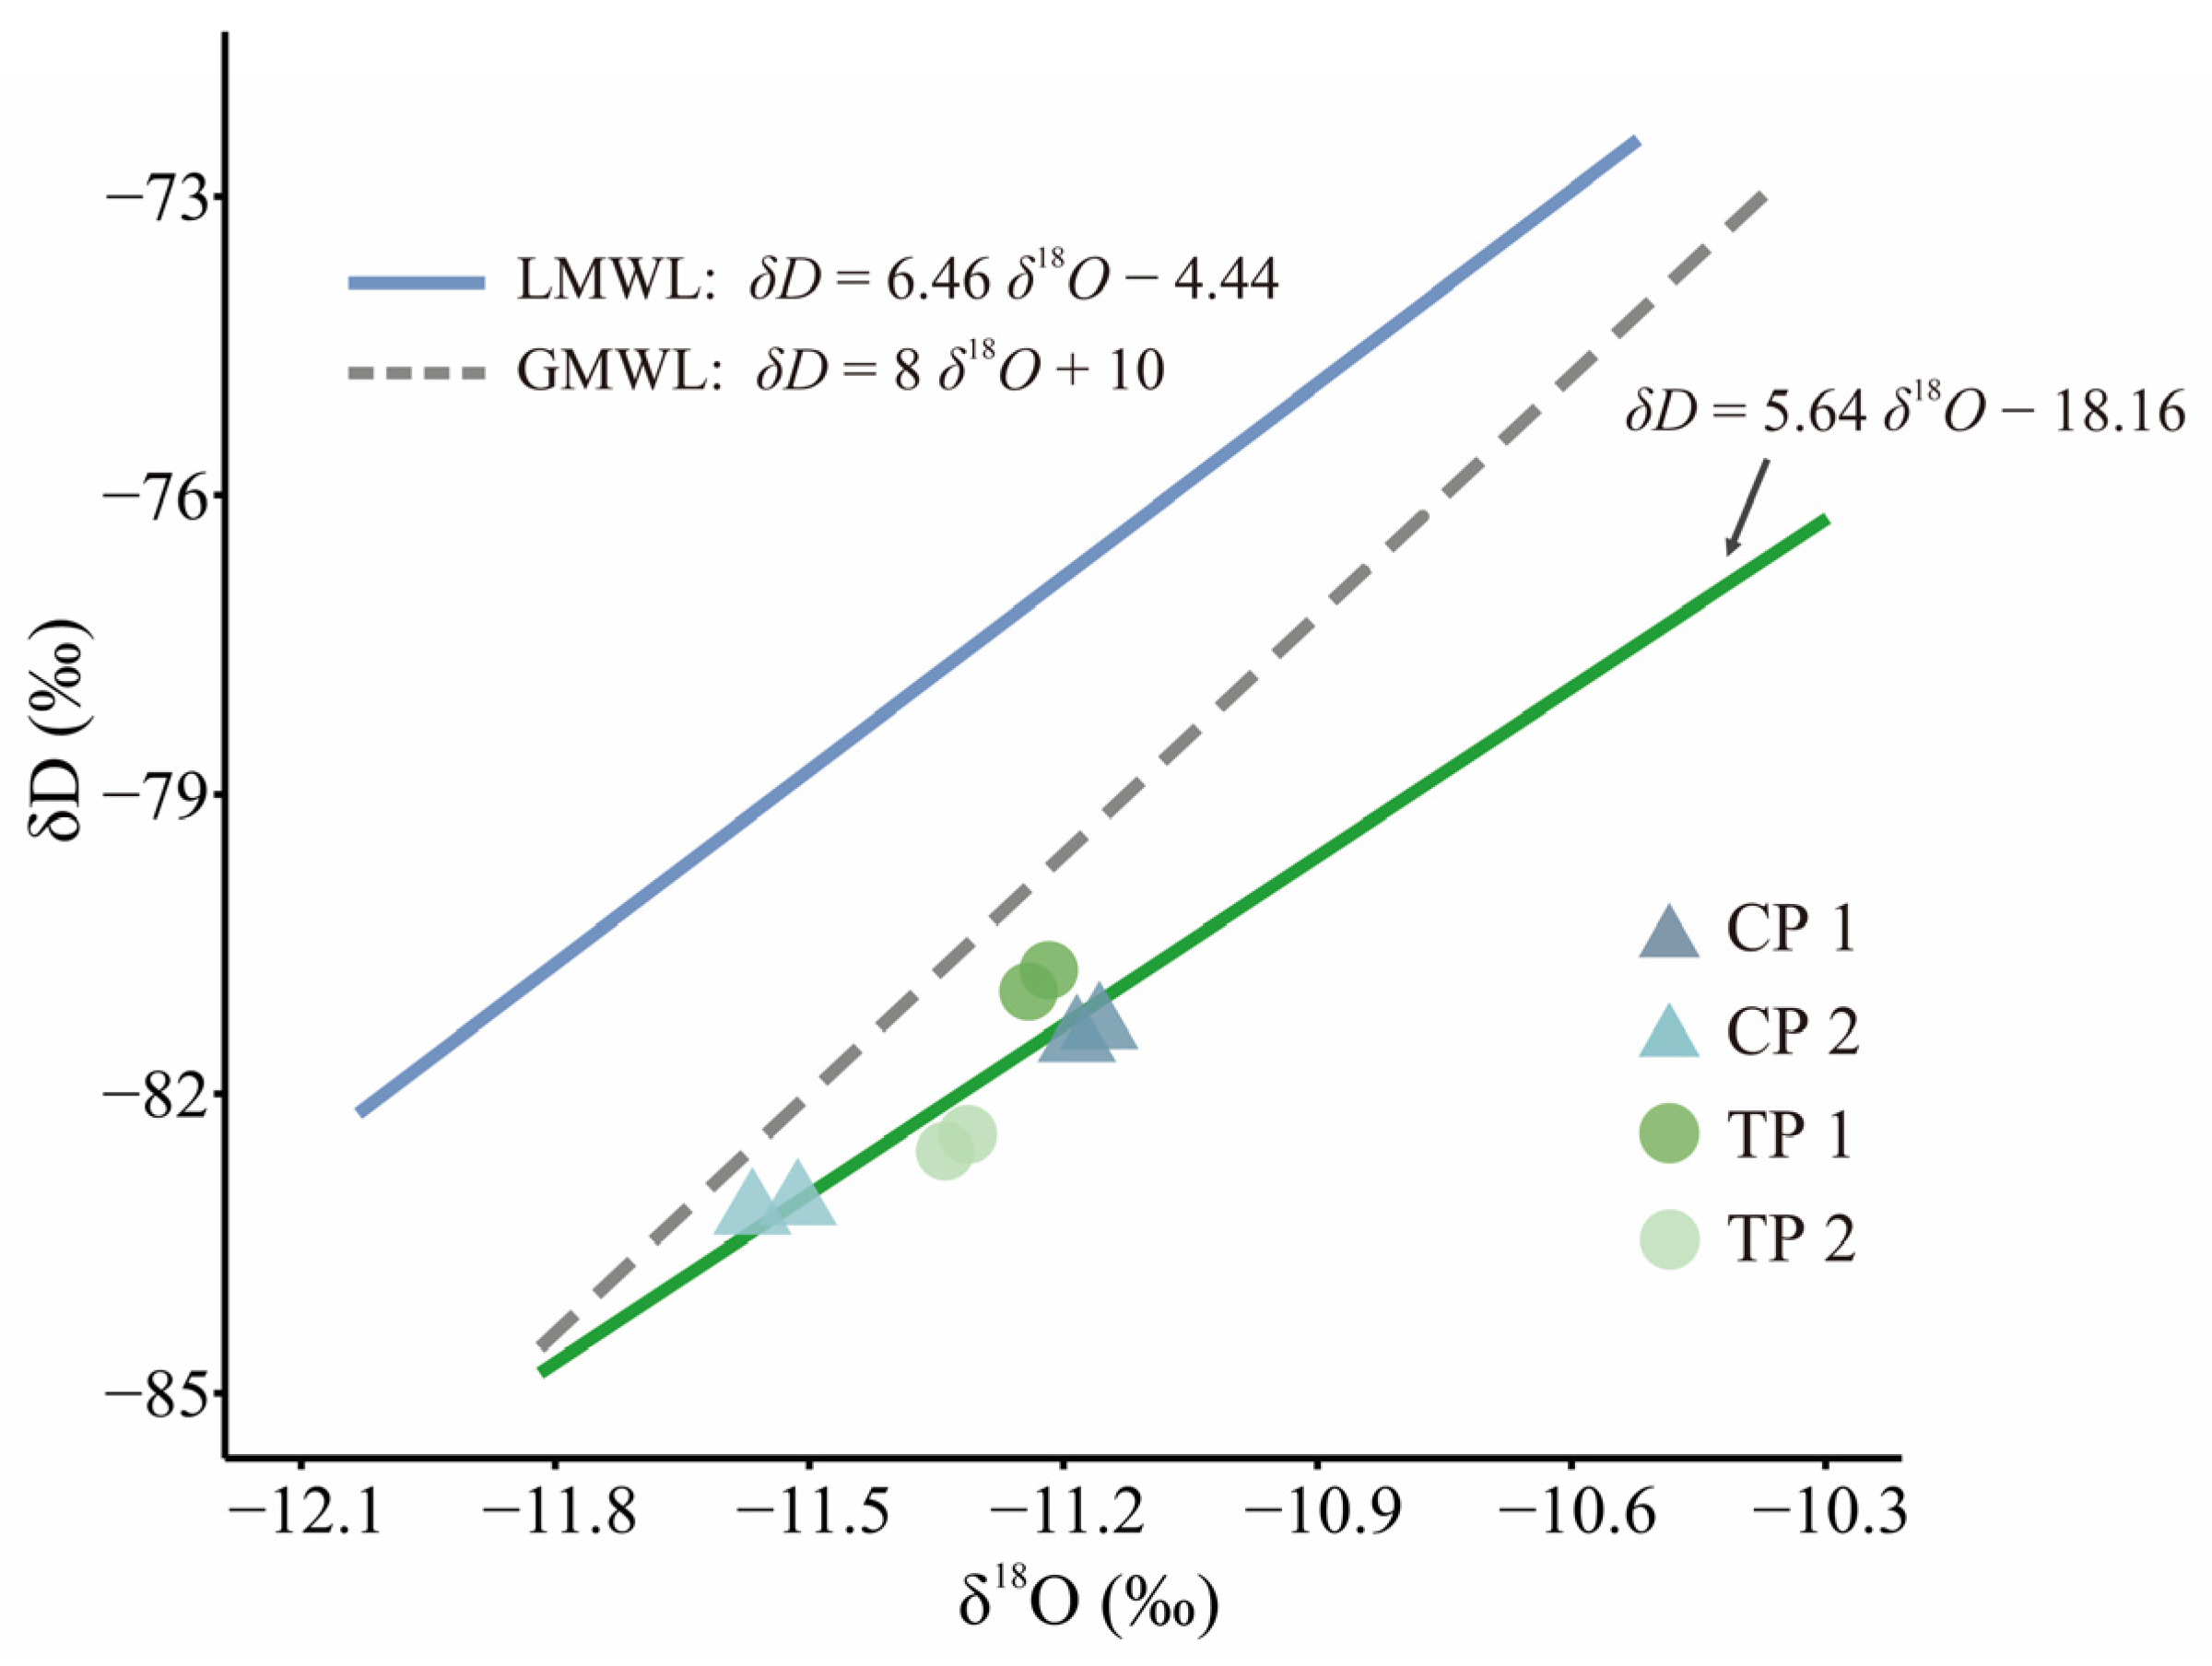
By analyzing the stable isotopic values of hydrogen and oxygen in atmospheric precipitation within the study area and combining the δ18O-δD relationship, we established the Local Meteoric Water Line (LMWL: δD = 6.46δ18O − 4.44). We also calculated the corresponding evaporation line (δD = 5.64δ18O − 18.16) for HP water samples based on hydrogen and oxygen isotopes and projected it onto the δ18O-δD plot (Figure 5). The results indicate that the isotopic values of the spring samples are located to the lower right of the LMWL, with significant deviations. However, the slope of the evaporation line (5.64) bears resemblance to that of the LMWL (6.46), suggesting that the principal water source for HP is atmospheric precipitation. This water has undergone significant evaporative fractionation or water–rock interactions, thereby resulting in older isotopic value than the precipitation.
By calculating the deuterium excess, we discovered that the d-excess for CP1 was the lowest (7.94–8.02‰), while the d-excess for CP2 was the highest (9.02–9.35‰). This indicates that the groundwater–rock interactions in the CP vary in intensity over time, with the most pronounced interactions occurring during periods of abnormal water color changes, leading to longer groundwater residence times [43]. In contrast, the d-excess for the TP remained relatively stable across both periods, suggesting that its hydrogen and oxygen isotopic values are primarily influenced by evaporative fractionation, owing to its shallower water depth. These differences reflect substantial hydrological and geological process variations between the CP and the TP in HP, underscoring the distinct processes governing water sources and isotopic behavior in these two water bodies.
Based on the above results, we can more comprehensively reveal the hydrological processes underlying the abnormal water color changes in HP (Figure 6). It is widely recognized that oxygen can enter shallow groundwater through four major pathways: vertical infiltration of oxygenated precipitation, infiltration of oxygen-rich surface water, diffusion of atmospheric air in the seepage zone, and gas entrapment associated with groundwater level fluctuations. In our study area, such fluctuations are more likely driven by natural hydrodynamic changes induced by rainfall events [44,45]. Groundwater in the CP remains in a long-term confined and anoxic environment. When continuous reduction reactions cause the accumulation of dissolved Fe2+ to exceed its storage threshold [46,47], fluctuations in groundwater levels triggered by oxygenated precipitation lead to the large-scale release of Fe2+. Under hydraulic pressure, this Fe2+-rich anoxic groundwater, along with long-sealed stagnant waters, is forced into the CP. When Fe2+ comes into contact with oxygen-rich surface waters in the CP, it is oxidized to form reddish-brown iron hydroxide colloids (Fe2+→Fe3+) [48,49,50]. The suspended Fe(OH)3 particles impart a transient reddish-brown “pumpkin soup” appearance to the water. As the CP’s groundwater subsequently returns to an iron-poor state, Fe2+ gradually re-accumulates through the reduction of iron-bearing minerals. Once Fe2+ again surpasses the storage threshold, coupled with hydrological fluctuations triggered by timely precipitation, the “pumpkin soup” phenomenon may recur.
The unusual mass mortality of aquatic organisms (e.g., fish and shrimp) observed during the discoloration events in the CP can also be reasonably explained by this mechanism. The upwelling of long-sealed, stagnant, anoxic groundwater under elevated hydraulic pressure introduced large volumes of oxygen-deficient water into the CP, leading to a marked decline in DO concentrations (Table 2). At the same time, the high concentrations of reducing substances (e.g., Fe2+ and Mn2+) in the anoxic groundwater further consumed DO when mixed with oxygen-rich surface waters. In addition, the significant decline in algal diversity observed in CP1 (Table 1) may be attributed to the sensitivity of certain algal species to hypoxic stress, resulting in their reduction or disappearance. This further confirms that shifts in redox conditions not only drive transformations in water color but also exert detrimental impacts on aquatic life [51,52].
Therefore, the core drivers of the CP’s water color changes include (i) rapid fluctuations in water level that drive groundwater upwelling, (ii) the prior formation of a sufficient volume of anoxic groundwater in karstic conduits, and (iii) the presence of an adequate reservoir of Fe in the groundwater. These factors collectively exhibit pronounced periodicity.
The differentiation of water color between the two pools is essentially an apparent manifestation of differences in hydrological connectivity. The CP, as a deeper pool, has stronger vertical mixing capabilities controlled by active groundwater exchange, which are conducive to the vertical distribution of DO, the oxidation of Fe2+, and the suspension and diffusion of Fe(OH)3 colloids. Its rapid redox-state switching is similar to the “pulsed material transport” mode seen in karst spring systems [53], resulting in significant water color changes. However, the continuous groundwater recharge and rapid material exchange in the CP help maintain high water transparency and relatively low nutrient concentrations during the normal-color period. In contrast, the TP has a shallower depth, is primarily recharged by isolated surface runoff, and lacks a clear outflow pathway. The shallow water retention characteristics form a closed material circulation, maintaining the current eutrophic state through the sediment–water interface feedback [54], resulting in limited water exchange and the retention of its original water volume. Furthermore, due to the narrow communication channel and the large depth difference between the CP and TP, the water exchange capacity between the two pools is limited, leading to a weak response of the TP’s water color to the hydrological processes of the CP, thus making the water color changes barely noticeable.
Furthermore, algae play a critical role in modulating the water color response in the TP. The high level of eutrophication in the TP leads to decreased DO concentrations, while the narrow connecting channels limit the inflow of oxygen-rich water from the CP, thereby inhibiting iron oxidation in the TP. Additionally, algae require iron for chlorophyll synthesis and electron transport processes [55,56]; in the TP, the dense algal communities likely uptake substantial amounts of Fe2+, reducing the concentration of free Fe2+ and further suppressing the formation of Fe(OH)3. Algal metabolism also releases dissolved organic matter, which can complex with Fe2+ or Fe3+, influencing iron’s mobility and transformation [57,58]. This coupled hydrobiological–chemical interaction ultimately results in the pronounced contrast in water color observed between the CP and TP.

4. Conclusions

This study took the abnormal water color changes in HP, Southwest China as an example. By employing a variety of analytical methods, including geochemical element analysis and biological community identification, it revealed the complex interrelationships among algal community structure, water quality physicochemical parameters, and hydrological processes. The results showed that during all observation periods, the algal density of Aulacoseira (Bacillariophyta) was significantly higher than that of other algae, making them a key dominant species in the algal community of HP. However, algae are not the primary driving factor behind the abnormal water color changes. Moreover, no evidence has been found to suggest that water nutrient levels or dissolved metal concentrations have a significant influence on the observed color variations. The periodic upwelling of Fe2+-rich groundwater, driven by increased hydraulic pressure from precipitation, caused oxidation and formed reddish-brown Fe(OH)3 colloid suspensions, which was the main cause of the “pumpkin soup” phenomenon. The differences in physical properties and biological environment between the clear and turbid ponds jointly drive the differentiated water color characteristics of the two ponds, reflecting the comprehensive impact of water exchange properties, groundwater dynamics, and local ecological processes on water color changes.
This study explored the drivers of water color anomalies in a karst spring system by examining the interactions among hydrological processes, redox conditions, and iron speciation. The results from HP provide a localized example of how hydrogeochemical dynamics can influence aquatic environments in karst settings. These findings may offer useful reference for future site-specific studies on similar phenomena in groundwater-dependent systems.

Supplementary Materials

The following supporting information can be downloaded at: https://www.mdpi.com/article/10.3390/su17167255/s1, Table S1: Algal community structure in HP (cells L−1).

Author Contributions

D.L. conceived the study, developed the methodology, and secured funding; B.Q. contributed to writing, reviewing, editing, formal analysis, and software; M.Z. and Q.L. provided supervision, software, and validation; Y.Z. and Q.G. were responsible for data curation and formal analysis; L.D., H.Z. and H.L. handled data curation, visualization, and investigation. All authors have read and agreed to the published version of the manuscript.

Funding

This research was funded by the Scientific Research Projects of the Yunnan Education Department (Grant No. 2025J0900), the Yunnan Fundamental Research Projects (Grant No.202501AU070173 and 202401AT070458), and the College Students Innovation Training Program (Grant No. 202410684005).

Institutional Review Board Statement

Not applicable.

Informed Consent Statement

Not applicable.

Data Availability Statement

The original contributions presented in this study are included in the article/Supplementary Materials. Further inquiries can be directed to the corresponding author.

Conflicts of Interest

The authors declare no conflicts of interest.

References

  1. Klein, I.; Gessner, U.; Dietz, A.J.; Kuenzer, C. Global WaterPack—A 250m resolution dataset revealing the daily dynamics of global inland water bodies. Remote Sens. Environ. 2017, 198, 345–362. [Google Scholar] [CrossRef]
  2. Adrian, R.; O’Reilly, C.M.; Zagarese, H.; Baines, S.B.; Hessen, D.O.; Keller, W.; Livingstone, D.M.; Sommaruga, R.; Straile, D.; Van Donk, E.; et al. Lakes as sentinels of climate change. Limnol. Oceanogr. 2009, 54, 2283–2297. [Google Scholar] [CrossRef] [PubMed]
  3. Lehmann, M.K.; Gurlin, D.; Pahlevan, N.; Alikas, K.; Conroy, T.; Anstee, J.; Balasubramanian, S.V.; Barbosa, C.C.F.; Binding, C.; Bracher, A.; et al. GLORIA—A globally representative hyperspectral in situ dataset for optical sensing of water quality. Sci. Data 2023, 10, 100. [Google Scholar] [CrossRef] [PubMed]
  4. Zhang, Y.; Deng, J.; Qin, B.; Zhu, G.; Zhang, Y.; Jeppesen, E.; Tong, Y. Importance and vulnerability of lakes and reservoirs supporting drinking water in China. Fundam. Res. 2023, 3, 265–273. [Google Scholar] [CrossRef]
  5. Breitburg, D.; Levin, L.A.; Oschlies, A.; Grégoire, M.; Chavez, F.P.; Conley, D.J.; Garçon, V.; Gilbert, D.; Gutiérrez, D.; Isensee, K.; et al. Declining oxygen in the global ocean and coastal waters. Science 2018, 359, eaam7240. [Google Scholar] [CrossRef]
  6. Wang, S.; Li, J.; Zhang, W.; Cao, C.; Zhang, F.; Shen, Q.; Zhang, X.; Zhang, B. A dataset of remote-sensed Forel-Ule Index for global inland waters during 2000–2018. Sci. Data 2021, 8, 26. [Google Scholar] [CrossRef] [PubMed]
  7. Xia, K.; Wu, T.; Li, X.; Wang, S.; Shen, Q. A new method for accurate inversion of Forel-Ule index using MODIS images—Revealing the water color evolution in China’s large lakes and reservoirs over the past two decades. Water Res. 2024, 255, 121560. [Google Scholar] [CrossRef]
  8. Zhao, Z.; Shi, K.; Peng, Y.; Wang, W.; Lai, L.; Zhang, Y.; Zhou, Y.; Zhang, Y.; Qin, B. Widespread decrease in chromophoric dissolved organic matter in Chinese lakes derived from satellite observations. Remote Sens. Environ. 2023, 298, 113848. [Google Scholar] [CrossRef]
  9. Shi, K.; Zhang, Y.; Liu, X.; Wang, M.; Qin, B. Remote sensing of diffuse attenuation coefficient of photosynthetically active radiation in Lake Taihu using MERIS data. Remote Sens. Environ. 2014, 140, 365–377. [Google Scholar] [CrossRef]
  10. Shen, X.; Ke, C.-Q.; Duan, Z.; Cai, Y.; Li, H.; Xiao, Y. Satellite Observations Reveal Widespread Color Variations in Global Lakes Since the 1980s. Water Resour. Res. 2025, 61, e2023WR036926. [Google Scholar] [CrossRef]
  11. Kessouri, F.; McWilliams, J.C.; Bianchi, D.; Sutula, M.; Renault, L.; Deutsch, C.; Feely, R.A.; McLaughlin, K.; Ho, M.; Howard, E.M.; et al. Coastal eutrophication drives acidification, oxygen loss, and ecosystem change in a major oceanic upwelling system. Proc. Natl. Acad. Sci. USA 2021, 118, e2018856118. [Google Scholar] [CrossRef] [PubMed]
  12. Ying, H.; Wang, S.; Zhang, B.; Mao, Z.; Zhang, F.; Li, J. Earth observation reveals the shifting patterns of China’s lake colour driven by climate change and land cover. J. Environ. Manag. 2024, 370, 122809. [Google Scholar] [CrossRef]
  13. Topp, S.N.; Pavelsky, T.M.; Dugan, H.A.; Yang, X.; Gardner, J.; Ross, M.R.V. Shifting Patterns of Summer Lake Color Phenology in Over 26,000 US Lakes. Water Resour. Res. 2021, 57, e2020WR029123. [Google Scholar] [CrossRef]
  14. Zhou, Q.; Zhang, Y.; Tao, J.; Ye, L.; Wang, H.; Shan, K.; Jeppesen, E.; Song, L. Water depth and land-use intensity indirectly determine phytoplankton functional diversity and further regulate resource use efficiency at a multi-lake scale. Sci. Total Environ. 2022, 834, 155303. [Google Scholar] [CrossRef]
  15. Zhang, Y.; Wang, J.; Tao, J.; Zhou, Y.; Yang, H.; Yang, X.; Li, Y.; Zhou, Q.; Jeppesen, E. Concentrations of dissolved organic matter and methane in lakes in Southwest China: Different roles of external factors and in-lake biota. Water Res. 2022, 225, 119190. [Google Scholar] [CrossRef]
  16. Hu, H.; Wei, Y. The Freshwater Algae of China—Systematics, Taxonomy and Ecology; Science Press: Beijing, China, 2006. [Google Scholar]
  17. Pavelková, A.; Cencerová, V.; Zeman, J.; Antos, V.; Nosek, J. Reduction of chlorinated hydrocarbons using nano zero-valent iron supported with an electric field. Characterization of electrochemical processes and thermodynamic stability. Chemosphere 2021, 265, 128764. [Google Scholar] [CrossRef]
  18. Li, D.; Chang, F.; Zhang, Y.; Duan, L.; Liu, Q.; Li, H.; Hu, G.; Zhang, X.; Gao, Y.; Zhang, H. Arsenic migration at the sediment-water interface of anthropogenically polluted Lake Yangzong, Southwest China. Sci. Total Environ. 2023, 879, 163205. [Google Scholar] [CrossRef] [PubMed]
  19. Wang, S.; Lei, S.; Zhang, M.; Hughes, C.; Crawford, J.; Liu, Z.; Qu, D. Spatial and seasonal isotope variability in precipitation across China: Monthly isoscapes based on regionalized fuzzy clustering. J. Clim. 2022, 35, 3411–3425. [Google Scholar] [CrossRef]
  20. Margalef, R. Information Theory in Ecology; Royal Academy of Sciences and Arts of Barcelona: Barcelona, Spain, 1973. [Google Scholar]
  21. Spellerberg, I.F.; Fedor, P.J. A tribute to Claude Shannon (1916–2001) and a plea for more rigorous use of species richness, species diversity and the ‘Shannon–Wiener’ Index. Glob. Ecol. Biogeogr. 2003, 12, 177–179. [Google Scholar] [CrossRef]
  22. Simpson, E.H. Measurement of diversity. Nature 1949, 163, 688. [Google Scholar] [CrossRef]
  23. Pielou, E.C. The measurement of diversity in different types of biological collections. J. Theor. Biol. 1966, 13, 131–144. [Google Scholar] [CrossRef]
  24. Kociolek, J. A worldwide listing and biogeography of freshwater diatom genera: A phylogenetic perspective. Diatom Res. 2018, 33, 509–534. [Google Scholar] [CrossRef]
  25. Duong, T.T.; Nguyen, H.Y.; Le, T.P.Q.; Nguyen, T.K.; Tran, T.T.H.; Le, N.D.; Dang, D.K.; Vu, T.N.; Panizzo, V.; McGowan, S. Transitions in diatom assemblages and pigments through dry and wet season conditions in the Red River, Hanoi (Vietnam). Plant Ecol. Evol. 2019, 152, 163–177. [Google Scholar] [CrossRef]
  26. Manoylov, K.M.; Ognjanova-Rumenova, N.; Stevenson, R.J. Morphotype variations in subfossil diatom species of Aulacoseira in 24 Michigan Lakes, USA. Acta Bot. Croat. 2009, 68, 401–419. [Google Scholar]
  27. Yang, C.; Nan, J.; Li, J. Driving factors and dynamics of phytoplankton community and functional groups in an estuary reservoir in the Yangtze River, China. Water 2019, 11, 1184. [Google Scholar] [CrossRef]
  28. Zhou, W.; Gao, J.; Liao, J.; Shi, R.; Li, T.; Guo, Y.; Long, A. Characteristics of phytoplankton biomass, primary production and community structure in the modaomen channel, pearl river estuary, with special reference to the influence of saltwater intrusion during neap and spring tides. PLoS ONE 2016, 11, e0167630. [Google Scholar] [CrossRef]
  29. Wang, C.; Wu, N.; Li, W.; Liu, Q.; Lai, Z.; Fohrer, N. Curved filaments of Aulacoseira complex as ecological indicators in the Pearl River, China. Ecol. Indic. 2020, 118, 106722. [Google Scholar] [CrossRef]
  30. Thomas, K.E.; Hall, R.I.; Scrimgeour, G.J. Evaluating the use of algal pigments to assess the biological condition of streams. Environ. Monit. Assess. 2013, 185, 7895–7913. [Google Scholar] [CrossRef]
  31. El Semary, N.A. Iron-Marine Algal Interactions and Impacts: Decreasing Global Warming by Increasing Algal Biomass. Sustainability 2022, 14, 10372. [Google Scholar] [CrossRef]
  32. Duppeti, H.; Chakraborty, S.; Das, B.S.; Mallick, N.; Kotamreddy, J. Rapid assessment of algal biomass and pigment contents using diffuse reflectance spectroscopy and chemometrics. Algal Res. 2017, 27, 274–285. [Google Scholar] [CrossRef]
  33. Xu, H.; Paerl, H.W.; Qin, B.; Zhu, G.; Gaoa, G. Nitrogen and phosphorus inputs control phytoplankton growth in eutrophic Lake Taihu, China. Limnol. Oceanogr. 2010, 55, 420–432. [Google Scholar] [CrossRef]
  34. Fowler, R.A.; Warner, K.A.; Gawley, W.G.; Saros, J.E. Paleolimnological comparison of algal changes in a clear-versus a brown-water lake over the last two centuries in the northeastern USA. J. Paleolimnol. 2022, 67, 289–305. [Google Scholar] [CrossRef]
  35. Pitblado, J.R. Landsat views of Sudbury (Canada) area acidic and nonacidic lakes. Can. J. Fish. Aquat. Sci. 1992, 49, 33–39. [Google Scholar] [CrossRef]
  36. Ma, R.; Tang, J.; Dai, J.; Zhang, Y.; Song, Q. Absorption and scattering properties of water body in Taihu Lake, China: Absorption. Int. J. Remote Sens. 2006, 27, 4277–4304. [Google Scholar] [CrossRef]
  37. Su, C.; Zhang, X.; Sun, Y.; Meng, S.; Cui, X.; Fei, Y. Hydrochemical characteristics and evolution processes of karst groundwater in Pingyin karst groundwater system, North China. Environ. Earth Sci. 2023, 82, 67. [Google Scholar] [CrossRef]
  38. Sun, H.; Bian, K.; Wang, T.; Jin, Z.; Niu, Z. Hydrogeochemical Characteristics and Genetic Analysis of Karst Groundwater in the Fengfeng Mining Area. Water 2023, 15, 4049. [Google Scholar] [CrossRef]
  39. Arvola, L.; Rask, M.; Huotari, J.; Tulonen, T.; Kahilainen, K.K.; Ruuhijärvi, J.; Lindberg, H.; Viitala, R.; Blanchet, C.; Arzel, C. Chemical responses of small boreal lakes to atmospheric and catchment drivers over four decades. Sci. Total Environ. 2025, 968, 178696. [Google Scholar] [CrossRef]
  40. Škerlep, M.; Steiner, E.; Axelsson, A.L.; Kritzberg, E.S. Afforestation driving long-term surface water browning. Glob. Change Biol. 2020, 26, 1390–1399. [Google Scholar] [CrossRef] [PubMed]
  41. Spiegel, C.J.; Mladenov, N.; Wall, C.B.; Hollman, K.; Tran, C.H.; Symons, C.C.; Shurin, J.B. Life after a fiery death: Fire and plant biomass loading affect dissolved organic matter in experimental ponds. Glob. Change Biol. 2024, 30, e17061. [Google Scholar] [CrossRef] [PubMed]
  42. Zhang, Z.; Xiao, C.; Adeyeye, O.; Yang, W.; Liang, X. Source and Mobilization Mechanism of Iron, Manganese and Arsenic in Groundwater of Shuangliao City, Northeast China. Water 2020, 12, 534. [Google Scholar] [CrossRef]
  43. Liu, K.; Qiao, X.; Li, B.; Sun, Y.; Li, Z.; Pu, C. Characteristics of deuterium excess parameters for geothermal water in Beijing. Environ. Earth Sci. 2016, 75, 1485. [Google Scholar] [CrossRef]
  44. Williams, M.D.; Oostrom, M. Oxygenation of anoxic water in a fluctuating water table system: An experimental and numerical study. J. Hydrol. 2000, 230, 70–85. [Google Scholar] [CrossRef]
  45. Kohfahl, C.; Massmann, G.; Pekdeger, A. Sources of oxygen flux in groundwater during induced bank filtration at a site in Berlin, Germany. Hydrogeol. J. 2009, 17, 571–578. [Google Scholar] [CrossRef]
  46. Grenthe, I.; Stumm, W.; Laaksuharju, M.; Nilsson, A.; Wikberg, P. Redox potentials and redox reactions in deep groundwater systems. Chem. Geol. 1992, 98, 131–150. [Google Scholar] [CrossRef]
  47. Bao, J.; Wu, X.; Zhang, Q.; Yuan, D.; Guo, F.; Liu, F. Unveiling the nitrogen transport and transformation in different karst aquifers media. J. Hydrol. 2023, 620, 129335. [Google Scholar] [CrossRef]
  48. Kazak, E.S.; Pozdniakov, S.P. Field study and reactive simulation of iron migration in groundwater during the riverbank filtration. Appl. Geochem. 2021, 124, 104817. [Google Scholar] [CrossRef]
  49. Xia, X.; Teng, Y.; Zhai, Y. Biogeochemistry of iron enrichment in groundwater: An indicator of environmental pollution and its management. Sustainability 2022, 14, 7059. [Google Scholar] [CrossRef]
  50. Smith, R.L.; Kent, D.B.; Repert, D.A.; Böhlke, J. Anoxic nitrate reduction coupled with iron oxidation and attenuation of dissolved arsenic and phosphate in a sand and gravel aquifer. Geochim. Cosmochim. Acta 2017, 196, 102–120. [Google Scholar] [CrossRef]
  51. Mahler, B.; Bourgeais, R. Dissolved oxygen fluctuations in karst spring flow and implications for endemic species: Barton Springs, Edwards aquifer, Texas, USA. J. Hydrol. 2013, 505, 291–298. [Google Scholar] [CrossRef]
  52. Linnik, P.; Osadchyi, V.; Osadcha, N.; Linnik, R. Redox potential as an important characteristic of the chemical and biological state of surface waters. Chem. Ecol. 2023, 39, 640–672. [Google Scholar] [CrossRef]
  53. Ford, D.; Williams, P.D. Karst Hydrogeology and Geomorphology; John Wiley & Sons: London, UK, 2007. [Google Scholar]
  54. Smith, L.; Watzin, M.C.; Druschel, G. Relating sediment phosphorus mobility to seasonal and diel redox fluctuations at the sediment–water interface in a eutrophic freshwater lake. Limnol. Oceanogr. 2011, 56, 2251–2264. [Google Scholar] [CrossRef]
  55. Sunda, W.G.; Huntsman, S.A. Iron uptake and growth limitation in oceanic and coastal phytoplankton. Mar. Chem. 1995, 50, 189–206. [Google Scholar] [CrossRef]
  56. Raven, J.A. The iron and molybdenum use efficiencies of plant growth with different energy, carbon and nitrogen sources. New Phytol. 1988, 109, 279–287. [Google Scholar] [CrossRef]
  57. Barbeau, K.; Rue, E.; Bruland, K.W.; Butler, A. Photochemical cycling of iron in the surface ocean mediated by microbial iron (III)-binding ligands. Nature 2001, 413, 409–413. [Google Scholar] [CrossRef]
  58. Rose, A.L.; Waite, T.D. Kinetics of iron complexation by dissolved natural organic matter in coastal waters. Mar. Chem. 2003, 84, 85–103. [Google Scholar] [CrossRef]
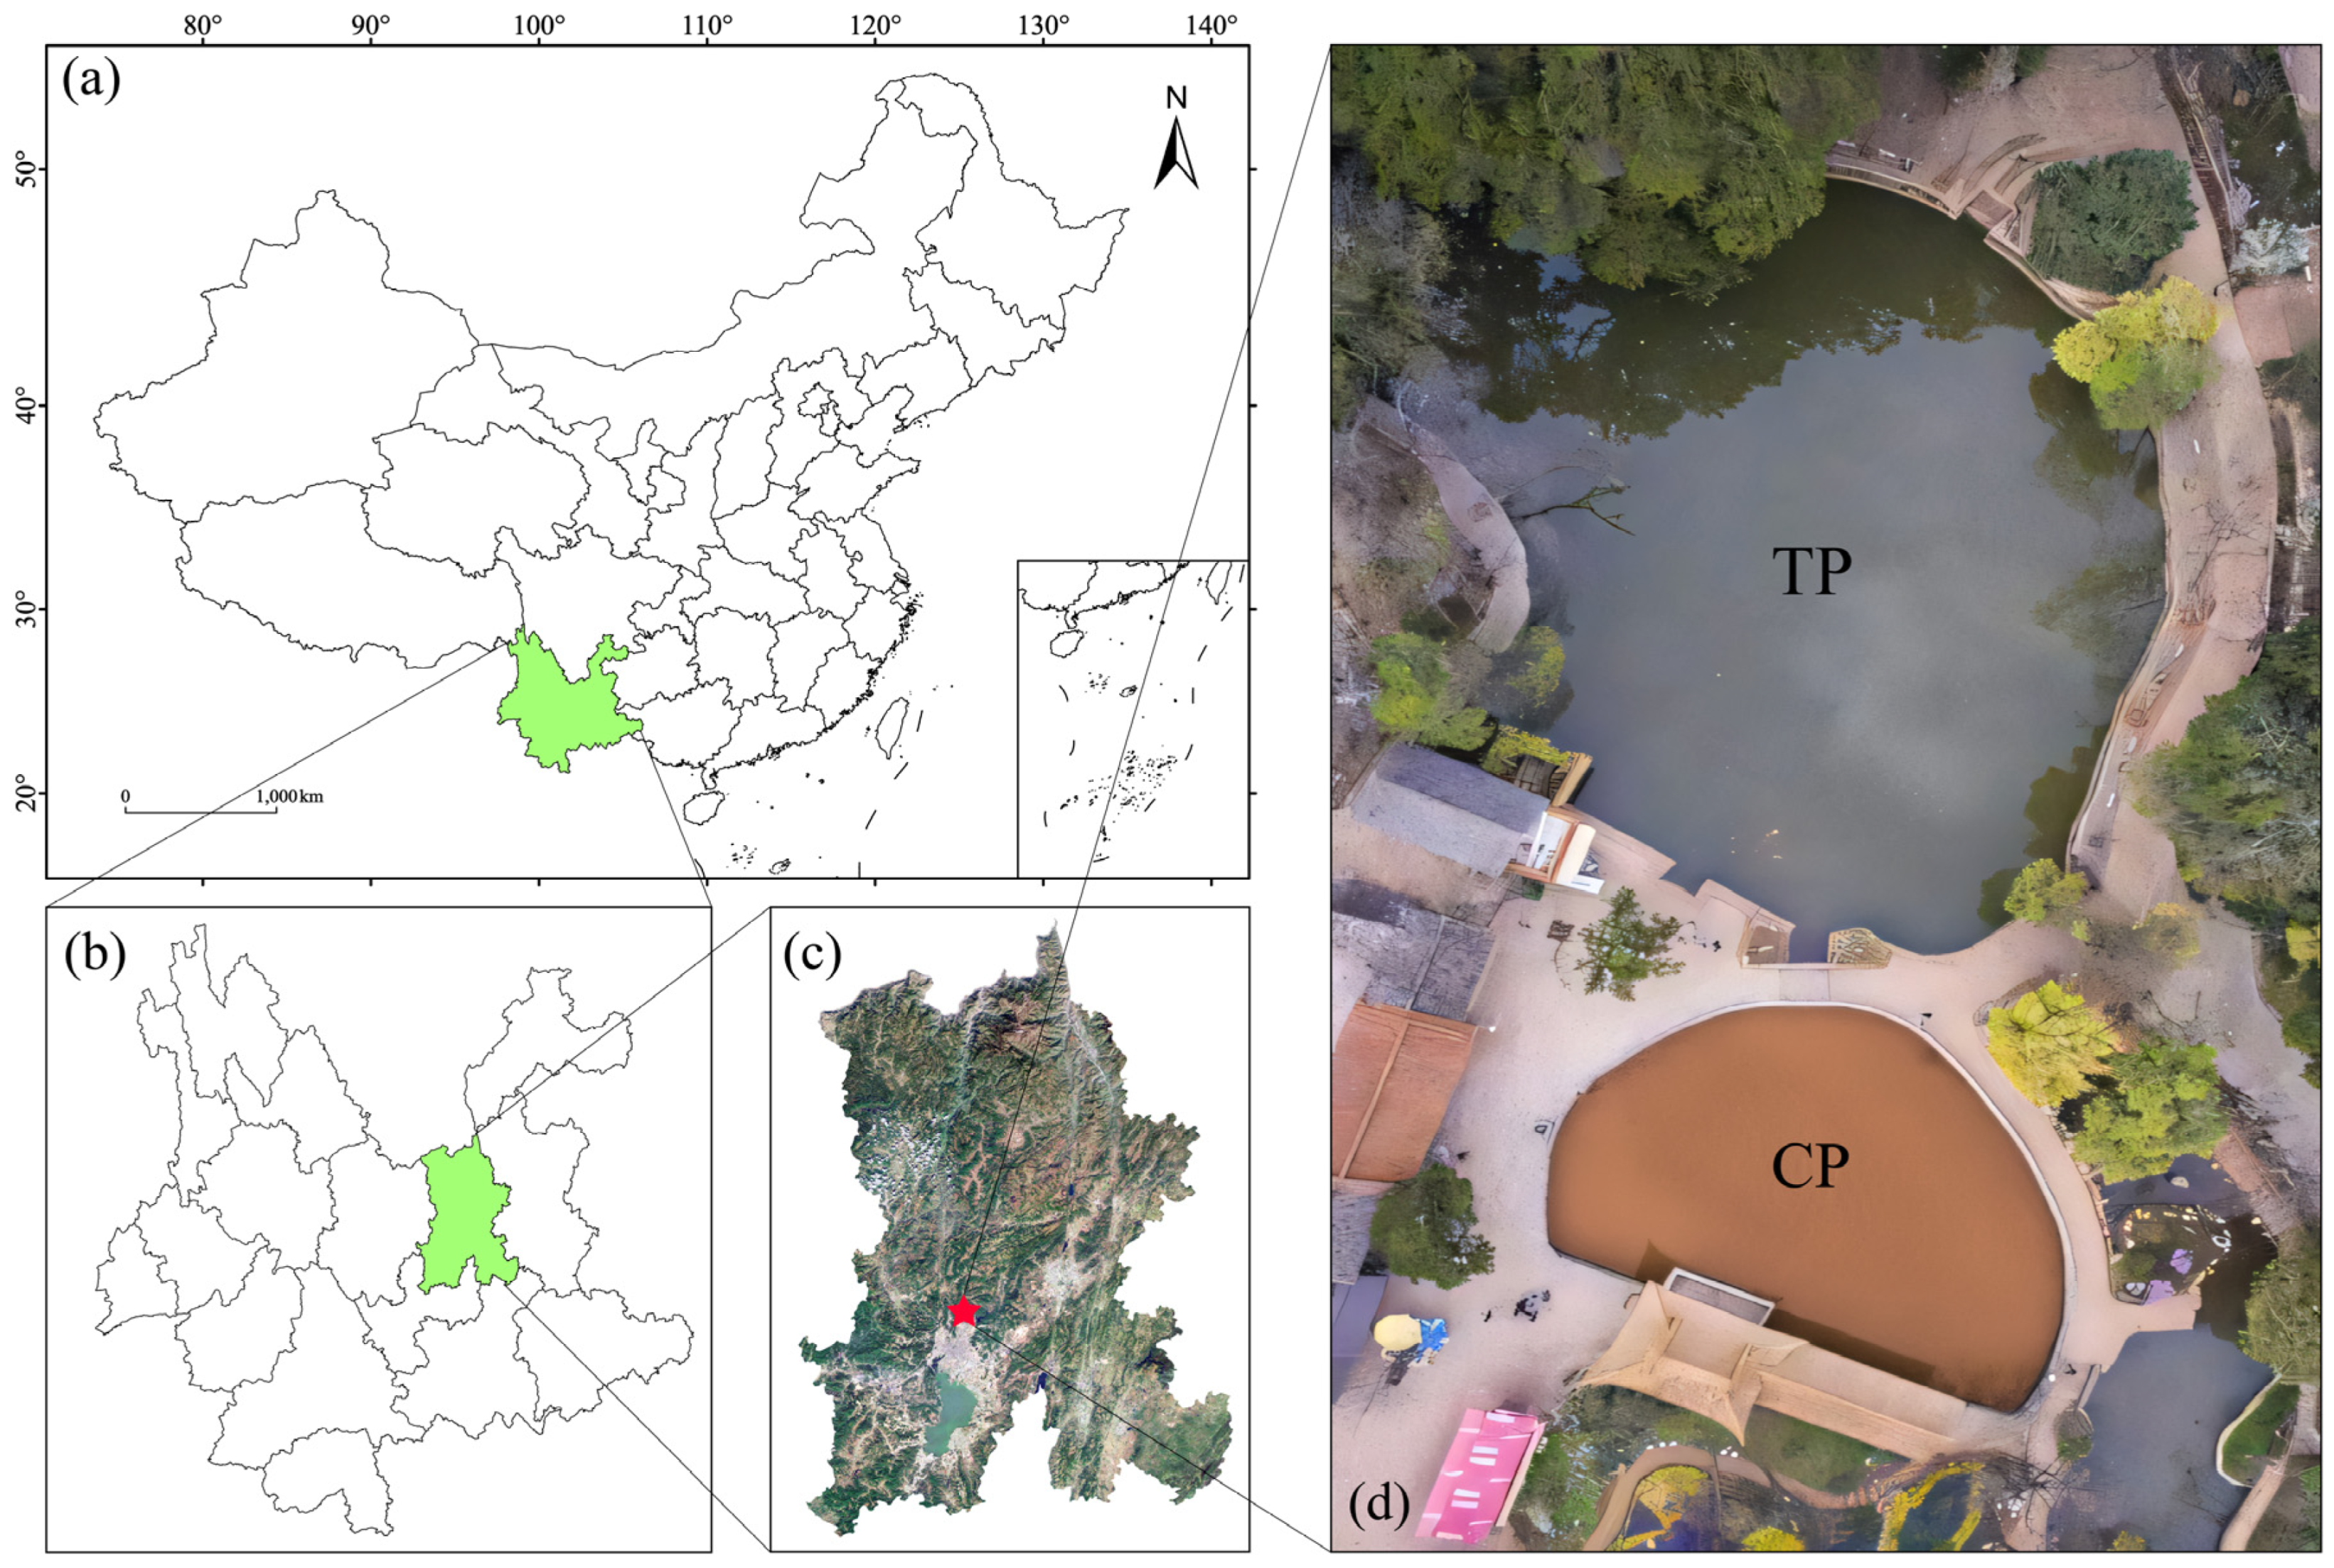
Figure 1. Location and remote sensing imagery of the study area: (a) provincial boundaries of China, (b) municipal boundaries of Yunnan Province, (c) remote sensing map of Kunming, and (d) aerial view of HP during water discoloration.
Sustainability 17 07255 g001
Figure 2. Structural distribution of major algae in HP.
Sustainability 17 07255 g002
Figure 3. Comparison of water samples after standing and after shaking (TP on the left and CP on the right): (a) after settling; (b) after shaking.
Sustainability 17 07255 g003
Figure 4. Eh–pH phase diagram of two pools for 2021 and 2022. The red arrow indicates the change in the redox potential of iron ions from Fe2+ to Fe3+, while the orange arrow represents the increase in iron’s redox potential with decreasing depth. In the CP, Eh decreased significantly by 81.4% with increasing water depth in 2021, while in 2022, Eh decreased by 30.2% as the water depth increased. The pH changes in both years were relatively minor. In contrast, in the TP, there were almost no variations in either pH or Eh during these two periods.
Sustainability 17 07255 g004
Figure 5. Atmospheric waterline (LMWL: Local Meteoric Water Line, GMWL: Global Meteoric Water Line).
Sustainability 17 07255 g005
Figure 6. Mechanism of water color variation in HP.
Sustainability 17 07255 g006
Table 1. Algal dominance and diversity in HP.
Dominant SpeciesMargalefShannonSimpsonPielou
2021CP 1Aulacoseira granulate var. angustissima1.011.770.740.63
Aulacoseira granulata
TP 1Aulacoseira granulate var. angustissima,1.522.070.780.62
Aulacoseira sp.
2022CP 2Aulacoseira ambigua1.332.050.780.71
Aulacoseira sp.
TP 2Aulacoseira ambigua1.331.880.710.62
Aulacoseira sp.
Table 2. Water quality parameters of HP.
Parameters2021 2022
CP 1TP 1CP 2TP 2
TN (mg L−1)1.994.272.611.85
TP (mg L−1)0.100.050.100.15
DTN (mg L−1)1.533.712.601.71
DTP (mg L−1)0.010.020.020.01
PO43− (mg L−1)0.000.010.020.01
NO3-N (mg L−1)0.832.792.271.16
Chl-a (μg L−1)5.7657.618.8665.76
DOC (mg L−1)3.525.364.758.45
DO (mg L−1)6.287.216.457.15
WT (°C)18.621.718.721.4
pH8.38.28.28.1
δ18O (‰)−11.16−11.24−11.51−11.31
δD (‰)−81.32−80.97−83.09−82.41
Table 3. Heavy metal concentration of water bodies in HP (μg L−1).
ElementsCP 1TP 1
As 5.9 × 10−14.11 × 10−1
Be 5.56 × 10−42.50 × 10−3
Cd 5.37 × 10−37.48 × 10−3
Co 1.96 × 10−12.29 × 10−1
Cr 1.151.81
Cu 6.26 × 10−15.07 × 10−1
Fe 4.85 × 1026.01 × 102
Mn −6.38 × 10−51.77 × 10−5
Mo 7.31 × 10−12.95 × 10−1
Ni 5.166.20
Pb4.53 × 10−25.50 × 10⁻²
Sb 1.26 × 10−17.98 × 10−2
Se 2.72 × 10−11.99 × 10−1
Ti 3.96 × 104.98 × 10
Tl 7.02 × 10−36.53 × 10−3
V 1.241.46
Zn 3.275.00
Disclaimer/Publisher’s Note: The statements, opinions and data contained in all publications are solely those of the individual author(s) and contributor(s) and not of MDPI and/or the editor(s). MDPI and/or the editor(s) disclaim responsibility for any injury to people or property resulting from any ideas, methods, instructions or products referred to in the content.