1. Introduction
Environmental awareness and sustainability have become major topics of discussion in Poland, mirroring trends in other developed countries. Younger generations have grown up with widespread access to information on climate change, environmental protection and sustainable development. The first Polish cohort to be raised with ecological concerns as a priority emerged after the fall of communism in 1989, with awareness intensifying following Poland’s accession to the European Union in 2004. To a large extent, this generation overlaps with the cohort known as Generation Z, “the group of people who were born between the late 1990s and the early 2010s” [
1]). Generation Z is the first generation to grow up with internet access, further shaping its environmental consciousness, as in Poland this topic is often consumed as content on social media [
2].
During the childhood or adolescence of the Generation Z cohort, the first wind farms, photovoltaic panels, and waste sorting bins appeared in the Polish landscape. Between 2009 and 2020, the country’s wind energy capacity increased more than ninefold [
3], and photovoltaic (PV) installations surged from 1.6 MW in 2012 to approximately 12 GW in 2022 [
4]. Meanwhile, waste recycling rates rose from 11.4% in 2011 to 34.1% in 2019 [
5]. At the global level, this period saw the signing of the Paris Agreement [
6] and, at the EU level, the introduction of the European Green Deal [
7].
In general, Generation Z is often seen as the most socially and environmentally conscious of all generational cohorts. Members of this generation are characterized by their interest not only in the present but also in the long-term impact of their actions. As consumers, Generation Z actively seeks eco-friendly products and considers their carbon footprint before making a purchase. Additionally, Generation Z travelers place high importance on sustainable practices and environmental issues [
8,
9]. However, some studies including Generation Z representatives in Poland suggest that this cohort may be less engaged in pro-environmental behaviors compared to previous generations [
10,
11]. Research also shows that, in comparison to major European economies like Germany or Italy, Polish representatives of Generation Z, coming from a developing economy, exhibit a lower level of environmental awareness [
11,
12,
13].
The observed differences in sustainable behavior may stem from lower awareness as well as economic factors. According to [
10], the sustainable actions of Polish Generation Z are primarily motivated by economic benefits, reflected in behaviors such as choosing public transportation or turning off lights when leaving a room. The limited purchasing power in Poland explains why the organic food market has developed at a slower pace than in Germany [
13]. A similar trend is noted among Czechs, Poles, and Ukrainians when discussing practices like burning waste at home or considering the energy efficiency of purchased consumer electronics [
14].
However, the same economic growth has led to rapid urbanization in Poland, driven by the high percentage of overcrowded dwellings, which has reached 36% [
15]. The tension between urbanization and preserving the green environment is evident, and urban trees are endangered, although they play a crucial role in shaping our daily lives. They offer esthetic benefits, enhance mental and physical well-being, and foster social interactions [
16,
17,
18,
19]. They also help reduce air and noise pollution and mitigate rising urban temperatures [
19,
20]. Moreover, green spaces increase the attractiveness of neighborhoods and alleviate the adverse effects of industrial and postindustrial areas [
20]. Finally, urban greenery supports biodiversity by providing habitats for wildlife [
21,
22,
23,
24].
The sustainable development of Polish cities, allowing for the preservation of urban greenery, including in its capital Warsaw, depends largely on residents’ actions. Most importantly, private property owners decide whether to plant or remove trees, in accordance with the law or in violation of it. Recently, a heated discussion swept through Poland, sparked by the change in Poland’s Act of Nature Protection, which in 2017 initially allowed for unrestricted tree removal on private land, later revised to require notification for larger trees. A study conducted by Kronenberg et al. (2021) in Łódź [
25], the fourth largest city in Poland, revealed that 40% of all tree removals in that city during the 2010–2019 decade occurred while the amendment to the act was in force, with 80% of those on private land.
The residents of Warsaw may also engage in the maintenance of communal green spaces through the efforts of local [
26,
27] and international [
28,
29] foundations and institutional city programs such as Green Volunteering [
30]. These initiatives involve fundraising and collective tree-planting efforts within neighborhoods. Additionally, Warsaw’s participatory budget allows residents to vote on local projects, many of which fund green spaces [
31].
All the actions discussed above require donations from residents. Voting on a participatory budget project that funds tree planting or planting another tree in a garden equals the decision that planting is a proper way of spending money instead of other aims. It sacrifices other potential benefits, whether private or communal. Individual support for trees through pro-ecological initiatives involves volunteering or donating money. Finally, an agreement to limit the rights to cut trees on private property is a donation of property ownership rights.
Urban trees, however, are associated not only with benefits but also with certain social costs. City dwellers have mixed views on tree benefits, such as their esthetic appeal, shading, noise reduction, and ecological value, versus concerns such as allergies, falling branches, littering with flowers or leaves or sidewalk damage [
32,
33,
34,
35,
36]. Attitudes toward donating time or money for urban greenery also vary [
19,
37,
38,
39,
40], as does support for tree cutting regulations on private land [
32,
38,
41,
42]. However, few studies have explored the link between willingness to contribute to urban trees and perceptions of their attributes [
32,
43].
This study aimed to fill that gap by analyzing survey data from Generation Z students at Warsaw University of Life Sciences (WULS-SGGW), a major natural sciences university in Poland. It had three main objectives. The first objective was to examine the general attitudes of young Polish adults from Generation Z toward trees and their various attributes in particular. Second, it investigated the attitudes toward three types of donations for the trees in the city: agreement with the notion of spending money on planting trees, volunteering one’s time or donating one’s money, and agreement to limit rights to cut down trees on private land. The third goal was to link the willingness of young Polish adults to donate to urban trees with the importance of individual tree attributes. By understanding these perspectives, this study provides insights into whether young Polish adults wish to support sustainable development of urban greenery and what factors influence their willingness to engage in environmental initiatives.
2. Materials and Methods
2.1. Respondents
The study surveyed students from Warsaw University of Life Sciences (WULS-SGGW) between May 2021 and March 2024 using Microsoft Forms via Microsoft Teams. The survey was anonymous, and no identifiable information about respondents was collected. Additionally, participants were given information regarding the study’s aims before filling it out voluntarily. Informed consent was obtained from the participants. The sample included 1032 respondents. Those over 25 years of age were excluded from the analysis, leaving 1023 persons. All participants were aged 18–25 (born 1996–2006), aligning with Generation Z. The sample comprised 55.6% women and 44.4% men, with 36.4% raised in villages and 63.6% raised in cities.
2.2. Questionnaire
The part of the survey used in this study consisted of two sections: (1) Assessment of tree attributes—Participants rated the importance of 32 urban tree attributes (benefits and harms). (2) Attitudes toward nature and the willingness to donate—Questions assessed general environmental attitudes and three donation forms: financial contributions, volunteer time, and the willingness to limit private property rights for tree preservation. The groups of analyzed questions are described below. A five-point Likert scale was applied. For some analyses, the answers were converted into a three-point Likert scale.
2.2.1. Tree Attributes
The tree attributes examined in the study consisted of 32 statements regarding the benefits and harms associated with urban trees, such as attractiveness, damage caused, or impact on social relationships. The respondents expressed how important each attribute is to them, with answers anchored by “definitely not important” and “definitely important.”
2.2.2. Attitudes Toward Nature and the Willingness to Donate to Trees
The questions used to assess the respondents’ attitudes toward nature were graded from a very general “How do you rate your attitude toward nature?” via “Do you pay attention to the nature around you in your everyday life?” to the more specific “Are you happy to see new tree plantings in your vicinity? “.
The questions concerning students’ disposition to donate to urban trees considered three donation methods, including general allocation of funds for tree planting: “Do you think planting trees is the right way to spend money instead of other purposes?”; donating one’s free time: “Would you take part in planting trees in your vicinity in your free time?” or donating one’s money: “Would you be willing to financially support planting trees in your vicinity?”; and finally, donating the right to decide about one’s property: “Do you think everyone should be allowed to cut down any tree on their property?”.
Table 1 presents the abbreviations of these questions and their corresponding Likert scale anchors.
2.3. Data Analysis
Descriptive statistics, including percentage distributions and mean values, were used to summarize the responses. Correlations between attitudes toward nature and willingness to donate were assessed using Spearman’s rank correlation. A network graph was prepared to show the flow of respondents between the positive, neutral, and negative responses to these questions.
Agglomerative Hierarchical Clustering (AHC) with distance based on the Kendall correlation and Ward agglomeration methods was used to cluster the survey questions regarding the importance of urban tree attributes into sets forming latent tree attributes. The internal consistency within each set of questions was measured with Cronbach’s alpha. For each respondent, the values of the latent attributes were computed as the mean answers to the questions forming it.
The AHC method with Euclidean distance was applied to cluster the respondents on the basis of their answers regarding attention given to nature and willingness to donate to trees. Principal Component Analysis (PCA) and box plots illustrated response differences across clusters. Chi-square tests were used to examine the relationships between demographic factors (gender and place of upbringing) and cluster membership. The significant departure from the independence of the examined variables was identified via Pearson’s residuals.
The average importance of each latent tree attribute was compared between groups of respondents who gave positive, neutral, and negative answers to the questions regarding nature and the willingness to donate to urban trees.
The Kruskal-Wallis test with the Dunn post hoc test was used throughout the study to compare the answers to the survey questions between all respondents or their clusters. The obtained homogenous groups are denoted with letters.
All analyses in the study were performed using the R program version 4.2.2 [
44], with the use of RStudio version 0.99.896 [
45]. The stats version 4.2.2, ggplot2 version 3.5.0, likert version 1.3.5, corrplot version 0.92, factoextra version 1.0.7 and network version 1.18.2 packages were applied to prepare figures illustrating the study results.
3. Results
3.1. Students’Attitudes Toward Nature and the Willingness to Donate to Trees
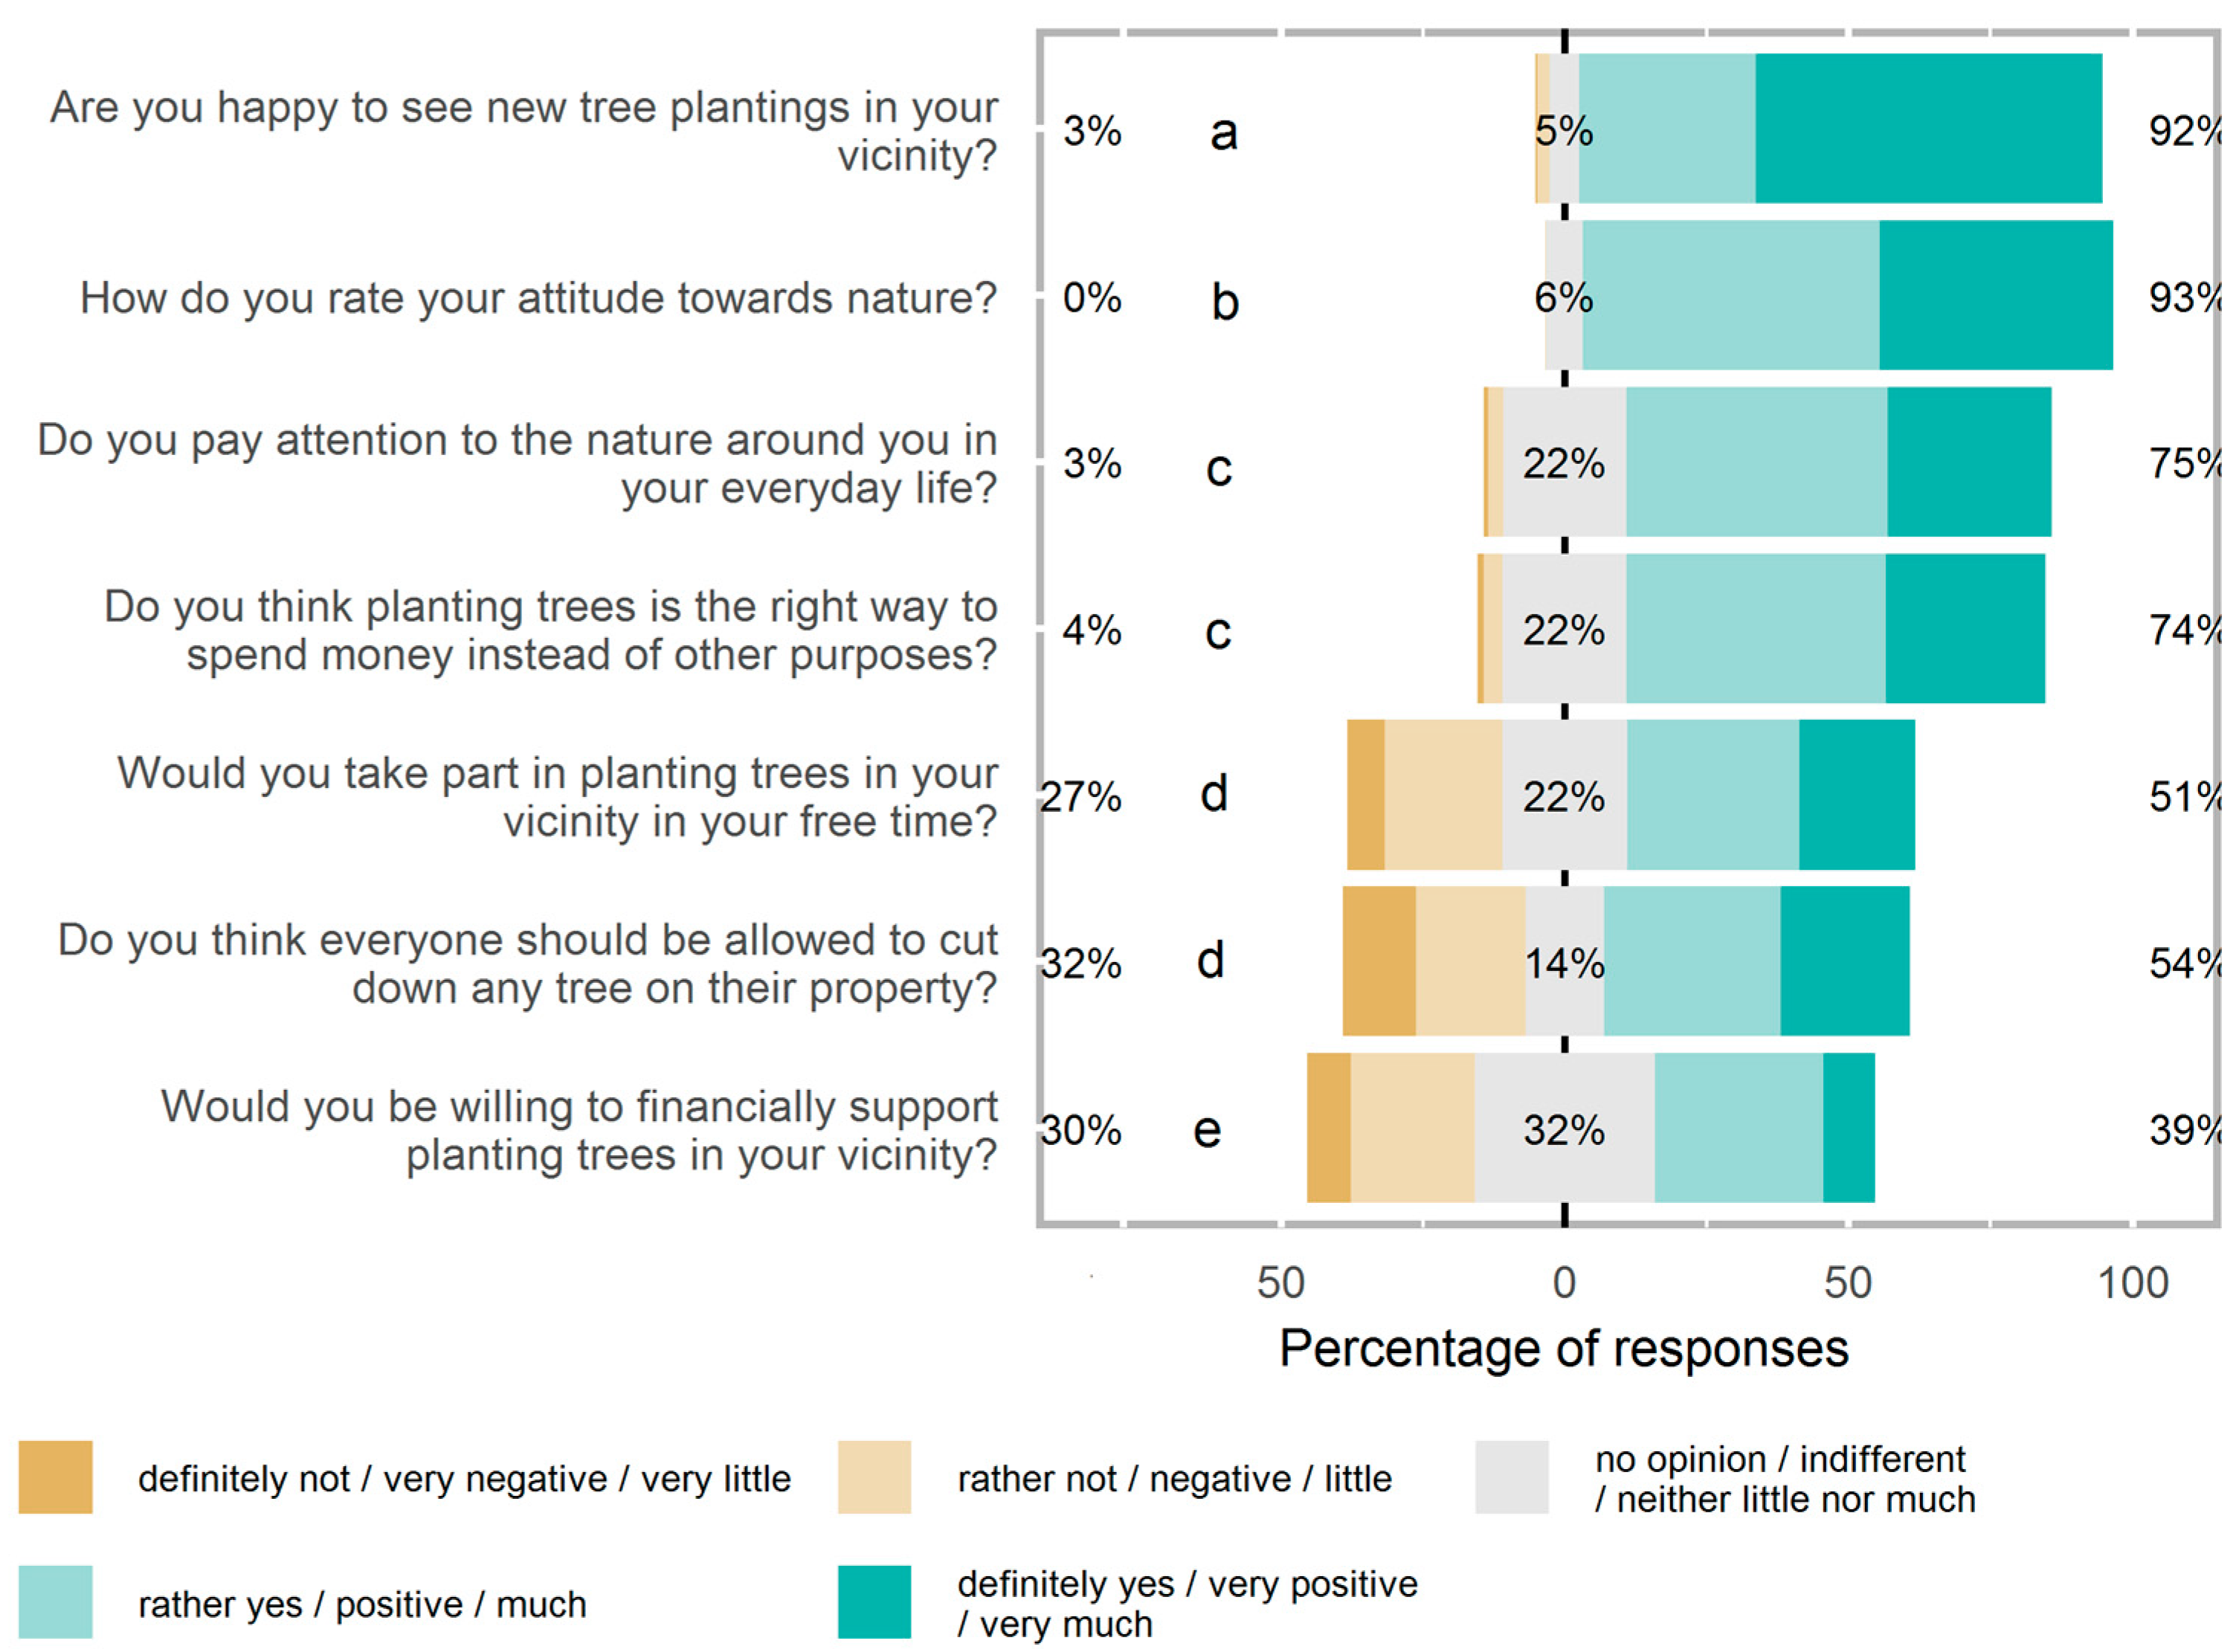
Figure 1 presents the detailed responses regarding students’ attitudes toward nature and their willingness to contribute time, money, or property rights to support urban trees. Across all the questions, positive and very positive responses outweighed negative and very negative responses.
A large majority (93%) of the respondents expressed a positive or very positive attitude toward nature, with only one individual declaring a negative attitude. Approximately 75% of the students stated that they pay much or very much attention to nature, and 92% expressed happiness at seeing new trees planted in their vicinity. This question received the highest proportion of very positive answers (61%). Finally, 74% of the students agreed that money spent on trees was properly allocated.
However, a notable drop in positive responses occurred regarding personal contributions to tree planting. Only 51% of the students expressed a willingness to volunteer their time, with 27% explicitly unwilling to do so. Financial donations received even lower support, with only 39% willing to contribute and 32% expressing no opinion. Finally, when asked whether individuals should have the unrestricted right to cut down trees on their property, 54% supported such rights. In comparison, 32% opposed them, the highest percentage of negative responses in this section.
Figure 2 illustrates the Spearman correlations between the students’ responses. While all the correlations were statistically significant (
p < 0.0001), their strengths varied. There were two main groups of strongly related questions. The first, related to general environmental attitudes, included respondents’ declared attitudes toward nature, attention to nature in daily life, and happiness with newly planted trees. The second combined the happiness of seeing trees planted with the willingness to donate time or money to them. The weakest, and the only negative, correlations were found between attitudes toward the right to cut down private trees and other questions.
Figure 3 presents a flow diagram showing how respondents transitioned between positive, neutral, and negative responses when three donation types were considered: general agreement to allocate funds for tree planting; willingness to devote one’s time or money to such plantings; and limiting the right to cut down trees on one’s property.
3.2. Clustering of Students According to Attitudes Toward Nature and Willingness to Donate to Trees
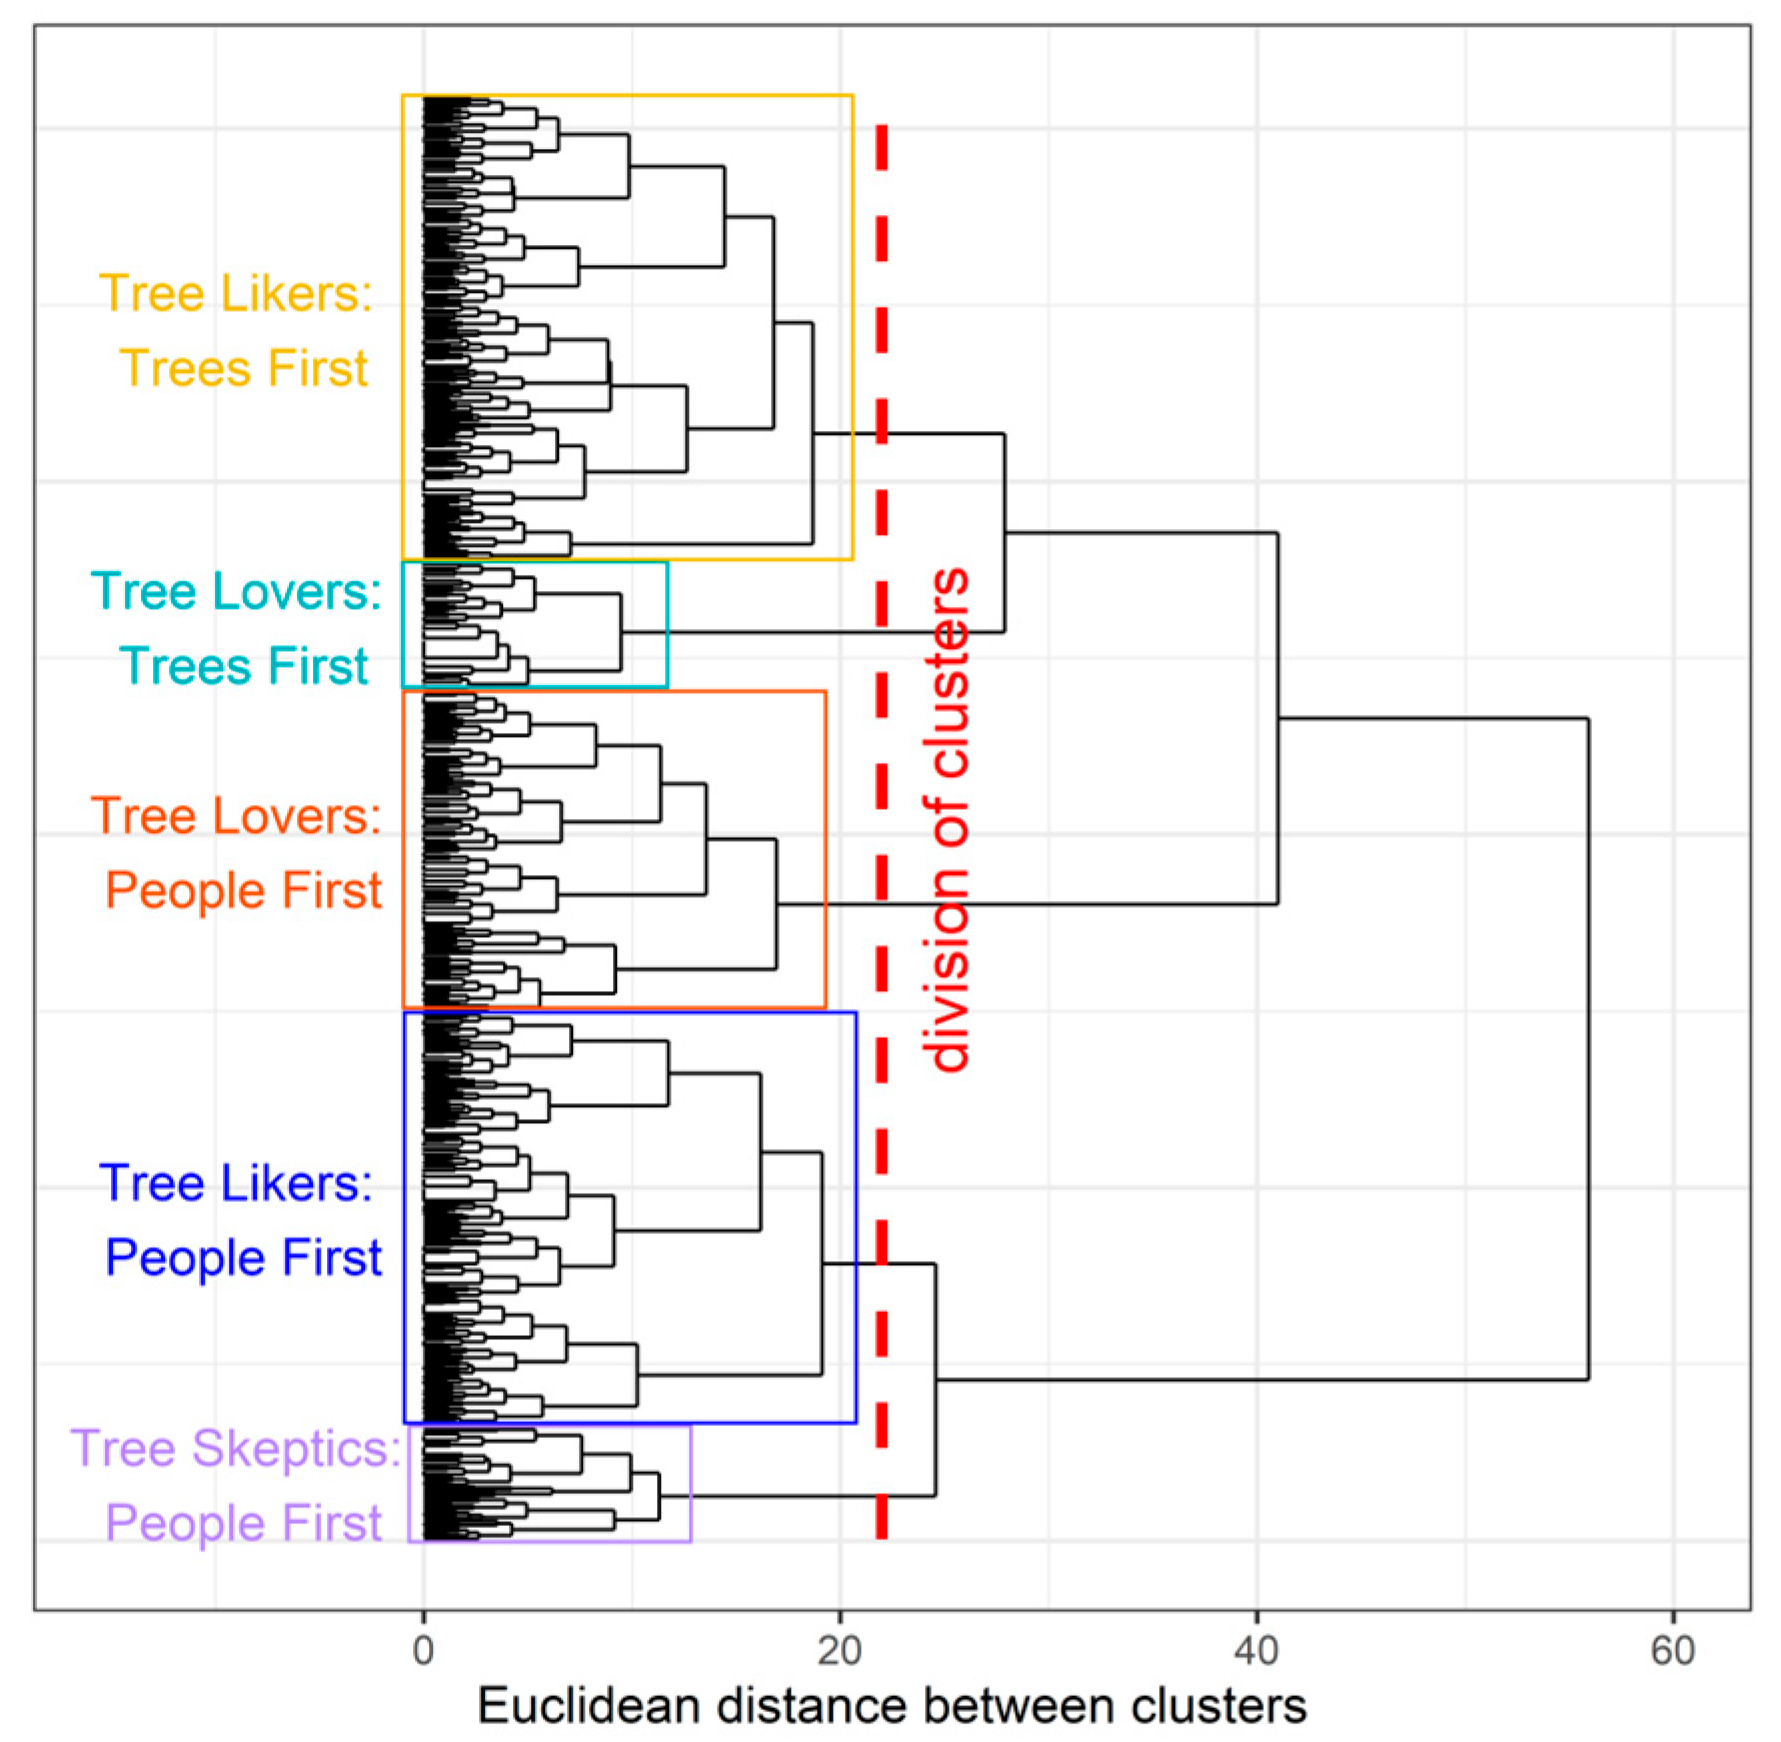
Using the Agglomerative Hierarchical Clustering (AHC) method, the survey respondents were divided into five clusters on the basis of their attention to nature, happiness with newly planted trees, and willingness to donate time, money, or property rights to support trees. The general attitude toward nature was excluded from this analysis due to its little differentiation of the students. A dendrogram illustrating the clustering process is presented in
Figure 4.
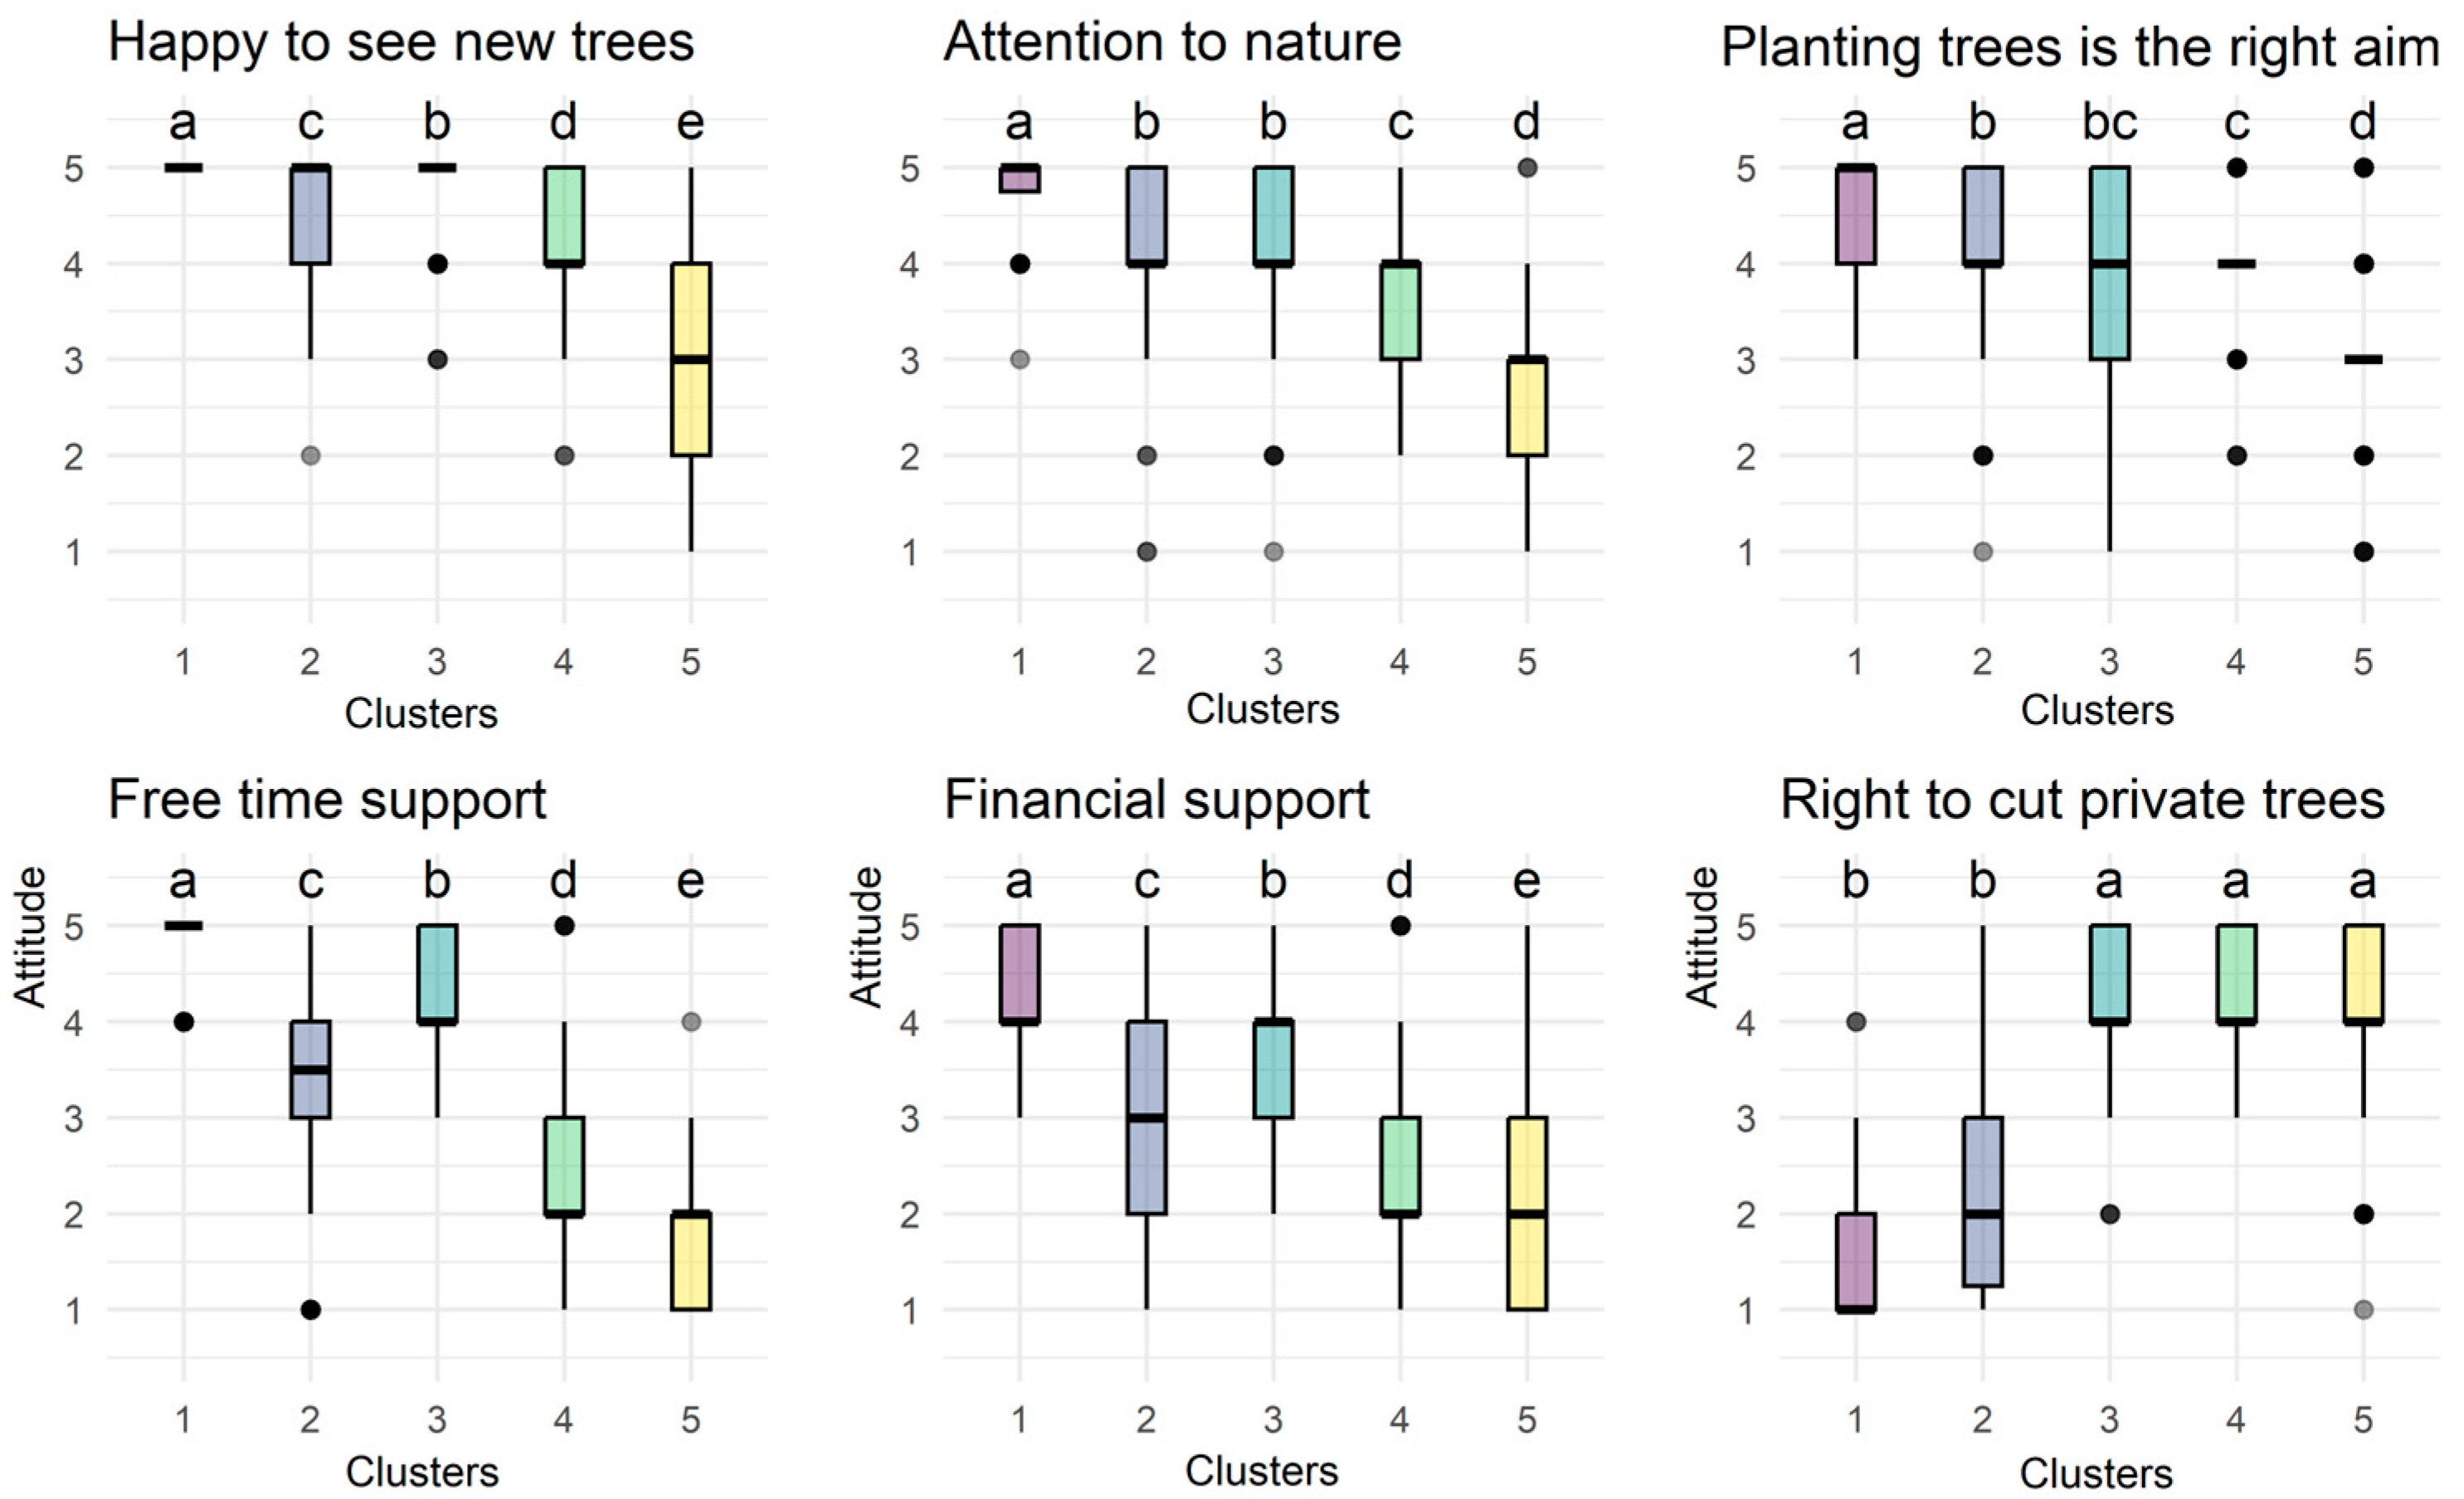
Box plots illustrating the distribution of responses within each cluster are presented in
Figure 5, while
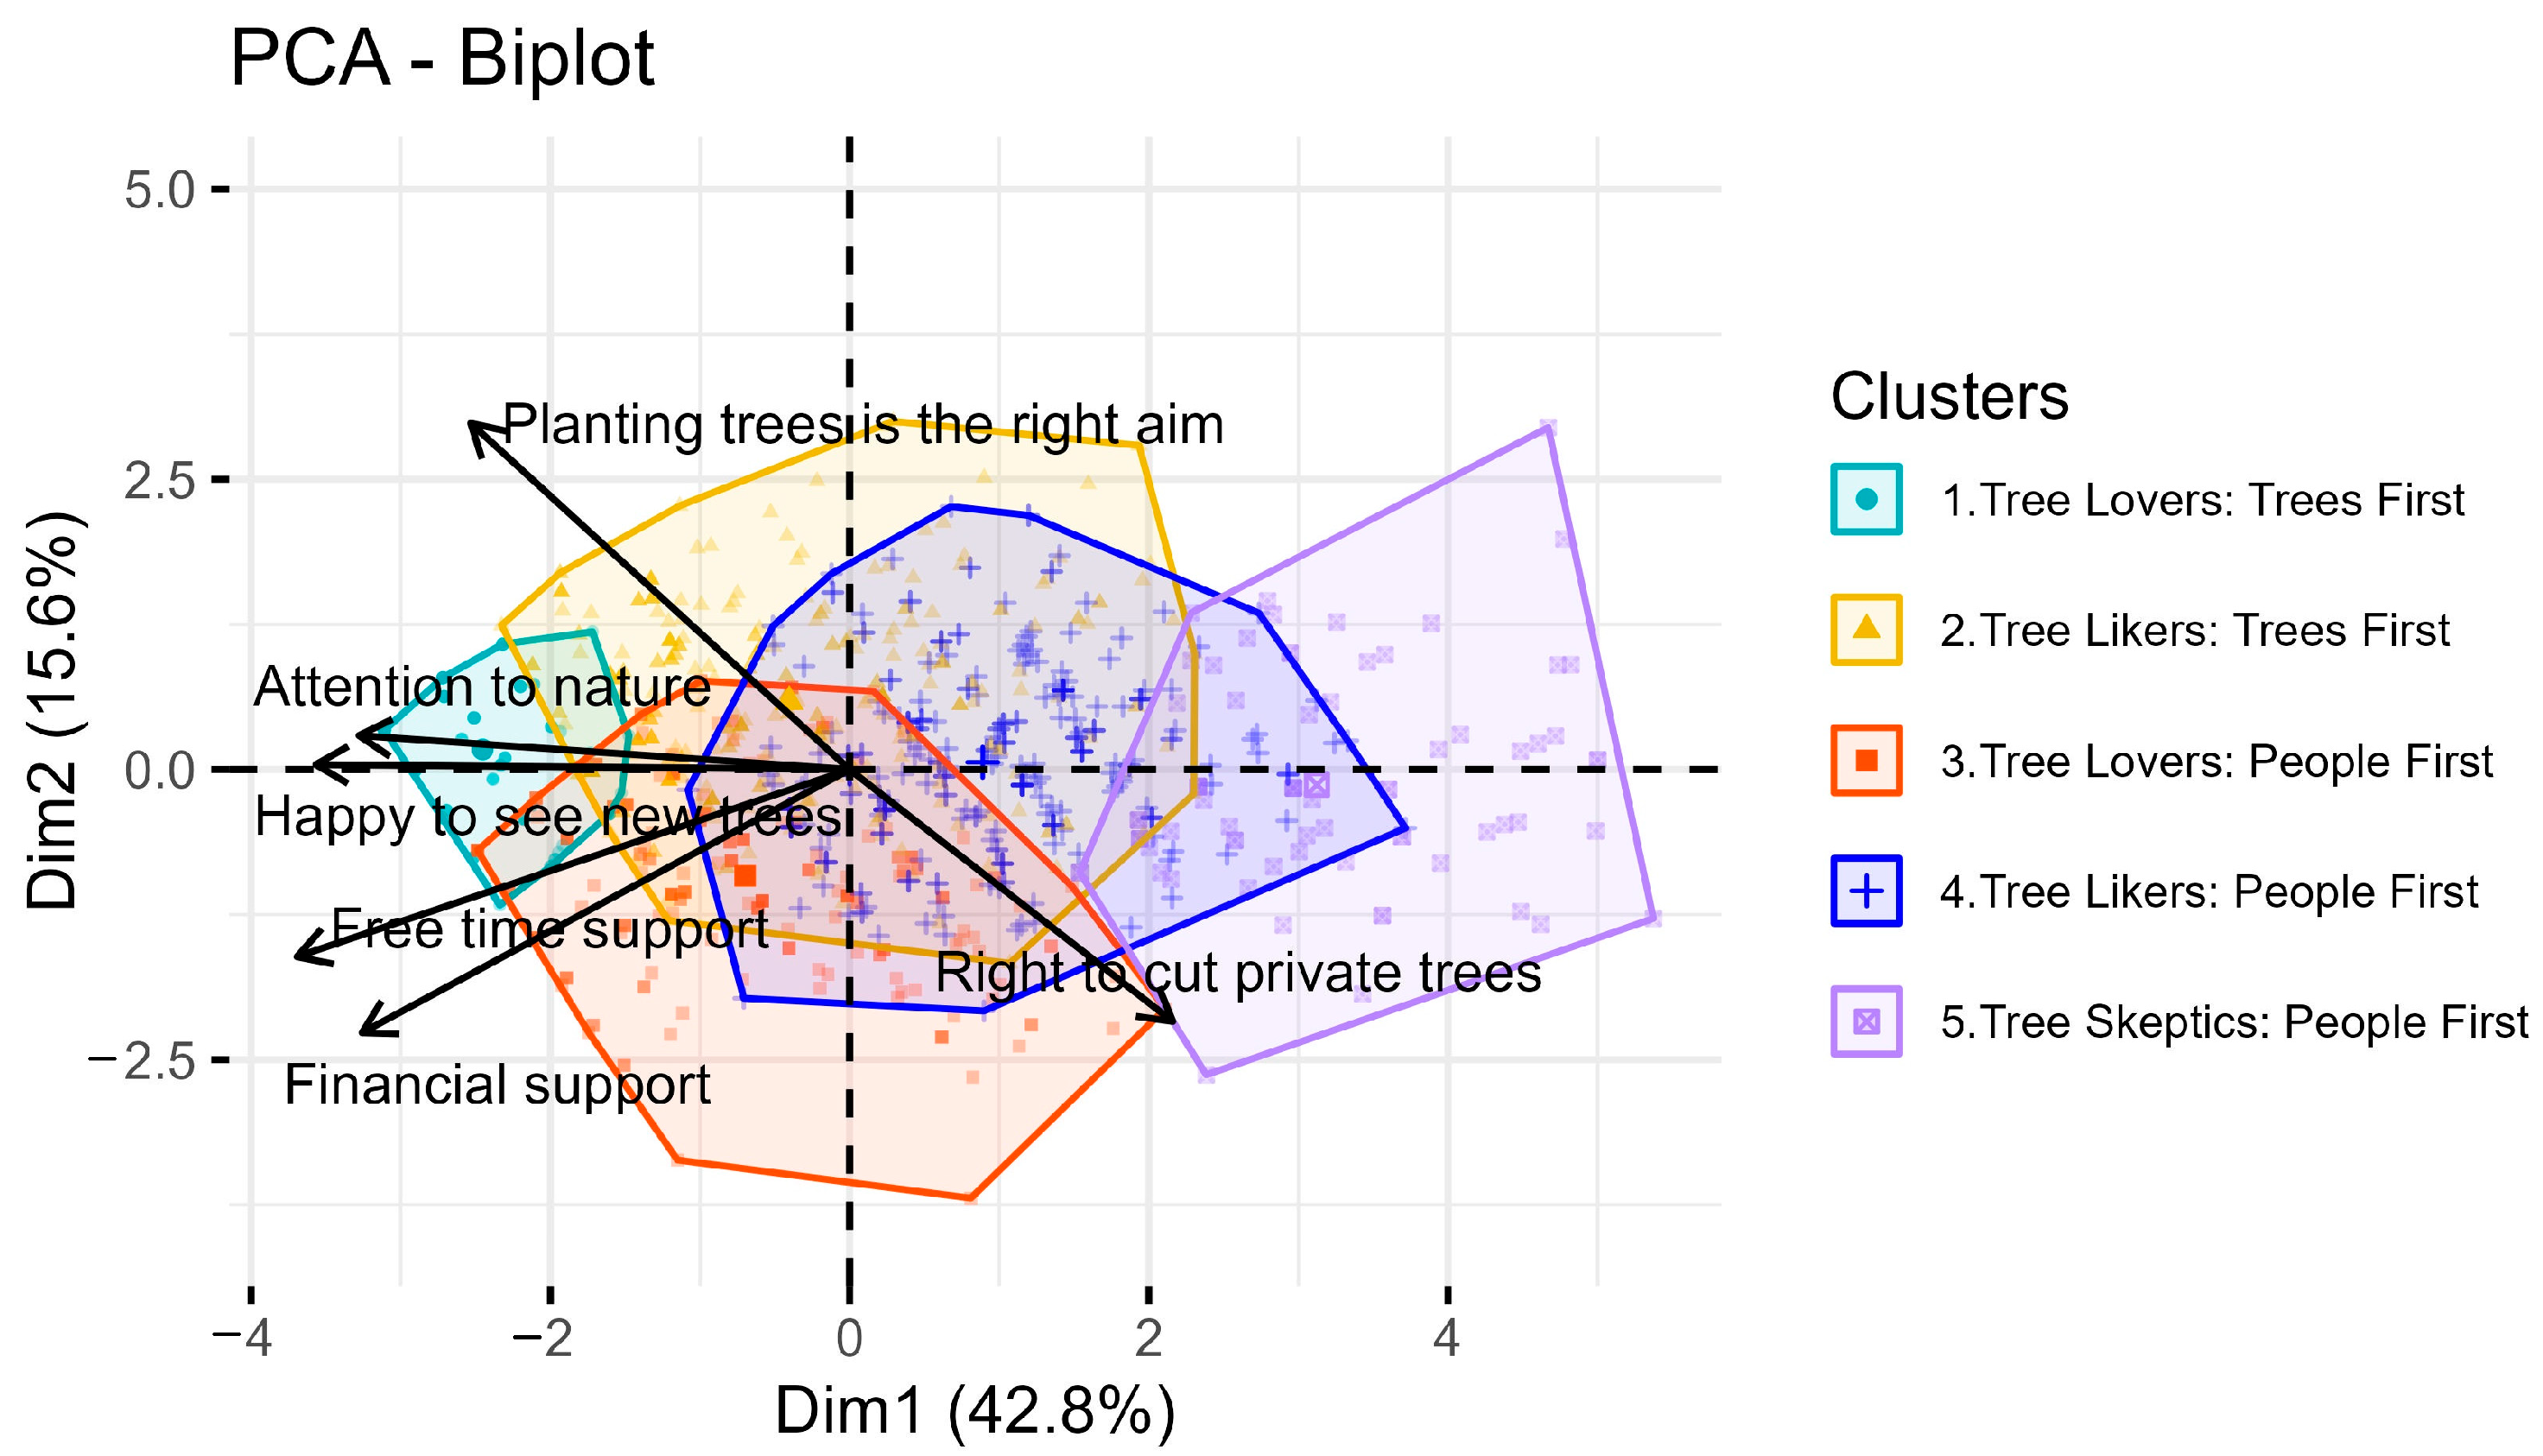
Figure 6 visually summarizes differences between clusters via the Principal Component Analysis (PCA) method.
Based on
Figure 5 and
Figure 6, the characteristics of the student clusters are as follows:
Cluster 1—“Tree Lovers: Trees First” (92 students, 9.0% of the sample, 77.2% women, 22.8% men): Students in this group are highly engaged in tree conservation. They pay great attention to nature, strongly support spending money on trees, and are willing to contribute both financially and through volunteer efforts. They also oppose unrestricted tree cutting rights on private property.
Cluster 2—“Tree Likers: Trees First” (330 students, 32.3% of the sample, 55.5% women, 44.5% men): Similarly to Cluster 1, members of this group also appreciate trees, but their views are more moderate in all aspects, particularly with respect to financial contributions.
Cluster 3—“Tree Lovers: People First” (226 students, 22.1% of the sample, 66.8% women, 33.2% men): These students pay attention to nature and love trees, seeing them as a proper way to spend money. While they wish to support tree planting, primarily through voluntary efforts, they believe that individuals should have the right to decide whether to cut down private trees.
Cluster 4—“Uncommitted Tree Likers: People First” (294 students, 28.7% of the sample, 44.6% women, 55.4% men): Like Cluster 3, this group has a generally positive attitude toward trees but is less engaged. They are unwilling to donate their time or money to tree-planting efforts and support the right of property owners to decide on tree removal.
Cluster 5—“Tree Sceptics: People First” (81 students, 7.9% of the sample, 40.7% women, 59.3% men): This group pays little attention to nature and is uncertain whether trees are the right way to spend money. They are reluctant to volunteer or donate money to plant trees and support individual rights to decide about cutting down private trees.
The relationship between gender and cluster membership was statistically significant (p < 0.0001), with women more frequently belonging to tree-positive clusters. However, no significant correlation was found between students’ upbringing (cities of various sizes or rural) and their cluster affiliation.
3.3. Importance of Tree Attributes
The 29 tree attributes examined in the survey were grouped into six categories through the AHC method. Each category represents a latent tree attribute reflecting specific perceptions of urban trees. Three attributes, “Trees restrict access to light,” “Trees increase the value of the property on which they grow,” and “In areas with trees, drivers retain greater caution and reduce speed,” did not fit into any latent category and were excluded from further analysis. The internal consistency of the latent variables was assessed via Cronbach’s alpha, with all values exceeding 0.7, indicating high reliability. The six latent tree attributes were classified as follows.
Positive attributes:
“Attractiveness”—Visual appeal and esthetic qualities of trees.
“Emotional values”—Social and psychological benefits of trees.
“Usefulness”—Practical advantages, such as providing shade or improving air quality.
Adverse attributes:
“Contamination and damage”—Littering, root damage, and other nuisances.
“Noise”—Sounds produced by trees, such as rustling branches or singing birds.
“Danger”—Risks posed by trees, including falling branches or allergic reactions.
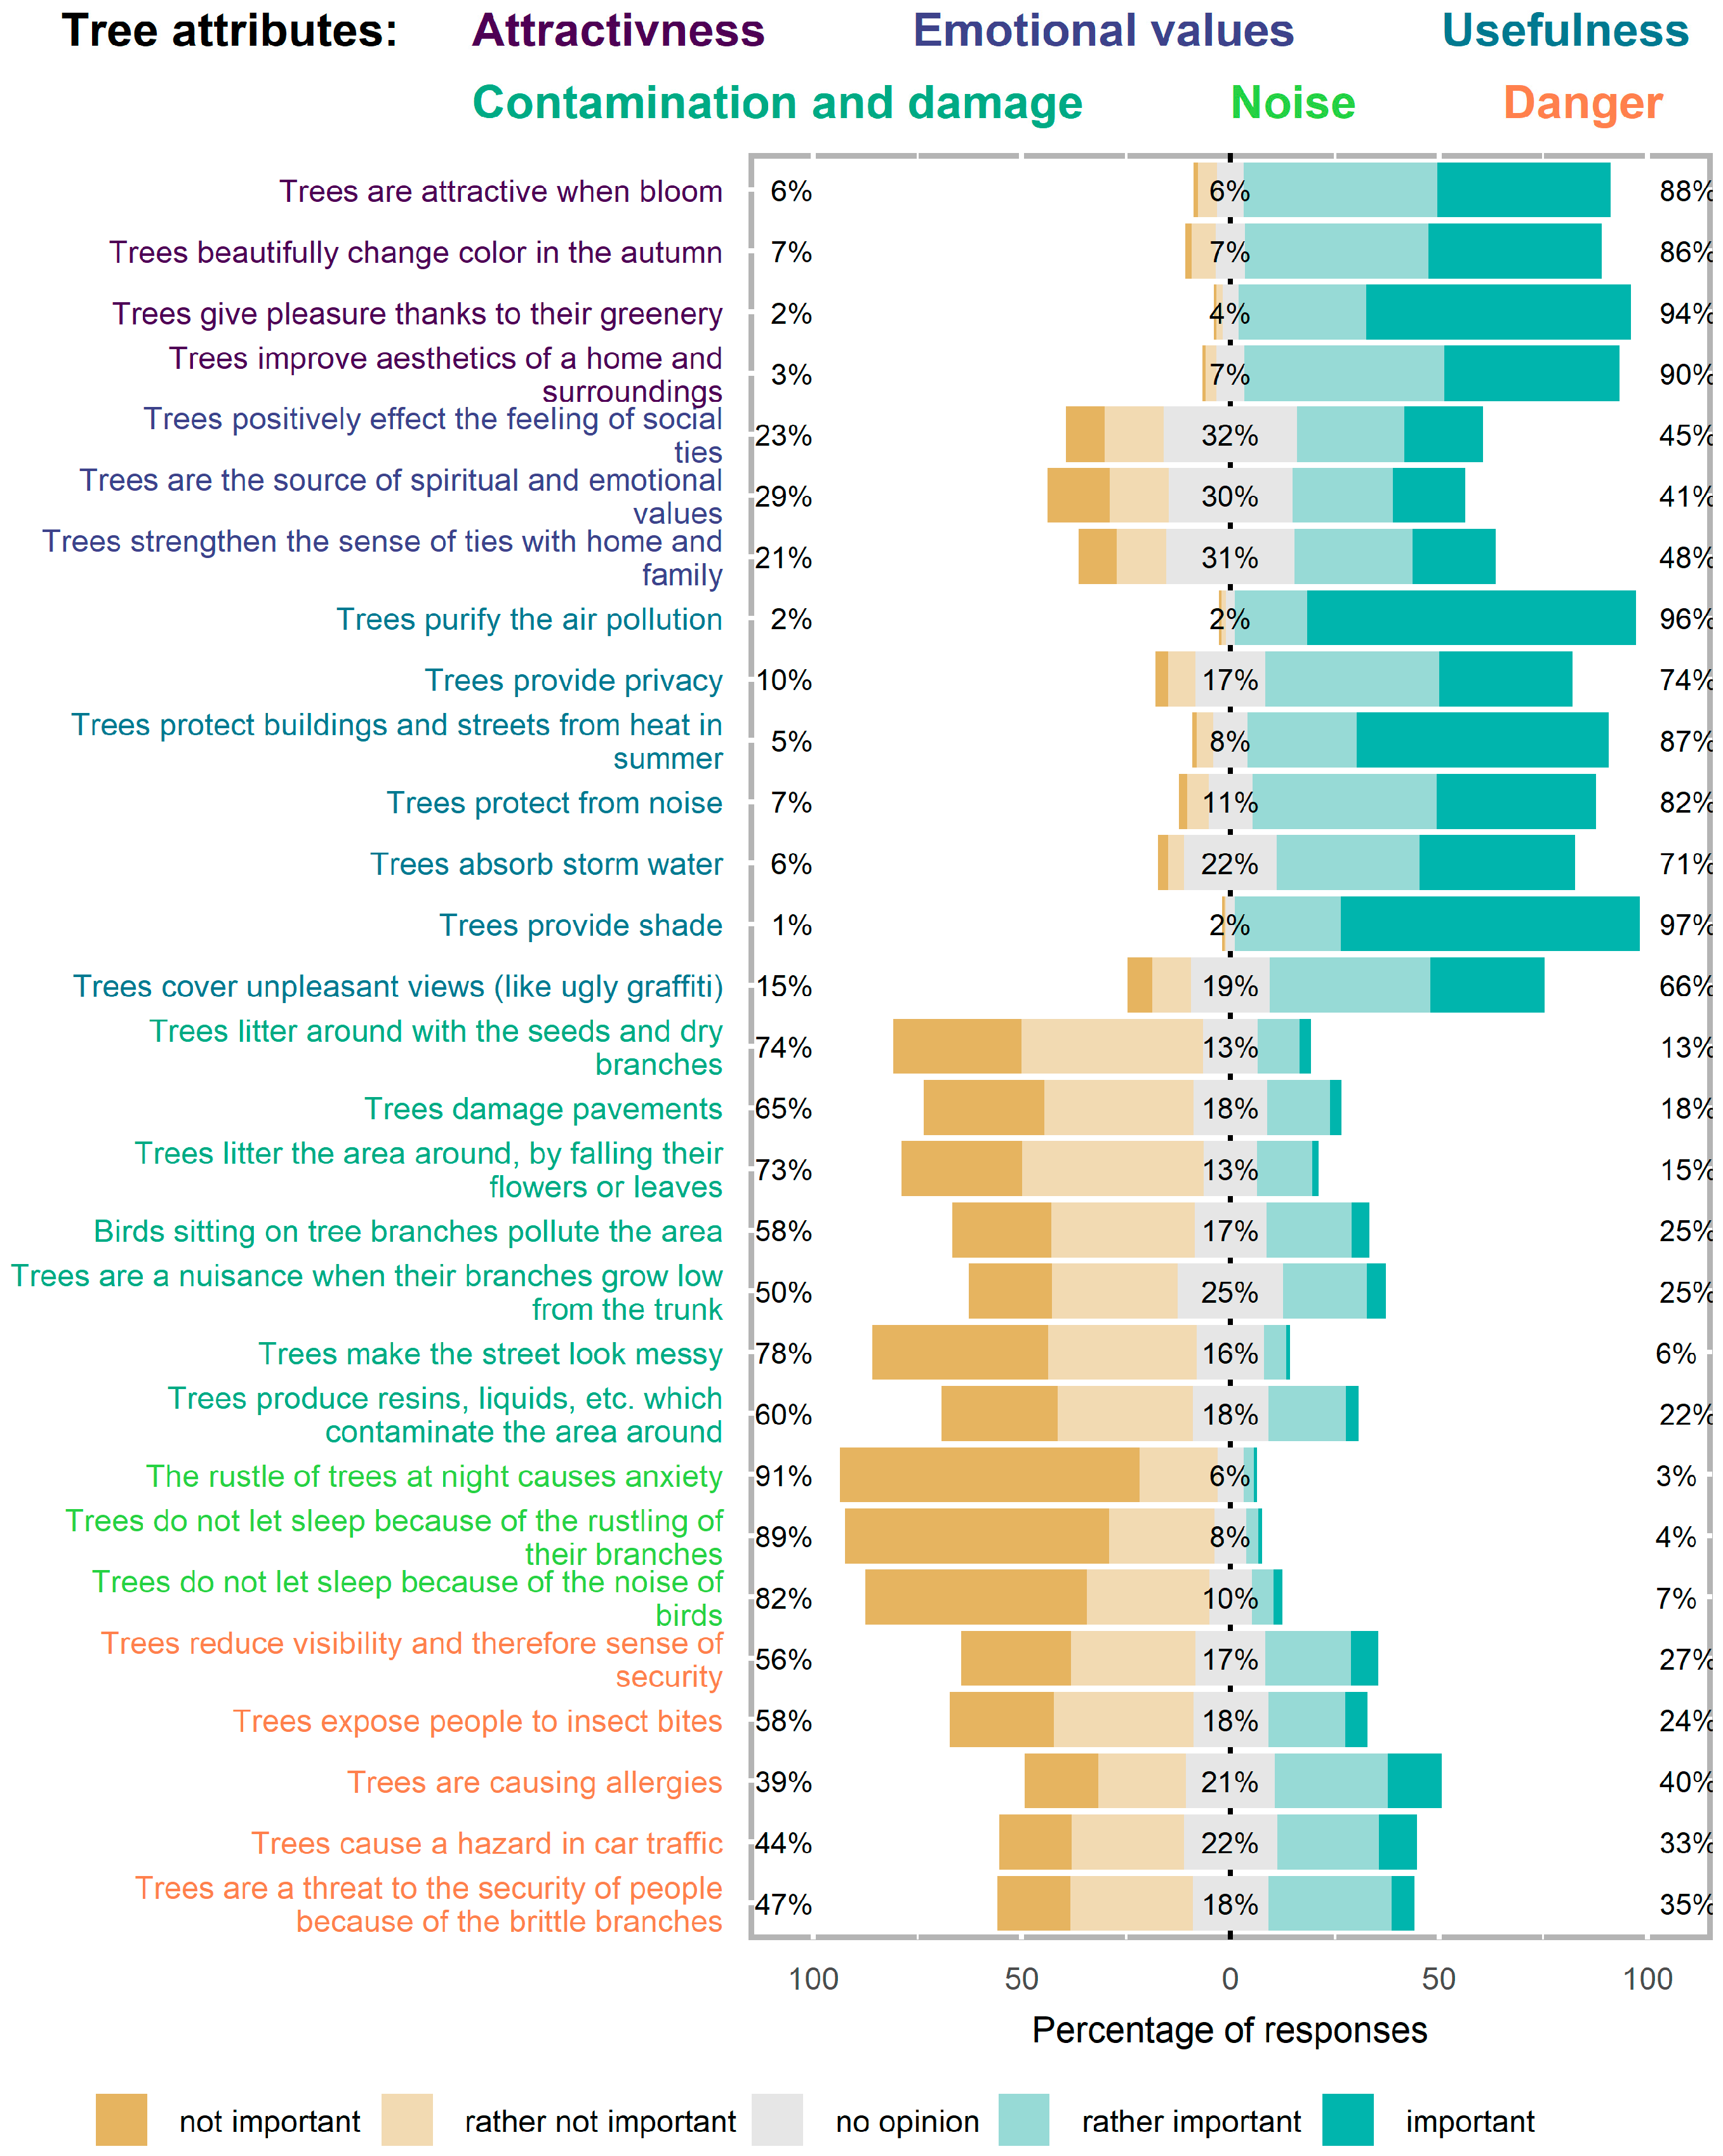
Figure 7 presents the distribution of respondents’ answers to individual tree attributes and their assignment to the latent variables. The attributes related to visual appeal (“Attractiveness”) and practical benefits (“Usefulness”) were rated as important by more than 80% and 66–96% of the students, respectively. Attributes related to emotional and social benefits (“Emotional values”) were valued by 41–48% of the students, whereas those associated with safety concerns (“Danger”) were considered important by 24–40%. The attributes of low importance included tree-related nuisances such as littering and root damage (“Contamination and damage”), which were relevant to only 13–25% of the students. The lowest-ranked attributes were those related to tree-generated noise (“Noise”), which was important to only 6–8% of the respondents.
The respondents’ mean (±standard deviation) answers to the latent tree attributes and the homogenous groups of these attributes (denoted with letters) confirm the above observation. The calculated values were as follows. “Attractiveness”: 4.30 ± 0.60 a; “Usefulness”: 4.23 ± 0.56 a; “Emotional Values”: 3.28 ± 1.01 b; “Danger”: 2.70 ± 0.90 c; “Contamination and damage”: 2.26 ± 0.74 d; “Noise”: 1.56 ± 0.69 e.
3.4. Tree Attributes and Students’ Willingness to Donate to Trees
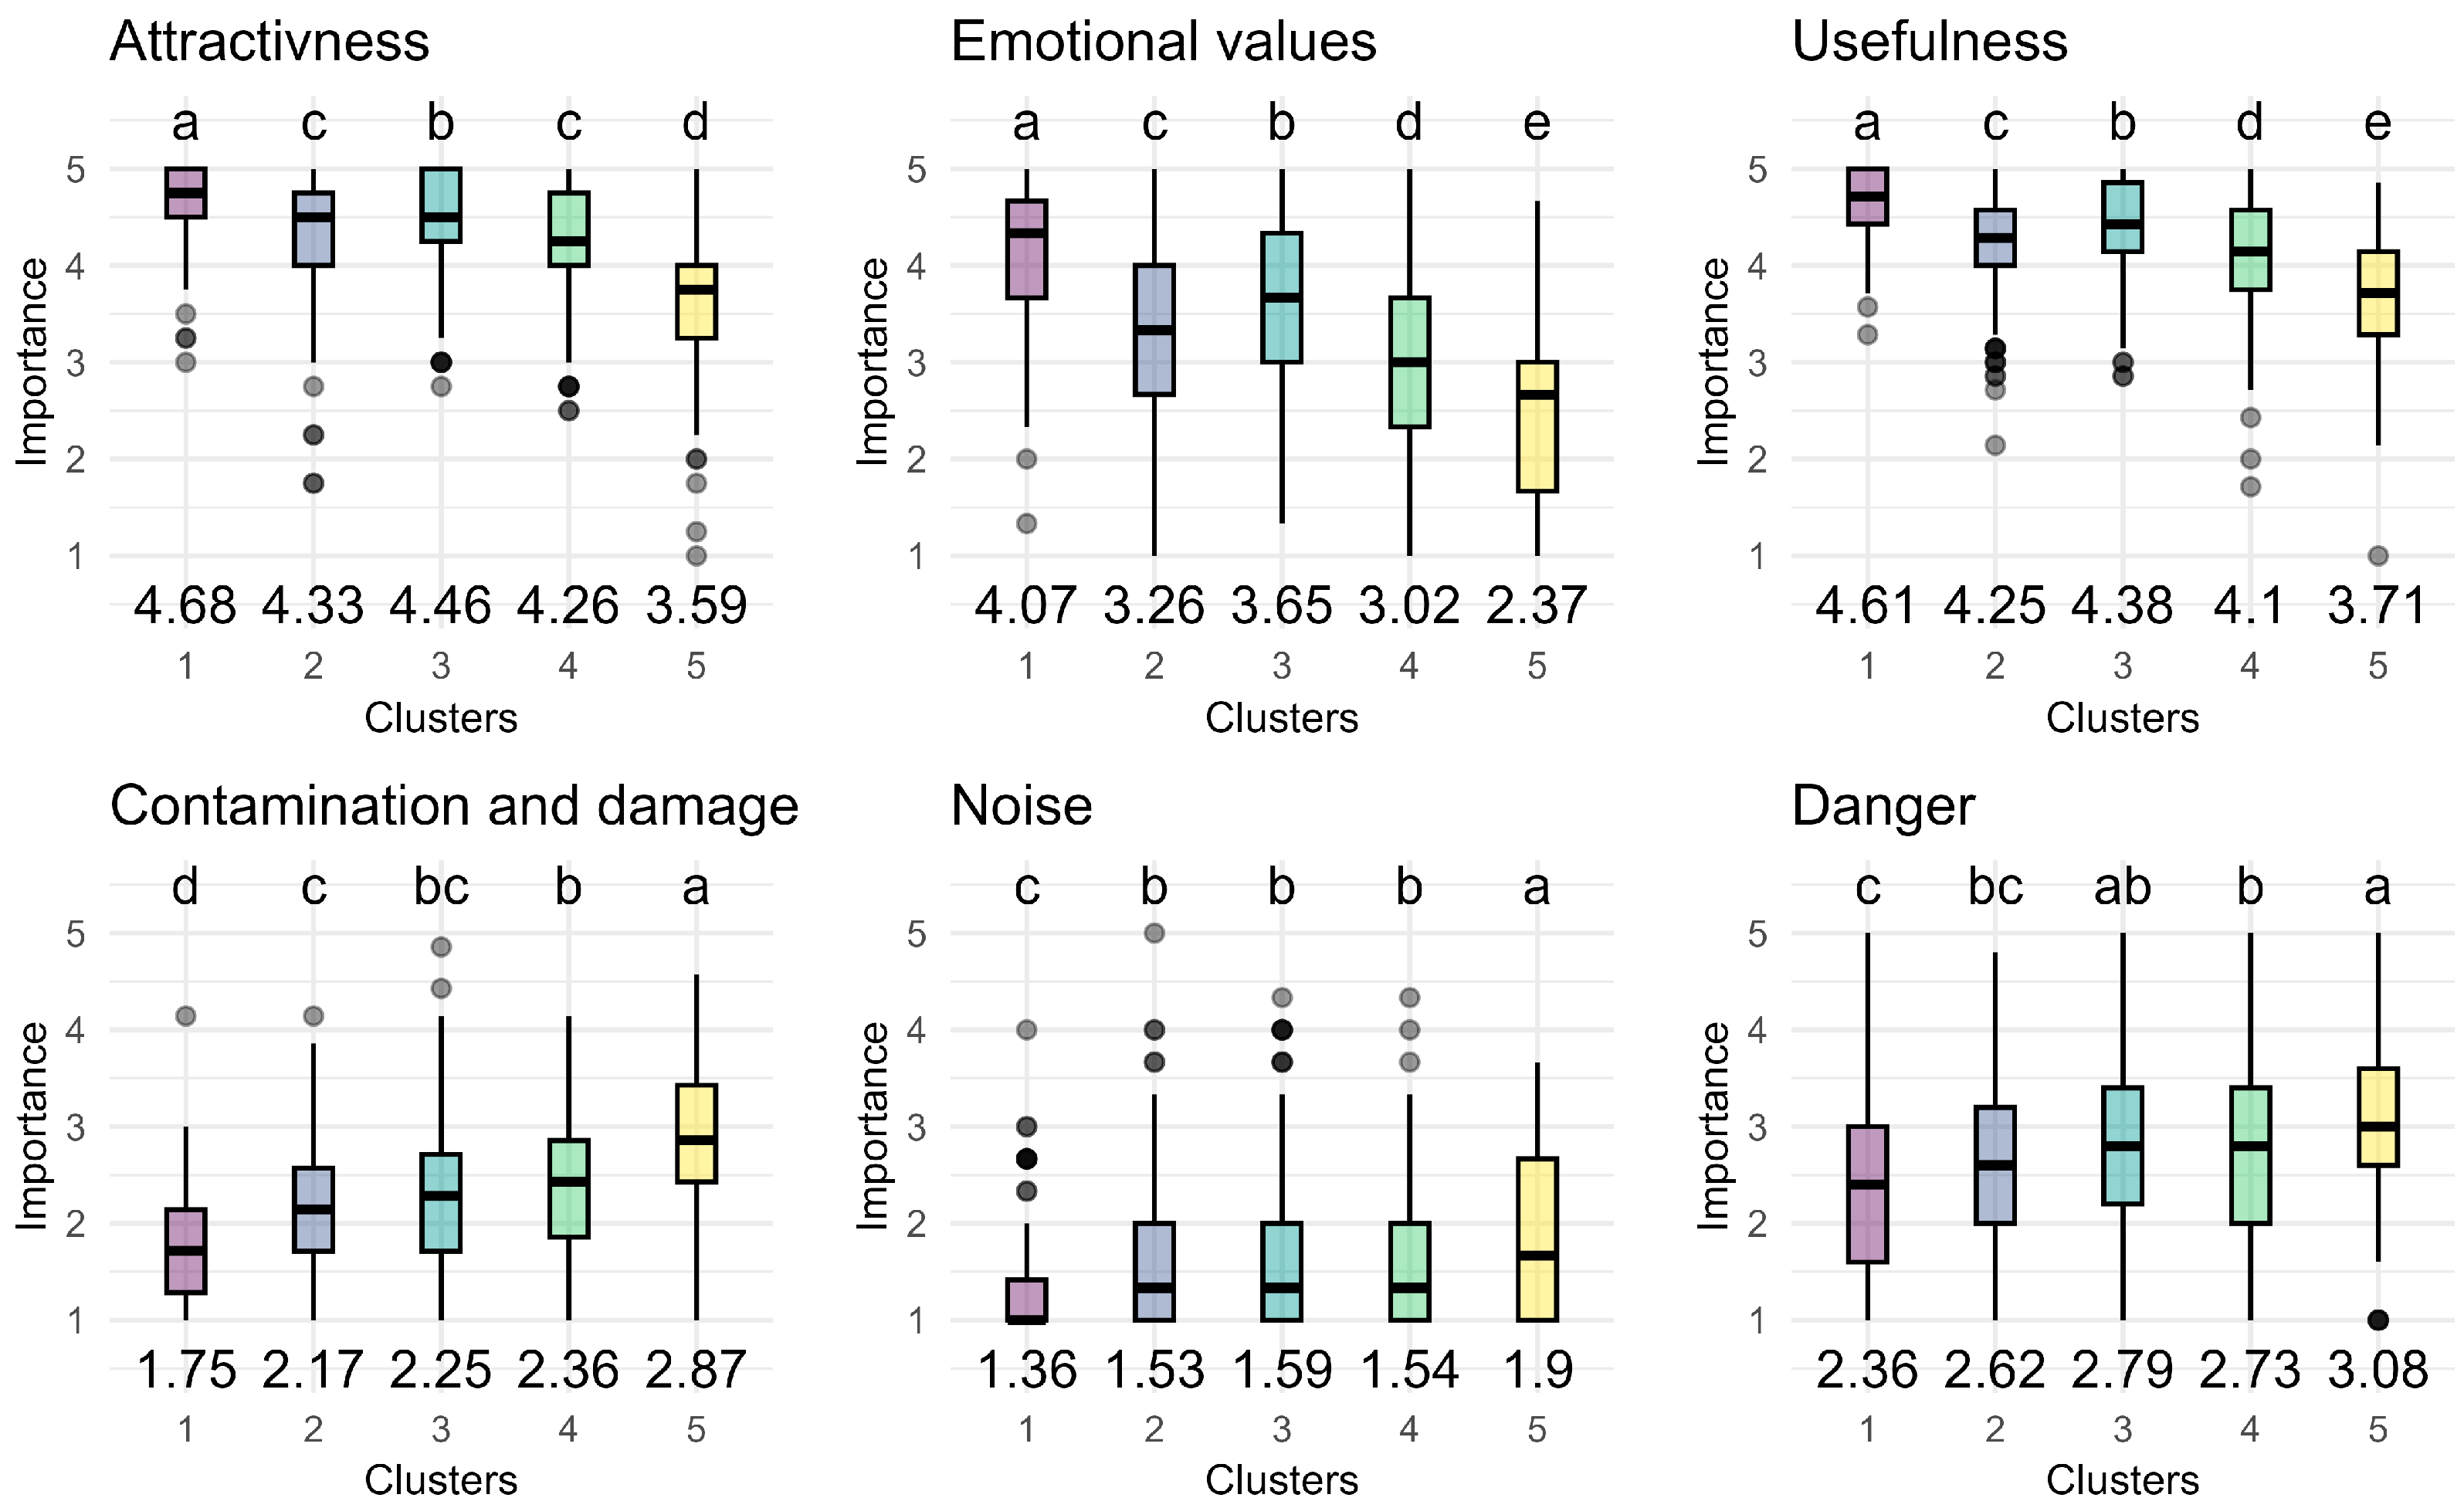
Figure 8 presents box plots illustrating the importance of tree attributes among students across the five clusters identified in the previous section. The results reveal differences between clusters regarding how they value tree attributes. Students in the “Tree Lovers” clusters (Clusters 1 and 3) rated “Attractiveness,” “Emotional values,” and “Usefulness” as the three most important tree attributes. These positive attributes were slightly less valued by “Tree Likers” (Clusters 2 and 4) and received the lowest importance ratings from “Tree Sceptics” (Cluster 5). In contrast, adverse tree attributes, “Contamination and damage,” “Noise,” and “Danger,” were most concerning to the “Tree Sceptics” and least important to “Tree Lovers: Trees First” (Cluster 1). The respondents from the other three clusters showed intermediate concerns regarding these negative aspects.
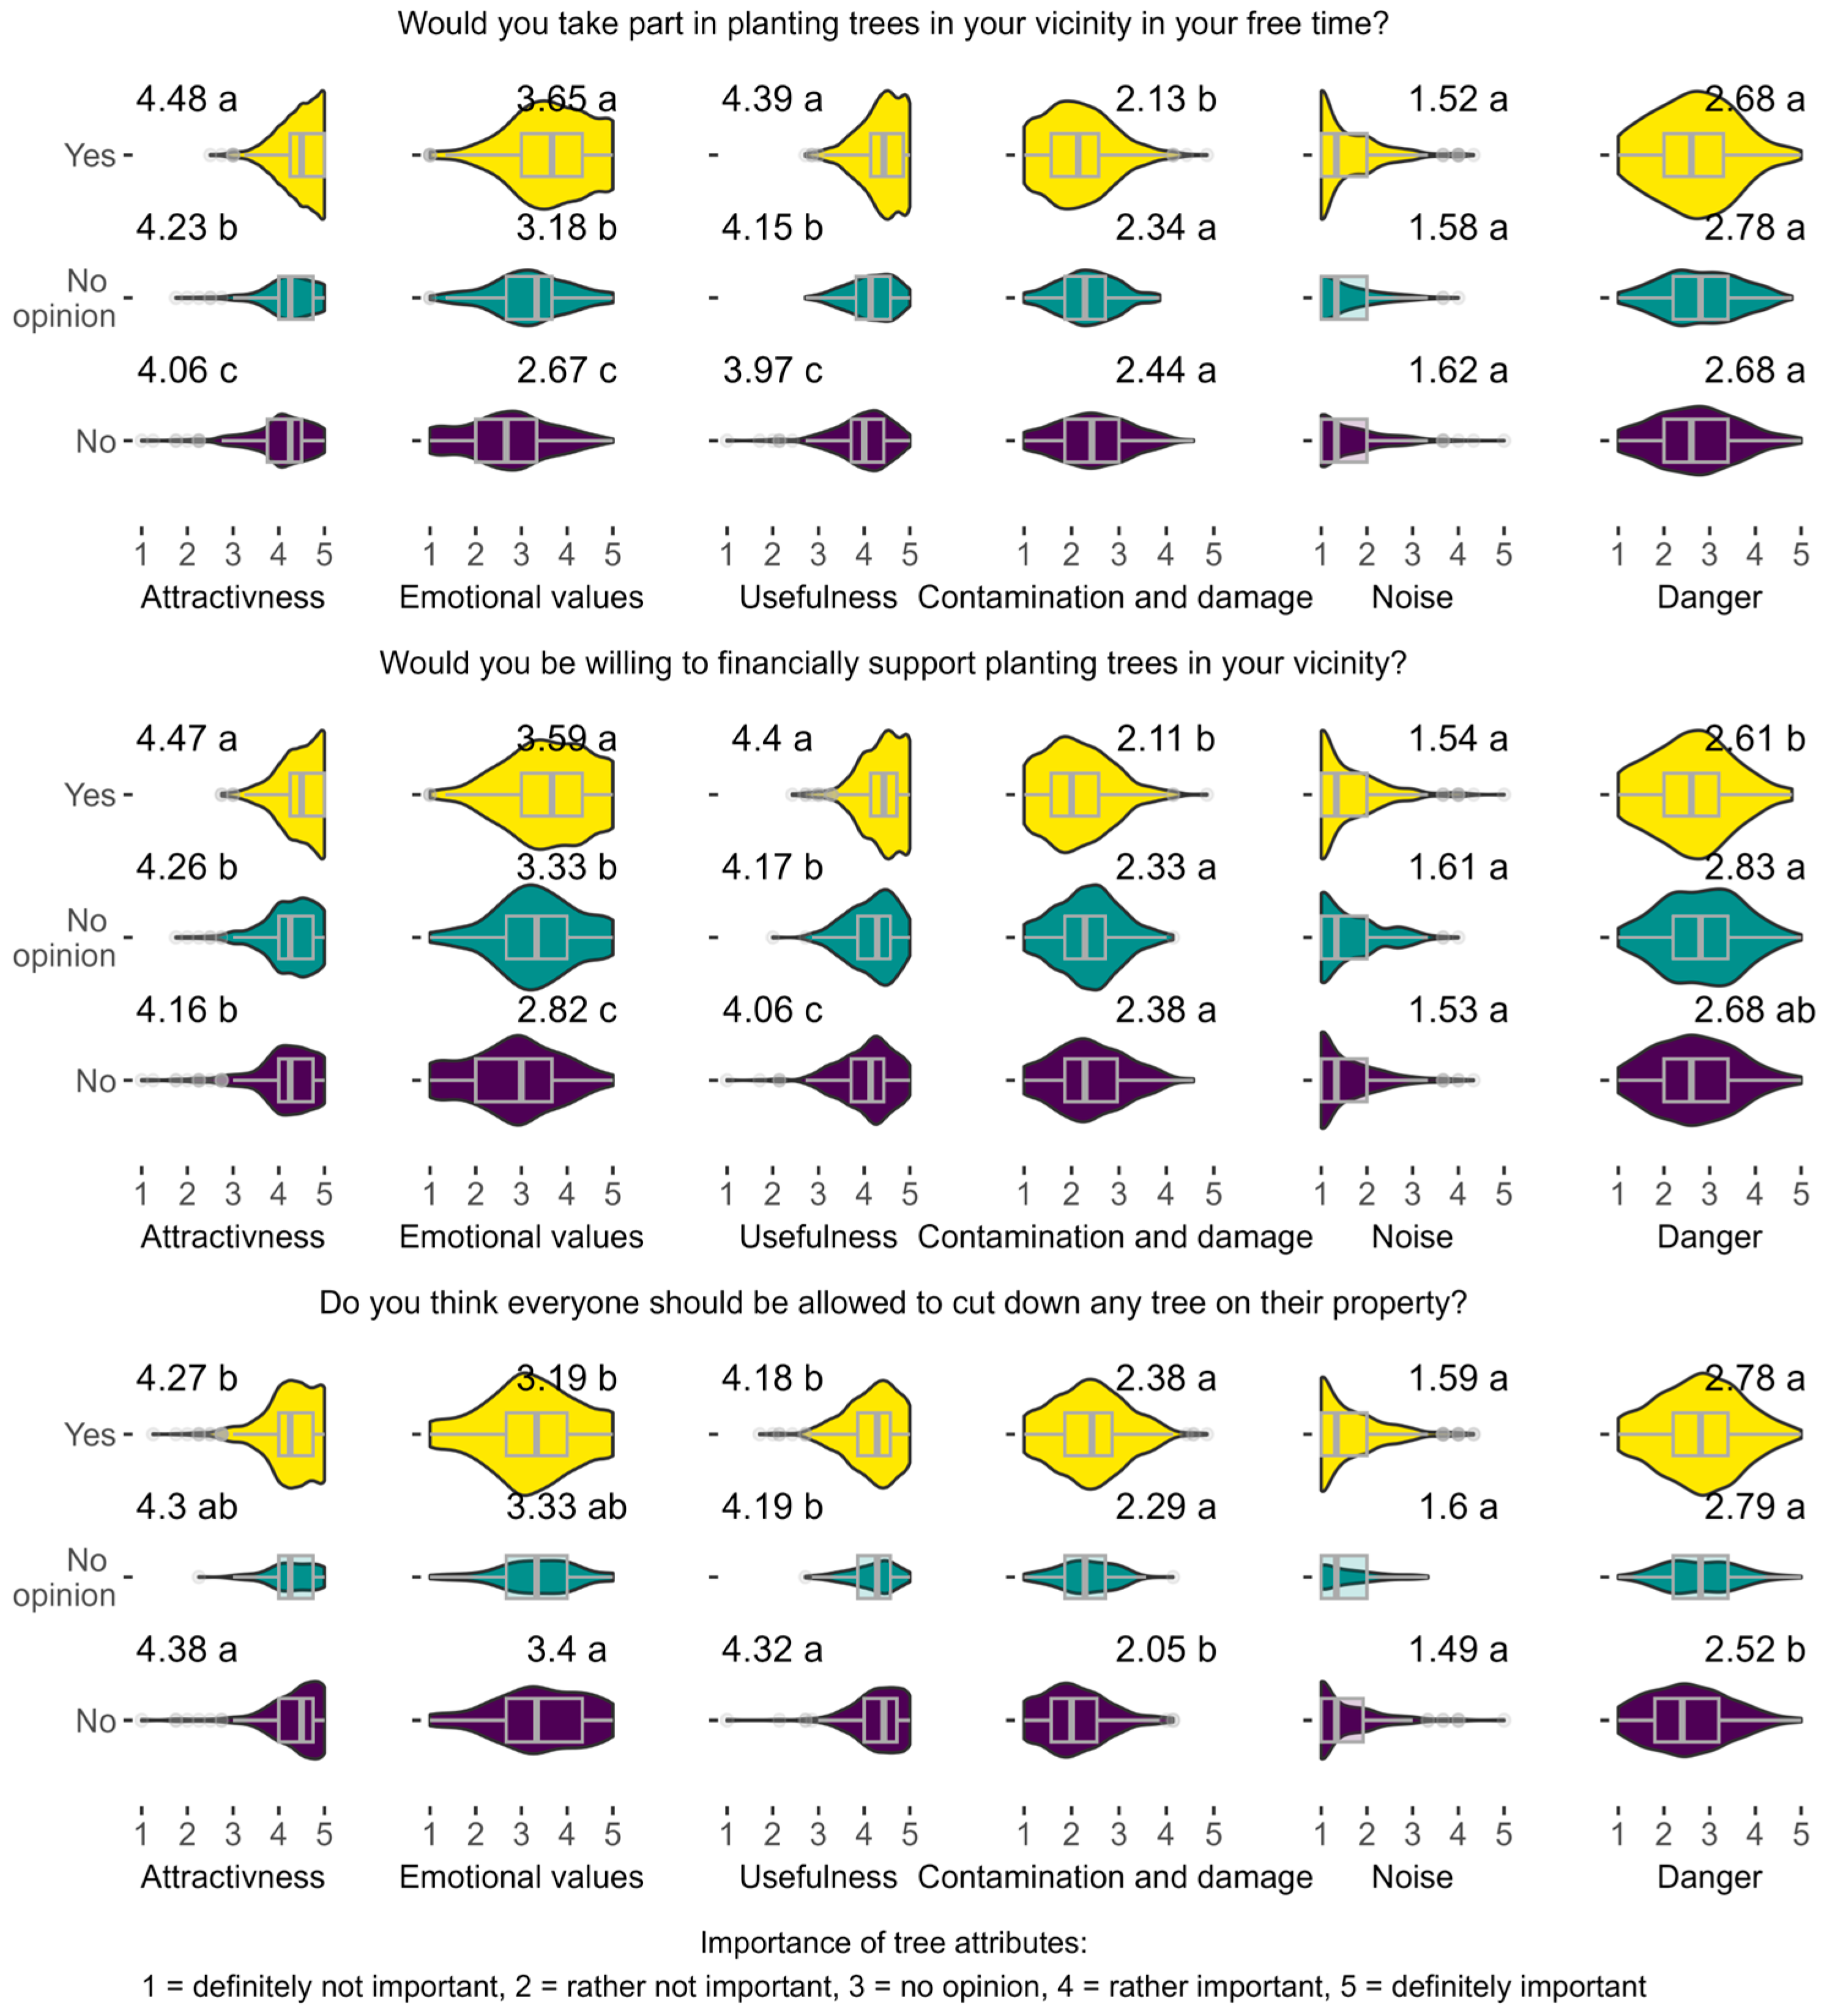
Apart from the cluster-based analysis, individual responses were converted into a three-point Likert scale to categorize willingness to donate time or money to tree planting as positive (“Yes” = “Rather yes” or “Definitely yes”), neutral (“No opinion”), or negative (“No” = “Rather not” or “Definitely not”). The perceived importance of each latent tree attribute was then compared across these three response groups. The results are visualized in
Figure 9, assigning homogenous groups whenever the differences were statistically significant and presenting distributions of the answers.
Willingness to donate to trees was strongly related to students’ perceptions of positive tree attributes. Compared with those who were hesitant or unwilling to contribute, those who expressed a willingness to donate time or money placed significantly greater importance on “Attractiveness,” “Emotional values,” and “Usefulness”. Similarly, these positive attributes were rated highest by students opposing unrestricted tree cutting on private property and lowest by those supporting such rights.
In terms of adverse attributes, the differences were less pronounced. “Noise” did not significantly differ across donation preferences. “Contamination and damage” was most concerning to students reluctant or undecided about donating time or money and those who supported or were unsure about unrestricted tree cutting rights. “Danger” was most important to respondents who favored or were uncertain about the right to cut trees on private property. There were no significant differences in relation to time donation preferences, and the differences across money donation preferences are difficult to interpret.
4. Discussion
4.1. WULS-SGGW Students and Urban Nature
The sustainable development of urban greenery depends on today’s young people. In large cities like Warsaw, these are native-born residents and young people migrating from smaller towns and villages. Between 2005 and 2016, 243 thousand people migrated to Warsaw from other Polish towns, while 165 thousand left the city, often moving into surrounding satellite towns [
46]. Like other major cities, Warsaw attracts young people by allowing them to study and later offering them the opportunity of a well-paid job and professional and social development. In return, young residents significantly influence the city’s development.
Taking the above into account, this study focused on young Poles, members of Generation Z, specifically students from Warsaw University of Life Sciences (WULS-SGGW). The WULS-SGGW students come from diverse backgrounds, ranging from small towns to major cities. While this sample is not representative of the entire Polish Generation Z cohort, it does encompass its significant and influential segment. According to Eurostat data [
47], approximately 46% of young Poles aged 25–34 years had a higher education diploma in 2023.
Green areas, including parks, gardens, housing-estate greenery, street and cemetery greenery, and open areas combined with forests, account for approximately 40% of Warsaw’s land area. The city hosts 27 municipal forest complexes, 85 parks, and numerous lawn areas [
48]. Forests cover about 15% of Warsaw, with approximately 40% of them in private possession [
49]. The greenery system includes unique habitats, such as the Vistula River areas, which are part of the “Natura 2000” network of nature reserves. Given this abundance of greenery, it is nearly impossible for Warsaw’s residents, including the surveyed students, to avoid interacting with urban nature.
The survey results indicate that WULS-SGGW students generally hold a positive attitude toward nature. Three out of four respondents declared a high or very high interest in the natural environment. Moreover, with only minor exceptions, the examined students are happy to see new tree plantings in their neighborhood, being a very good prognostic indicator of urban greenery development. These findings align with previous studies demonstrating widespread public appreciation for urban trees [
21,
32,
41,
50,
51].
4.2. Willingness of Students to Donate to Urban Trees
Three-quarters of the surveyed students believe that allocating funds to urban greenery, rather than other investments, is justified. This sentiment is reflected in Warsaw’s participatory budgeting outcomes. In 2023, more than half of the civic budget was allocated to urban greenery development projects, with the city-wide project “500+ Trees for Warsaw” receiving the most votes [
52]. Similarly, district-level projects prioritizing greenery, such as “More greenery in the entire Praga-Południe” (in 2023) and “2050 Trees for Warsaw” (in 2022), received the most votes [
52,
53].
However, students displayed a more nuanced stance when asked about personal contributions. While most agreed with funding for tree planting, the share of students willing to volunteer time dropped to about half, while only 39% indicated a willingness to provide financial support. These results are consistent with the outcomes of previous studies conducted worldwide. A 48% share of respondents in Lagos, Nigeria, with an average age of around 30 years, wanted to commit time to urban forestry development [
37]. Further, 58% and 56% of urban residents of Alabama, USA, were ready to contribute time or money, respectively, to community forestry program activities [
38]. In Montreal, Canada, analogous questions received average responses of 2.8 against 2.5 on a 5-point Likert scale, ranging from 1 “completely liking” to 5”completely disagree” [
39]. A 48.5% share of the citizens of Greece were willing to pay the highest proposed additional annual tax for urban green spaces [
19]. The lowest share of respondents prepared to pay more council taxes to support tree care, only 30%, was found in a British survey [
40].
The correlation between willingness to donate time and money is significant, and 57% of the respondents provided the same response to both questions. This suggests that for many students, time and financial contributions to urban greenery are complementary rather than interchangeable. The lower financial commitment may be attributed to students’ limited income, as research indicates that philanthropic donations increase with income and wealth [
54,
55]. Conversely, time donations appear to be less affected by economic factors [
56]. The low income of students may also explain why one-third of them were uncertain about their financial commitment to tree planting, which was the highest share of undecided answers in the survey.
Over half of the students stated that everyone should have the right to decide to cut down their trees, and one-third were against that right. These answers may explain why 40% of all trees removed in the city of Łódź during the 2010–2019 decade were cut down when the amendment to the Act of Nature Protection permitted the free removal of trees from private properties [
25]. The fact that about 80% of these trees were cut down on private land shows that many citizens agreed with the amendment.
The relatively low support for local ordinances governing the planting, maintaining, and removing of urban trees on private property is not exclusive to Poland. A study from Alabama, USA, reported such support at 36% [
38]. According to a subsequent study from that area, protecting publicly owned trees was “very important” for 55% of the respondents [
32]. In contrast, protection applied to individually owned trees was “very important” for only 17% of those respondents, with roughly as many participants selecting the lowest rating “not important” [
32]. In Ontario, Canada, on average, 43% of the examined residents “agreed” or “strongly agreed” with a proposed tree protection law on private property, and 29% percent “disagreed” or “strongly disagreed”, wishing to self-govern the presence of trees on their property [
41]. Finally, support among homeowners in Florida, USA, for the ordinances that prevent the removal of mature, healthy trees from private possessions was 54% [
42].
The fact that so many young people oppose restricting their right to cut down trees on private properties should be understandable. While they may appreciate trees, they often value the freedom to shape their environment even more. Just as they wish to design their apartments to suit their individual needs, they seek the same unrestricted freedom when planning their gardens. Environmental protection regulations that limit tree removal can hinder projects such as building a new gazebo, creating a garden path, or expanding a garage. The environmental value of a tree is not significant in this respect. Unfortunately, such conclusion does not favor urban forest sustainability and indicates that unrestricted urbanization is indeed the major threat for urban greenery.
4.3. Drivers of Students’ Willingness to Donate to Trees
If students like nature and trees in particular and are happy to see them planted, what makes them differ in their individual willingness to donate to trees? This study identified five clusters within Polish Generation Z students on the basis of their attitudes toward trees, willingness to donate, and opinions about the right to cut down private trees.
The first axis of classification reflects personal affection for trees and their willingness to contribute. The students fell into three groups: “Tree Lovers,” “Tree Likers,” and the smallest group of “Tree Sceptics.” Compared with the importance of tree attributes, this division is related primarily to how students perceive the benefits of trees, their “Attractiveness,” “Usefulness,” and “Emotional values.” There is a significant decrease in the perceived importance of these attributes as one moves from “Tree Lovers” to “Tree Likers” and further to “Tree Sceptics.” Hence, the major driver of attention to trees and willingness to support them is trees’ utility. The analysis of individual students’ responses confirms that the benefits associated with trees are most important for students who want to devote time or money to planting trees, less important for those who are hesitant, and least important for students who do not want to do so. In contrast, the only adverse tree attribute with a clear relation to the willingness to donate to trees is “Contamination and damage,” as the students willing to donate are significantly less concerned with this issue than the hesitant and unwilling ones are.
In general, time and money donations may be driven by altruism or impure altruism (“warm glow”) or the exchange of value benefits (such as obtaining knowledge or experience) [
57]. In the case of planting trees, the three motives for donations may be inseparable. It is natural to assume that planting trees is an act that benefits others, i.e., an altruistic act. It also brings a long-lasting “warm glow” to everyone involved, as the results of planting trees last for decades. Moreover, separating the “warm glow” from the private benefit obtained, which is the increasing attractiveness of the surroundings, is difficult. Hence, the beauty of new trees, their usefulness, and the satisfaction of emotional needs they bring are the principal payments for voluntary labor or monetary donation. In this respect, our results agree with the finding of [
10] that the sustainable actions of Polish Generation Z are primarily motivated by obtained benefits, though not economic in this case. It also agrees with the results which showed that the higher the development level of recreational infrastructure of a forest in Wasaw, the more often representatives of Generation Z choose it for leisure and are more willing to pay to access it [
58].
The utilitarian view of urban greenery seems natural. Various studies have examined city dwellers’ attitudes toward various tree-related benefits and risks. They all agreed that personal, social, and environmental benefits are most important to the inhabitants of cities. A study performed in Guangzhou city, China, revealed that people indicate O
2 release and CO
2 sequestration, esthetic enhancement, shading, air pollution absorption, noise abatement, and recreational values as the most critical services generated by green spaces [
59]. All these factors were very important to more than 40% of the respondents to the study. Similarly, the improved appearance of the community, improved air quality, control of soil erosion, reduction in noise levels, creation of wildlife habitats, and creation of buffer zones were significant to more than 40% of the respondents to a survey conducted in Alabama, USA [
32]. Further benefits, such as increased property values, decreased energy costs, increased community pride, and improved health, were significant to more than 30% of the questioned citizens. The beauty of trees, improved appearance of gardens or houses, increased privacy, and attraction of birds and animals have also been shown to be the most important reasons for the planting of trees for citizens in the suburbs of eastern Australian cities [
33]. These reasons were indicated by 61% to 85% of the respondents in the survey. Similar results were obtained in a study of citizens in Poland [
35]. The tree attributes chosen most often by Polish respondents as important were those related to tree attractiveness and usefulness. Finally, tree attractiveness and personal, public, and environmental benefits were the major drivers for participation in city programs that provided free street trees to residents of New Haven, Connecticut, U.S., [
34] and Nashville, Tennessee, U.S. [
36].
The second axis in classifying Polish Generation Z students is their attitude toward the right to cut down private trees. The “Tree Lovers” and “Tree Likers” can be split into groups opposing (“Trees First”) and supporting (“People First”) such rights, confirming that the two directions of student division are independent. This classification can be identified with the broader distinction between anthropocentric and environmentally oriented people. Anthropocentric individuals believe that the landowner should decide, and environmentally oriented individuals believe that the municipality should decide on private greenery [
60]. Not surprisingly, this division did not occur in the “Tree Sceptics” cluster.
Further analysis revealed that the division according to the right to cut down trees is related primarily to adverse attributes associated with trees, such as “Contamination and damage,” “Noise,” and “Danger.” Concerns about these tree features increase from the “Trees First” cluster to the “People First” cluster, with the “Tree Lovers: Trees First” and “Tree Sceptics: People First” groups having extreme opinions on this matter; students in the “Tree Likers: Trees First” cluster attach only slightly numerically less importance to the adverse attributes than students from the “Tree Lovers: People First” and “Tree Likers: People First” clusters. The analysis of individual students’ responses indicates that those who disagree with the free cutting of private trees pay less attention to the harm caused by the trees surrounding them but also appreciate the positives more strongly. However, these differences are less numerically substantial than in the case of the questions regarding willingness to donate time or money to trees. This indicates that there are additional reasons for the different opinions of students regarding the right to cut down private trees.
Finally, gender played a notable role in students’ classification, which was unaffected by their place of growing up. Women are overrepresented in both groups of “Tree Lovers,” especially among those who oppose the idea of individuals having the right to cut down private trees. Conversely, men dominate groups of “Tree Sceptics” and “Tree Likers,” except for the largest cluster, “Tree Likers: Trees First,” where the gender distribution matches that of the overall sample of students.
5. Conclusions
In conclusion, the study results do not provide a clear answer regarding Polish Generation Z students’ opinions and the future sustainability of urban greenery. As far as the development of urban greenery is concerned, the worst news is that only 8% of respondents belong to a tree-oriented “Tree Lovers: Trees First” subgroup. Still, the results show a high potential hidden in Generation Z students towards pro-environmental behaviors, as, similarly, only 8% of the sample belongs to the “Tree Sceptics: People First” subgroup. The rest of the students have a more mediocre attitude towards urban trees. Activation of these young people certainly requires proper educational policy. Young people have access to various initiatives by ecological organizations and the city, but they must be regular and strongly advertised, for instance, through social media. As students have limited income, the priority should be given to voluntary tree-planting actions and similar. Such actions may start in primary school, when young people should learn about the beauty and worth of their local nature.
As more than half of the surveyed students think that everyone should have the right to fell trees on their property, we suggest that the law should be adequately balanced. It must be transparent and prompt, and decisions regarding refusal to cut down private trees must be well and clearly justified. The study showed that young Poles highly value their right to self-determination regarding their property, including trees. Therefore, they must not feel that the law unjustifiably prohibits them from doing so. This can lead them to disrespect regulations and strongly resist them.
Limitations and Future Research
The major limitation of the presented study is the selection of survey respondents, limited to students of WULS-SGGW. WULS-SGGW is a Life Sciences University but, as most of contemporary universities, it contains faculties which are not related to Life Sciences. We surveyed students from faculties ranging from Agronomy, Biology and Food Sciences to Economy and Finance and Information Technology. Still, the conclusions of the study cannot be generalized to the entire Generation Z cohort in Poland. Further studies should be carried out on a more representative sample.
The second limitation is related to the focus on the particular cohort. The lack of similar studies conducted in Poland for other age groups does not allow us to determine whether the local Generation Z cohort has a stronger tendency toward environmental awareness or attitudes toward urban trees and tree donation than other generations. Further studies should be carried out on other cohorts.
