The authors would like to make the following corrections to the published paper [
1]. The changes are as follows:
- (1)
The authors would like to replace Emanuele Naboni’s email address:
emanuele.naboni@kaglakademi.dk
With:
emanuele.naboni@kglakademi.dk
- (2)
The authors would like to update Figures 2, 3, 4, 9, 10 and 11 to a higher resolution version; the contents basically remain unchanged.
![Sustainability 17 07237 i002 Sustainability 17 07237 i002]() |
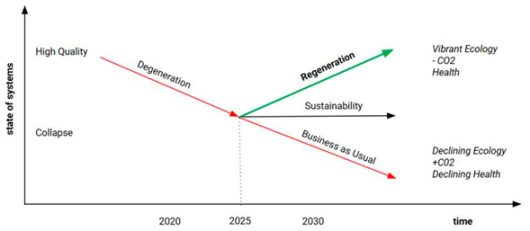
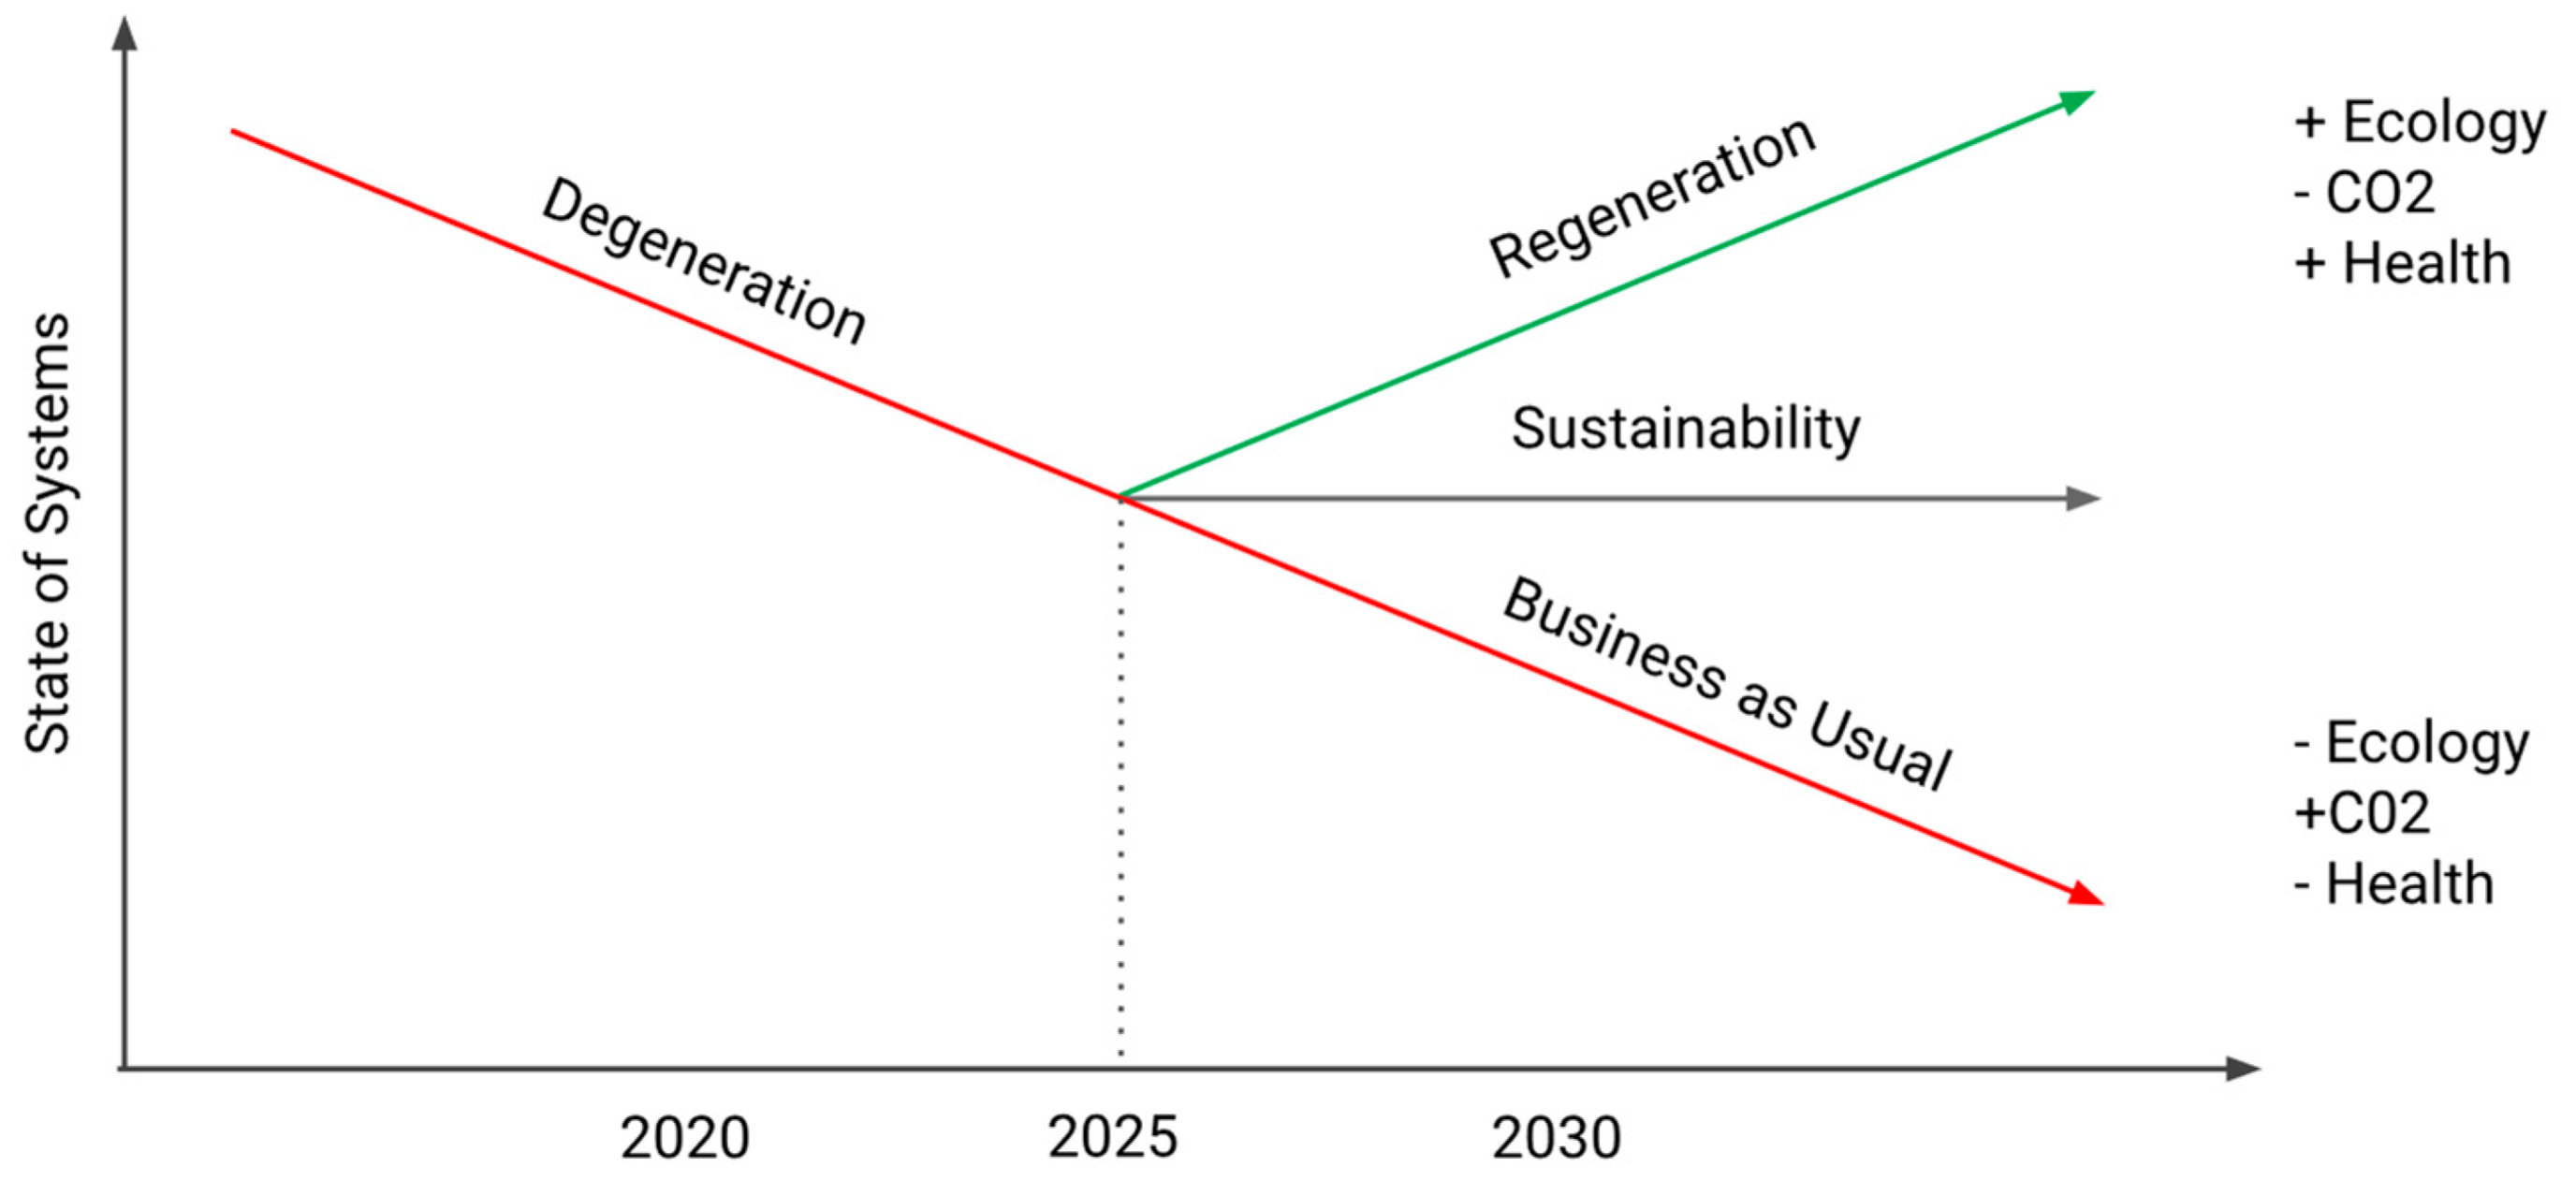
Figure 2. System futures under varying development trajectories. The graph illustrates four possible developmental paths, starting from a common decision point in 2025. Degeneration (dashed red) reflects historical trends leading to systemic decline. Businesses as Usual (solid red) projects continued degradation of ecological, carbon, and health conditions. Sustainability (black) stabilizes systems without reversing existing damage. Regeneration (green) actively improves ecological integrity, reduces CO2 emissions, and enhances public health. The transition year marks a pivotal moment to choose between continued collapse and long-term systemic improvement. (Credit: Emanuele Naboni).
|
With:
Figure 2.
System futures under varying development trajectories. The graph illustrates four possible developmental paths, starting from a common decision point in 2025. Degeneration (dashed red) reflects historical trends leading to systemic decline. Businesses as Usual (solid red) projects continued degradation of ecological, carbon, and health conditions. Sustainability (black) stabilizes systems without reversing existing damage. Regeneration (green) actively improves ecological integrity, reduces CO2 emissions, and enhances public health. The transition year marks a pivotal moment to choose between continued collapse and long-term systemic improvement. (Credit: Emanuele Naboni).
With:
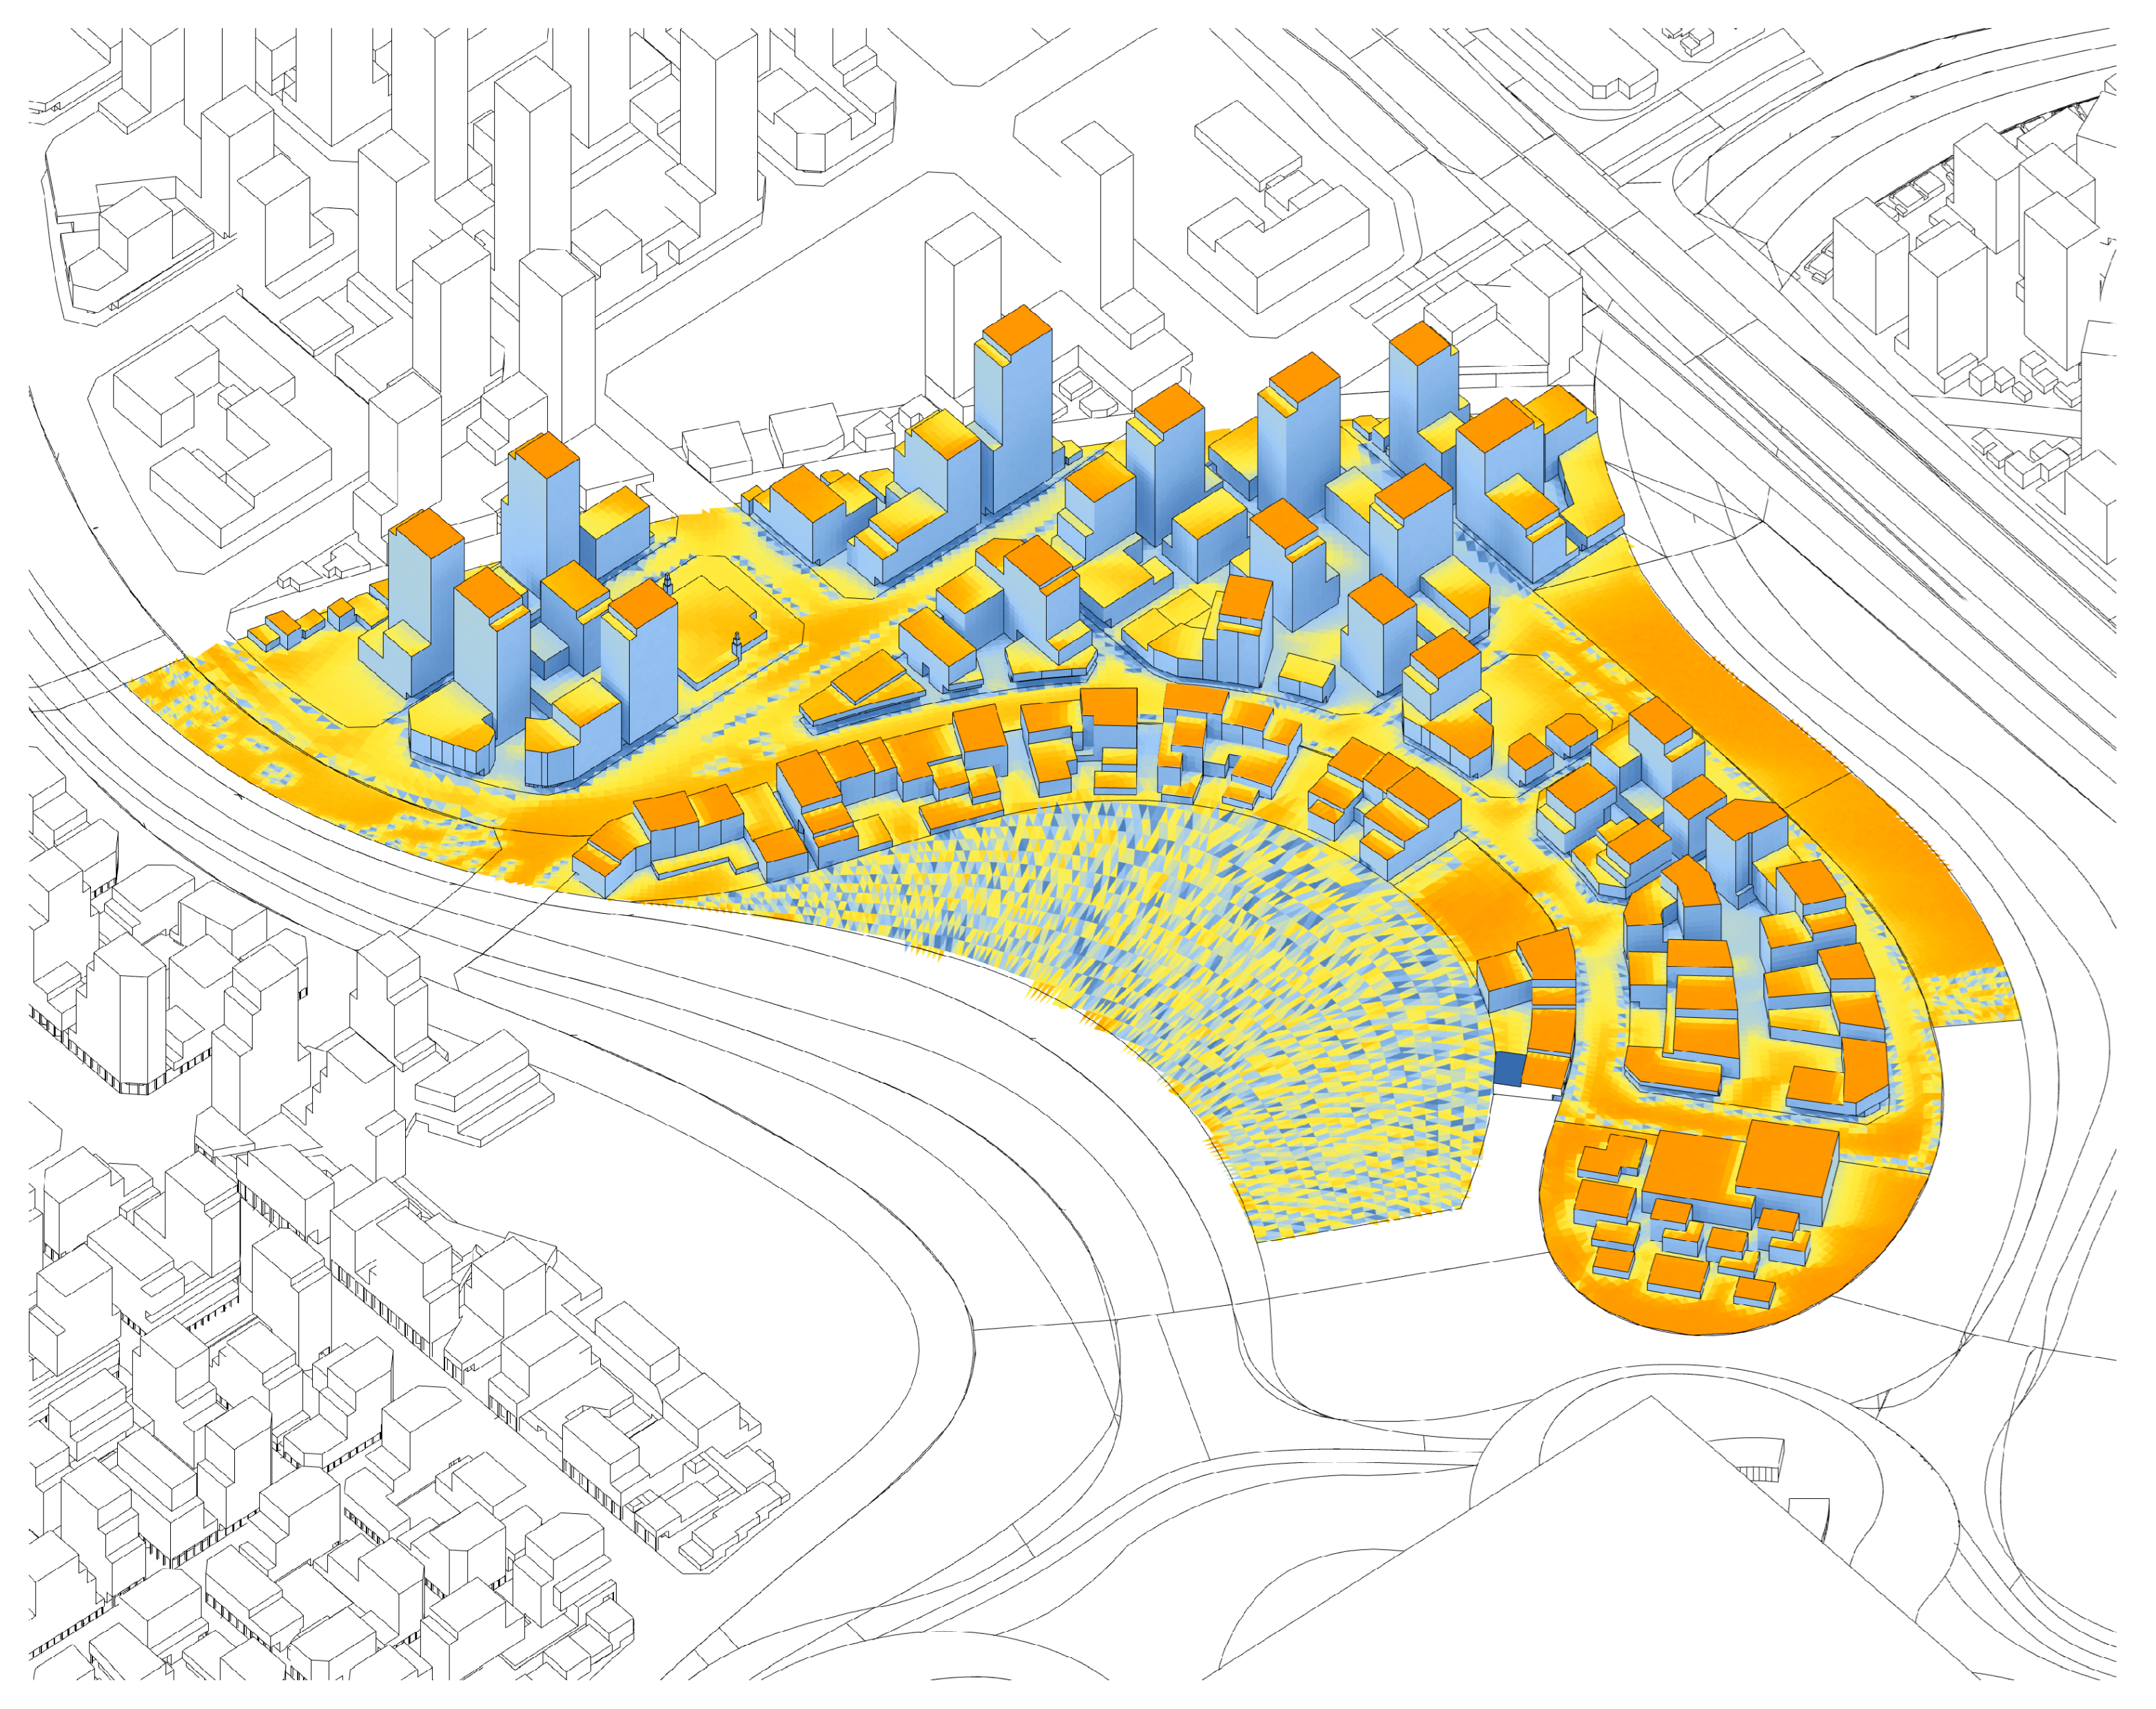
Figure 3.
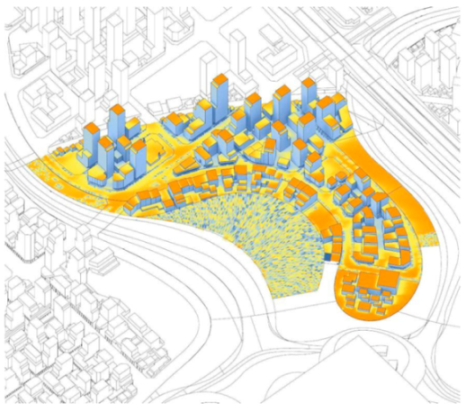
Examples of temperature studies in 2050. This visualization presents a temperature study for the year 2050. The color gradient represents temperature variation, with yellow to orange hues indicating higher surface temperatures. (Credit: Emanuele Naboni).
Figure 3.
Examples of temperature studies in 2050. This visualization presents a temperature study for the year 2050. The color gradient represents temperature variation, with yellow to orange hues indicating higher surface temperatures. (Credit: Emanuele Naboni).
![Sustainability 17 07237 i004 Sustainability 17 07237 i004]() |
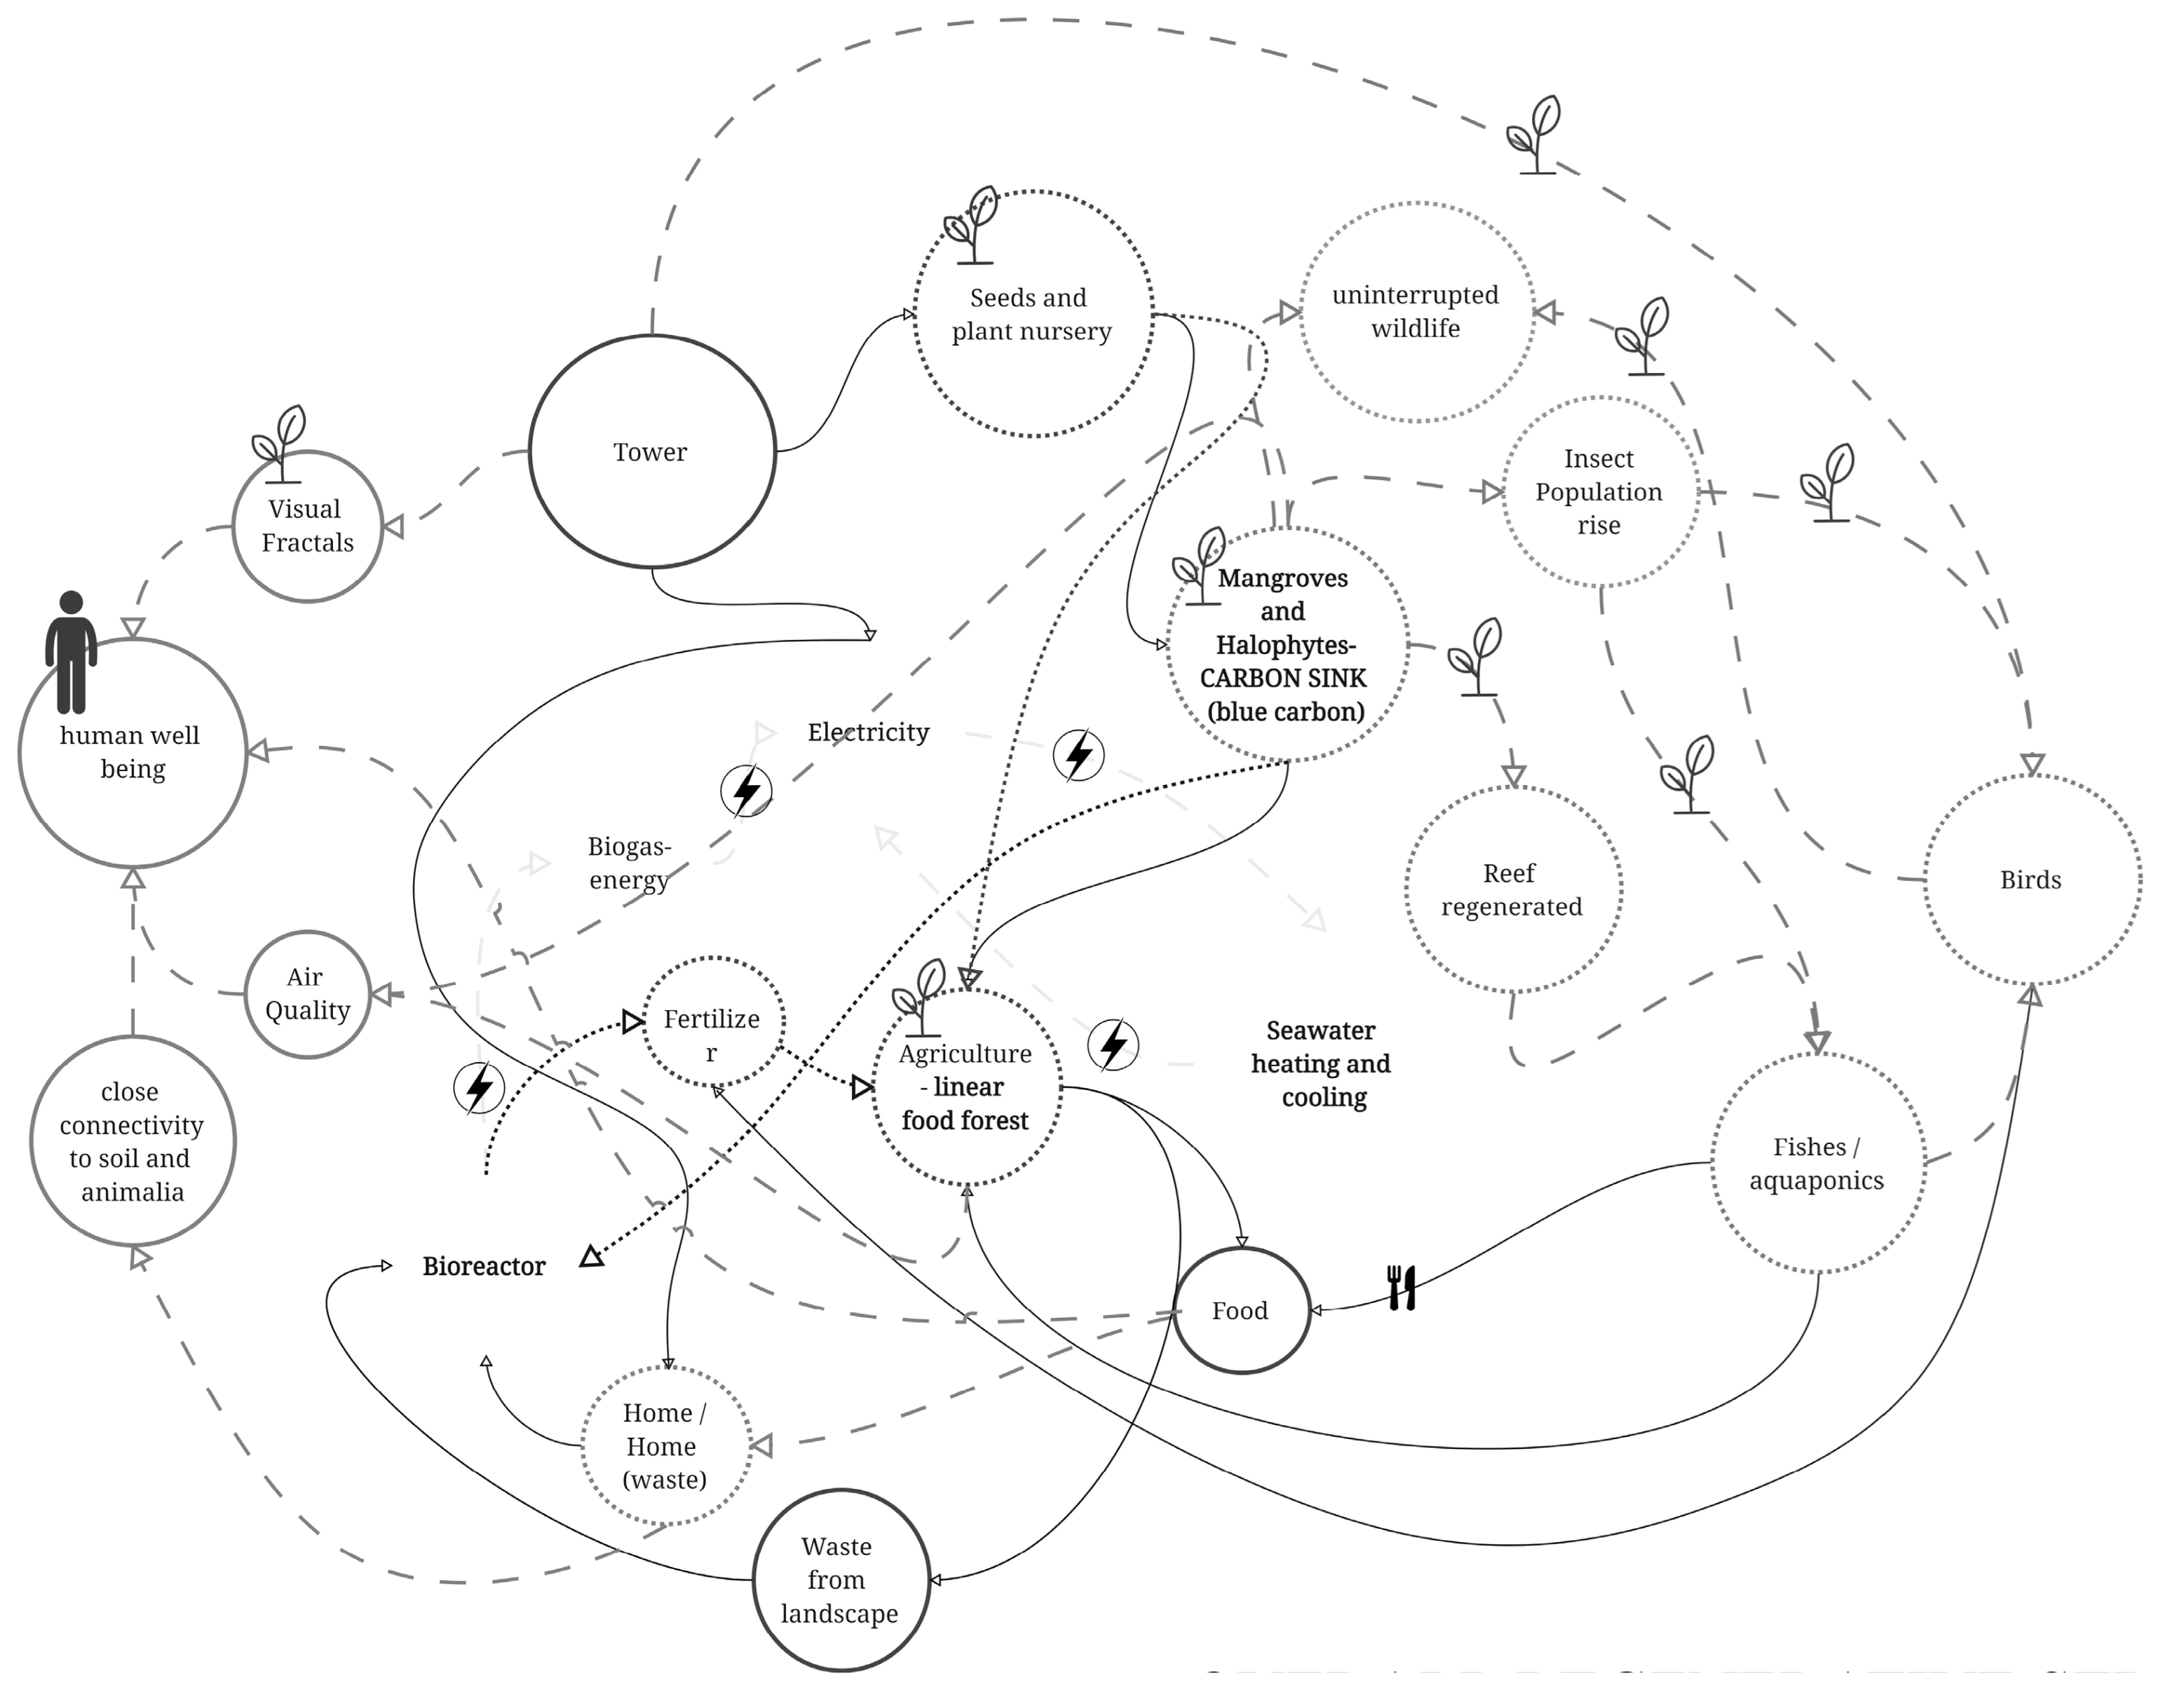
Figure 4. A student systems diagram as interconnected metabolisms, serving as methodological tool for ecological, infrastructural, and human-centered design integration. (Credit: student Leen Tasneem).
|
With:
Figure 4.
A student systems diagram as interconnected metabolisms, serving as methodological tool for ecological, infrastructural, and human-centered design integration. (Credit: student Leen Tasneem).
Figure 4.
A student systems diagram as interconnected metabolisms, serving as methodological tool for ecological, infrastructural, and human-centered design integration. (Credit: student Leen Tasneem).
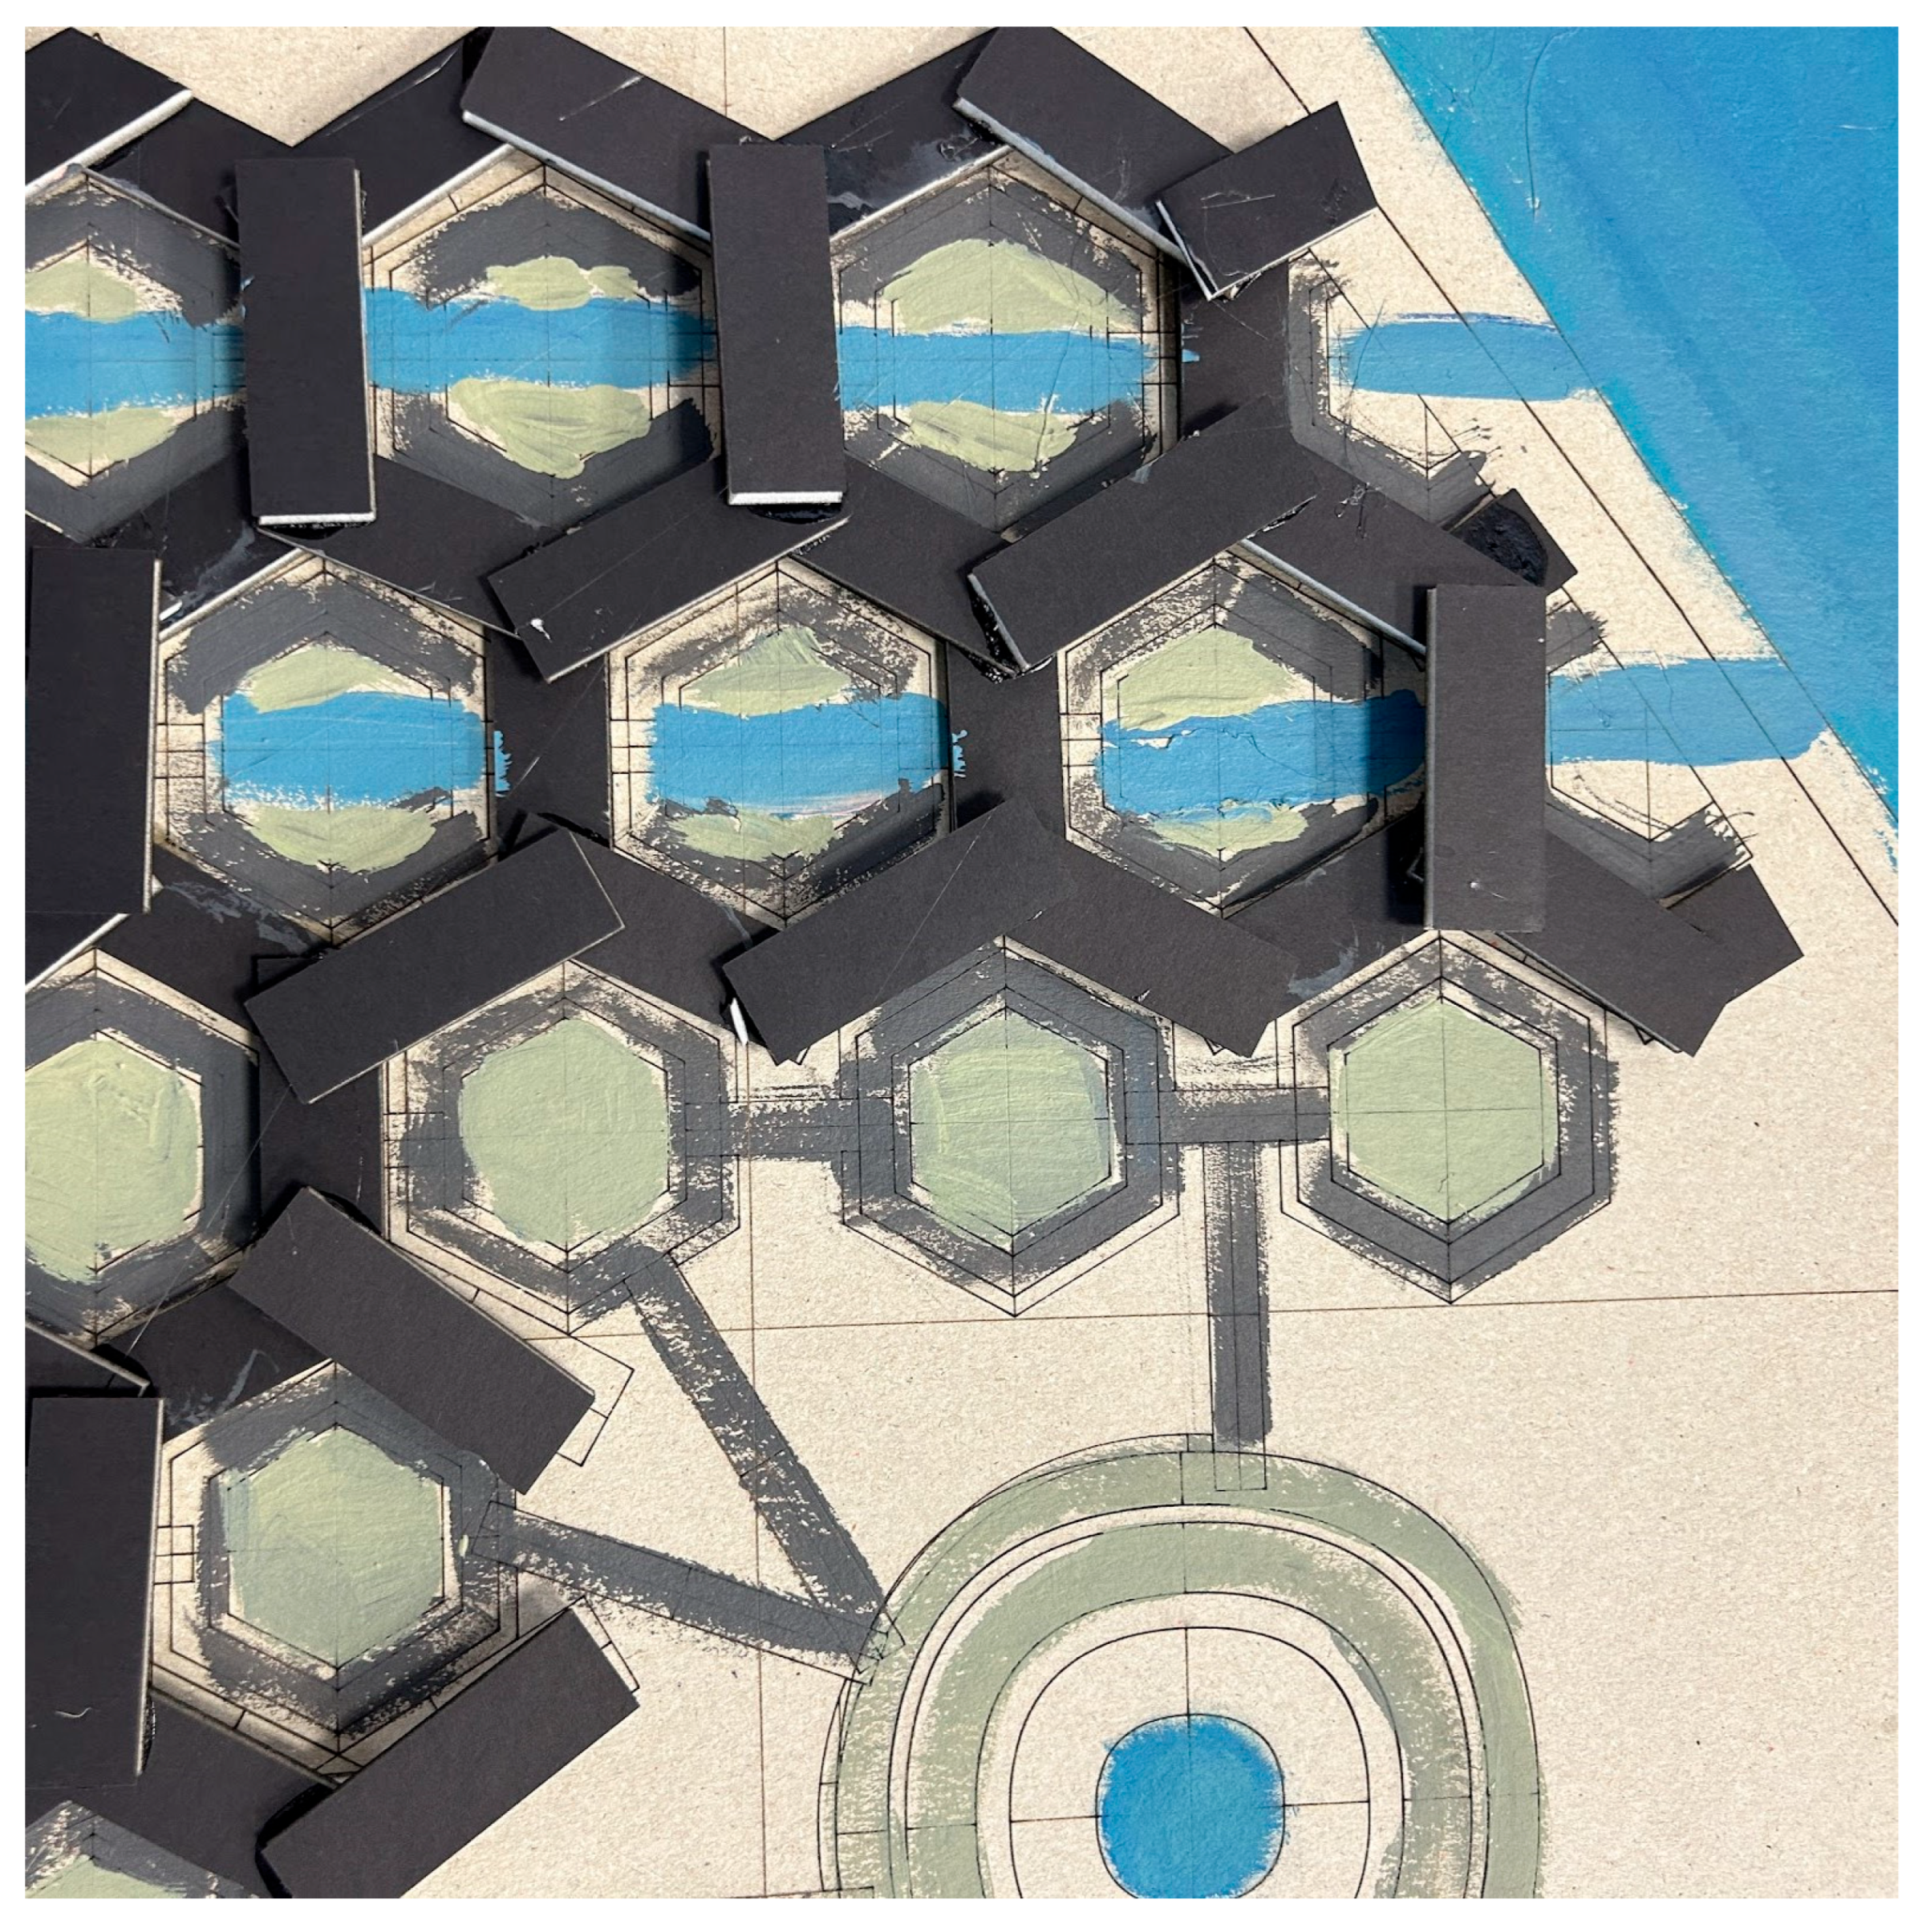
![Sustainability 17 07237 i009 Sustainability 17 07237 i009]() |
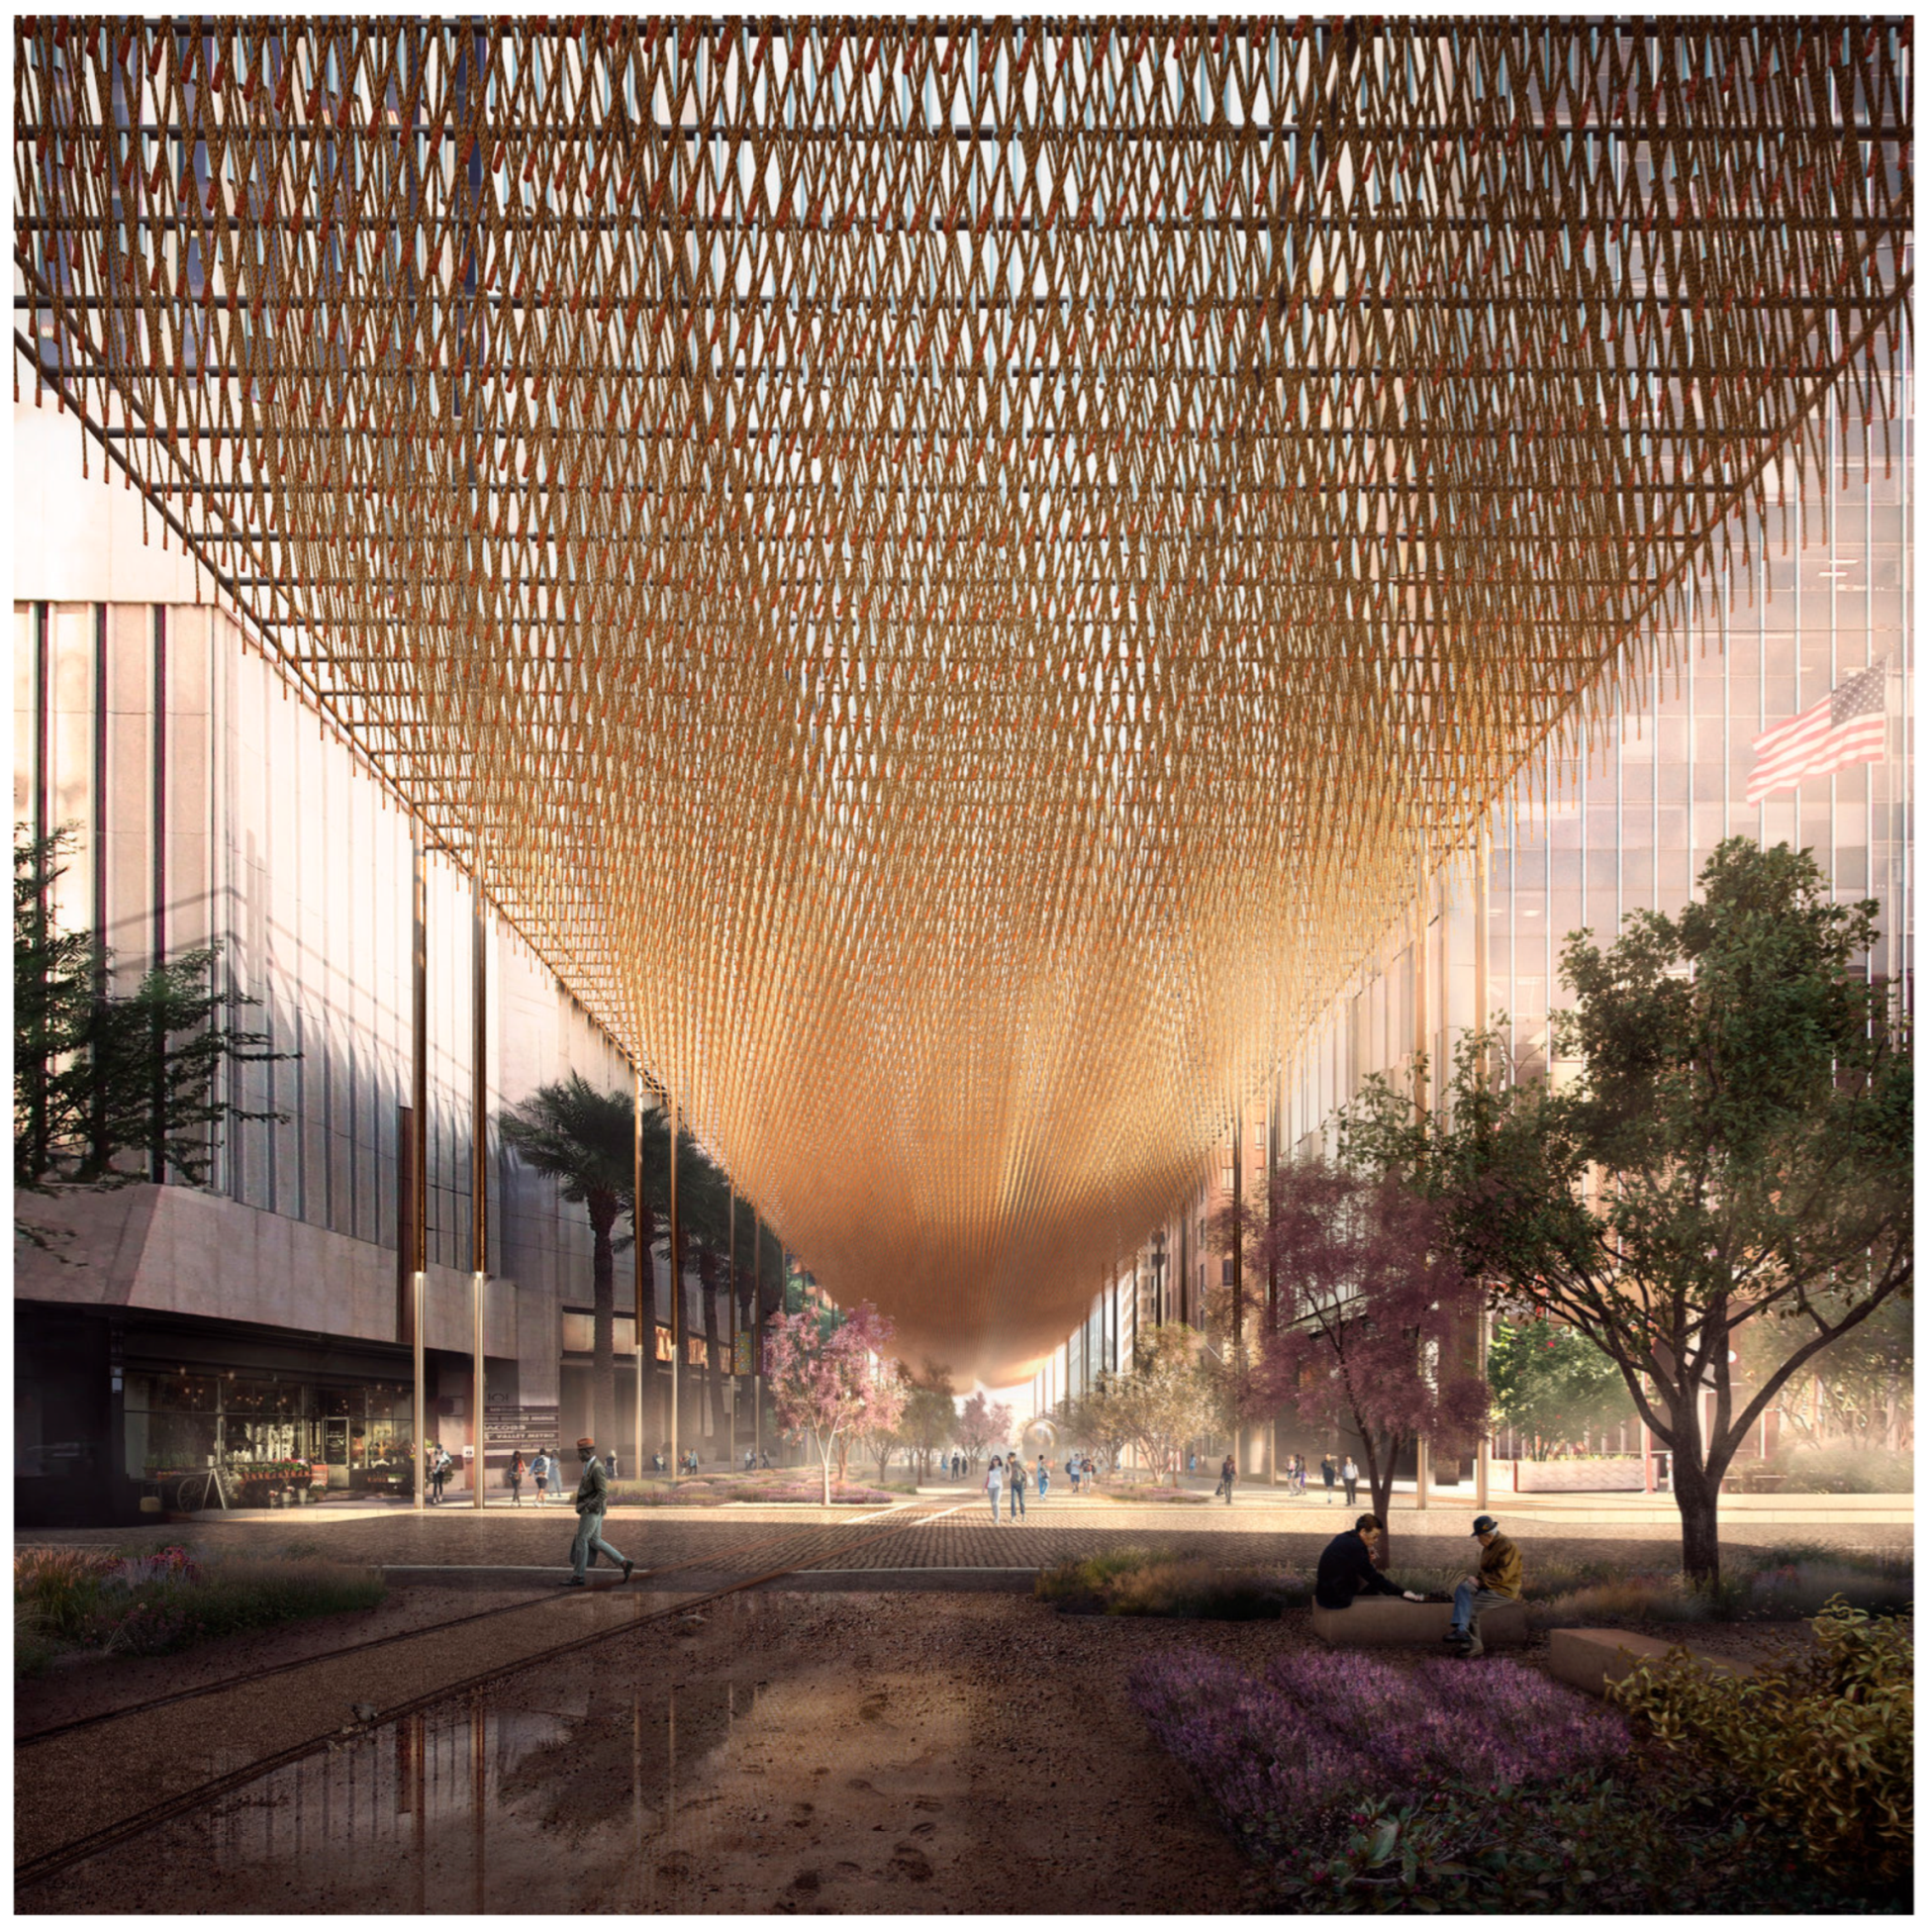
Figure 9. A suspended canopy that attenuates solar radiation, enhances pedestrian thermal comfort along a linear corridor, while simultaneously supporting sub-canopy vegetation and evaporative transpiration. (Credit: Leen Tasneem).
|
With:
Figure 9.
A suspended canopy that attenuates solar radiation, enhances pedestrian thermal comfort along a linear corridor, while simultaneously supporting sub-canopy vegetation and evaporative transpiration. (Credit: Leen Tasneem).
Figure 9.
A suspended canopy that attenuates solar radiation, enhances pedestrian thermal comfort along a linear corridor, while simultaneously supporting sub-canopy vegetation and evaporative transpiration. (Credit: Leen Tasneem).
![Sustainability 17 07237 i010 Sustainability 17 07237 i010]() |
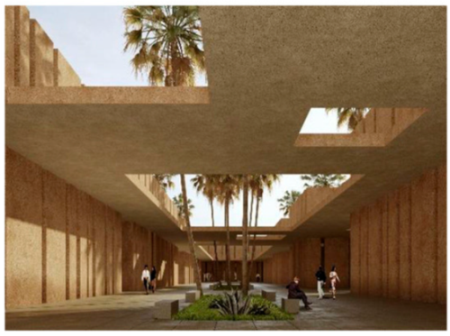
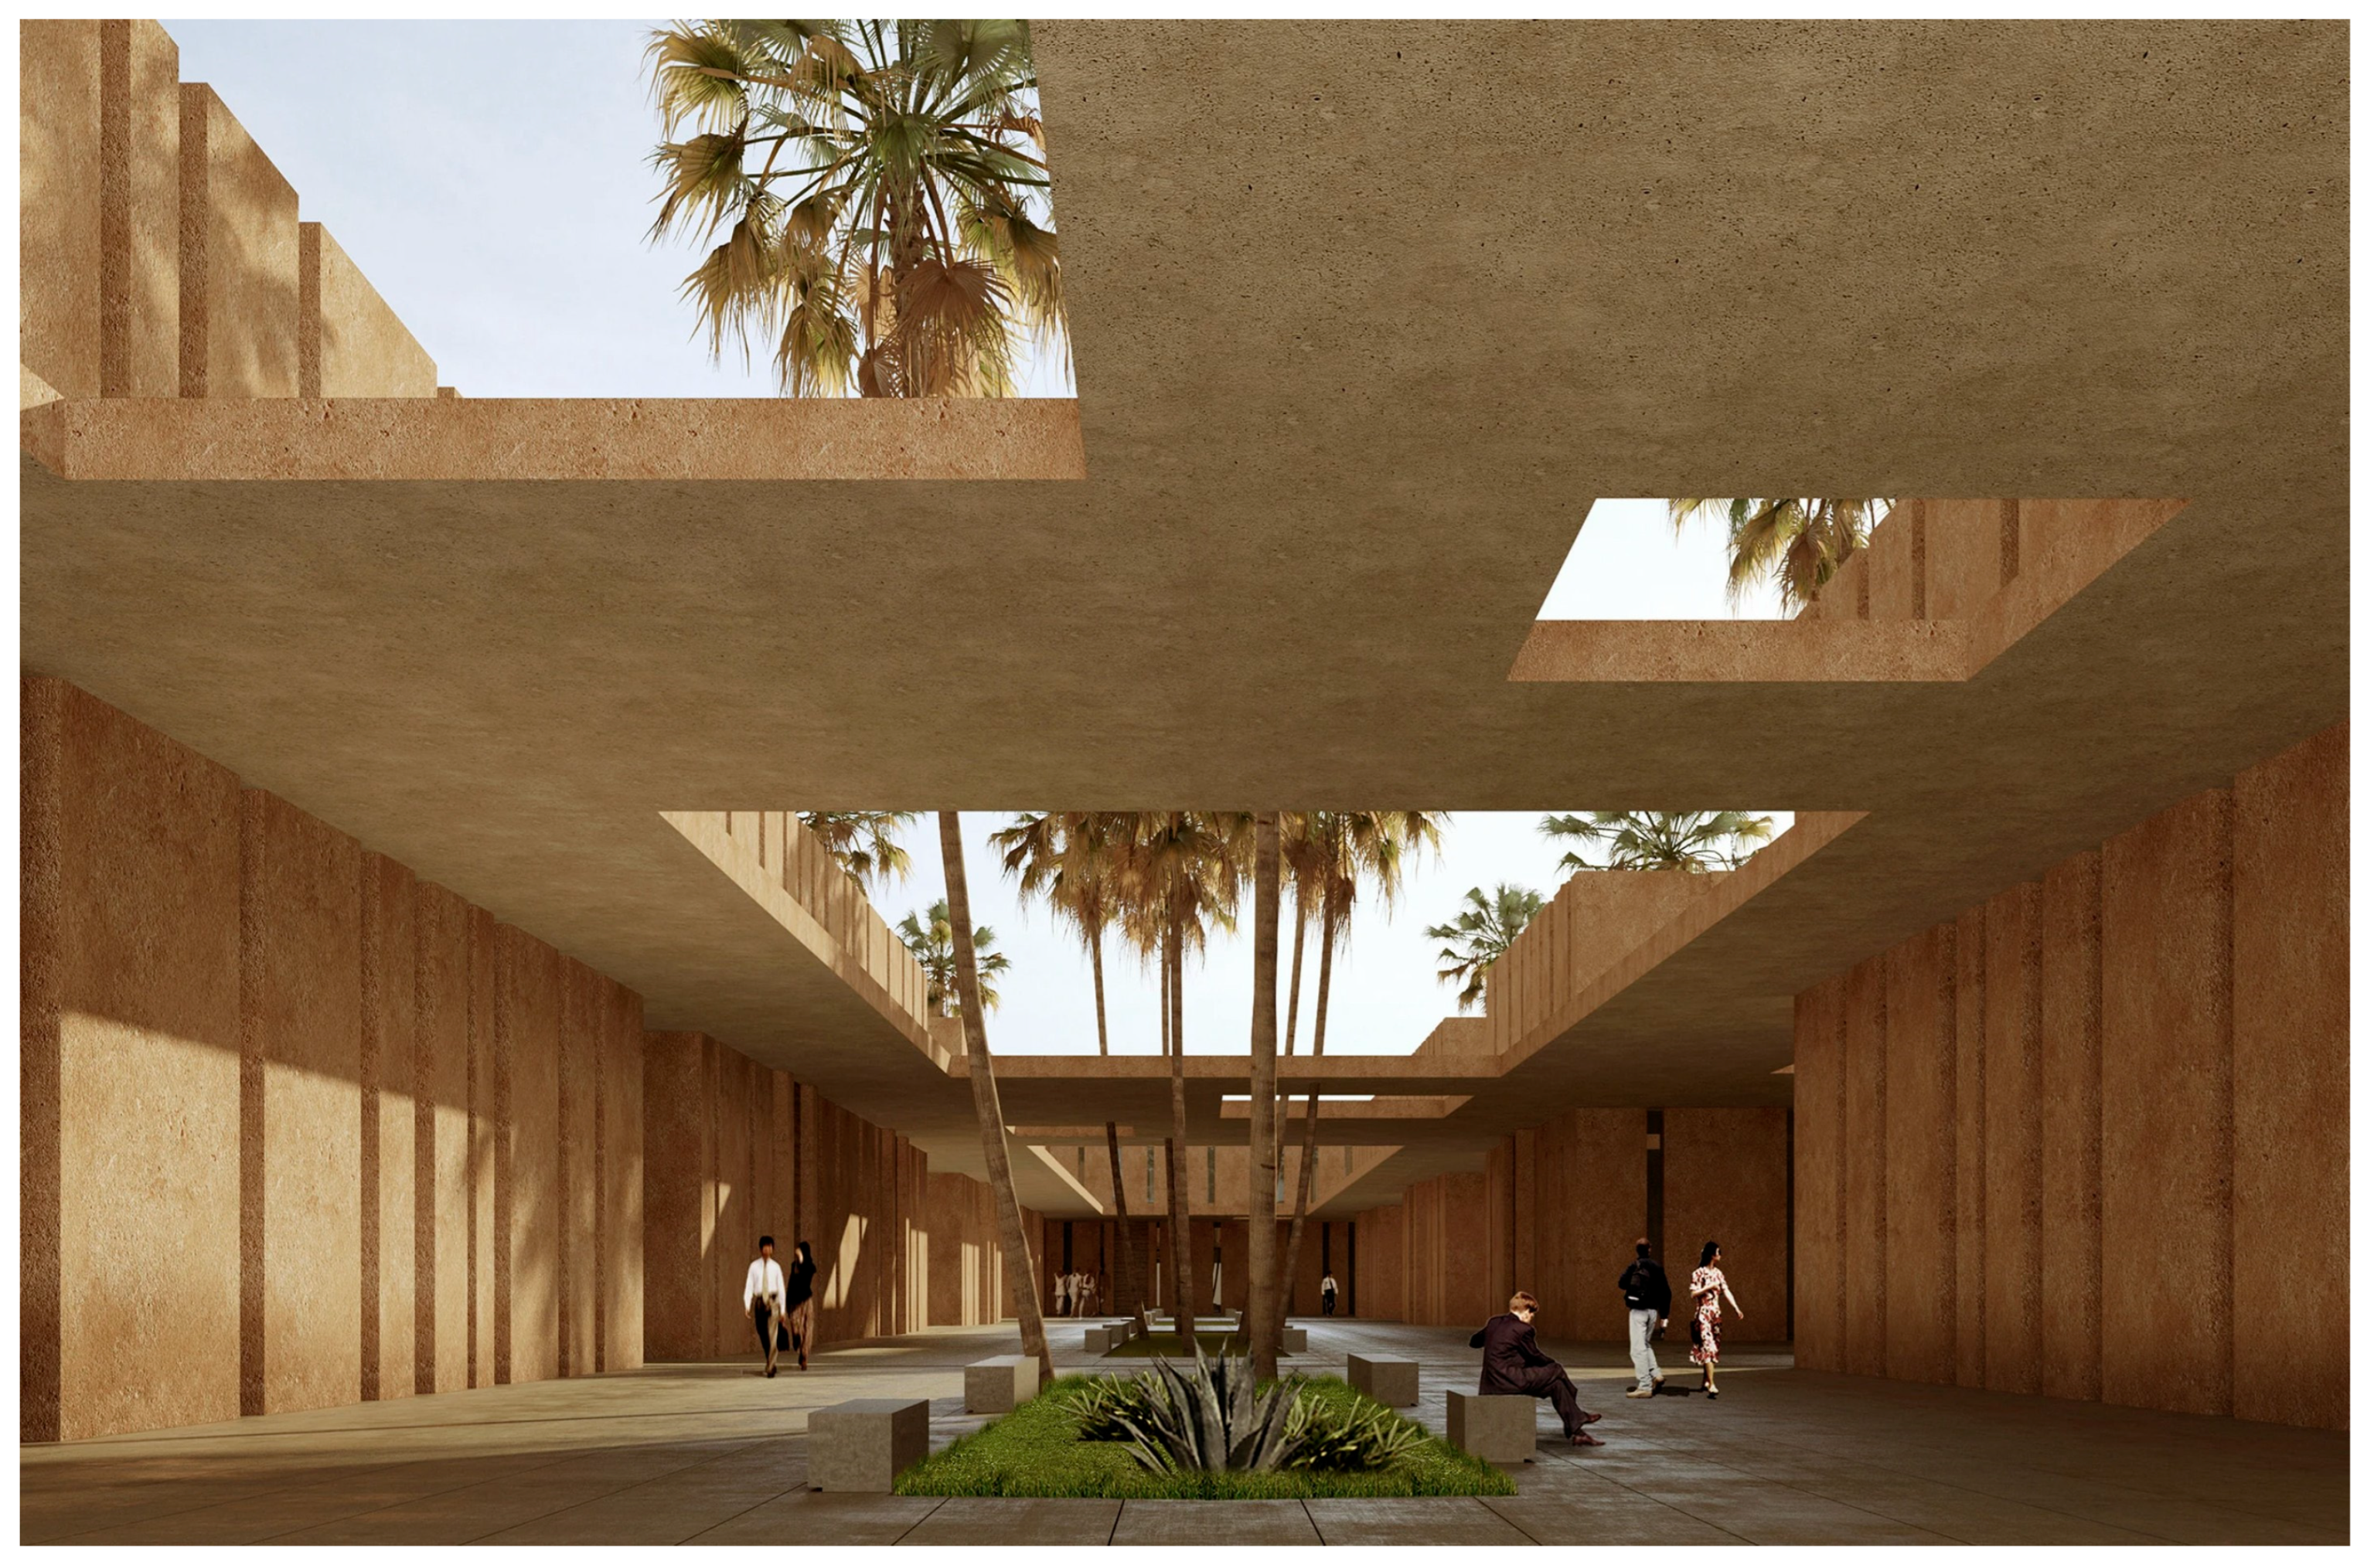
Figure 10. A courtyard-based, low-carbon architectural form, characterized by deep cantilevered roofs and integrated soil–vegetation systems. This typology generates localized humidity, reduces surface temperatures, and establishes multispecies microclimates functioning as regenerative sanctuaries for humans, insects, and avifauna. (Credit: student Camilia Yaghi).
|
With:
Figure 10.
A courtyard-based, low-carbon architectural form, characterized by deep cantilevered roofs and integrated soil–vegetation systems. This typology generates localized humidity, reduces surface temperatures, and establishes multispecies microclimates functioning as regenerative sanctuaries for humans, insects, and avifauna. (Credit: student Camilia Yaghi).
![Sustainability 17 07237 i011 Sustainability 17 07237 i011]() |
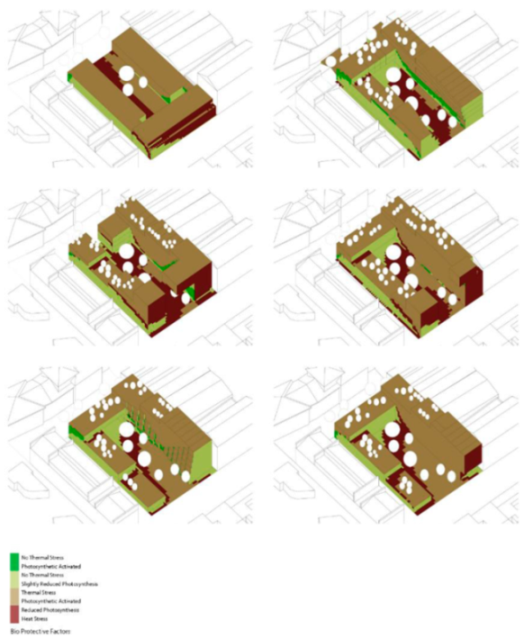
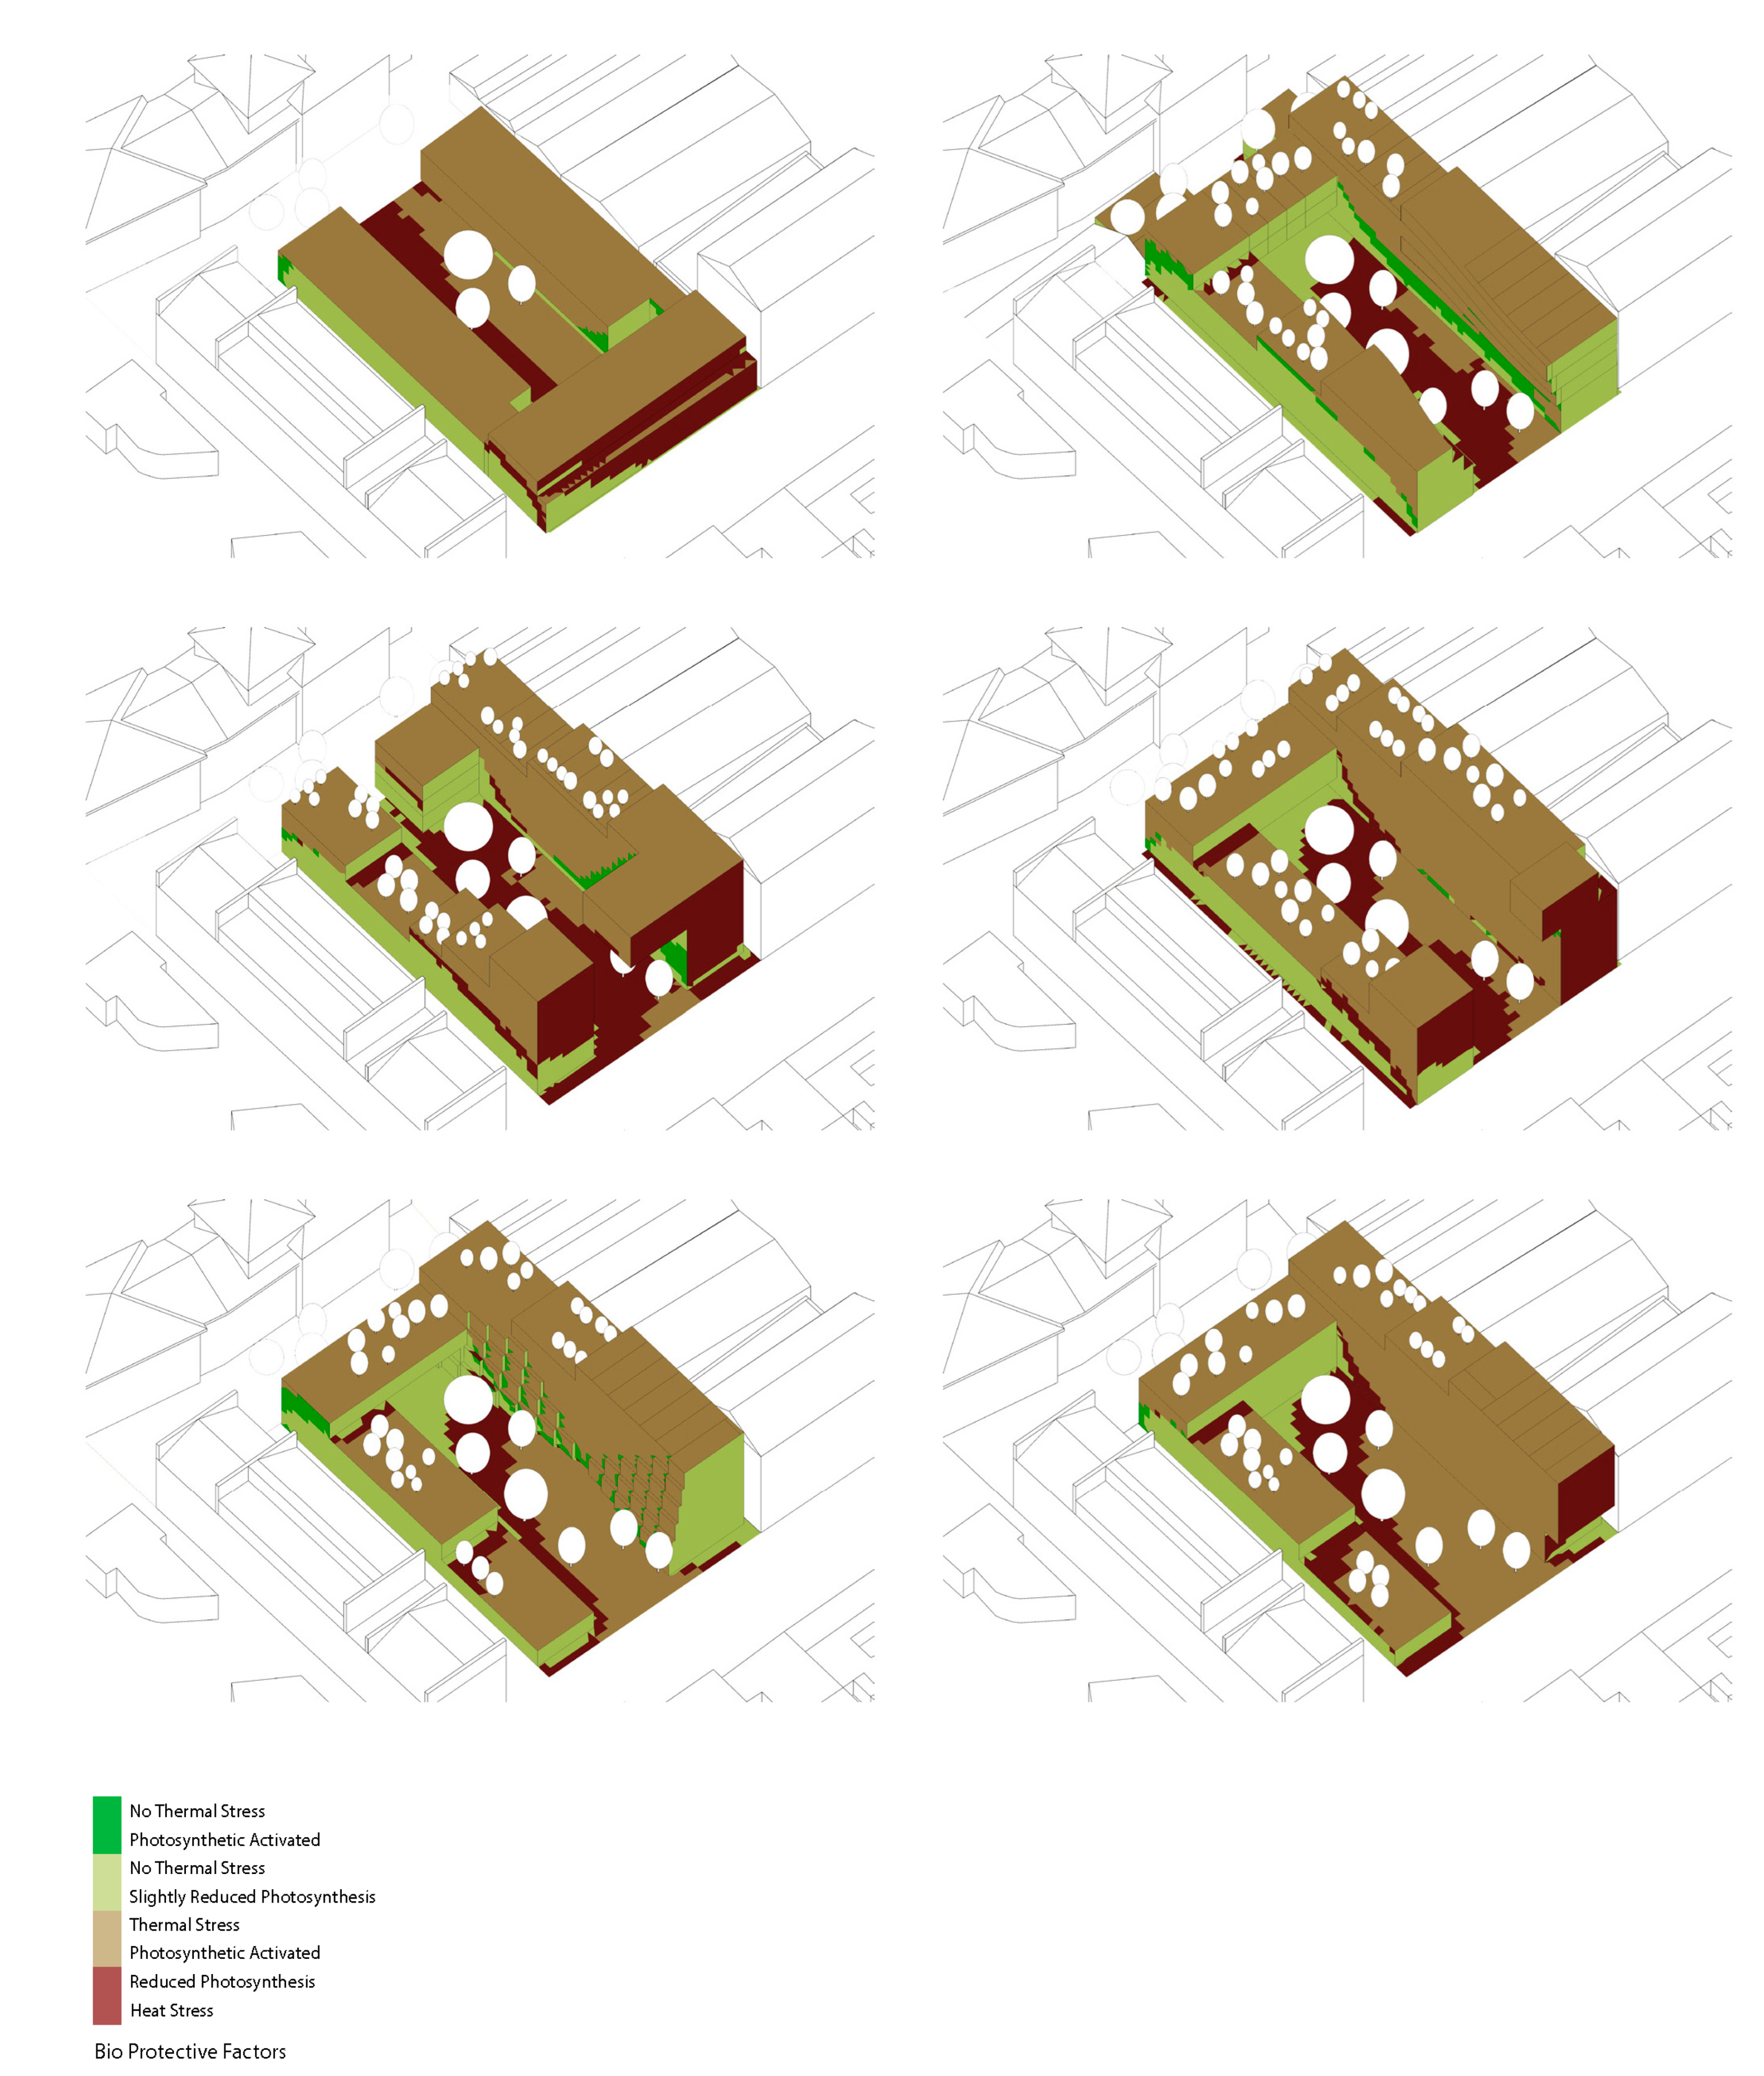
Figure 11. Illustrates the massing performances, with green areas denoting optimal zones for vegetation. These zones have been identified through ecological analysis utilizing Grasshopper algorithms, which assess temperature, solar exposure, and moisture retention. (Credit: Emanuele Naboni).
|
With:
Figure 11.
Illustrates the massing performances, with green areas denoting optimal zones for vegetation. These zones have been identified through ecological analysis utilizing Grasshopper algorithms, which assess temperature, solar exposure, and moisture retention. (Credit: Emanuele Naboni).
Figure 11.
Illustrates the massing performances, with green areas denoting optimal zones for vegetation. These zones have been identified through ecological analysis utilizing Grasshopper algorithms, which assess temperature, solar exposure, and moisture retention. (Credit: Emanuele Naboni).
- (3)
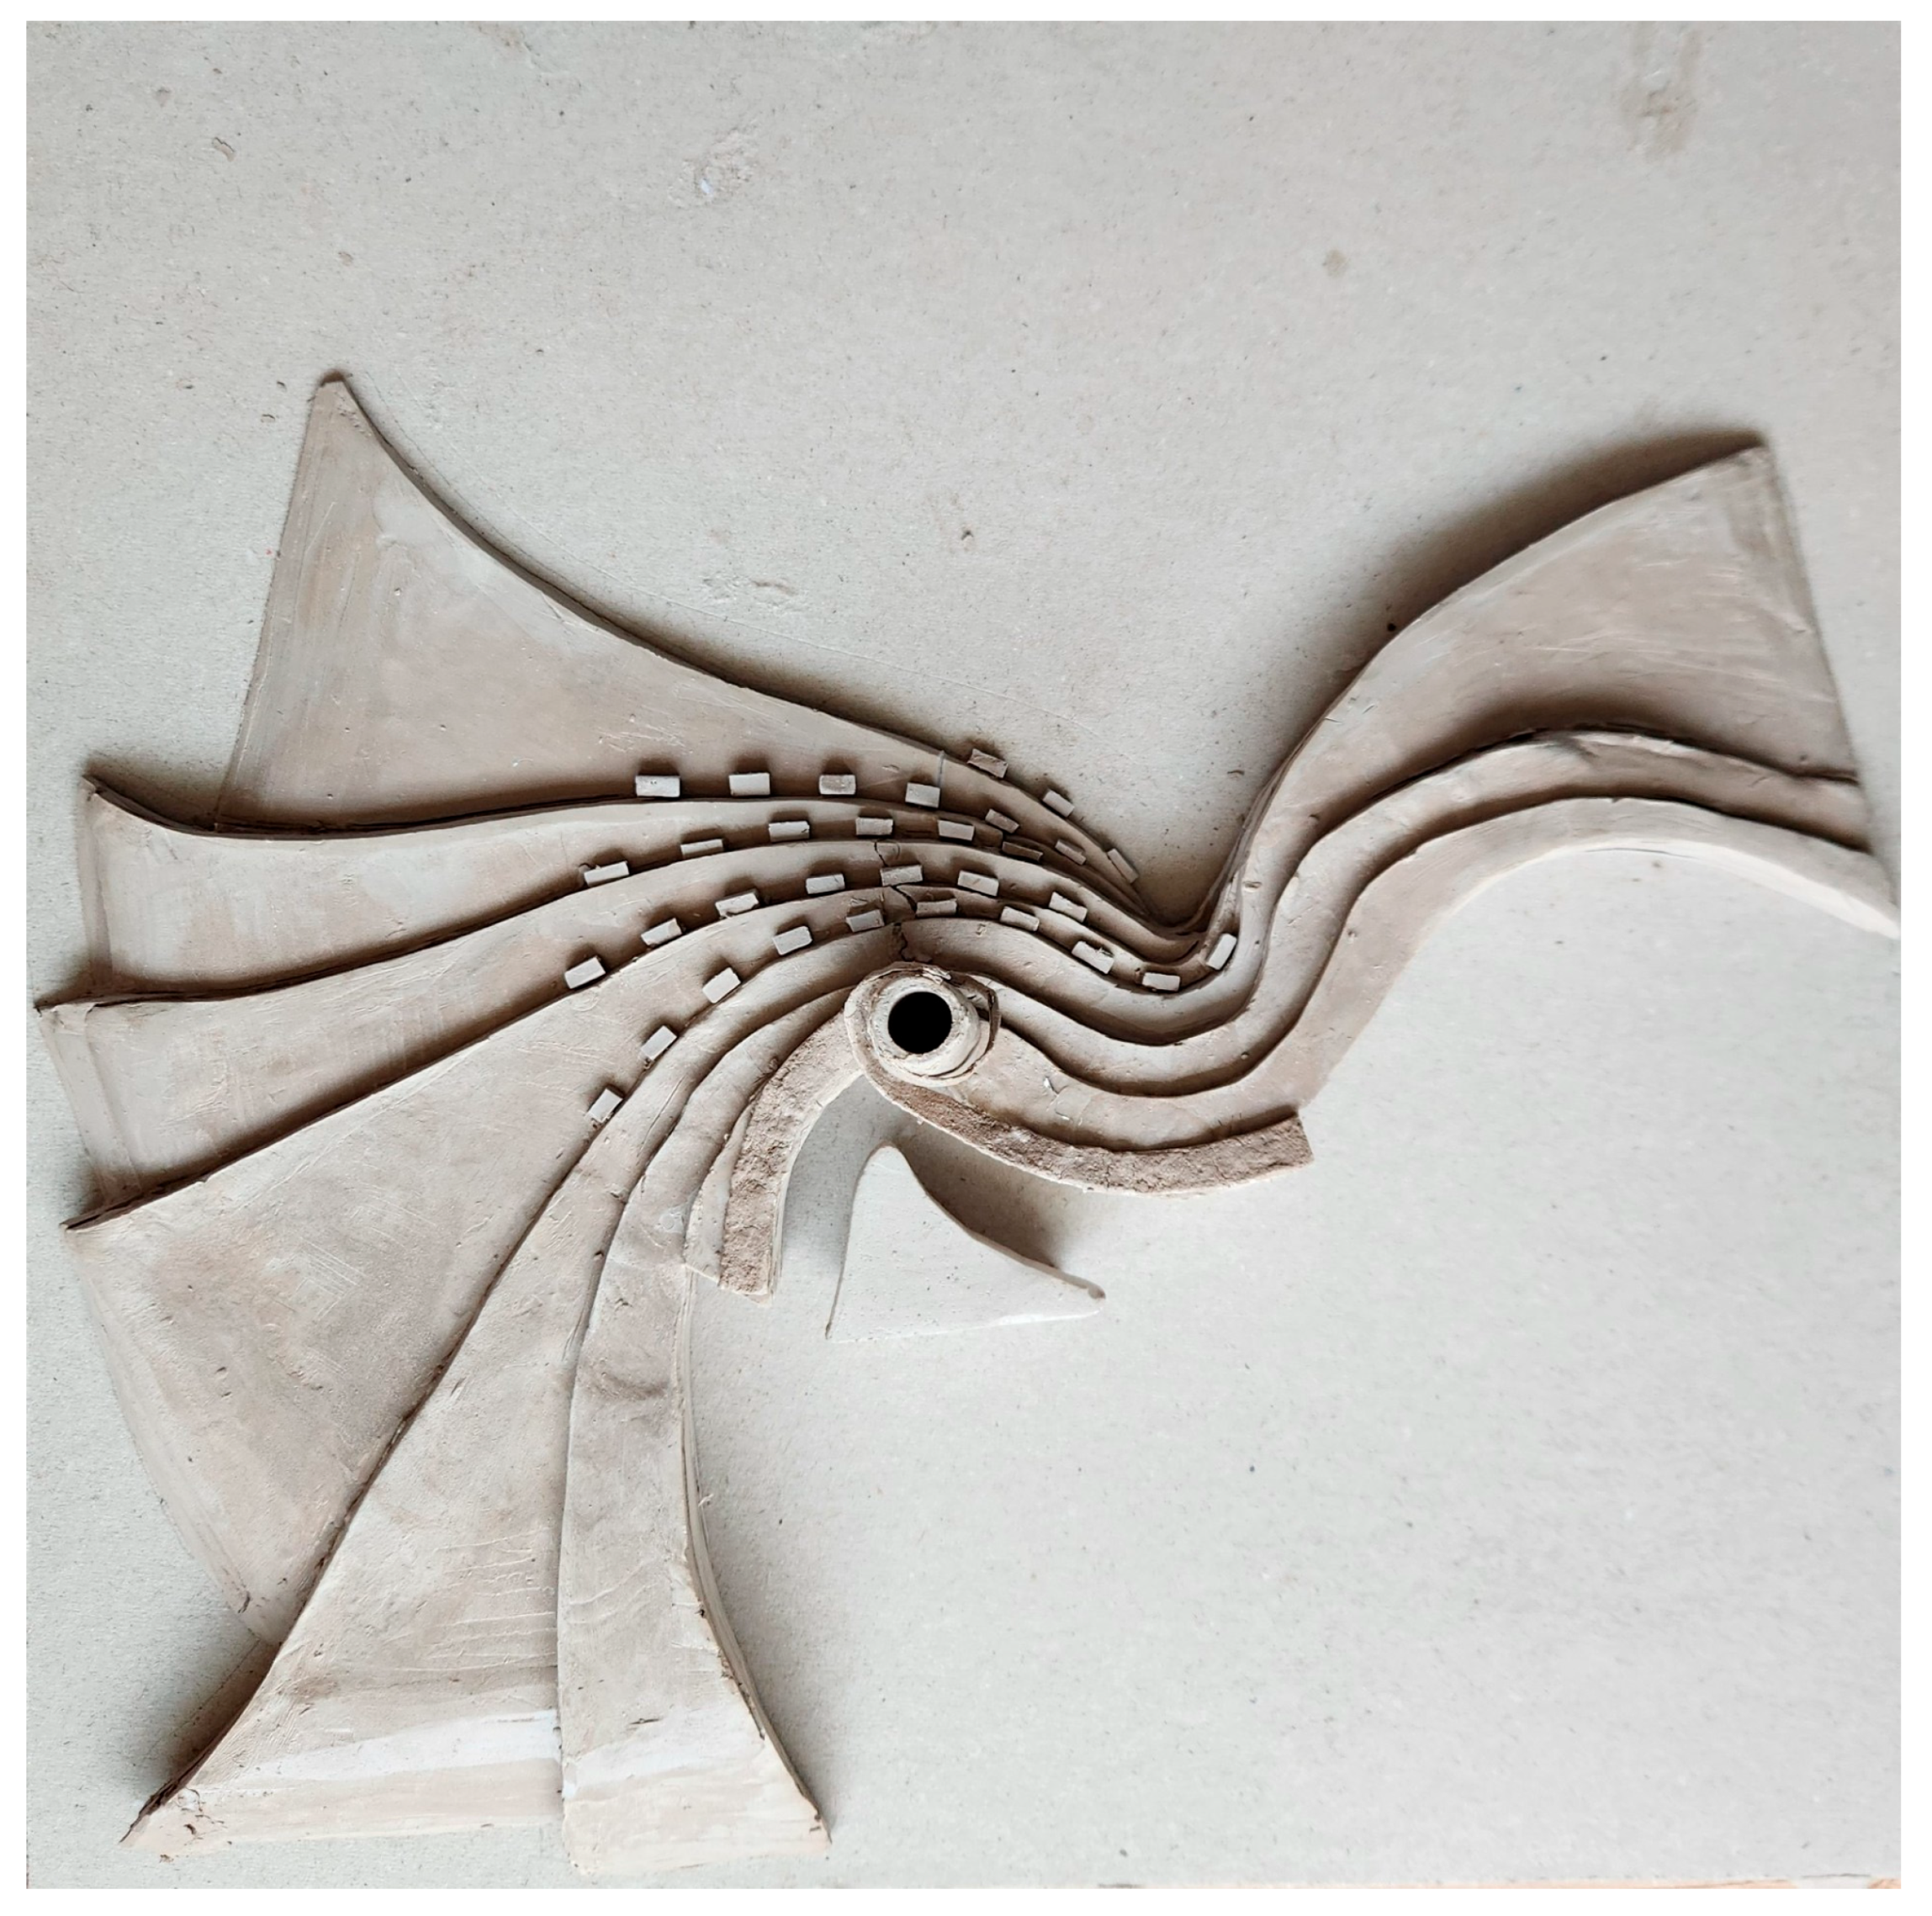
The authors would like to update Figures 6 and 7 to a higher resolution version and change the contents. These changes were essential to ensure the legibility of complex linework and graphical elements, which were compromised in the previously published lower-resolution versions. The revised figures maintain the same conceptual content but require adjustments in visual composition and formatting during the vector-to-raster export process to accurately convey the intended message:
With:
Figure 6.
Examples of regenerative massing. (Credit: student Leen Tasneem).
Figure 6.
Examples of regenerative massing. (Credit: student Leen Tasneem).
With:
Figure 7.
Examples of regenerative massing. (Credit: student Habiba Ahmed).
Figure 7.
Examples of regenerative massing. (Credit: student Habiba Ahmed).
The authors state that the scientific conclusions are unaffected. This correction was approved by the Academic Editor. The original publication has also been updated.
