Article

Real-Time Scanning Curve of Soil–Water Characteristic Curve for Sustainability of Residual Soil Slopes

by
Abdulroqeeb Mofeyisope Daramola
1,
Alfrendo Satyanaga
1,*,
Babatunde David Adejumo
1,
Yongmin Kim
2,*,
Zhai Qian
3 and
Jong Kim
1
1
Department of Civil and Environmental Engineering, Nazarbayev University, 53 Kabanbay Batyr Ave, Astana 010000, Kazakhstan
2
James Watt School of Engineering, University of Glasgow, Glasgow G12 8QQ, UK
3
School of Civil Engineering, Southeast University, Nanjing 211189, China
*
Authors to whom correspondence should be addressed.
Sustainability 2025, 17(5), 1803; https://doi.org/10.3390/su17051803
Submission received: 2 January 2025 / Revised: 7 February 2025 / Accepted: 17 February 2025 / Published: 20 February 2025
(This article belongs to the Special Issue Disaster Prevention, Resilience and Sustainable Management)

Abstract

:
The scanning curve of the soil–water characteristic curve (SWCC) represents the intermediate paths followed by soil as it transitions between the initial drying and main wetting cycles. The alternating occurrence of climatic conditions, such as rainfall and evaporation in different regions globally, provides a valuable framework for understanding how these dynamics influence the scanning curve. Monitoring the scanning curve can provide valuable insights for managing water resources and mitigating the impacts of drought, contributing to environmental sustainability by enabling more precise agricultural practices, promoting water conservation, and supporting the resilience of ecosystems in the face of climate change. It enhances sustainability by enabling data-driven designs that minimize resource use, reduce environmental impact, and increase the resilience of slopes to natural hazards like landslides and flooding. Available studies to determine the scanning curve of SWCC are limited and mostly conducted in the laboratory. This study aims to determine the real-time measurement of the scanning curve of SWCC for unsaturated soil. The research focuses on assessing the hysteresis behavior of residual soil slope from old alluvium through a combination of field instrumentation and laboratory testing. The pore size distribution was derived from the initial drying and main wetting SWCC. Field monitoring (scanning curve) indicates measurable deviations from the experimental results, including a 10% lower saturated water content and a 25% lower air-entry value. This study demonstrates the potential for field-based determination of scanning curves. It highlights their role in improving the prediction of the hydraulic behavior of residual slopes during varying climatic conditions.

1. Introduction

Urban migration and population growth significantly influence factors contributing to global warming. An increasing population drives greater resource demand, including high consumption, deforestation, and environmental degradation. These activities substantially increase carbon emissions, accelerating climate change [1,2]. The impacts of these climatic shifts are evident in many regions, with intense rainfall and evaporation (prolonged periods of elevated temperatures becoming more frequent) degrading urban sustainability [3]. Both are critical triggers for natural hazards such as landslides. Excessive and continuous rainfall saturates the soil, reducing its shear strength and increasing the likelihood of slope failures [4,5,6,7,8,9]. Similarly, rising temperatures expedite snowmelt, further destabilizing soil structures and exacerbating slope failures [10,11,12]. Addressing these challenges requires integrating advanced engineering solutions and environmentally conscious policies to improve slope stability and enhance resilience against climate-induced hazards [13]. These measures are essential to promote sustainable practices that foster urban development while preserving the environment, ensuring slope safety and long-term stability in urban areas.
Most slope failures occur in the unsaturated soil zone above the groundwater table due to excessive rainfall, which causes the soil to lose its shear strength [14]. Understanding the hydraulic and mechanical behavior of the soil in this zone is necessary for slope assessment. The soil–water characteristic curve (SWCC) is one of the most important hydraulic properties that can be used to estimate other soil parameters, such as pore size distribution and the permeability function of the soil [15,16]. The SWCC defines a sigmoidal relationship between the soil water content and the soil suction (ua − uw) in a semi-logarithmic plot [17,18]. The soil water content is the amount of water within the pores of the soil; the higher the amount of water within this pore, the lower the soil suction and vice versa. The soil water content is either expressed as gravimetric water content (w-SWCC), volumetric water content (ϴ-SWCC), or degree of saturation (S-SWCC) [19,20]. In the field, soil water content is measured directly only in the form of volumetric water content using either time-domain reflectometry or frequency-domain reflectometry sensors [21,22]. Similarly, soil suction is measured using tensiometers. These tensiometers are usually embedded with pressure transducers that provide readings in real time.
Several studies have used the drying SWCC to determine the stability of slopes; however, these studies have shown that this approach is conservative since the SWCC exhibits hysteretic behavior [23,24]. The hysteretic behavior implies that, at the same suction, the soil will have less water content during the wetting cycle than during the drying cycle. This can be explained using the “entrapped air” phenomenon. During the drying cycle, the water inside the soil pores evaporates and is replaced with air, creating stronger capillary forces within the soil. These capillary forces hold the water tightly in the soil, leading to higher soil suction. The wetting cycle creates non-uniformity in the soil pores; air becomes trapped in some soil pores and prevents the soil from achieving the same moisture level as during the drying cycle. The hysteretic behavior is attributed to four main factors [20,25]: (i) air entrapment that leads to volume change with increasing or decreasing soil suction; (ii) a lesser contact angle in a receding meniscus than in an advancing meniscus; (iii) variation in the shape of the void path, or the “ink bottle effect”; and (iv) thixotropic effects influenced by the soil’s history of wetting and drying cycles.
In the field, the variation of rainfall and evaporation creates multiple paths of drying and wetting SWCC cycles. In most cases, when rainfall occurs, the soil absorbs water without becoming saturated before the onset of evaporation. This results in partial wetting cycles followed by drying cycles known as “scanning curves’’. The scanning curve represents the dynamic response of the soil as it loses and regains water content. Limited studies have investigated the derivation of the scanning curve of SWCC using a combination of laboratory experiments and field instrumentation in slope analysis. For instance, Li et al. [26] compared the field and laboratory SWCC of a decomposed granite in a cut slope with the assumption that the drying and wetting field SWCC aligns only with the laboratory wetting SWCC. However, this may not be the case due to the hysteretic nature of the SWCC under varying climatic conditions. Hedayati et al. [27] revealed the hysteresis behavior between field instrumentation and laboratory measurements of SWCCs. Although the volumetric water content of the drying and wetting field SWCCs was normalized to the form of degree of saturation, this poses significant challenges as it fails to capture the absolute water content level of the soil in real time. Furthermore, these studies neglect the initial drying and main wetting SWCCs that are needed to establish the initial condition during seepage and slope stability numerical analysis. Therefore, this study aims to determine the hysteresis behavior and scanning curve of the SWCC through real-time field monitoring and laboratory testing. The scope of work includes a six-month assessment of the SWCC behavior of a residual slope in Singapore by installing field monitoring equipment such as piezometers, tensiometers, and capacitance moisture sensors. The field monitoring results are combined with experimental data to assess the differences in the SWCC.

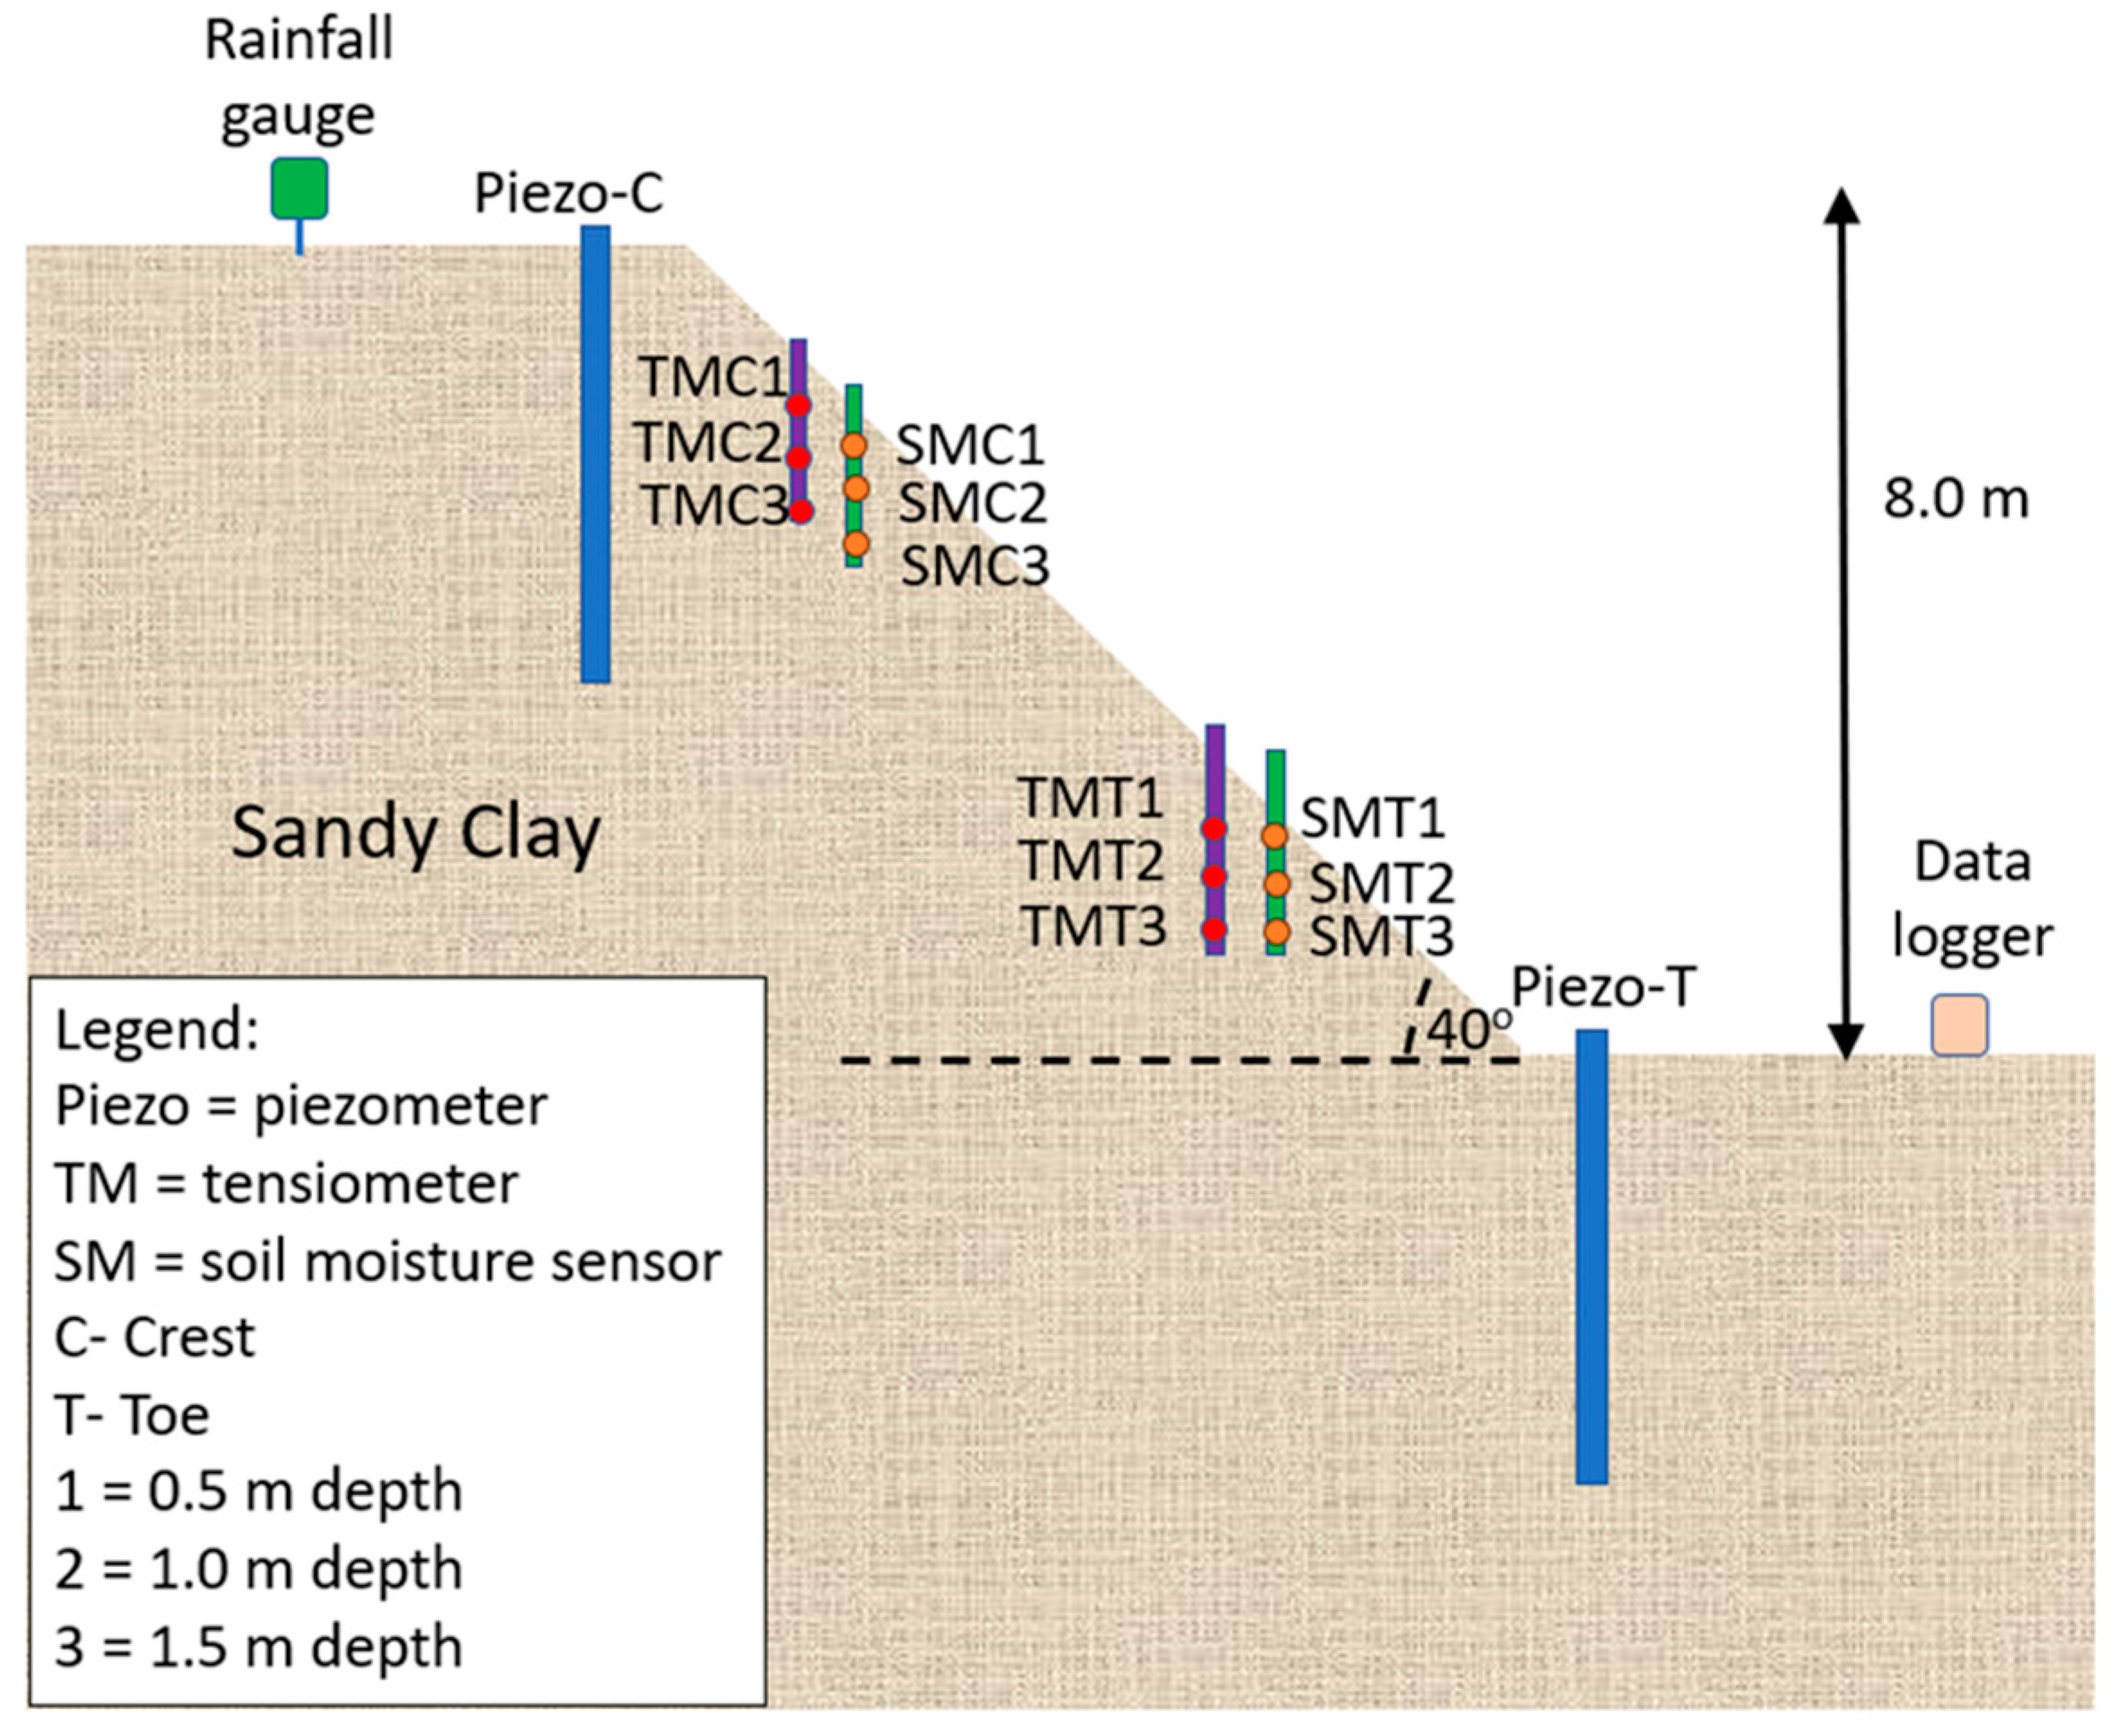
2. Site Overview and Field Instrumentation

The slope in Buangkok Link is located in the northeastern part of Singapore (Figure 1). The slope sits on a geological formation of old alluvium, with a height of 8 m and a slope angle of approximately 40° (Figure 2). The Buangkok Link slope was selected due to its susceptibility to climatic variations, particularly intense and prolonged rainfall, which significantly impacts slope stability. The region experiences a tropical monsoon climate, characterized by high annual precipitation and heavy storms during the wet season [28]. The geological formations of Singapore are divided into three main types based on their locations (Figure 1): (i) igneous granite rock, referred to as Bukit Timah Granite, found in the central and northwestern regions; (ii) sedimentary rocks located in the western region, widely known as the Jurong Formation; and (iii) semi-hardened alluvium, also known as old alluvium, which covers the eastern part of Singapore [29]. The oldest rocks in Singapore date back to the Palaeozoic era, which ended around 225 million years ago. Igneous rocks also underlie Bukit Timah Nature Reserve and the Central Catchment Area. Based on radioactive dating, the granite in Singapore is over 200 million years old. The sedimentary rocks of the Jurong Formation cover large areas in the southern, southwestern, and western parts of the island. The old alluvium, deposited by an ancient river system, likely formed during the Pleistocene epoch when sea levels were lower. The soils from this deposition are classified as residual soil, and they primarily consist of clayey, coarse, and angular sand with subrounded pebbles up to 4 cm in diameter.
The slope was instrumented and monitored for six months (1 October to 5 April 2020). Real-time monitoring equipment was installed on the slope. A rain gauge was placed in an open area, one meter above the ground at the crest of the slope, to measure the amount of rainfall. The rain gauge was positioned at a height sufficient to prevent wind disturbance and splashing from rainfall. The tipping bucket of the rain gauge was calibrated to tip for every 0.25 mm of rainfall. The gauge was monitored periodically (every two weeks) to prevent dust and insects from disrupting its accuracy.
The setup of the field monitoring instruments for the slope at Buangkok Link is shown in Figure 2. Two Casagrande-type piezometers were installed at the crest (P1) and the toe (P2) to a depth of 8 m to track changes in the groundwater table during dry and rainy periods. Casagrande-type piezometers were selected for their reliability in measuring pore-water pressure (PWP) [30]. The piezometer tip was placed between two bentonite layers at the designated installation depth, with the area above sealed with grout to prevent water migration into the intake. Pressure transducers were installed inside the piezometer to enable automated data collection. The piezometer had a diameter of 50 mm, larger than the 25 mm transducer, allowing the transducer to fit securely within the standpipe. The transducers measured PWP by converting it into a frequency signal using a diaphragm, a tensioned steel wire, and an electromagnetic coil. This setup allowed for precise monitoring of groundwater level changes in response to rainfall.
A capacitance soil moisture sensor and tensiometers were vertically installed in the soil layers. Three pairs of jet-fill tensiometers and soil moisture sensors were positioned near the crest (TMC1 and SMC1 at 0.5 m depth; TMC2 and SMC2 at 1.0 m depth; TMC3 and SMC3 at 1.5 m depth), while the other three pairs were placed at the toe of the slope (TMT1 and SMT1 at 0.5 m depth; TMT2 and SM2 at 1.0 m depth; TMT3 and SMT3 at 1.5 m depth) (Figure 2). Pressure transducers were connected to the tensiometers to measure PWP ranging from −100 to 100 kPa, with a resolution of 0.1 kPa. Before installation, the ceramic tips of the tensiometers were saturated. The tensiometers were filled with de-aired water and sulfate solution. The soil moisture sensor was calibrated to measure the volumetric water content ranging from 0 to 100%.

3. Research Methodology

3.1. Applicable Theory

Numerous mathematical models have been used to best fit the SWCC [31,32,33,34,35]. The Brooks and Corey [31] model is suitable for coarser soils but is less effective for fine-grained soils in capturing sharp transitions in water retention. Van Genuchten’s model [34], while commonly used, assumes a smooth and continuous relationship between water content and soil suction. Compared to these models, Fredlund and Xing’s model [35] is preferred for fitting SWCCs due to its ability to capture a wide suction range of zero to 1 × 10⁶ kPa. In addition, the model is widely applicable to a variety of soil types and accounts for the hysteretic nature of the SWCC. In this study, the laboratory data of the SWCC were best fitted using Fredlund and Xing’s [35] (Equation (1)). It consists of three fitting parameters: a, m, and n. The correction factor ( C ψ ) ensures that the upper limit of soil suction approaches zero (Equation (2)).
θ ψ = C ψ 1 ln e + ψ a n m
C ψ = 1 ln 1 + ψ ψ r ln 1 + 10 6 ψ r
Here, θ s is the saturated volumetric water content; θ is the calculated volumetric water content; ψ (kPa) is the soil suction under consideration; “a” is the fitting parameter corresponding to the air-entry value when the m and n parameters are fixed; “n” is the parameter that indicates how steep the slope of the curve will be, relating to the inflection point of the slope; “m” is the fitting parameter corresponding to the curvature of the slope; and ψ r (kPa) is the fitting parameter that relates to the residual suction.
The pore size distribution was estimated from the experimental SWCC data using Satyanaga et al. [36] (Equation (3)). This equation was derived using an exponential function, with each fitting parameter having a physical meaning related to the fitting curve.
θ ψ = C ψ θ s θ r e x p 5 ψ ψ a e v ψ r ψ a e v + θ r
Here, C ψ is the correction factor; θ s is saturated volumetric water content; θ r is the residual volumetric water contents; ψ (kPa) is the soil suction under consideration; ψ a e v is the air-entry value of the soil; and ψ r (kPa) is the fitting parameter that relates to the residual suction.

3.2. Laboratory Testing

The soil from old alluvium was collected from a depth of 3–5 m on the residual slope and subjected to SWCC tests using three different laboratory equipment: Small Centrifuge testing (0–250 kPa), a pressure plate (250–400 kPa), and a chilled-mirror hygrometer (400–85,000 kPa).
The centrifuge test was conducted following method E of ASTM D6836-02 [37]. The soil sample was trimmed and placed in a steel ring. The ring was then inserted into a mold with holes at the bottom to allow for water flow. The mold (together with the soil) was submerged in water up to the soil sample’s height (5 cm). The weight of the sample was checked after 12 h to monitor water content. Saturation was completed after 24 h, and the final weight was recorded. Next, the soil sample was placed into the centrifuge chamber and sealed. The sample was then subjected to various angular velocities (each corresponding to one matric suction), and the weight of the specimen was simultaneously measured as water was displaced to determine the SWCC.
The pressure plate test was conducted using method C of ASTM D6836-02 [37]. The pressure plate consists of a pressure chamber with a saturated ceramic disc at 15 bars. The soil specimen was compacted and saturated until it achieved at least 95% of its water content before placement on the ceramic disc. Contact between the soil specimen and the ceramic disc was maintained during placement to ensure continuous water flow between them. The pressure plate was then connected to a burette to measure water volume changes and to keep the ceramic plate saturated. The weight of the soil sample was recorded at regular intervals, and once equilibrium was achieved, a higher pore-air pressure was applied.
Method E of ASTM D6836-02 [37] identifies the chilled-mirror hygrometer (WP4C) as an appropriate method for measuring high suction ranges from 400 kPa to 100 MPa. The WP4C uses the dew point technique to measure soil water potential. The soil specimen was prepared by ensuring the height of the sample was half the height of the container (approximately 9 mm). The prepared sample was placed inside the WP4C chamber, where the equipment measures the relative humidity of the soil once it achieves equilibrium with the surrounding air. The chamber contains a mirror whose temperature is controlled by a thermoelectric (Peltier) cooler. A photoelectric cell detects the precise moment condensation forms on the mirror by directing a light beam onto it. The thermocouple attached to the mirror records the condensation temperature. Initial readings are displayed on the screen of the WP4C, and a green LED light flashes with a beeping sound when the final value is reached. The value is recorded, and the weight of the sample is measured.

4. Results

4.1. Experimental Results

4.1.1. Basic Soil Properties

The results of the index property tests, compaction tests, and saturated permeability for the soil samples extracted from the Buangkok Link at a depth of 3 to 5 m are presented in Table 1. The index properties include the grain size distribution and Atterberg limits (liquid limit, plastic limit, and plasticity index) (Table 1). According to the Unified Soil Classification System (USCS) [38], the soil is classified as Lean Clay (CL), indicating that more than 50% of the soil passes through sieve No. 200 and has a liquid limit of less than 50% (Table 1).

4.1.2. Soil–Water Characteristic Curve

Using Equation (1), the experimental data of the SWCC were best fitted, as shown in Figure 3. The C( ψ ) was set as recommended by Leong and Rahardjo [42]. Table 2 and Table 3 present the fitting parameters used to best fit the drying and wetting SWCCs, respectively. The drying SWCC has a saturated water content of 0.60, while the wetting SWCC exhibits a variation of approximately 50% relative to the drying SWCC, with a saturated water content of 0.30. Similarly, the residual volumetric water content ( θ r ) is 0.12 and the volumetric water content related to the water entry value of the wetting SWCC is 0.06, showing a variation of approximately 50% compared to the residual moisture content of the drying SWCC. The air-entry value ( ψ a ) of the drying SWCC is around 40 kPa, which corresponds to the water saturation point ( ψ b w ) of the wetting SWCC. The residual soil suction ( ψ r ) and the water entry value ( ψ w ) are 5000 kPa for the drying and wetting SWCC, respectively.

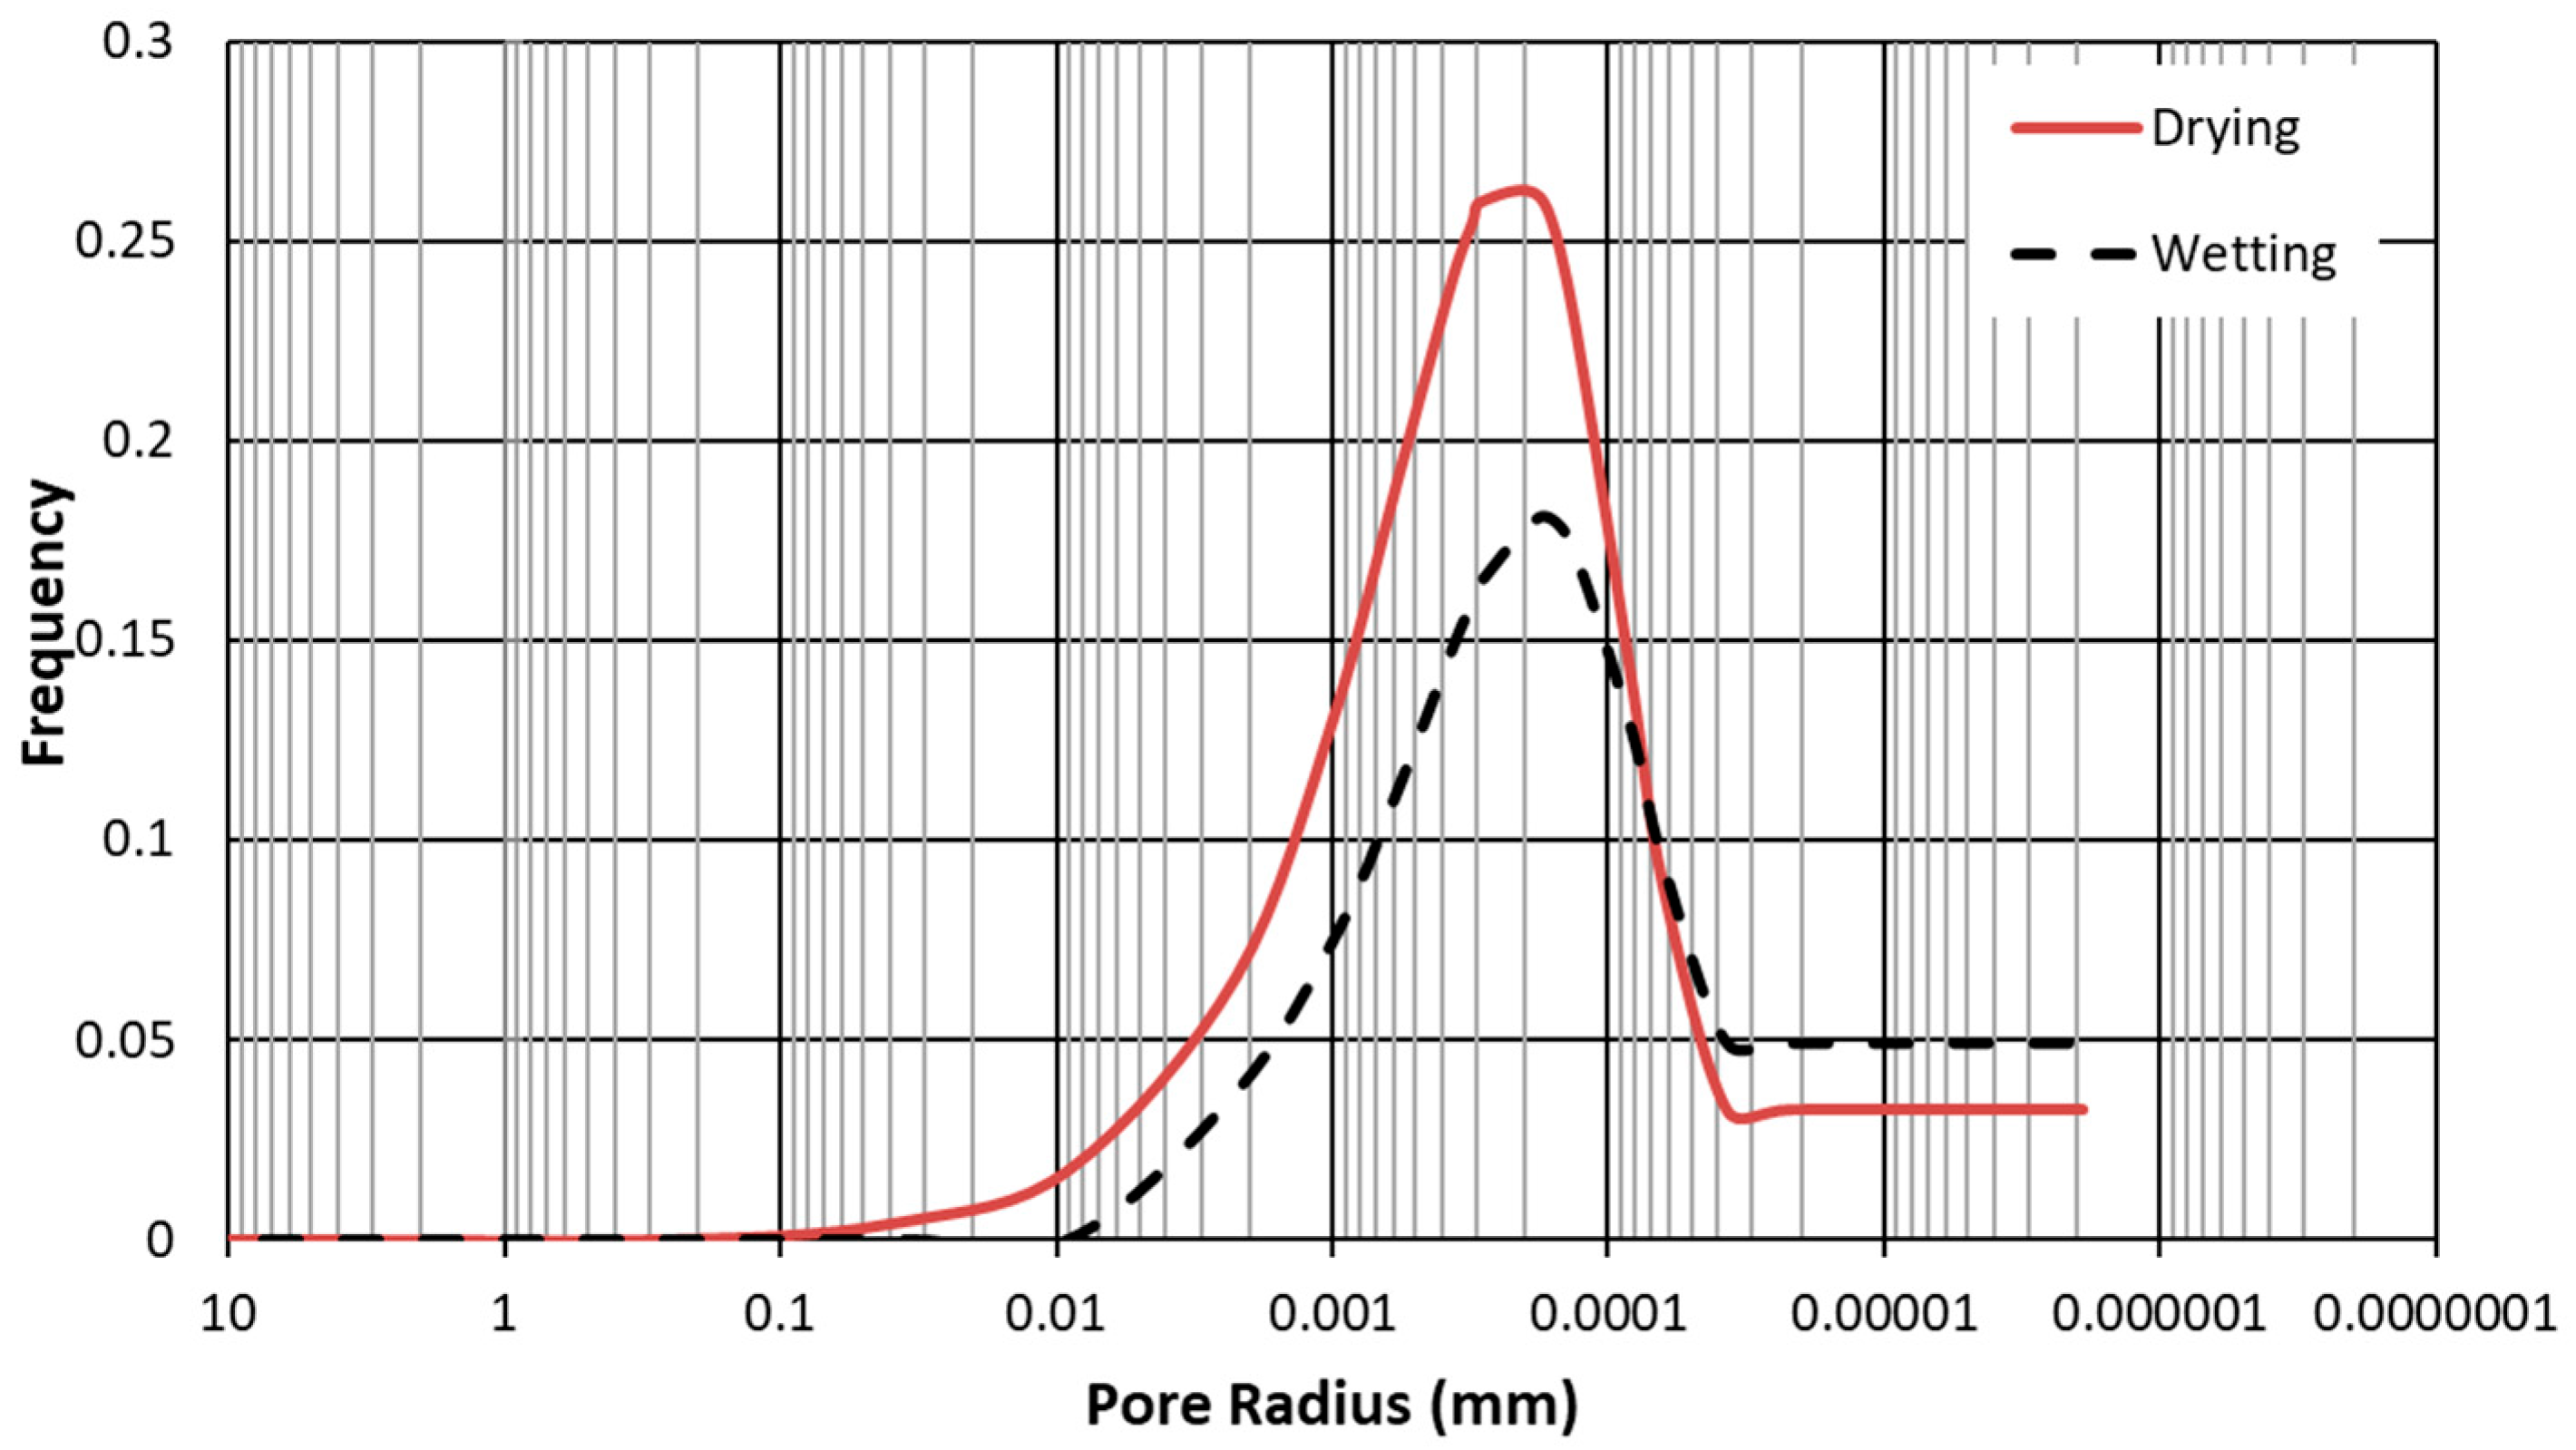
4.1.3. Pore Size Distribution

Figure 4 shows the pore size distribution (PSD), representing the frequency of the pore radii in the soil sample. It illustrates the individual pore radius variation during the wetting and drying cycles. The soil has a dominant pore radius of 0.0002 mm. The frequency at this radius was 0.26 and 0.18 for the drying and wetting cycles, respectively. These differences are attributed to variations in water movement during each cycle.

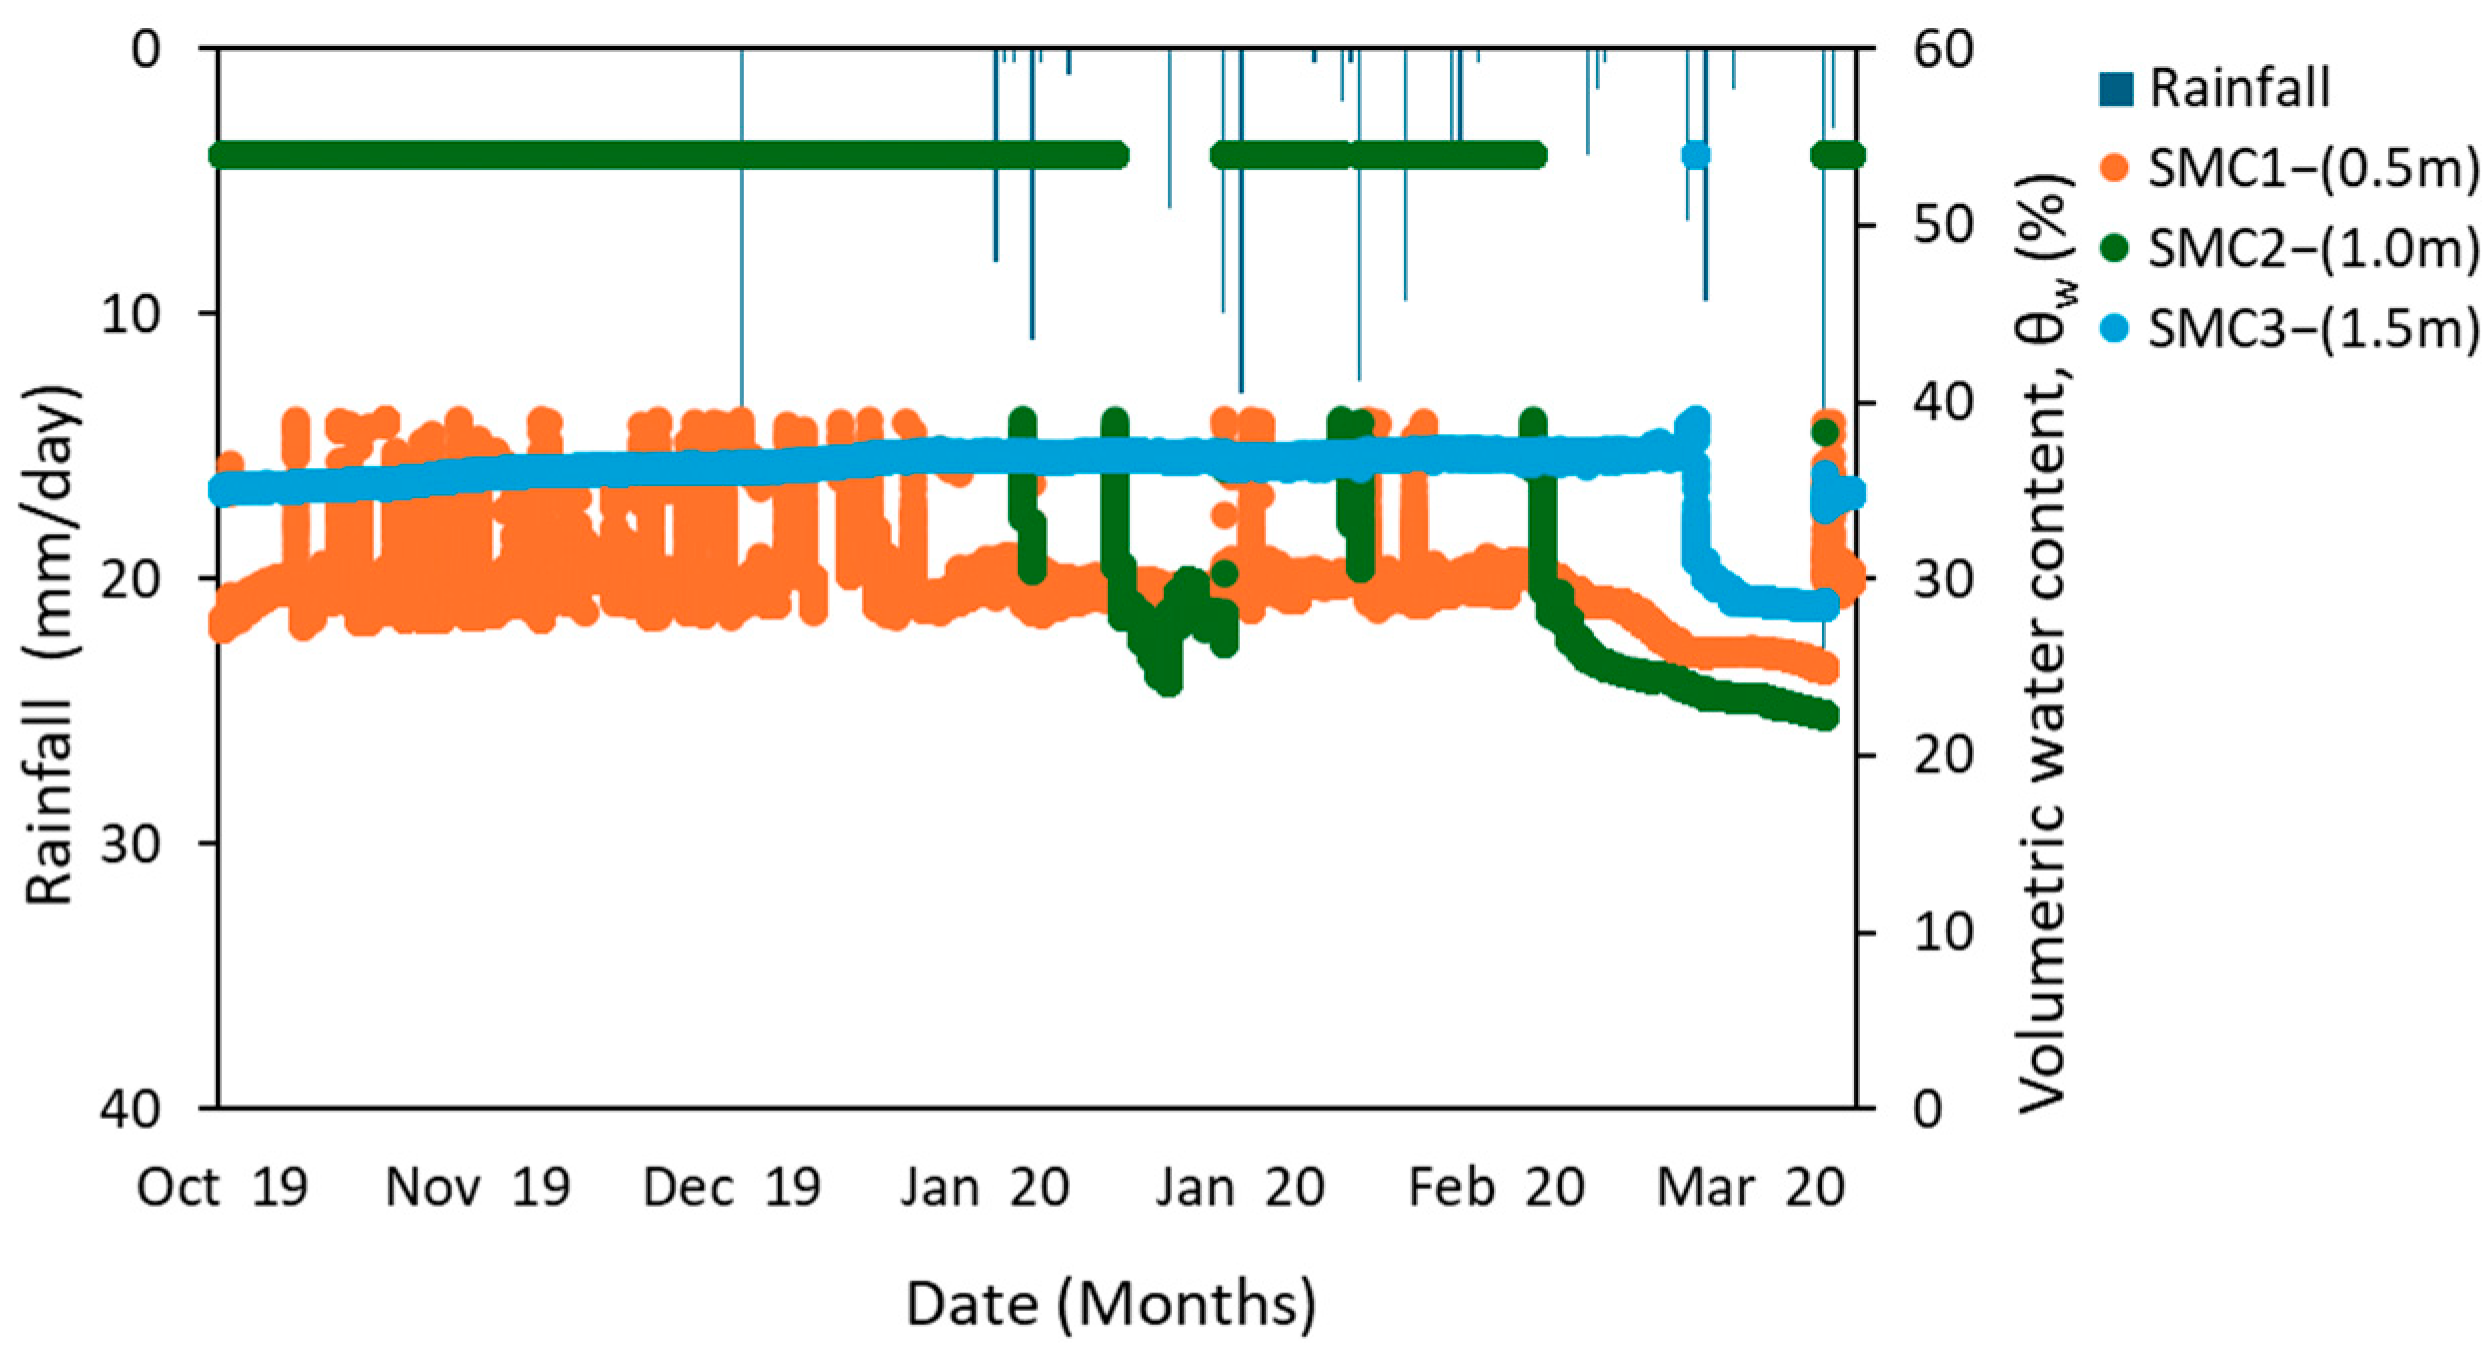
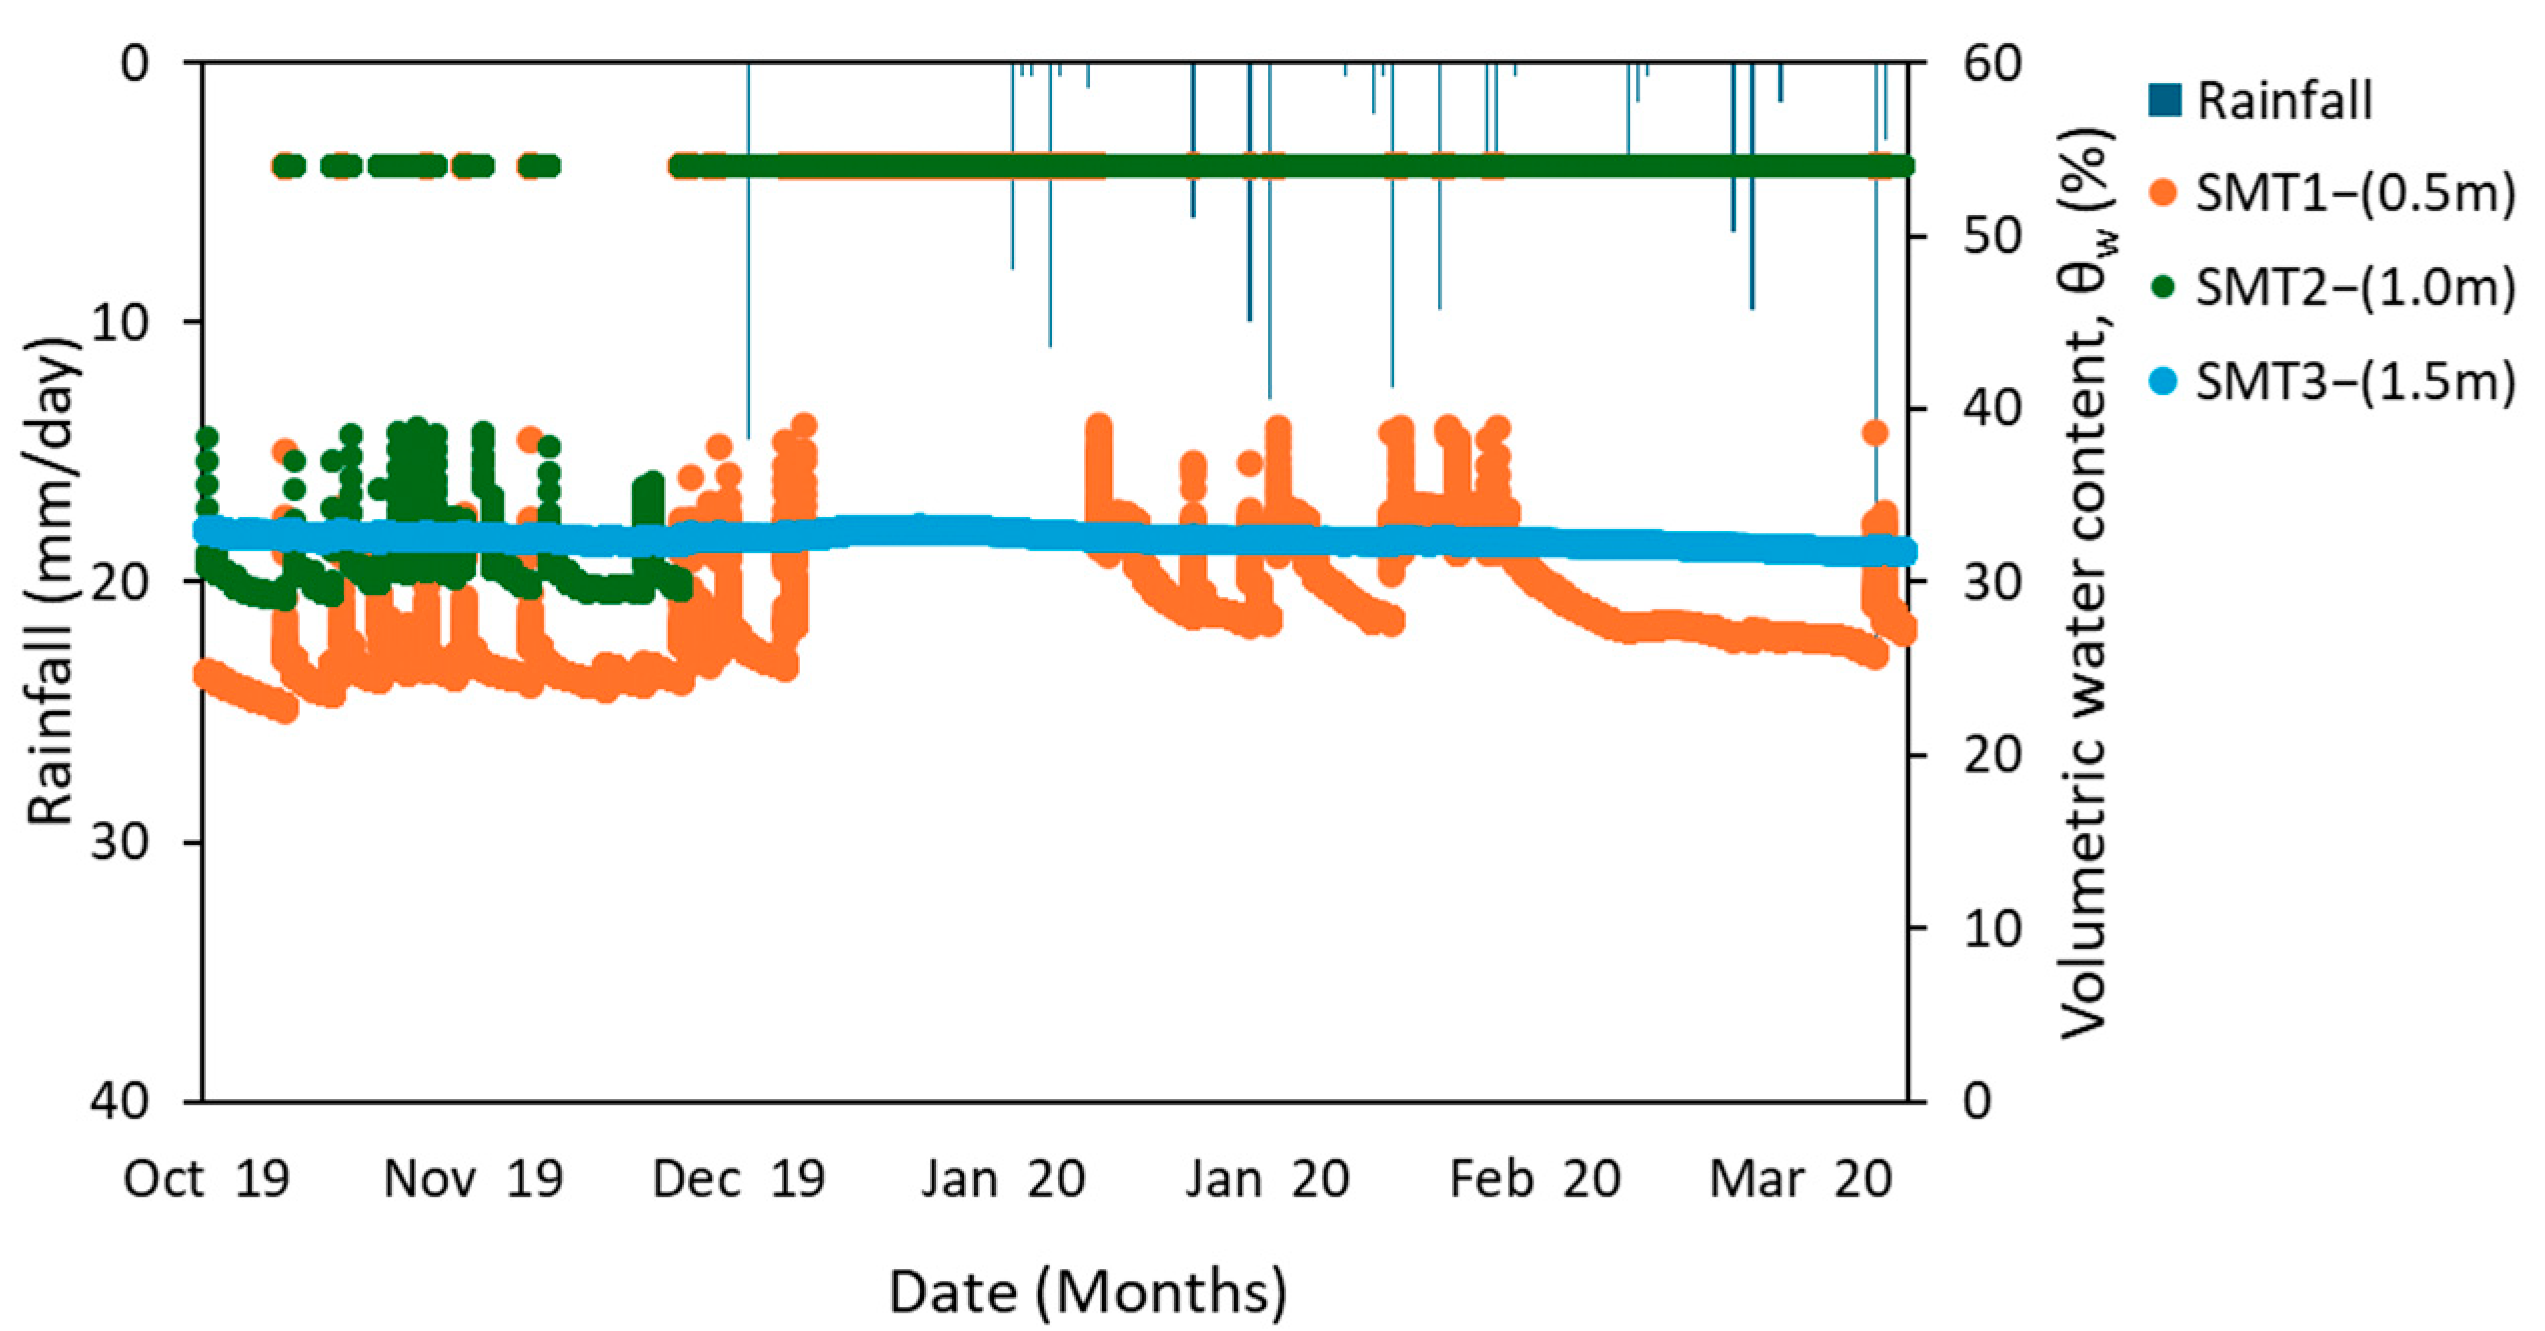
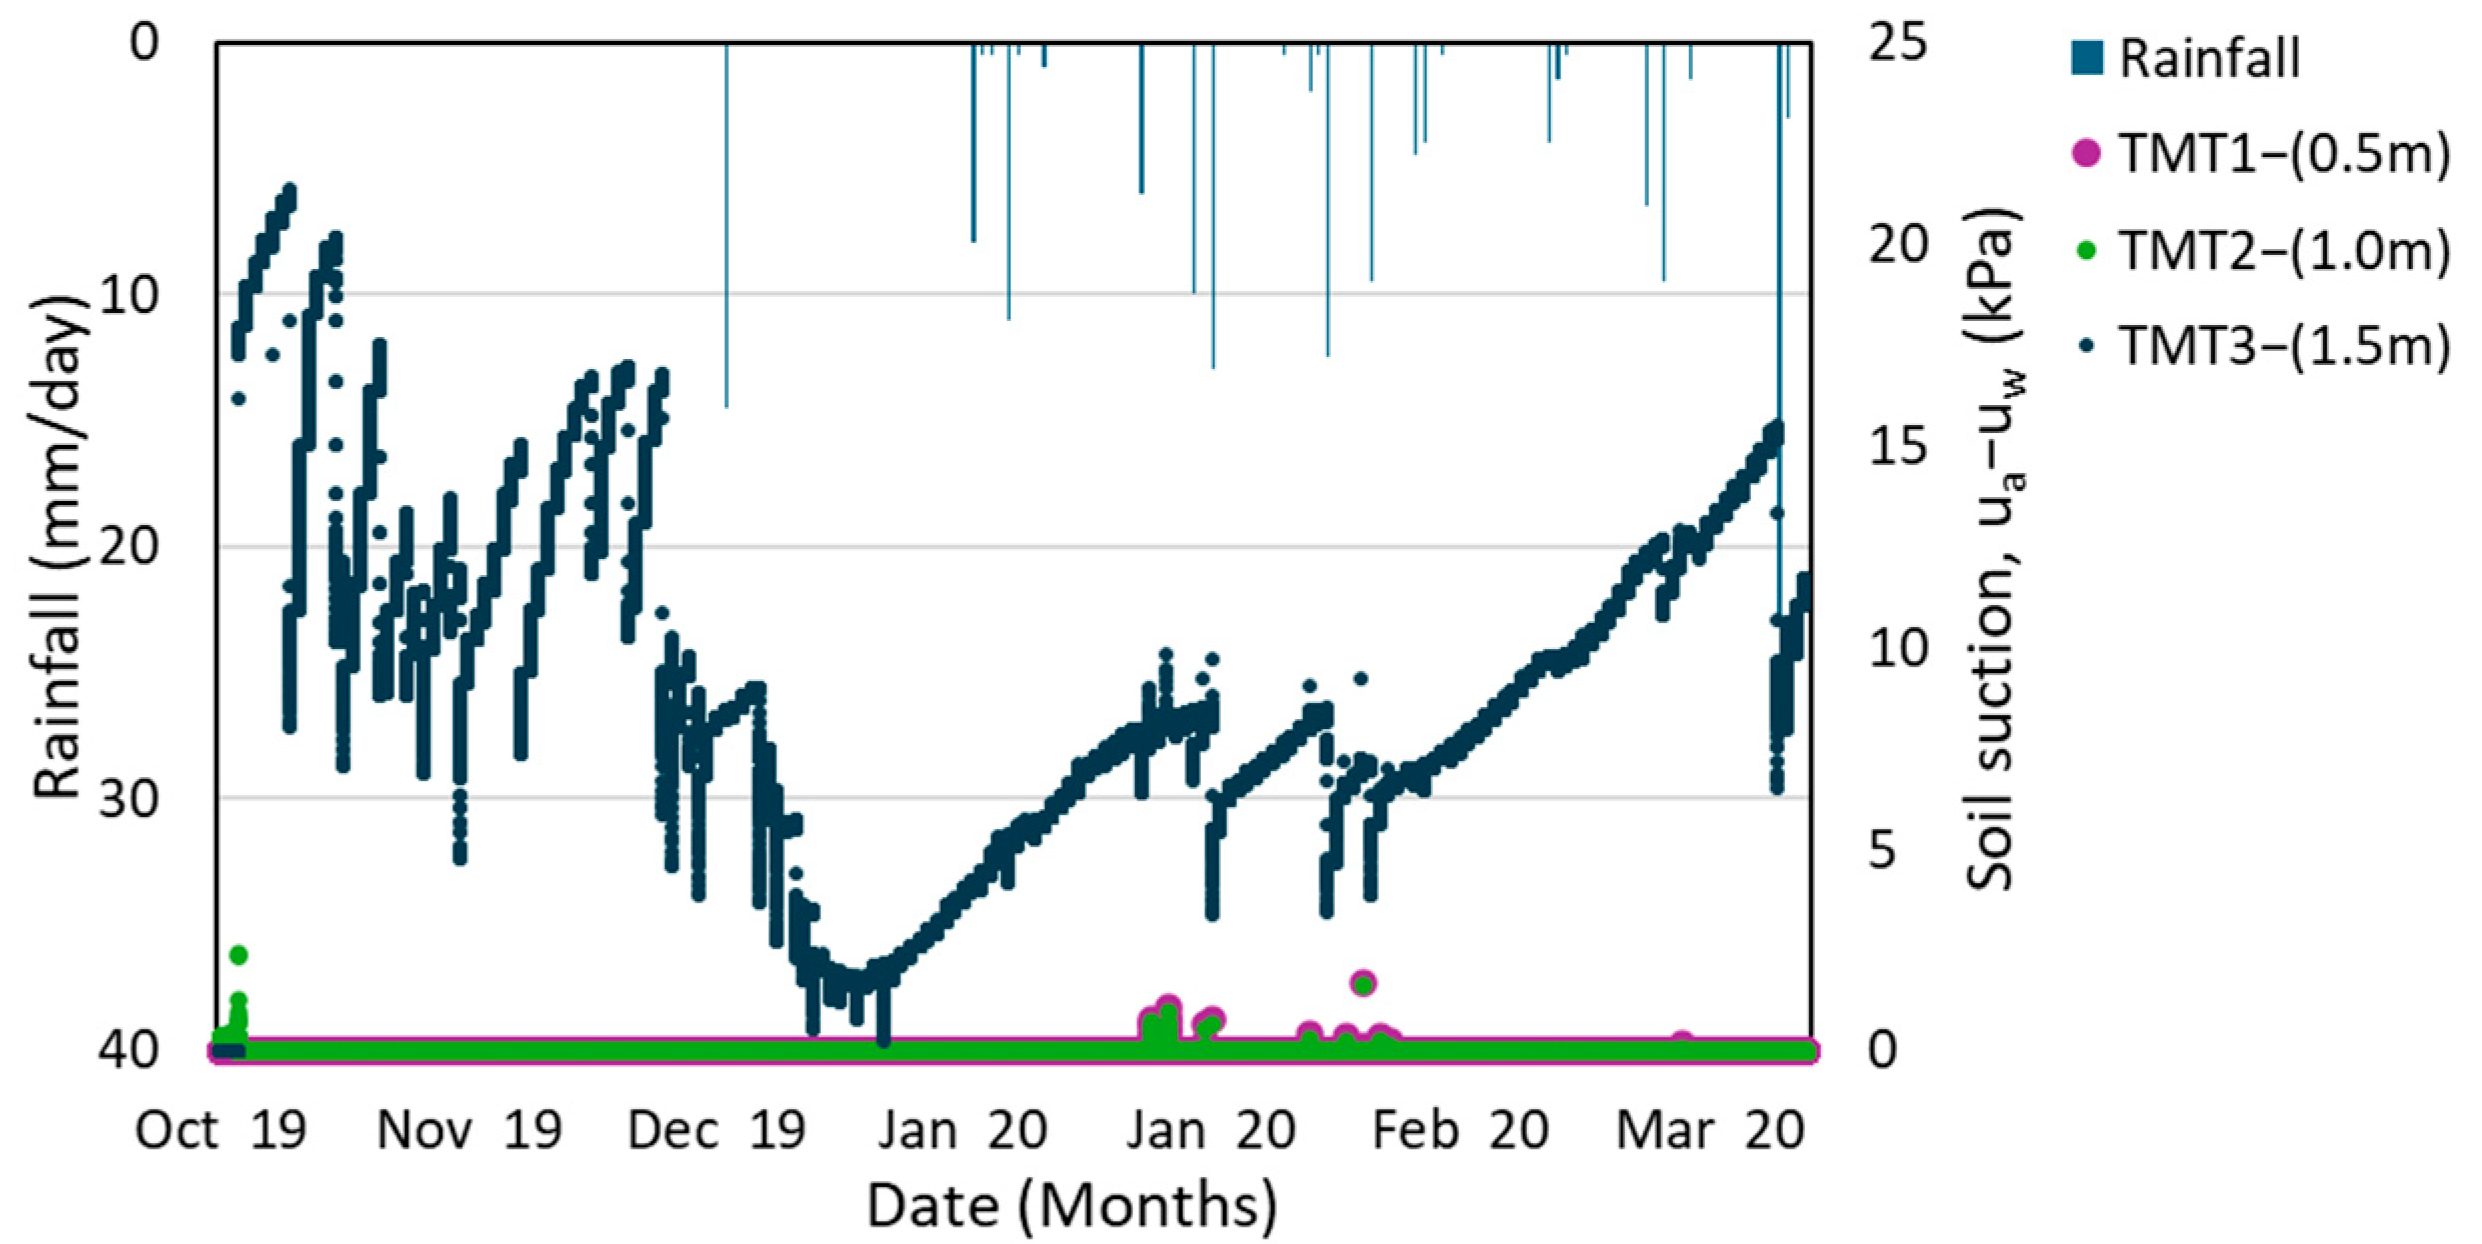
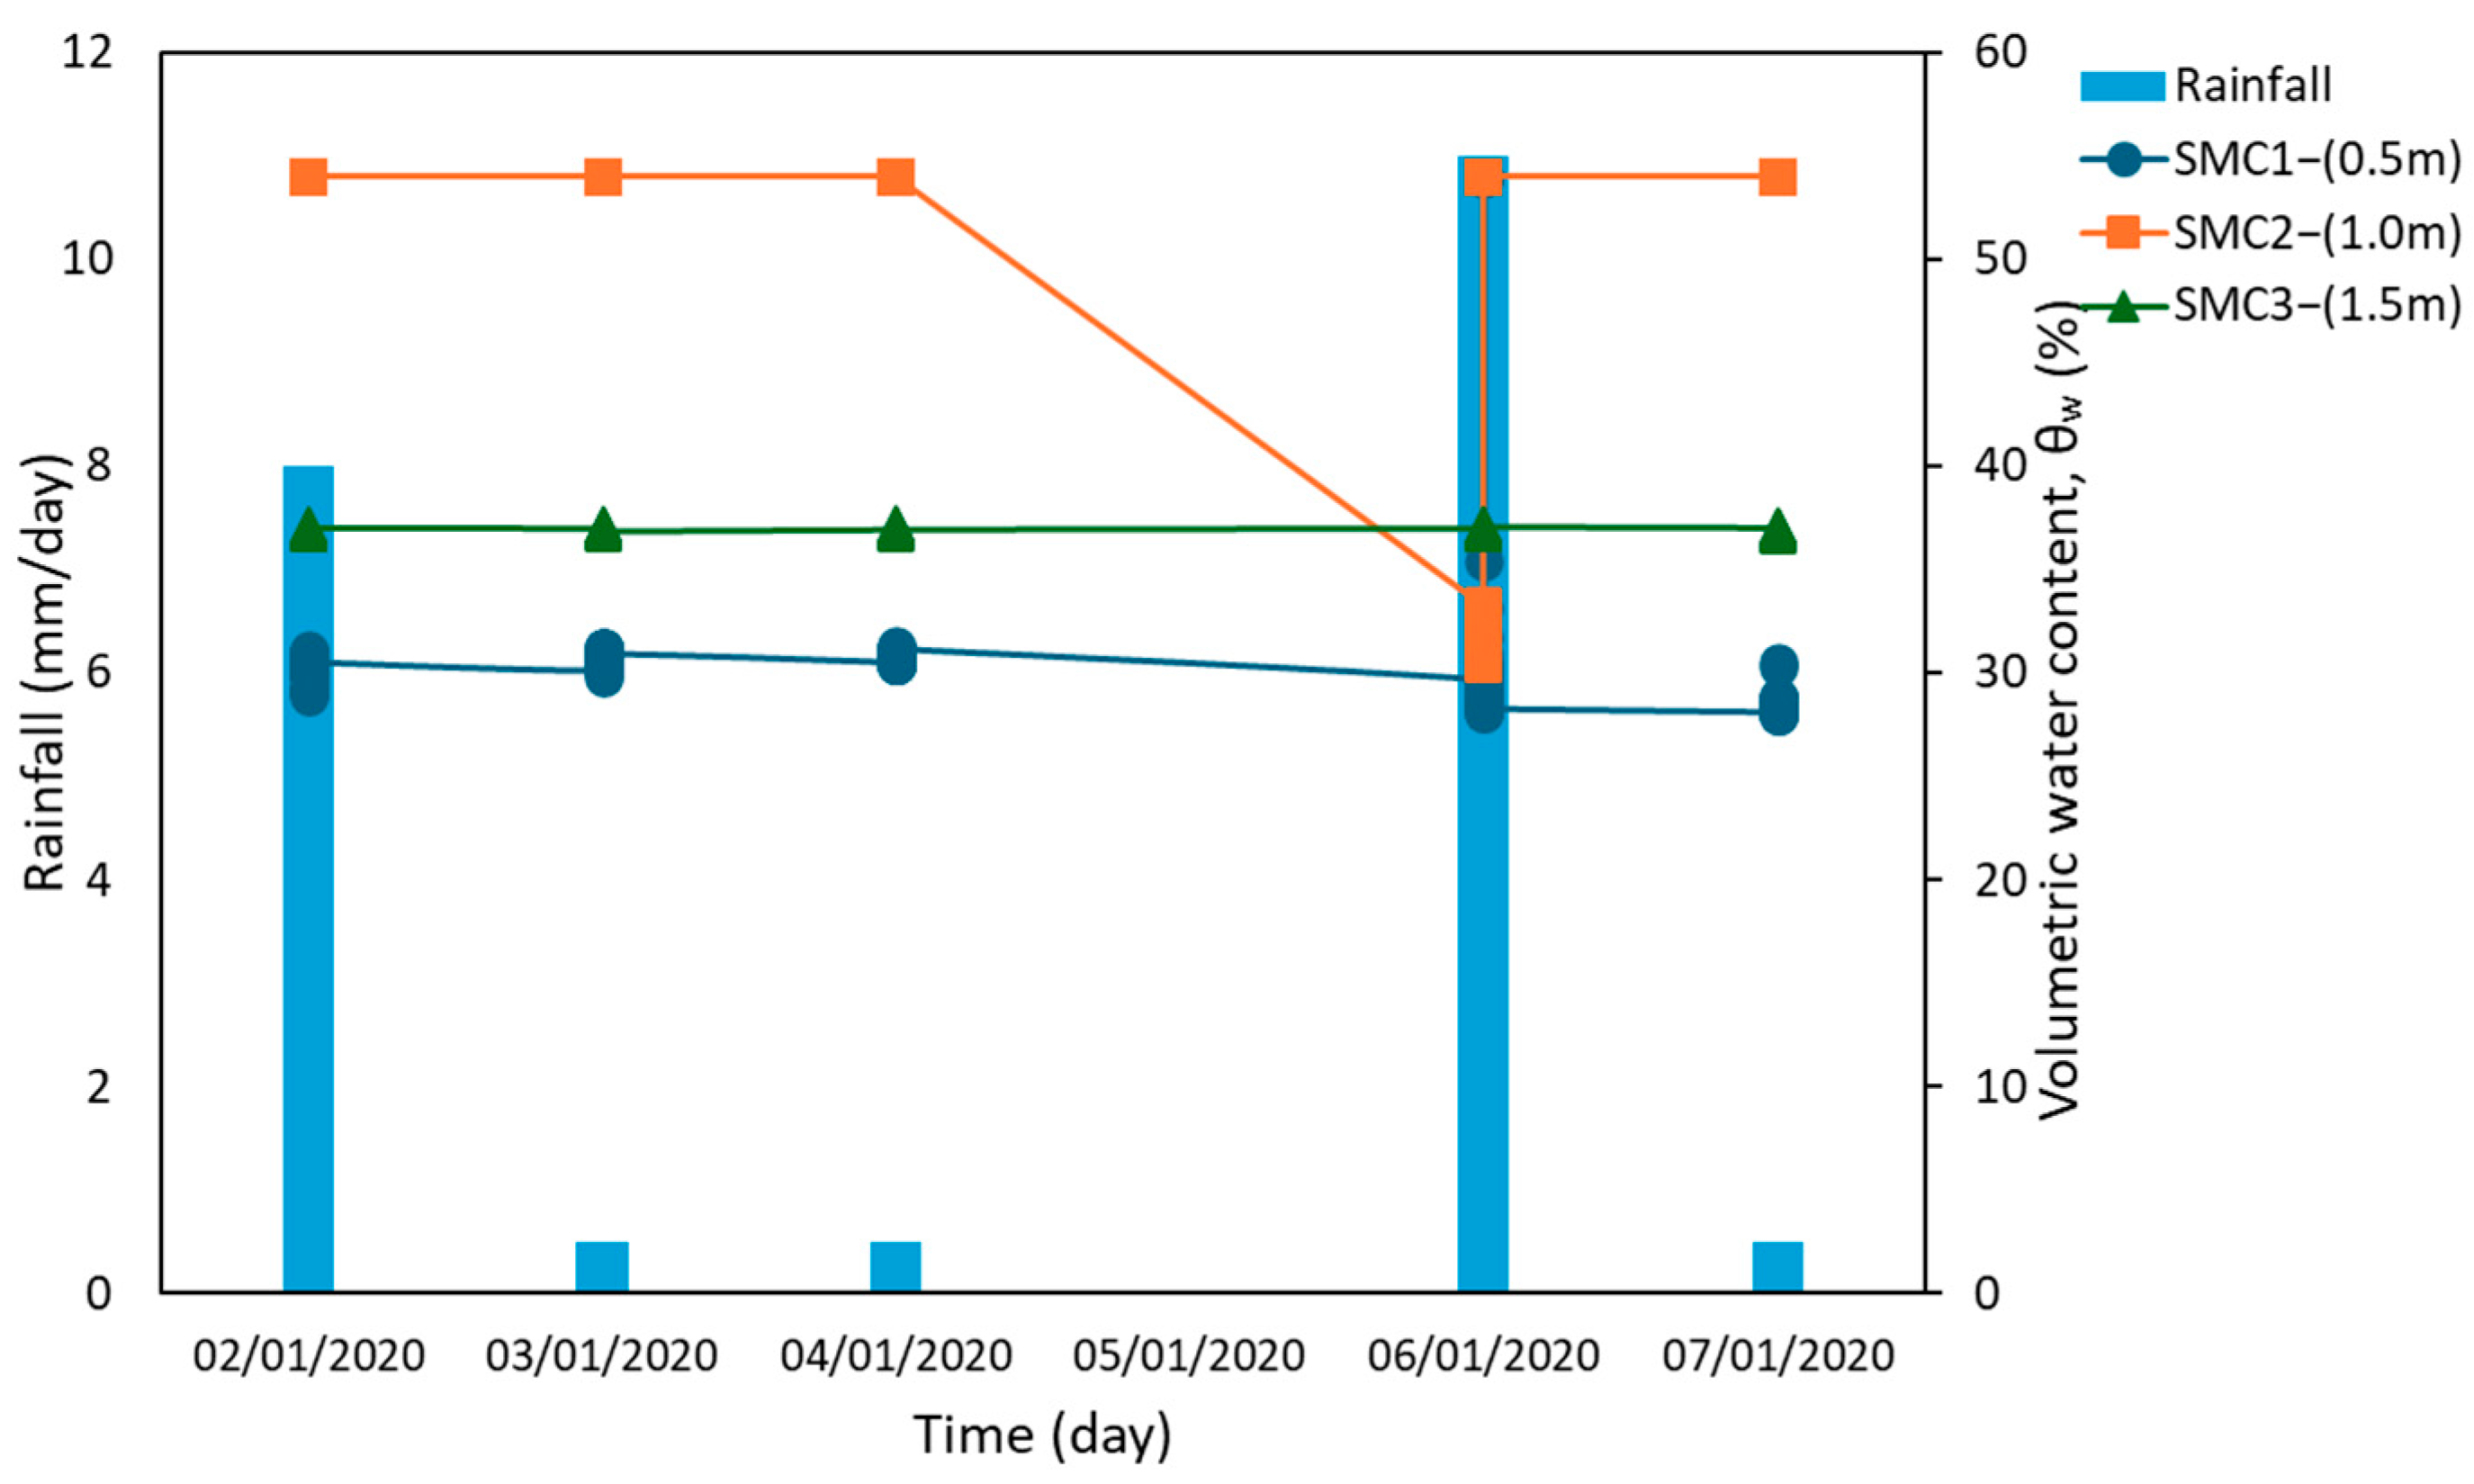
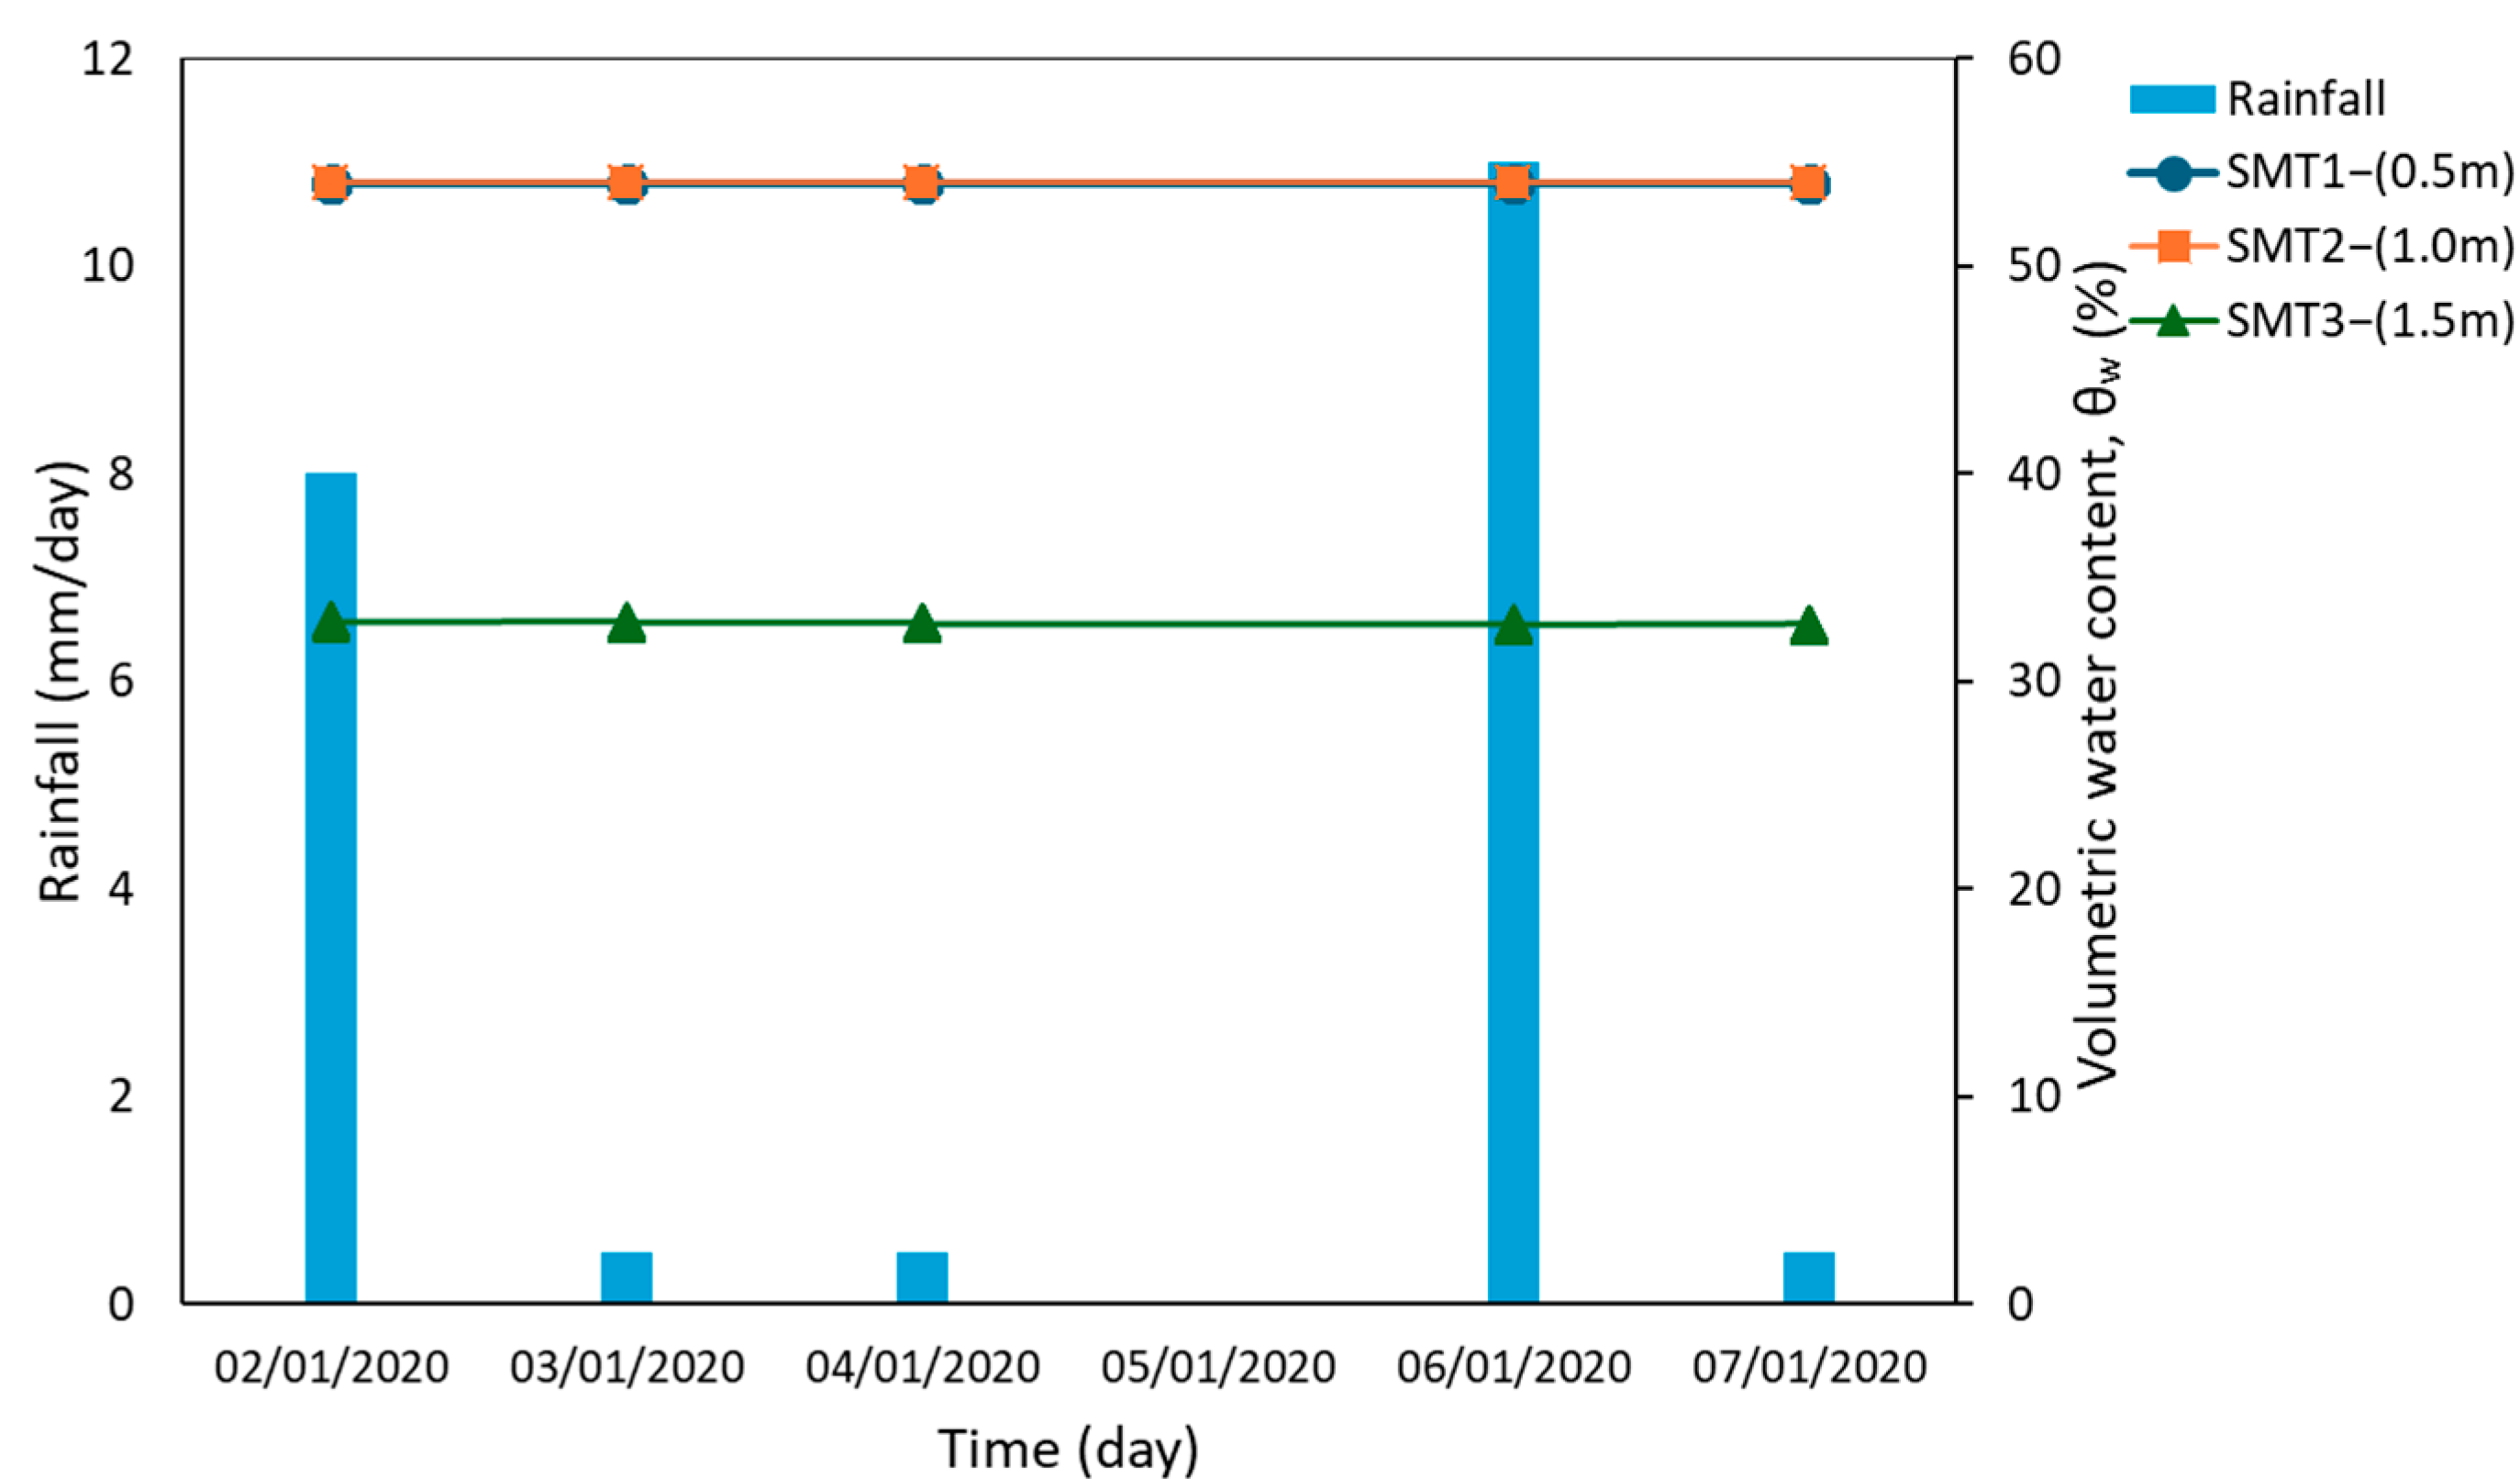
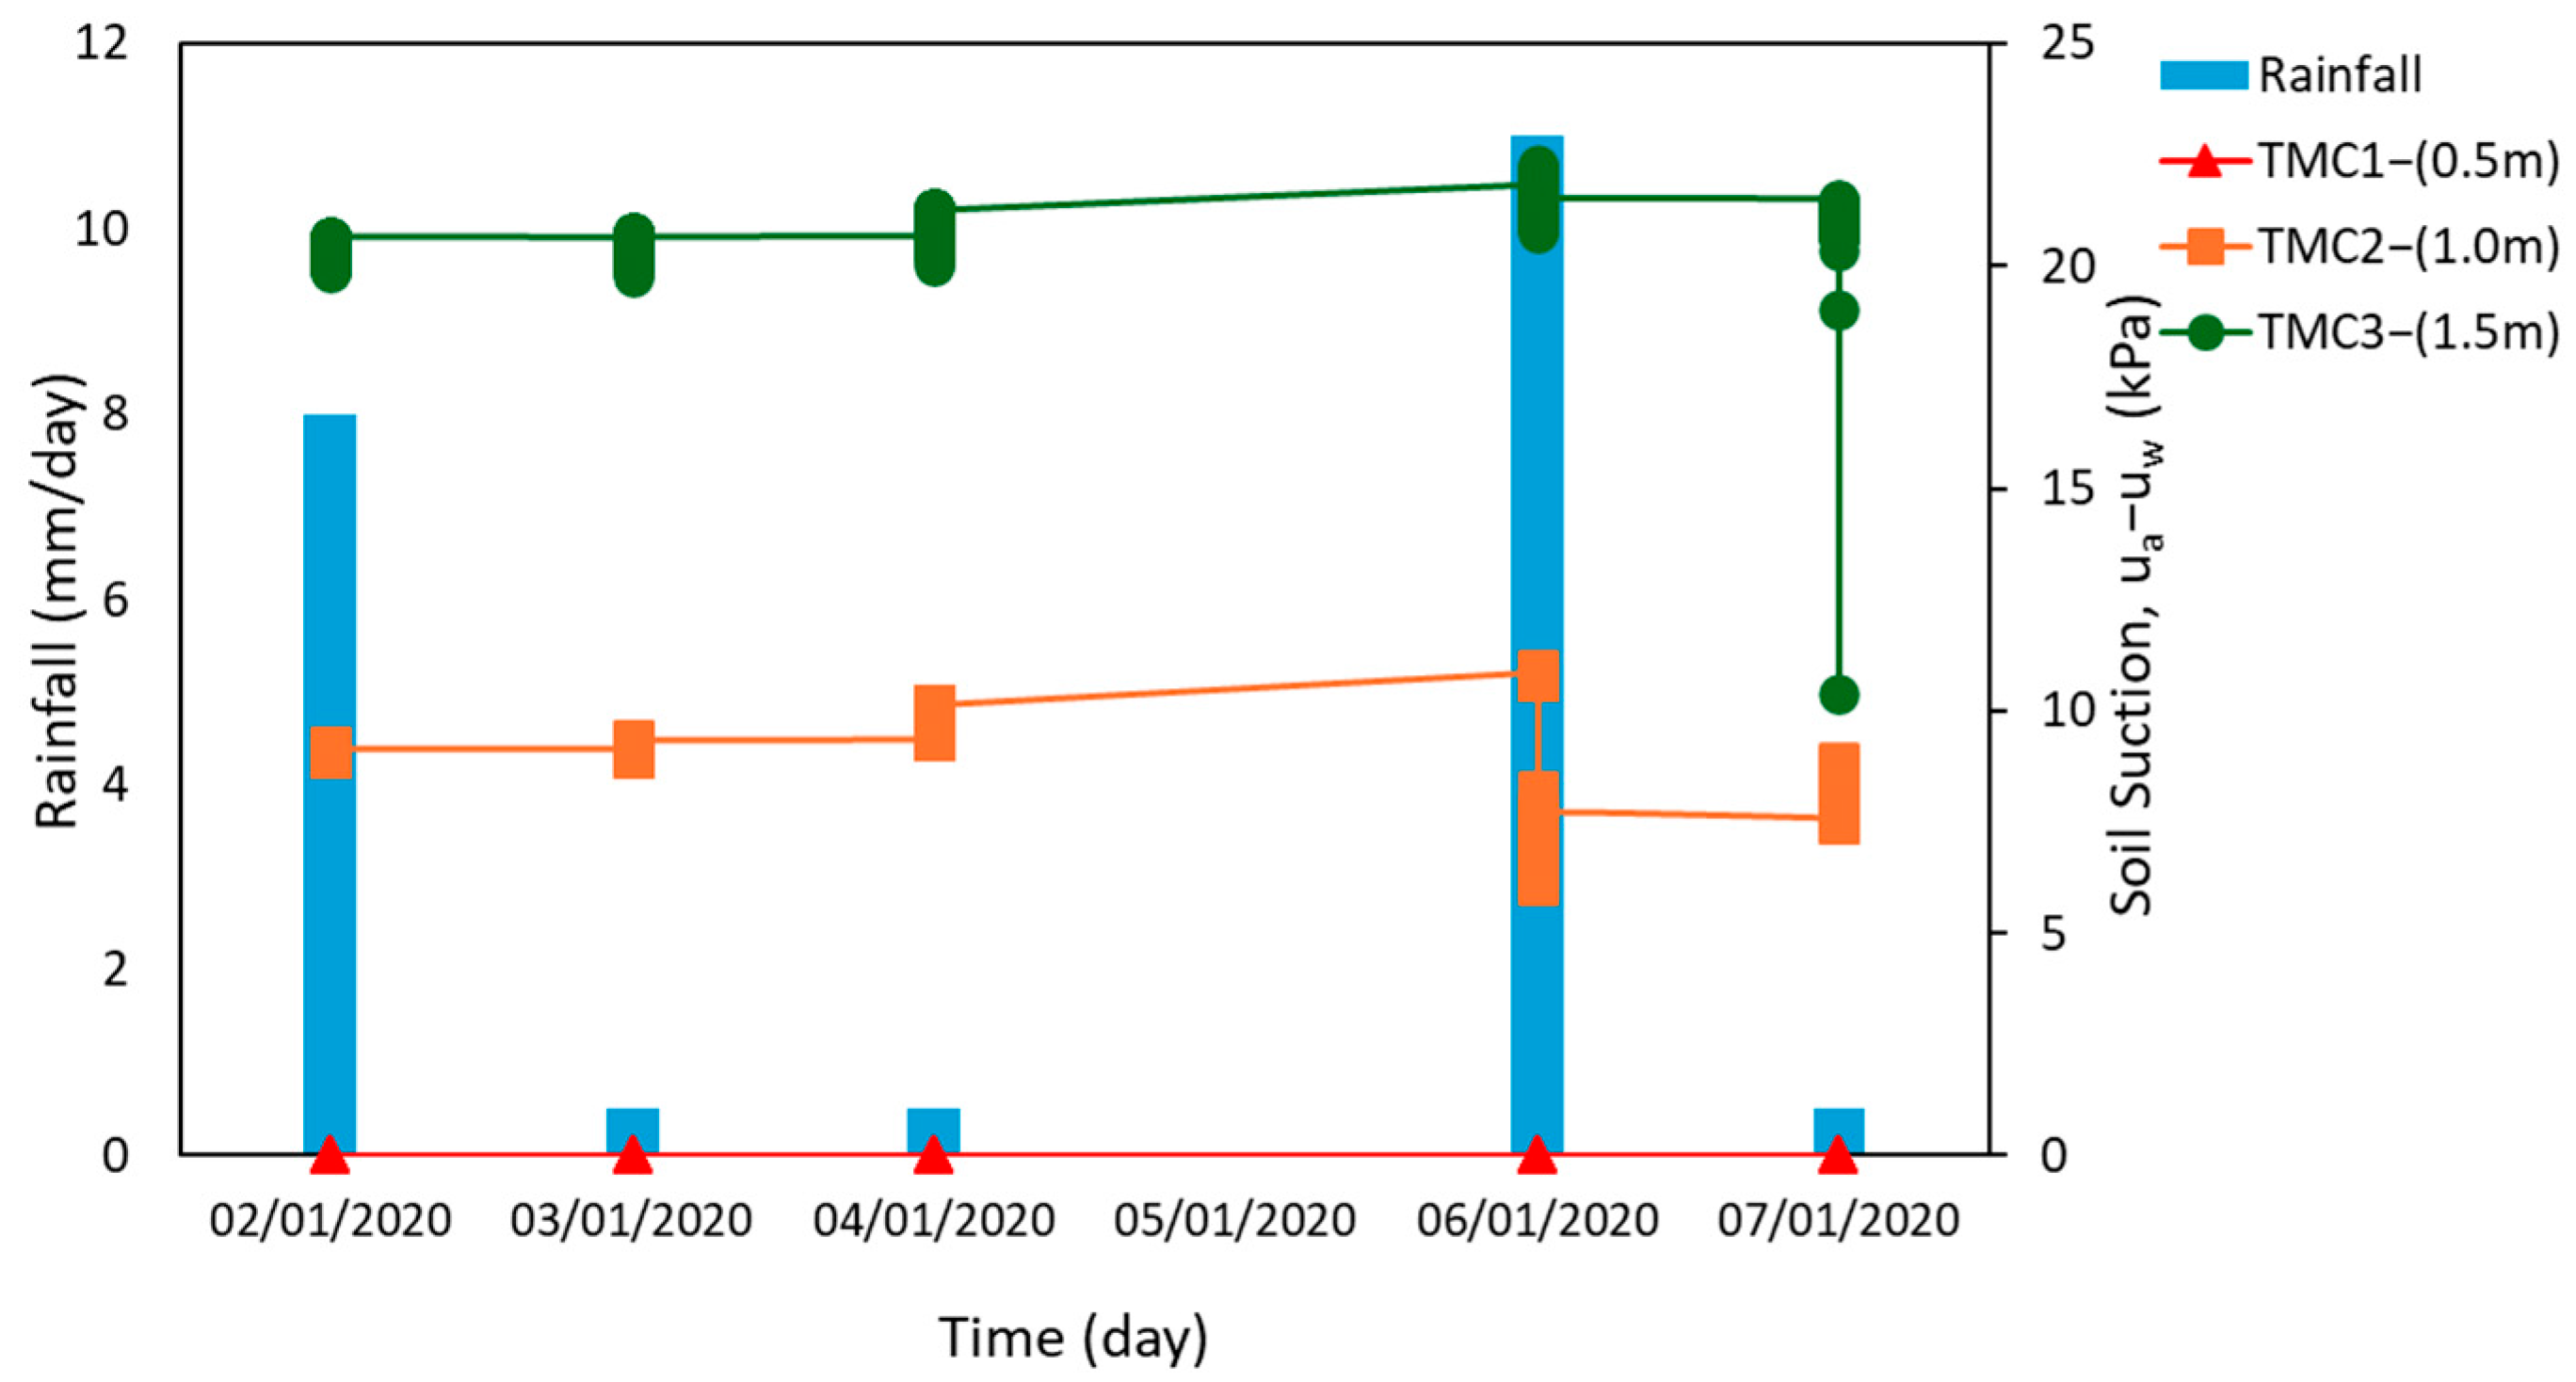
4.2. Field Instrumentation Results

Figure 5 shows the daily and monthly rainfall of the Buangkok slope between 1 October 2019 and 4 April 2020. A significant peak in cumulative rainfall was observed in October, January, and February, with values of 105 mm, 163 mm, and 142 mm, respectively. January had the highest cumulative rainfall, corresponding with the wettest period typically experienced during the Northeast Monsoon season, usually between December and January [28]. According to the Meteorological Service Singapore [28], the annual average rainfall in 2020 was low. It can be seen that there was no rainfall in November. The cumulative rainfall in December was 17.5 mm, which is relatively low compared to the country’s monthly average rainfall of approximately 250 mm. January and February experienced an average decrease in rainfall of about 30% compared to the 30-year average rainfall from 1981 to 2010.
Figure 6 and Figure 7 show the variation in rainfall intensity and soil volumetric water content at the crest and toe of the Buangkok Link slope from 1 October 2019 to 4 April 2020. Three soil moisture sensors were installed at depths of 0.5 m, 1.0 m, and 1.5 m at both the crest and toe of the slope. In Figure 6, the volumetric water content at the crest (0.5 m depth) fluctuated significantly between 30% and 40%. At a depth of 1.0 m, the volumetric water content exhibited the highest variation of approximately 54% during rainfall. At a depth of 1.5 m, the volumetric water content in the soil remained constant at 38% until February, then progressively decreased in March to 28% due to low rainfall. In Figure 7, the volumetric water content at the toe (0.5 m depth) varied between 25% and 40%. At a depth of 1.0 m, the volumetric water content also varied between 30% and 54% from October to December, then maintained a constant trend of 54% throughout the monitoring period. Similarly, the volumetric water content at a depth of 1.5 m was relatively stable at approximately 32%.
Figure 8 and Figure 9 show the variation between rainfall and soil suction at the crest and toe of the Buangkok Link Slope from 1 October 2019 to 4 April 2020. Three jet-filled tensiometers were installed at depths of 0.5 m, 1.0 m, and 1.5 m at both the crest and toe of the slope. In Figure 8, the soil suction at the crest (0.5 m depth) was constant, with a value of 0 kPa throughout the monitoring period. At a depth of 1.0 m, the soil suction fluctuated significantly between 0 and 32 kPa in response to rainfall and evaporation events, whereas at a depth of 1.5 m, the soil suction varied between 20 and 25 kPa. In Figure 9, the soil suction at the toe of the slope at both the 0.5 m and 1.0 m depths remained constant with a value of 0 kPa for the entire monitoring period. However, the soil suction at the 1.5 m depth varied from 0 to 23 kPa due to changes in rainfall patterns.

5. Discussion

5.1. Influence of Rainfall on the Soil Moisture and Soil Suction of the Slope

Figure 10, Figure 11, Figure 12 and Figure 13 show the most consecutive days of rainfall during the monitoring period between 2 and 7 January 2020. As the depth of the slope to the ground surface increases, the variation of the volumetric water content at the crest of the residual slope is shown in Figure 10. On the second day of January 2020, the volumetric water content was 30%, 54%, and 36% at depths of 0.5 m, 1.0 m, and 1.5 m, respectively, due to approximately 8 mm of rainfall. These differences indicate that at the onset of the rainfall, some of the water content at a depth of 0.5 m was simultaneously absorbed by the roots of a tree located at the crest, while the rest infiltrated to the 1.0 m and 1.5 m depths. The water content at the 0.5 m and 1.5 m depths remained constant throughout the six days of rainfall. At a depth of 1.0 m, the water content decreased due to a two-day period of prolonged low rainfall totaling 0.5 mm. However, the water content suddenly increased back to its initial state of approximately 54% following 11 mm of rainfall that occurred on 6 January 2020.
Figure 12 shows the variation in soil suction and rainfall at the crest of the slope between 2 and 7 January 2020. The soil suction at a depth of 0.5 m was 0 kPa throughout the monitoring period. However, there is a possibility of higher soil suction due to evapotranspiration from the tree at the crest of the slope. This could not be established due to the limitation of the jet-filled tensiometer, which measures soil suction at less than 100 kPa [43]. Similar findings were observed by Leung et al. [44] and Ni et al. [45], where the presence of plants or vegetation in the soil led to increased soil suction. The soil suction at a depth of 1.0 m varied between 6.1 kPa and 10.6 kPa due to differences in soil moisture. Compared to the 1.0 m depth, the soil suction at a depth of 1.5 m varied between 10.38 kPa and 21 kPa due to lower soil moisture at greater depths.
Figure 11 shows the variation in soil volumetric water content at the toe of the slope between 2 and 7 January 2020. At depths of 0.5 m and 1.0 m, the volumetric water content remained constant at approximately 54% throughout the monitoring period. This can be attributed to the near-saturation condition of the soil at these depths. Given the low saturated permeability of the soil (Table 1), water enters the soil gradually and drains out slowly. At a depth of 1.5 m, the volumetric water content was constant at 34%, indicating less water infiltration at this deeper level of the toe. The variation in soil suction at the toe of the slope during the monitoring period is shown in Figure 13. Due to the higher water content at depths of 0.5 m and 1.0 m, the soil suction was 0 kPa. In contrast, at a depth of 1.5 m, the soil suction fluctuated between 4 kPa and 5.5 kPa, indicating a higher soil suction.

5.2. Scanning Curve of Soil–Water Characteristic Curve

The SWCC is strongly influenced by the soil’s texture and structure, particularly its pore size distribution [46,47]. The soil predominantly found in the study area is sandy clay (Table 1), typical of the old alluvium deposits in Singapore [48]. In Table 2, the drying SWCC from the laboratory test shows that the saturated volumetric water content of the soil is approximately 0.60, likely due to the higher clay content. The micropore structure predominant in clay is responsible for the high water retention capacity. In contrast, the air-entry value (AEV) was 40 kPa, reflecting the influence of the sandy content in the soil composition. The soil contains a significant amount of sand, which allows air to enter at lower suction, leading to a more rapid initial desaturation. This is demonstrated by the sudden decline in volumetric water content once the AEV is reached (Figure 14). The early air-entry and subsequent drop in water content emphasize the dual influence of sand and clay on the SWCC behavior of the soil. At the residual suction of 5000 kPa, the soil’s residual water content was 0.12. This indicates that the high specific surface area and strong adsorptive forces of the clayey soil allow it to retain more moisture at high suction [49,50].
The initial drying and main wetting SWCCs show different pathways, with the drying SWCC exhibiting higher water content at the same suction in the capillary and transition zones of the SWCC. This represents the hysteresis behavior of the SWCC, with field monitoring SWCC forming a scanning curve within the hysteresis loop (Figure 14). The drying scanning curve has a saturated water content of 0.54 and an AEV of 10 kPa. This value is lower compared to the laboratory drying SWCC. The wetting scanning curve has a saturated water content of 0.30 and follows a similar trend as the main wetting SWCC. The dominant pore radius (Figure 4) corresponding to the initial drying PSD is higher than that of the main wetting PSD. This can be linked to the volumetric shrinkage behavior observed in clayey soil during drying. The shrinkage in the soil is attributed to the adsorption and capillarity forces that act through the interparticle stresses, known as negative pore-water stresses in the soil [51]. Therefore, the water-holding capacity of the pore size in the soil during wetting is continuously reduced due to the induced volume changes that occur during the drying cycle. The fraction of the pores infiltrated with water during the wetting cycle is reduced since there is less energy to displace the air. This phenomenon can be related to the formation of entrapped air inside the soil sample.
Figure 14 shows that the actual parameters in the SWCC in the field are smaller than those obtained from laboratory tests. As a result, the stability of unsaturated soil slopes may be overestimated if laboratory-based values are used in stability analyses. Under laboratory conditions, the soil typically retains more moisture at higher suction values, which contributes to greater negative pore pressures and stronger interparticle forces, thereby increasing the effective stress and shear strength. However, in the field, the actual suction values are often lower due to factors such as increased permeability, variability in pore structure, and fluctuating environmental conditions. These reduced suction values lead to lower effective stress, weakening the shear strength of the soil and potentially making the slope less stable.
As a result, when predicting the stability of unsaturated soil slopes, using smaller field-based suction values is essential for more accurate predictions. The reduced suction in the field lowers the effective stress, which in turn decreases the shear strength of the soil. This reduces the soil’s ability to resist sliding forces and decreases the Factor of Safety (FoS) of the slope. Without accounting for these differences between laboratory and field conditions, the predicted stability could be overly optimistic, leading to an increased risk of slope failure. Therefore, to ensure reliable stability assessments, it is crucial to incorporate the field-derived SWCC parameters, which reflect the actual soil behavior under natural environmental conditions.

6. Conclusions

This paper presents experimental SWCC and field monitoring (scanning curve) of a residual slope. The field monitoring during rainfall events shows a significant increase in water content and a reduction in soil suction at a depth of 0.5 m at both the crest and toe of the slope. This change occurred due to low saturated permeability and the effect of transpiration in the soil. Furthermore, the experimental and field monitoring of the residual slope confirm the hysteresis behavior of the SWCC. The field monitoring forms a scanning curve that creates a loop within the envelope of the experimental SWCC. The wetting SWCC for both the experimental and scanning curves followed a similar trend. The air-entry value of the scanning curve was 25% lower, and the saturated water content was 10% lower than that of the initial drying SWCC. These findings provide valuable insights into the exact hydraulic behavior of unsaturated soil during numerical analysis. This can provide informed and accurate predictions of residual slope behavior under extreme climatic conditions and enhance strategies for mitigating geotechnical hazards such as landslides.

Author Contributions

Conceptualization, A.M.D. and A.S.; methodology, A.M.D. and B.D.A.; software, A.M.D. and A.S.; validation, Y.K. and Z.Q.; formal analysis, A.M.D. and B.D.A.; investigation, A.M.D., A.S., and Y.K.; resources, Y.K. and J.K.; data curation, B.D.A. and Z.Q.; writing—original draft preparation, A.M.D., A.S. and B.D.A.; writing—review and editing, Y.K., Z.Q. and J.K.; visualization, Y.K. and Z.Q.; supervision, A.S. and J.K.; project administration, A.S. and J.K.; funding acquisition, A.S. All authors have read and agreed to the published version of the manuscript.

Funding

This research was supported by the Ministry of Education and Science (MES) (Grant No. AP23486953), and Nazarbayev University under Faculty-development competitive research grants program for 2024-2026 (Grant No. 20122022FD4108). The authors are grateful for this support. Any opinions, findings, and conclusions or recommendations expressed in this material are those of the author(s) and do not necessarily reflect the views of Nazarbayev University.

Institutional Review Board Statement

Not applicable.

Informed Consent Statement

Not applicable.

Data Availability Statement

Data are contained within the article.

Acknowledgments

We would like to acknowledge the advice provided by Harianto Rahardjo on the data extraction in this study.

Conflicts of Interest

The authors declare no conflicts of interest.

References

  1. Udemba, E.N.; Khan, N.U.; Raza Shah, S.A. Demographic change effect on ecological footprint: A tripartite study of urbanization, aging population, and environmental mitigation technology. J. Clean. Prod. 2024, 437, 140406. [Google Scholar] [CrossRef]
  2. Henderson, J.V.; Jang, B.Y.; Storeygard, A.; Weil, D.N. Climate Change, Population Growth, and Population Pressure; NBER Working Paper Series; National Bureau of Economic Research: Cambridge, MA, USA, 2024; Available online: http://www.nber.org/papers/w32145 (accessed on 1 January 2025).
  3. Strauch, A.M.; MacKenzie, R.A.; Giardina, C.P.; Bruland, G.L. Climate driven changes to rainfall and streamflow patterns in a model tropical island hydrological system. J. Hydrol. 2015, 523, 160–169. [Google Scholar] [CrossRef]
  4. Liu, W.; Bai, R.; Sun, X.; Yang, F.; Zhai, W.; Su, X. Rainfall-and Irrigation-Induced Landslide Mechanisms in Loess Slopes: An Experimental Investigation in Lanzhou, China. Atmosphere 2024, 15, 162. [Google Scholar] [CrossRef]
  5. Satyanaga, A.; Mohammad, A.S.; Ibrahimi, A.B.; Wijaya, M.; Moon, S.; Kim, J. Direct and indirect methods in determination of water retention curve of residual soils. In Proceedings of the 17th Asian Regional Conference on Soil Mechanics and Geotechnical Engineering (17th ARC), Astana, Kazakhstan, 14–18 August 2023; CRC Press: Boca Raton, FL, USA, 2023; pp. 363–371. [Google Scholar] [CrossRef]
  6. Leung, A.K.; Sun, H.W.; Millis, S.W.; Pappin, J.W.; Ng, C.W.; Wong, H.N. Field monitoring of an unsaturated saprolitic hillslope. Can. Geotech. J. 2011, 48, 339–353. [Google Scholar] [CrossRef]
  7. Greco, R.; Guida, A.; Damiano, E.; Olivares, L. Soil water content and suction monitoring in model slopes for shallow flowslides early warning applications. Phys. Chem. Earth 2010, 35, 127–136. [Google Scholar] [CrossRef]
  8. Dikshit, A.; Sarkar, R.; Pradhan, B.; Segoni, S.; Alamri, A.M. Rainfall induced landslide studies in indian himalayan region: A critical review. Appl. Sci. 2020, 10, 2466. [Google Scholar] [CrossRef]
  9. Askrinejad, A.; Casini, F.; Bischof, P.; Beck, A.; Springman, S. Rainfall induced instabilities: A field experiment on a silty sand slope in northern Switzerland. Riv. Ital. Di Geotec. 2012, 3, 50–71. [Google Scholar]
  10. Kawagoe, S.; Kazama, S.; Sarukkalige, P.R. Assessment of snowmelt triggered landslide hazard and risk in Japan. Cold Reg. Sci. Technol. 2009, 58, 120–129. [Google Scholar] [CrossRef]
  11. Chiarelli, D.D.; Galizzi, M.; Bocchiola, D.; Rosso, R.; Rulli, M.C. Modeling snowmelt influence on shallow landslides in Tartano valley, Italian Alps. Sci. Total Environ. 2023, 856, 158772. [Google Scholar] [CrossRef]
  12. Miao, F.; Wu, Y.; Li, L.; Liao, K.; Zhang, L. Risk assessment of snowmelt-induced landslides based on GIS and an effective snowmelt model. Nat. Hazards 2019, 97, 1151–1173. [Google Scholar] [CrossRef]
  13. Jia, X.; Jiang, X.; Huang, J.; Yu, S.; Liu, B. Slope Stability Analysis Based on the Explicit Smoothed Particle Finite Element Method. Sustainability 2024, 16, 702. [Google Scholar] [CrossRef]
  14. Fredlund, D.G.; Rahardjo, H.; Fredlund, M.D. Unsaturated Soil Mechanics in Engineering Practice; John Wiley & Sons: Hoboken, NJ, USA, 2012. [Google Scholar] [CrossRef]
  15. Vanapalli, S.K.; Catana, M.C. Estimation of the soil-water characteristic curve of coarse-grained soils using one point measurement and simple properties. In Proceedings of the International Symposium on Advanced Experimental Unsaturated Soil Mechanics, Trento, Italy, 27–29 June 2005; pp. 401–410. [Google Scholar]
  16. Tao, G.; Peng, Y.; Liu, Y. A method for predicting unsaturated soil permeability coefficient based on clay content. Fractals 2023, 31, 2340177. [Google Scholar] [CrossRef]
  17. Chai, J.; Khaimook, P. Prediction of soil-water characteristic curves using basic soil properties. Transp. Geotech. 2020, 22, 100295. [Google Scholar] [CrossRef]
  18. Ren, X.; Kang, J.; Ren, J.; Chen, X.; Zhang, M. A method for estimating soil water characteristic curve with limited experimental data. Geoderma 2020, 360, 114013. [Google Scholar] [CrossRef]
  19. Pernebekova, G.; Satyanaga, A.; Abishev, R.; Moon, S.; Kim, J. Water characteristic curve and permeability function of steel slag. In Proceedings of the 17th Asian Regional Conference on Soil Mechanics and Geotechnical Engineering (17th ARC), Astana, Kazakhstan, 14–18 August 2023; CRC Press: Boca Raton, FL, USA, 2023; pp. 523–527. [Google Scholar] [CrossRef]
  20. Satyanaga, A.; Wijaya, M.; Hamdany, A.H.; Moon, S.-W.; Kim, J. Green retaining structure utilizing recycled concrete aggregate. In Sustainable Materials in Civil Infrastructure; Woodhead Publishing: Cambridge, UK, 2024; pp. 151–160. [Google Scholar] [CrossRef]
  21. Leão, T.P.; Domingues Da Costa, B.F.; Bof Bufon, V.; Fidel, F.; Aragón, H. Using time domain reflectometry to estimate water content of three soil orders under savanna in Brazil. Geoderma Reg. 2020, 21, e00280. [Google Scholar] [CrossRef]
  22. He, H.; Turner, N.C.; Aogu, K.; Dyck, M.; Feng, H.; Si, B.; Wang, J.; Lv, J. Time and frequency domain reflectometry for the measurement of tree stem water content: A review, evaluation, and future perspectives. Agric. For Meteorol. 2021, 306, 108442. [Google Scholar] [CrossRef]
  23. Royer, J.M.; Vachaud, G. Field Determination of Hysteresis in Soil-Water Characteristics. Soil Sci. Soc. Am. J. 1975, 39, 221–223. [Google Scholar] [CrossRef]
  24. Chen, Y.; Li, B.; Xu, Y.; Zhao, Y.; Xu, J. Field Study on the Soil Water Characteristics of Shallow Layers on Red Clay Slopes and Its Application in Stability Analysis. Arab J. Sci. Eng. 2019, 44, 5107–5116. [Google Scholar] [CrossRef]
  25. Pham, H.Q.; Fredlund, D.G.; Barbour, S.L. A study of hysteresis models for soil-water characteristic curves. Can. Geotech. J. 2005, 42, 1548–1568. [Google Scholar] [CrossRef]
  26. Li, A.G.; Tham, L.G.; Yue, Z.Q.; Lee, C.F.; Law, K.T. Comparison of field and laboratory soil–water characteristic curves. J. Geotech. Geoenviron. Eng. 2005, 131, 1176–1180. [Google Scholar] [CrossRef]
  27. Hedayati, M.; Ahmed, A.; Hossain, M.S.; Hossain, J.; Sapkota, A. Evaluation and comparison of in-situ soil water characteristics curve with laboratory SWCC curve. Transp. Geotech. 2020, 23, 100351. [Google Scholar] [CrossRef]
  28. Metrological Service Singapore. Annual Climate Assessment Report; Metrological Service Singapore: Singapore, 2020. [Google Scholar]
  29. PWD. Geology of the Republic of Singapore; Public Works Department: Singapore, 1976. [Google Scholar]
  30. Barnes, G. Soil Mechanics Principles and Practice 2016, 4th ed.; Red Globe Limited: Kolkata, India, 2016. [Google Scholar]
  31. Brooks, R.H.; Corey, A.T. Hydraulic Properties of Porous Media; Hydrology Paper No. 3; Colorado State University: Fort Collins, CO, USA, 1964. [Google Scholar]
  32. Gardner, W.R. Some steady state solutions of the unsaturated moisture flow equation with application to evaporation from a water table. Soil Sci. 1958, 85, 228–232. [Google Scholar] [CrossRef]
  33. McKee, C.R.; Bumb, A.C. The importance of unsaturated flow parameters in designing a monitoring system for hazardous wastes and environmental emergencies. In Proceedings of the Hazardous Materials Control Research Institute National Conference, Houston, TX, USA, 4–6 March 1984; pp. 50–58. [Google Scholar]
  34. van Genuchten, M.T. A closed-form equation for predicting the hydraulic conductivity of unsaturated soils. Soil Sci. Soc. Am. J. 1980, 44, 892–898. [Google Scholar] [CrossRef]
  35. Fredlund, D.G.; Xing, A. Equations for the soil-water characteristic curve. Can. Geotech. J. 1994, 31, 521–532. [Google Scholar] [CrossRef]
  36. Satyanaga, A.; Kim, J.; Moon, S.W.; Wijaya, M. Exponential functions for modelling hysteresis of soil-water characteristic curves. E3S Web Comf. 2020, 195, 2002. [Google Scholar] [CrossRef]
  37. ASTM D6836-02; Standard Test Methods for Determination of the Soil Water Characteristic Curve for Desorption Using Hanging Column, Pressure Extractor, Chilled Mirror Hygrometer, or Centrifuge. ASTM International: West Conshohocken, PA, USA, 2008. [CrossRef]
  38. ASTM D2487-17; Standard Practice for Classification of Soils for Engineering Purposes (Unified Soil Classification System). ASTM International: West Conshohocken, PA, USA, 2017. [CrossRef]
  39. ASTM D422-63; Standard Test Method for Particle-Size Analysis of Soils. ASTM International: West Conshohocken, PA, USA, 2007. [CrossRef]
  40. ASTM D4318-17e1; Standard Test Methods for Liquid Limit, Plastic Limit, and Plasticity Index of Soils. ASTM International: West Conshohocken, PA, USA, 2017. [CrossRef]
  41. ASTM D5084-24; Standard Test Methods for Measurement of Hydraulic Conductivity of Saturated Porous Materials Using a Flexible Wall Permeameter. ASTM International: West Conshohocken, PA, USA, 2024. [CrossRef]
  42. Leong, E.C.; Rahardjo, H. Permeability functions for unsaturated soils. J. Geotech. Geoenviron. Eng. 1997, 123, 1118–1126. [Google Scholar] [CrossRef]
  43. Soil Moisture Equipment Corp. 2710 ARL Tensiometer and 2725ARL Jet Fill Tensiometer Operating Instructions; Soil Moisture Equipment Corp.: Goleta, CA, USA, 2011. [Google Scholar]
  44. Leung, A.K.; Garg, A.; Ng, C.W.W. Effects of plant roots on soil-water retention and induced suction in vegetated soil. Eng. Geol. 2015, 193, 183–197. [Google Scholar] [CrossRef]
  45. Ni, J.J.; Leung, A.K.; Ng, C.W.W.; So, P.S. Investigation of plant growth and transpiration-induced matric suction under mixed grass-tree conditions. Can. Geotech. J. 2017, 54, 561–573. [Google Scholar] [CrossRef]
  46. Carrick, S.; Buchan, G.; Almond, P.; Smith, N. Atypical early-time infiltration into a structured soil near field capacity: The dynamic interplay between sorptivity, hydrophobicity, and air encapsulation. Geoderma 2011, 160, 579–589. [Google Scholar] [CrossRef]
  47. Hou, X.; Qi, S.; Liu, F. Soil Water Retention and Pore Characteristics of Intact Loess Buried at Different Depths. Sustainability 2023, 15, 14890. [Google Scholar] [CrossRef]
  48. Bello, N.; Satyanaga, A.; Aventian, G.D.; Moon, S.-W.; Kim, J. Mathematical equations for modelling soil-water characteristic curve. In Smart Geotechnics for Smart Societies; CRC Press: Boca Raton, FL, USA, 2023; pp. 2378–2384. [Google Scholar]
  49. Horrocks, R.D.; Vallentine, J.F. 12—Water Relations and Irrigation. In Harvested Forages; Horrocks, R.D., Vallentine, J.F., Eds.; Academic Press: San Diego, CA, USA, 1999; pp. 225–242. [Google Scholar] [CrossRef]
  50. Resurreccion, A.C.; Moldrup, P.; Tuller, M.; Ferré, T.P.A.; Kawamoto, K.; Komatsu, T.; De Jonge, L.W. Relationship between specific surface area and the dry end of the water retention curve for soils with varying clay and organic carbon contents. Water Resour. Res. 2011, 47, 6. [Google Scholar] [CrossRef]
  51. Lu, N.; Likos, W.J. Suction stress characteristic curve for unsaturated soil. J. Geotech. Geoenviron. Eng. 2006, 132, 131–142. [Google Scholar] [CrossRef]
Figure 1. Study area and geological formation of Singapore.
Sustainability 17 01803 g001
Figure 2. Field monitoring layout of the residual slope at Buangkok Link.
Sustainability 17 01803 g002
Figure 3. Laboratory experiment of drying and wetting soil–water characteristic curve of Buangkok Link soil.
Sustainability 17 01803 g003
Figure 4. Estimated drying and wetting pore size distribution of Buangkok Link soil.
Sustainability 17 01803 g004
Figure 5. Daily and cumulative daily rainfall in Buangkok Link between 1 October 2019 and 4 April 2020.
Sustainability 17 01803 g005
Figure 6. Rainfall distribution with soil volumetric water content between October 2019 and April 2020 at the crest of the Buangkok Link slope.
Sustainability 17 01803 g006
Figure 7. Rainfall distribution with soil volumetric water content between October 2019 and April 2020 at the toe of the Buangkok Link slope.
Sustainability 17 01803 g007
Figure 8. Rainfall distribution with soil suction between 1 October 2019 and 4 April 2020 at the crest of the Buangkok Link slope.
Sustainability 17 01803 g008
Figure 9. Rainfall distribution with soil suction between October 2019 and April 2020 at the toe of the Buangkok Link slope.
Sustainability 17 01803 g009
Figure 10. Variation in soil volumetric water content at the crest of Buangkok Link slope between 2 and 7 January.
Sustainability 17 01803 g010
Figure 11. Variation in soil volumetric water content at the toe of Buangkok Link slope between 2 and 7 January.
Sustainability 17 01803 g011
Figure 12. Variation in soil suction at the crest of Buangkok Link slope between 2 and 7 January.
Sustainability 17 01803 g012
Figure 13. Variation in soil suction at the toe of Buangkok Link slope between 2 and 7 January.
Sustainability 17 01803 g013
Figure 14. Scanning curve of soil–water characteristic curve.
Sustainability 17 01803 g014
Table 1. Index properties of the soil at Buangkok Link.
PropertiesTesting StandardsValue
USCSASTM D2487-17 [38]CL
Gravel (%)ASTM D422-63 [39]4
Sand (%) 45
Silt (%) 17
Clay (%) 34
Liquid Limit, LL (%)ASTM D4318-17e1 [40]46
Plastic Limit, PL (%) 22
Plasticity Index, PI (%) 24
Total density (Mg/m3) 1.91
Water content (%) 24.7
Void ratio 0.65
Saturated Permeability, ks (m/s)ASTM D5084-24 [41] 2.65 × 10⁻⁶
Table 2. Values of fitting parameters for drying soil–water characteristic curve.
ParameterValue
Saturated volumetric water content (θs)0.60
a300
n1.0
m1.3
Air-entry value, ψ a (kPa)40
Residual volumetric water content ( θ r ) 0.12
Residual soil suction, ψ r (kPa)5000
Table 3. Values of fitting parameters for wetting soil–water characteristic curve.
ParameterValue
Saturated volumetric water content (θs)0.30
a5000
n0.4
m3.0
Water entry value, ψ w (kPa)5000
Volumetric water content related to ψ w (m3/m3)0.06
Wetting saturation point, ψ b w (kPa)40
Disclaimer/Publisher’s Note: The statements, opinions and data contained in all publications are solely those of the individual author(s) and contributor(s) and not of MDPI and/or the editor(s). MDPI and/or the editor(s) disclaim responsibility for any injury to people or property resulting from any ideas, methods, instructions or products referred to in the content.

