Article

Sustainable Treatment of Crude Oil-in-Saline Water Emulsion with Licuri (Syagrus coronata) Leaf Fiber

by
Pedro Victor Bomfim Bahia
1,
Guilherme Augusto Ferreira
1,
Artur José Santos Mascarenhas
2,
Fabiana da Silva Castro
2,
Roger Thomas François Fréty
3 and
Rosangela Regia Lima Vidal
1,*
1
Departamento de Físico-Química, Instituto de Química, Campus Universitário de Ondina, Universidade Federal da Bahia, Salvador 40170-115, Bahia, Brazil
2
Laboratório de Catálise e Materiais (Labcat), Departamento de Química Geral e Inorgânica, Instituto de Química, Campus Universitário de Ondina, Universidade Federal da Bahia, Salvador 40170-115, Bahia, Brazil
3
Laboratório de Refino e Tecnologias Limpas (LabRefino/Lateclim), Departamento de Engenharia Química, Instituto de Petróleo e de Pesquisas Energéticas (LITPEG), Universidade Federal do Pernambuco, Recife 50740-540, Pernambuco, Brazil
*
Author to whom correspondence should be addressed.
Sustainability 2025, 17(16), 7188; https://doi.org/10.3390/su17167188
Submission received: 20 June 2025 / Revised: 30 July 2025 / Accepted: 6 August 2025 / Published: 8 August 2025
(This article belongs to the Special Issue Advanced Materials and Processes for Wastewater Treatment)

Abstract

Due to the toxicity of produced water, which is characterized as crude oil-in-water emulsions, strategies are required to decrease its potential hazard before its disposal into the environment. This work employs a raw biosorbent, licuri leaf fiber (LLF), to enable the discharge of produced water emulsions into the sea, following a reduction in oil concentration by sorption to levels below current regulatory limits. LLF with a BET area of 0.07 m2 g−1 was characterized by SEM/EDS, FTIR, and TGA before and after crude oil sorption. The results obtained from batch experiments showed that the sorption capacity increased when oil concentration in the emulsion varied from 20 to 100 mg L−1 and decreased when temperature increased from 300 to 320 K. The pseudo-second-order kinetic model fitted the experimental data for the emulsions with higher oil concentration. The Freundlich model gave the best fit for the sorption isotherm data. The thermodynamic parameters indicated that oil sorption is exothermic, spontaneous, and less random, controlled by physisorption. At 300 K, raw LLF can remove crude oil from emulsions with an oil concentration less than or equal to 100 mg L−1 below the current environmental standards.

1. Introduction

Crude oil production plays a vital role in the economy of oil-producing countries [1,2]. During oil production, large volumes of saline water containing a complex mixture of dissolved and undissolved organic and inorganic substances, called produced water, are obtained together with oil, thus being characterized as an emulsion [3,4]. The volume of produced water increases mainly with the amount of oil production and the age of the well [4,5]. Due to the large volume generated, produced water or oily wastewater needs to be treated before being reused or even discarded into the environment [6,7]. This type of wastewater generally contains different contaminants, such as mineral ions, dispersed oil, grease, organic compounds, and heavy metals, among other contaminants [7,8,9]. Its treatment is necessary since these contaminants are harmful to human health and the environment [4,10].
Due to the toxicity of produced water, many oil-producing countries define disposal limits for this waste into the environment [10,11]. In Brazil, the Brazilian National Environmental Council (CONAMA) and, in the United States, the United States Environmental Protection Agency (USEPA) require that the disposal of produced water must comply with the average monthly content limit of oils and greases in saline water (TOG) of up to 29 mg L−1, with a daily limit of 42 mg L−1 [11,12,13]. However, considering the increased concern regarding environmental pollution, such limits are expected to be reduced due to the increase in oil production and, consequently, the volume of produced water.
Free and larger oil droplets are easily removed during oil–water separation processes. However, the emulsified oil in produced water is challenging to remove as it is made up of tiny droplets that remain suspended in the aqueous phase, being discarded along with the water [13,14]. Asphaltenes, one of the main constituents of crude oil [15], which act as a surfactant, stabilize the tiny droplets, as well as organic acids and phenols, which are water-soluble compounds [13]. The methods commonly used to treat produced water are based on chemical, physical, mechanical, and biological processes [4,10]. Among these, adsorption has been considered a more suitable method to treat oily wastewater because it is simple, efficient, low-cost, does not harm the environment, and is easy to apply [9]. For these reasons, adsorption has been widely used in systems containing wastewater contaminated by crude oil in small quantities [16,17,18,19]. The sorbent material can remove oil from oily water by two simultaneous mechanisms, which are adsorption or absorption, collectively known as sorption. Adsorption occurs on the surface of the adsorbent, and several factors, like the oil viscosity, must be considered. On the other hand, absorption is mainly governed by capillary attraction, in which oil droplets penetrate the pores of the sorbent through capillary forces [1]. Although they can occur at different magnitudes depending on the investigated system, these two processes assist in sorbent–oil interaction.
The sorbent nature is an important parameter to be considered. Based on this, research is being increasingly focused on using biodegradable materials that do not cause harm to the environment, such as lignocellulosic materials. These materials have been widely used as biosorbents in the removal of oily wastewater because they are biodegradable, non-toxic to humans and the environment, recyclable, cheap, easy to acquire, and can have good oil storage capacity [18,20]. The main components of lignocellulosic materials are cellulose, hemicellulose, and lignin. Their amount percentage can vary between 40 and 60%, 20–40%, and 10–24%, respectively, depending on the source and origin of the biomass and climatic conditions [21]. The lignocellulosic biomass interacts with both water and oil since cellulose and hemicellulose are hydrophilic, and lignin is hydrophobic. In addition to lignin, parts of biomass such as leaves have a thin layer of natural wax on their surface [22,23], which are also hydrophobic. In the literature, some statements informed that oil removal efficiency by biomass can be determined by the presence of lignin and wax and the action of capillary forces, but numerical data were not presented [24,25]. Some biomass residues have been evaluated in the treatment of oily wastewater, including pineapple crown [26], barley straw [27], corn cob [28], and cotton linter [25].
There are reports in the literature on the use of various natural sorbent materials to capture spilled and/or emulsified oil from crude oil-contaminated waters (see Table S1 in the Supplementary Material). For example, Al-Najar et al. [29] evaluated the sorption capacity of natural adsorbents, animal bones (ABs), and analytical residues (ARs) for oil removal from water using a batch adsorption process. They evaluated the effects of adsorbent dosage, initial oil concentration, and contact time on the adsorption process at 301 K. The best results were observed at an initial oil concentration of 400 mg L−1, with sorption capacities of 45 and 30 mg g−1, and removal percentages of 94 and 70% for ABs and ARs, respectively. Luftee et al. [30] evaluated the feasibility of using fish scales (FSs) as biosorbents for cleaning oil spills in water bodies. They studied the effects of sorbent weight, initial oil concentration, and pH using a batch system at 298 K. The most expressive result was observed for an initial oil concentration of 400 mg L−1, at pH 7, with a sorption capacity of approximately 28 mg g−1 and a removal percentage of 93%. Silva et al. [25] evaluated the efficiency of cotton linter fiber (CLF) in removing oil from saline oily water. They evaluated the initial oil concentration and temperature in a batch system. The most promising result was observed for an initial oil concentration of approximately 100 mg L−1, with a sorption capacity of 171.23 mg g−1 and a removal percentage of 82% at 300 K.
Licuri (Syagrus Coronata (Martius) Beccari) is a palm tree native to Brazil found in the semi-arid region, mainly in the states of Alagoas, Bahia, Pernambuco, Sergipe, and northern Minas Gerais, with a more significant occurrence in the semi-arid region of Bahia [31]. This culture represents a source of income for the local population, and its cultivation promotes sustainability in the region where it is grown, as all parts of the palm tree (roots, stems, leaves, and fruits) are used. The leaves are used in construction and crafts, and the fruits in human and animal food and in the manufacture of handicrafts, soaps, and oils [32]. Until now, no research has been found in the literature using the licuri leaf to treat produced water.
Based on the above, the main objective of the study was to investigate the sorption of crude oil emulsion in synthetic saline water (SOSW) using licuri leaf fiber (LLF) as sorbing material. For this, low concentrations of crude oil-dispersed simulated seawater were used. Kinetic and equilibrium studies were performed and compared with different theoretical models. Thermodynamic parameters were also estimated after measuring oil sorption at three different temperatures. The equilibrium and kinetic parameters were determined to propose a sorption mechanism. Collectively, the current work indicated the feasibility of using raw licuri leaf fiber (LLF) sorption capacity to allow the discharge of produced water emulsion in the sea after its concentration in oil decreased below the actual regulatory limits.

2. Materials and Methods

2.1. Materials

Licuri palm leaves were collected in Capim Grosso, from the north-eastern region of the Bahia State, Brazil. Crude oil used to prepare the oil-in-saline water emulsions was provided by Petrobras (Sergipe-Alagoas Exploration and Production Operations Unit), Brazil. This oil, with a density of 0.84 g cm−3 and an API grade of 37.3°, is considered a light crude oil. Sodium chloride and calcium chloride salts (Synth, Brazil) and distilled water were used to prepare synthetic saline water. n-hexane (Impex, Brazil) was used to extract the organic phase (crude oil) present in the emulsion. All chemicals were of the highest purity available and used as received without further purification.

2.2. Methods

2.2.1. Preparation of Licuri Leaf Fiber

Licuri leaf is structurally composed by the leaf segment (flexible part) and rachis (hard part). The leaf segment was separated from the rachis, washed with water to remove dust and water-soluble components, and dried under sunlight. The licuri leaf was cut into small pieces to facilitate grinding using a Willey mill with four knives (model LSW5000, Brazil), with a sieve opening of 0.5 mm and a diameter of 2.0 mm. The ground licuri leaf fiber (LLF) was washed again with distilled water and dried under static air in an oven at 60 °C before being used as biosorbent.

2.2.2. Characterization of the LLF

The pH value of the zero-charge point (pHpzc) of LLF was measured using a method described by Lopez-Ramon et al. [33] and Yang et al. [34] and detailed in Silva et al. [25] for cotton linter fiber. Cellulose, hemicellulose, and lignin contents in LLF were obtained using the van Soest method [35,36] in triplicate determinations. Such a method was recalled by Silva et al. [25]. The morphology of LLF and its mineral composition were observed through Scanning Electron Microscopy (SEM) equipped with an Energy Dispersive X-ray spectrometer (EDS) module from OXFORD INSTRUMENTS, using a JEOL, JSM-6610LV model, Tokyo, Japan, after gold metallization. The maximum operating voltage for imaging and EDS analysis was 10 kV. FTIR spectra were recorded for LLF using VERTEX-70 (Bruker, Germany) equipment and an ATR device, before and after oil sorption, and for crude oil in the 4000–400 cm−1 range. TG-DTA curves were obtained with LLF in its original state and after sorption of an emulsion containing 105 mg L−1 crude oil, using a Shimadzu (DTG-60H model, Kyoto, Japan) thermobalance and platinum sample holder. The thermogravimetric curves were obtained with an initial sample mass close to 2 mg, under air flow (50 mL min−1), following a heating program between room temperature and 650 °C, including a plateau at 100 °C and a general heating ramp of 20 °C min−1. Structural and textural experiments of the raw LLF were also performed; the methodologies and results are summarized in the Supplementary Material (see S3.1 and S3.2).

2.2.3. Preparation of Crude Oil in Saline Water Emulsion

The emulsion of crude oil in SOSW was prepared by addition of a known quantity of crude oil in saline water (55 g/L NaCl + CaCl2, with a 10/1 Na/Ca ratio). The SOSW was maintained under constant agitation of 12,000 rpm for 40 min using a TURRAX T25 of IKA, Königswinter, Germany. There was no need to add surfactant to make the emulsion because natural surfactants that are present in crude oil, such as waxes, asphaltenes, resins, and naphthenic acids, helped to stabilize the emulsion [37]. Emulsions with oil content between 19 and 105 mg L−1 in saline water were used in sorption experiments immediately after their preparation. Although long-term stability was not directly assessed, the emulsions are expected to be colloidally stable and homogeneous based on the known interfacial behavior of crude oil components and the standardized preparation method employed [38].

2.2.4. Batch Sorption Experiments

Batch sorption experiments were performed using 0.05 g LLF in 100 mL of SOSW containing various amounts of crude oil under constant agitation (140 rpm) in a horizontal shaker. For kinetic experiments, equilibrium time was defined after a study of the contact time effect between LLF and SOSW from 0.17 to 5 h for two initial concentrations of crude oil (28 and 102 mg L−1) at 310 K. Sorption experiment isotherms were obtained at 300, 310, and 320 K, respectively, for 19 to 105 mg L−1 initial concentrations of crude oil in SOSW, after 4 h of contact. At the end of the previous experiments, the solid sample was filtrated, and 40 mL of the residual liquid SOSW phase was transferred to Falcon tubes. Then, 5 mL of n-hexane was added, and the system was vortex mixed for 4 min. After separation of the aqueous and organic phases, the latter was collected, and its oil concentration was determined by measuring the absorbance at 260 nm in a UV-VIS spectrometer (Rigol Ultra 3560, Japan), with the help of an absorbance vs. crude oil concentration calibration curve previously built. The detailed procedure was given in Silva et al. [25]; all sorption experiments were performed at least in triplicate.
Sorption capacity (qt) in mg g−1 of the fiber for crude oil at t time was estimated using the mass balance equation (Equation (1)), where Ci and Cf (mg L−1) are the initial and final crude oil concentrations in SOSW, before and after sorption, respectively, V (L) is the SOSW volume, and m (g) is the LLF mass. The percentage of crude oil removal in SOSW by the fiber was calculated by Equation (2). Sorption capacity and removal percentage at equilibrium conditions were also obtained using Equations (1) and (2), in which qt was substituted by qe, and Cf by the oil concentration at equilibrium (Ce).
q t = C i C f V m
O i l   r e m o v a l = C i C f C i × 100  

2.2.5. Kinetic and Isotherm Models

Kinetic pseudo-first-order (PFO) and pseudo-second-order (PSO) models were applied to experimental data to better understand the nature of the interactions between the FLL and the crude oil present in the emulsion. Kinetic parameters for the PFO model (kinetic constant kt in h−1 and sorption capacity of crude oil in SOSW on LLF (qmax,calc) in mg g−1) and for the PSO model (kinetic constant k2 in g mg−1 h−1 and qmax,calc in mg g−1) were calculated from the linear transformations presented in Equations (3) and (4), respectively.
log q m a x q t = l o g q m a x , c a l c k 1 t 2.303
t q t = 1 k 2 q m a x , c a l c 2 + t q m a x , c a l c  
Sorption isotherm models of Langmuir, Temkin, and Freundlich were also applied to experimental data; the sorption parameters were obtained using the linear form of these isotherms recalled in Equations (5)–(7), respectively. In Equation (5), qo (mg g−1) is the Langmuir constant, and b (L mg−1) is the maximum sorption capacity [39]. In Equation (6), KF (mg g−1) (L mg−1)1/n is the Freundlich constant, and n (dimensionless number) is the sorption intensity [39,40,41]. In Equation (7), KT (L mg−1) is the Temkin constant associated with the chemical bond, and BT (dimensionless number) is the parameter issued from the relation BT = RT/bT, where bT is associated with the sorption heat (J mol−1), R is the universal gas constant (J mol−1 K−1), and T is the absolute temperature (K) [37]. In these equations, Ce (mg L−1) is the equilibrium concentration of crude oil in SOSW after sorption by LLF, and qe (mg g−1) is the sorption capacity at equilibrium of crude oil per unit mass of LLF.
C e q e = 1 q o b + C e q o
l n q e = l n K F + 1 n l n C e
q e = B T ln K T + B T l n C e  

3. Results and Discussion

3.1. Characterization of LLF

3.1.1. Zero Charge Point Analysis

The sorption of cations on surfaces is higher when the solution pH is higher than the pHpzc, whereas the sorption of anions is better when the solution pH is lower than the pHpzc [42]. The measure of the zero-charge point of LLF allowed us to estimate qualitatively the type of charge on the fiber surface as a function of pH. Figure 1 presents the final pH of the aqueous phase as a function of the initial pH after contact with the LLF. Figure 1 shows that the pH at the zero-charge point is 6.68. This value can be considered the PZC and suggests that, at this pH, the surface of the LLF presents an equivalent number of positive and negative charges. As the pH of the prepared SOSW is 6.6 ± 0.2, Figure 1 indicates that the pH will not be an important parameter for the present sorption studies. This is in line with previous reports for other types of biomasses [27,28]. Usually, cellulosic materials have a pHpzc close to 6 due to the presence of hydroxyl groups (-OH) on their surface. These hydroxyl groups can both accept and donate protons, making them amphoteric. At around pH 6, the surface hydroxyl groups of cellulose are partially protonated, leading to a balance between positive and negative charges on the surface. This results in a pHpzc near neutral pH, as the material neither attracts cations nor anions preferentially. The determination of the zero-charge point (Figure 1) suggests a wide pH range that does not alter the sorption property of our system.

3.1.2. Compositional Analysis

The works of Choi et al. [43] and Ansari et al. [44] showed that the sorption capacity of fibers can be associated with their composition. The composition of LLF was quantified by the van Soest method, and the present LLF is composed of 44.8 ± 0.6 % cellulose, 29.0% ± 0.8 % hemicellulose, and 11.0 ± 0.2 % lignin. The LLF also shows 84.8 ± 0.4 % FDN (fraction of fiber not dissolved in a neutral solvent, such as cellulose, hemicellulose, and lignin) and 55.8 ± 0.4% FDA (fraction of fiber not dissolved in an acidic medium, such as cellulose and lignin). Then, cellulose and lignin contents are close to 56%, representing more than half of LLF composition.

3.1.3. SEM and EDS Analysis

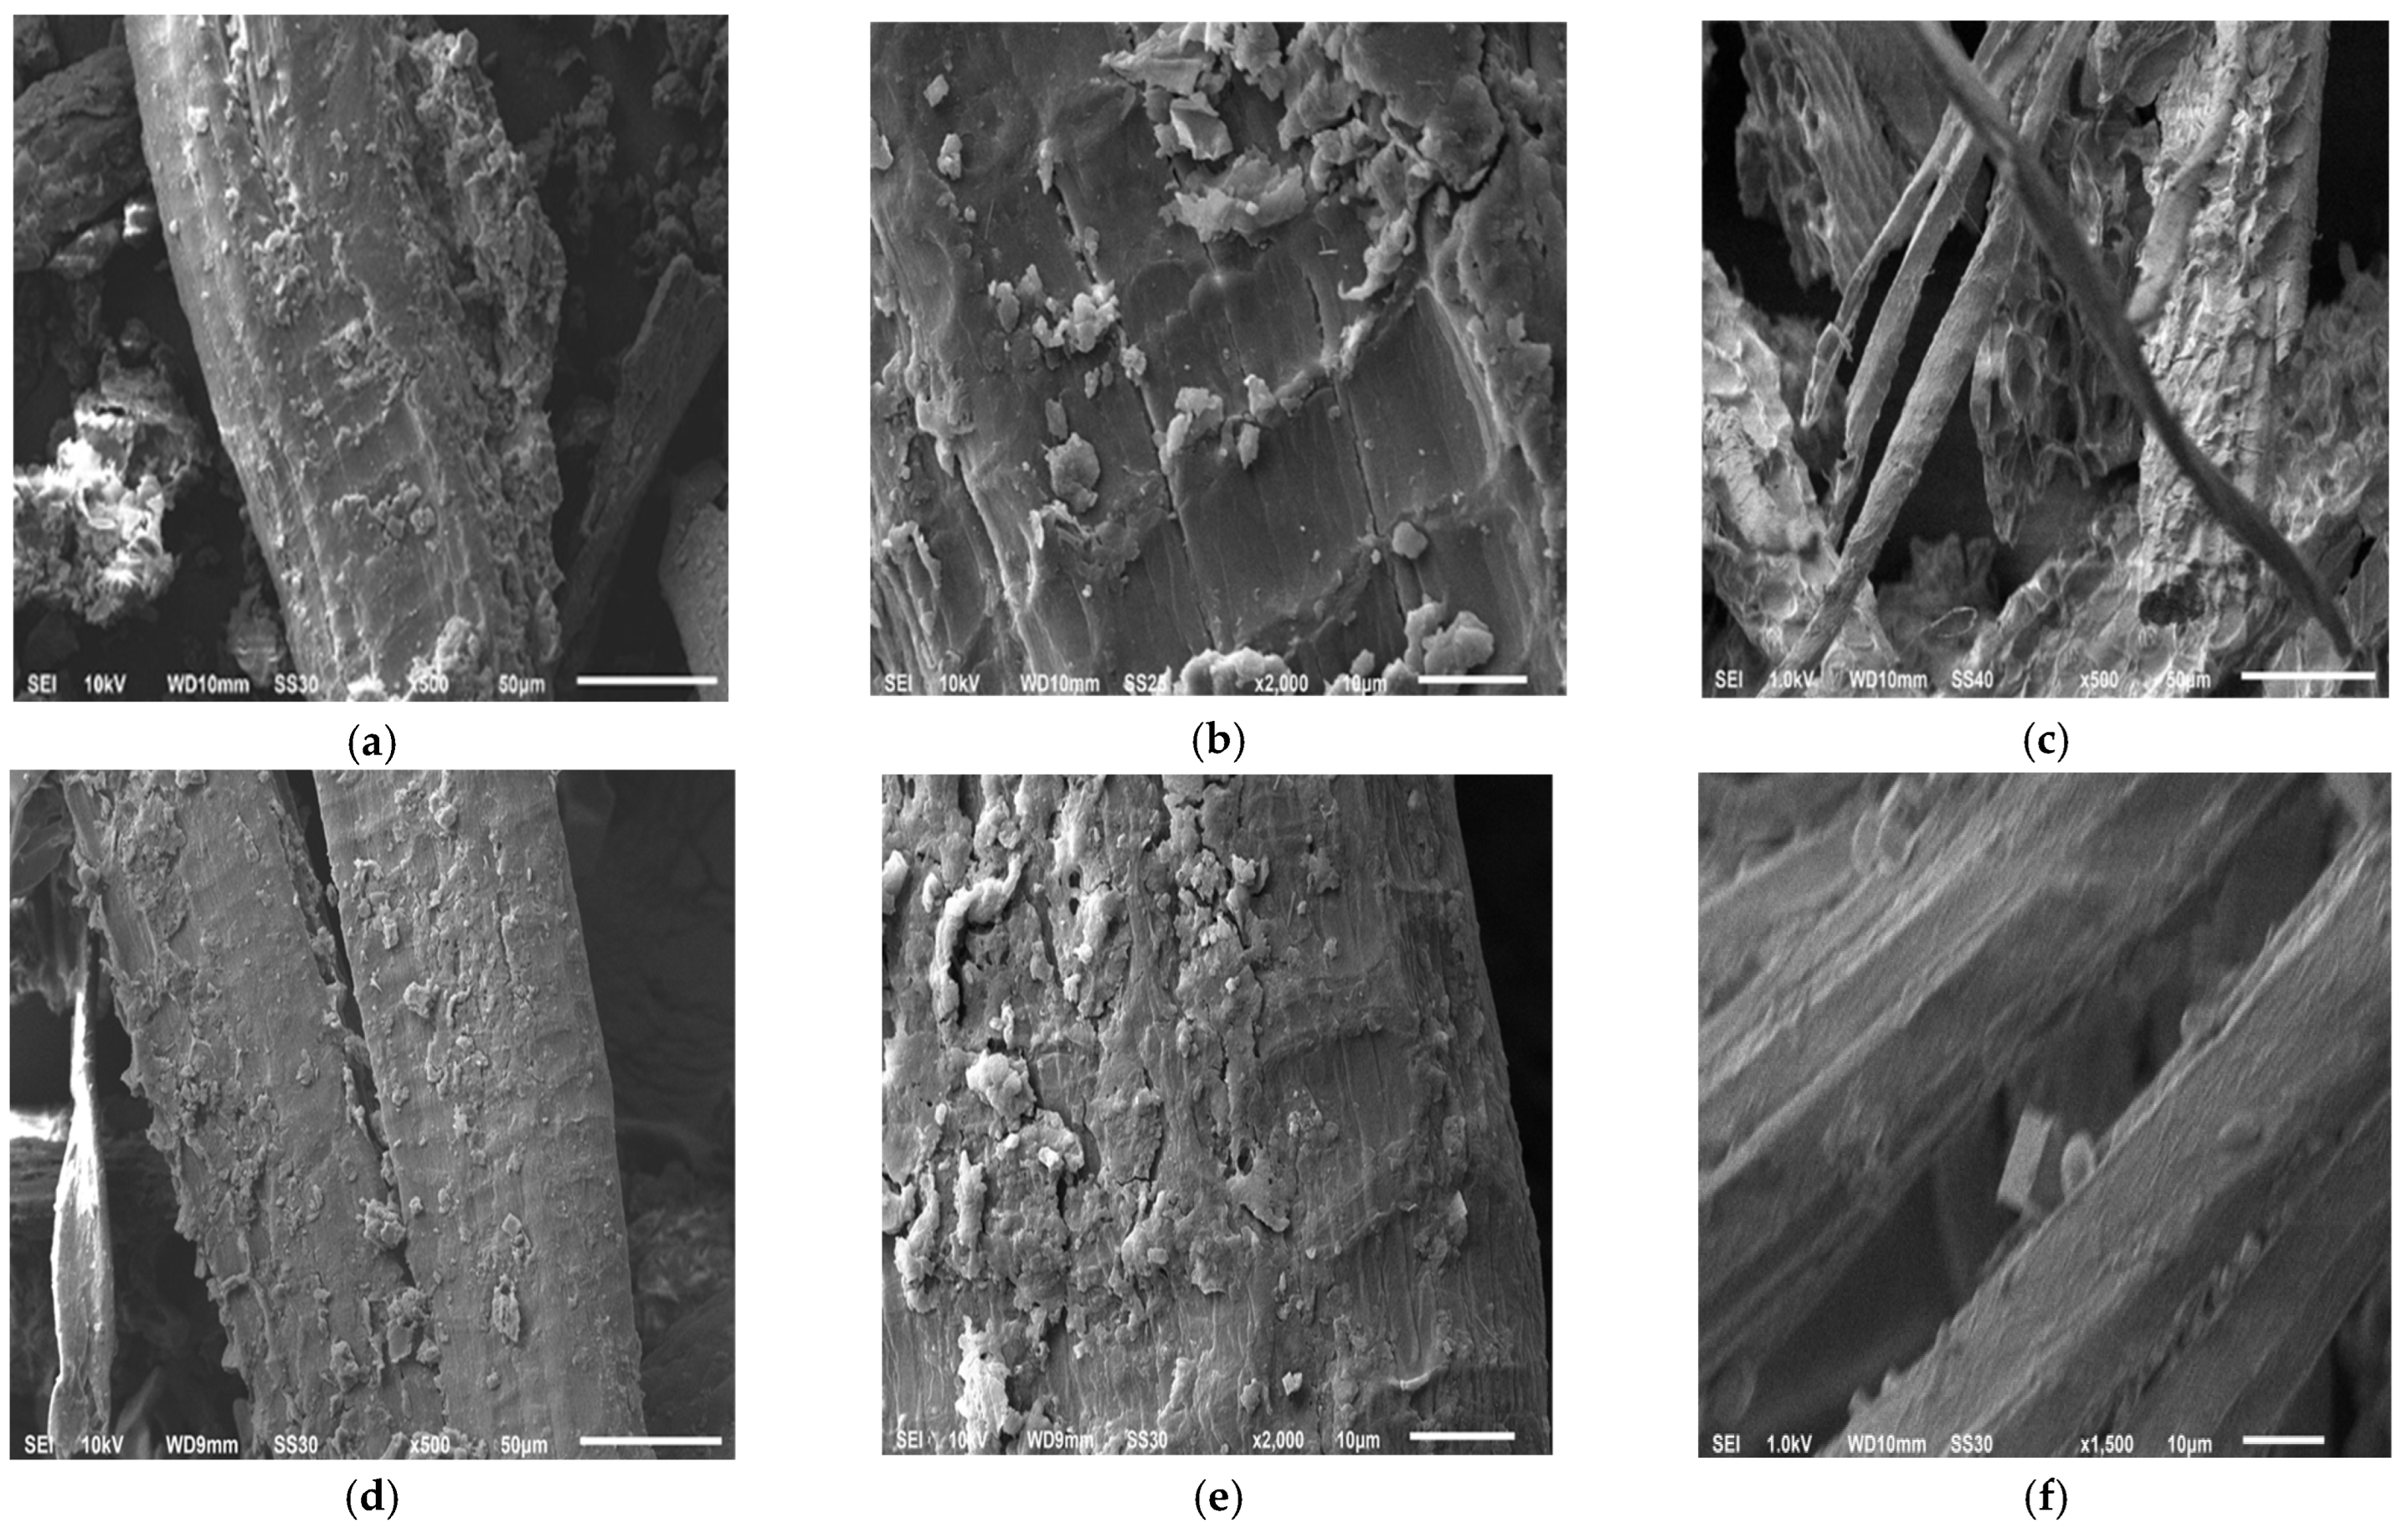
The surface morphology of LLF is shown in Figure 2, and textural data are presented in the Supplementary Material (see S3.2), showing that the BET area (0.07 m2 g−1) and pore volume (0.0015 cm3 g−1) are quite low. Such poor textural properties are in line with the results of previous works with other biomasses [45,46,47].
The initial fiber appears in Figure 2 as a material presenting a quite heterogeneous surface habitus, with many irregularities possibly due to biomass micro fragments and some fine longitudinal fractures, both situations probably resulting from mechanical grinding (Figure 2a,b). A limited number of holes with diameters of 1 to 3 microns and large cavities is also observed. In some places, neighbor cavities show sequential location and parallel organization along the fiber length; these cavities have mouth diameters in the range of 5 to 50 microns, and depths with similar sizes (Figure 2c). These results agree with the work of Lins et al. [48]. Along the LLF length, subsurface organization is also suggested. Then, LLF presents itself as a highly macro-porous material. After sorption of an emulsion with 20 mg L−1 crude oil in saline water, the general habitus is not changed (See Figure 2d) except for the fact that some highly faceted irregularities are observed (Figure 2e,f) with lateral sizes ranging from 2 to 8 microns. EDS results are summarized in Table 1.
Although these results were not obtained in a statistical way (only two SEM images were used), some points need comments: (i) Carbon (C) content is decreased after sorption, whereas the fiber has been in contact with crude oil, leading to a theoretical increase in C. This was not observed experimentally and one possible explanation is that, after sorption, other materials exempt of C, such as inorganic ions, can be sorbed in the fiber, thus decreasing the contribution of C to the overall composition. (ii) The decrease in potassium (K) content could result from an exchange between this element and Na and/or Ca especially, due to their quite high concentration in the emulsion. (iii) The variations in oxygen (O) content are within the experimental error. (iv) The contents of Ca, Na, and specially Cl increased after emulsion sorption: this means that during emulsion sorption, the ions resulting from dissociation of CaCl2 and NaCl in aqueous medium can also interact with the fiber surface and, after simple drying, generate solid salt deposits on the fiber. Therefore, the highly faceted structures observed in Figure 2e,f can be attributed to crystals of NaCl and CaCl2 located onto the external fiber surface.
The EDS results then suggest that during sorption of SOSW, not only oil but also soluble salts of saline water interact with the LLF, probably in a competitive way.

3.1.4. FTIR Analysis

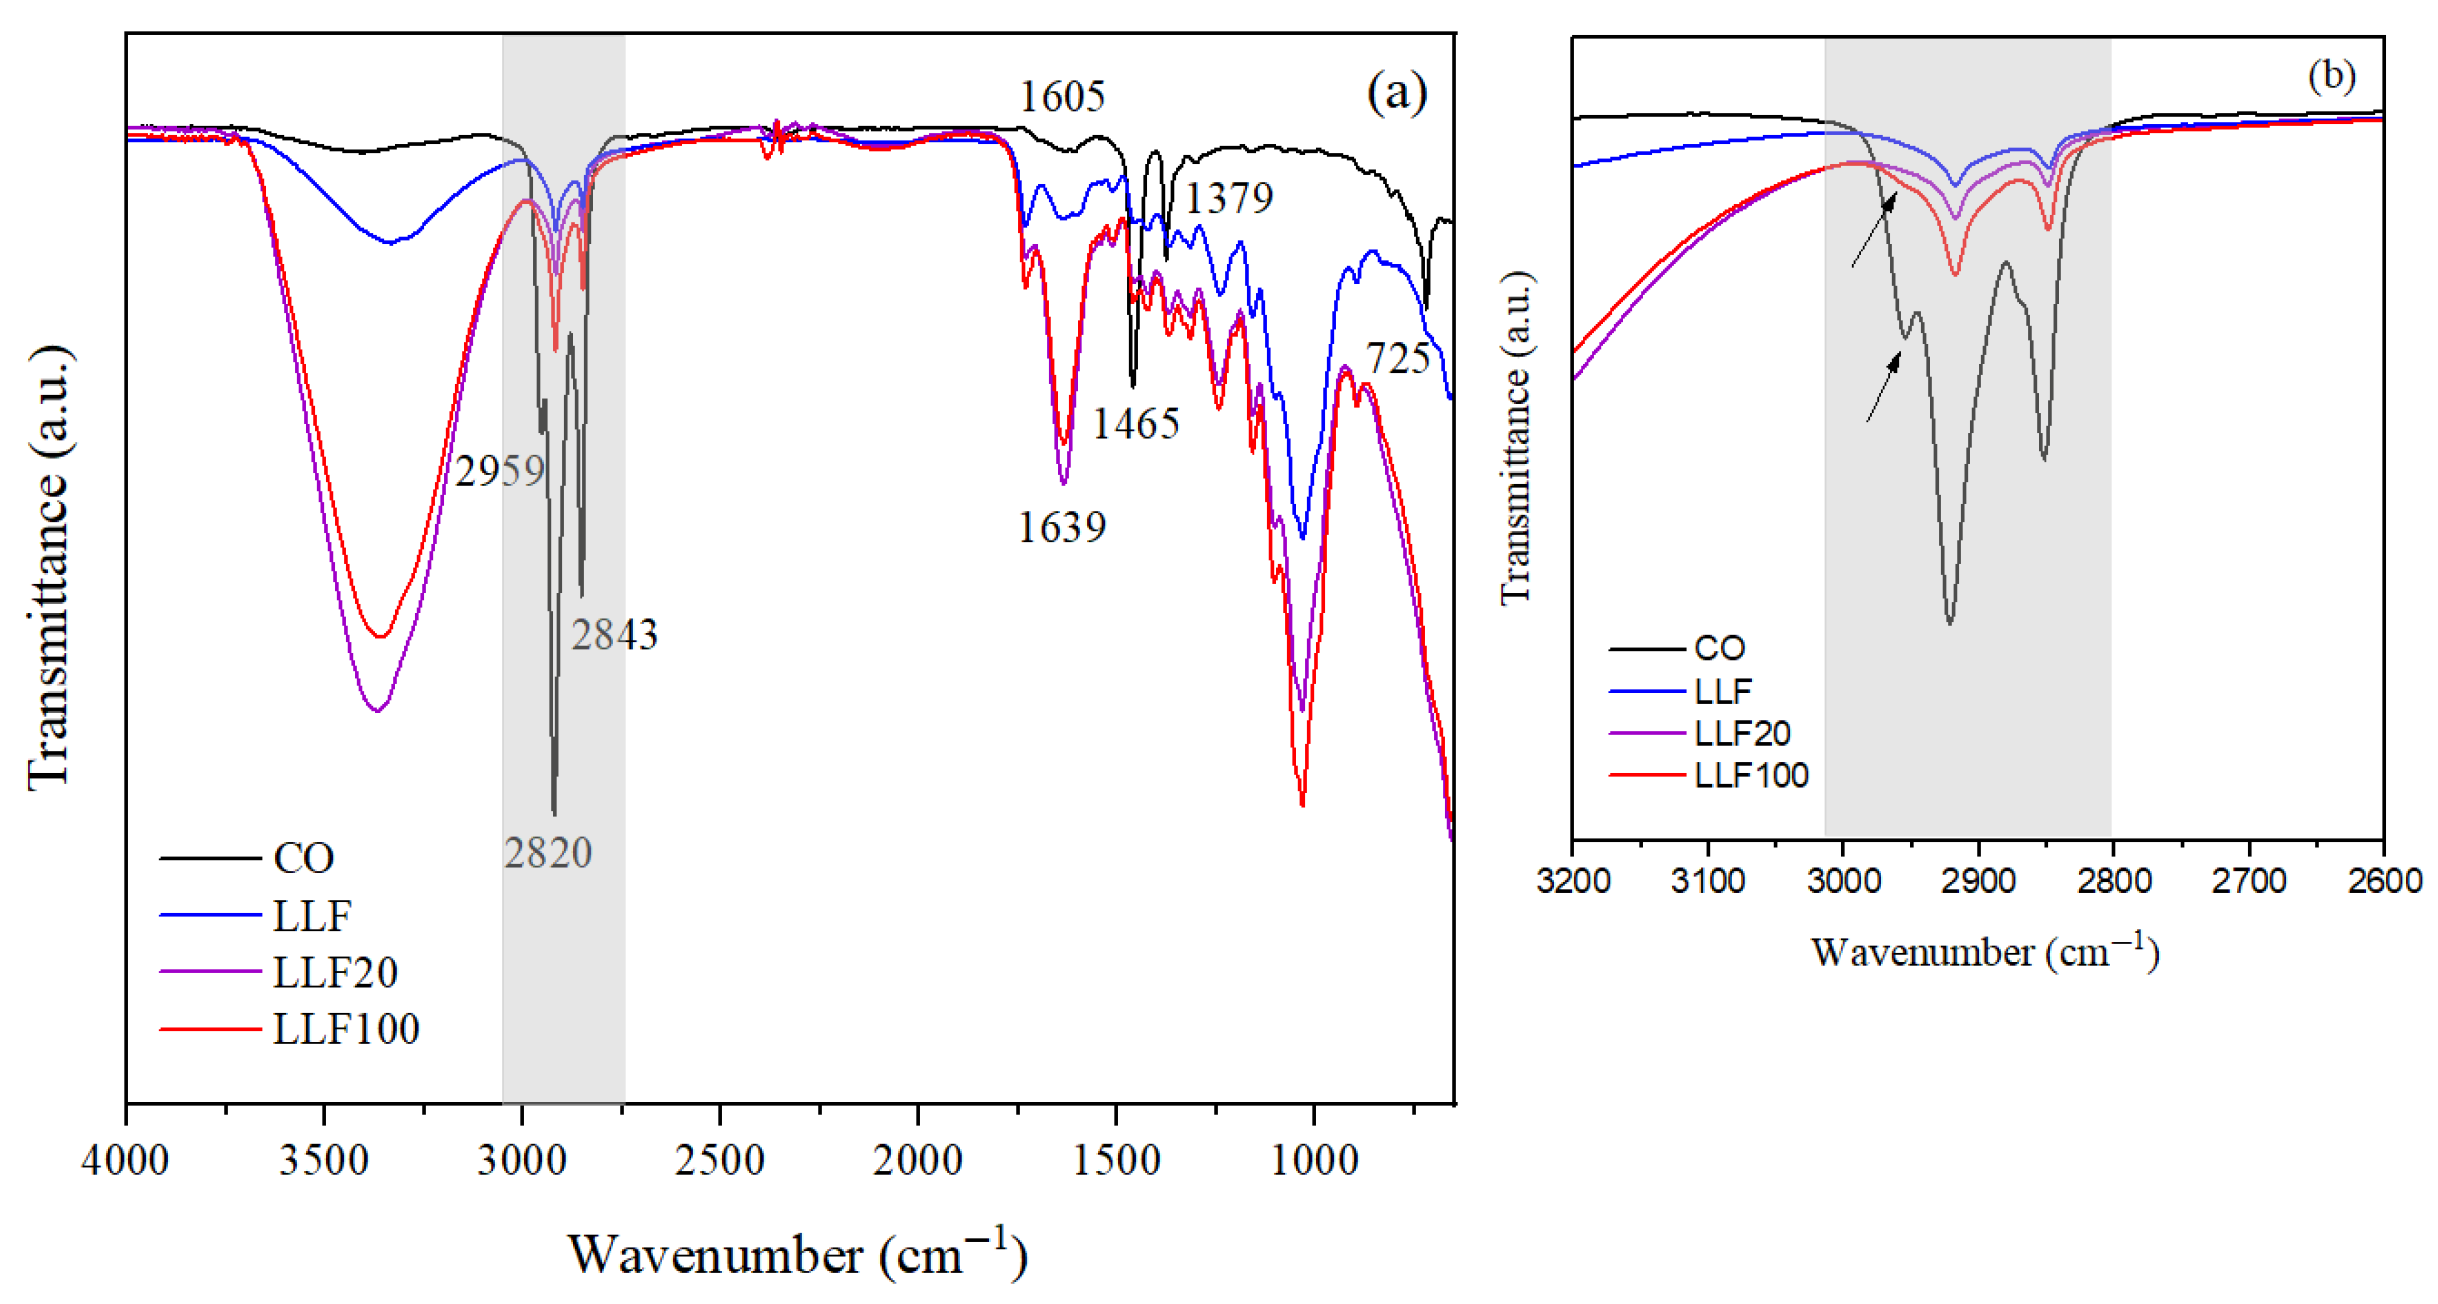
The ATR-FTIR results are presented in Figure 3, which shows the spectrum of crude oil (CO) and the spectra of LLF before and after SOSW sorption. In the spectrum of crude oil, one could observe bands at 2920 cm−1 and 2843 cm−1 due to the asymmetric and symmetric stretching of C-H bonds in the -CH2 groups present in the hydrocarbon chains. At 2959 cm−1, it is possible to distinguish a band associated with the stretching of -CH3 groups. The absorption band at 1465 cm−1 is associated both with the stretching of C=C and asymmetric deformation of C-CH3 groups, while symmetric deformation appears at 1379 cm−1 [49]. The band at 725 cm−1 could be due to the deformation of C-H bonds in aromatic species present in crude oil [50]. These bands can be attributed to the presence of asphaltenes in the oil. It is important to mention that the broad band at 1605 cm−1 could be due the stretching C=C [51,52], but the contribution of the deformation of H2O that appears at 1630 cm−1 cannot be discarded. The broad but weak band at ~3500 cm−1 could be due to the OH stretching of contaminant water.
In the case of the LLF spectrum, before sorption, a band at 3369 cm−1 is characteristic of the O-H stretching of hydroxyl groups present in the cellulose [53]. The bands at 2850 cm−1 and 2920 cm−1 are partly due to the stretching vibration of the C-H bond of CH2-groups, which coexist in cellulose and hemicellulose [54]. The band at 1639 cm−1 can be attributed to the O-H bending of absorbed water [53,55]. The band at 1242 cm−1 corresponds to the stretching of C-O-C bonds of ether associated with lignin. The band at 1379 cm−1 is generally observed in crystalline cellulose and is attributed to the angular vibration of C-O-H groups. The band at 1037 cm−1 is due to xylans present in hemicellulose, which are essential for establishing strong interactions with cellulose. The band close to 890 cm−1 is due to β-glycosidic bonds present in both cellulose and hemicellulose [56].
After the sorption process, remarkable differences are seen in the spectra of LLF. The 3300 cm−1 and 1639 cm−1 bands attributed to O-H vibrations become more intense after sorption of SOSW (LLF20 and LLF100), suggesting that water is also sorbed along with the oil. Furthermore, the intensity of the bands at 2854 cm−1 and 2922 cm−1 due to the stretching vibration of the C-H bond of CH2- groups is increased as a result of the addition of crude oil -CH2 species to the pre-existing species in the LLF. A small shoulder is also observed at 2959 cm−1, attributed to the stretching of the -CH3 groups of C=O, only in the sample with the highest oil concentration (LLF100) (Figure 3b), due to the increase in oil in the emulsion.
The intensification of the band at 1639 cm−1 in LLF20 and LLF100 indicates the formation of a modified interface between the fiber and the oil, in which specific physical or chemical interactions are occurring, possibly involving the reorganization of water molecules or the rearrangement of fiber components at the surface, thus changing the chemical neighborhood of the functional groups involved. A similar trend is seen for the bands located at 1242, 1037, and 897 cm−1. The increase in intensity of these bands confirms the presence of crude oil in LLF after emulsion sorption. Then, the ATR-FTIR results show that during crude oil emulsion sorption, LLF will sorb both crude oil and water, probably in a competitive situation. To summarize, the preceding characterizations show that after SOSW sorption, oil, water, and Na/Ca are present on the surface of licuri leaf fibers.

3.1.5. TGA and DTA Analysis

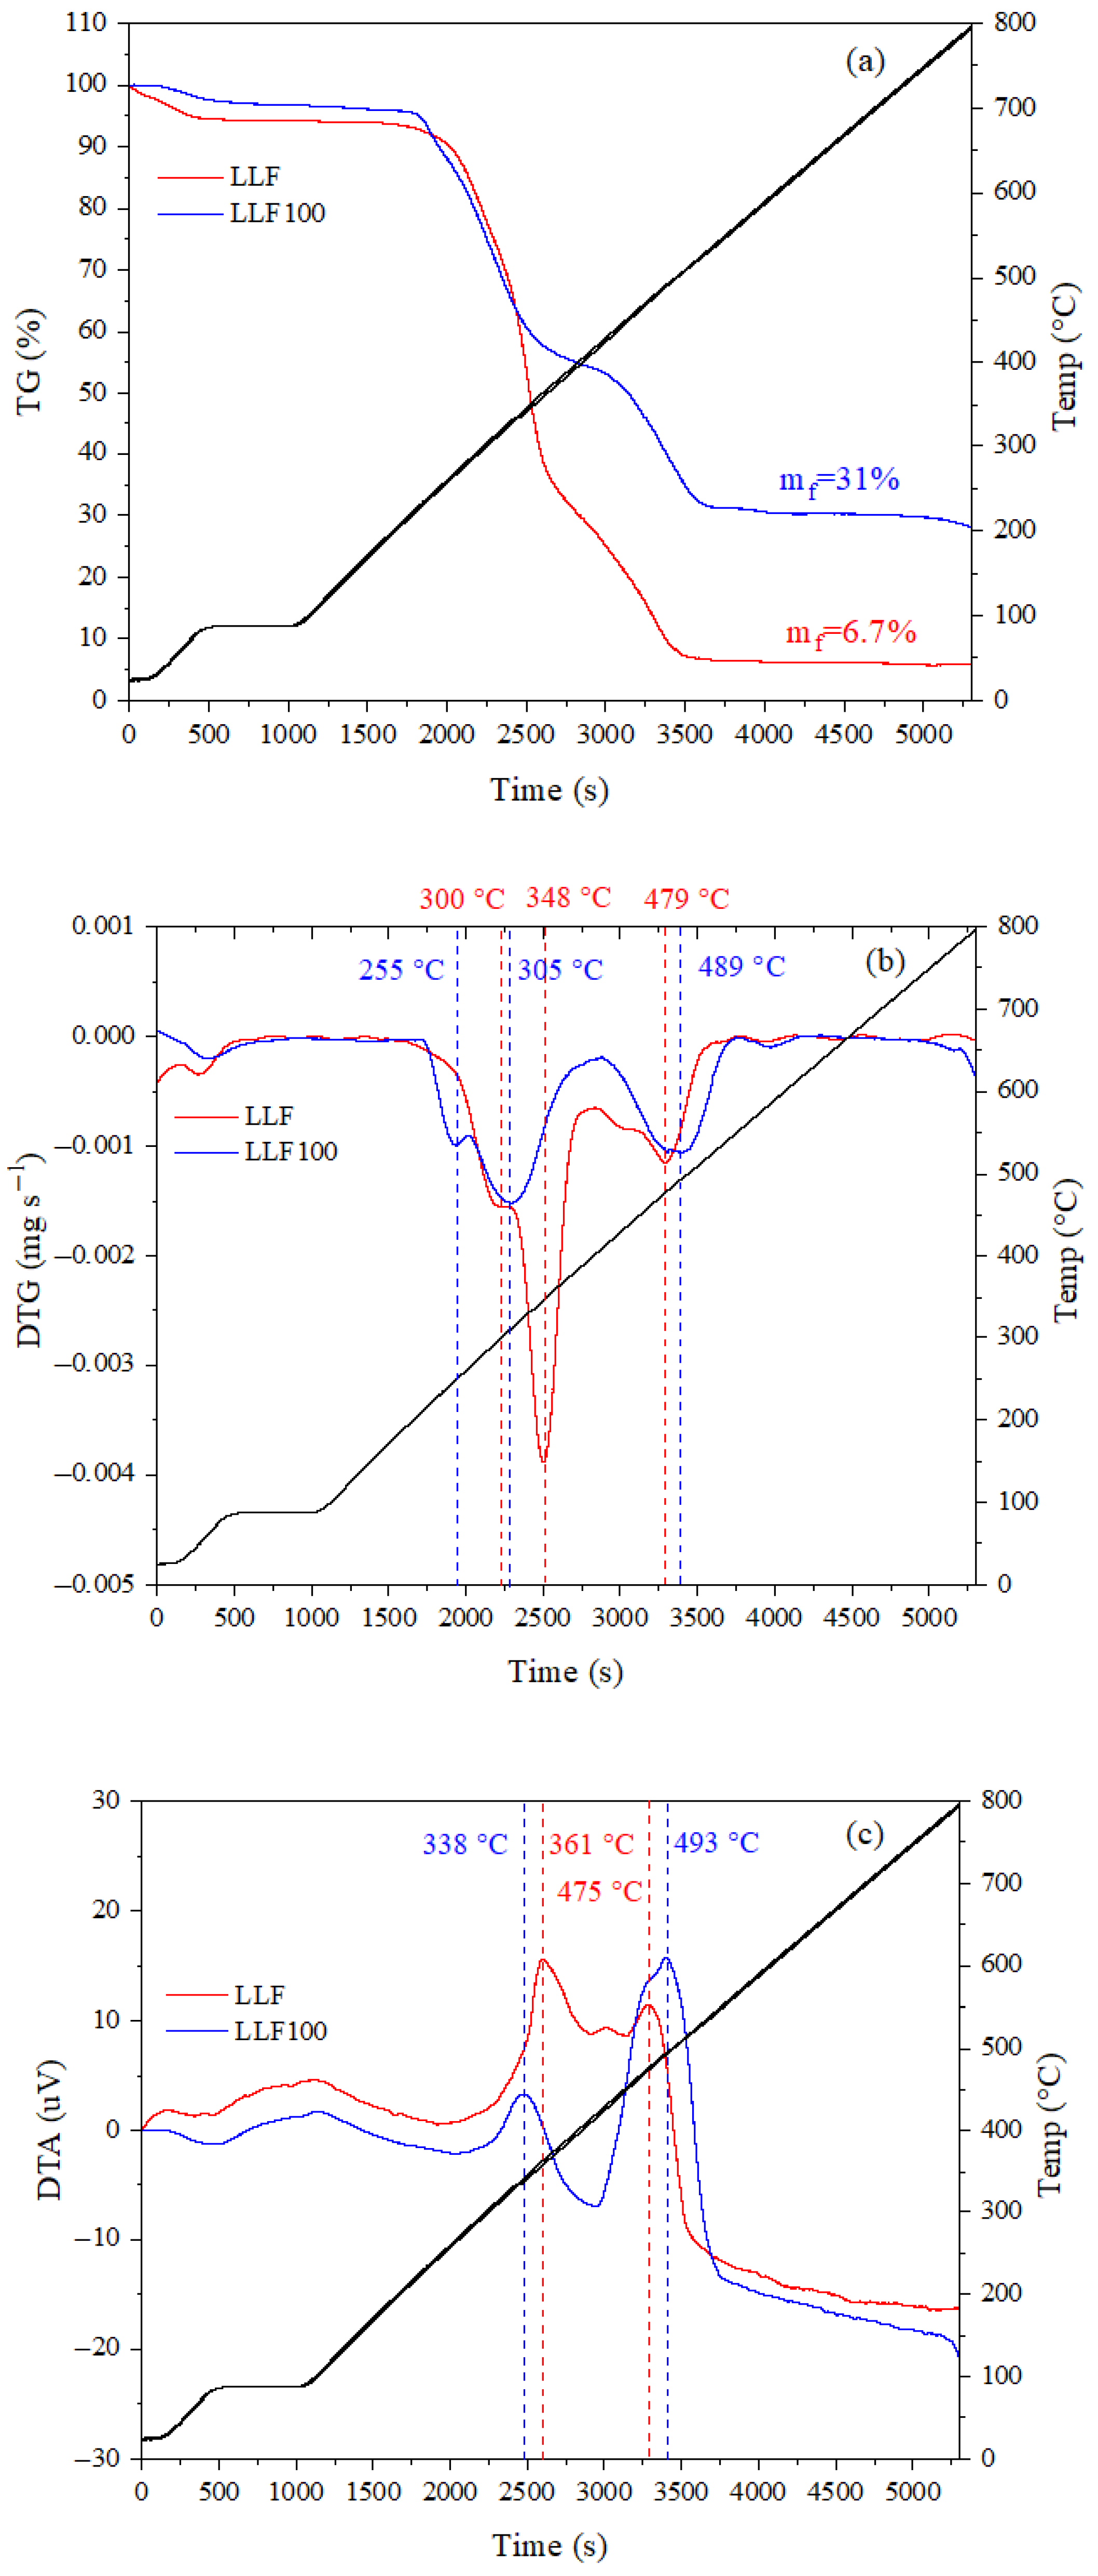
Figure 4a–c presents the mass percentage of the initial sample mass, the DTG transformation of TGA expressed in mg s−1, the DTA profile expressed in µV, and the temperature ramp (black curves) vs. time in sec. The two samples tested were initial licuri fiber (red curves) after washing, grinding, and drying (60 °C in static air oven) and the same licuri sample after sorption of crude oil (100 mg L−1) emulsion in a 40 g L−1 saline water solution (blue curves). Both samples were stored in Eppendorf vials in a fridge maintained at 4 °C, before TGA experiments.
Figure 4a shows the results obtained with the starting licuri fiber, and it is possible to note that during the first step (up to 100 °C), a 6.6% mass loss was observed, attributed to dehydration and confirmed by the endothermic curve in Figure 4c. Then, starting at around 210 °C, an important mass loss is observed, ending at ca. 510 °C. At this temperature, a 6.7% residual mass was noted and attributed to ash remaining after biomass combustion. The huge mass loss between 210 and 510 °C included 3 steps (better seen in the DTG trace of Figure 4b), attributed to devolatilization/combustion of the main constituents of licuri fiber, i.e., hemicellulose, cellulose, and lignin, respectively, as previously seen in other lignocellulosic materials [57]. The DTG peaks associated with these three main steps are located at 300, 348, and 479 °C, respectively. When looking at the DTA trace, two main exothermic peaks are observed, at 361 and close to 480 °C. Whereas the peak at 480 °C corresponds well with the DTG peak observed in the same temperature range, indicating that these peaks correspond to the same oxidation event (probably final carbon combustion from lignin and cellulose), the DTA peak at 361 °C is retarded by 13 °C to the low-temperature DTG phenomenon. This difference suggests that during the low-temperature steps of TG, more than two phenomena occurred: at lower temperatures, decomposition of hemicellulose and cellulose occurred before their autoxidation or initial combustion. Similar phenomena, although less intense, were observed during the TGA of microalgae [58] lacking hemicellulose and cellulose but rich in other oxygen, hydrogen, and carbon species.
After sorption of crude oil emulsion on LLF, the TG trace (blue curve) presents mainly three consecutive phenomena: the low-temperature one is due to dehydration, and is associated with a small endotherm in DTA with a maximum close to 100 °C; the second important mass loss occurs between 210 and 400 °C and is associated with two DTG steps (peak maximum at ca. 255 and 305 °C, respectively); and the third mass loss appeared between 400 and 540 °C. This last mass loss event is linked with a simultaneous DTG peak and DTA exotherm close to 480 °C. The final mass loss corresponds to 68.8% of the initial mass and the remaining mass is close to 31% of the original sample mass. As it is impossible to attribute the remaining mass only to LLF and is difficult to attribute this remaining mass to crude oil residues in a high-temperature oxidizing atmosphere, the more probable reason for such a residual mass is the presence of the salts (NaCl and CaCl2) in the water of the crude oil emulsion, summed up to licuri ash. Such a hypothesis confirms that during crude oil sorption, combined with competition between oil and water for sorption sites, dissolved salts also compete for licuri surface sites, as suggested from SEM/EDS results.
Comparing mass loss values, it appears that the main mass losses represent around 73% and 63% of the total mass loss of licuri, free of water and residues, before and after crude oil emulsion sorption, respectively; this means that the main mass loss is 27 and 37% for licuri, before and after oil contamination, respectively. Then, the second main mass loss is increased after oil sorption, and this increase must be essentially due to partial or total combustion of the sorbed oil between 400 and 540 °C in the case of licuri after oil sorption; this interpretation is supported by the huge exotherm shown in the DTA trace, compared to the rather modest exotherm seen in the absence of sorbed oil.
Then, TGA measurements confirm the presence of sorbed oil and saline water residues after contact between licuri fiber and crude oil emulsion in model sea water, followed by sample drying. With the hypothesis that the increase in mass loss during the high-temperature event is due to sorbed oil, the increase from 27 to 37% agrees well with the value deduced from isotherm measurements (see Section 3.2.3), showing that during sorption at 310 K with a 105 mg L−1 crude oil emulsion in saline water, the oil sorbed at equilibrium qe was in the order of 0.10 g g−1 of LLF.

3.2. Batch Experiments

3.2.1. Sorption Kinetics

Equilibrium time was estimated using the sorption kinetics of crude oil in a SOSW medium by LLF. Figure 5a,b show, for two initial concentrations of crude oil (Ci = 28 and 102 mg L−1) in SOSW, the oil sorption capacity (qt) and the removal percentage of crude oil (COR), respectively, for a 0.5 g L−1 dosage of LLF, a 140 rpm rotation velocity at 310 K, and a pH value in SOSW of 6.6 ± 0.2. As expected, the qt value increased when the contact time increased from 0.17 up to 5 h and with an increase in Ci in the emulsion [26]. For the LLF-SOSW system, the equilibrium time was reached after 0.5 h of contact for Ci = 28 mg L−1 and after around 3 h for Ci = 102 mg L−1. This result shows that kinetic equilibrium is reached more quickly for the lowest Ci in the emulsion. At the equilibrium state, for the lowest Ci, qt was around 25 mg g−1 with COR close to 41%, while for the highest Ci value, qt was close to 91 mg g−1 with COR of 45% (see Figure 5a,b, respectively). This result shows an increase of around 3.64 times in the qt value when Ci increased from 28 to 102 mg L−1.
However, there is no significant difference in the COR percentage value, indicating that no matter the Ci value in the emulsion, the FFL captures at most 45% of the oil present in the aqueous phase. The plateau observed in these curves is associated with the saturation of the sorption sites present in the fiber for each experimental condition (Figure 5a). The results suggest that saturation occurs faster for the smaller Ci in the emulsion. In addition, the qt value in the equilibrium was higher for the higher Ci in the emulsion because the amount of oil increases with Ci in the emulsion, increasing the probability of oily substances being sorbed by the fiber [59].

3.2.2. Model Kinetics

The pseudo-first-order (PFO) and pseudo-second-order (PSO) sorption kinetics models from the experimental data were used to evaluate the kinetic parameters of crude oil sorption in SOSW by LLF. Table 2 shows the sorption parameters for LLF in SOSW with initial concentrations of 28 and 102 mg L−1.
It is possible to observe that for Ci of 28 mg L−1, the value of qmax,cal from the PSO model was very close to the experimental data, attained a higher correlation (R2 = 0.9971), and showed a weak correlation (R2 = 0.2726) for the PFO model. These results indicate that the PFO model is not suitable for describing oil sorption by LLF when sorption equilibrium is observed in the first minutes of contact, as was observed for Ci = 28 mg L−1 (Figure 5). This behavior was confirmed by observing kinetic data for three different Ci, shown in Figures S3 and S4 in the Supplementary Material. It was also observed that, for the lowest concentration, the model that best fitted the experimental data was the PSO model. However, FTIR data (Figure 3) have not shown polar groups in the crude oil sample, suggesting that this result could be due to the interference of simultaneous adsorption of cations and anions from SOSW in the charged sites of LLF, as demonstrated by pHPZC measurements (Figure 1) and SEM images (Figure 2).
With the increase in Ci from 28 to 102 mg L−1 of crude oil in SOSW, the calculated value of qmax of 107.10 mg g−1 by the PFO model was closer to the experimental one (91.03 mg g−1) and with a higher R2 value (0.9570) when compared to the PSO model (qmax,cal = 114.94 mg g−1; R2 = 0.9173). This result suggests that physical adsorption was dominant for crude oil sorption in LLF at this condition. In physical adsorption, nonpolar oil molecules adhere via van der Waals interactions over a surface area due to macropores [60], which is in better accordance considering the composition of crude oil used in the current study.

3.2.3. Sorption Isotherm

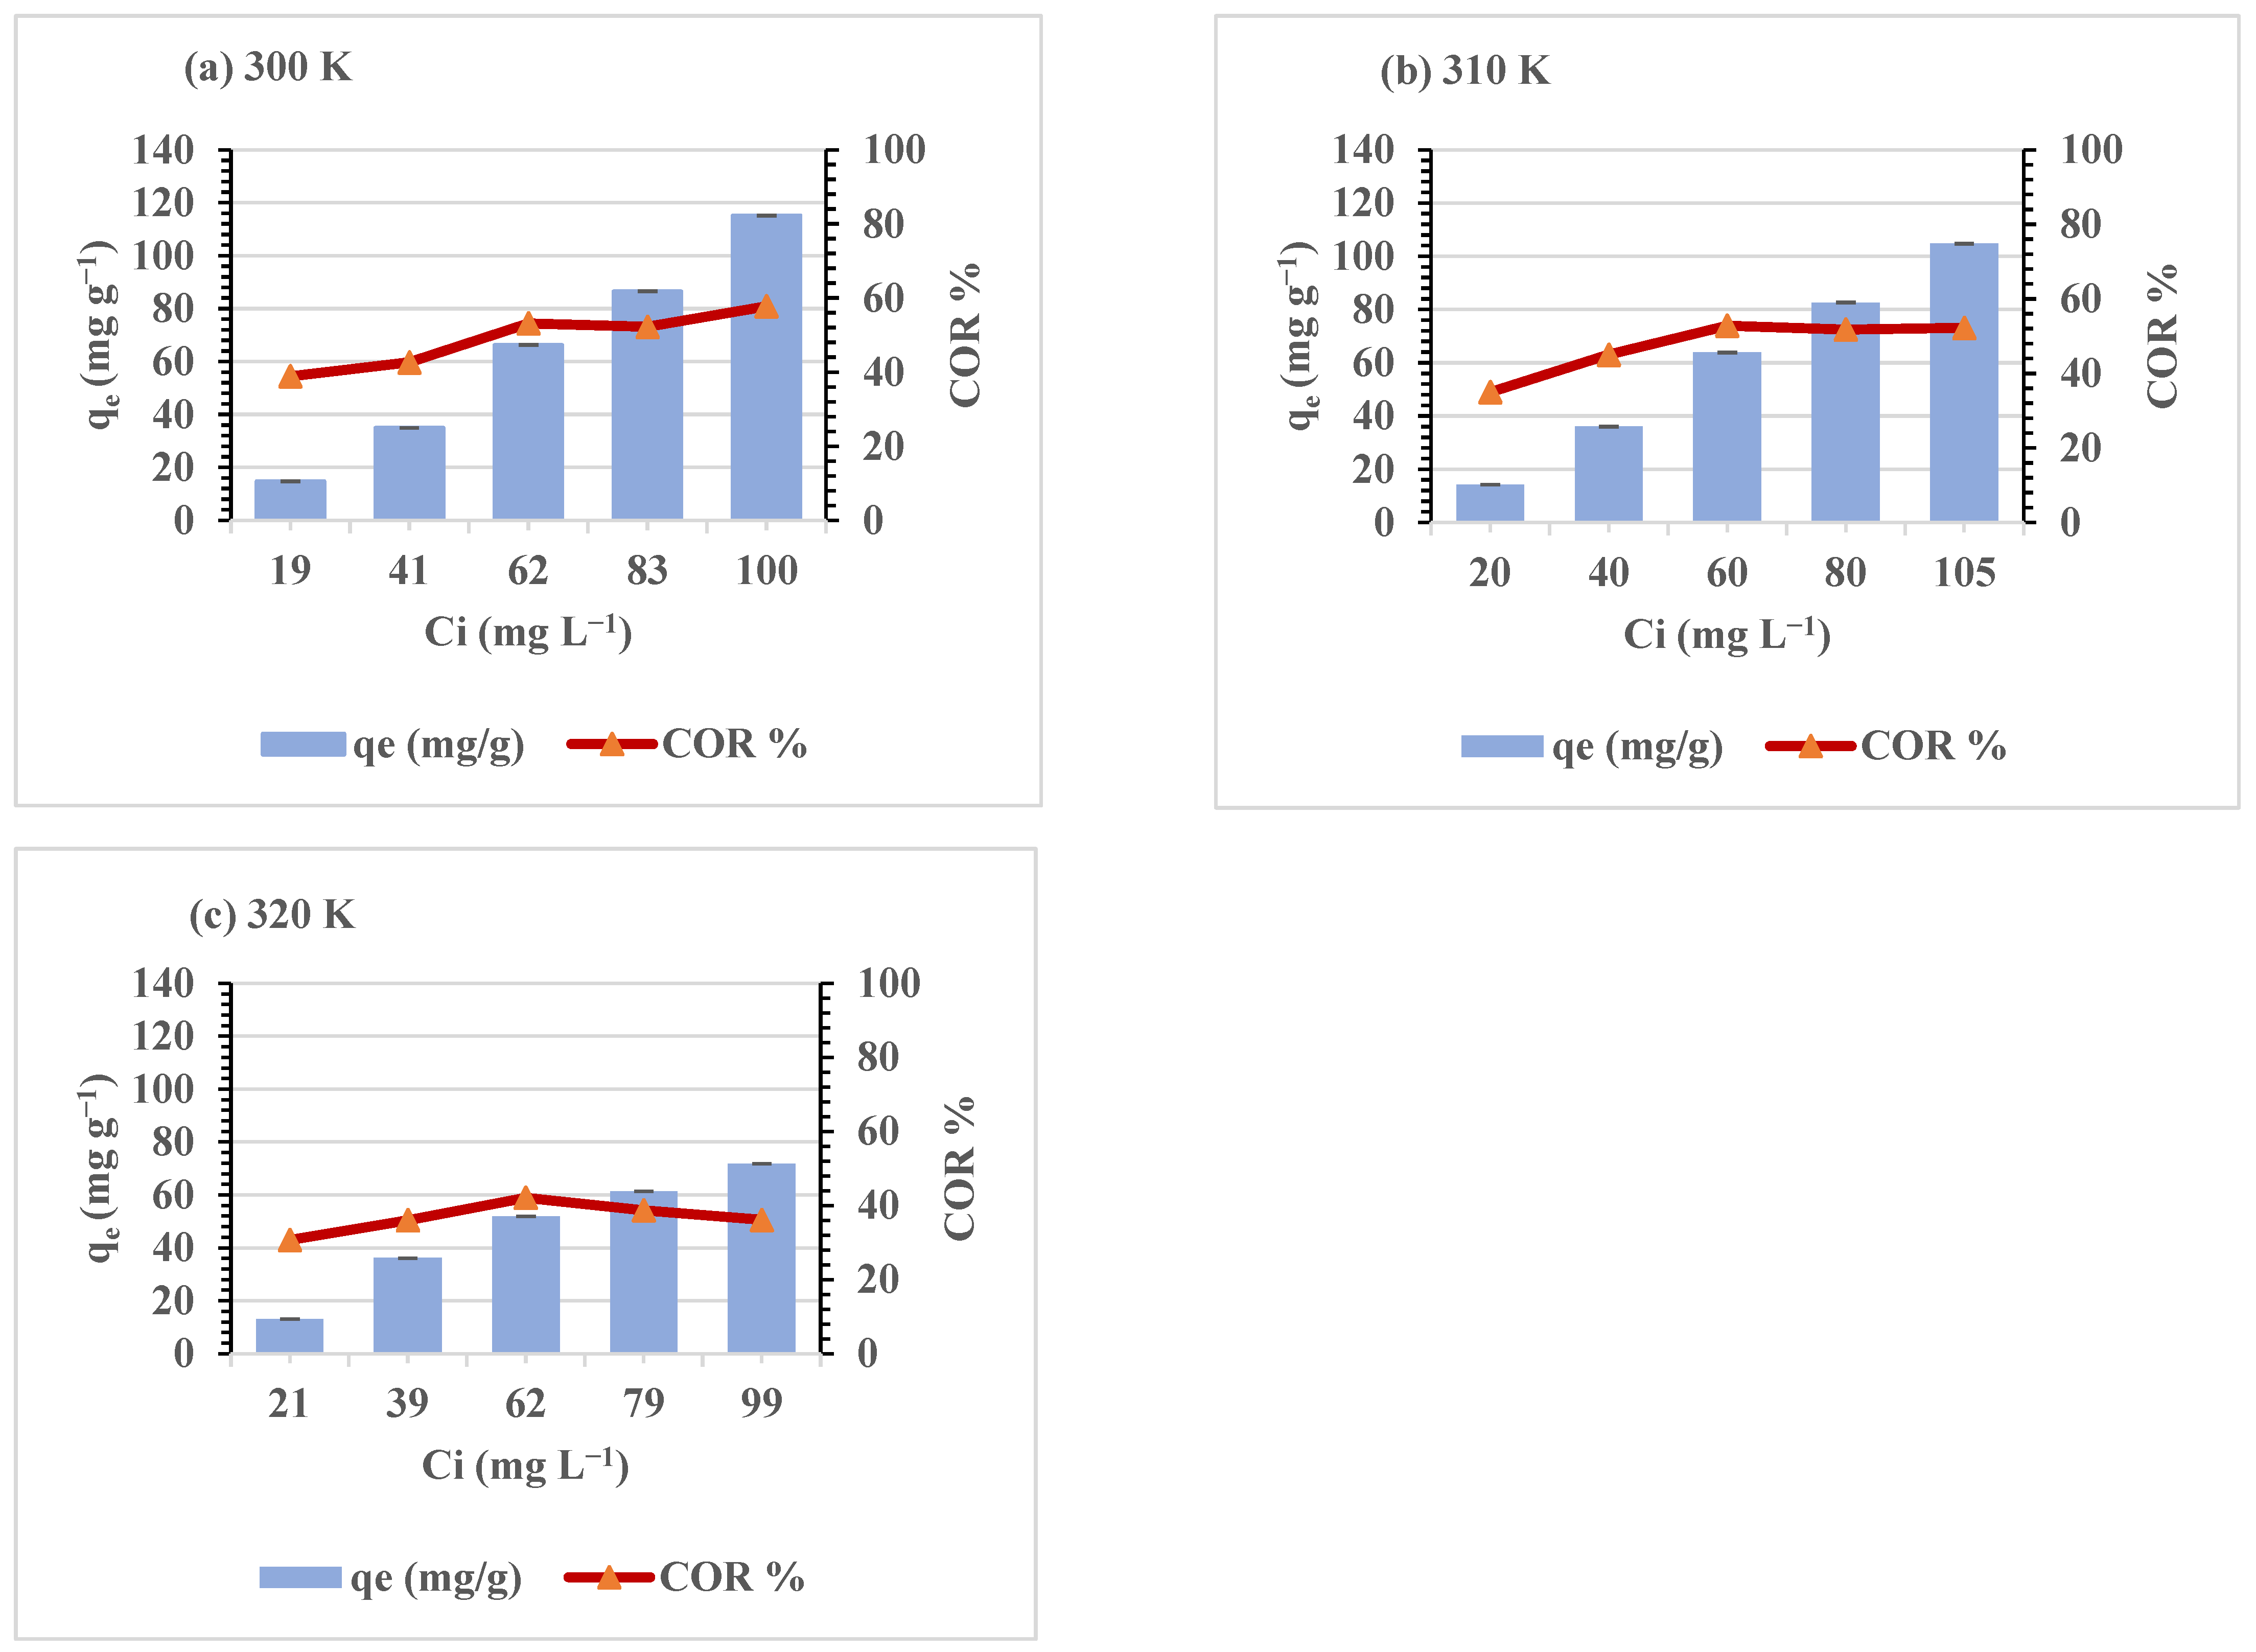
Table 3 shows the effect of the initial concentration of crude oil (Ci) in SOSW, in the range of 19–105 mg L−1, on the sorption capacity of oil (qe), the crude oil equilibrium concentration (Ce), and crude oil removal (COR, %) by LLF, with the standard deviations for all parameters observed. These data were obtained for experimental conditions as follows: 0.5 g L−1 of fiber, 4 h contact time, 140 rpm rotation speed, and temperatures of 300, 310, and 320 K. Figure 6a–c show the effect of Ci on qe and COR (%), and Figure 7a–c present the effect of Ce on qe and COR (%), under the experimental conditions recalled in Table 3.
The values of qe and COR increase with Ci and Ce; however, these values tend to decrease with increasing temperature from 300 to 320 K (see Table 3; Figure 6a–c and Figure 7a–c). The Ce values are an indication of non-removed crude oil by LLF. Ce values below 29 mg L−1 (mean daily limit reject per month allowed by CONAMA and USEPA) are observed when Ci is lower or equal to 41 mg L−1 at 300, 310, and 320 K. Ce values lower than 42 mg L−1 (maximum daily limit of reject for CONAMA and USEPA) are observed when Ci is lower or equal to 83 mg L−1 at 300 and 310 K or Ci is lower or equal to 62 mg L−1 at 320 K. These results show that temperature exerts an influence on the removal of emulsified crude oil by fiber and that this effect is more significant when Ci increases in the emulsion. The lower the temperature, the higher the fiber capacity to remove crude oil. These results also suggest that LFF can be used for SOSW pretreatment with Ci lower or equal to 83 mg L−1 to allow daily rejects lower than those defined by CONAMA and USEPA at 300 and 310 K in seawater.

3.2.4. Isotherm Model

Table 4 shows the values of the isothermal parameters obtained from the Langmuir, Temkin, and Freundlich models for crude oil sorption in SOSW by LLF for temperatures of 300, 310, and 320 K.
Among the models evaluated, the Freundlich model was the one that best fit the experimental data, with a correlation coefficient closest to 1 for the three temperatures evaluated. With increasing temperature, the values of KF and 1/n decreased. The Freundlich constant (KF) is correlated with the sorption capacity of the adsorbent, and 1/n is the heterogeneity factor of the adsorbent that indicates the relative distribution of energy sites; the closer to zero, the more heterogeneous the adsorption surface [60,61]. Then, with increasing temperature, the sorption capacity decreases with less heterogeneity of the adsorbent. The value of n increased with temperature but remained lower than 1, indicating complex adsorption [28]. The Freundlich model describes adsorption in multilayers, assuming energetic heterogeneity of the surface accompanied by adsorption sites; that is, the oil molecules occupy specific adsorption sites, and the occupation of these sites interferes with the energy of the others, resulting in the formation multilayer, although adsorption is not favorable [28,60]. The experimental data used to obtain the sorption isotherm parameters are presented in the Supplementary Material (see S3.6).

3.2.5. Thermodynamic Parameters

The nature of the crude oil sorption process in LLF was evaluated based on the thermodynamic parameters (ΔG, ΔH, and ΔS) for temperatures of 300, 310, and 320 K (Table 5). These parameters can be calculated by the following equations:
Δ G = R T l n K C
l n K C = Δ H R T + Δ S R
in which R is the universal gas constant (8.314 J mol−1 K−1), and T is the absolute temperature in Kelvin; ΔG (kJ mol−1), ΔH (kJ mol−1), and ΔS (J mol−1 K−1) are changes in the standard Gibbs free energy, enthalpy, and entropy, respectively. Kc is the ratio between qe and Ce, ΔH and ΔS are calculated from the slope and intercept of the linear plot of ln Kc versus 1/T, and the results are shown in Table 5. The experimental data used to obtain thermodynamic parameters are presented in the Supplementary Material (See S3.7).
As the temperature increases from 300 to 320 K, the ΔG values increase from −0.60 to 0.30 kJ mol−1, from −2.00 to −0.97 kJ mol−1, from −1.91 to −0.60 kJ mol−1, and from −2.44 to −0.32 kJ mol−1, for each range of Ci shown in Table 5. According to the literature, the physisorption process is observed for values of ΔG between −20 to 0 kJ mol−1 [62]. The negative values of ΔG suggest that crude oil sorption on LLF is a spontaneous physical process. The values of ΔH and ΔS were also negative, and these values increased from −14.49 to −34.90 kJ mol−1 for ΔH and from −0.046 to −0.108 kJ mol−1 K−1 for ΔS as Ci of the crude oil increased in SOSW, suggesting that the sorption process is exothermic with reduced disorder at the solid–emulsion interface. Furthermore, increasing Ci makes the process less exothermic and less disordered (see Table 5). According to Osemeahon and Dimas [63] and Obi et al. [64], at higher temperatures, the kinetic energy of the oil molecules increases, reducing the capture of the oil by the adsorbent due to the decrease in the sorption forces between the oil molecules and the active sites of the solid phases, making the sorption process more reversible. Finally, the sorption of oil molecules on the fiber surface is favored as Ci increases in SOSW. Furthermore, the negative values of ΔS indicate that the configuration of the crude oil molecules on the fiber surface is less random [65], probably because a physical process governs the adsorption behavior according to the results of ΔG [66], via van der Waals interactions [67]. Rajak et al. [37] also observed negative values of ΔH, ΔS, and ΔG when studying the adsorption of crude oil from oil-in-water emulsion by activated charcoal. The thermodynamic data reinforce the idea that the physisorption of oil molecules on the fiber surface is the most important phenomenon under the conditions used in this work.

4. Conclusions

This work evaluated the licuri leaf fiber as an oil biosorbent from crude oil emulsions in saline water with low initial oil concentrations without changing the emulsion pH (pH = 6.6) or the fiber nature. The raw fiber presents poor textural properties (BET area = 0.07 m2 g−1 and pore volume = 0.0015 cm3 g−1) and possesses mineral impurities, seen through EDS, such as K and Ca. After oil sorption from synthetic oily saline water, elimination of K and increases in Ca and Na concentration showed that mineral salts compete with oil and water during sorption process. ATR-FTIR confirmed the competition between water and oil during sorption. The results obtained by the batch sorption experiments showed that the oil sorption capacity increased with the initial concentration of oil in the emulsion and decreased when temperature rose from 300 to 320 K. The sorption equilibrium was achieved quickly for the lowest initial concentration of oil in the emulsion (28 mg L−1), and in this condition, the model that best fit the experimental data was the pseudo-first-order model. For a higher initial oil concentration (102 mg L−1), both pseudo-first-order and pseudo-second-order kinetic models described the sorption behavior well but with better adjustment for the latter, suggesting that the process is ruled by physisorption. The value of the sorption capacity in the equilibrium for a higher initial oil concentration (105 mg L−1) in the range 0.1 g g−1 was confirmed by TGA. The Freundlich model best fit the experimental data, indicating that oil sorption by fiber occurs in multilayers. The thermodynamic parameters (ΔG, ΔH, and ΔS) were negative, suggesting that oil sorption onto LLF is a spontaneous and viable exothermic process, with little disorder. The negative values of the observed Gibbs energy indicated that the sorption process of crude oil by the licuri leaf fiber is governed by physical adsorption, probably via van der Waals interactions. The equilibrium results suggest that raw LLF can be used to remove oil in oily water with initial oil concentrations greater than or equal to 83 mg L−1,below the daily limit of 42 mg L−1 in seawater, at temperatures of 300 and 310 K, thus meeting the environmental conditions imposed by CONAMA and USEPA. This study highlights the use of biomass, like licuri leaf fiber, for oil removal in aquatic systems, demonstrating a sustainable approach to managing both biomass disposal and environmental cleanup. By exploring this new type of biomass, we demonstrated the fiber’s effectiveness as a biosorbent in highly saline water without altering pH, aligning with environmental standards, thus promoting the recycling of biomass waste and supporting pollution control effectively. Future work will be focused on the chemical modification of LLF to decrease its hydrophilic character, without adding polluting species such as S, N or P.

Supplementary Materials

The following supporting information can be downloaded at: https://www.mdpi.com/article/10.3390/su17167188/s1, Table S1. Natural sorbents for oily water treatment. Table S2: Experimental data for the kinetic sorption of crude oil sorption on LLF, after contact with different initial oil concentrations (28, 44, and 102 mg g−1), at 310 K. Table S3: Experimental data for crude oil sorption on LLF, after contact with different initial oil concentrations, applied to the pseudo-first order kinetic model, at 310 K. Table S4: Experimental data for crude oil sorption on LLF. after contact with different initial oil concentrations, applied to the pseudo-second order kinetic model, at 310 K. Table S5: Experimental data for crude oil sorption on LLF, after contact with different initial oil concentrations, applied to the Langmuir, Temkin and Freundlich isotherm models, at 300 K. Table S6: Experimental data for crude oil sorption on LLF, after contact with different initial oil concentrations, applied to the Langmuir, Temkin and Freundlich isotherm models, at 310 K. Table S7: Experimental data for crude oil sorption on LLF, after contact with different initial oil concentrations, applied to the Langmuir, Temkin and Freundlich isotherm models, at 320 K. Table S8: Experimental data used to determine the thermodynamic parameters for the crude oil sorption on LLF, after contact with different initial oil concentrations around (a) 20 mg L−1, (b) 60 mg L−1, (c) 80 mg L−1, and (d) 100 mg L−1. Figure S1: XRD of raw LLF. Figure S2: Chemical element distribution maps and EDS spectra for (a) LLF (before contact with emulsion) and (b) LLF20 (after contact with 20 mg L−1 oil emulsion in saline water). Figure S3: (a) Effect of contact time on sorption of crude oil onto LLF and (b) crude oil removal (COR) percentage as a function of contact time between CO and LLF, at three different initial oil concentrations in SOSW (Ci = 28, 44 and 102 mg L−1 and experimental conditions: LLF dosage: 0.5 g L−1; shaking speed: 140 rpm; temperature = 310 K). Results presented as the average ± standard deviation for three experiments. Figure S4: Pseudo-first order plot of crude oil sorption on LLF. after contact with different initial oil concentrations (a) 28 mg L−1, (b) 44 mg L−1, and (c) 102 mg L−1, at 310 K. Figure S5: Pseudo-second order plot of crude oil sorption on LLF. after contact with different initial oil concentrations (a) 28 mg L−1, (b) 44 mg L−1, and (c) 102 mg L−1, at 310 K. Figure S6: Plots of (a) Langmuir, (b) Temkin, and (c) Freundlich isotherm models for crude oil sorption in LLF after contact with different initial oil concentrations, at 300 K. Figure S7: Plots of (a) Langmuir, (b) Temkin, and (c) Freundlich isotherm models for crude oil sorption in LLF after contact with different initial oil concentrations, at 310 K. Figure S8: Plots of (a) Langmuir, (b) Temkin, and (c) Freundlich isotherm models for crude oil sorption in LLF after contact with different initial oil concentrations, at 320 K. Figure S9: Plots used to determine the thermodynamic parameters for crude oil sorption on LLF. after contact with different initial oil concentrations around (a) 20 mg L−1, (b) 60 mg L−1, (c) 80 mg L−1, and (d) 100 mg L−1. References [25,26,29,30,47,64,68,69] are citied in the Supplemental Materials.

Author Contributions

Conceptualization, R.T.F.F. and R.R.L.V.; Methodology, P.V.B.B., R.T.F.F. and R.R.L.V.; Validation, G.A.F. and R.T.F.F.; Investigation, P.V.B.B., F.d.S.C. and R.R.L.V.; Resources, A.J.S.M.; Writing—original draft, P.V.B.B. and G.A.F.; Writing—review and editing, A.J.S.M., R.T.F.F. and R.R.L.V.; Visualization, F.d.S.C. All authors have read and agreed to the published version of the manuscript.

Funding

Institutional Program of Scientific Initiation Scholarships (PIBIC-UFBA) and the National Council for Scientific and Technological Development (CNPq-Brazil) for the scholarships and the project USINA (FINEP n. 0057/21) for the funds.

Institutional Review Board Statement

Not applicable.

Informed Consent Statement

Not applicable.

Data Availability Statement

Data are contained within the article.

Acknowledgments

Authors thank the Medical Research Laboratory (LAPEMM) for the analysis of ATR-FTIR, the Animal Nutrition laboratory (LANA) for determining the chemical composition of licuri leaf fiber by the van Soest method, and the Electron Microscopy Multiuser Laboratory (LAMUME) for the analysis of Scanning Electron Microscopy and EDS analysis.

Conflicts of Interest

The authors declare no conflict of interest.

References

  1. Siwayanan, P.; Ramachandran, D.G.; Jamaluddin, R.; Ahmad, S. Oil spill removal using kenaf core fibers as biosorbent material. In IOP Conference Series: Materials Science and Engineering, Proceedings of the 26th Regional Symposium on Chemical Engineering (RSCE 2019), Kuala Lumpur, Malaysia, 30–31 October 2019; IOP Publishing Ltd: Bristol, UK, 2020; Volume 778, p. 012003. [Google Scholar]
  2. Zhang, T.; Li, Z.; Lü, Y.; Liu, Y.; Yang, D.; Li, Q.; Qiu, F. Recent progress and future prospects of oil-absorbing materials. Chin. J. Chem. Eng. 2019, 27, 1282–1295. [Google Scholar] [CrossRef]
  3. Liu, B.; Chen, B.; Zhang, B.; Song, X.; Zeng, G.; Lee, K. Photocatalytic ozonation of offshore produced water by TiO2 nanotube arrays coupled with UV-LED irradiation. J. Hazard. Mater. 2021, 402, 123456. [Google Scholar] [CrossRef]
  4. Abuhasel, K.; Kchaou, M.; Alquraish, M.; Munusamy, Y.; Jeng, Y.T. Oily wastewater treatment: Overview of conventional and modern methods, challenges, and future opportunities. Water 2021, 13, 980. [Google Scholar] [CrossRef]
  5. Choi, Y.; Kim, Y.; Woo, Y.C.; Hwang, I. Water management and produced water treatment in oil sand plant: A review. Desalination 2023, 567, 116991. [Google Scholar] [CrossRef]
  6. Amakiri, K.T.; Canon, A.R.; Molinari, M.; Angelis-Dimakis, A. Review of oilfield produced water treatment technologies. Chemosphere 2022, 298, 134064. [Google Scholar] [CrossRef] [PubMed]
  7. Delanka-Pedige, H.M.; Zhang, Y.; Young, R.B.; Wang, H.; Hu, L.; Danforth, C.; Xu, P. Safe reuse of treated produced water outside oil and gas fields? A review of current practices, challenges, opportunities, and a risk-based pathway for produced water treatment and fit-for-purpose reuse. Curr. Opin. Chem. Eng. 2023, 42, 100973. [Google Scholar] [CrossRef]
  8. Fakharian, H.; Ganji, H.; Naderifar, A. Saline produced water treatment using gas hydrates. J. Environ. Chem. Eng. 2017, 5, 4269–4273. [Google Scholar] [CrossRef]
  9. Zhang, W.; Li, Q.; Dong, S.; Liu, H.; Dong, K.; Wu, X.; Sui, M.; Zhang, F. Synthesis of mixed-base active material from drilling fluid solid waste and biomass for oil wastewater adsorption and its mechanism. J. Water Process Eng. 2024, 66, 106076. [Google Scholar] [CrossRef]
  10. Cerff, B.; Key, D.; Bladergroen, B. A review of the processes associated with the removal of oil in water pollution. Sustainability 2021, 13, 12339. [Google Scholar] [CrossRef]
  11. Vidal, R.R.L.; Moraes, J.S. Removal of organic pollutants from wastewater using chitosan: A literature review. Int. J. Environ. Sci. Technol. 2019, 16, 1741–1754. [Google Scholar] [CrossRef]
  12. Vianna, L.F. RESOLUÇÃO CONAMA Nº 393. Rev. Bras. Direito Petróleo Gás Energ. 2018, 5, 211–224. [Google Scholar]
  13. Zheng, J.; Chen, B.; Thanyamanta, W.; Hawboldt, K.; Zhang, B.; Liu, B. Offshore produced water management: A review of current practice and challenges in harsh/Arctic environments. Mar. Pollut. Bull. 2016, 104, 7–19. [Google Scholar] [CrossRef] [PubMed]
  14. de Medeiros, A.D.M.; da Silva Junior, C.J.G.; de Amorim, J.D.P.; Durval, I.J.B.; de Santana Costa, A.F.; Sarubbo, L.A. Oily wastewater treatment: Methods, challenges, and trends. Processes 2022, 10, 743. [Google Scholar] [CrossRef]
  15. Li, X.; Jin, X.; Wu, Y.; Zhang, D.; Sun, F.; Ma, H.; Pugazhendhi, A.; Xia, C. A comprehensive review of lignocellulosic biomass derived materials for water/oil separation. Sci. Total Environ. 2023, 876, 162549. [Google Scholar] [CrossRef]
  16. Ani, J.U.; Akpomie, K.G.; Okoro, U.C.; Aneke, L.E.; Onukwuli, O.D.; Ujam, O.T. Potentials of activated carbon produced from biomass materials for sequestration of dyes, heavy metals, and crude oil components from aqueous environment. Appl. Water Sci. 2020, 10, 69. [Google Scholar] [CrossRef]
  17. Emenike, E.C.; Adeleke, J.; Iwuozor, K.O.; Ogunniyi, S.; Adeyanju, C.A.; Amusa, V.T.; Okoro, H.K.; Adeniyi, A.G. Adsorption of crude oil from aqueous solution: A review. J. Water Process Eng. 2022, 50, 103330. [Google Scholar] [CrossRef]
  18. Santos, T.M.; de Jesus, F.A.; da Silva, G.F.; Pontes, L.A.M. Synthesis of activated carbon from oleifera moringa for removal of oils and greases from the produced water. Environ. Nanotechnol. Monit. Manag. 2020, 14, 100357. [Google Scholar] [CrossRef]
  19. Toorani, F.; Aghdasinia, H.; Nejatbakhsh, S.; Karimi, A. Removal of hydrocarbon pollutants from aqueous media using hydrophobic cellulose-based adsorbents. Chem. Eng. Res. Des. 2023, 199, 413–424. [Google Scholar] [CrossRef]
  20. Zhang, Y.; Sam, E.K.; Liu, J.; Lv, X. Biomass-Based/Derived Value-Added Porous Absorbents for Oil/Water Separation. Waste Biomass Valorization 2023, 14, 3147–3168. [Google Scholar] [CrossRef]
  21. Mujtaba, M.; Fraceto, L.F.; Fazeli, M.; Mukherjee, S.; Savassa, S.M.; de Medeiros, G.A.; Pereira, A.E.S.; Mancini, S.D.; Lipponen, J.; Vilaplana, F. Lignocellulosic biomass from agricultural waste to the circular economy: A review with focus on biofuels, biocomposites and bioplastics. J. Clean. Prod. 2023, 402, 136815. [Google Scholar] [CrossRef]
  22. Dong, T.; Wang, F.; Xu, G. Sorption kinetics and mechanism of various oils into kapok assembly. Mar. Pollut. Bull. 2015, 91, 230–237. [Google Scholar] [CrossRef]
  23. Oliveira, L.M.T.M.; Oliveira, L.F.A.M.; Sonsin, A.F.; Duarte, J.L.S.; Soletti, J.I.; Fonseca, E.J.S.; Ribeiro, L.M.O.; Meili, L. Ultrafast diesel oil spill removal by fibers from silk-cotton tree: Characterization and sorption potential evaluation. J. Clean. Prod. 2020, 263, 121448. [Google Scholar] [CrossRef]
  24. Batzias, F.A.; Sidiras, D.K.; Siontorou, C.G.; Bountri, A.N.; Politi, D.V.; Kopsidas, O.N.; Konstantinou, I.G.; Katsamas, G.N.; Salapa, I.S.; Zervopoulou, S.P. Experimental design for estimating parameter-values of modelling crude oil adsorption on thermo-chemically modified lignocellulosic biomass. Int. J. Arts Sci. 2014, 7, 205. [Google Scholar]
  25. Silva, M.S.; Frety, R.; Vidal, R.R.L. Cotton linter as biosorbent: Removal study of highly diluted crude oil-in-saline water emulsion. Int. J. Environ. Sci. Technol. 2023, 20, 2111–2126. [Google Scholar] [CrossRef]
  26. Cheu, S.C.; Kong, H.; Song, S.T.; Johari, K.; Saman, N.; Yunus, M.A.C.; Mat, H. Separation of dissolved oil from aqueous solution by sorption onto acetylated lignocellulosic biomass-equilibrium, kinetics and mechanism studies. J. Environ. Chem. Eng. 2016, 4, 864–881. [Google Scholar] [CrossRef]
  27. Ibrahim, S.; Wang, S.; Ang, H.M. Removal of emulsified oil from oily wastewater using agricultural waste barley straw. Biochem. Eng. J. 2010, 49, 78–83. [Google Scholar] [CrossRef]
  28. Choi, H.J. Agricultural bio-waste for adsorptive removal of crude oil in aqueous solution. J. Mater. Cycles Waste Manag. 2019, 21, 356–364. [Google Scholar] [CrossRef]
  29. Al-Najar, J.A.; Al-Humairi, S.T.; Lutfee, T.; Balakrishnan, D.; Veza, I.; Soudagar, M.E.M.; Fattah, I.M. Cost-effective natural adsorbents for remediation of oil-contaminated water. Water 2023, 15, 1186. [Google Scholar] [CrossRef]
  30. Lutfee, T.; Al-Najar, J.A.; Abdulla, F.M. Removal of oil from produced water using biosorbent. In IOP Conference Series: Materials Science and Engineering, Proceedings of the 4th International Conference on Buildings, Construction and Environmental Engineering, Istanbul, Turkey, 7–9 October 2019; IOP Publishing Ltd: Bristol, UK, 2020; Volume 737, p. 012198. [Google Scholar]
  31. Cavalcanti, C.P.L.; Macedo, T.J.S.; Gois, G.C.; Menezes, V.G.; do Monte, A.P.O.; da Silva, A.D.; da Silva, D.J.M.; da Silva, E.O.; Araújo, G.G.L.; Rodrigues, R.T.S.; et al. Licuri oil improves feedlot performance and modifies ruminal fauna of Santa Inês ewes. Livest. Sci. 2022, 265, 105093. [Google Scholar] [CrossRef]
  32. Guimarães, J.S.; ShiosakI, R.K.; Mendes, M.L.M. Licuri (Syagrus coronata): Características, importâncias, potenciais e perspectivas do pequeno coco do Brasil. Desenvolv. Meio Ambiente 2021, 58, 169–192. [Google Scholar] [CrossRef]
  33. Lopez-Ramon, M.V.; Stoeckli, F.; Moreno-Castilla, C.; Carrasco-Marin, F. On the characterization of acidic and basic surface sites on carbons by various techniques. Carbon 1999, 37, 1215–1221. [Google Scholar] [CrossRef]
  34. Yang, Y.; Chun, Y.; Sheng, G.; Huang, M. pH-dependence of pesticide adsorption by wheat-residue-derived black carbon. Langmuir 2024, 20, 6736–6741. [Google Scholar] [CrossRef]
  35. Van Soest, P.J. Use of detergents in the analysis of fibrous feeds. II. A rapid method for the determination of fiber and lignin. J. Assoc. Off. Anal. Chem. 1990, 73, 491–497. [Google Scholar] [CrossRef]
  36. van Soest, P.V.; Robertson, J.B.; Lewis, B.A. Methods for dietary fiber, neutral detergent fiber, and nonstarch polysaccharides in relation to animal nutrition. J. Dairy Sci. 1991, 74, 3583–3597. [Google Scholar] [CrossRef]
  37. Rajak, V.K.; Kumar, S.; Thombre, N.V.; Mandal, A. Synthesis of activated charcoal from saw-dust and characterization for adsorptive separation of oil from oil-in-water emulsion. Chem. Eng. Commun. 2018, 205, 897–913. [Google Scholar] [CrossRef]
  38. Hao, X.; Elakneswaran, Y.; Shimokawara, M.; Kato, Y.; Kitamura, R.; Hiroyoshi, N. Impact of the temperature, homogenization condition, and oil property on the formation and stability of crude oil emulsion. Energ. Fuel. 2024, 38, 979–994. [Google Scholar] [CrossRef]
  39. Elanchezhiyan, S.S.; Meenakshi, S. Synthesis and characterization of chitosan/Mg-Al layered double hydroxide composite for the removal of oil particles from oil-in-water emulsion. Int. J. Biol. Macromol. 2017, 104, 1586–1595. [Google Scholar] [CrossRef]
  40. Liu, Q.S.; Zheng, T.; Wang, P.; Jiang, J.P.; Li, N. Adsorption isotherm, kinetic and mechanism studies of some substituted phenols on activated carbon fibers. Chem. Eng. J. 2010, 157, 348–356. [Google Scholar] [CrossRef]
  41. Chen, X. Modeling of experimental adsorption isotherm data. Information 2015, 6, 14–22. [Google Scholar] [CrossRef]
  42. Mall, I.D.; Srivastava, V.C.; Kumar, G.V.A.; Mishra, I.M. Characterization and utilization of mesoporous fertilizer plant waste carbon for adsorptive removal of dyes from aqueous solution. Colloids Surf. A Physicochem. Eng. Asp. 2006, 278, 175–187. [Google Scholar] [CrossRef]
  43. Choi, H.M.; Kwon, H.J.; Moreau, J.P. Cotton nonwovens as oil spill cleanup sorbents. Text. Res. J. 1993, 63, 211–218. [Google Scholar] [CrossRef]
  44. Ansari, I.A.; East, G.C.; Johnson, D.J. Structure–property relationships in natural cellulosic fibres: Part III: Flax—An oil sorbent. J. Text. Inst. 2003, 94, 1–15. [Google Scholar] [CrossRef]
  45. Dougherty, M.J.; Tran, H.M.; Stavila, V.; Knierim, B.; George, A.; Auei, M.; Adams, P.D.; Hadi, M.Z. Cellulosic biomass pretreatment and sugar yields as a function of biomass particle size. PLoS ONE 2014, 9, e100836. [Google Scholar] [CrossRef] [PubMed]
  46. Isaac, A.; Barboza, V.; Sket, F.I.; D’Almeida, J.R.M.; Montoro, L.A.; Hilger, A.; Manke, I. Towards a deeper understanding of structural biomass recalcitrance using phase-contrast tomography. Biotechnol. Biofuels 2015, 8, 40. [Google Scholar] [CrossRef][Green Version]
  47. Guo, S.; Deng, X.; Zhao, D.; Zhu, S.; Qu, H.; Li, X.; Zhao, Y. An optimized method for evaluating the preparation of high-quality fuel from various types of biomass through torrefaction. Molecules 2024, 29, 1889. [Google Scholar] [CrossRef]
  48. Lins, U.; Barros, C.F.; Da Cunha, M.; Miguens, F.C. Structure, morphology, and composition of silicon biocomposites in the palm tree Syagrus coronata (Mart.) Becc. Protoplasma 2002, 220, 0089–0096. [Google Scholar] [CrossRef]
  49. Asemani, M.; Rabbani, A.R. Detailed FTIR spectroscopy characterization of crude oil extracted asphaltenes: Curve resolve of overlapping bands. J. Pet. Sci. Eng. 2020, 185, 106618. [Google Scholar] [CrossRef]
  50. Wilt, B.K.; Welch, W.T.; Rankin, J.G. Determination of asphaltenes in petroleum crude oils by Fourier transform infrared spectroscopy. Energ. Fuels. 1989, 12, 1008–1012. [Google Scholar] [CrossRef]
  51. Christy, A.A.; Dahl, B.; Kvalheim, O.M. Structural features of resins, asphaltenes and kerogen studied by diffuse reflectance infrared spectroscopy. Fuel 1989, 68, 430–435. [Google Scholar] [CrossRef]
  52. Zojaji, I.; Esfandiarian, A.; Taheri-Shakib, J. Toward molecular characterization of asphaltene from different origins under different conditions by means of FT-IR spectroscopy. Adv. Colloid Interface Sci. 2021, 289, 102314. [Google Scholar] [CrossRef]
  53. El-Sakhawy, M.; Kamel, S.; Salama, A.; Tohamy, H.A.S. Preparation and infrared study of cellulose based amphiphilic materials. Cellul. Chem. Technol. 2018, 52, 193–200. [Google Scholar]
  54. De Rosa, I.M.; Kenny, J.M.; Puglia, D.; Santulli, C.; Sarasini, F. Morphological, thermal and mechanical characterization of okra (Abelmoschus esculentus) fibres as potential reinforcement in polymer composites. Compos. Sci. Technol. 2010, 70, 116–122. [Google Scholar] [CrossRef]
  55. Liew, F.K.; Hamdan, S.; Rahman, M.R.; Rusop, M.; Lai, J.C.H.; Hossen, M.F.; Rahman, M.M. Synthesis and characterization of cellulose from green bamboo by chemical treatment with mechanical process. J. Chem. 2015, 2015, 212158. [Google Scholar] [CrossRef]
  56. Ludueña, L.N.; Vecchio, A.; Stefani, P.M.; Alvarez, V.A. Extraction of cellulose nanowhiskers from natural fibers and agricultural byproducts. Fibers Polym. 2013, 14, 1118–1127. [Google Scholar] [CrossRef]
  57. López-González, D.; Fernandez-Lopez, M.; Valverde, J.L.; Sanchez-Silva, L. Thermogravimetric-mass spectrometric analysis on combustion of lignocellulosic biomass. Bioresour. Technol. 2013, 143, 562–574. [Google Scholar] [CrossRef]
  58. Fonseca, N.S.; Oliveira, V.C.; Fréty, R.; Sales, E.A. Thermal and catalytic fast pyrolysis of oily extracts of microalgae: Production of Biokerosene. J. Braz. Chem. Soc. 2021, 32, 811–822. [Google Scholar] [CrossRef]
  59. Zhang, B.; Yu, S.; Zhu, Y.; Shen, Y.; Gao, X.; Shi, W.; Tay, J.H. Adsorption mechanisms of crude oil onto polytetrafluoroethylene membrane: Kinetics and isotherm, and strategies for adsorption fouling control. Sep. Purif. Technol. 2020, 235, 116212. [Google Scholar] [CrossRef]
  60. El Shahawy, A.; Heikal, G. Organic pollutants removal from oily wastewater using clean technology economically, friendly biosorbent (Phragmites australis). Ecol. Eng. 2018, 122, 207–218. [Google Scholar] [CrossRef]
  61. Mahmoud, A.E.D.; Fawzy, M.; Hosny, G.; Obaid, A. Equilibrium, kinetic, and diffusion models of chromium (VI) removal using Phragmites australis and Ziziphus spina-christi biomass. Int. J. Environ. Sci. Technol. 2021, 18, 2125–2136. [Google Scholar] [CrossRef]
  62. Ma, J.; Yu, F.; Zhou, L.; Jin, L.; Yang, M.; Luan, J.; Tang, Y.; Fan, H.; Yuan, Z.; Chen, J. Enhanced adsorptive removal of methyl orange and methylene blue from aqueous solution by alkali-activated multiwalled carbon nanotubes. ACS Appl. Mater. Interfaces 2012, 4, 5749–5760. [Google Scholar] [CrossRef] [PubMed]
  63. Osemeahon, S.A.; Dimas, B.J. Removal of crude oil from aqueous medium by sorption on Sterculis setigera. Asian J. Appl. Chem. Res. 2020, 10, 1–12. [Google Scholar] [CrossRef]
  64. Obi, A.I.; Ajiwe, A.C.; Okoye, P.A.C.; Umeh, C.T.; Amadi, E.G. Crude oil sorption performance of native and acetylated Siamese senna seed pods. Sustain. Chem. Environ. 2024, 8, 100173. [Google Scholar] [CrossRef]
  65. Kumar, P.S.; Ramalingam, S.; Senthamarai, C.; Niranjanaa, M.; Vijayalakshmi, P.; Sivanesan, S. Adsorption of dye from aqueous solution by cashew nut shell: Studies on equilibrium isotherm, kinetics and thermodynamics of interactions. Desalination 2010, 261, 52–60. [Google Scholar] [CrossRef]
  66. Alvarado-Gómez, E.; Tapia, J.I.; Encinas, A. A sustainable hydrophobic luffa sponge for efficient removal of oils from water. Sustain. Mater. Technol. 2021, 28, e00273. [Google Scholar] [CrossRef]
  67. Von Oepen, B.; Kördel, W.; Klein, W. Sorption of nonpolar and polar compounds to soils: Processes, measurements and experience with the applicability of the modified OECD-Guideline 106. Chemosphere 1991, 22, 285–304. [Google Scholar] [CrossRef]
  68. Castro, E.G.; Oliveira, J.C.; Miranda, C.S.; Jose, N.M. Licuri Fibers Characterization After Treatment to Produce Cellulose Nanocrystals; No. INIS-BR—17511; Associacao Brasileira de Ceramica (ABCERAM): Sao Paulo, Brazil, 2014. [Google Scholar]
  69. Ju, X.; Bowden, M.; Brown, E.E.; Zhang, X. An improved X-ray diffraction method for cellulose crystallinity measurement. Carbohydr. Polym. 2015, 123, 476–481. [Google Scholar] [CrossRef] [PubMed]
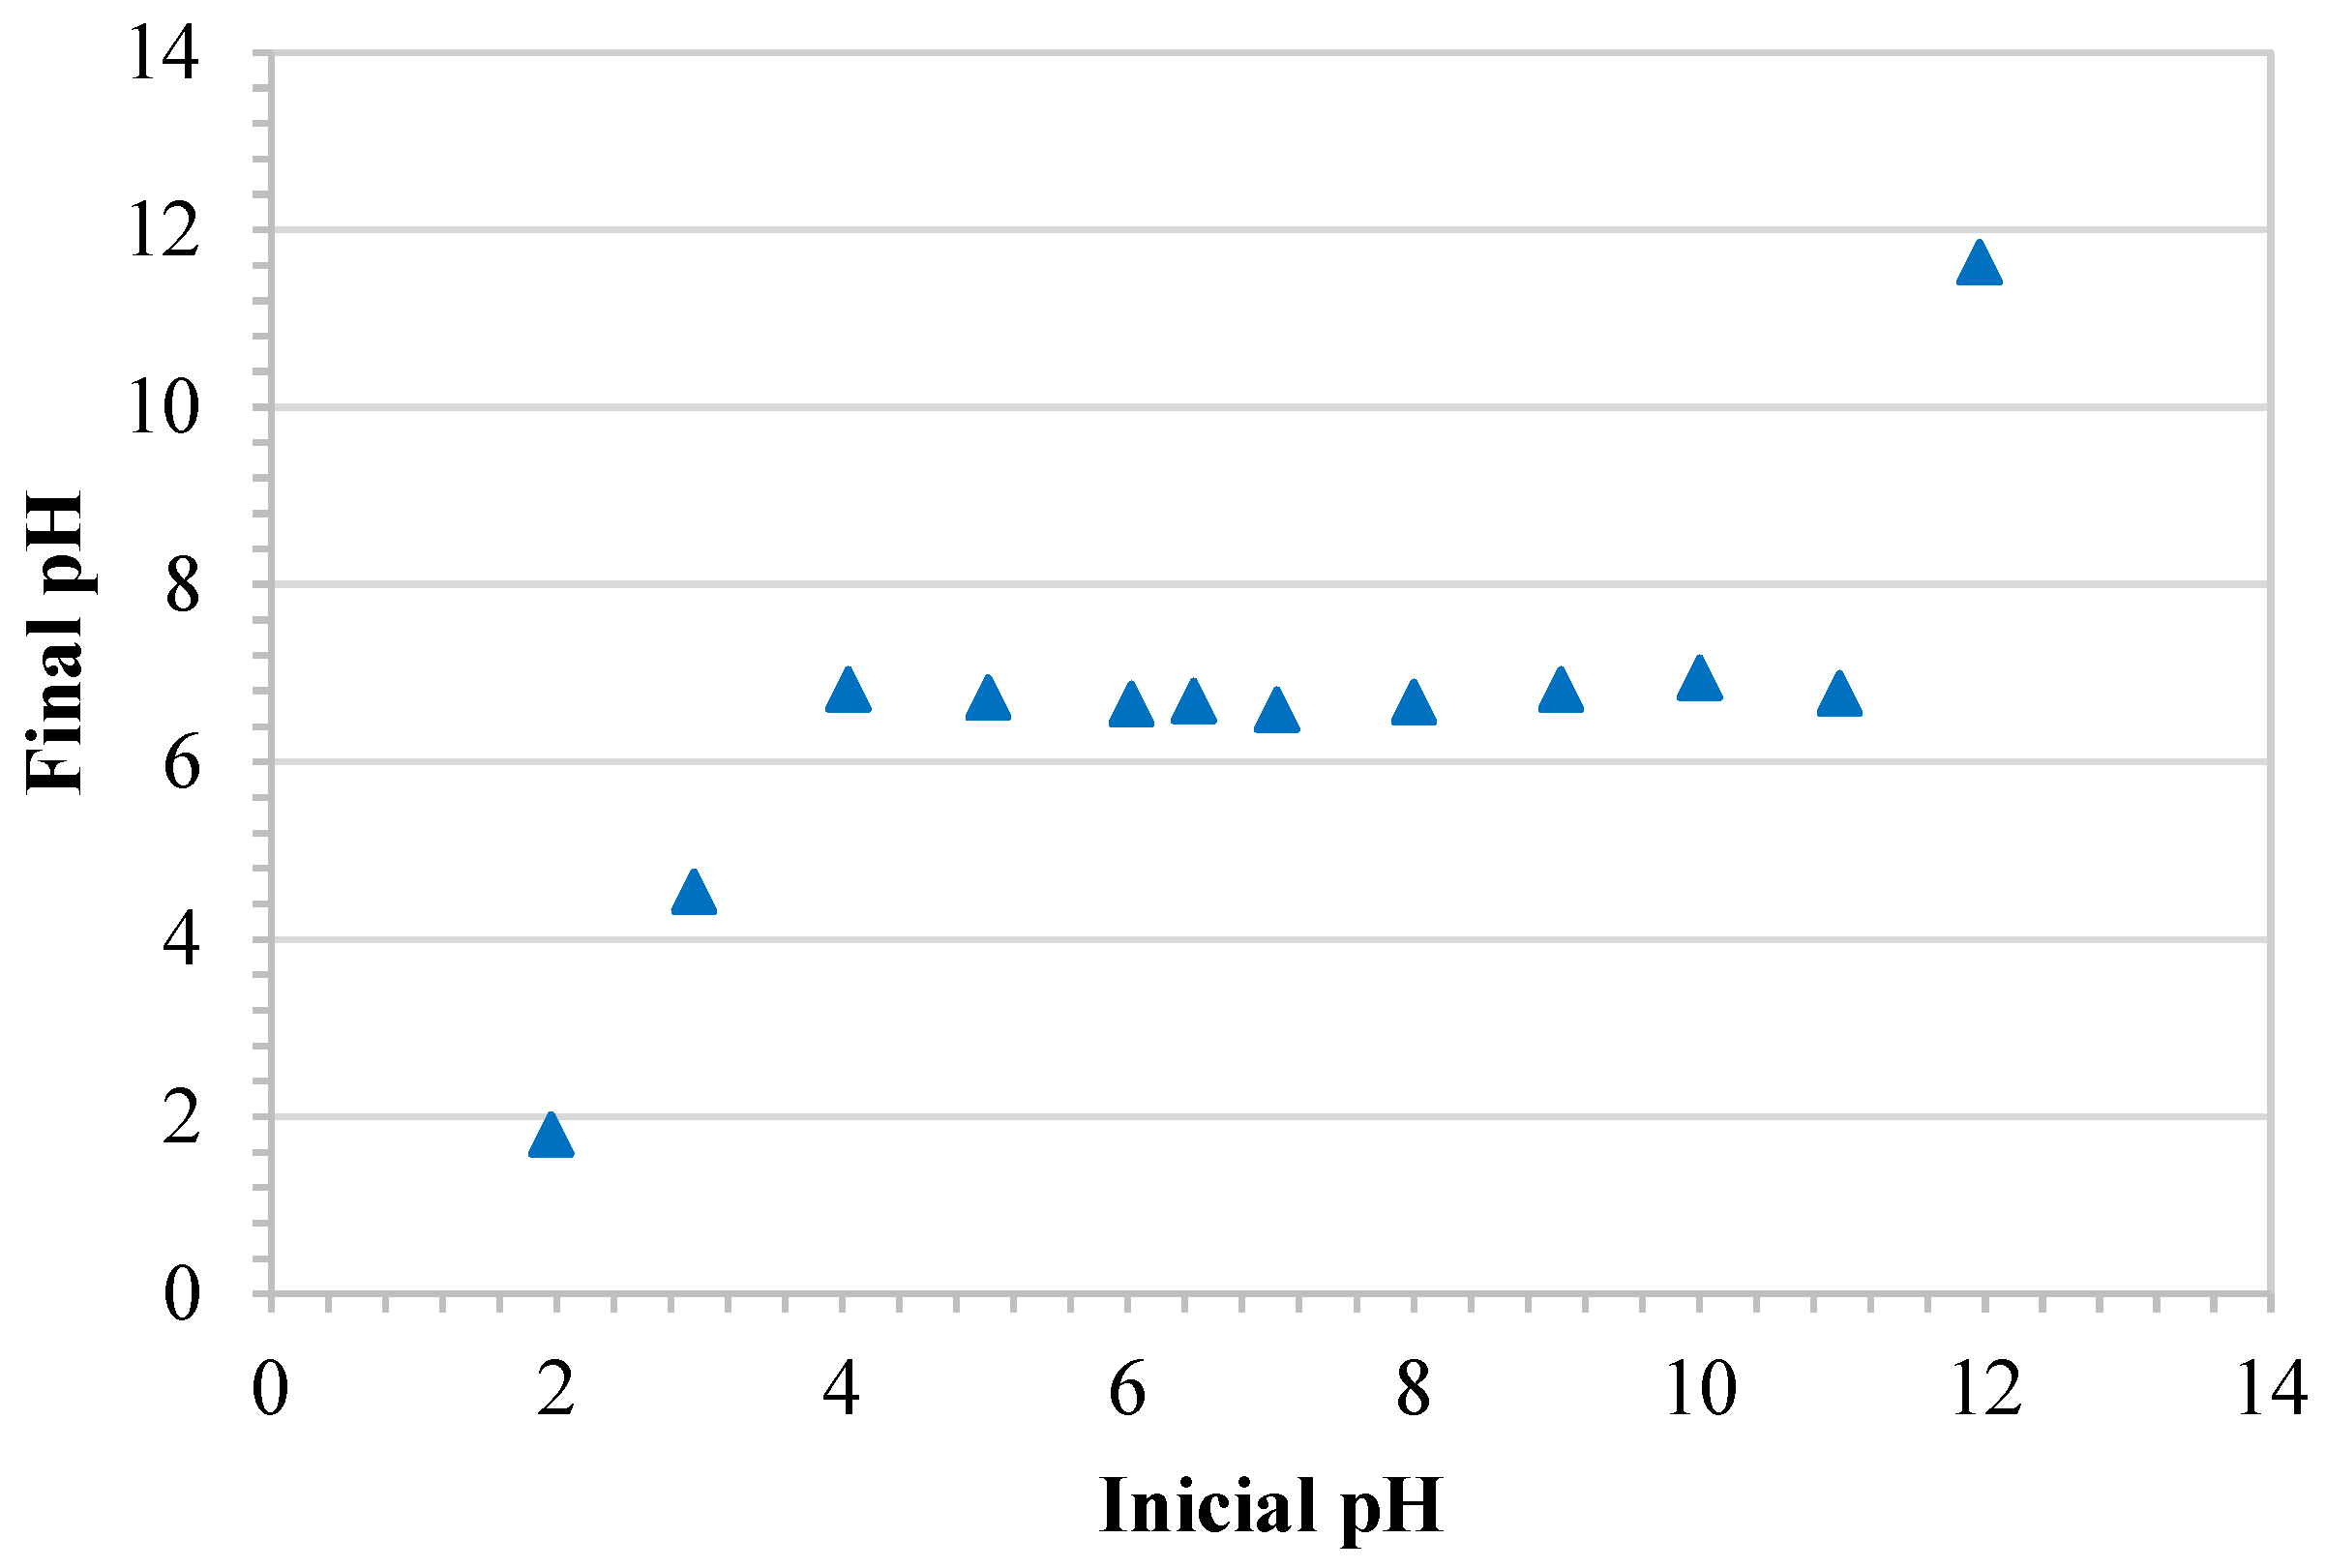
Figure 1. Determination of the zero charge point of LLF by the pH drift method.
Sustainability 17 07188 g001
Figure 2. SEM of LLF before (micrographs at (a) ×500, (b) ×2000, and (c) ×500) and after sorption of crude oil emulsion with 20 mg L−1 oil (micrographs at (d) ×500, (e) ×2000, and (f) ×1500).
Sustainability 17 07188 g002
Figure 3. ATR-FTIR spectra of (a) CO, LLF before, and LLF after oil sorption with initial oil concentrations of 20 and 100 mg L−1 (LLF20 and LLF100 samples). (b) Magnification of the ATR-FTIR spectra within the 3200 to 2600 cm−1 range, showing better in grey area the C-H stretching due to the sorption of crude oil.
Sustainability 17 07188 g003
Figure 4. (a) TG, (b) DTG, and (c) DTA curves under air flow of LLF before sorption and LLF100 after sorption of crude oil (100 mg L−1).
Sustainability 17 07188 g004
Figure 5. Effect of contact time (a) on sorption of crude oil onto LLF and (b) crude oil removal (COR) percentage as a function of contact time between CO and LLF, at two different initial oil concentrations in SOSW (Ci = 28 and 102 mg L−1 and experimental conditions: LLF dosage: 0.5 g L−1; shaking speed: 140 rpm; temperature = 310 K). Results presented as the average ± standard deviation for three experiments.
Sustainability 17 07188 g005
Figure 6. Effect of initial oil concentration (Ci) in SOSW on the sorption capacity of oil (qe) and the crude oil removal percentage of crude oil (COR%) at 300 K (a), 310 K (b), and 320 K (c), for LLF dose = 0.5 g L−1, contact time = 4 h, and agitation speed = 140 rpm.
Sustainability 17 07188 g006
Figure 7. Effect of the crude oil equilibrium concentration (Ce) in SOSW on the sorption capacity of oil (qe) and the crude oil removal percentage of crude oil (COR%) at 300 K (a), 310 K (b), and 320 K (c), for LLF dose = 0.5 g L−1, contact time = 4 h, and agitation speed = 140 rpm.
Sustainability 17 07188 g007
Table 1. EDS results for samples of LLF before and after oil sorption. The original EDS graphs and maps are presented in the Supplementary Material (see S3.3).
ElementsContent (wt%)
Before SorptionAfter Sorption
C73.466.8
O21.020.6
K0.9-
Na-1.8
Ca1.43.4
Cl0.37.0
Table 2. Kinetic parameters for crude oil sorption on LLF at 310 K.
Ci
(mg L−1)
qmax
(mg g−1)
Pseudo-First OrderPseudo-Second Order
qmax,calc
(mg g−1)
k1
(h−1)
R2qmax,calc
(mg g−1)
k2
(g mg−1 h−1)
R2
2825.404.400.270.272624.151.070.9971
10291.03107.101.040.9570114.940.010.9173
Table 3. Effect of temperature on Ci and Ce in SOSW on qe and COR at 300, 310, and 320 K, for LLF dose = 0.5 g L−1, contact time = 4 h, and agitation speed = 140 rpm.
Temperature (K)Ci (mg L−1)Ce (mg L−1)qe (mg g−1)COR (%)
30019.01 ± 1.0711.60 ± 0.3114.81 ± 1.5238.90 ± 1.82
41.00 ± 1.4223.51 ± 0.8434.98 ± 1,2442.65 ± 0.39
62.39 ± 0.7429.23 ± 0.4166.32 ± 0.6653.15 ± 0.10
82.88 ± 1.2439.59 ± 0.7486.58 ± 1.1252.23 ± 0.29
99.73 ± 2.6942.15 ± 2.67115.18 ± 2.0457.76 ± 1.11
31020.35 ± 1.0213.22 ± 1.2714.25 ± 1.2835.02 ± 0.14
40.35 ± 1.3724.20 ± 0.5436.05 ± 2.0845.04 ± 3.40
60.49 ± 0.8235.91 ± 1.2963.90 ± 0.5152.83 ± 1.25
79.84 ± 0.7338.60 ± 0.9982.68 ± 1.4851.77 ± 0.25
105.35 ± 2.7350.30 ± 0.81104.79 ± 2.0752.22 ± 1.77
32020.81 ± 1.8014.69 ± 0.8913.08 ± 1.4030.73 ± 2.05
39.29 ± 1.2821.21 ± 0.7936.17 ± 3.5036.03 ± 4.45
62.30 ± 0.2835.69 ± 1.7451.85 ± 1.6042.09 ± 1.31
79.40 ± 0.5548.58 ± 1.5861.38 ± 2.9138.71 ± 1.77
98.90 ± 2.4463.55 ± 2.5071.84 ± 2.1936.12 ± 1.29
Table 4. Adsorption isotherm parameters of LLF on the removal of oil molecules.
ModelParametersTemperature (K)
300310320
Langmuirqo (mg g−1)263.16243.90116.28
b (L mg−1)0.0110.0100.0207
R20.05260.05940.2803
TemkinKL (L mg−1)0.23430.23120.2578
B136.5433.03123.154
R20.74100.77050.8876
FreundlichKF (mg g−1)(mg L−1)1/n0.64330.67790.9307
n0.7470.7860.921
1/n1.341.271.09
R20.98490.98900.9697
Table 5. Thermodynamic parameters for the sorption of crude oil on LLF.
T (K)Ci
(mg L−1)
Thermodynamic Parameters
Kc
(L g−1)
ΔG
(kJ mol−1)
ΔH
(kJ mol−1)
ΔS
(kJ mol−1 K−1)
R2
30019.01 ± 1.071.28−0.60−14.49−0.0460.9969
31020.35 ± 1.021.08−0.18
32020.81 ± 1.800.890.30
30062.39 ± 0.742.27−2.00−17.90−0.0530.9991
31060.49 ± 0.821.78−0.77
32062.30 ± 0.281.45−0.97
30082.88 ± 1.242.19−1.91−21.84−0.0660.7657
31079.84 ± 0.732.14−1.98
32079.40 ± 0.551.26−0.60
30099.73 ± 2.692.72−2.44−34.90−0.1080.9437
310105.35 ± 2.732.08−0.65
32098.90 ± 2.441.13−0.32
Disclaimer/Publisher’s Note: The statements, opinions and data contained in all publications are solely those of the individual author(s) and contributor(s) and not of MDPI and/or the editor(s). MDPI and/or the editor(s) disclaim responsibility for any injury to people or property resulting from any ideas, methods, instructions or products referred to in the content.