Article

Excess Commuting in Rural Minnesota: Ethnic and Industry Disparities

Department of Anthropology and Geography, Minnesota State University, Mankato, MN 56001, USA
*
Author to whom correspondence should be addressed.
Sustainability 2025, 17(15), 7122; https://doi.org/10.3390/su17157122
Submission received: 29 June 2025 / Revised: 30 July 2025 / Accepted: 2 August 2025 / Published: 6 August 2025

Abstract

Research on commuting patterns has mainly focused on urban and metropolitan areas, and such studies are not typically applied to rural and small-town regions, where workers often face longer commutes due to limited job opportunities and inadequate public transportation. By using the Census Transportation Planning Package (CTPP) data, this research fills that gap by analyzing commuting behavior by ethnic group and industry in south-central Minnesota, which is a predominantly rural area of 13 counties in the United States. The results show that both white and minority groups in District 7 experienced an increase in excess commuting from 2006 to 2016, with the minority group in Nobles County showing a significantly higher rise. Analysis by industry reveals that excess commuting in the leisure and hospitality sector (including arts, entertainment, and food services) in Nobles County increased five-fold during this time, indicating a severe spatial mismatch between jobs and affordable housing. In contrast, manufacturing experienced a decline of 50%, possibly indicating better commuting efficiency or a loss of manufacturing jobs. These findings can help city and transportation planners conduct an in-depth analysis of rural-to-urban commuting patterns and develop potential solutions to improve rural transportation infrastructure and accessibility, such as promoting telecommuting and hybrid work options, expanding shuttle routes, and adding more on-demand transit services in rural areas.

1. Introduction

The concept of excess commuting (or wasteful commuting)—defined as the discrepancy between actual and optimal commuting distances—was initiated by Hamilton [1], later improved by White [2], and developed further by Horner and Murray [3]. Considerable scholarly work has been devoted to excess commuting as a measure of the spatial mismatch between jobs and housing that impacts transportation planning and quality of life, particularly in urban and metropolitan areas. While this body of research largely focuses on urban contexts, commuting patterns in rural areas are shaped by fundamentally different conditions. These include dispersed population settlements, limited public transportation options, and limited job opportunities [4,5,6,7,8]. Therefore, the relative neglect of how rural spatial structures shape commuting behaviors—especially for minority groups and low-income populations who often face longer commutes and greater job-access barriers—represents a significant gap in our knowledge of rural economics, transportation, and social systems.
This paper addresses this gap by analyzing aggregated excess commuting by ethnic group and industrial sector in south-central Minnesota in the United States, which is predominantly rural and characterized mainly by agricultural and manufacturing industries. To meet this goal, we propose the following research questions and hypotheses: (1) How do excess commuting patterns differ between white and minority workers in rural south-central Minnesota? We hypothesize that minority groups exhibit a greater increase in excess commuting compared to their white counterparts. (2) Do excess commuting trends differ by industry sector in rural areas? If so, which sectors experience the most significant changes? Sectors related to low-wage service jobs are expected to show a severe spatial mismatch between jobs and housing.
The Minnesota Department of Transportation (MnDOT) in the United States has divided the state into eight transportation districts [9]. This study uses Transportation District 7, which covers part of the south-central region of the state, with some areas characterized by flat and open landscapes dominated by corn and soybean fields [10]. Given its predominantly white population, District 7 has the unique advantage of being able to compare itself with Nobles County, where minorities comprise a larger share of the population due to its sizable immigrant labor force, providing a different commuting picture at a finer spatial scale. The aggregate analysis of District 7 as a whole and the disaggregate study of Nobles County provide valuable insights into the causes of excess commuting, the effects of excess commuting on rural development, and other commuting-related factors that have had an impact on the quality of life. Gaining insight into rural commuting dynamics will allow policymakers and planners to develop public transport systems that address the current spatial mismatch between jobs and housing, and reduce travel inefficiencies, thereby enhancing quality of life in rural areas.
This paper is organized as follows: The literature review on excessive commuting patterns is discussed in Section 2. The methods, which include an investigation of excessive commuting, commuter range, and commuting utilization, are described in Section 3. The results (categorized by ethnicity and industry) and discussion (CTTP data limitations and policy implications) are presented in Section 4. The conclusion is provided in Section 5, along with recommendations for future research.

2. Literature Review

Excess commuting refers to the additional cost of commuting that arises when the actual geography of travel deviates from the pattern that would minimize total travel costs [11]. Various benchmarks and indices for excess commuting have been used to study transportation efficiency and the job–housing balance. These tools have also been applied to examine a wide range of related issues, such as social inequalities, land use distribution, urban structure, transportation planning and policies, commuting economy, and the psychology and health of commuters. Kanaroglou et al. (2015) [12] evaluated and compared four commuting benchmarks (minimum commute, maximum commute, random commute, and proportionally matched commute) and five excess commuting indices (excess commute, commuting potential utilized, commuting economy, normalized commuting economy, and effort). They concluded that each index can be utilized to address a specific policy question, and that urban form and commuting behavior can be more effectively understood when multiple indices are used together [12]. Moreover, different transportation models, such as the radiation model [13,14], the gravity model [15,16], the Monte Carlo simulation [17], and the flow and jump model [18], have been developed to study commuting flows and consistency. Radiation models estimate commuting flows from theory. While parameter-free, they oversimplify commuting behavior by assuming people choose the nearest acceptable jobs and tend to underestimate long commutes [13,14]. Gravity models rely on calibrated parameters to tune how strongly distance and size affect commuting flows [15,16]. They often assume symmetrical flows, which may not exist in real-world job–housing markets. Monte Carlo simulations use repeated random sampling to compute average commute time and model variability in traffic but are computationally intensive and highly sensitive to input distributions [17]. In contrast, jump-diffusion models, with their ability to handle sudden, discrete changes, demonstrate their capacity to adapt effectively to model unexpected disruptions, provided the data on the frequency and magnitude of jumps are available [18].
In addition to excess commuting indices and modeling approaches, the previous literature has focused on examining the major contributing factors to excess commuting. These include not only land use and traffic distribution, but also various socio-demographic and socio-economic characteristics such as age, ethnicity, gender, income, house price, household conditions, occupation, place of residence, type of settlement, and workplace choices. Some studies have focused on how socio-demographic, individual, and household characteristics affect commuting patterns. For instance, McQuaid and Chen (2012) found that the length of the commute in the United Kingdom depended on the worker’s age, whether they had children, the age of their youngest child, occupation, wages, and mode of transportation [19]. Brown et al. (2015) noted that male workers and those in higher-paid occupations “are more likely to commute longer distances, and they are more likely to maintain longer journeys to work regardless of their migration status” [20].
Public transportation was associated with longer commute times, and having children increased the likelihood of commuting for males. It was also found that men commuted further than women in most job categories, based on 2000 Census Transportation Planning Package (CTPP) data for Hamilton County, Ohio, in the United States [21]. However, in Sofia, Bulgaria, women tend to spend more time on commuting trips than men and have a more limited spatial scope for urban opportunities, primarily because they rely on public transportation [22]. These findings highlight the context-dependent nature of gendered commuting patterns. Furthermore, young people tend to prefer public transportation to meet their travel needs, while older adults are more likely to rely on private cars [23,24].
Income, education, occupation, and urban size also shape commuting patterns. In addition, urban and rural residential environments can influence travel patterns [25]. Nevertheless, the existing associations between urban service centers and the surrounding rural hinterland are complex and subject to change [26]. Fan et al.’s (2015) study of active commuting (AC) and its sociodemographic and physical environmental correlates in rural America found that the former explained more variance in AC than the latter, but the associations were complex [27]. In some places, differences exist between long-term rural residents and individuals who have recently moved from the city to the countryside in terms of how far individuals are willing to commute for work. Champion et al. (2009) found that recent newcomers to rural settlements are more likely to commute 12 miles or farther than long-time rural residents of the English countryside [28].
On average, low-income workers have shorter commutes than most commuters in the Memphis Metropolitan Area in the United States, largely because many of them reside in central urban neighborhoods or older inner-ring suburbs located near low-wage employment opportunities [29]. However, these shorter commute times are more indicative of constrained socioeconomic mobility than of commuting efficiency. Ash (2017) [30] demonstrated that the size of the Census Metropolitan Areas (CMAs) in Ontario, Canada, and the number of spatial interaction activities were key factors affecting commuting efficiency. Households with higher education and those in certain occupations, such as education, law, and social community services or government services, were found to have higher rates of excess commuting [30]. Employees in the urban areas of eleven Latin American countries commute about 8.2 minutes longer than self-employed workers, which again highlights the role of employment type in shaping commuting time [31]. Moreover, Zhang et al. (2021) noted that mixed land use, waterbody distribution, and centripetal urbanization of the ten most populous megacities in China have significant impacts on urban commuting distance and time [32]. Kim and Horner (2021) revealed that private workers in Atlanta, Georgia, in the United States experienced a better job–housing balance during the Great Recession (2007–2009), but their commutes were longer and less efficient than those of public workers [33].
Nowadays, Information and Communication Technologies (ICTs) are increasingly integrated into work, permitting work activities to take place anytime, anywhere [34]. Occupational mobility is undergoing constant changes, with more professionals working in non-traditional locations, such as at home, on the road, or in someone else’s office [35]. During the COVID-19 era, a study found that the net travel distance per person increased as employees were more willing to commute farther since they were commuting less frequently from teleworking. Thus, the adoption of remote or hybrid work significantly reshaped commuting behavior and residential location decisions [36]. Longer commutes could lead to higher income as the number of better-paid jobs increases with a worker’s search radius, but this also negatively impacts an individual’s health and overall life satisfaction [35].
Telecommuting has emerged as a potential solution to address excessive commuting, which is associated with work-family conflict, affective commitment (i.e., emotional commitment to the organization), and desire to quit one’s job [37]. Hambly and Lee (2019) found that the average cost savings of telecommuters in Southwest Ontario, Canada, ranged from $8820 to $23,964 per year per telecommuter, in addition to social benefits such as reduced traffic congestion and a lower likelihood of traffic accidents [38]. Policy interventions can also help mitigate the problem of excess commuting. Policies directly targeting bus commuters in Beijing, China—such as fare subsidies and improved service frequency—resulted in greater commuting efficiency gains compared to other policies such as car usage restrictions and driving bans [39]. Separately, Niedzielski et al. (2020) recommended encouraging flexible working hours to distribute work start times and increase off-peak use of public transportation [40]. The impact of the job–worker imbalance on commuting time is greater than in the suburban areas than in the city centers in U.S. metropolitan areas, suggesting that transportation policy priorities may need to be directed to suburban areas [41]. Thus, diverse policies targeting different population subgroups and commuting contexts are needed [42].
Due to the complexity of travel behavior, accurately assessing excess commuting is challenging, and the problem of bias inherent in transportation data requires more careful interpretation, especially in comparative studies across cities and over time [43]. Data aggregation, spatial unit definitions, and reporting errors can significantly affect estimates of excess commuting [3,17]. More refined models based on detailed travel behavior, sociodemographic, and geospatial data have been proposed to calculate excess urban commuting in recent studies. Hu and Li (2021) integrated trip-chaining behavior into excess commuting, arguing that traditional excess commuting studies underestimate actual and optimal commuting and overestimate excess commuting by simplifying commuting as nonstop travel from homes to jobs [44]. Zhang et al. (2021) suggested a greedy-initialization-based genetic algorithm that accounts for efficiency, equity, and commuting frequency [45]. Jing et al. (2023) proposed measuring excess commuting across subgroups of workers differentiated by residential neighborhood types to capture workers’ socio-economic profiles [42]. More refined excess commuting models may offer better accuracy, but require more extensive data, involve higher computational complexity, and often lack transparency.
Mobility and car dependence vary significantly across geographical locations [46]. Tao et al.’s (2019) study of commuting modes in urban and rural areas of Yorkshire, United Kingdom, found that urban commuters travel to work more frequently by bus, walking, and cycling than rural commuters [25]. Because of dataset availability, population density, and transportation issues, most previous studies on excess commuting have been conducted in urban areas. However, the urban focus left rural commuting behaviors relatively unknown, despite their significant differences from those in urban areas. For example, commuting in rural areas is heavily dependent on private vehicles because public transportation is limited [5,6], making the rural residents highly vulnerable to volatility in fuel prices and higher driving expenses. As noted by Jain et al. (2018) [47], residents in areas with high unemployment tend to commute longer distances to their work sites. The loss of rural employment opportunities has forced residents of the countryside to commute to urban areas [48]. Champion et al. (2009) noted that “longer-distance commuting is largely a response to the lack of suitable work, more remote areas are all the more likely to see longer-distance commuting, both by recent migrants and by longer-term residents” [28].
Thus, analyzing excess commuting in rural regions can be beneficial for researchers in better understanding job accessibility, infrastructure gaps, and transportation challenges. For this reason, this study focuses on District 7 in south-central Minnesota, which consists mostly of rural and small-town areas. According to the U.S. Census Bureau, rural counties are defined as those outside of urban clusters, which are determined by population density and land use characteristics [49]. Some recent research supports the growing importance of examining rural commuting trends. Kures and Deller (2023) [50] observed a rise in long-distance (>50 miles) commuting in rural Midwestern areas of the United States across several sub-periods and regions between 2006 and 2019. During this period, remote work was not yet a viable option for most rural workers [50]. However, the COVID-19 pandemic appears to have triggered a significant shift in work patterns, enabling more remote opportunities and allowing rural residents to seek jobs farther from home. While rural residents are more likely to express a preference for working from home, they are less likely to have the opportunity to do so due to limited broadband access and job availability [51]. Rural transportation plays a foundational role in advancing many Sustainable Development Goals (SDGs) and delivers critical socioeconomic benefits to rural communities worldwide [52,53,54]. Investments in rural transportation infrastructure through enhancement, expansion, and modernization can bring significant benefits to both individuals and communities. These include higher household incomes and a reduction in regional inequality [52]. Overall, a deeper understanding of rural excess commuting is essential for designing effective transportation and economic development strategies. By focusing on underrepresented rural regions like District 7 in Minnesota, this research helps fill a knowledge gap and inform evidence-based policy solutions tailored to the unique needs of rural America, particularly in the Midwest.

3. Methodologies

3.1. Study Area and Data

The Minnesota Department of Transportation (MnDOT) in the United States has divided the state into eight transportation districts to make transportation planning more effective, with seven located in Greater Minnesota and one in the Minneapolis-St. Paul area (https://www.dot.state.mn.us/information/districts.html, accessed on 20 May 2025). District 7, the focus of this study, is located in the south-central region of Minnesota, includes 13 counties (see Figure 1 and Table 1), had a population of 290,319 (5.1% of the state total of 5,737,915) in 2024, and is known for agriculture and manufacturing, especially in food processing and machinery. Due to increasing mechanization of agricultural production and to manufacturing shedding labor as it becomes increasingly capital-intensive, the number of available jobs in these sectors has declined over time. Moreover, the rural counties in District 7 are facing the challenges of older adults and low birth rates, thus contributing to the long-term decline in the population.
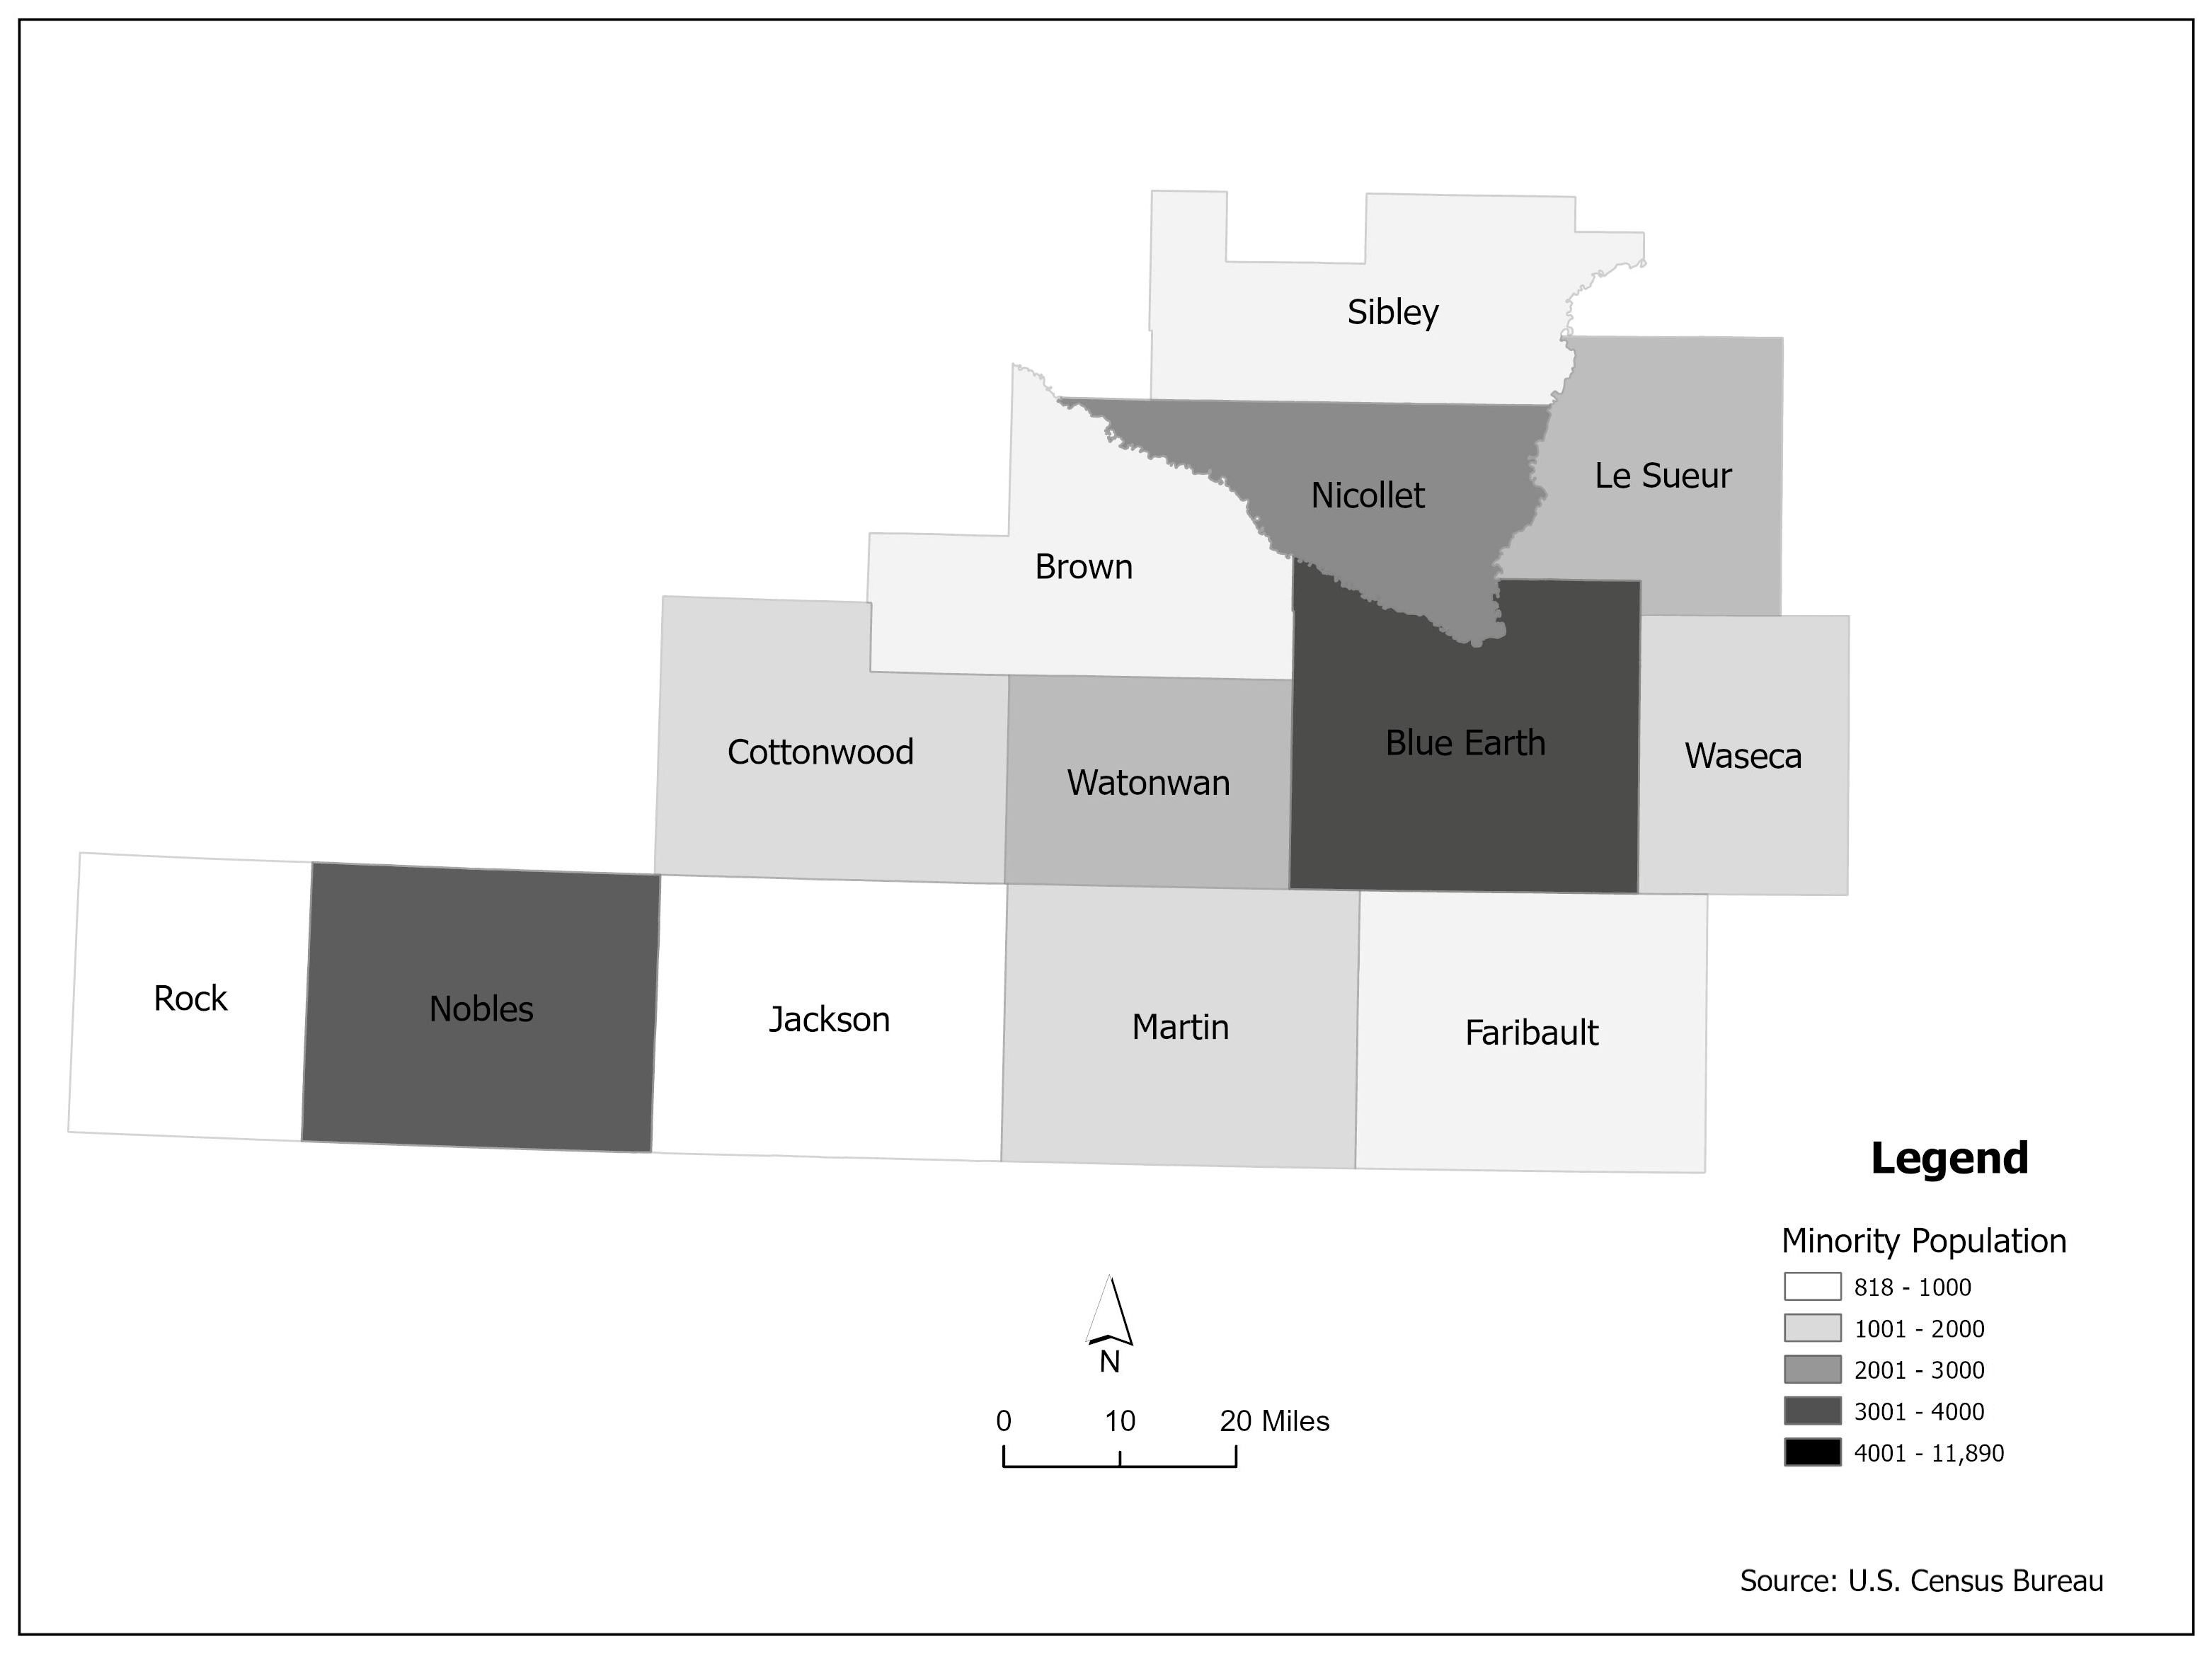
For the disaggregate level of analysis, we chose Nobles County to show a more detailed picture of excess commuting patterns. Nobles County is notable for its higher concentration of minority ethnic groups (see Figure 2), primarily Hispanic workers, due to the structure of its local economy and labor market. Lichter et al. (2016) pointed out that during the mid-2010s, 6.2 percent of all Hispanics in Nobles County lived outside Worthington [55]. Similar to District 7, the county’s main economic sectors are the meatpacking and agricultural processing industries, which usually require fewer skilled laborers, making it a convenient labor market entry point for new immigrant workers. Even though agriculture is one of the pillars of the county’s economy, this primary productive activity has experienced transformations that have brought hardships to some of the area’s residents. There have been episodes during the last sixty years where the number of farms declined, while the average farm size increased, and land values increased during an era of unstable crop prices [56]. On the other hand, meatpacking plants have thrived in the area, although working conditions for those who opt to work there are difficult and occasionally unsafe [57]. Some of these plants have been acquired by foreign companies such as the large JBS pork processing factory, which is a Brazilian interest [58]. JBS is located in Nobles County’s largest community, Worthington, and this facility used to be part of Swift & Company, a global leader in the processing of beef and pork products [55].
Several rural and small-city transit systems serve District 7 and the Nobles County area. These systems provide essential transportation, especially for individuals who do not have a driver’s license or own a vehicle, people with disabilities, and low-income families who rely on these transit services. Nobles County is served by Prairie Land Transit, while its neighbors, Rock and Jackson Counties, are served by United Community Transit [59]. Mattson et al. (2023) found in their study of rural transit ridership that most transit riders in Minnesota are low-income, whereas in neighboring states such as South Dakota, these riders tend to be older adults or individuals with disabilities [60]. These variables indicate that Nobles County has a diverse population, a narrow range of job opportunities, particularly in the agricultural and manufacturing sectors, and limited transportation options, as compared to its other rural counterparts in District 7.
The data used to examine patterns of excess commuting by ethnicity (Table 2) and industry (Table 3) were drawn from the 2006–2010 and 2012–2016 Census Transportation Planning Products (CTPP), which include three components: CTPP 1 (place of residence), CTPP 2 (place of work), and CTPP 3 (commuter flows between residence and workplace), all of which are widely used in analyzing commuting pattern, spatial mismatch between jobs and housing, transportation equity, and travel demand modeling. Traffic analysis zones (TAZs) serve as the primary spatial unit, commonly used in transportation planning, providing the finest geographic resolution available during the study period. CTTP 1 and CTPP 2 include 173 zones each, resulting in 29,929 origin-destination pairs (173 × 173) in CTPP 3. The data were obtained from the American Association of State Highway and Transportation Officials (AASHTO) at https://ctppdata.transportation.org (accessed on 20 May 2025).
The CTPP data have some limitations (e.g., temporal averages and potential biases) when applied to rural areas for excess commuting. First, the CTPP data released after 2000 are based on five-year American Community Survey (ACS) estimates, which may not accurately reveal unusual short-term changes in commuting behaviors, such as those observed during the pandemic. Second, rural areas have small sample sizes and large traffic analysis zones (TAZs), which can impact the accuracy of excess commuting findings, as opposed to urban areas where data representation is more robust.

3.2. Method

Excess commuting, also known as wasteful commuting, measures spatial mismatches between jobs and housing. For the study of excess commuting, the most common method is transportation problem (TP) linear programming, which is utilized to measure either the minimum total travel distance (representing efficient commuting) between housing and employment or the maximum (inefficient commuting).
The objective function, as presented by Equation (1), minimizes total commuting costs (or average costs if divided by the number of observations). Subject to several constraints, the solution technique determines values of x i j that yield minimum regional commuting costs. These restrictions ensure that all job locations receive the required number of workers to meet employment demand (as stated in Equation (2)), that all workers depart from their residence locations to their workplaces (as specified in Equation (3)), and that commuting flows between locations are non-negative (as stipulated in Equation (4)). That is, there must be some degree of commuting or zero commuting.
Minimize or Maximize:
T min ( o r   m a x ) =   i = 1 n j = 1 m c i j   x i j
Subject to:
i = 1 n x i j = D j         for   all   j = 1 ,   2 ,   ,   m
j = 1 m x i j = O i         for   all   i = 1 ,   2 ,   ,   n
        x i j 0                             for   all   i , j
where T min ( o r   m a x ) represents the theoretical minimum (or maximum) trip. Here, n is the number of origin TAZ locations, and m is the number of destination TAZ locations. O i denotes the total number of workers residing in zone i and D j denotes the total number of jobs located in zone j. The travel cost between zone i and zone j is represented by c i j , while the number of trips from zone i and zone j is represented by x i j .
Equation (5) represents excess commuting (EC) that ranges from 0% (perfect job–housing match; no excess commuting) to 100% (maximum inefficiency; severe spatial mismatch). It provides a simple interpretation of the extent to which the observed commute exceeds the minimum. It is useful for detecting spatial mismatches between jobs and housing. However, excess commuting (EC) does not fully capture the extent of commuting inefficiency because it does not account for the theoretical maximum trip ( T m a x ). In addition, excess commuting is highly dependent on the observed trip ( T o b s ) meaning that if the actual average commute becomes longer, the calculated excess commuting can appear smaller—not because commuting efficiency improved, but because the observed commute trips increased. In comparison, commuting utilization (CU), as seen in Equation (6), measures the efficiency with which the area is utilized for commuting purposes, ranging from 0% (full potential commuting range unused) to 100% (full utilization; little remaining flexibility). Unlike the EC approach, CU explains the full range of possible commuting results by incorporating both the minimum and maximum theoretical commute distances.
E C = T o b s T m i n T o b s × 100
where T o b s is the observed trip, and T m i n is the theoretical minimum trip.
C U = T o b s T m i n T m a x T m i n × 100
where the definitions of T o b s and T m i n are the same as in Equation (5), while T m a x is the theoretical maximum trip.
Distance proves to be a key factor in determining commuting patterns: the closer the distance, the more frequent the commutes, in general. The traditional Euclidean distance (straight-line distance) method assigns a value of zero to intrazonal areas if the origin and destination are the same; however, many of these areas still interact in reality. To overcome this limitation, this study applies the model proposed by Frost et al. [61], which calculates the interzonal distance as the square root of the area over π. This approximation accounts for the average distance one would commute within a zone (Equation (7)). In addition, we ensure that this adjusted intrazonal distance is smaller than the shortest interzonal distance in the same row of the distance matrix, which satisfies the minimum-distance rule (Equation (8)).
d i j = R π
D i j = Y i m i n d i j × Y i m i n ,           i f   d i j > Y i m i n
where d i j is the intrazonal distance (when i = j ) ,   R is the area of the zone, and π represents pi, set to 3.14159. D i j is the new intrazonal distance if the distance is more significant than an interzonal distance, and Y i m i n is the minimum of the row i .
To deal with the transportation problem for excess commuting (EC), commuting range (R), and commuting utilization (CU), we performed the lp.transport function from the lpSolve package in R 4.5.0. The input data—primarily traffic analysis zones (173 zones in both CTPP 1 and 2) for the lpSolve package—were preprocessed using ArcGIS Pro 3.4 and Microsoft Excel, and the distance matrix (consisting of 173 rows and 173 columns) that represents the shortest distance (measured in miles) between origin and destination was calculated using TransCAD 9.0. The primary outputs (i.e., minimum and maximum distance or cost) of the model were compared to the observed commuting flows from the CTPP 3 dataset to calculate key excess commuting variables (i.e., EC, R, and CU).
In previous studies, gravity and radiation models have been commonly used to estimate commuting flows, but both have limitations in assessing spatial efficiency as aforementioned in Section 2. Unlike gravity or radiation models, the linear programming transportation model based on the lp.transport function avoids behavioral assumptions and requires no calibration. It provides a normative benchmark for optimal commuting and is well-suited for assessing excess commuting. It also accommodates real-world constraints such as the number of workers and jobs at each location, which makes it especially useful in rural areas like District 7, where commuting is shaped more by necessity than choice. This approach helps reveal structural spatial mismatches and supports the development of more effective, data-driven policy interventions.

4. Results and Discussion

4.1. Results

Table 4 and Figure 3 present excess commuting (EC), commuting range (R), and commuting utilization (CU) for District 7, categorized by ethnic groups and industry for the periods 2006–2010 and 2012–2016. The excess commuting for white workers increased from 49.0% to 54.0%, indicating that their commuting efficiency decreased over time as their actual commutes extended further beyond the theoretical minimum. In addition, commuting utilization increased from 5.8% to 7.0%. This indicates they began using more of their potential commuting ranges, which reveals an increasing spatial dispersion of commuting behavior. Commuting range showed a slight growth from 50.9 miles to 51.9 miles, indicating a moderate but continued spatial mismatch between jobs and housing. In comparison to white workers, the excess commuting for minority workers remained nearly unchanged, from 43.6% to 43.7%, meaning that the overall inefficiency neither improved nor worsened. In contrast, commuting utilization showed a slight decline from 4.3% to 3.8%, which indicates that minority workers were using less of their available commuting range. A remarkable change was the increase in the commuting range for minorities from 49.2 miles to 61.4 miles, a clear sign of the wide spatial separation between homes and jobs in the area, which reflects fewer job options, housing constraints, or transportation barriers.
The majority of industry sectors in District 7 underwent growth in excess commuting (EC), commuting range (R), and commuting utilization (CU), indicating an ongoing trend of longer, more dispersed, and less efficient commuting overall. All sectors showed increases in the excess commuting, with the education and health sector seeing the largest numbers (49.5% in 2006–2010 and 52.7% in 2012–2016), suggesting greater spatial mismatches between jobs and housing. Additionally, commuting range also increased, particularly in the agriculture, mining, and construction sector from 66.3 miles to 67.5 miles, the highest commuting range among all industrial sectors, which reflects a greater spatial dispersion of residences and workplaces. Commuting utilization increased in nearly every industry, with manufacturing (from 6.9% to 9.3%) showing the highest rate of utilization, indicating a widening spatial disconnect between the locations of manufacturing jobs and the residences of those workers. Overall, commuting patterns in District 7 by ethnic groups and industrial sectors revealed increases in all three measurements (i.e., EC, R, and CU), indicating a regional shift toward inefficient and lengthy commutes. These patterns suggest that rural residents commute longer distances to access jobs in a few urbanized zones and regional centers. Workers living outside these centers in District 7 mostly commute by private vehicle, which worsens commuting inefficiency, especially for minority and lower-wage workers, who may face additional barriers to accessing housing near job centers due to high costs and limited affordable options.
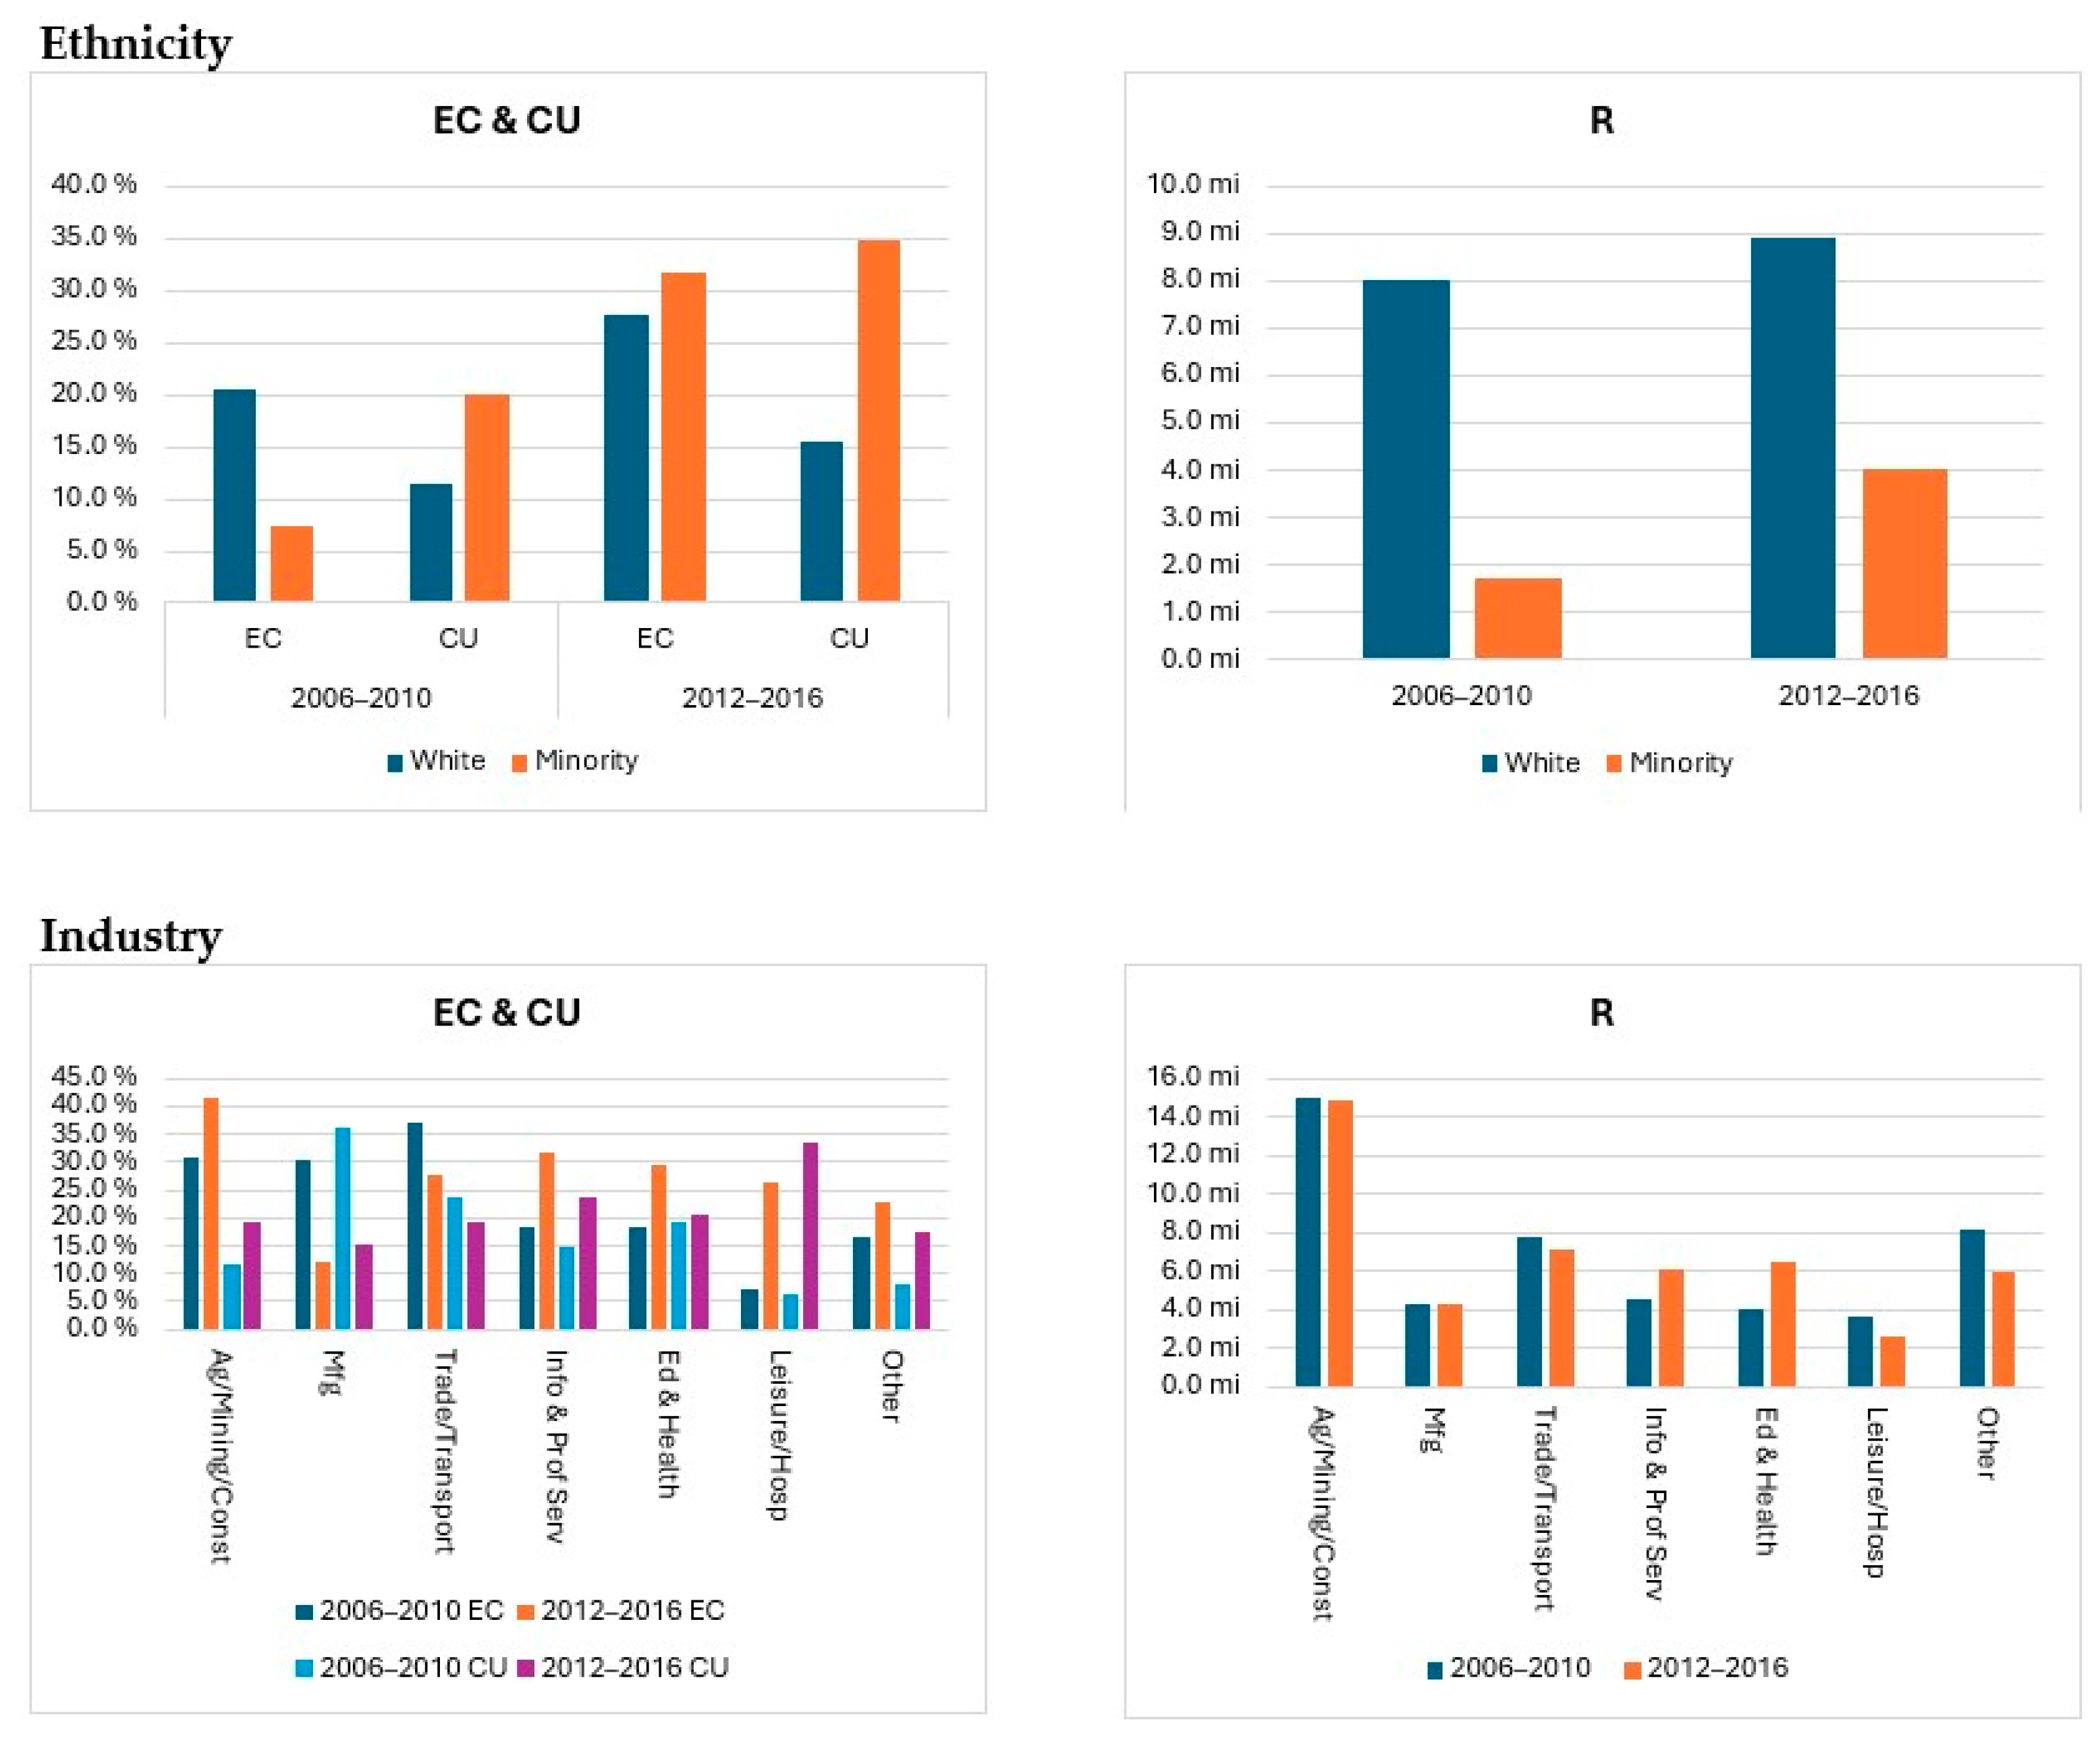
Excess commuting (EC), commuting range (R), and commuting utilization (CU) for Nobles County are presented in Table 5 and Figure 4 by ethnicity and industry for the years 2006–2010 and 2012–2016. The three core metrics—excess commuting (EC), commuting range (R), and commuting utilization (CU)—increased among white commuters, from 20.6% to 27.7%, from 8 miles to 8.9 miles, and from 11.4% to 15.4%, respectively. This indicates that there has been a decent increase in commuting inefficiency, a wider geographic spread between jobs and housing, and a greater use of the available commuting area. In contrast, minority groups experienced a truly dramatic rise in excess commuting from 7.4% to 31.7% and in commuting utilization from 20.1% to 34.7% while commuting range more than doubled from 1.7 miles to 4.0 miles, indicating a change to both longer and more spatially dispersed commutes, compared to their white counterparts. Overall, the regional pattern reflects a decrease in commuting efficiency and an increase in spatial mismatch across all groups in Nobles County, where the change was more noticeable among minority workers.
In terms of industry in Nobels County, most industries saw an increase in excess commuting (EC) and commuting utilization (CU), indicating a substantial rise in commuting burden and range usage. In the leisure hospitality sector (i.e., arts, entertainment, recreation, accommodation, and food services), excess commuting climbed up from 7.4% to 26.3%, and commuting utilization gained from 6.3% to 33.6%, reflecting the extent of commuting inefficiency and spatial dispersion between jobs and housing. In contrast, the manufacturing and trade/ transport sectors (i.e., wholesale/retail trade, transportation, warehousing, and utilities) were more efficient, with the excess commuting going down from 30.3% to 12.1% and from 36.9% to 27.6%, respectively, echoing their respective shifts in commuting utilization. This suggests that manufacturing workers in Nobles County lived closer to their jobs over the time period, likely due to the stable location of the manufacturing facilities (e.g., the JBS pork plant in Worthington) and affordable housing options. It is important to note that the values of excess commuting (EC) and commuting range (R) in Nobles County were much smaller than those in District 7, but the value of commuting utilization (CU) was much greater. This indicates that although workers in Nobles County had shorter and more compact commuting patterns than those in District 7, they made great use of their commuting range, suggesting an intensive spatial mismatch at a local scale.
The previous results highlighted spatial mismatches and commuting inefficiencies across regions, ethnic groups, and industries. District 7 exhibited greater spatial dispersion and underutilized space, most likely due to cross-county commuting and geographical mismatches across a wider area. In contrast, Nobles County showed more localized job–housing mismatches but demonstrated a more intensive use of the limited commuting areas, where even within a small area, workers may not live close to available jobs. More specifically, apparent disparities in commuting patterns by industry and ethnicity were seen when District 7 and Nobles County were compared. White workers in District 7 showed a slow but consistent decline in commuting efficiency, whereas minority workers encountered broader commuting ranges but better commuting efficiency. At a finer geographic scale, minority workers in Nobels County experienced a severe spatial mismatch between jobs and housing within a compact geographic area. Notably, these changes had a significant industry-level impact in the leisure and hospitality sector, where commuting inefficiencies grew sharply, and commuting utilization (CU) rose more than fivefold, suggesting a growing disconnect between housing and employment. This may also be due to the in-person nature of leisure and hospitality jobs, which typically makes remote work less feasible. These drastic changes in different directions indicate that in Nobles County, low-wage service jobs were being pushed further from the locations of affordable housing, and this had a direct impact on minorities. The research findings underscore the need for targeted housing and transportation measures that will address the inefficient commuting patterns at both regional and local scales. It is worth noting that our findings about excess commuting require careful consideration when applied to other rural areas in the United States. Based on the results, District 7 has a unique combination of immigrant-driven labor markets, which have a relatively large Hispanic population, especially in Nobles County, as well as agriculture and meatpacking industries that distinguish it from other rural areas, such as oil and gas in McKenzie County in North Dakota. As a result, these structural differences in industry and demographics may limit the generalization of our findings beyond our study area in south-central Minnesota.

4.2. CTPP Data Limitations

New 2017–2021 CTPP data, which includes the COVID-19 pandemic years of 2020–2021, were released in late March 2025. The pandemic changed our daily lives, including commuting behaviors, most notably a sharp increase in the number of workers working from home. We did not include the CTPP 2017–2021 in our research due to the following reasons. First, the new data is based on the smallest spatial unit, the census tract. By contrast, previous CTPPS (2006–2010 and 2012–2016) used traffic analysis zone (TAZ) as the smallest spatial unit that is mainly designed for transportation planning (e.g., trips, flows, and networks) ideal for our excess commuting (EC), commuting range (R), and commuting utilization (CU) work, compared to the census tracts, which are primarily used for general demographic and statistical analysis. Second, the new CTPP 2017–2021 includes both pre-pandemic years (2017–2019) and post-pandemic years (2020–2021), meaning that it includes very different commuting behaviors. Many workers had to work from home or experienced temporary job loss during the pandemic. This shift demonstrated a sharp decline in the number of commutes, giving the false impression that commuting was efficient. Because of this, the excess commuting (EC) measure is probably underestimated in the pandemic’s CTPP statistics, which could result in inaccurate estimates of commuting efficiency.
Furthermore, the use of traffic analysis zones (TAZs) is limited by the modifiable areal unit problem (MAUP), which refers to statistical bias in spatial analysis, indicating that the size and scale of spatial units may impact the results of a geographic study. Similarly, the excess commuting (EC) calculation is highly dependent on the size and shape of spatial units. TAZ boundaries have changed over time (e.g., 2010 and 2020) in response to population growth, land use changes, and transportation planning needs. In addition, TAZs in rural areas are typically larger and more irregular than those in urban areas. For these reasons, researchers need to be cautious when evaluating the effects of TAZ use due to inconsistencies in analytical results.

4.3. Policy Implications

The information regarding disparities in commuting patterns by industry and ethnicity within our study area can help urban planners and policymakers understand commuting characteristics in rural Minnesota. The spatial disparity between residences and employment that minority groups experience in the region highlights limited job opportunities, housing constraints, and transportation barriers [4,5,6,7,8]. Employment and housing issues are among the most contentious topics during electoral campaigns. Similar concerns have been voiced by numerous working-class communities across the nation. Thus, this type of research should not be ignored by those aspiring to public office. The needs and characteristics of commuters in our study may not be directly comparable to those of residents in other regions, and many elected officials remain unaware of this reality.
In southwestern Minnesota, promoting and supporting public transportation can help address the issue of separation between residences and workplaces. Due to limited transportation options, many people who struggle to get to work or to receive social and medical services may feel socially excluded. Šťastná and Vaishar (2017) pointed out that improving the public transport system can benefit society by reducing social exclusion [62]. Well-organized public transportation systems in rural areas can promote economic growth and enhance social inclusion [63]. Nevertheless, developing an effective public transportation system for rural communities requires policymakers and public administrators to examine successful cases in Europe that can serve as “a positive influence on public transportation ridership” [64].

5. Conclusions and Future Studies

Most commuting studies have focused on urban and metropolitan regions due to dataset availability, population density, and transportation challenges. As a result, rural areas suffer from a knowledge gap regarding excessive commuting, where severe spatial mismatches between jobs and housing exist, transportation costs are high, and access to employment (or public transportation options) is limited. The lack of research about rural areas is an issue that should not be ignored, especially considering that the rural population in the United States is increasing in some parts of the country. Renkow and Hoover (2000) noted that as more urban workers take up residence in rural areas as a result of changes in residential preferences, the connectedness of rural and urban places increases [65].
This study is the result of an in-depth analysis of excess commuting patterns in south-central Minnesota, a predominantly rural area in the United States, to identify differences across both ethnic groups and industrial sectors and highlight implications for improving transportation policy and planning in rural areas. This study made use of both aggregate (District 7) and disaggregate (Nobles County) techniques to examine District 7 in rural Minnesota. The results showed a spatial mismatch between jobs and housing across regions (District 7 vs. Nobles County), ethnic groups (white vs. minority), and industries. District 7 had broad spatial dispersion and underutilized commuting space, whereas Nobles County had a more localized and intensive spatial mismatch. Disparities by ethnicity and industry were evident. Minority workers in Nobles County faced severe jobs–housing gaps in compact areas compared to their white counterparts. The leisure and hospitality sector in Nobles County experienced a five-fold increase in excess commuting during the period, while manufacturing saw a 50% decline, indicating that commuting inefficiency worsened greatly in the former, but improved significantly in the latter. These results demonstrate the need for planning solutions tailored to rural areas with car-dependent commuters and show that spatial mismatch is not exclusive to urban areas. To promote more sustainable commuting in south-central Minnesota, it will be necessary to increase housing options, improve public transportation and infrastructure, and create local job opportunities. In addition, targeted policies that expand rural broadband access and promote remote or hybrid work opportunities are also needed. Unfortunately, rural areas present challenges for the development of public transportation that are not present in urban areas. As noted by Tao et al. (2019), urban areas enjoy greater advantages for increasing sustainable transport modes than rural areas, “especially for bus and cycling modes that more depend on public infrastructure” [25].
Commuting patterns of various socio-demographic and economic characteristics (e.g., age, gender, income, education) in rural regions could be explored in future studies. Previous research has shown that such factors in urban areas shape commuting behaviors [21,22,23,24]. For example, low-income groups often have longer commutes than their high-income counterparts due to limited access to affordable housing near job centers and inadequate transportation options. Examining these disparities will provide a clear picture of the causes of spatial mismatch between jobs and housing in rural areas. Future studies could also look into such commuting behaviors as those that occur in other states or in broader regional areas (e.g., West, Midwest, South, and North) to discover regional trends, such as shifts in employment hubs. The outcomes of transportation and housing policy planning that support more equitable and efficient modes of transportation would be among the key benefits of such research.

Author Contributions

Conceptualization, W.J. and J.J.L.; Methodology, W.J.; Software, W.J.; Validation, W.J.; Formal analysis, W.J.; Resources, J.J.L. and F.Y.; Writing—original draft, W.J. and F.Y.; Writing—review & editing, W.J., J.J.L. and F.Y. All authors have read and agreed to the published version of the manuscript.

Funding

This research received no external funding.

Institutional Review Board Statement

Not applicable.

Informed Consent Statement

Not applicable.

Data Availability Statement

The data presented in this study are available from AASHTO at https://ctppdata.transportation.org (accessed on 20 May 2025).

Conflicts of Interest

The authors declare no conflict of interest.

References

  1. Hamilton, B. Wasteful commuting. J. Polit. Econ. 1982, 90, 1035–1053. [Google Scholar] [CrossRef]
  2. White, M.J. Urban commuting journeys are not “wasteful”. J. Polit. Econ. 1988, 96, 1097–1110. [Google Scholar] [CrossRef]
  3. Horner, M.W.; Murray, A.T. Excess commuting and the modifiable areal unit problem. Urban Stud. 2002, 39, 131–139. [Google Scholar] [CrossRef]
  4. Pucher, J.; Renne, J.L. Rural mobility and mode choice: Evidence from the 2001 national household travel survey. Transportation 2005, 32, 165–186. [Google Scholar] [CrossRef]
  5. Espeland, S.; Rowangould, D. Rural travel burdens in the United States: Unmet need and travel costs. J. Transp. Geogr. 2024, 121, 104016. [Google Scholar] [CrossRef]
  6. Hole, A.R.; FitzRoy, F.R. Commuting in small towns in rural areas: The case of St Andrews. Int. J. Transp. Econ. 2005, 32, 77–92. [Google Scholar]
  7. Fletcher, C.N.; Garasky, S.B.; Jensen, H.H.; Nielsen, R.B. Transportation access: A key employment barrier for rural low-income families. J. Poverty 2010, 14, 123–144. [Google Scholar] [CrossRef]
  8. Parmaksız, D.; Ülkü, M.A.; Weigand, H. Investigating rural logistics and transportation through the lens of quadruple bottom line sustainability. Logistics 2024, 8, 81. [Google Scholar] [CrossRef]
  9. Izevbekhai, B.I.; Aydin, C.; Velasquez, R. Evaluation of Benefits of Drainable Base Systems Used by MnDOT; Report No. MN 2024-32; Minnesota Department of Transportation, Office of Research & Innovation: St. Paul, MN, USA, 2024. [Google Scholar]
  10. Current, D.; Motschke, C.; Serra, A., Jr.; Wyatt, G.; Zamora, D. Expanding Landowner Adoption of Snow Control Measures Through a Better Understanding of Landowner Knowledge, Attitudes and Practices; Report No. MN/RC 2019-44; Minnesota Department of Transportation, Office of Research & Innovation: St. Paul, MN, USA, 2019. [Google Scholar]
  11. Murphy, E.; Killen, J.E. Commuting economy: An alternative approach for assessing regional commuting efficiency. Urban Stud. 2011, 48, 1255–1272. [Google Scholar] [CrossRef]
  12. Kanaroglou, P.S.; Higgins, C.D.; Chowdhury, T.A. Excess commuting: A critical review and comparative analysis of concepts, indices, and policy implications. J. Transp. Geogr. 2015, 44, 13–23. [Google Scholar] [CrossRef]
  13. Simini, F.; González, M.C.; Maritan, A.; Barabási, A.-L. A universal model for mobility and migration patterns. Nature 2012, 484, 96–100. [Google Scholar] [CrossRef]
  14. Ren, Y.; Ercsey-Ravasz, M.; Wang, P.; González, M.C.; Toroczkai, Z. Predicting commuter flows in spatial networks using a radiation model based on temporal ranges. Nat. Commun. 2014, 5, 5347. [Google Scholar] [CrossRef]
  15. Persyn, D.; Torfs, W. A gravity equation for commuting with an application to estimating regional border effects in Belgium. J. Econ. Geogr. 2016, 16, 155–175. [Google Scholar] [CrossRef]
  16. Mazzoli, M.; Molas, A.; Bassolas, A.; Lenormand, M.; Colet, P.; Ramasco, J. Field theory for recurrent mobility. Nat. Commun. 2019, 10, 3895. [Google Scholar] [CrossRef] [PubMed]
  17. Hu, Y.; Wang, F. Decomposing excess commuting: A Monte Carlo simulation approach. J. Transp. Geogr. 2015, 44, 43–52. [Google Scholar] [CrossRef]
  18. Varga, L.; Tóth, G.; Neda, Z. Commuting patterns: The flow and jump model and supporting data. EPJ Data Sci. 2018, 7, 37. [Google Scholar] [CrossRef]
  19. McQuaid, R.W.; Chen, T. Commuting times: The role of gender, children and part-time work. Res. Transp. Econ. 2012, 34, 66–73. [Google Scholar] [CrossRef]
  20. Brown, D.L.; Champion, T.; Coombes, M.; Wymer, C. The migration-commuting nexus in rural England: A longitudinal analysis. J. Rural Stud. 2015, 41, 118–128. [Google Scholar] [CrossRef]
  21. Kim, C.; Sang, S.; Chun, Y.; Lee, W. Exploring urban commuting imbalance by jobs and gender. Appl. Geogr. 2012, 32, 532–545. [Google Scholar] [CrossRef]
  22. Kwan, M.-P.; Kotseve, A. Gender differences in commute time and accessibility in Sofia, Bulgaria: A study using 3D geo-visualization. Geogr. J. 2015, 181, 83–96. [Google Scholar] [CrossRef]
  23. Levin, L. How may public transport influence the practice of everyday life among younger and older people and how may their practices influence public transport? Soc. Sci. 2019, 8, 96. [Google Scholar] [CrossRef]
  24. Jang, W.; Yuan, F.; Lopez, J.J. Investigating sustainable commuting patterns by socio-economic factors. Sustainability 2021, 13, 2180. [Google Scholar] [CrossRef]
  25. Tao, X.; Fu, Z.; Comber, A.J. An analysis of modes of commuting in urban and rural areas. Appl. Spat. Anal. Policy 2019, 12, 831–845. [Google Scholar] [CrossRef]
  26. Green, M.B.; Meyer, S.P. An overview of commuting in Canada with special emphasis on rural commuting and employment. J. Rural Stud. 1997, 13, 163–175. [Google Scholar] [CrossRef]
  27. Fan, J.X.; Wen, M.; Kowaleski-Jones, L. Sociodemographic and environmental correlates of active commuting in rural America. J. Rural Health 2015, 31, 176–185. [Google Scholar] [CrossRef]
  28. Champion, T.; Coombes, M.; Brown, D.L. Migration and longer-distance commuting in rural England. Reg. Stud. 2009, 43, 1245–1259. [Google Scholar] [CrossRef]
  29. Antipova, A. Analysis of commuting distances of low-income workers in Memphis Metropolitan area, TN. Sustainability 2020, 12, 1209. [Google Scholar] [CrossRef]
  30. Ash, L.J. Excess Commuting and Its Relation to Urban Form in Ontario, Canada. Master’s Thesis, University of Windsor, Windsor, ON, Canada, 2017. Available online: https://hdl.handle.net/20.500.14776/7465 (accessed on 1 March 2025).
  31. Giménez-Nadal, J.I.; Velilla, J.; Ortega-Lapiedra, R. Differences in commuting between employee and self-employed workers: The case of Latin America. J. Transp. Geogr. 2024, 114, 103770. [Google Scholar] [CrossRef]
  32. Zhang, H.; Xu, S.; Liu, X.; Liu, C. Near ’real-time’ estimation of excess commuting from open-source data: Evidence from China’s megacities. J. Transp. Geogr. 2021, 91, 102929. [Google Scholar] [CrossRef]
  33. Kim, K.; Horner, M.W. Examining the impacts of the Great Recession on the commuting dynamics and jobs-housing balance of public and private sector workers. J. Transp. Geogr. 2021, 90, 102933. [Google Scholar] [CrossRef]
  34. Alexander, B.; Dijst, M. Professional workers @ work: Importance of work activities for electronic and face-to-face communications in the Netherlands. Transportation 2012, 39, 919–940. [Google Scholar] [CrossRef]
  35. Kersting, M.; Matthies, E.; Lahner, J.; Schlüter, J. A socio-economic analysis of commuting professionals. Transportation 2021, 48, 2127–2158. [Google Scholar] [CrossRef]
  36. Campisi, T.; Tesoriere, G.; Trouva, M.; Papas, T.; Basbas, S. Impact of teleworking on travel behaviour during the COVID-19 era: The case of Sicily, Italy. Transp. Res. Procedia 2022, 60, 251–258. [Google Scholar] [CrossRef]
  37. Elfering, A.; Igic, I.; Kritzer, R.; Semmer, N.K. Commuting as a work-related demand: Effects on work-to-family conflict, affective commitment, and intention to quit. Psych J. 2020, 9, 562–577. [Google Scholar] [CrossRef]
  38. Hambly, H.; Lee, J. The rural telecommuter surplus in Southwestern Ontario, Canada. Telecomm. Policy 2019, 43, 278–286. [Google Scholar] [CrossRef]
  39. Zhou, J.; Murphy, E.; Long, Y. Commuting efficiency gains: Assessing different transport policies with new indicators. Int. J. Sustain. Transp. 2018, 13, 710–721. [Google Scholar] [CrossRef]
  40. Niedzielski, M.A.; Hu, Y.; Stępniak, M. Temporal dynamics of the impact of land use on modal disparity in commuting efficiency. Comput. Environ. Urban Sys. 2020, 83, 101523. [Google Scholar] [CrossRef]
  41. Kim, C.; Choi, C. Towards sustainable urban spatial structure: Does decentralization reduce commuting times? Sustainability 2019, 11, 1012. [Google Scholar] [CrossRef]
  42. Jing, Y.; Hu, Y.; Niedzielski, M.A. Neighborhood divides: Where you live matters for commuting and its efficiency. Cities 2023, 132, 104091. [Google Scholar] [CrossRef]
  43. Ma, K.R.; Banister, D. Excess commuting: A critical review. Transp. Rev. 2006, 26, 749–767. [Google Scholar] [CrossRef]
  44. Hu, Y.; Li, X. Modeling and analysis of excess commuting with trip chains. Ann. Am. Assoc. Geogr. 2021, 111, 1851–1867. [Google Scholar] [CrossRef]
  45. Zhang, Y.; Zhang, Y.; Zhou, J. A novel excess commuting framework: Considering commuting efficiency and equity simultaneously. Urban Anal. City Sci. 2021, 48, 151–168. [Google Scholar] [CrossRef]
  46. Delbosc, A.; Currie, G. The spatial context of transport disadvantage, social exclusion, and well-being. J. Transp. Geogr. 2011, 19, 1130–1137. [Google Scholar] [CrossRef]
  47. Jain, M.; Korzhenevych, A.; Hecht, R. Determinants of commuting patterns in a rural-urban megaregion of India. Transp. Policy 2018, 68, 98–106. [Google Scholar] [CrossRef]
  48. Partridge, M.D.; Ali, K.; Olfert, M.R. Rural-to-urban commuting: Three degrees of integration. Growth Change 2010, 41, 303–335. [Google Scholar] [CrossRef]
  49. Ratcliffe, M.; Burd, C.; Holder, K.; Fields, A. Defining Rural at the U.S. Census Bureau; U.S. Census Bureau: Washington, DC, USA, 2016.
  50. Kures, M.; Deller, S.C. Growth in commuting patterns and their impacts on rural workforce and economic development. Econ. Dev. Q. 2023, 37, 54–63. [Google Scholar] [CrossRef]
  51. Paul, J. Work from home behaviors among U.S. urban and rural residents. J. Rural Stud. 2022, 96, 101–111. [Google Scholar] [CrossRef]
  52. Kaiser, N.; Barstow, C.K. Rural transportation infrastructure in low- and middle-income countries: A review of impacts, implications, and interventions. Sustainability 2022, 14, 2149. [Google Scholar] [CrossRef]
  53. Spey, I.-K.; Kupsch, D.; Bobo, K.S.; Waltert, M.; Schwarze, S. The Effects of road access on income generation. Evidence from an integrated conservation and development project in Cameroon. Sustainability 2019, 11, 3368. [Google Scholar] [CrossRef]
  54. Charlery, L.C.; Qaim, M.; Smith-Hall, C. Impact of infrastructure on rural household income and inequality in Nepal. J. Dev. Eff. 2015, 8, 266–286. [Google Scholar] [CrossRef]
  55. Lichter, D.T.; Parisi, D.; Taquino, M.C. Emerging patterns of Hispanic residential segregation: Lessons from rural and small-town America. Rural Sociol. 2016, 81, 483–518. [Google Scholar] [CrossRef]
  56. Smith, J.M. Racializing rural places through USDA home economics agricultural extension, 1965–1982. J. Rural Stud. 2024, 106, 103240. [Google Scholar] [CrossRef]
  57. Krumel, T.P.; Goodrich, C. Meatpacking working conditions and the spread of COVID-19. Appl. Econ. 2023, 55, 3637–3660. [Google Scholar] [CrossRef]
  58. Byttebier, K. COVID-19’s Impact on Labour. In COVID-19 and Capitalism: Success and Failure of the Legal Methods for Dealing with a Pandemic; Springer International Publishing: Cham, Switzerland, 2022; pp. 663–787. [Google Scholar]
  59. Mattson, J.; Peterson, D.; Hough, J.; Godavarthy, R.; Kack, D. Measuring the Economic Benefits of Rural and Small Urban Transit Services in Greater Minnesota; Report No. MN 2020-10; Minnesota Department of Transportation, Office of Policy Analysis, Research & Innovation: St. Paul, MN, USA, 2020. [Google Scholar]
  60. Mattson, J.; Quayson, B.; Ebrahimi, Z.D. Comparing Public Transportation Services for Rural States in the Upper Midwest and Great Plains Region; Report No. 320; Upper Great Plains Transportation Institute: Fargo, ND, USA, 2023. [Google Scholar]
  61. Frost, M.; Linneker, B.; Spence, N. Excess or wasteful commuting in the selection of British cities. Transp. Res. Part A Policy Pract. 1998, 32, 529–538. [Google Scholar] [CrossRef]
  62. Šťastná, M.; Vaishar, A. The relationship between public transport and the progressive development of rural areas. Land Use Policy 2017, 67, 107–114. [Google Scholar] [CrossRef]
  63. Velaga, N.R.; Nelson, J.D.; Wright, S.D.; Farrington, J.H. The potential role of flexible transport services in enhancing rural public transport provision. J. Public Transp. 2012, 15, 111–131. [Google Scholar] [CrossRef]
  64. Buehler, R. Promoting public transportation: Comparison of passengers and policies in Germany and the United States. Transp. Res. Rec. 2009, 2110, 60–68. [Google Scholar] [CrossRef]
  65. Renkow, M.; Hoover, D. Commuting, migration, and rural-urban population dynamics. J. Reg. Sci. 2000, 40, 261–287. [Google Scholar] [CrossRef]
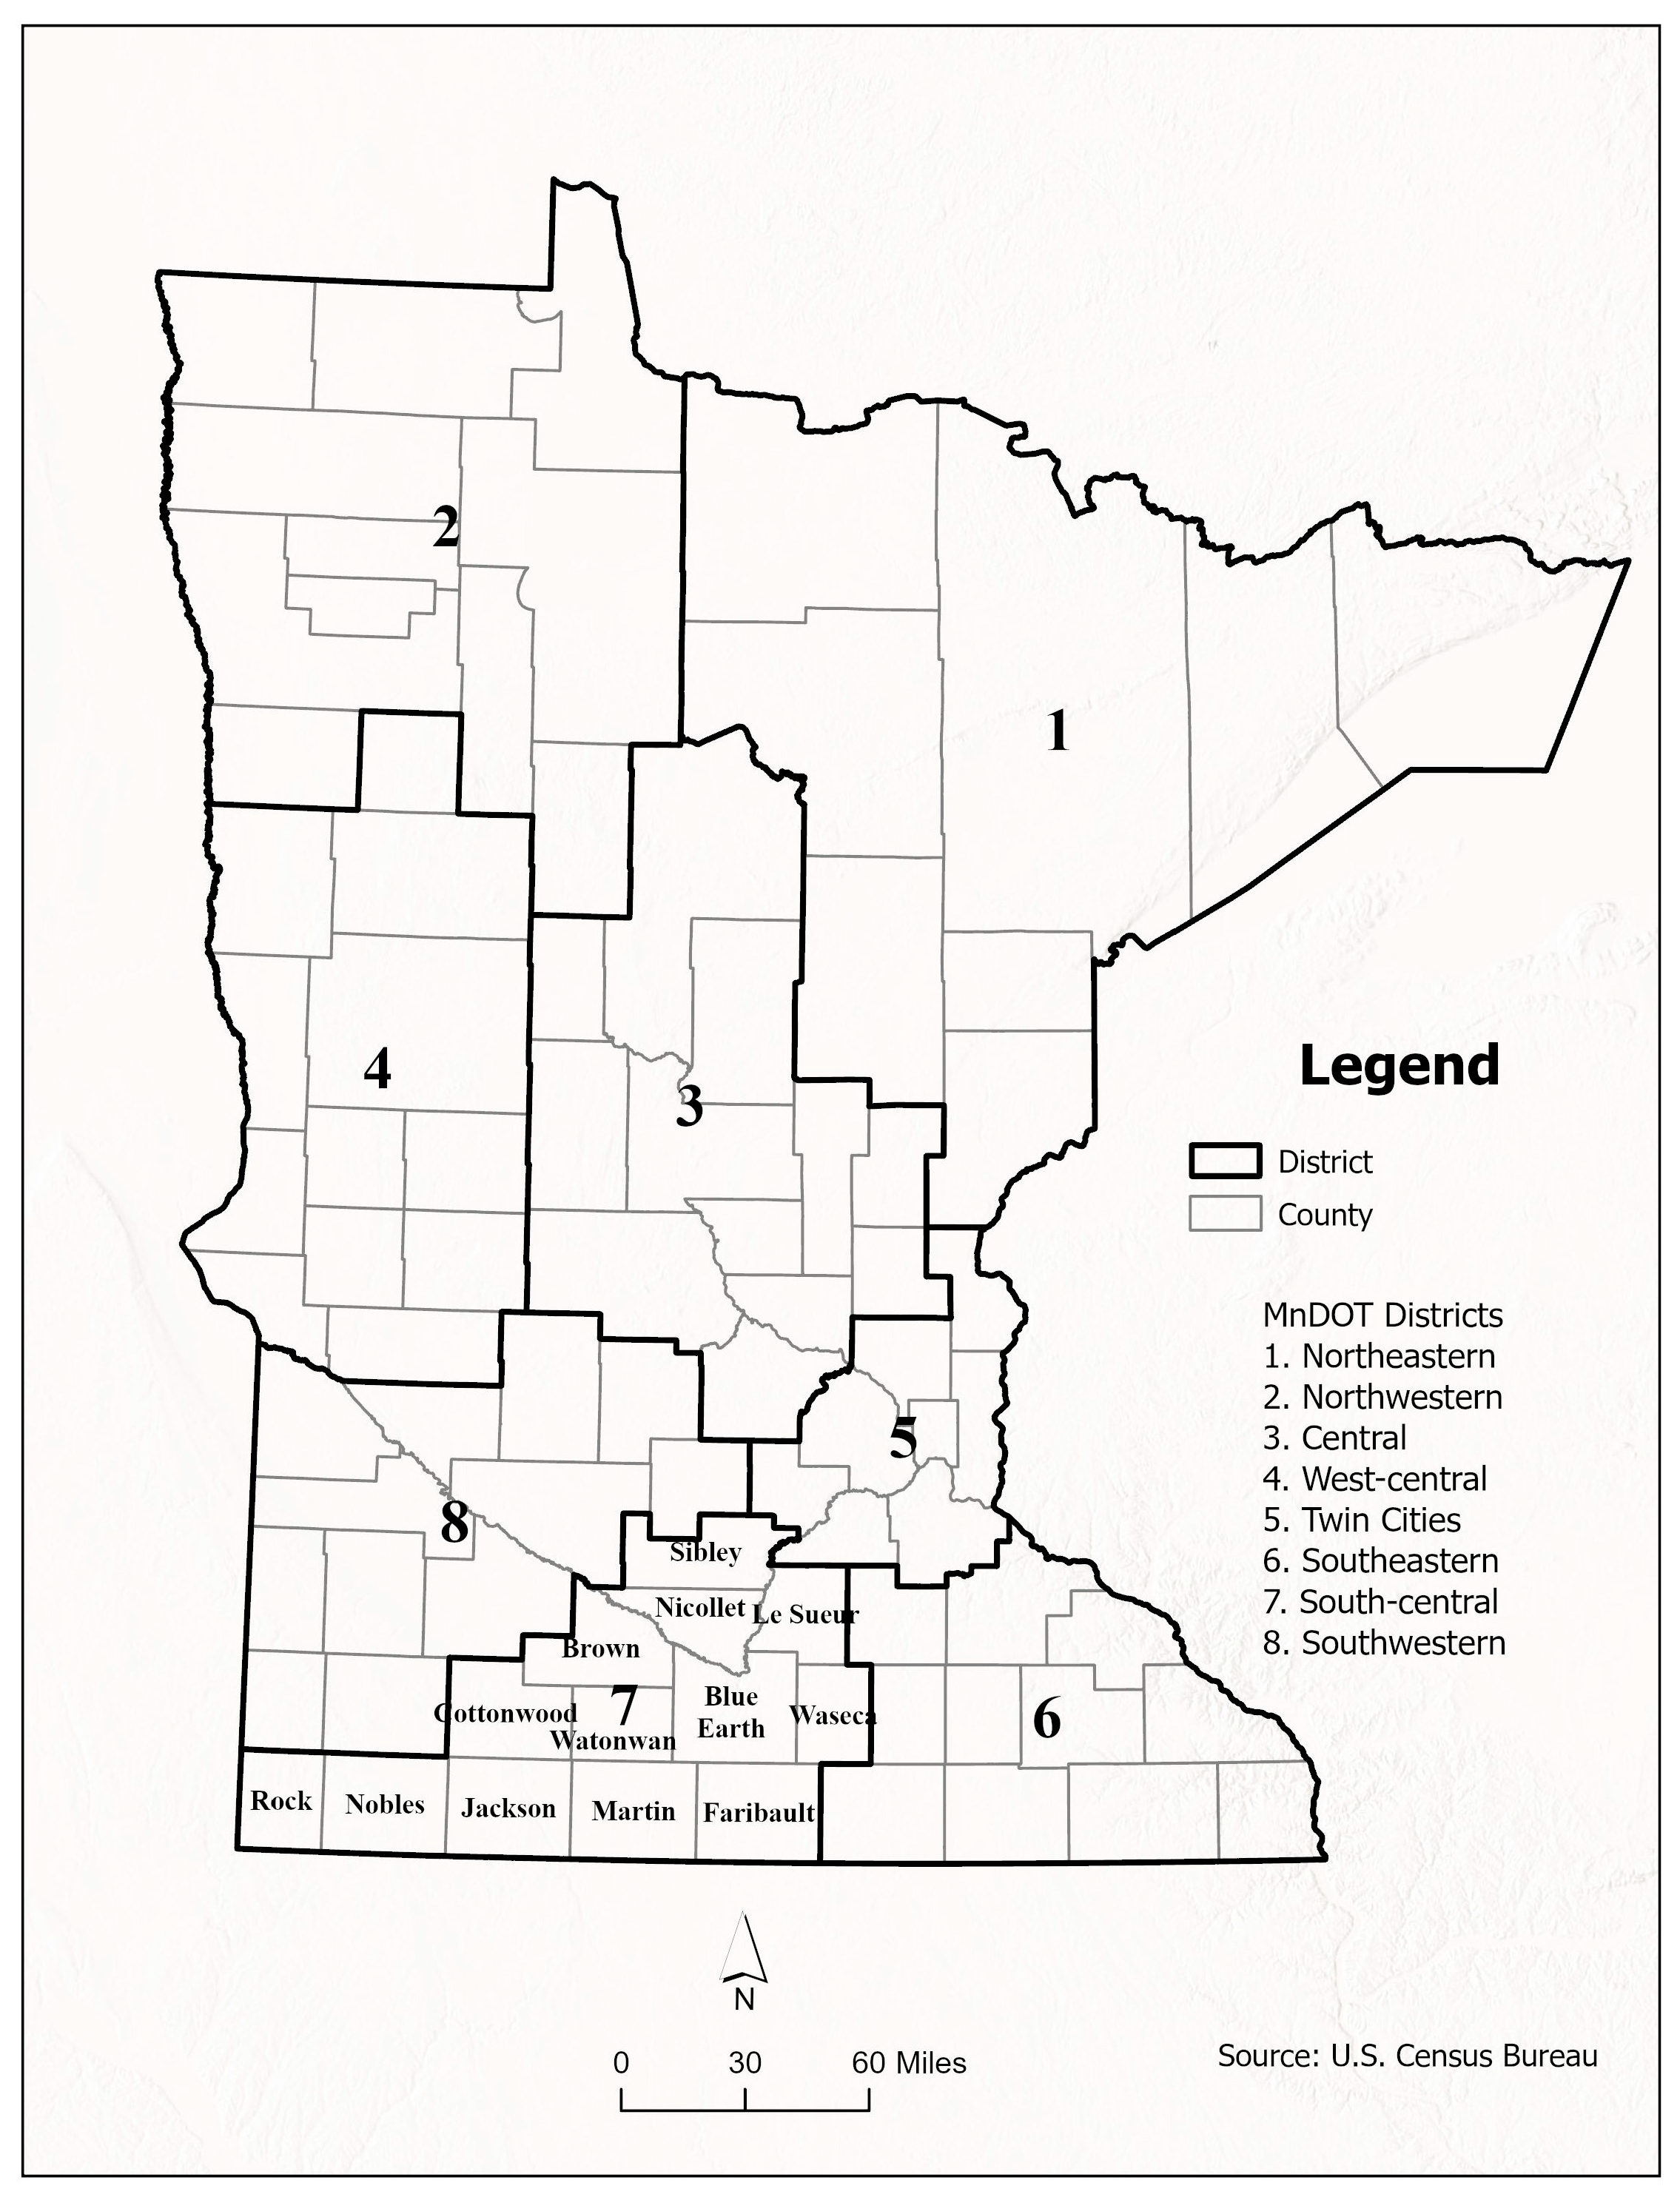
Figure 1. MnDOT Map Showing County Names in District 7.
Sustainability 17 07122 g001
Figure 2. Map showing minority population in District 7.
Sustainability 17 07122 g002
Figure 3. Bar chart showing EC, CU, and R by ethnicity and industry in District 7. Note: EC (excess commuting), CU (commuting utilization), and R (commuting range). Industry types are detailed in Table 3.
Sustainability 17 07122 g003
Figure 4. Bar chart showing EC, CU, and R by ethnicity and industry in Nobles County. Note: EC (excess commuting), CU (commuting utilization), and R (commuting range). Industry types are detailed in Table 3.
Sustainability 17 07122 g004
Table 1. County classification by urban–rural type in District 7.
NameType *
Blue EarthEntirely Urban
BrownTown/rural mix
CottonwoodTown/rural mix
FaribaultTown/rural mix
JacksonTown/rural mix
Le SueurUrban/town/rural mix
MartinTown/rural mix
NicolletUrban/town/rural mix
NoblesTown/rural mix
RockUrban/town/rural mix
SibleyUrban/town/rural mix
WasecaUrban/town/rural mix
WatonwanTown/rural mix
* County classifications by urban–rural type are based on the Center for Rural Policy and Development at https://www.ruralmn.org (accessed on 20 May 2025).
Table 2. Classification of ethnic groups.
CategoryDescription
1Total persons
2White alone, not Hispanic/Latino
3Other
Note: Data and descriptions are from the American Association of State Highway and Transportation Officials (AASHTO), available at https://ctppdata.transportation.org (accessed on 20 May 2025).
Table 3. Classification of industry groups.
CategoryDescriptionNew Label
1Total, all IndustriesAll
2Agriculture, Forestry, Fishing and Hunting, and Mining; Construction; Armed ForcesAg, Mining, & Const
3ManufacturingMfg
4Wholesale Trade; Retail Trade; Transportation and Warehousing, and UtilitiesTrade & Transport
5Information; Finance, Insurance, Real Estate and Rental, and Leasing; Professional, Scientific, Management, Administrative, and Waste Management ServicesInfo & Prof. Services
6Educational, Health, and Social ServicesEd & Health
7Arts, Entertainment, Recreation, Accommodation, and Food ServicesLeisure & Hospitality
8Other services (except Public Administration); Public AdministrationOther
Note: As in Table 2, data and descriptions are from the American Association of State Highway and Transportation Officials (AASHTO).
Table 4. Commuting by ethnicity and industry in District 7.
2006–20102012–2016
CategoryTminTobsTmaxEC (%)RCU (%)TminTobsTmaxEC (%)RCU (%)
Ethnicity
White3.16.054.049.050.95.83.16.755.054.051.97.0
Minority2.74.952.043.649.24.33.05.464.443.761.43.8
Industry
Ag/Mining/Const3.86.470.239.666.33.83.86.971.444.667.54.6
Mfg3.96.642.340.338.36.94.78.444.344.139.79.3
Trade/Transport3.35.955.543.152.24.83.77.157.647.953.96.3
Info & Prof Serv3.55.952.841.149.34.93.26.351.548.948.36.4
Ed & Health3.16.053.949.550.85.93.16.652.152.749.07.1
Leisure/Hosp2.54.050.437.247.93.12.64.853.845.751.24.3
Other3.56.757.748.054.25.93.66.858.246.454.55.8
All3.06.053.950.150.95.93.06.655.554.552.56.9
Note: T m i n (the theoretical minimum trip), T o b s (the observed trip), T m a x (the theoretical maximum trip), and R (commuting range, calculated as T m a x T m i n ) are measured in miles, whereas EC (excess commuting) and CU (commuting utilization) are presented as percentages. Industry types are detailed in Table 3.
Table 5. Commuting by ethnicity and industry in Nobles County.
2006–20102012–2016
Category TminTobsTmax EC (%) R CU (%) TminTobsTmax EC (%) R CU (%)
Ethnicity
White3.54.411.520.68.011.43.65.012.527.78.915.4
Minority4.24.55.87.41.720.13.04.47.031.74.034.7
Industry
Ag/Mining/Const3.95.718.930.915.011.74.06.918.941.714.919.2
Mfg3.65.17.930.34.336.04.75.49.012.14.315.1
Trade/Transport3.25.010.936.97.823.83.65.010.727.67.119.3
Info & Prof Serv3.03.67.418.24.514.73.14.69.231.66.123.6
Ed & Health3.44.17.418.54.019.23.24.69.729.76.520.8
Leisure/Hosp2.93.16.67.43.76.32.43.35.026.32.633.6
Other3.33.911.416.58.18.03.64.69.622.86.017.5
All3.14.410.930.57.917.23.04.811.536.98.521.0
Note: Tmin, Tobs, Tmax, and R (commuting range) are measured in miles, whereas EC (excess commuting) and CU (commuting utilization) are presented as percentages. Industry types are detailed in Table 3.
Disclaimer/Publisher’s Note: The statements, opinions and data contained in all publications are solely those of the individual author(s) and contributor(s) and not of MDPI and/or the editor(s). MDPI and/or the editor(s) disclaim responsibility for any injury to people or property resulting from any ideas, methods, instructions or products referred to in the content.