Article

Spatiotemporal Dynamics of the Aridity Index in Central Kazakhstan

1
Faculty of Geography and Environmental Sciences, Al-Farabi Kazakh National University, Almaty 050040, Kazakhstan
2
China-Kazakhstan Joint Laboratory for Remote Sensing Technology and Application, Almaty 050040, Kazakhstan
3
State Key Laboratory of Ecological Safety and Sustainable Development in Arid Lands, Xinjiang Institute of Ecology and Geography, Chinese Academy of Sciences, Urumqi 830011, China
4
Research Center for Ecology and Environment of Central Asia, Chinese Academy of Sciences, Urumqi 830011, China
5
University of Chinese Academy of Sciences, Beijing 100049, China
*
Author to whom correspondence should be addressed.
Sustainability 2025, 17(15), 7089; https://doi.org/10.3390/su17157089
Submission received: 22 May 2025 / Revised: 29 July 2025 / Accepted: 3 August 2025 / Published: 5 August 2025
(This article belongs to the Section Air, Climate Change and Sustainability)

Abstract

This study analyzes spatiotemporal aridity dynamics in Central Kazakhstan (1960–2022) using a monthly Aridity Index (AI = P/PET), where P is precipitation and PET is potential evapotranspiration, Mann–Kendall trend analysis, and climate zone classification. Results reveal a northeast–southwest aridity gradient, with Aridity Index ranging from 0.11 to 0.14 in southern deserts to 0.43 in the Kazakh Uplands. Between 1960–1990 and 1991–2022, southern regions experienced intensified aridity, with Aridity Index declining from 0.12–0.15 to 0.10–0.14, while northern mountainous areas became more humid, where Aridity Index increased from 0.40–0.44 to 0.41–0.46. Seasonal analysis reveals divergent patterns, with winter showing improved moisture conditions (52.4% reduction in arid lands), contrasting sharply with aridification in spring and summer. Summer emerges as the most extreme season, with hyper-arid zones (8%) along with expanding arid territories (69%), while autumn shows intermediate conditions with notable dry sub-humid areas (5%) in northwestern regions. Statistical analysis confirms these observations, with northern areas showing positive Aridity Index trends (+0.007/10 years) against southwestern declines (−0.003/10 years). Key drivers include rising temperatures (with recent degradation) and variable precipitation (long-term drying followed by winter and spring), and PET fluctuations linked to temperature. Since 1991, arid zones have expanded from 40% to 47% of the region, with semi-arid lands transitioning to arid, with a northward shift of the boundary. These changes are strongly seasonal, highlighting the vulnerability of Central Kazakhstan to climate-driven aridification.

1. Introduction

The phenomenon of global warming, which is a consequence of increasing human influence, has been demonstrated to have a significant impact on the frequency and severity of natural hazards, including droughts, forest fires, and floods [1,2,3,4]. In this regard, arid lands are among the most vulnerable to these processes, covering 41% of the world’s terrestrial area. These regions are home to over two billion people [5], where mounting anthropogenic pressures and climate change amplify risks of desertification—the irreversible transition to desert-like conditions—and recurrent droughts, defined as prolonged moisture deficits exceeding natural variability [6]. These compound stressors exacerbate ecological degradation and poverty, underscoring the need to quantify their spatiotemporal dynamics.
Aridization is associated with multiple factors, including precipitation, surface radiation, humidity, soil moisture content, evaporation, and VPD (vapor pressure deficit) [7,8,9,10], and others. To assess, analyze, and monitor drought conditions across regions, various indices based on these factors have been developed worldwide [11,12]. Among them, the Aridity Index is the most widely used and has been applied in numerous scientific reports and studies [11,13,14,15]. The Aridity Index varies in its formulas and applications, ranging from climate classification [16,17] to agricultural drought monitoring [18]. This study employs the Aridity Index to assess actual aridity, in line with contemporary agroclimatic research [19]. The Aridity Index reflects the exchange of energy and water between the land surface and the atmosphere, and its variability can be used to predict droughts and floods, making it critically important for sustainable management of socio-ecological systems. This index has been recommended by the Food and Agriculture Organization (FAO) [20] and is employed by the United Nations Educational, Scientific, and Cultural Organization (UNESCO).
For instance, McDonald et al. [21] utilized the Aridity Index as a proxy indicator for developing a framework of global water availability for future urban growth, given the limited water data available for many regions. Kimura and Moriyama [22] applied the Aridity Index to assess the distribution of arid regions and the total arid land area from 2001 to 2013. Their and other findings revealed an expansion of hyper-arid and arid lands, while the proportion of semi-arid and dry sub-humid regions decreased [23]. Dos Santos et al. [24] employed the Aridity Index to identify areas vulnerable to desertification in Brazil.
In addition, based on modeling projections, the researchers found that global land aridity will increase throughout the 21st century [14]. This trend underscores the urgent need for sustainable land management strategies in drylands, which are highly susceptible to climate change and anthropogenic pressures [25,26].
In Central Asia (CA), aridity levels vary depending on geographical location and climatic conditions. Moyan Li et al. [10] observed a general increase in aridity across most of CA, indicating a clear trend toward atmospheric drying. While extensive research exists on droughts in the region, few studies have examined moisture and drought trends across different climatic zones within CA. Moreover, regional adaptation and mitigation policies require detailed spatial-scale analyses of aridity changes to ensure precision in policy-making.
In Kazakhstan, located in northern Central Asia, climate change has progressed faster in recent decades compared to other regions at similar latitudes. Between 1950 and 2020, temperatures rose at a rate of 0.31 °C per decade [27]. According to Yunfeng Hu et al. [28], approximately 76.1% of Kazakhstan’s land area is moderately to highly sensitive to desertification, covering 3.8% of the country’s total land. These vulnerable zones are primarily concentrated in seven provinces across western, northwestern, and southwestern Kazakhstan.
As a typical continental arid zone, Central Kazakhstan is characterized by low precipitation, high evaporation rates, dry climate, and the absence of major water arteries, spanning three distinct landscape zones. The region’s location in an arid area fundamentally shapes vegetation and soil quality [29,30,31], which exhibit negative trends due to climatic stressors.
Central Kazakhstan’s pastoral systems [29] are transitioning toward agro-industrial models due to climate pressures, market integration, and modernization policies. While this shift may enhance climate adaptation, it risks exacerbating water stress in this topographically complex and vulnerable region [32,33,34]. Thus, Central Kazakhstan—with its varied terrain and reliance on pastoral livestock farming—stands out as one of the country’s most vulnerable regions. Observed desert boundary shifts northward, rising temperatures, and declining humidity pose [35,36] critical threats to water resources and agricultural sustainability. One of the most severe droughts in recent decades occurred across multiple regions of Kazakhstan. As documented by the United Nations Development Programme (UNDP), the summer of 2021 saw extensive drought-induced wildfires in the Karaganda Region (Central Kazakhstan), which burned approximately 1000 hectares of land [37].
The vast expanse of Central Kazakhstan, with its arid and semi-arid climate, coupled with economic dependencies tied to three landscape zones, heightens risks of environmental degradation under potential aridification [38]. Despite its urgency, Kazakhstan lacks comprehensive studies assessing climate aridity changes over extended timeframes with high spatial resolution. Previous research has either focused on small subregions [39], excluded insular territories, or sacrificed spatial detail for broader geographic coverage [29,40,41]. To our knowledge, no prior analysis has systematically evaluated recent aridity shifts across Central Kazakhstan with both temporal depth and fine-scale spatial precision.
Furthermore, as a key nexus connecting the Eurasian continent, this region’s terrestrial ecosystems are increasingly affected by drought conditions, which may hinder progress toward Sustainable Development Goal (SDG) 15 (“Protect, restore, and promote sustainable use of terrestrial ecosystems; combat desertification”) [42]. Environmental shifts driven by aridity/humidity variability significantly impact economic and social development, ecological restoration, and local livelihoods. Addressing this issue is thus a prerequisite for effective regional ecological governance and natural resource management.
This study aims to facilitate comprehensive research on this critical climatic variable and monitor its long-term trends in the region. The specific objectives are to conduct a detailed spatiotemporal analysis of the Aridity Index, to quantify statistically significant changes using non-parametric tests, and to perform geospatial assessments of aridity distribution and variability.
The increasing frequency and intensity of aridization in certain years threaten agricultural resilience, underscoring the necessity of this research. The findings are supposed to support effective water resource management under climate change, agricultural adaptation strategies, and enhanced understanding of climate change impacts in Central Asia and Kazakhstan.

2. Study Area

Central Kazakhstan is situated in the central part of the Republic of Kazakhstan and the heart of the Eurasian continent, spanning 49°54′–51°15′ N and 63°15′–77°45′ E. Covering approximately 428,000 km2, it constitutes 15.7% of Kazakhstan’s total territory. The definition of “Central Kazakhstan” varies among scholars. Some delineate it as encompassing Karaganda and Akmola regions, along with adjacent administrative territories dominated by low-mountain relief (melkosopochnik). However, most studies focus on the economic region of Karaganda, and more recently, Ulytau Region has also been included (see Figure 1).
Central Kazakhstan has a continental climate with extreme differences in temperature and precipitation. Average January temperatures range from −16 to −17 °C, with 35–37% of annual precipitation falling as snow. Summers are hot, arid, and windy, with July averages of 20–21 °C. Annual precipitation in the north of the region is 250–300 mm, in the south—150–210 mm, and in low mountainous areas—300–400 mm. In general, 35–37 per cent of the annual precipitation falls as snow during winter.
The landscapes of the region are represented by the dry Kazakh Uplands or the Kazakh Hummocks in the north and steppes and semi-deserts in the south, bordering the northern shore of Lake Balkhash. The river network is poor and low-water. In terms of surface structure, the territory of the region is weakly articulated. The territory of the region is elevated on average 300–900 m above sea level and has a general slope from east to south-west, south, and partly north. Most of it is occupied by the Kazakh Uplands—Saryarqa, which is almost a plain with average elevations of 400–500 m above sea level. In the eastern part of the region, there are the highest altitudes, where the shallow forest passes into mountain massifs and ridges. The southern part of the region passes into the desert zone and is occupied by the clay desert of Betpak-Dala, and in the west, the region passes into the plains of the Turan Lowland.

3. Data Sources

In this study, the Aridity Index was calculated using monthly climatic datasets for the period 1960–2020, including mean monthly precipitation (P), potential evapotranspiration (PET), and average temperature (T). These datasets were obtained from the Climatic Research Unit (CRU), University of East Anglia (CRU TS v4.04; available at: https://crudata.uea.ac.uk/cru/data/hrg, accessed on 20 February 2025). CRU climate data are available from 1901 to the present day at a spatial resolution of 0.5° × 0.5° for the entire globe, with the exception of Antarctica. During the development of the latest CRU database, a range of quality control measures were implemented, including outlier removal, the skipping of short records, and the exclusion of anomaly values [43]. A primary constraint is spatial resolution: CRU datasets typically employ a 0.5° × 0.5° grid, smoothing local variability in complex terrain and underrepresenting microclimates. Interpolation from sparse station networks further reduces accuracy, particularly in data-scarce regions. CRU data are often monthly averages, obscuring short-term extremes critical for drought monitoring. For local decision-making, CRU’s coarse resolution may overlook critical sub-grid variations, leading to misaligned policy responses. Ground validation remains essential, yet in many regions, sparse station networks hinder verification. Hybrid approaches—combining CRU data with localized observations or downscaling techniques—can mitigate these limitations.
To enhance interpolation accuracy, station-based data from the Kazhydromet National Meteorological Service (https://www.kazhydromet.kz, accessed on 20 February 2025) were incorporated into the CRU processing pipeline. Although there are meteorological stations in the region, the study did not use data from meteorological stations due to a lack of data and due to the large number of missing values.
The validity of CRU data has been demonstrated in various geographical regions [44,45,46], and its application in numerous hydroclimatological studies worldwide has been proven to be successful [11,47,48,49].
The CRU database derives PET using the FAO Penman–Monteith equation [43], the internationally recognized standard for PET estimation (endorsed by the United Nations Food and Agriculture Organization, FAO). This method ensures robust and physiologically consistent evapotranspiration estimates by integrating meteorological parameters (temperature, humidity, wind speed, solar radiation) and surface resistance factors.
CRU datasets have been extensively validated in diverse climatic regions and are widely employed in global hydroclimatological research [48,50], underscoring their reliability for this study.

4. Methods

4.1. Aridity Index

The Aridity Index is calculated as the ratio of multi-year mean P over PET, in which P is precipitation and PET is the potential evapotranspiration. In this study, PET corresponds to reference evapotranspiration (ETo) for a standard grass surface according to the CRU methodology. This index serves as a fundamental tool for assessing spatial patterns of aridity at regional and national scales:
Aridity Index = P/PET,
where P = annual or seasonal precipitation, PET = annual or seasonal potential evapotranspiration. The Aridity Index system classifies climate conditions into six distinct categories, where Arid Index is shown as AI: Hyper-arid (AI < 0.04), Arid (0.04 ≤ AI < 0.16), Semi-arid (0.16 ≤ AI < 0.40), Dry sub-humid (0.40 ≤ AI < 0.56), Moist sub-humid (0.56 ≤ AI ≤ 0.85), and Humid (AI > 0.85)
The primary analysis focused on the classification and mapping of the Aridity Index across three key temporal scales: annual (to assess long-term trends), agricultural growing season (for agroclimatic analysis), and non-vegetative period (to examine seasonal dynamics).
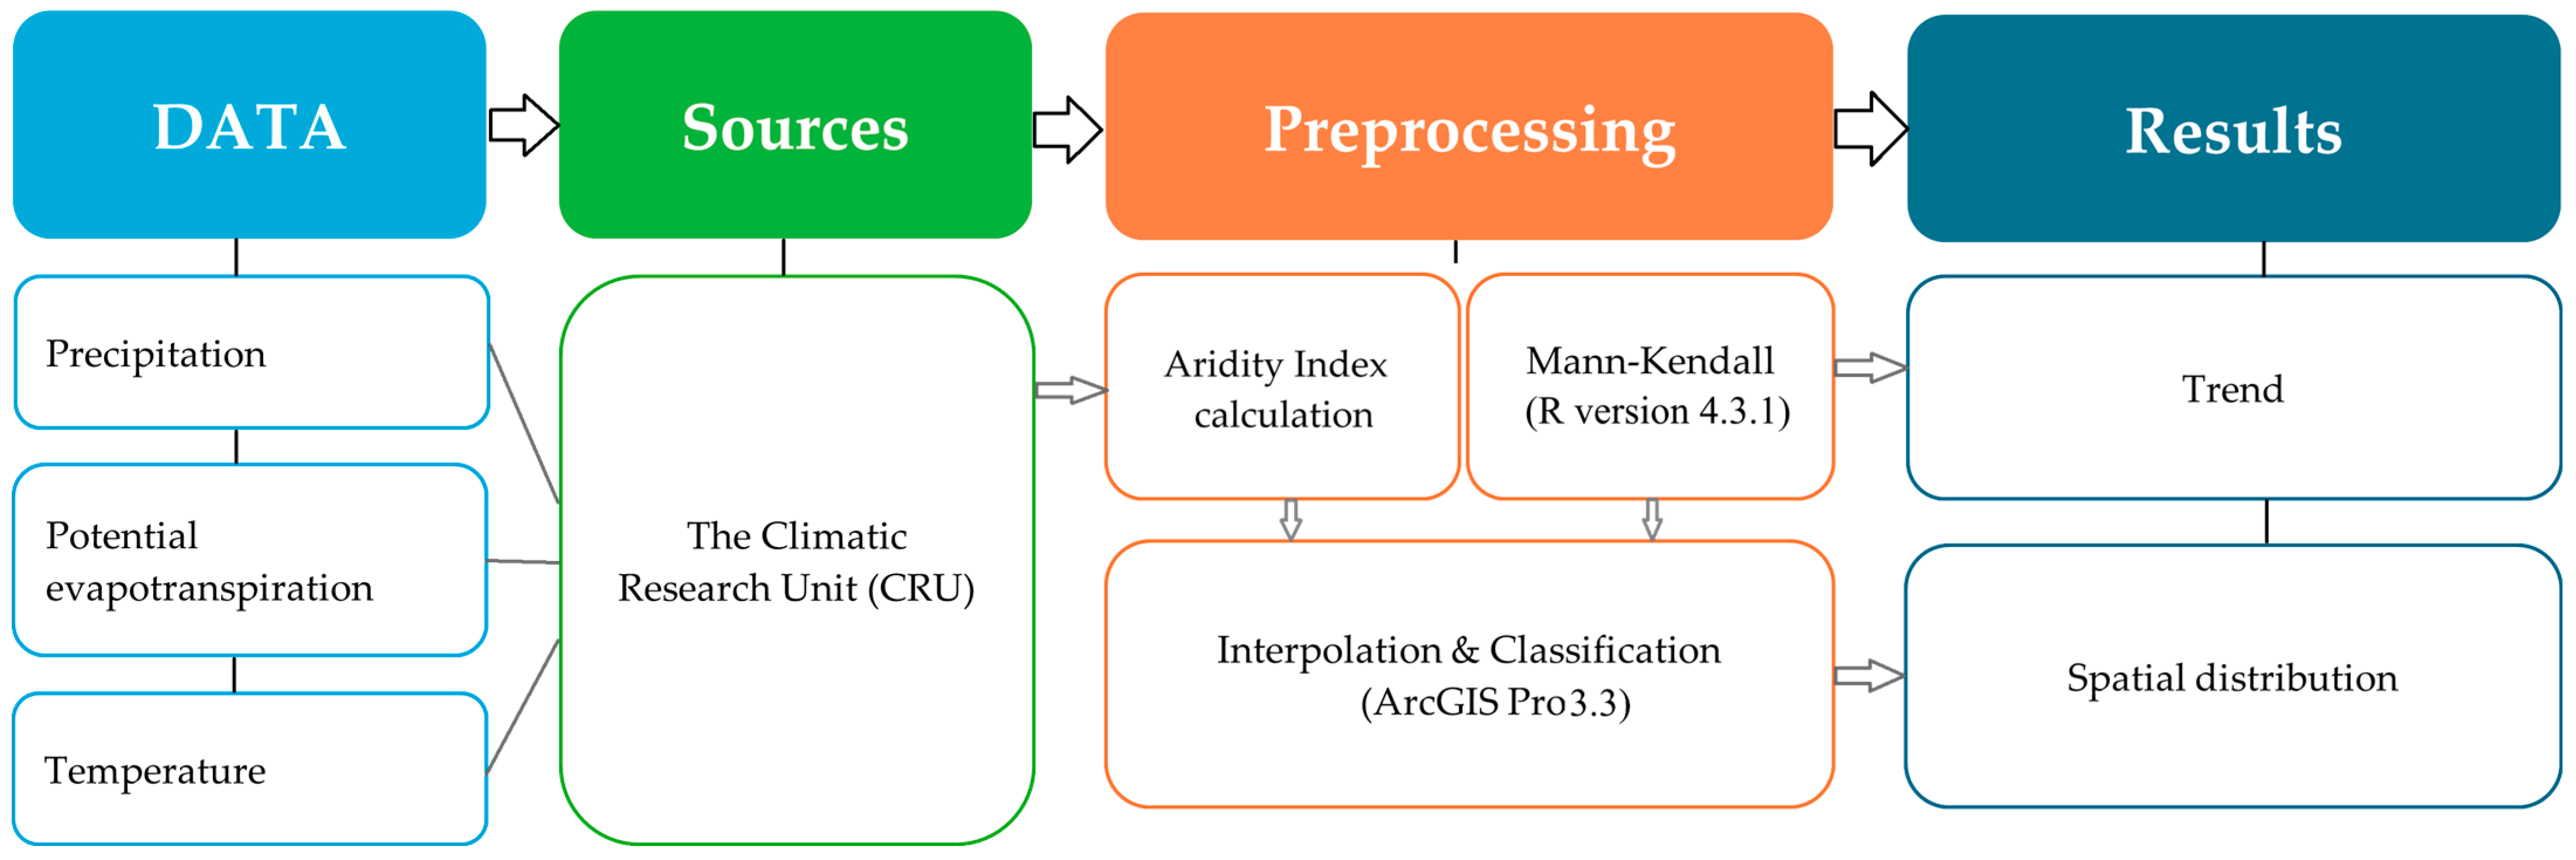
The conceptual framework for this study, along with the attribute characteristics of all employed datasets, is presented in Figure 2. Climate data sourced from the Climatic Research Unit (CRU) were processed and analyzed utilizing the R version 4.3.1 statistical programming environment. Spatial distribution patterns of the Aridity Index values and temporal interpolation of observational data were generated employing geostatistical tools within the Spatial Analyst module of ArcGIS Pro 3.3 software.
The significance of this study lies in its integration of high-resolution CRU climate data with Mann–Kendall trend analysis to assess AI (Aridity Index) dynamics at seasonal and decadal scales. This approach addresses a critical gap in regional studies, where temporal granularity is often lacking.

4.2. Mann–Kendall Test

To assess the significance and magnitude of trends in long-term climatic variables and the Aridity Index, we employed non-parametric Mann–Kendall (M-K) tests [51]. The Mann–Kendall test is a non-parametric statistical method. Unlike parametric tests, it does not require the sample data to follow a specific distribution and remains robust against outliers. This makes it particularly suitable for analyzing sequential variables [52].
S = k = 1 n 1 j = k + 1 n s g n x j x k ,
s g n x j x k = + 1   if   ( x j x k )       0   if   ( x j x k ) 1   if   ( x j x k ) ,
V a r S = n n 1 2 n + 5 t t t 1 2 t + 5 18 ,
xj and xk are the annual data values at times j and k; n is length of observation; and t—the extent of any given time. The parameters’ Z conforms to the standard normal variable and is calculated by using the equation:
Z = S 1 V a r ( S )   if   S > 0                   0                 if   S = 0 , S + 1 V a r ( S )   if   S < 0
A positive Z value shows increasing trends, while negative values of Z indicate decreasing trends. When testing either increasing or decreasing monotonous trends at a 5% significance level, the H0 hypothesis was rejected for Z > 1.96 [53].
The calculations were performed for both annual and seasonal data.

5. Results

5.1. Spatial Change in Average Aridity Index

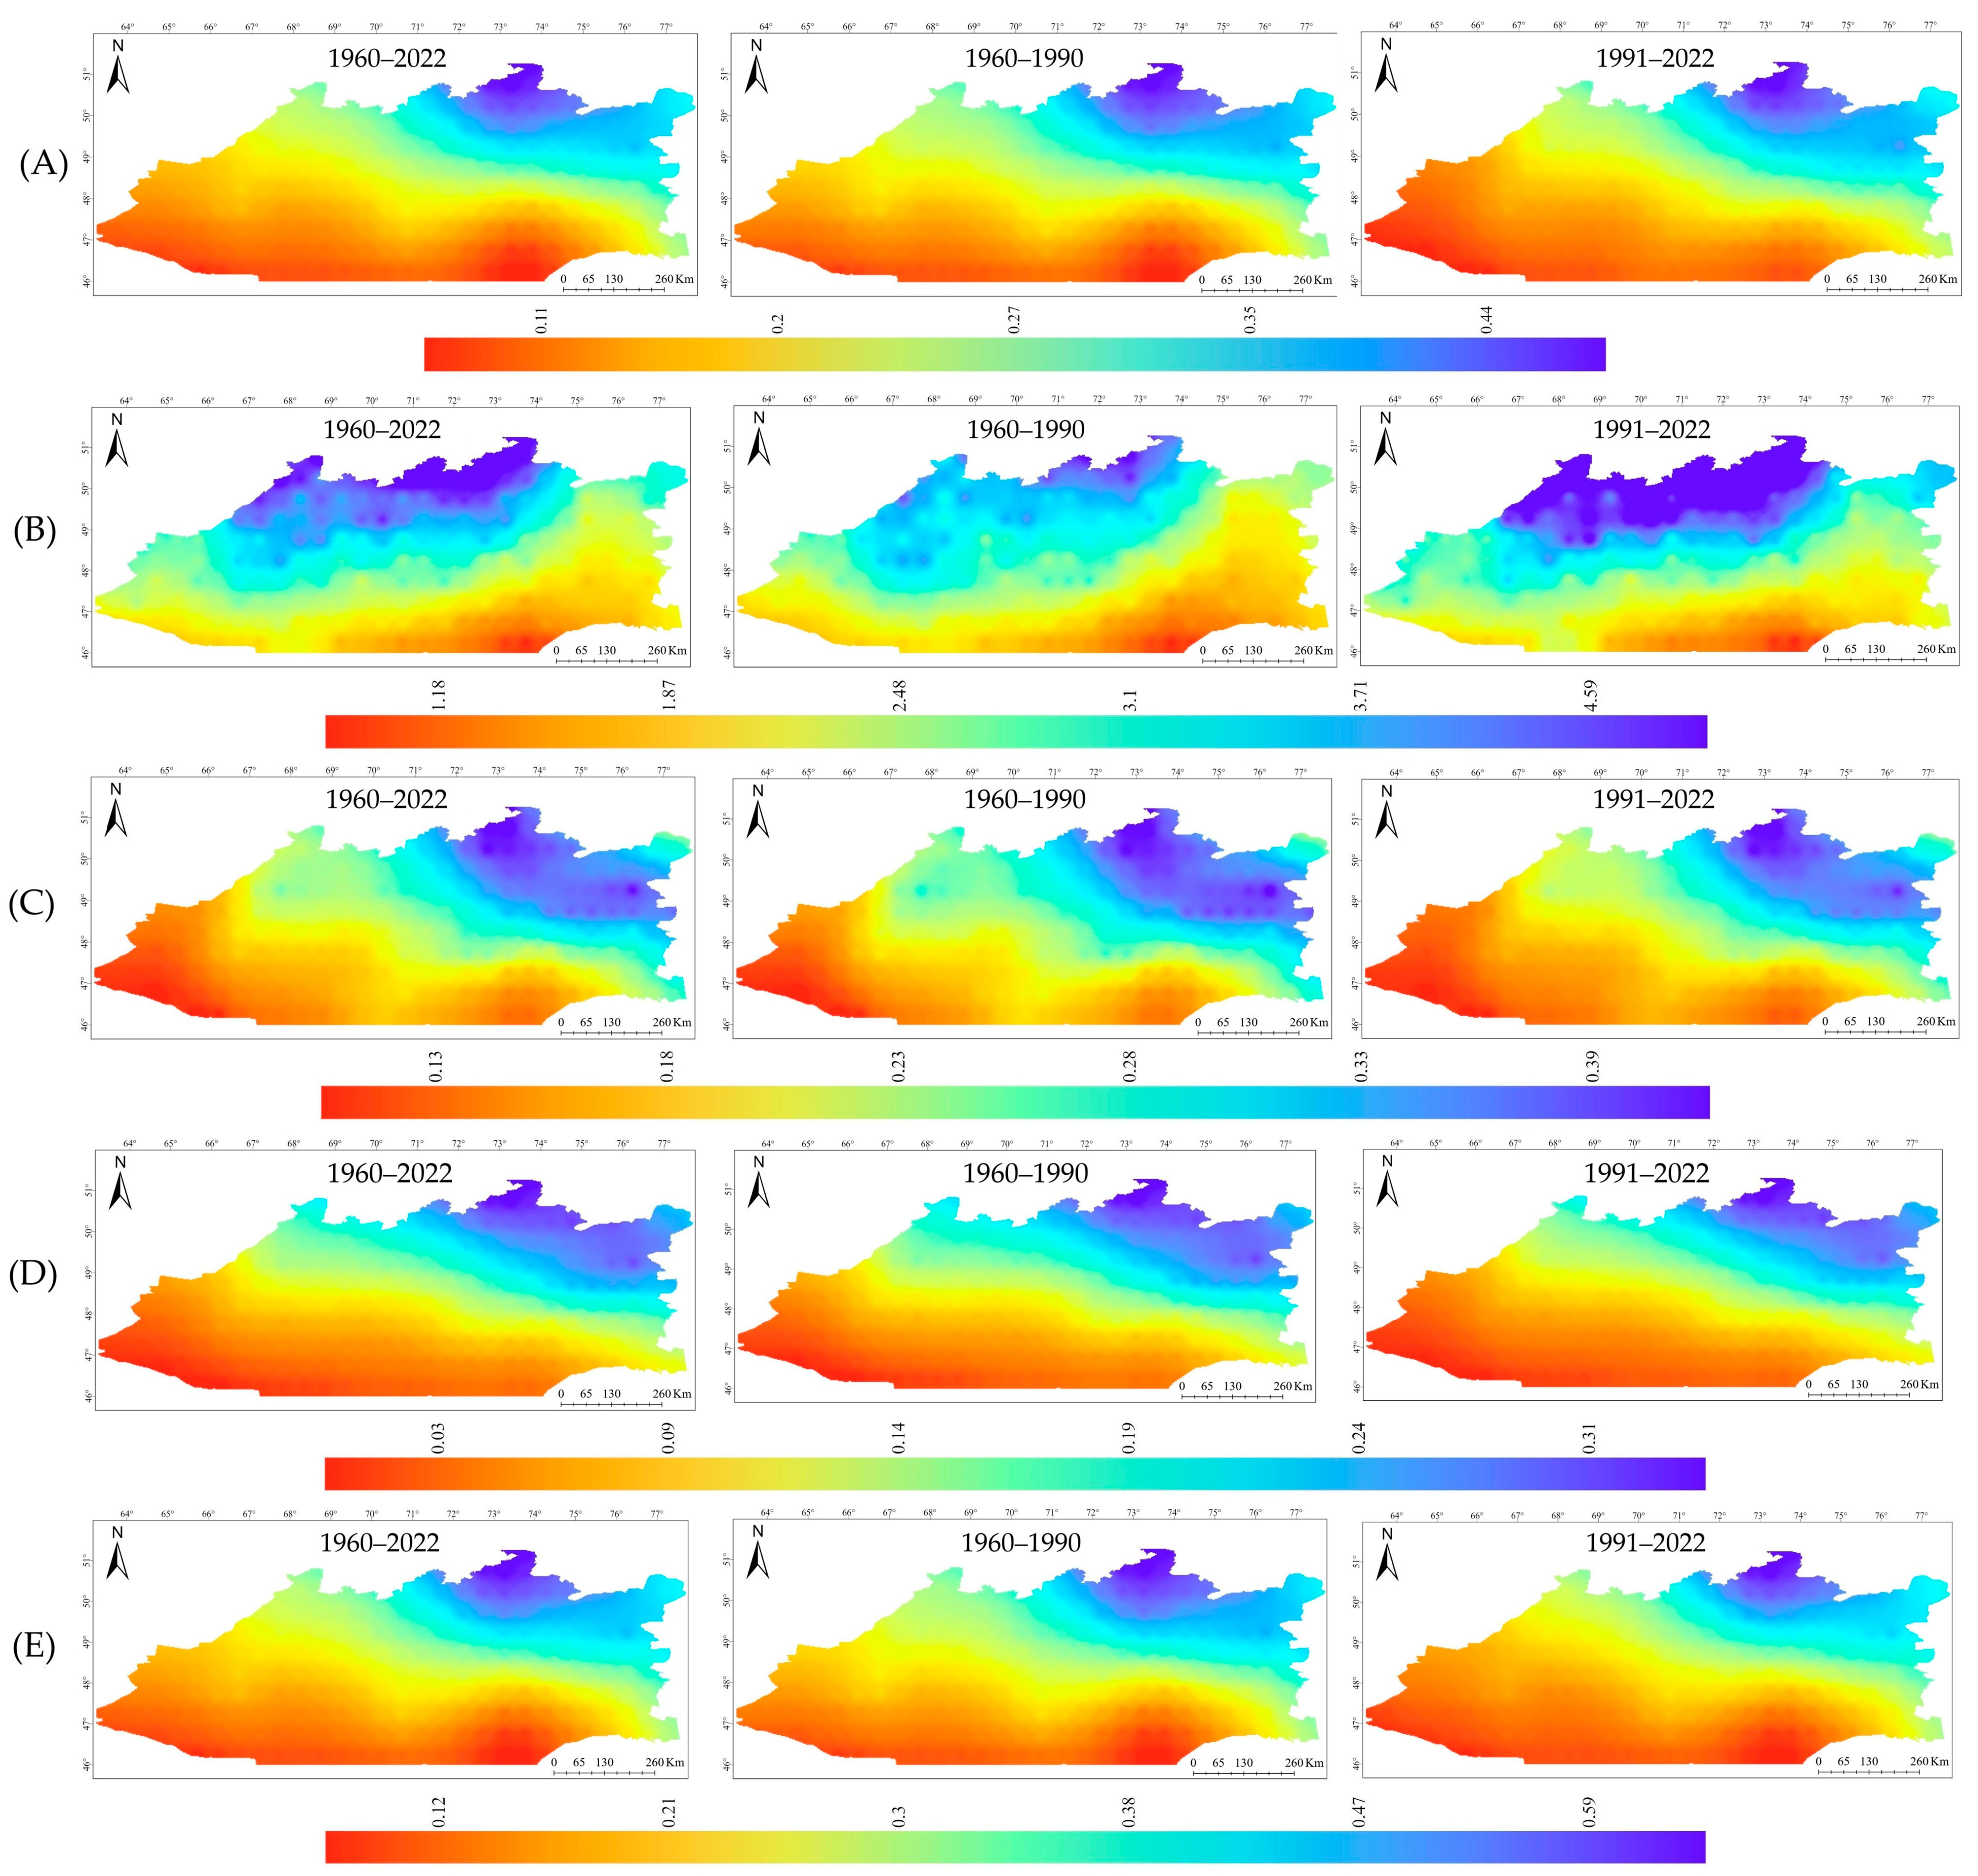
Figure 3 presents the spatial distribution of the long-term mean annual and seasonal Aridity Index in Central Kazakhstan across different time periods. The analysis revealed dynamic changes in the spatial patterns of aridity. The following periods were selected for assessment: 1960–2022 (long-term period), 1960–1990 (first period), and 1991–2022 (second period).
The long-term mean annual Aridity Index (Figure 3A) shows increasing values from northeast to southwest, correlating with the landscape features of the study area. During 1960–2022, southern regions exhibited Aridity Index values of 0.11–0.14, characteristic of southwestern areas bordering the Aral Sea region and Betpak-Dala. The highest index values (approximately 0.43) were recorded in the low-mountain areas of Yerementau and Karkaraly, part of the Kazakh Uplands (Saryarqa).
Comparative analysis of 1960–1990 and 1991–2022 periods revealed decreasing Aridity Index values and a northeastward shift of arid zones, indicating climate warming and drying over the past 30 years. In southern regions, the Aridity Index decreased from 0.12–0.15 to 0.10–0.14, while Saryarqa showed an increase from 0.40–0.44 to 0.41–0.46. This suggests intensifying aridity in dry regions coupled with increasing index values in northwestern areas.
Seasonal Aridity Index variations (Figure 3B) show winter periods exhibiting a distinct south–north gradient. The lowest values occurred near Balkhash, while the highest were recorded in the Yerementau mountains. Period comparison revealed increased winter humidity over the past 30 years, potentially associated with rising temperatures and corresponding changes in moisture regimes.
The spring season (Figure 3C) follows the annual Aridity Index trend. The analysis indicates a progressive dedication of the region: the minimum Aridity Index values decreased from 0.13 to 0.12, while the maximum values increased from 0.38 to 0.39.
The summer season (Figure 3D) exhibits the most pronounced aridity, with the minimum Aridity Index reaching 0.03 and the maximum 0.31. The inter-period dynamics are statistically insignificant; however, an expansion of areas with low aridity levels is observed.
The autumn season (Figure 3E) demonstrates the highest Aridity Index values compared to other seasons, ranging from 0.13 (southern territories) to 0.6 (certain districts). According to the classification, this region falls under dry sub-humid zones. Nevertheless, over the past 30 years, aridity has intensified: the minimum Aridity Index values declined from 0.14 to 0.12, and the maximum values decreased from 0.62 to 0.59.

5.2. Temporal Characteristics of Aridity Index Changes and Trends

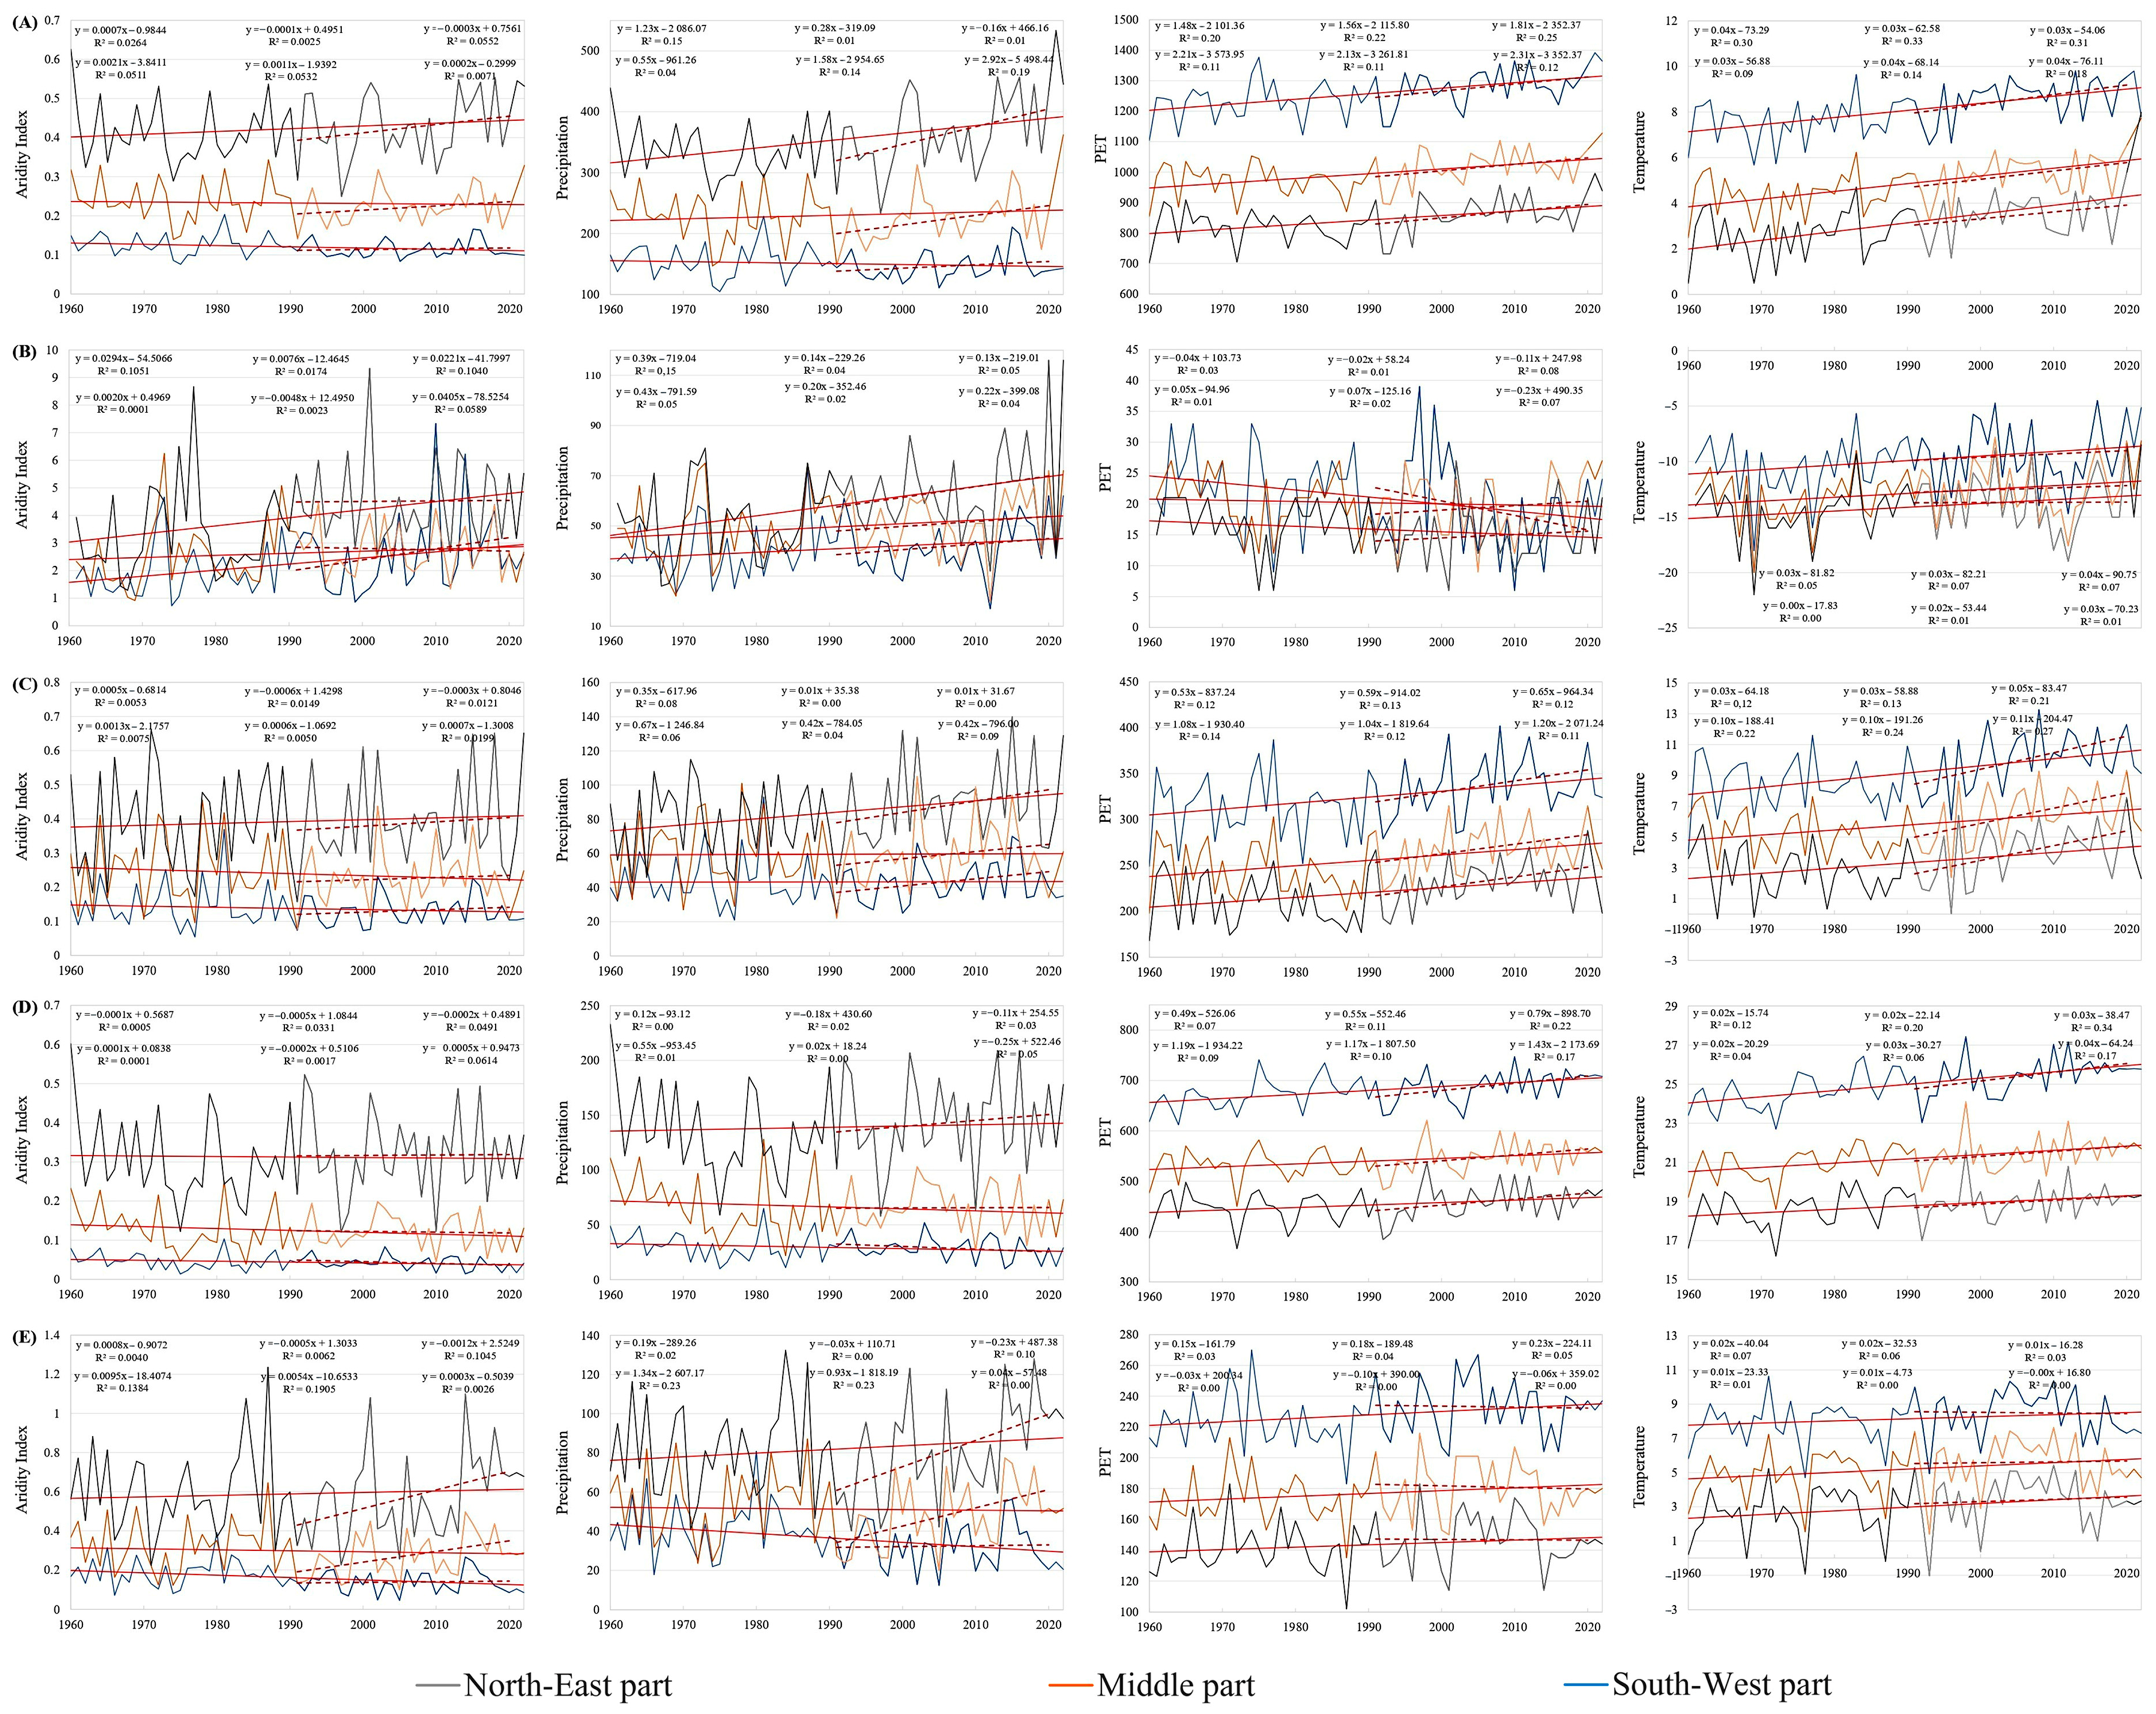
The results of the Mann–Kendall (MK) test for annual Aridity Index trends are presented in Table 1. The analysis revealed divergent trends in Aridity Index changes: both positive (increased humidity) and negative (increased aridity). The temporal dynamics of the index and associated climatic parameters are visualized in Figure 4.
In Central Kazakhstan, a slight decreasing trend in the annual Aridity Index was observed from 1961 to 2022, indicating increased climatic aridity, except for the northwestern part of the region. Both the MK test and graphical analysis confirmed a rise in the index in northern areas over the 60-year period. The rate of change was +0.007/10 years in the northeast (positive trend) and −0.003/10 years in the southwest (negative trend).
However, in the second period (1991–2022), all parts of the region exhibited a weak positive trend (+0.002/10 years), though the statistical significance of these changes remains low.
The MK test was applied to assess seasonal Aridity Index dynamics (Figure 4B–E). The winter season was characterized by a significant positive trend, indicating increased humidity throughout both northern and southern parts. In contrast, spring and summer periods showed predominant negative trends reflecting increased aridity, though these changes were statistically insignificant in northern areas. The autumn season presented a marked spatial divergence, with southern regions experiencing a significant Aridity Index decline (indicating heightened aridity) while northern zones maintained a weak positive trend.
Analysis of the second period (1991–2022) revealed notable deviations from long-term patterns. The northern sector consistently demonstrated positive trends across all seasons, with particularly pronounced increases during autumn months. The central parts of the region showed measurable Aridity Index increases, reaching statistical significance in autumn observations. The southern part exhibited more complex dynamics, with modest Aridity Index increases during winter and spring months, contrasting with decreases in summer and autumn values. These second-period patterns suggest an evolving climatic regime, particularly evident in the autumn season’s enhanced humidity compared to historical norms.
Aridity represents a complex climatic phenomenon whose comprehensive assessment requires an integrated analysis of numerous hydroclimatic and environmental parameters. The key determinants of this phenomenon include the dynamics of atmospheric precipitation, potential evapotranspiration (PET) indicators, and temperature regime. The present study conducted a comprehensive analysis of the temporal dynamics of these parameters over the period 1960–2022, followed by an assessment of their relationship with changes in the Aridity Index.
As clearly demonstrated by the data in Figure 4, the study period showed statistically significant increases in both annual average and seasonal temperature indicators. Particularly noteworthy is the sharp acceleration of global warming processes, indicating an intensification of climate change in the region. Interestingly, during 1991–2022, the rate of temperature increase showed some deceleration compared to the established long-term trend.
Spatiotemporal analysis of precipitation patterns revealed substantial variability in precipitation distribution. The long-term perspective (1960–2022) shows a consistent trend toward decreasing precipitation, while the second period (1991–2022) displays an opposite dynamic with marked increases in moisture indicators. Seasonal analysis demonstrated precipitation growth during winter–spring periods for both considered time intervals.
PET research results revealed a distinct positive dynamic of this indicator, showing direct correlation with temperature increases. Particularly significant is the identified close relationship between PET and temperature regime at the level of seasonal fluctuations. Winter periods show a PET decrease in the long-term perspective with minor increases in the contemporary period. The obtained data convincingly demonstrates the substantial influence of temperature characteristics and moisture regime on the spatiotemporal dynamics of PET. The established climatic patterns provide a scientifically grounded explanation for the observed changes in aridity indicators across different study periods.

5.3. Spatial Distribution Characteristics of Aridity Index Climate Zones

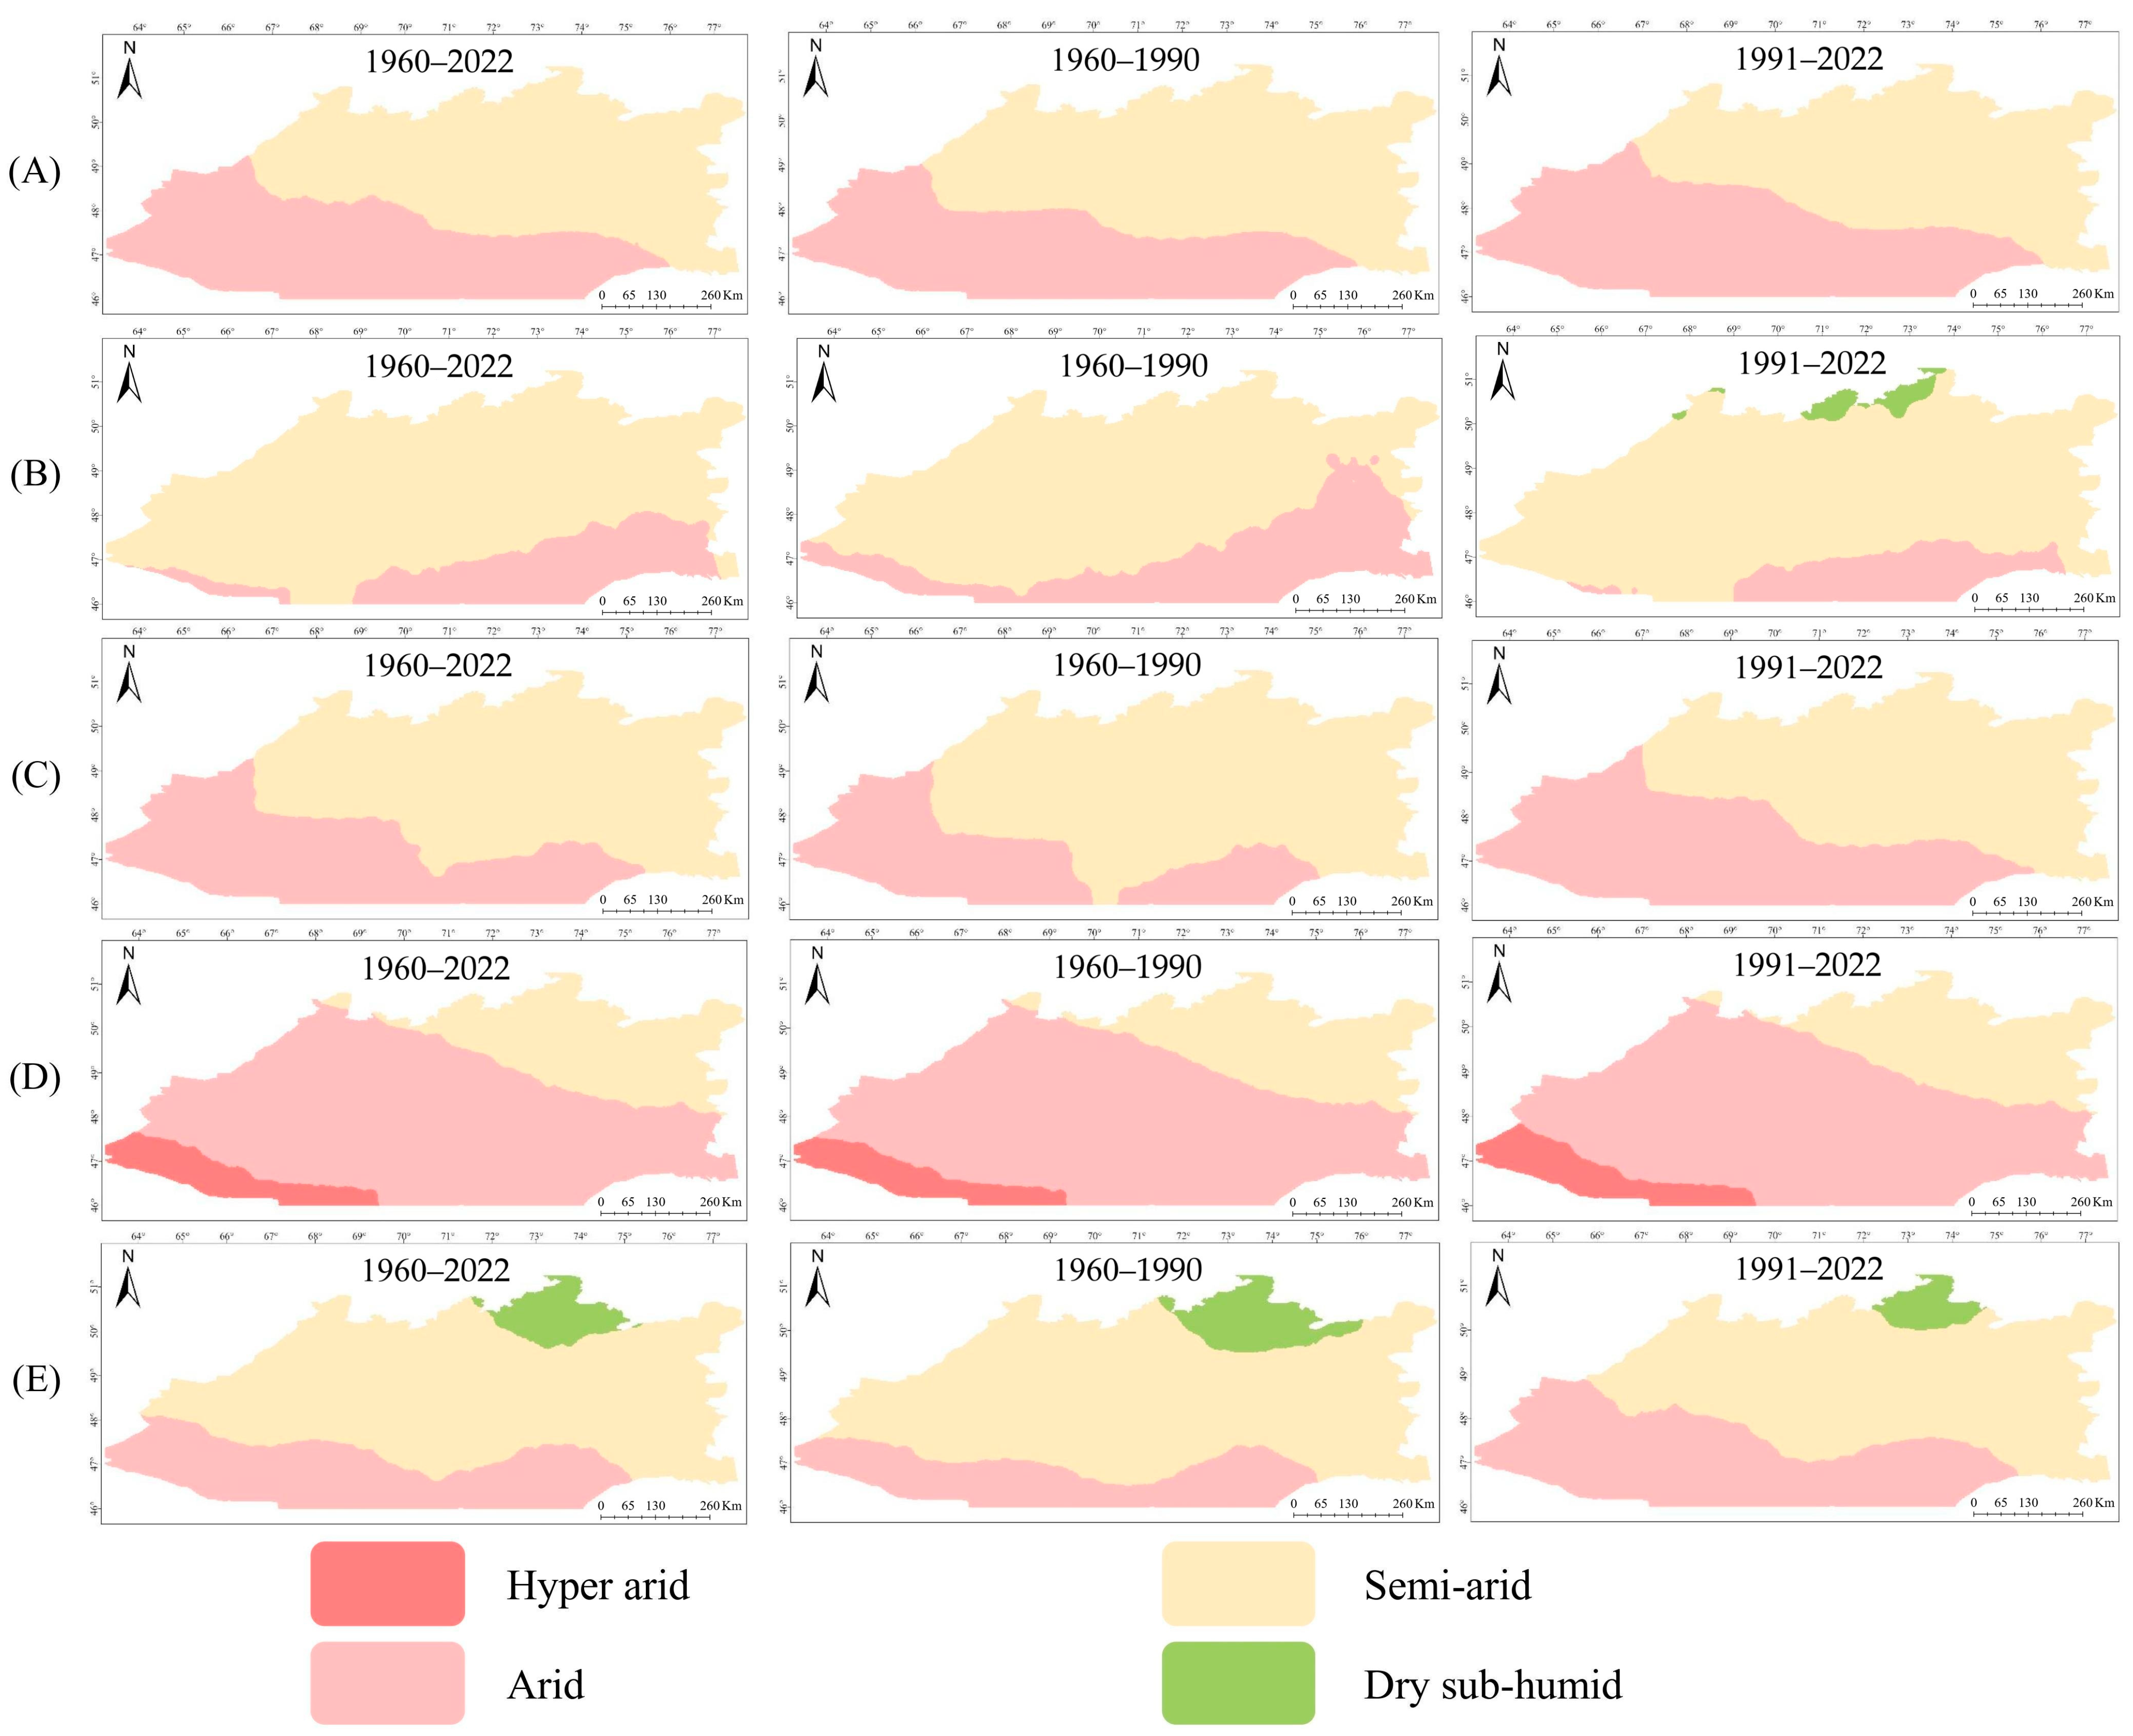
Figure 5 presents the spatiotemporal distribution of Aridity Index climate zone/classes in Central Kazakhstan, with detailed percentage ratios provided in Table 2. During the study period (1960–2022), two dominant climate types were identified: arid (43% of the territory) and semi-arid, showing clear geographical differentiation—arid zones being predominantly located in western and southern regions.
Comparative analysis of two time intervals (1960–1990 and 1991–2022) revealed pronounced aridization dynamics. The first period showed a 40% (arid) to 60% (semi-arid) ratio, corresponding to natural zoning: desert areas were classified as arid, while semi-desert and dry steppe areas as semi-arid. In recent decades, the proportion of arid lands increased to 47% with a simultaneous decrease in semi-arid areas to 53%, accompanied by a northward shift of arid zone boundaries.
Seasonal dynamics show significant fluctuations in Aridity Index climate zone distribution. During winter, the proportion of arid land reaches its minimum at approximately 20%, concentrated mainly in southeastern areas. Spring brings an increase in arid territories to 37%, while summer exhibits the most pronounced aridity with three distinct Aridity Index climate zones: hyper-arid (8%), arid (69%), and semi-arid (23%) territories. Autumn is characterized by reduced aridity (28%), with semi-arid dominance (67%) and emergence of dry sub-humid territories (5%) in northwestern Saryarqa.
The most significant changes between 1960–1990 and 1991–2022 occurred during winter, when arid land area more than halved (from 28% to 13%), with northern areas transitioning to dry sub-humid classification. In contrast, spring showed substantial growth of arid lands (by 52.5%). Summer changes were characterized by the expansion of hyper-arid zones alongside relative stability in arid territories. Autumn dynamics reflected increasing arid lands with a simultaneous reduction in both semi-arid (18.6%) and dry sub-humid (6.6%) territories. Since the moist sub-humid area occupies a very small portion of the territory, we classified it as a dry sub-humid area.
Table 2. Changes in the areal extent (%) of Aridity Index climate zones over different time periods.
PeriodsTypeAreal Extent Changes, in %
AnnualWinterSpringSummerAutumn
1960–2020 Hyper-arid 00080
Arid 4320376928
Semi-arid 5780632367
Dry sub-humid 00005
1960–1990 Hyper-arid 00070
Arid 4028297021
Semi-arid 6072712372
Dry sub-humid 00007
1990–2020 Hyper-arid 00080
Arid 4713446938
Semi-arid 5384562359
Dry sub-humid 02003
These findings demonstrate complex spatiotemporal dynamics of Aridity Index climate zone classes in Central Kazakhstan, reflecting both seasonal fluctuations and long-term aridity trends. Particularly noteworthy is the identified trend toward aridization in spring–autumn periods against a background of increased winter moisture, which may have significant implications for regional ecosystems and agricultural activities.

6. Discussion

Numerous studies on Kazakhstan and Central Asia indicate that arid regions exhibit high sensitivity to climate change and environmental degradation [27,54,55]. Persistent temperature increases have intensified evapotranspiration, leading to water scarcity and heightened aridity [30,56].
An analysis of long-term Aridity Index dynamics by employing CRU’s FAO Penman–Monteith in Central Kazakhstan reveals the expansion of arid zones, particularly in the Aral Sea and Balkhash regions. The results confirm a clear southwest-to-northeast aridity gradient, with ranging values from 0.11 (hyper-arid southern deserts) to 0.46 (dry sub-humid northern uplands), aligning with the region’s topographic and climatic heterogeneity (Section 5.1). In addition, non-parametric trend analysis ensured robust detection of shifts, such as the northward expansion of arid zones (from 40% to 47% of the study area since 1991) and seasonal contrasts (e.g., 52.4% winter arid area reduction vs. summer hyper-arid zone expansion to 8%). These findings align with observed reductions in rainy days and prolonged heatwaves [57], suggesting a further intensification of arid conditions [58,59]. The results correlate with studies by Deng et al. [55], who noted stronger aridification in southwestern Kazakhstan compared to northeastern areas. Similarly, Farooq et al. [60] found that increased winter precipitation amid moderate warming enhances moisture availability, whereas autumn warming offsets this effect in arid and semi-arid zones. This feature and seasonal asymmetry create unique environmental stresses, since the period of peak biological activity (April–September) experiences an increase in moisture deficit, despite the overall increase in annual precipitation.
Historically, Central Kazakhstan’s climate has been shaped by east–west air mass transport along the Siberian High’s periphery. However, recent decades have seen a strengthening of meridional circulation, bringing cold, humid air from the north and dry, heated air from Central Asian deserts [61]. This shift has contributed to accelerated warming in the region’s steppe and desert zones, with rates twice the global average. The relatively moderate increase in moisture—compared to the West Siberian Plain—may be attributed to significant moisture loss during air mass transport and partial accumulation in the Kazakh Uplands.
Over the past 30 years, Central Kazakhstan has experienced an anomalous rise in annual precipitation and Aridity Index values, contrasting the global aridification trend. This phenomenon may be linked to El Niño–Southern Oscillation (ENSO) variability and shifts in the North Atlantic Oscillation (NAO) regime [27,57,62,63,64], which have occasionally led to localized cooling and altered spatiotemporal precipitation patterns [65,66]. By contrast, comparable warming in other arid zones—such as the Sahel region of Africa and Australia’s Murray–Darling Basin—has exacerbated aridity, consistent with global climate change impacts. In these regions, rising temperatures and precipitation variability have intensified water stress and ecological disruptions [67], underscoring the high sensitivity of drylands to climatic shifts. The divergence in Central Kazakhstan highlights the complex interplay of atmospheric circulation changes (e.g., monsoonal and mid-latitude patterns) that can create regional exceptions to broader trends [68,69]. These global parallels emphasize the need for adaptive water management strategies tailored to localized climatic responses.
According to forecast assessments by the Regional Environmental Centre for Central Asia [70], based on IPCC scenarios, a significant decline in water resources is expected by 2050 due to glacial degradation and rising temperatures, particularly during summer. These changes may trigger severe ecological consequences, including the following:
-
Increased aridification across Kazakhstan, with northern regions transitioning to semi-arid zones and other areas shifting to fully arid conditions.
-
Vertical displacement of natural zone boundaries, altering altitudinal ecosystem distributions.
-
Prolonged and intensified droughts, dry winds, and extreme temperature events.
-
A 50–70% reduction in summer precipitation, leading to decreased agricultural yields.
-
A 30–90% decline in natural pasture productivity, threatening pastoral economies.
Projected temperature increases are anticipated to reduce soil moisture reserves by 15–20% and diminish river flow by 7–11%. Although precipitation may rise by 10–12% by 2050, elevated evaporation rates will outweigh these gains, sustaining moisture deficits. These trends will likely drive a northward migration of climatic zones in Central Kazakhstan and increase the frequency of extreme weather events. Of particular concern is spring aridification [71], which exacerbates soil moisture deficits, heightens drought risks, and severely impacts agricultural productivity, and the need to address the growing disparity between winter moisture accumulation and summer aridity, which currently limits the agricultural potential of the region despite overall increases in annual precipitation. Drier summer conditions may further stress plant communities, intensify drought frequency and severity, and elevate wildfire risks.
This research highlights several critical areas for future investigation, including the socioeconomic impacts of changing drought patterns, the feedback mechanisms between land degradation and regional climate, and the development of predictive models for aridity under various climate change scenarios. Such studies will be essential for formulating effective adaptation measures to ensure the sustainability of Central Kazakhstan’s ecosystems and agricultural systems in the face of ongoing climatic changes.
The results underscore the complex nature of aridity changes in Central Asia, where general trends of increasing precipitation coexist with intensifying seasonal drought conditions. This paradox presents unique challenges for climate adaptation and requires innovative approaches to water resource management and land-use planning in the region.

7. Conclusions

This study elucidates the spatial dynamics of regional aridification and advances climatic zoning methodologies, providing a scientific foundation for adaptive strategies in sustainable land use and agriculture.
The study presents a comprehensive analysis of aridity patterns in Central Kazakhstan over a 62-year period, employing the Aridity Index as a key metric to assess climatic changes. Through annual and seasonal examinations using the Mann–Kendall test, we identify significant shifts in moisture regimes across the region, with particular attention to two distinct periods: 1960–1990 and 1991–2022.
The spatial distribution of aridity reveals a pronounced southwest-to-northeast gradient, with the most substantial drying trends observed in central and southern districts. This pattern exhibits clear seasonal variability, where winter months demonstrate increasing moisture availability in northern areas, while autumn months show statistically significant intensification of aridity throughout much of the study region. The latter period (1991–2022) presents an interesting anomaly, with both winter and autumn seasons registering positive Aridity Index trends, suggesting complex changes in atmospheric circulation patterns.
Central Kazakhstan’s climate has undergone remarkable transformations, characterized by a 1.6 °C increase in mean annual temperatures compared to mid-20th-century baselines. While annual precipitation has shown an overall increase, including in traditionally arid southern zones, the temporal distribution has shifted dramatically. The majority of precipitation now occurs during winter and spring months, leaving summer periods, particularly July, with its extreme temperatures reaching 40–42 °C, vulnerable to intense aridity. During these summer months, evapotranspiration processes reduce topsoil moisture to critical levels of 1.5–2%, creating severe challenges for vegetation survival and agricultural productivity.
These climatic shifts have triggered several environmental consequences, most notably the reactivation of soil salinization processes and the gradual transformation of arable lands into solonchaks. The northward migration of climatic zones has altered natural vegetation patterns and ecosystem boundaries, with particular implications for this agriculturally significant region. The observed changes in drought regimes may lead to fundamental restructuring of agricultural systems and water resource management approaches.
The research findings possess significant applicability for modeling and predicting both short- and long-term climate shifts. The identified trends in aridity patterns provide a scientific basis for developing targeted interventions in water resource management, agricultural planning, and ecosystem conservation. These analytical outputs enable policymakers to develop comprehensive regional development strategies through several critical pathways. First, they facilitate the identification of economic sectors exhibiting particular vulnerability to climatic conditions. Second, they permit rigorous evaluation of existing adaptation plans’ effectiveness. Third, they provide means to assess institutional preparedness across multiple dimensions, including (1) the robustness of water resource management frameworks, (2) the operational capacity of early warning systems, and (3) the availability of financial mechanisms designed to support climate adaptation initiatives.

Author Contributions

Conceptualization, D.S. and S.B.; methodology, D.S.; software, A.S. and S.B.; validation, J.A. and D.S.; formal analysis, L.M. and Y.G.; investigation, D.S. and S.B.; resources, A.S., L.M. and Y.G.; data curation, D.S. and S.B.; writing—original draft preparation, D.S. and S.B.; writing—review and editing, D.S. and S.B.; visualization, S.B., A.S. and Y.G.; supervision, J.A.; project administration, D.S. All authors have read and agreed to the published version of the manuscript.

Funding

This research was funded and supported by CAS, the Alliance of National and International Science Organizations for the Belt and Road Regions (Grant No: CAS-ANSO-FS-2024-29 and Grant No: CAS-ANSO-FS-2024-15). The authors acknowledge the support received from all the organizations for the present study.

Institutional Review Board Statement

Not applicable.

Informed Consent Statement

Not applicable.

Data Availability Statement

The data that support the findings of this study are available from the corresponding author upon reasonable request.

Conflicts of Interest

All authors declare no competing financial, professional, or personal interests that could affect the objectivity of this research.

References

  1. Vicente-Serrano, S.M.; Peña-Angulo, D.; Beguería, S.; Domínguez-Castro, F.; Tomás-Burguera, M.; Noguera, I.; Gimeno-Sotelo, L.; El Kenawy, A. Global Drought Trends and Future Projections. Philos. Trans. R. Soc. A Math. Phys. Eng. Sci. 2022, 380. [Google Scholar] [CrossRef]
  2. Rajkhowa, S.; Sarma, J. Climate Change and Flood Risk, Global Climate Change. In Global Climate Change; Elsevier: Amsterdam, The Netherlands, 2021; pp. 321–339. [Google Scholar]
  3. Gampe, D.; Zscheischler, J.; Reichstein, M.; O’Sullivan, M.; Smith, W.K.; Sitch, S.; Buermann, W. Increasing Impact of Warm Droughts on Northern Ecosystem Productivity over Recent Decades. Nat. Clim. Chang. 2021, 11, 772–779. [Google Scholar] [CrossRef]
  4. Huang, J.; Mondal, S.K.; Zhai, J.; Fischer, T.; Wang, Y.; Su, B.; Wang, G.; Gao, M.; Jiang, S.; Tao, H.; et al. Intensity-Area-Duration-Based Drought Analysis under 1.5 °C–4.0 °C Warming Using CMIP6 over a Climate Hotspot in South Asia. J. Clean. Prod. 2022, 345, 131106. [Google Scholar] [CrossRef]
  5. Millennium Ecosystem Assessment (MEA). Ecosystems and Human Well-Being; Island Press: Washington, DC, USA, 2005; Volume 5. [Google Scholar]
  6. Wilhite, D.A.; Buchanan-Smith, M. Drought as Hazard: Understanding the Natural and Social Context. In Drought and Water Crises; CRC Press: Boca Raton, FL, USA, 2017; p. 18. [Google Scholar]
  7. Zhu, Y.; Yang, P.; Xia, J.; Huang, H.; Chen, Y.; Li, Z.; Sun, K.; Song, J.; Shi, X.; Lu, X. Drought Propagation and Its Driving Forces in Central Asia under Climate Change. J. Hydrol. 2024, 636, 131260. [Google Scholar] [CrossRef]
  8. Liu, Y.; Shan, F.; Yue, H.; Wang, X.; Fan, Y. Global Analysis of the Correlation and Propagation among Meteorological, Agricultural, Surface Water, and Groundwater Droughts. J. Environ. Manag. 2023, 333, 117460. [Google Scholar] [CrossRef]
  9. Kim, S.W.; Jung, D.; Choung, Y.-J. Development of a Multiple Linear Regression Model for Meteorological Drought Index Estimation Based on Landsat Satellite Imagery. Water 2020, 12, 3393. [Google Scholar] [CrossRef]
  10. Li, M.; Yao, J.; Zheng, J. Spatio-Temporal Changes in Atmospheric Aridity over the Arid Region of Central Asia during 1979–2019. Ecol. Indic. 2024, 169, 112814. [Google Scholar] [CrossRef]
  11. Ullah, S.; You, Q.; Sachindra, D.A.; Nowosad, M.; Ullah, W.; Bhatti, A.S.; Jin, Z.; Ali, A. Spatiotemporal Changes in Global Aridity in Terms of Multiple Aridity Indices: An Assessment Based on the CRU Data. Atmos. Res. 2022, 268, 105998. [Google Scholar] [CrossRef]
  12. Yao, J.; Chen, Y.; Chen, J.; Zhao, Y.; Tuoliewubieke, D.; Li, J.; Yang, L.; Mao, W. Intensification of Extreme Precipitation in Arid Central Asia. J. Hydrol. 2021, 598, 125760. [Google Scholar] [CrossRef]
  13. Asadi Zarch, M.A.; Sivakumar, B.; Sharma, A. Assessment of Global Aridity Change. J. Hydrol. 2015, 520, 300–313. [Google Scholar] [CrossRef]
  14. Park, C.-E.; Jeong, S.-J.; Joshi, M.; Osborn, T.J.; Ho, C.-H.; Piao, S.; Chen, D.; Liu, J.; Yang, H.; Park, H.; et al. Keeping Global Warming within 1.5 °C Constrains Emergence of Aridification. Nat. Clim. Chang. 2018, 8, 70–74. [Google Scholar] [CrossRef]
  15. Lioubimtseva, E.; Cole, R.; Adams, J.M.; Kapustin, G. Impacts of Climate and Land-Cover Changes in Arid Lands of Central Asia. J. Arid Environ. 2005, 62, 285–308. [Google Scholar] [CrossRef]
  16. De Martonne, E. Aréisme et Indice d’aridité; Comptes Rendus de L’Academy of Science: Paris, France, 1926. [Google Scholar]
  17. Erinç, S. An Attempt on Precipitation Efficiency and a New Index; Instanbul University Institute Release; Baha Press: Istanbul, Turkey, 1965. [Google Scholar]
  18. Paltineanu, C.; Mihailescu, I.F.; Seceleanu, I.; Dragota, C.; Vasenciuc, F. Using Aridity Indices to Describe Some Climate and Soil Features in Eastern Europe: A Romanian Case Study. Theor. Appl. Climatol. 2007, 90, 263–274. [Google Scholar] [CrossRef]
  19. Koffi, D.; Komla, G. Trend Analysis in Reference Evapotranspiration and Aridity Index in the Context of Climate Change in Togo. J. Water Clim. Chang. 2015, 6, 848–864. [Google Scholar] [CrossRef]
  20. Fu, Q.; Feng, S. Responses of Terrestrial Aridity to Global Warming. J. Geophys. Res. Atmos. 2014, 119, 7863–7875. [Google Scholar] [CrossRef]
  21. McDonald, R.I.; Douglas, I.; Revenga, C.; Hale, R.; Grimm, N.; Grönwall, J.; Fekete, B. Global Urban Growth and the Geography of Water Availability, Quality, and Delivery. Ambio 2011, 40, 437–446. [Google Scholar] [CrossRef] [PubMed]
  22. Kimura, R.; Moriyama, M. Recent Trends of Annual Aridity Indices and Classification of Arid Regions with Satellite-Based Aridity Indices. Remote Sens. Earth Syst. Sci. 2019, 2, 88–95. [Google Scholar] [CrossRef]
  23. Liu, X.; Zhang, D.; Luo, Y.; Liu, C. Spatial and Temporal Changes in Aridity Index in Northwest China: 1960 to 2010. Theor. Appl. Climatol. 2013, 112, 307–316. [Google Scholar] [CrossRef]
  24. dos Santos, J.C.; Lyra, G.B.; Abreu, M.C.; de Oliveira-Júnior, J.F.; Bohn, L.; Cunha-Zeri, G.; Zeri, M. Aridity Indices to Assess Desertification Susceptibility: A Methodological Approach Using Gridded Climate Data and Cartographic Modeling. Nat. Hazards 2022, 111, 2531–2558. [Google Scholar] [CrossRef]
  25. Cowie, A.L.; Penman, T.D.; Gorissen, L.; Winslow, M.D.; Lehmann, J.; Tyrrell, T.D.; Twomlow, S.; Wilkes, A.; Lal, R.; Jones, J.W.; et al. Towards Sustainable Land Management in the Drylands: Scientific Connections in Monitoring and Assessing Dryland Degradation, Climate Change and Biodiversity. L. Degrad. Dev. 2011, 22, 248–260. [Google Scholar] [CrossRef]
  26. IPCC. Climate Change 2021: The Physical Science Basis; Contribution of Working Group I to the Sixth Assessment Report of the Intergovernmental Panel on Climate Change; Masson-Delmotte, V., Zhai, P., Pirani, A., Connors, S.L., Péan, C., Berger, S., Caud, N., Chen, Y., Goldfarb, L., Gomis, M.I., et al., Eds.; Cambridge University Press: Cambridge, UK; New York, NY, USA, 2021; p. 2391. [Google Scholar] [CrossRef]
  27. Karatayev, M.; Clarke, M.; Salnikov, V.; Bekseitova, R.; Nizamova, M. Monitoring Climate Change, Drought Conditions and Wheat Production in Eurasia: The Case Study of Kazakhstan. Heliyon 2022, 8, e08660. [Google Scholar] [CrossRef]
  28. Hu, Y.; Han, Y.; Zhang, Y. Land Desertification and Its Influencing Factors in Kazakhstan. J. Arid Environ. 2020, 180, 104203. [Google Scholar] [CrossRef]
  29. Hu, Y.; Hu, Y. Land Cover Changes and Their Driving Mechanisms in Central Asia from 2001 to 2017 Supported by Google Earth Engine. Remote Sens. 2019, 11, 554. [Google Scholar] [CrossRef]
  30. Li, Z.; Chen, Y.; Li, W.; Deng, H.; Fang, G. Potential Impacts of Climate Change on Vegetation Dynamics in Central Asia. J. Geophys. Res. Atmos. 2015, 120, 12345–12356. [Google Scholar] [CrossRef]
  31. Han, W.; Zheng, J.; Guan, J.; Liu, Y.; Liu, L.; Han, C.; Li, J.; Li, C.; Tian, R.; Mao, X. A Greater Negative Impact of Future Climate Change on Vegetation in Central Asia: Evidence from Trajectory/Pattern Analysis. Environ. Res. 2024, 262, 119898. [Google Scholar] [CrossRef]
  32. Russell, A.; Ghalaieny, M.; Gazdiyeva, B.; Zhumabayeva, S.; Kurmanbayeva, A.; Akhmetov, K.K.; Mukanov, Y.; McCann, M.; Ali, M.; Tucker, A.; et al. A Spatial Survey of Environmental Indicators for Kazakhstan: An Examination of Current Conditions and Future Needs. Int. J. Environ. Res. 2018, 12, 735–748. [Google Scholar] [CrossRef]
  33. Kuralbayeva, R.; Aitmukhanbetova, D.; Itekeyeva, G.; Kuatpekova, A.; Abdikulova, P. Innovative Methods of Organising the Work of the AIC in Market Conditions (World Experience and Kazakhstan). Sci. Horizons 2023, 26, 158–168. [Google Scholar] [CrossRef]
  34. Zhumabaev, A.; Schwedhelm, H.; Marti, B.; Ragettli, S.; Siegfried, T. Water Tales from Turkistan: Challenges and Opportunities for the Badam-Sayram Water System under a Changing Climate. Cent. Asian J. Water Res. 2024, 10, 1–25. [Google Scholar] [CrossRef]
  35. Hu, Q.; Han, Z. Northward Expansion of Desert Climate in Central Asia in Recent Decades. Geophys. Res. Lett. 2022, 49. [Google Scholar] [CrossRef]
  36. Guo, L.; Xia, Z. Temperature and Precipitation Long-Term Trends and Variations in the Ili-Balkhash Basin. Theor. Appl. Climatol. 2014, 115, 219–229. [Google Scholar] [CrossRef]
  37. UNDP; UNDP Kazakhstan. Transforming Water Management in Kazakhstan: A Core Investment in Resilience. Available online: https://www.undp.org/kazakhstan/stories/transforming-water-management-kazakhstan-core-investment-resilience (accessed on 28 April 2025).
  38. Tokbergenova, A.; Nyussupova, G.; Arslan, M.; Kiyassova, S.K.L. Causes and Impacts of Land Degradation and Desertification: Case Study from Kazakhstan. In Vegetation of Central Asia and Environs; Springer: Berlin/Heidelberg, Germany, 2018; pp. 291–302. [Google Scholar] [CrossRef]
  39. Akhmetova, S.T.; Rodrigo, J.I.; Duskaev, K.K. Analysis of Atmospheric Aridity in the Territory of Almaty Region in the Conditions of Modern Climate Change. J. Geogr. Environ. Manag. 2019, 54, 49–59. [Google Scholar] [CrossRef]
  40. Zheleznova, I.; Gushchina, D.; Meiramov, Z.; Olchev, A. Temporal and Spatial Variability of Dryness Conditions in Kazakhstan during 1979–2021 Based on Reanalysis Data. Climate 2022, 10, 144. [Google Scholar] [CrossRef]
  41. Li, S.; He, S.; Xu, Z.; Liu, Y.; von Bloh, W. Desertification Process and Its Effects on Vegetation Carbon Sources and Sinks Vary under Different Aridity Stress in Central Asia during 1990–2020. CATENA 2023, 221, 106767. [Google Scholar] [CrossRef]
  42. Sembayeva, Z.; Mussina, L.; Kazbek, M.; Dosmaganbetov, A.; Xenarios, S. Sustainable Land Use Resources in Droughtprone Regions of Kazahstan and Implications for the Wider Central Asia Region. In Resilience and Economic Growth in Times of High Uncertainty; CAREC: Almaty, Kazakhstan, 2023; pp. 340–400. Available online: https://www.carecinstitute.org/publications/resilience-and-economic-growth-in-times-of-high-uncertainty/ (accessed on 21 April 2025).
  43. Harris, I.; Osborn, T.J.; Jones, P.; Lister, D. Version 4 of the CRU TS Monthly High-Resolution Gridded Multivariate Climate Dataset. Sci. Data 2020, 7, 109. [Google Scholar] [CrossRef]
  44. Zhu, X.; Zhang, M.; Wang, S.; Qiang, F.; Zeng, T.; Ren, Z.; Dong, L. Comparison of Monthly Precipitation Derived from High-Resolution Gridded Datasets in Arid Xinjiang, Central Asia. Quat. Int. 2015, 358, 160–170. [Google Scholar] [CrossRef]
  45. Sun, Q.; Miao, C.; Duan, Q.; Ashouri, H.; Sorooshian, S.; Hsu, K. A Review of Global Precipitation Data Sets: Data Sources, Estimation, and Intercomparisons. Rev. Geophys. 2018, 56, 79–107. [Google Scholar] [CrossRef]
  46. Elagib, N.A.; Ali, M.M.A.; Schneider, K. Evaluation and Bias Correction of CRU TS4.05 Potential Evapotranspiration across Vast Environments with Limited Data. Atmos. Res. 2024, 299, 107194. [Google Scholar] [CrossRef]
  47. Oduro, C.; Shuoben, B.; Ayugi, B.; Beibei, L.; Babaousmail, H.; Sarfo, I.; Ullah, S.; Ngoma, H. Observed and Coupled Model Intercomparison Project 6 Multimodel Simulated Changes in Near-surface Temperature Properties over Ghana during the 20th Century. Int. J. Climatol. 2022, 42, 3681–3701. [Google Scholar] [CrossRef]
  48. Ahmed, K.; Shahid, S.; Wang, X.; Nawaz, N.; Khan, N. Spatiotemporal Changes in Aridity of Pakistan during 1901–2016. Hydrol. Earth Syst. Sci. 2019, 23, 3081–3096. [Google Scholar] [CrossRef]
  49. Ahmed, R.; Shamim, T.; Bansal, J.K.; Rather, A.F.; Javaid, S.; Wani, G.F.; Malik, I.H.; Ahmed, P.; Jain, S.K.; Imdad, K.; et al. Assessing Climate Trends in the Northwestern Himalayas: A Comprehensive Analysis of High-Resolution Gridded and Observed Datasets. Geomat. Nat. Hazards Risk 2024, 15, 2401994. [Google Scholar] [CrossRef]
  50. Lickley, M.; Solomon, S. Drivers, Timing and Some Impacts of Global Aridity Change. Environ. Res. Lett. 2018, 13, 104010. [Google Scholar] [CrossRef]
  51. Mann, H.B. Non-Parametric Test against Trend. Econometrica 1945, 13, 245–259. [Google Scholar] [CrossRef]
  52. Yue, S.; Pilon, P.; Cavadias, G. Power of the Mann–Kendall and Spearman’s Rho Tests for Detecting Monotonic Trends in Hydrological Series. J. Hydrol. 2002, 259, 254–271. [Google Scholar] [CrossRef]
  53. Tabari, H.; Aghajanloo, M. Temporal Pattern of Aridity Index in Iran with Considering Precipitation and Evapotranspiration Trends. Int. J. Climatol. 2013, 33, 396–409. [Google Scholar] [CrossRef]
  54. Jiang, L.; Liu, B.; Guo, H.; Yuan, Y.; Liu, W.; Jiapaer, G. Assessing Vegetation Resilience and Vulnerability to Drought Events in Central Asia. J. Hydrol. 2024, 634, 131012. [Google Scholar] [CrossRef]
  55. Deng, H.; Yin, Y.; Han, X. Vulnerability of Vegetation Activities to Drought in Central Asia. Environ. Res. Lett. 2020, 15, 084005. [Google Scholar] [CrossRef]
  56. Vitkovskaya, I.; Batyrbayeva, M.; Berdigulov, N.; Mombekova, D. Prospects for Drought Detection and Monitoring Using Long-Term Vegetation Indices Series from Satellite Data in Kazakhstan. Land 2024, 13, 2225. [Google Scholar] [CrossRef]
  57. Salnikov, V.; Talanov, Y.; Polyakova, S.; Assylbekova, A.; Kauazov, A.; Bultekov, N.; Musralinova, G.; Kissebayev, D.; Beldeubayev, Y. An Assessment of the Present Trends in Temperature and Precipitation Extremes in Kazakhstan. Climate 2023, 11, 33. [Google Scholar] [CrossRef]
  58. Zhou, J.; Jiang, T.; Wang, Y.; Su, B.; Tao, H.; Qin, J.; Zhai, J. Spatiotemporal Variations of Aridity Index over the Belt and Road Region under the 1.5 °C and 2.0 °C Warming Scenarios. J. Geogr. Sci. 2020, 30, 37–52. [Google Scholar] [CrossRef]
  59. Yan, X.; Zhang, Q.; Ren, X.; Wang, X.; Yan, X.; Li, X.; Wang, L.; Bao, L. Climatic Change Characteristics towards the “Warming–Wetting” Trend in the Pan-Central-Asia Arid Region. Atmosphere 2022, 13, 467. [Google Scholar] [CrossRef]
  60. Farooq, I.; Shah, A.R.; Sahana, M.; Ehsan, M.A. Assessment of Drought Conditions Over Different Climate Zones of Kazakhstan Using Standardised Precipitation Evapotranspiration Index. Earth Syst. Environ. 2023, 7, 283–296. [Google Scholar] [CrossRef]
  61. Budanov, N.U. Degradation of Land Resources of Kazakhstan. In Proceedings of the International Science-Practice Conference “Geography and Geoecology: Science, Practice, and Education”; Moscow Region State University Publishing House: Moscow, Russia, 2016; pp. 31–36. [Google Scholar]
  62. Shmelev, S.E.; Salnikov, V.; Turulina, G.; Polyakova, S.; Tazhibayeva, T.; Schnitzler, T.; Shmeleva, I.A. Climate Change and Food Security: The Impact of Some Key Variables on Wheat Yield in Kazakhstan. Sustainability 2021, 13, 8583. [Google Scholar] [CrossRef]
  63. Zou, S.; Abuduwaili, J.; Ding, J.; Duan, W.; De Maeyer, P.; van de Voorde, T. Description and Attribution Analysis of the 2017 Spring Anomalous High Temperature Causing Floods in Kazakhstan. J. Meteorol. Soc. Japan. Ser. II 2020, 98, 1353–1368. [Google Scholar] [CrossRef]
  64. Bayer-Altın, T.; Sadykova, D.; Türkeş, M. Evolution of Long-Term Trends and Variability in Air Temperatures of Kazakhstan for the Period 1963–2020. Theor. Appl. Climatol. 2024, 155, 541–566. [Google Scholar] [CrossRef]
  65. Cherednichenko, A.V.; Cherednichenko, A.V.; Cherednichenko, V.S. Climatic Fluctuations in Temperature and Precipitation in Northern Kazakhstan. Proc. Vor. State Univ. Ser. Geogr. Geoecology 2019, 2, 17–31. (In Russian) [Google Scholar]
  66. Fekete, B.M.; Vörösmarty, C.J.; Roads, J.O.; Willmott, C.J. Uncertainties in Precipitation and Their Impacts on Runoff Estimates. J. Clim. 2004, 17, 294–304. [Google Scholar] [CrossRef]
  67. Nicholson, S.E. The West African Sahel: A Review of Recent Studies on the Rainfall Regime and Its Interannual Variability. ISRN Meteorol. 2013, 2013, 1–32. [Google Scholar] [CrossRef]
  68. Cook, B.I.; Ault, T.R.; Smerdon, J.E. Unprecedented 21st Century Drought Risk in the American Southwest and Central Plains. Sci. Adv. 2015, 1, e1400082. [Google Scholar] [CrossRef]
  69. Timbal, B.; Drosdowsky, W. The Relationship between the Decline of Southeastern Australian Rainfall and the Strengthening of the Subtropical Ridge. Int. J. Climatol. 2013, 33, 1021–1034. [Google Scholar] [CrossRef]
  70. CAREC Analysis of Climate Change Adaptation Activities in Central Asia: Needs, Recommendations, Practices. Available online: https://carececo.org/upload/27.pdf (accessed on 21 April 2025).
  71. Luković, J.; Bajat, B.; Blagojević, D.; Kilibarda, M. Spatial Pattern of Recent Rainfall Trends in Serbia (1961–2009). Reg. Environ. Chang. 2014, 14, 1789–1799. [Google Scholar] [CrossRef]
Figure 1. Locations of the study area.
Sustainability 17 07089 g001
Figure 2. Framework diagram for this study.
Sustainability 17 07089 g002
Figure 3. Spatial patterns of Aridity Index at the annual (A) and seasonal scale ((B) winter, (C) spring, (D) summer, (E) autumn) for the entire study period (1960–2022), the first sub-period (1960–1990), and the second sub-period (1991–2022).
Sustainability 17 07089 g003
Figure 4. Temporal characteristics Aridity Index, P, PET, and T at the annual (A) and seasonal scale ((B) winter, (C) spring, (D) summer, (E) autumn) for the different periods.
Sustainability 17 07089 g004
Figure 5. Spatial distribution characteristics of Aridity Index climate zones at the annual (A) and seasonal scale ((B) winter, (C) spring, (D) summer, (E) autumn) for the different periods.
Sustainability 17 07089 g005
Table 1. Results of the MK tests for the long-term period and the recent 30-year period.
Parts of RegionPara-
Meters
Z Value
AnnualWinterSpringSummerAutumn
1960–20221991–20221960–20221991–20221960–20221991–20221960–20221991–20221960–20221991–2022
SouthernP−1.050.921.711.040.621.75−0.96−0.48−1.97 *−0.11
PET3.64 *1.64−2.45 *−1.332.67 *1.843.53 *2.05 *1.85−0.3
T4.52 *2.32 *1.450.433.32 *2.66 *4.63 *2.34 *1.89−0.32
Aridity Index−1.550.392.54 *1.46−0.40.99−1.18−0.71−2.35 *−0.28
CentralP−1.062.03 *1.741.150.230.87−0.70.52−0.112.66 *
PET2.76 *1.34−1.030.632.82 *1.551.781.411.72−0.52
T4.14 *1.96 *1.290.342.63 *2.37 *3.321.772.23−0.53
Aridity Index−1.11.321.61−0.19−0.640.21−0.830.17−0.612.21 *
NorthernP2.17 *2.26 *2.71 *0.661.531.140.470.690.82.49 *
PET2.88 *1.23−2.14 *0.352.75 *2.07 *1.541.621.83−0.18
T3.62 *1.231.120.0012.622.14 *2.31 *1.252.15 *−0.26
Aridity Index1.060.232.88 *0.010.270.230.210.070.212.23 *
Note: *—significance level.
Disclaimer/Publisher’s Note: The statements, opinions and data contained in all publications are solely those of the individual author(s) and contributor(s) and not of MDPI and/or the editor(s). MDPI and/or the editor(s) disclaim responsibility for any injury to people or property resulting from any ideas, methods, instructions or products referred to in the content.