Article

How Does New Quality Productive Forces Affect Green Total Factor Energy Efficiency in China? Consider the Threshold Effect of Artificial Intelligence

1
Institute of Geographical Sciences, Hebei Academy of Sciences (Hebei Engineering Research Center for Geographic Information Application), Shijiazhuang 050011, China
2
College of Business & Economics, Australian National University, Canberra, ACT 2601, Australia
3
School of Management Science and Information Engineering, Hebei University of Economics and Business, Shijiazhuang 050061, China
*
Author to whom correspondence should be addressed.
Sustainability 2025, 17(15), 7012; https://doi.org/10.3390/su17157012
Submission received: 1 July 2025 / Revised: 22 July 2025 / Accepted: 28 July 2025 / Published: 1 August 2025
(This article belongs to the Section Energy Sustainability)

Abstract

China’s economy is shifting from an era of rapid expansion to one focused on high-quality development, making it imperative to tackle environmental degradation linked to energy use. Understanding how New Quality Productive Forces (NQPF) interact with energy efficiency, along with the mechanisms driving this relationship, is essential for economic transformation and long-term sustainability. This study establishes an evaluation framework for NQPF, integrating technological, green, and digital dimensions. We apply fixed-effects models, the spatial Durbin model (SDM), a moderation model, and a threshold model to analyze the influence of NQPF on Green Total Factor Energy Efficiency (GTFEE) and its spatial implications. This underscores the necessity of distinguishing it from traditional productivity frameworks and adopting a new analytical perspective. Furthermore, by considering dimensions such as input, application, innovation capability, and market efficiency, we reveal the moderating role and heterogeneous effects of artificial intelligence (AI). The findings are as follows: The development of NQPF significantly enhances GTFEE, and the conclusion remains robust after tail reduction and endogeneity tests. NQPF has a positive spatial spillover effect on GTFEE; that is, while improving the local GTFEE, it also improves neighboring regions GTFEE. The advancement of AI significantly strengthens the positive impact of NQPF on GTFEE. AI exhibits a significant U-shaped threshold effect: as AI levels increase, its moderating effect transitions from suppression to facilitation, with marginal benefits gradually increasing over time.

1. Introduction

The transition to green energy is a fundamental approach to achieving sustainable energy advancement and an important driving force for China’s high-quality economic progression. While China’s rapid economic development has brought disruptive transformations to society, it has also been accompanied by intensive energy dependence, contributing to a sharp increase in carbon emissions and environmental issues such as the greenhouse effect. Yale University’s 2024 Environmental Performance Index (EPI) shows China ranked 156th among 180 nations and territories. The China Energy Development Annual Report (2024) indicates that China’s energy consumption continues to grow, reaching a total of 5.72 billion tons of standard coal in 2023, an increase annually of 5.7%, with fossil energy still the main energy sources. Given the tightening resource constraints and an inflexible energy framework, enhancing energy efficiency to curb energy usage has become an urgent need for China. Green Total Factor Energy Efficiency (GTFEE) primarily addresses energy output levels while also stressing the importance of efficiency and sustainability in energy production. It comprehensively integrates various factors such as capital, labor, resources, and the environment, which make it a key benchmark for evaluating the progress of green energy initiatives. Amidst the pressures of economic expansion and energy saving, along with emission reduction goals, improving GTFEE is a necessary way to relieve the pressure.
As the material foundation of socioeconomic development, energy is progressively transitioning into a new stage of deep integration of digital technology and the energy industry. Improving GTFEE and transitioning from a resource-dependent to an innovation-led energy development model require a fundamental shift in the existing productivity paradigm. As a newly emerging policy concept in China’s economic discourse, New Quality Productive Forces (NQPF) represents a strategic departure from traditional productivity models, calling for a novel analytical framework to understand its broader implications. NQPF is characterized by digitalization, intelligence, and greenness, aiming to drive sustainable development by innovatively allocating production factors to achieve high-quality economic growth. With global energy transformation and sustainable development, artificial intelligence (AI) is helpful to enhance production efficiency, optimizing energy utilization and promoting green technology innovation. However, technological innovation and AI themselves consume capital and energy, leading to additional inputs for GTFEE while also contributing to environmental pollution, including SO2 and CO2 emissions. Therefore, exploring how AI empowers NQPF to improve GTFEE holds substantial practical value in advancing high-quality green development. At the current stage, determining whether the development of NQPF can enhance GTFEE depends on the relationship between its expected benefits, such as economic and environmental gains, and its unintended outputs, including environmental pollution and resource consumption. To address this duality, this study explicitly investigates the conditions under which the benefits of NQPF outweigh the potential costs. Specifically, by integrating undesirable outputs into the GTFEE evaluation framework and examining AI’s moderating and threshold effects, we assess how intelligent transformation may reduce such negative externalities. Consequently, revealing NQPF’s impact on GTFEE and examining AI’s moderating role in this process can provide a scientific basis for policymaking and contribute to sustainable economic development. However, existing studies predominantly focus on linear relationships between indicators, which may overlook the spatial dependence and cross-regional externalities in green energy development. Therefore, this study incorporates a spatial dimension to examine the broader geographic impact of NQPF on GTFEE.
At present, academic research on energy efficiency has attracted widespread attention, with most studies focusing on accurately evaluating energy efficiency and analyzing its spatial and temporal distribution. Regarding influencing factors, the previous literature has primarily explored the effects of technological progress [1,2], financial development [3], urbanization [4,5], and industrial structure [6] on GTFEE. Meanwhile, the previous literature has also focused on exploring the conceptual characteristics of NQPF, mostly adopting qualitative approaches to conduct theoretical analyses. Limited research has analyzed NQPF’s impact on economic and social development. Nonetheless, the prior literature has largely emphasized the effects of single dimensions, such as technological innovation and digitization, on energy efficiency and consumption [7]. However, existing studies lack empirical studies on how the multidimensional combination of NQPF influences energy efficiency. In particular, under the backdrop of rapid AI development, the mechanisms linking AI, NQPF, and energy efficiency remain unclear. Moreover, existing studies predominantly focus on linear relationships between indicators [8], with fewer studies incorporating a three-dimensional spatial perspective [9] to examine GTFEE’s spatial dependence and NQPF’s spatial influence. Therefore, it is essential to conduct empirical analyses to explore the intrinsic relationships among NQPF, AI development levels, and GTFEE. Doing so can fill theoretical gaps and provide key theoretical support and practical guidance for achieving sustainable energy development.
To achieve this objective, we adopt panel data from 30 Chinese provinces (2011–2022) to systematically explore the multidimensional effect and underlying mechanisms of NQPF on GTFEE. As shown in Figure 1, the main research contents are as follows: (1) We construct an NQPF, AI, GTFEE indicator system and use the entropy weight method to quantify NQPF and AI levels and use Super-SBM to assess GTFEE. (2) We construct both static and dynamic fixed-effects models to systematically explore the effect of NQPF on GTFEE. (3) We use SDM to examine whether NQPF development induces spatial spillover effects on GTFEE in adjacent regions, as well as to measure the intensity of such effects. (4) We construct moderation and threshold effect models to analyze how NQPF’s impact on GTFEE varies across different levels of AI development.
Research Innovations and Academic Contributions: (1) From the perspective of NQPF, this study innovatively examines static and dynamic effects of NQPF development on GTFEE, offering a novel analytical perspective for advancing urban green development. The conclusions are helpful to further understand the effect of NQPF on GTFEE, thereby assisting governments in formulating relevant policies. (2) Considering the spatial externalities of NQPF, this study extends the conventional two-dimensional regional impact framework to a three-dimensional cross-regional analysis, investigating the spatial spillover effects of NQPF in overcoming geographical and economic distance constraints on GTFEE, thereby broadening the research scope from a geographical perspective. (3) Within the context of artificial intelligence, this study elucidates AI development levels’ role in shaping the impact of NQPF on GTFEE. (4) This study further refines the understanding of variations in impact intensity across different AI threshold intervals through threshold effect analysis, thereby identifying the critical nodes and providing empirical evidence of inflection points in the relationship between NQPF and GTFEE. This establishes a theoretical foundation for delineating the boundary conditions of the impact mechanism and enables enterprises and policymakers to determine the optimal range for maximizing marginal returns on resource investments under specific conditions, thereby optimizing energy and technological inputs. These findings provide new insights into existing research.
The subsequent sections are as follows: Section 2 is theoretical analysis. Section 3 is variable definition. Section 4 is analysis of empirical results. Section 5 is the discussion. Section 6 is the conclusion.

2. Theoretical Analyses and Hypotheses

2.1. The Effect of NQPF on GTFEE

Energy efficiency has become a widely studied and highly relevant topic. Balancing energy efficiency, economic growth, and environmental sustainability is a critical challenge in achieving sustainable development [2]. Essentially, energy efficiency can be explained from both technological [10] and economic perspectives [11]. From an economic standpoint, energy efficiency refers to achieving higher economic output with lower energy consumption, while from a technological perspective, it involves reducing energy consumption through advancements in energy technology. NQPF signifies a shift from traditional resource-dependent productivity to innovation-driven productivity, emphasizing technological advancements and optimized resource allocation to enhance production efficiency and product quality while simultaneously reducing environmental pollution and resource waste. This approach aims to achieve efficient, green, and sustainable development. First, NQPF emphasizes revolutionary technological breakthroughs to drive profound transformations in production methods. These technologies enhance the intelligence and automation of production, significantly improving efficiency [12] while also fostering the emergence of new industries and products, thereby promoting economic diversification and structural optimization. Second, NQPF establishes a novel and coordinated production system by efficiently allocating key production factors, including labor, capital, technology, and data. The optimization of these factors enhances production efficiency while simultaneously improving product quality and value-added benefits. Furthermore, NQPF advocates for green production, reducing environmental pollution and resource waste while aligning economic and environmental benefits. Collectively, these measures significantly improve GTFEE, thereby promoting sustainable green economic development. Thus, we formulate:
H1. 
The development of NQPF can enhance GTFEE.

2.2. The Spatial Relationship Between NQPF and GTFEE

In geographically proximate regions, the flow of key factors, including technology, industry, and policy, remains more fluid, enabling spatial spillover effects in NQPF development. First, the core driving force of NQPF is technological innovation. Based on the Technology Diffusion Theory, technological innovation is inherently diffusive and replicable [8], meaning its influence is not confined to a specific region but can be transmitted across regions. For example, emerging technologies (e.g., clean energy technologies, smart manufacturing, and digital management systems) can be spread through market mechanisms, technological cooperation, and talent mobility, thereby expanding their impact on neighboring regions. Second, the development of NQPF is often dependent on the agglomeration of advanced manufacturing and high-tech industries. According to Alfred Marshall’s Industrial Agglomeration Theory, these industries tend to establish tightly integrated upstream and downstream supply chains, facilitating their diffusion to surrounding regions through coordinated industrial development [13]. This process enhances overall production efficiency in neighboring areas while simultaneously improving energy utilization efficiency. Furthermore, in the context of regional cooperation and industrial chain integration, upstream suppliers and downstream enterprises are often influenced by the green production practices of core enterprises [14], leading them to optimize their own energy consumption patterns. Through green supply chain management, large enterprises have put forward more stringent environmental requirements for suppliers, forcing suppliers to adopt more energy-saving and environmentally friendly production methods. This, in turn, generates spillover effects throughout the entire industrial chain. Additionally, the spatial spillover effects of policies related to NQPF play a crucial role in enhancing regional GTFEE. When a particular region enforces stricter environmental regulations, provides subsidies for green technologies, or sets carbon emission constraints to promote the development of NQPF, neighboring regions may adjust their policy frameworks in response to industrial competition, policy coordination, or market demand. This process facilitates green development on a broader scale and contributes to the overall improvement of GTFEE across regions. Thus, we formulate:
H2. 
Improving the NQPF level can improve adjacent regions’ GTFEE through the spatial spillover effect.

2.3. The AI Effect of NQPF on GTFEE
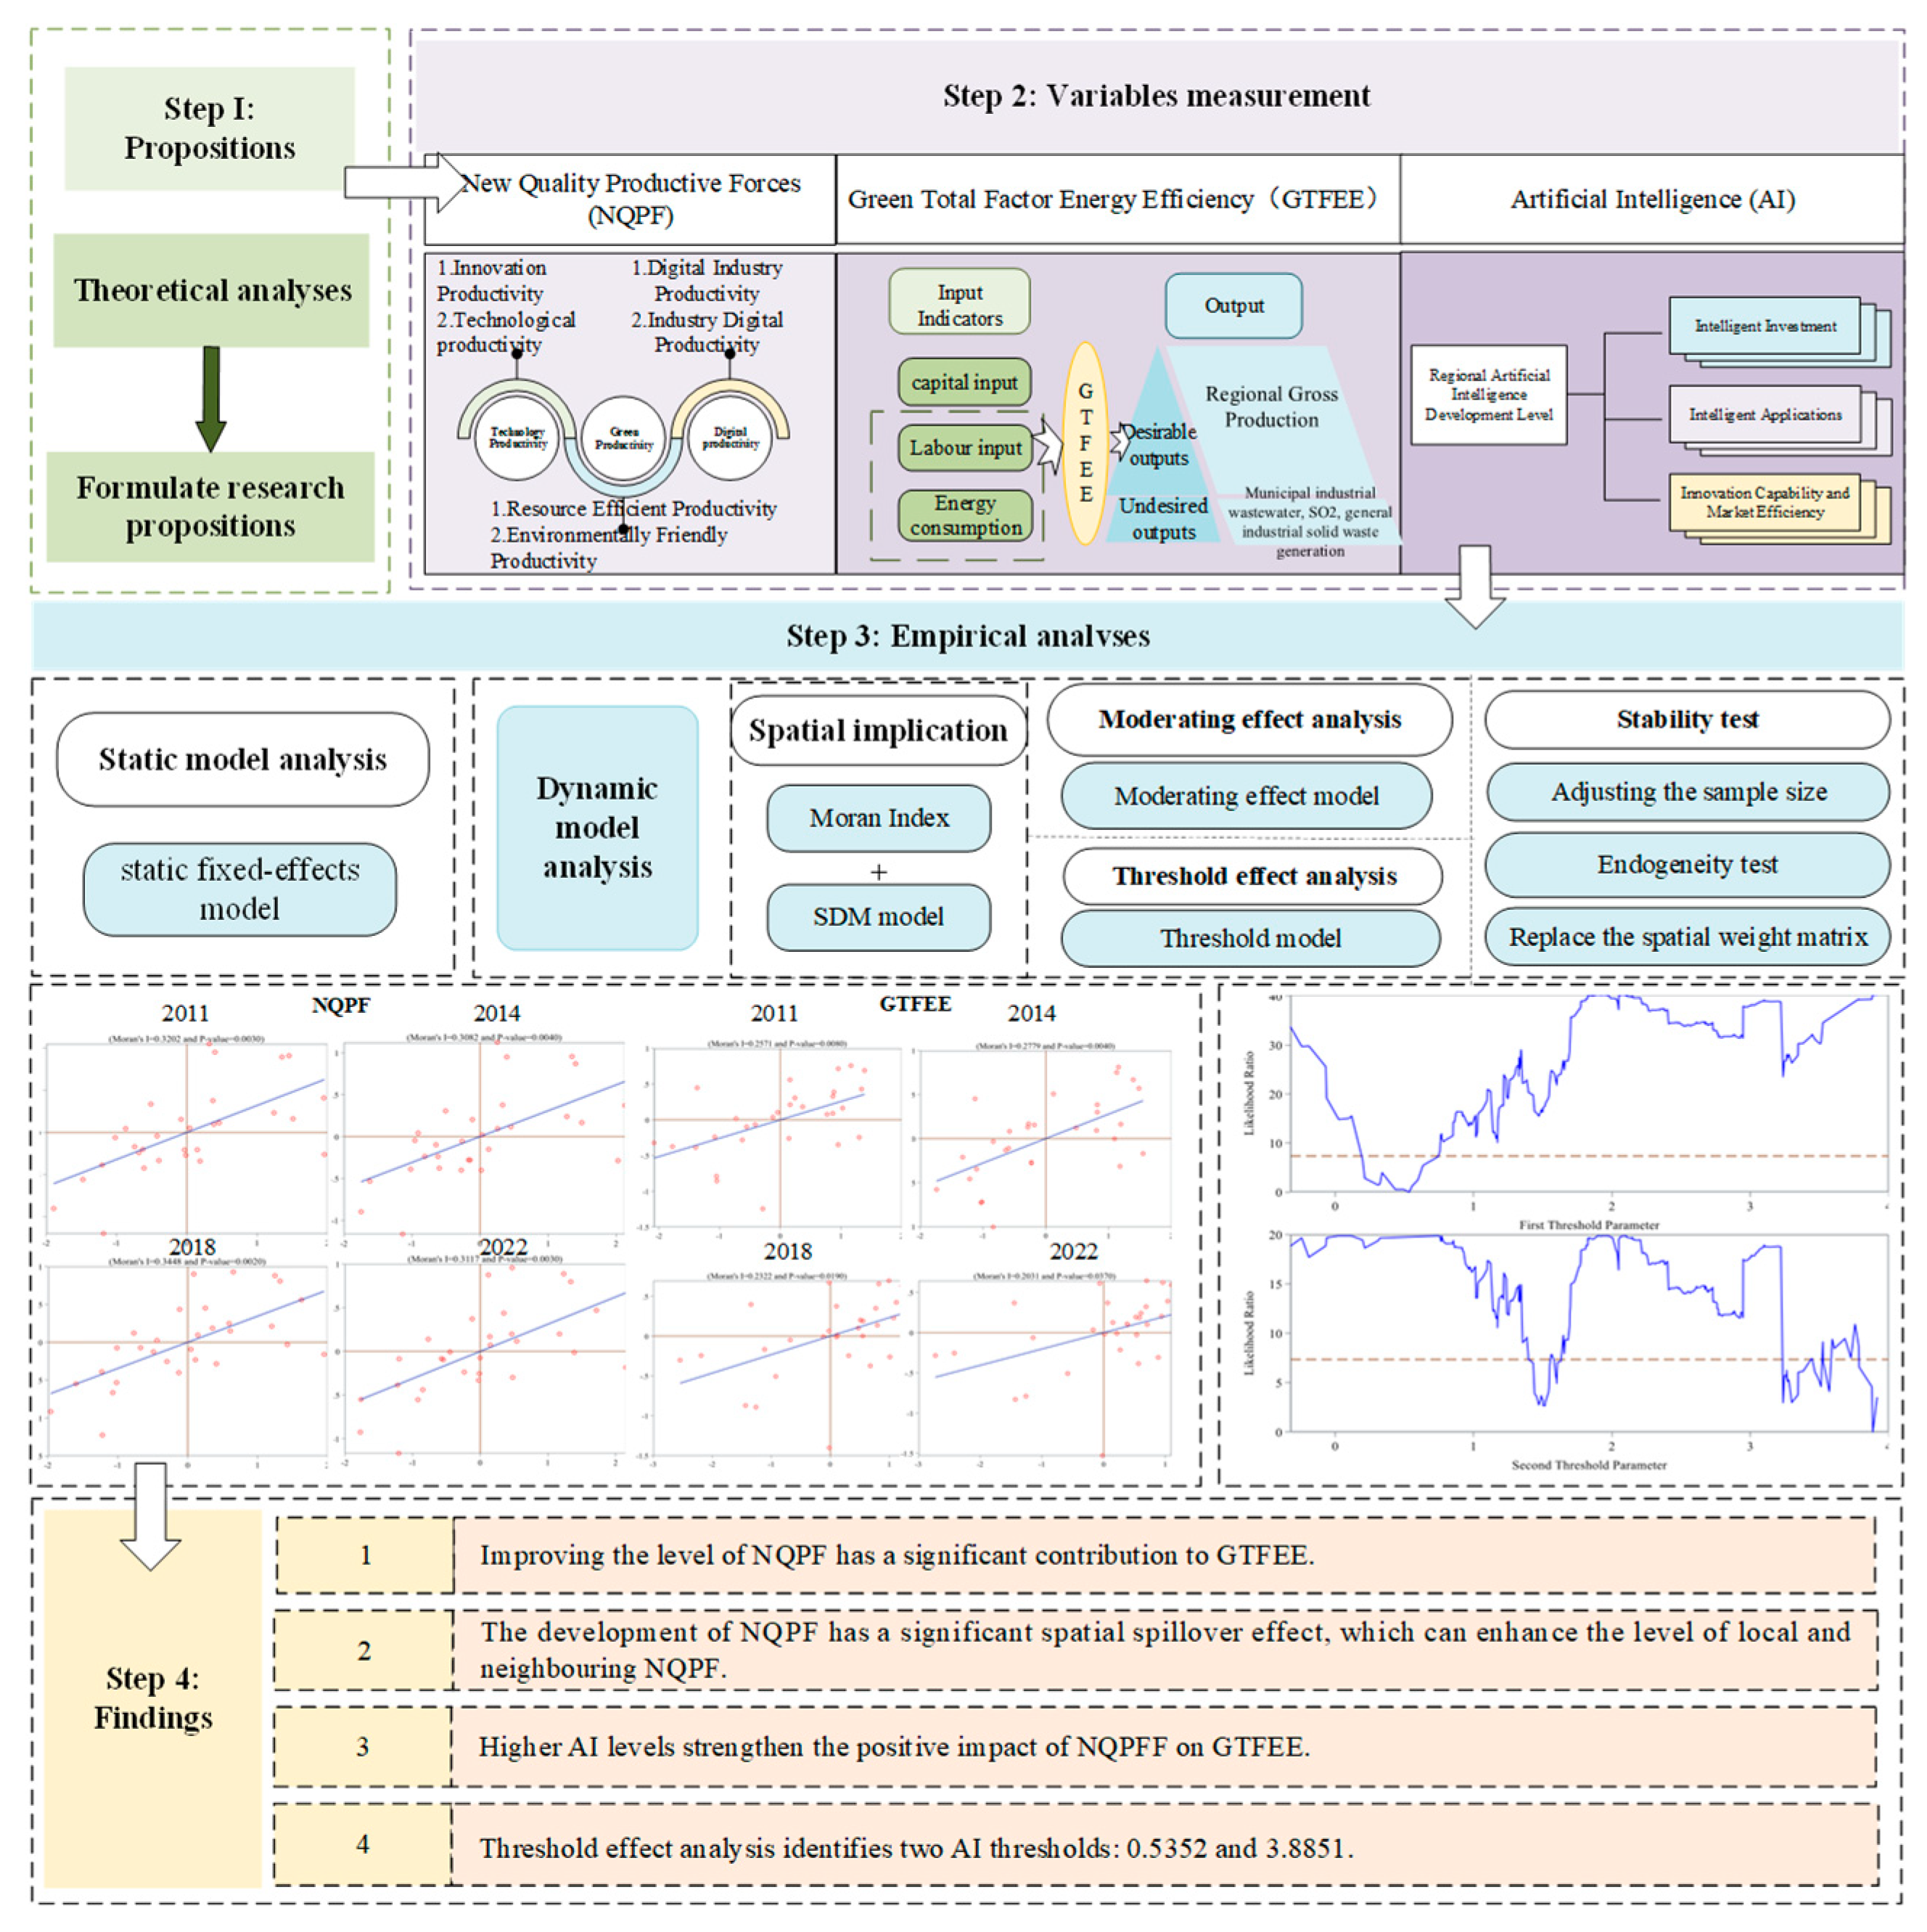
AI, as a transformative General-Purpose Technology (GPT) driving the new wave of technological revolution and industrial development, not only reshapes production and daily life but also gives rise to new business models and industrial structures, making it a crucial engine for advancing NQPF. First, AI enhances the quality and efficiency of NQPF by optimizing resource allocation, enabling enterprises to achieve high-efficiency production with lower energy consumption and carbon emissions. For instance, the widespread application of intelligent manufacturing systems, industrial Internet of Things (IoT), and adaptive production technologies enables a more precise matching of energy consumption with production activities, thereby reducing energy waste and improving energy utilization efficiency. This not only enhances production efficiency but also lowers environmental costs, promoting green and sustainable development. Second, according to the Endogenous Growth Theory, AI accelerates the diffusion and application of green technological innovations [15], thereby empowering NQPF. For example, intelligent energy management systems can monitor and optimize energy use in real time, decreasing unnecessary energy losses. Additionally, AI-driven pollution-monitoring technologies enhance environmental risk warning capabilities, helping enterprises better control emissions, and facilitating the transition to cleaner production models. Furthermore, AI contributes to data-driven decision-making, promoting personalized energy solutions at both regional and industrial levels, thereby amplifying the positive impact of NQPF on GTFEE. Leveraging big data analytics and AI algorithms, governments and enterprises can formulate more precise energy-saving and emission-reduction policies, achieving differentiated management and enhancing policy effectiveness. In summary, AI not only improves the efficiency of NQPF but also plays a crucial role in green technological innovation, intelligent decision-making, and energy optimization, further influencing the impact of NQPF on GTFEE. Thus, we formulate:
H3. 
Improving the AI level can positively moderate the effect of NQPF on GTFEE.

3. Methods

3.1. Variable Definition

3.1.1. Explanatory Variable

New Quality Productive Forces. Existing studies mainly examine the influence of traditional productivity determinants [16,17] and technology [18] on energy. In contrast, this study examines the effect of NQPF, a novel productivity system, on GTFEE. Unlike traditional productivity, NQPF is primarily driven by technological innovation, digital transformation, and intelligent automation. Its core lies in optimizing and efficiently utilizing production factors through high-tech advancements such as AI, big data, and the IoT, thereby achieving higher production efficiency and sustainable development goals. To rigorously and accurately assess China’s NQPF levels, we construct a comprehensive evaluation system grounded in rationality, scientific rigor, and data availability. As Table 1 shows, NQPF is measured across three dimensions: technological productivity, green productivity, and digital productivity, which are further divided into six sub-dimensions, including innovation productivity, technological productivity, and resource-efficient productivity. A total of 18 indicators are used to establish the NQPF evaluation index system. We employ the polarization method to eliminate variable outline effects and variation range, while the entropy weight method is used to compute the NQPF level.

3.1.2. Dependent Variable

Green Total Factor Energy Efficiency. Referring to Fang et al. (2024) [19], Dai et al. (2024) [17], and Lin et al. (2024) [20], we construct an input–output model to measure GTFEE. Factors are as shown in Table 2. Capital input is measured by fixed capital stock [7]. Labor input is represented by the number of employed individuals in each province, while energy input is calculated based on the total energy consumption of each province. The desirable output is measured by GDP, which reflects the economic growth benefits derived from energy consumption. The undesirable outputs, representing environmental pollution caused by the production process, are selected based on Shao et al. (2023) [5]. We adopt urban industrial wastewater discharge, SO2 emissions, and general industrial solid waste generation as pollution indicators. Additionally, referring to Gao et al. (2022), we adopt Super-SBM to effectively calculate GTFEE [7].

3.1.3. Moderating Variable

Artificial Intelligence Level. Considering the early, mid, and late stages of AI development, we construct an AI index system based on three dimensions: AI investment, AI application, and AI innovation capability market benefits. This system is further subdivided into 13 secondary indicators (as shown in Table 3). AI investment ensures that AI technology receives sufficient resource support for its development and reveals the initial driving forces of AI growth. It is measured through infrastructure development, R&D investment, and talent reserves. AI application focuses on how AI technology transitions from the research phase to actual productivity, particularly in industrial applications and product innovation. It includes indicators such as software development and application, smart product development, smart enterprise growth, and the degree of AI technology adoption. AI innovation capability market benefits further analyze AI technology’s market performance, commercialization progress, and contribution to economic growth. This includes indicators such as innovation capability, AI market value-added, AI market profitability, AI market size, and social benefits. We adopt the entropy weight method to calculate the AI level [21].

3.1.4. Control Variables

Referring to Hao et al. (2023) [22], Li et al. (2021) [23], and Wu et al. (2021) [2], we adopt five control variables: (1) Labor Force Level (LFL): measured by the natural logarithm of employment. (2) Economic Development Level (EDL): measured by the per capita GDP. (3) Research and Development Intensity (RDI): measured by the ratio of internal R&D expenditure to the regional GDP. (4) Fiscal Budget Expenditure (FBE): measured by the general public budget expenditure. (5) Industrial Structure Upgrading (IS): measured by the ratio of the value-added of the tertiary sector to the secondary sector.

3.2. Data Source

We select panel data from 30 provinces (excluding Xinjiang) in China from 2010 to 2022. The data are sourced from the China Statistical Yearbook, China Science and Technology Statistical Yearbook, China Energy Statistical Yearbook, and various provincial statistical yearbooks. Missing data are supplemented using the linear interpolation method [24]. To avoid multicollinearity, we use the Variance Inflation Factor (VIF) to test explanatory and control variables. The results show that all VIF values are below 10, and tolerance values exceed 0.1, suggesting that multicollinearity is not a concern. The descriptive statistics are shown in Table 4.

4. Results and Analysis

4.1. Benchmark Regression

4.1.1. Static Model Analysis

The White test indicates the presence of heteroscedasticity in the short-panel data. Therefore, the clustered robust standard error method is applied for correction. In model selection, the robust Hausman test consistently rejects the null hypothesis and shows that a fixed-effects model should be used [7]. Accordingly, we construct:
ln GTFEE i t = α 0 + α 1 ln NQPF i t + α 2 ln CV i t + u i + v t + σ i t
where CV represents the control variables. α is the coefficient value. i is city, t is year, u captures individual fixed effects, v accounts for time fixed effects, and σ represents the random error term.
In the regression analyses in this paper, the 1% and 5% significance levels were determined by statistically testing whether the p-values were less than 0.01 and 0.05. The regression results are presented in Columns (1) and (2) of Table 5. Significance levels at 1% and 5% are based on p-values below 0.01 and 0.05, respectively. The coefficients of lnNQPF are significantly positive, indicating that NQPF development enhances GTFEE. Specifically, Column (1) reports a coefficient of 0.196 for lnNQPF (t = 4.90), significant at the 1% level, suggesting that a 1% increase in NQPF is associated with a 0.196% increase in GTFEE. In Column (2), after controlling for additional covariates, the coefficient rises to 0.238 (t = 2.51), significant at the 5% level. Although the significance level declines slightly, the result remains robust (p < 0.05), supporting the conclusion that NQPF development has a stable and positive impact on GTFEE. Thus, H1 is supported. The possible reasons are as follows: First, technological innovation is one of the core elements of NQPF. It includes the application of green technology, digital technology, and intelligent manufacturing. These technological advancements improve energy utilization efficiency, reduce waste, and enhance resource allocation through more efficient energy management systems, thereby increasing GTFEE. Second, the improvement of NQPF levels promotes industrial structure upgrading, gradually transforming traditional high-energy-consumption and low-efficiency industries into high-value-added and low-energy-consuming green industries. In this process, technology-intensive and intelligent manufacturing industries replace resource-intensive industries [25], leading to an optimized energy consumption structure and consequently enhancing GTFEE. Third, NQPF utilizes big data, blockchain, and new energy technologies [26]. It has promoted changes in production methods; reduced energy, labor, and land inputs and undesirable outputs; and increased economic, social, and environmental benefits, thus increasing GTFEE.
As shown in column (2) of Table 5, lnLFL’s coefficient is −4.893 and is significant at the 1% level, suggesting that the labor force level has a negative impact on GTFEE. When the labor force level increases, GTFEE declines. The possible reasons are as follows: First, when the labor force level increases, especially in high-energy-consuming industries (e.g., heavy industry), each additional worker may require more energy support, thereby increasing energy consumption per unit of output. This could lead to increasing marginal energy consumption benefits, ultimately reducing GTFEE. Additionally, an increase in the labor force may cause imbalances in the industrial structure and the labor market. The additional labor force may not necessarily flow into efficient, green, or technology-intensive industries but may instead expand inefficient and high-energy-consuming industries, such as manufacturing and construction. This can reduce energy utilization efficiency and increase overall energy consumption. Furthermore, lnIS’s coefficient is −0.108 and is significant at 10%, indicating that industrial structure upgrading is negatively correlated with GTFEE. This may be because, although the service industry generally has lower energy consumption, certain sectors such as finance, transportation, and construction remain energy intensive. The advancement of the service industry is often accompanied by the development of infrastructure, transportation, and other related activities, leading to increased energy consumption, which in turn lowers GTFEE. Furthermore, China’s industrial upgrading is still in a transitional phase, and the early stages often involve large-scale infrastructure construction, equipment updates, and industrial restructuring, all of which are capital- and energy-intensive. Additionally, some fast-growing service sectors, such as logistics and data services, exhibit high energy intensity, contributing to the observed decline in GTFEE during this phase.

4.1.2. Dynamic Model Analysis

Considering that the development of NQPF may have cumulative and lagged effects on GTFEE, we introduce a one-period lagged term of GTFEE into Model (1) and construct a dynamic fixed-effects model [9]:
ln GTFEE i t = α 0 + α 1 ln NQPF i t + α 2 ln CV i t + α 3 L . ln GTFEE i t 1 + u i + v t + σ i t
where L.lnGTFEE represents the first order lagged term of GTFEE, while other variables are the same as in Model (1).
The regression results are shown in column (3) of Table 5. L.lnGTFEE’s coefficient is significantly positive at 1%, suggesting that GTFEE exhibits dynamic persistence. The improvement in energy efficiency is generally a long-term cumulative process, relying on past technological upgrades, industrial structure adjustments, and policy guidance. Therefore, a higher energy efficiency level in the previous period has a sustained impact on the current period. Additionally, lnNQPF’s coefficient is significantly positive at 5%, with a marginal effect of 0.587, indicating that NQPF can significantly enhance GTFEE. Thus, when considering dynamic effects, the findings further support H1.

4.2. Spatial Effects

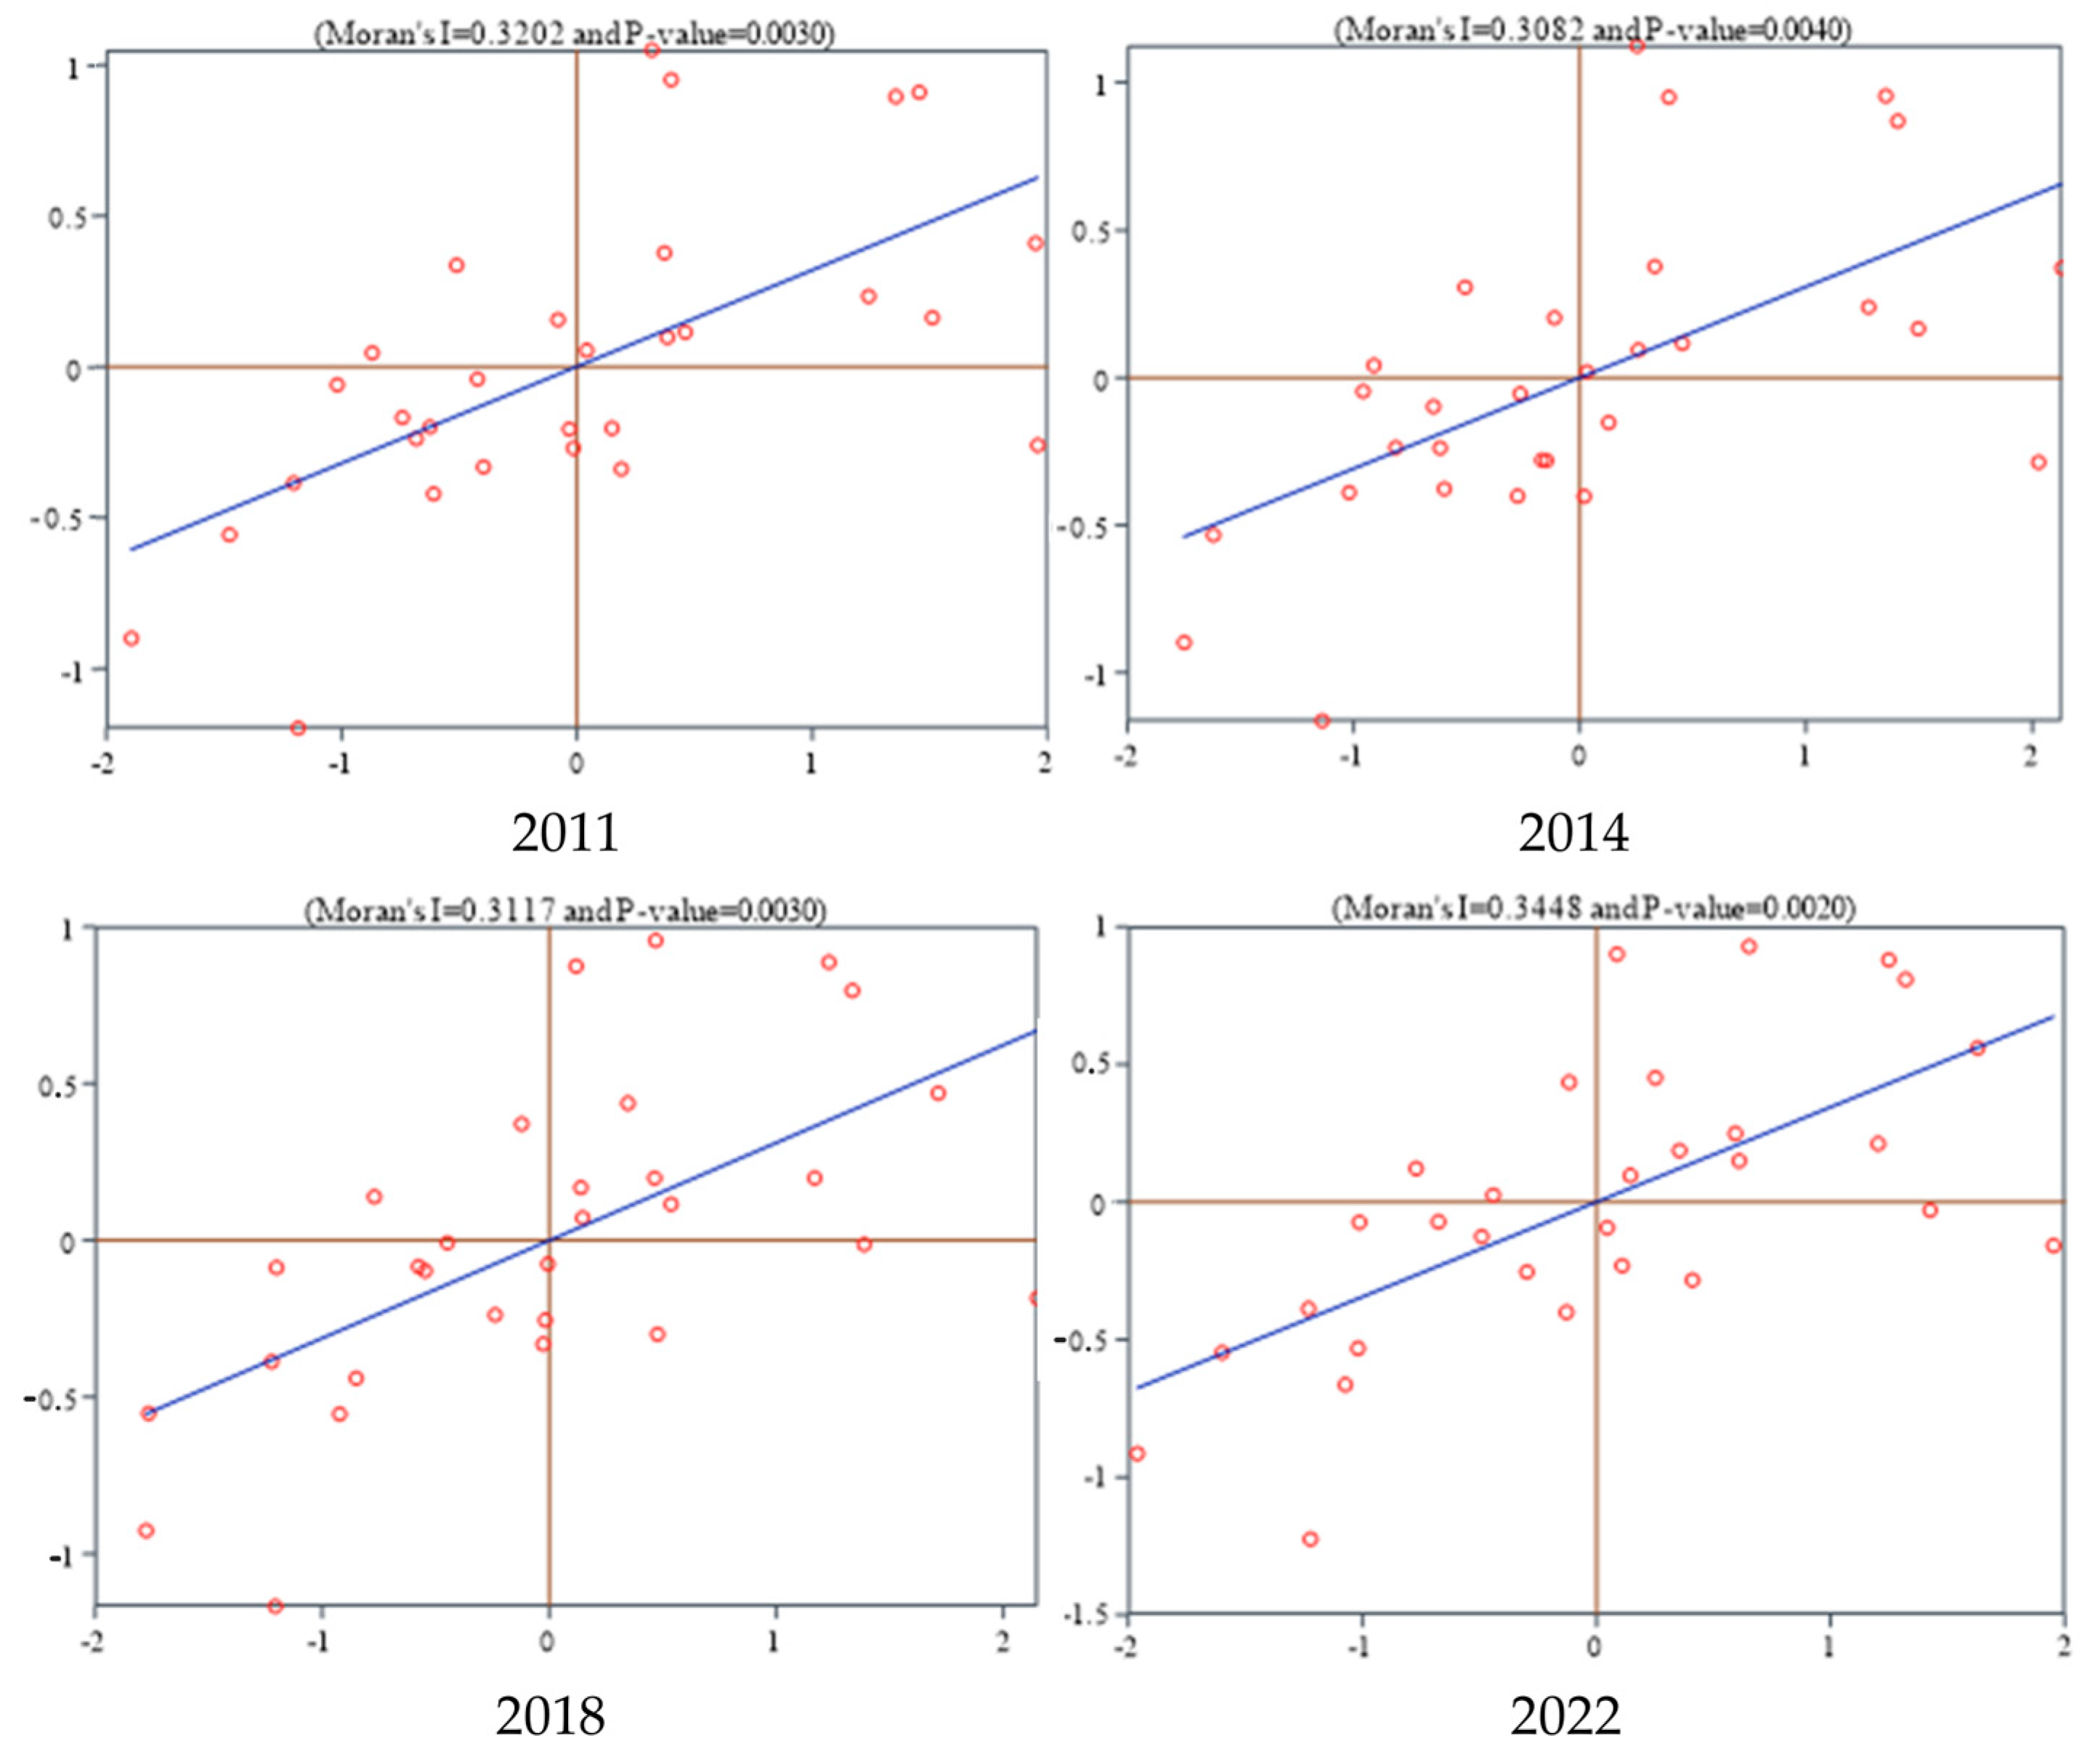
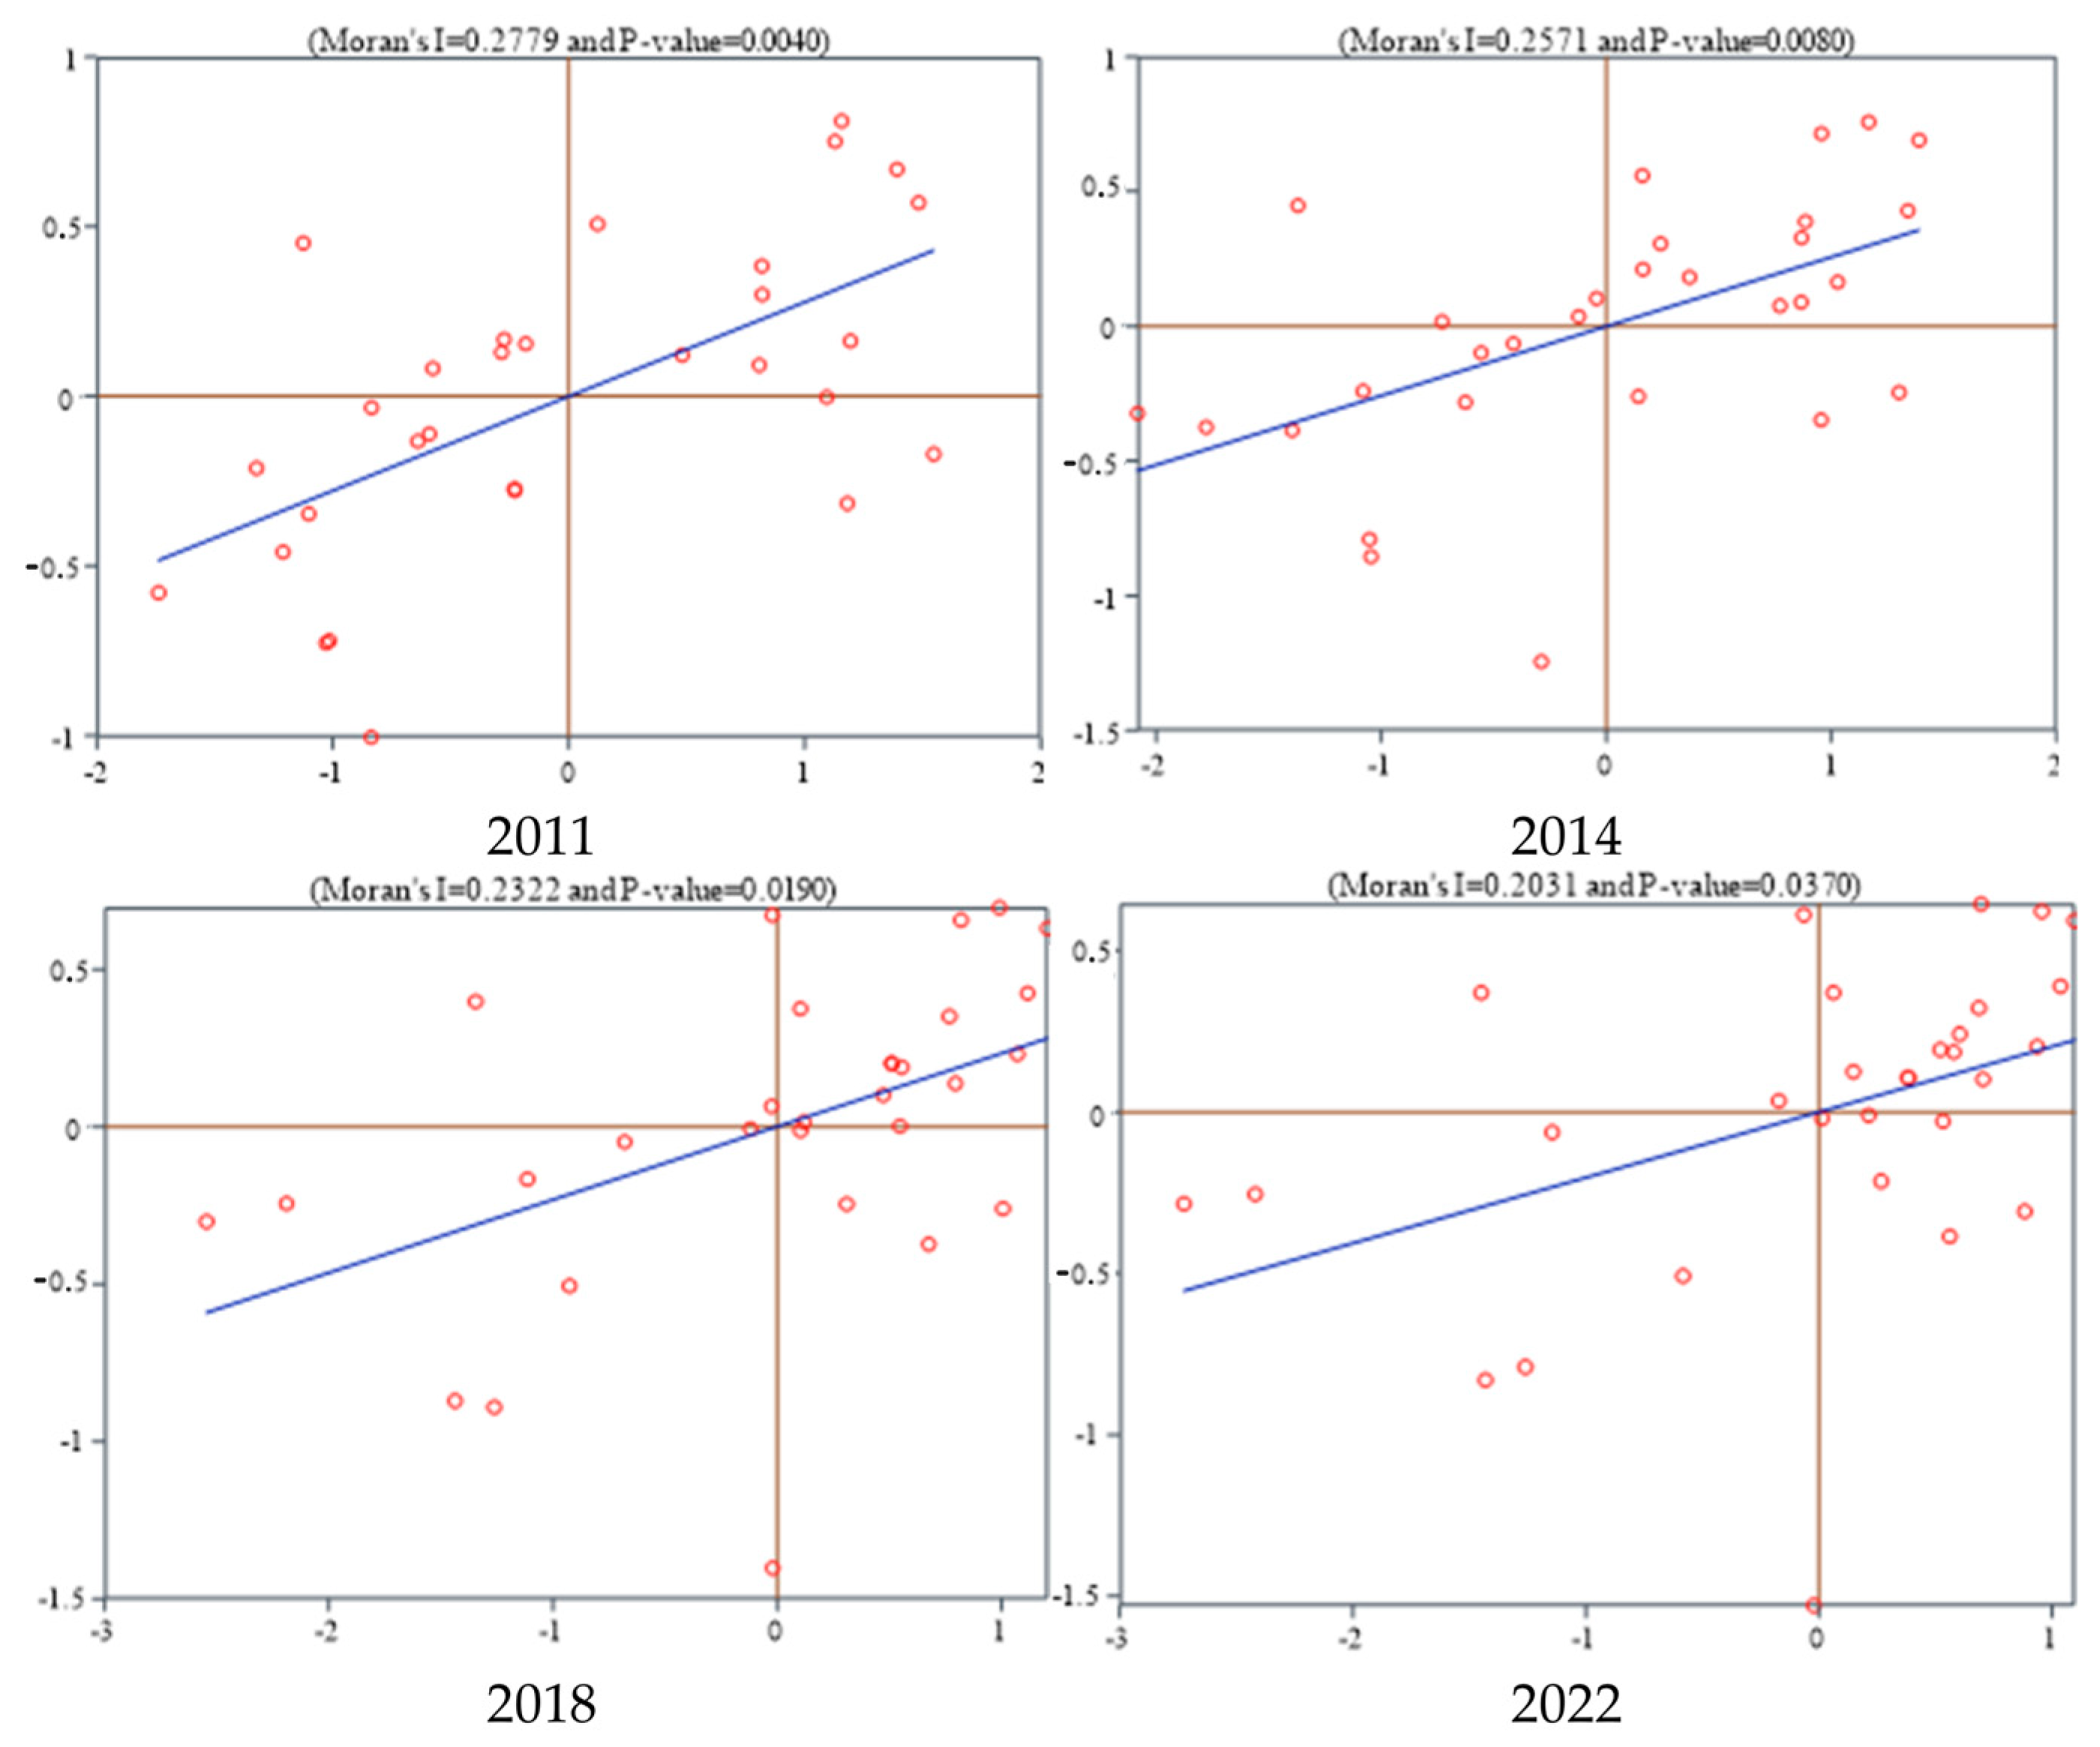
4.2.1. Spatial Correlation

We adopt Moran’s I to determine the spatial correlation between GTFEE and NQPF and adopt an economic–geographical nested matrix as a spatial weight matrix, which simultaneously considers economic factors and geographical distance. The formula is as follows:
S 2 = 1 n i = 1 n ( X i X ¯ ) 2 , M o r a n s I = i = 1 n j = 1 n ω i j x i x ¯ x j x ¯ S 2 i = 1 n j = 1 n ω i j
w i j = 1 | a v p g d p i a v p g d p j | , i j 0 , i = j
where X refers to the observed value of the variable for a given region. x ¯ is the mean of the variable across all regions. i and j represent cities, S2 represents sample variance, ωij represents the economic–geographical nested matrix, and avpgdp refers to the average per capita GDP of a city.
The Moran’s index plot for NQPF is shown in Figure 2. The Moran’s I value for all four years is significantly positive at 1% [27]. The majority of cities’ Moran’s I values fall within Quadrants 1 and 3, demonstrating a significant “high–high” and “low–low” clustering effect. This indicates that the spatial correlation of NQPF is positive [28].
The Moran’s index plot for GTFEE is shown in Figure 3. The Moran’s I value for all four years is significantly positive at 1%, suggesting that the GTFEE levels of different cities exhibit a positive spatial correlation [29]. Furthermore, the majority of cities’ Moran’s I values for GTFEE fall within Quadrants 1 and 3, suggesting that cities with high (or low) GTFEE levels tend to be surrounded by cities with similarly high (or low) GTFEE levels. Therefore, GTFEE demonstrates spatial correlation, necessitating the use of a spatial regression model for empirical analysis of its specific impact.

4.2.2. Spatial Spillover Effect

To further determine the optimal spatial econometric model, this study applies LM, LR, and Hausman tests [21]. The LM test assesses the existence and type of spatial relationships among variables. The LM-Spatial Error and Robust LM-Spatial Error tests are both significant at 1%, while the LM-Spatial Lag and Robust LM-Spatial Lag tests are significant at 5%. These results indicate the simultaneous presence of both spatial lag effects and spatial autocorrelation effects, suggesting that the SDM should be employed for spatial econometric analysis. Through the LR test, both LR-error and LR-lag are significant at 1%, leading to the rejection of the null hypothesis that the SDM can be reduced to a SEM or SLM. The Hausman test is significant at 10%, rejecting the null hypothesis that a random-effects model should be used, thereby confirming that a fixed-effects SDM is the appropriate choice [30].
Accordingly, we construct:
ln G T F E E i t = λ 0 + ρ W ln G T F E E i t + λ 1 ln N Q P F i t + φ 1 W ln N Q P F i t + λ 2 C V i t + φ 2 W C V i t + u i
where ρ is the spatial spillover coefficient, λ is the coefficient value, W is the economic–geographical nested matrix, and μ1 and μ2 are spatial interaction terms coefficients. The other variables are the same as in Model (1).
The SDM regression results are presented in Table 6. lnNQPF’s coefficient is significantly positive at 1% across all columns, suggesting that enhancing NQPF positively influences both local and neighboring regions’ GTFEE. This confirms that NQPF development enhances GTFEE through spatial spillover effects, supporting H2. The possible reasons are as follows: First, the development of NQPF is often accompanied by the research and application of advanced technologies, particularly clean energy and environmental protection technologies. These technologies may diffuse to neighboring regions through technology spillover effects, thereby improving energy utilization efficiency in surrounding areas. Second, regions that seek to promote NQPF typically implement a series of green economic policies. These policies may create demonstration effects, encouraging neighboring regions to adopt similar measures, thus improving their GTFEE. Additionally, the development of NQPF fosters synergies along the green economic industrial chain. Neighboring regions, through collaboration with core regions, may benefit from greener supply chain management and more efficient energy utilization practices, thereby enhancing overall energy efficiency.

4.3. Moderating Effect

To explore whether AI development levels influence the effect of NQPF on GTFEE [21,31], we construct a moderating effect model:
ln G T F E E i t = β 0 + β 1 ln N Q P F i t + β 2 ln A I i t + β 3 ln N Q P F i t × ln A I i t - c + β 4 ln C V i t + u i + v t + σ i t
where lnAI × lnNQPF-c represents the decentralized interaction term between AI levels and NQPF. β denotes the coefficient value. All other variables remain consistent with Model (1).
The regression results are shown in Table 7. The coefficients of lnNQPF and lnAI × lnNQPF-c are significantly positive at 5% and 10%, suggesting that enhancing AI levels strengthens the effect of NQPF on GTFEE. This validates the validity of H3. Specifically, after incorporating the moderating variable, lnNQPF’s coefficient is 0.267. Comparing this with the coefficient of 0.238 in column (2) of Table 5, the marginal moderating effect of AI on the main effect is 0.029. The possible reasons are as follows: First, AI’ s powerful data processing and analytical capabilities allow for precise monitoring of energy consumption patterns, enabling optimized energy allocation, reducing energy waste, and enhancing energy utilization efficiency. Second, in the R&D stage, AI accelerates green energy technological breakthroughs within NQPF. For example, AI-driven advancements in solar and wind energy conversion technologies enhance energy transformation efficiency, promoting the efficient utilization of clean energy. Additionally, AI facilitates intelligent monitoring and regulation, enabling energy-efficient upgrades to production processes, thereby reducing energy consumption per unit of output. Thus, leveraging its intelligent advantages, AI strengthens the impact of NQPF on GTFEE through multiple dimensions, including energy allocation, technological innovation, and production optimization, thereby providing strong support for sustainable development.

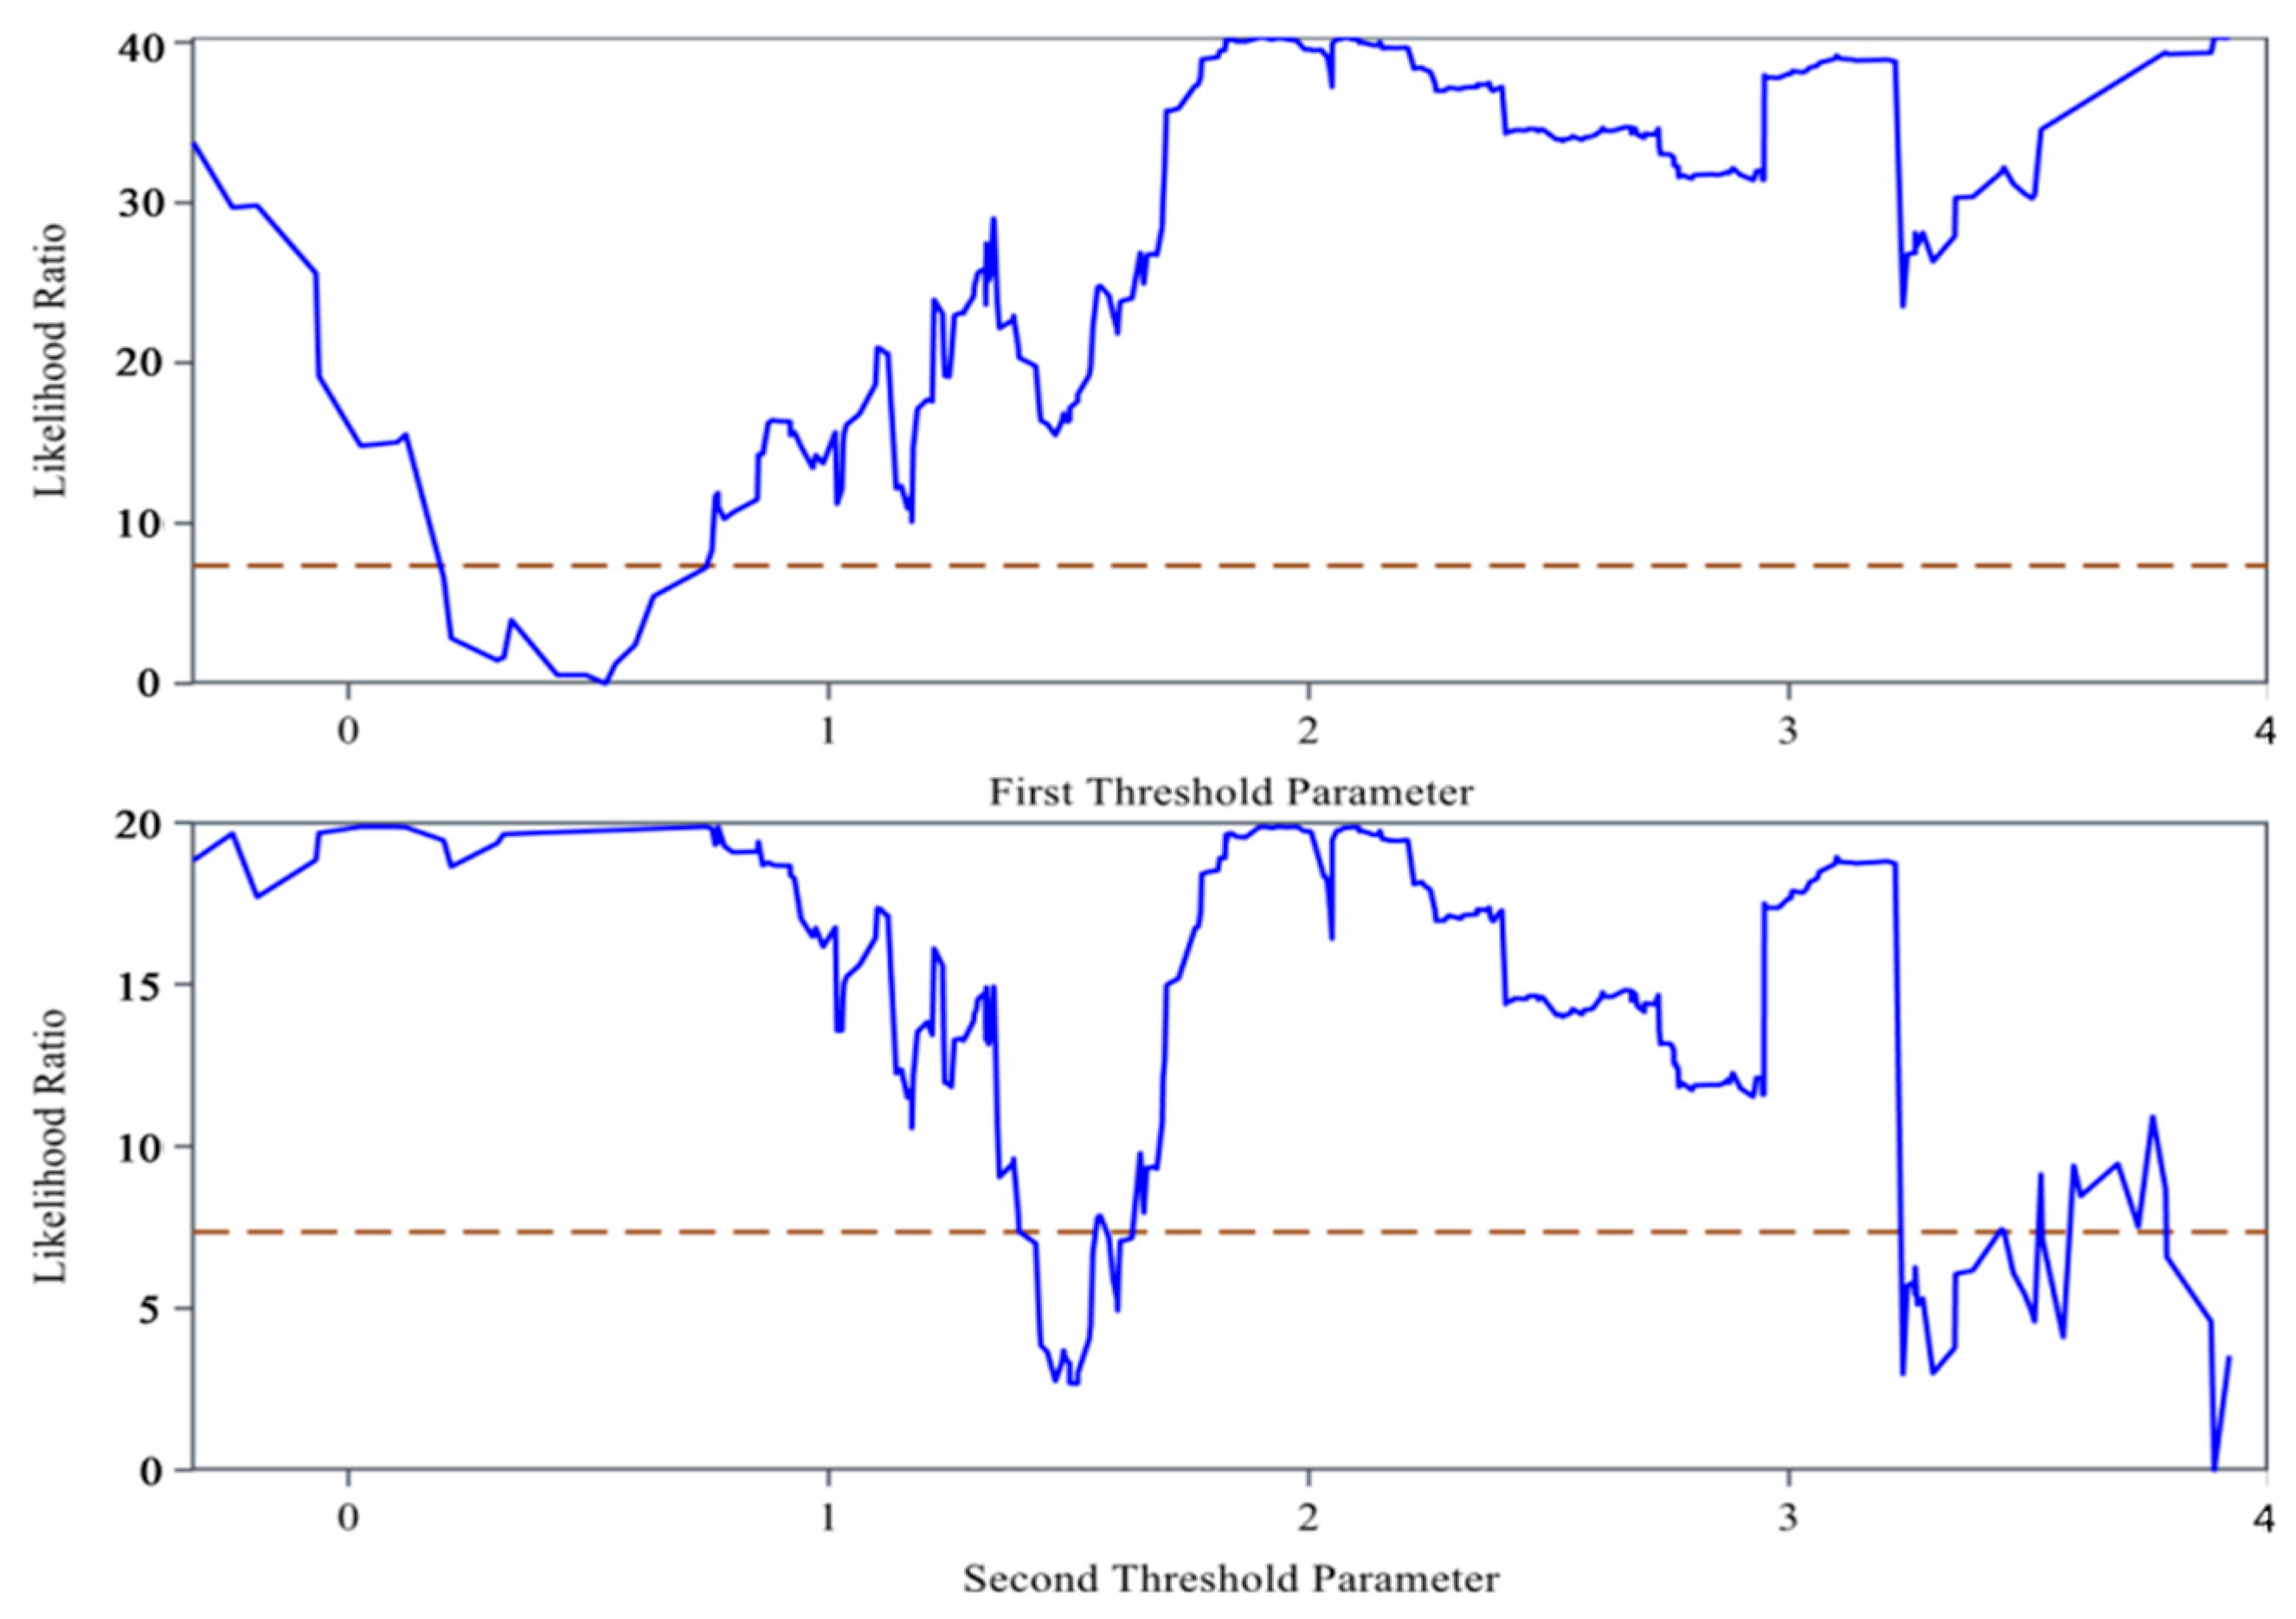
4.4. Threshold Effect

Changes in AI levels may lead to a structural shift in the impact of NQPF on GTFEE. Therefore, a threshold effect model is constructed to analyze how the impact intensity of NQPF on GTFEE varies across different AI threshold intervals [32].
ln G T F E E i t = θ 0 + θ 1 ln A I i t × I ( ln N Q P F i t γ ) + θ 2 ln N Q P F i t × I ( ln A I i t > γ ) + j = 3 T θ j C V i t j + u i + v t + σ i t
where γ is the threshold value, and θ1 and θ2 represent the impact coefficients of NQPF on GTFEE when lnAIitγ and lnAIit > γ, respectively. I is the indicator function.
This study applies the Bootstrap method for threshold testing (Table 8). Based on Hansen’s (2000) threshold theory, AI levels exhibit a significant double-threshold characteristic, both of which fall within the 99% confidence interval [33]. We used LR tests to verify the validity of the thresholds [34]. As shown in Figure 4, the estimated threshold values are consistent with the actual values, and the LR test is successfully passed. Thus, a double-threshold regression model is constructed.
The regression results are shown in Table 9. In column (1), when lnAI ≤ 0.5352, the positive impact of NQPF on GTFEE is suppressed or even becomes negative. At this stage, low AI levels hinder NQPF’s ability to enhance GTFEE effectively due to weak intelligent transformation capacity, limited technological application, and low digital integration. The development of NQPF at this stage may be accompanied by industrial expansion effects, leading to increased energy consumption and pollution, thereby reducing GTFEE. When 0.5352 < lnAI ≤ 3.8851, lnNQPF’s coefficient is significantly positive, with a value of 0.029, suggesting that the previous inhibitory effect transitions into a promoting effect. At this stage, AI technology starts penetrating the industrial chain, beginning to exert a positive influence on the impact of NQPF on GTFEE. However, the intelligent optimization and automation control brought by AI have not yet fully replaced traditional models, meaning that energy utilization efficiency is still constrained. As a result, the marginal effect on GTFEE remains limited, with a coefficient of only 0.029. When lnAI > 3.8851, lnNQPF’s coefficient is significantly positive, with a marginal effect of 1.209, indicating that a higher level of AI is typically associated with the development of high-end manufacturing and the new energy industry. This transformation reduces the proportion of traditional high-energy-consuming industries, thereby optimizing energy utilization efficiency. Consequently, the positive effect of NQPF on GTFEE becomes significantly stronger.
Comparing column (2) of Table 9 (Model 1 regression result) with column (1), it can be observed that although when lnAI ≤ 3.8851, the coefficients in column (1) are both smaller than 0.238 in column (2), once lnAI > 3.8851 (i.e., when AI development reaches a relatively mature stage), the comparison between column (1) and column (2) coefficients (1.209 > 0.238) indicates that AI significantly enhances the positive impact of NQPF on GTFEE. Thus, from a long-term development perspective, advancing AI has a sustained positive impact on strengthening the effect of NQPF on GTFEE.

4.5. Robustness Tests

We conduct robustness tests using truncation processing, replacement of the spatial weight matrix, and instrumental variable methods for endogeneity testing. The details are as follows:
  • Adjusting sample. Extreme values in the dataset may distort research results. Therefore, all variables undergo a 1% truncation process, where values below the 1st percentile and exceeding the 99th percentile are replaced with the 1st and 99th percentile values, respectively. As in column (1) of Table 10, lnNQPF’s coefficient is positive at 5%, indicating that the regression estimates remain unaffected by the truncation adjustment, confirming the research conclusion is robust.
  • Endogeneity test. To mitigate potential endogeneity issues, this study employs the first-order and second-order lagged terms of NQPF as instrumental variables and applies 2SLS method for estimation [35]. As in column (3) of Table 10, lnNQPF’s coefficient is positive at 1%, the same as the previous conclusions, further validating robustness.
  • Replacing the spatial weight matrix. We replace the economic–geographical nested matrix with a geographical distance matrix for regression analysis. As indicated in (3) to (5) of Table 10, lnNQPF’s coefficient remains significantly positive across all three columns, confirming the research conclusion is robust.

5. Discussion

This study examines the connection between NQPF and GTFEE. Using both static and dynamic models, it explores their connection in depth. The findings show that improving NQPF significantly enhances GTFEE. This conclusion aligns with the findings of Zhao et al. (2024) [36], Wang et al. (2024) [37] and Wu et al. (2024) [38] and also indirectly supports the research of Shah et al. (2022) [39], Cui and Cao (2024) [40], and Zhang et al. (2024) [41]. The results have important practical implications. For energy-intensive industries, increasing investment in NQPF development can facilitate energy conservation and emission reduction objectives [42]. Simultaneously, it bolsters market competitiveness while advancing the industry’s transition toward a greener and more efficient model. For policymakers, these insights provide a robust foundation for policy formulation that fosters NQPF development. Policy guidance can accelerate the integration of NQPF across industries, ultimately leading to an overall improvement in GTFEE at the societal level [43].
Building on the existing literature research and drawing upon the studies of Gu et al. (2023) [21] and Cui and Cao (2024) [40], we extend the research framework from a two-dimensional linear perspective to a three-dimensional spatial analysis. First, the Moran index indicates that both the development of NQPF and GTFEE exhibit positive spatial correlation. They primarily manifest in H-H and L-L clustering patterns, which can enhance the levels of NQPF and GTFEE in both local and neighboring areas [42,44]. This finding is consistent with Gao et al. (2024) [21]. Moreover, SDM regression results show that the development of NQPF can improve GTFEE in adjacent areas through spatial spillover effects, aligning with Wu et al. (2024) [38] and Zhao et al. (2022) [45]. Yin and Shen (2025) [46] and Wang and Chen (2025) [47] provide valuable references for the government in optimizing regional coordinated development strategies and formulating differentiated policies. By revealing the spatial spillover effects of NQPF, this study highlights the importance of regional interconnectivity. This implies that policymakers should focus on promoting resource and technology sharing and cooperation across regions, thereby facilitating the wider diffusion of NQPF and ultimately enhancing GTFEE on a broader scale.
Referencing the research of Zhang and Zhang (2024) [48], we explore the role of AI in amplifying the impact of NQPF on GTFEE. Through moderation and threshold effect tests, the findings reveal that AI levels can strengthen the positive impact of NQPF on GTFEE, confirming the conclusions of Luo et al. (2024) [49] and Wang et al. (2024) [50]. Further analysis shows that AI exhibits a double-threshold effect. As AI levels increase, the impact of NQPF on GTFEE shifts from suppression to promotion, with the effect intensity gradually strengthening over time. AI empowers production processes with intelligence, making technological innovation and resource integration in NQPF development more efficient [38,48,51,52]. This, in turn, facilitates the adoption of clean energy, helping firms and industries optimize their production strategies in response to environmental and market dynamics, thereby improving regional GTFEE.

6. Conclusions and Recommendations

6.1. Research Conclusions

This study explores the multidimensional effect of NQPF on GTFEE and the threshold effect of AI. The findings are as follows:
Static and dynamic fixed-effect models regression analysis indicates that lnNQPF’s coefficients are all significantly positive at 5% levels, with marginal effects of 0.238 and 0.587, respectively. This confirms that the development of NQPF can enhance GTFEE.
According to the SDM regression findings, lnNQPF’s coefficients are significantly positive at the 1% level, demonstrating that NQPF development exhibits a significant spatial spillover effect, which improves both local and neighboring regions’ GTFEE.
The moderation effect regression results show that higher AI levels strengthen the positive impact of NQPF on GTFEE, with a marginal moderating effect of 0.029.
Threshold effect analysis identifies two AI thresholds: 0.5352 and 3.8851. When lnAI ≤ 0.5352, AI exerts a suppressive effect on the main effect. However, as AI levels increase, once lnAI > 0.5352, AI’s moderating role shifts from suppression to promotion, and the impact intensity gradually increases. From a long-term perspective, when AI development reaches a high level (lnAI > 3.8851), it significantly enhances the impact of NQPF on GTFEE.

6.2. Policy Recommendations

In response to the research findings, we present the following recommendations:
(1)
The government should vigorously develop NQPF to assist in improving GTFEE. First, the government should strengthen policy support and guidance, formulate and implement strict industrial upgrading policies, eliminate high-energy-consuming and high-pollution traditional industries, and promote the concentration of resources in green and low-carbon NQPF industries. Additionally, policy measures such as financial incentives and tax reductions should be introduced to support enterprises in the R&D and application of green technologies and intelligent manufacturing. Second, the government should strengthen regional cooperation, implement regional coordination strategies, promote inter-provincial collaboration, develop green economic zones, and encourage resource sharing and green technology diffusion. Furthermore, the government should increase investment in related scientific research by providing government grants or interest-subsidized loans, encouraging enterprises to actively engage in R&D in NQPF-related fields. More funding should be allocated to the development of green energy technologies, new materials, and intelligent manufacturing technologies.
(2)
The government should fully utilize the spillover effects of NQPF to promote interregional sharing and mobility of green technologies and resource policies, thereby enhancing overall GTFEE. By establishing a regional collaborative innovation mechanism, the government can facilitate the flow of technology, resources, and policies across different regions. It should support interregional green technology cooperation projects, create shared platforms, and encourage developed regions to transfer successful NQPF experiences and technologies to less developed areas in central and western China, achieving coordinated regional growth. Additionally, the government should encourage enterprises to invest across regions, providing financial and policy support for green technology enterprises to expand into neighboring areas by setting up branches or engaging in cooperative projects. Furthermore, tax incentives should be granted to enterprises and projects that enhance GTFEE through technology spillovers, encouraging them to share technological achievements.
(3)
From a long-term developmental perspective, fully developed AI technology exerts a notable promotive impact on NQPF’s effect on GTFEE. Therefore, the government should promote AI development in phases. At the early AI stage, policies should prioritize the establishment of fundamental AI infrastructure, encourage enterprises to adopt AI technology, and mitigate the rise in energy consumption attributed to NQPF expansion. In the mid-AI development stage, the focus should be on supporting AI applications in industrial manufacturing and energy optimization, improving the level of intelligent manufacturing, so that AI’ s impact on the main effect shifts from negative to positive, truly transforming into a tool for improving energy efficiency. In the mature stage of AI technology, policies should promote AI empowerment for green and low-carbon transformation, build an AI + green energy system, and make AI a core driving force for long-term energy efficiency improvements, thereby maximizing its impact on the main effect. Since different provinces have varied economic development and technological innovation capabilities, the government should formulate targeted AI technology promotion strategies based on each province’s characteristics. In the economically developed eastern coastal provinces, where there is already a relatively mature foundation for AI technology R&D and application, these regions can take the lead in advancing the deep application of AI technology in energy management, particularly in industrial production, transportation, and building management, to achieve efficient energy utilization through intelligent technology. To ensure the widespread application of AI technology in enhancing NQPF and GTFEE, in the AI-lagging central and western regions, the government can attract AI enterprises and research institutions to these areas through financial subsidies and talent introduction policies.

6.3. Research Prospects

Although this study conducts a detailed analysis of the impact of NQPF on GTFEE and reveals a series of important associations and patterns, there remains significant potential for further expansion and deepening due to the complexity and broad scope of this study field. In terms of process mechanisms, future studies can further explore the specific pathways or mechanisms through which NQPF influences GTFEE, for example, key elements of NQPF, such as the application of innovative technologies and transformation of production methods, and how they gradually penetrate and ultimately impact GTFEE at the micro-level of enterprise production processes, the meso-level of industrial structure adjustments, and the macro-level of regional economic development. From a policy impact perspective, future research can further examine the moderating effects of various policy tools, such as financial subsidies, tax incentives, and industrial planning, on the relationship between NQPF and GTFEE. Additionally, further analysis can explore how different policies perform at different development stages and in different economic environments.

Author Contributions

Conceptualization, B.Y., R.G. and Y.H.; methodology, B.Y. and R.G.; software, Y.H.; formal analysis, P.W. and Y.H.; writing—original draft preparation, B.Y. and R.G.; writing—review and editing, P.W. and Y.H. All authors have read and agreed to the published version of the manuscript.

Funding

This research is supported by the Hebei Academy of Sciences Basic Scientific Research Fees System Pilot Project (Grant number: 2025PF06) and the Social Science Fund of Hebei Province (Grant number: HB24YJ004).

Institutional Review Board Statement

Not applicable.

Informed Consent Statement

Not applicable.

Data Availability Statement

The original contributions presented in this study are included in the article. Further inquiries can be directed to the corresponding author.

Acknowledgments

The authors are particularly grateful to the editors and reviewers for their most insightful and valuable comments on this paper, which played an important role in improving the quality of the research.

Conflicts of Interest

The authors declare no conflicts of interest.

References

  1. Chen, M.; Sinha, A.; Hu, K.; Shah, M.I. Impact of technological innovation on energy efficiency in in-dustry 4.0 era: Moderation of shadow economy in sustainable development. Technol. Forecast. Soc. Change 2021, 164, 120521. [Google Scholar] [CrossRef]
  2. Wu, H.; Hao, Y.; Ren, S.; Yang, X.; Xie, G. Does internet development improve green total factor energy efficiency? Evidence from China. Energy Policy 2021, 153, 112247. [Google Scholar] [CrossRef]
  3. Haider, S.; Mishra, P.P. Does innovative capability enhance the energy efficiency of Indian Iron and Steel firms? A Bayesian stochastic frontier analysis. Energy Econ. 2021, 95, 105128. [Google Scholar] [CrossRef]
  4. Lv, Y.; Chen, W.; Cheng, J. Effects of urbanization on energy efficiency in China: New evidence from short run and long run efficiency models. Energy Policy 2020, 147, 111858. [Google Scholar] [CrossRef]
  5. Shao, J.; Wang, L. Can new-type urbanization improve the green total factor energy efficiency? Evidence from China. Energy 2023, 262, 125499. [Google Scholar] [CrossRef]
  6. Qu, C.; Shao, J.; Shi, Z. Does financial agglomeration promote the increase of energy efficiency in China? Energy Policy 2020, 146, 111810. [Google Scholar] [CrossRef]
  7. Gao, D.; Li, G.; Yu, J. Does digitization improve green total factor energy efficiency? Evidence from Chinese 213 cities. Energy 2022, 247, 123395. [Google Scholar] [CrossRef]
  8. Xu, G.; Wang, Y.; Wang, L.; Zhou, Y. How do competition and collaboration promote green technology diffusion? Evidence from the global hydropower industry. J. Clean. Prod. 2024, 478, 143890. [Google Scholar] [CrossRef]
  9. Yang, Y.; Chen, W.; Gu, R. How does digital infrastructure affect industrial eco-efficiency? Considering the threshold effect of regional collaborative innovation. J. Clean. Prod. 2023, 427, 139248. [Google Scholar] [CrossRef]
  10. Ibekwe, K.I.; Umoh, A.A.; Nwokediegwu, Z.Q.; Etukudoh, E.A.; Ilojianya, V.I.; Adefemi, A. Energy efficiency in industrial sectors: A review of technologies and policy measures. Eng. Sci. Technol. J. 2024, 5, 169–184. [Google Scholar] [CrossRef]
  11. Chen, W.; Alharthi, M.; Zhang, J.; Khan, I. The need for energy efficiency and economic prosperity in a sus-tainable environment. Gondwana Res. 2024, 127, 22–35. [Google Scholar] [CrossRef]
  12. Yang, T.; Yi, X.; Lu, S.; Johansson, K.H.; Chai, T. Intelligent manufacturing for the process industry driven by industrial artificial intelligence. Engineering 2021, 7, 1224–1230. [Google Scholar] [CrossRef]
  13. Ding, J.; Liu, B.; Shao, X. Spatial effects of industrial synergistic agglomeration and regional green de-velopment efficiency: Evidence from China. Energy Econ. 2022, 112, 106156. [Google Scholar] [CrossRef]
  14. Li, Y.; Li, N.; Li, Z. Evolution of carbon emissions in China’s digital economy: An empirical analysis from an entire industry chain perspective. J. Clean. Prod. 2023, 414, 137419. [Google Scholar] [CrossRef]
  15. Chang, Q.; Wu, M.; Zhang, L. Endogenous growth and human capital accumulation in a data economy. Struct. Change Econ. Dyn. 2024, 69, 298–312. [Google Scholar] [CrossRef]
  16. Lee, C.C.; Zhao, Y.N. Heterogeneity analysis of factors influencing CO2 emissions: The role of human capital, urbanization, and FDI. Renew. Sustain. Energy Rev. 2023, 185, 113644. [Google Scholar] [CrossRef]
  17. Dai, J.; Ahmed, Z.; Alvarado, R.; Ahmad, M. Assessing the nexus between human capital, green energy, and load capacity factor: Policymaking for achieving sustainable development goals. Gondwana Res. 2024, 129, 452–464. [Google Scholar] [CrossRef]
  18. Yang, S.; Liu, F. Impact of industrial intelligence on green total factor productivity: The indispensability of the environmental system. Ecol. Econ. 2024, 216, 108021. [Google Scholar] [CrossRef]
  19. Fang, G.; Chen, G.; Yang, K.; Yin, W.; Tian, L. How does green fiscal expenditure promote green total factor energy efficiency?—Evidence from Chinese 254 cities. Appl. Energy 2024, 353, 122098. [Google Scholar] [CrossRef]
  20. Lin, B.; Wang, C. Does industrial relocation affect green total factor energy efficiency? Evidence from China’s high energy-consuming industries. Energy 2024, 289, 130002. [Google Scholar] [CrossRef]
  21. Gu, R.; Li, C.; Yang, Y.; Zhang, J. The impact of industrial digital transformation on green development efficiency considering the threshold effect of regional collaborative innovation: Evidence from the Bei-jing-Tianjin-Hebei urban agglomeration in China. J. Clean. Prod. 2023, 420, 138345. [Google Scholar] [CrossRef]
  22. Hao, X.; Li, Y.; Ren, S.; Wu, H.; Hao, Y. The role of digitalization on green economic growth: Does in-dustrial structure optimization and green inno-vation matter? J. Environ. Manag. 2023, 325, 116504. [Google Scholar] [CrossRef]
  23. Li, X.; Ma, D. Financial agglomeration, technological innovation, and green total factor energy efficiency. Alex. Eng. J. 2021, 60, 4085–4095. [Google Scholar] [CrossRef]
  24. Wei, W.; Wang, X.; Zhu, H.; Li, J.; Zhou, S.; Zou, Z.; Li, J.S. Carbon emissions of urban power grid in Jing-Jin-Ji region: Characteristics and influential factors. J. Clean. Prod. 2017, 168, 428–440. [Google Scholar] [CrossRef]
  25. Hong, Y.; Wang, K. Research on the resilience and security of industrial chain supply chain under the perspective of new quality productivity. Econ. Res. 2024, 59, 4–14. [Google Scholar]
  26. Hu, X. The disruptive technological foundation of new quality productivity: The AI technological impact and China’s response. Shanghai Econ. Res. 2024, 10, 17–27. [Google Scholar]
  27. Zhao, J.; Jiang, Q.; Dong, X.; Dong, K.; Jiang, H. How does industrial structure adjustment reduce CO2 emissions? Spatial and mediation effects analysis for China. Energy Econ. 2022, 105, 105704. [Google Scholar] [CrossRef]
  28. Wang, Z.; Xia, C.; Xia, Y. Dynamic relationship between environmental regulation and energy con-sumption structure in China under spatiotemporal heterogeneity. Sci. Total Environ. 2020, 738, 140364. [Google Scholar] [CrossRef]
  29. Zhao, M.; Sun, T. Dynamic spatial spillover effect of new energy vehicle industry policies on carbon emission of transportation sector in China. Energy Policy 2022, 165, 112991. [Google Scholar] [CrossRef]
  30. Xue, R.; Gu, R.; Ong, T. How does coupling coordination between industrial structure optimization and ecosystem services dynamically affect carbon emissions in the Yellow River Basin? J. Clean. Prod. 2025, 517, 145872. [Google Scholar] [CrossRef]
  31. Tao, Z.; Huang, X.Y.; Dang, Y.J.; Qiao, S. The impact of factor market distortions on profit sustainable growth of Chinese renewable energy enterprises: The moderating effect of environmental regulation. Renew. Energy 2022, 200, 1068–1080. [Google Scholar] [CrossRef]
  32. Wang, S.; Li, C.; Zhou, H. Impact of China’s economic growth and energy consumption structure on atmospheric pollutants: Based on a panel threshold model. J. Clean. Prod. 2019, 236, 117694. [Google Scholar] [CrossRef]
  33. Hansen, B.E. Sample splitting and threshold estimation. Econometrical 2000, 68, 575–603. [Google Scholar] [CrossRef]
  34. Zhang, W.; Liu, X.; Wang, D.; Zhou, J. Digital economy and carbon emission performance: Evidence at China’s city level. Energy Policy 2022, 165, 112927. [Google Scholar] [CrossRef]
  35. Song, Z. Economic growth and carbon emissions: Estimation of a panel threshold model for the transi-tion process in China. J. Clean. Prod. 2021, 278, 123773. [Google Scholar] [CrossRef]
  36. Zhao, C.; Zhu, Z.; Wang, Y.; Du, J. The impact of industrial robots on green total factor energy efficiency: Empirical evidence from Chinese cities. Energies 2024, 17, 5034. [Google Scholar] [CrossRef]
  37. Wang, Q.; Chen, X. Can new quality productive forces promote inclusive green growth: Evidence from China. Front. Environ. Sci. 2024, 12, 1499756. [Google Scholar] [CrossRef]
  38. Wu, H.; Wen, H.; Li, G.; Yin, Y.; Zhang, S. Unlocking a greener future: The role of digital finance in enhancing green total factor energy efficiency. J. Environ. Manag. 2024, 364, 121456. [Google Scholar] [CrossRef]
  39. Shah, W.U.H.; Hao, G.; Yan, H.; Yasmeen, R.; Padda, I.U.H.; Ullah, A. The impact of trade, financial development and government integrity on energy efficiency: An analysis from G7-Countries. Energy 2022, 255, 124507. [Google Scholar] [CrossRef]
  40. Cui, H.; Cao, Y. Do smart cities improve energy efficiency? A test of spatial effects and mechanisms. Sustain. Cities Soc. 2024, 101, 105124. [Google Scholar] [CrossRef]
  41. Zhang, L. Understanding the new quality productive forces in the energy sector. Energy Nexus 2024, 16, 100352. [Google Scholar] [CrossRef]
  42. Xiang, J.; Tan, L.; Gao, D. Unlocking green patterns: The local and spatial impacts of green finance on urban green total factor productivity. Sustainability 2024, 16, 8005. [Google Scholar] [CrossRef]
  43. Chen, X.; Wu, Y. A study on the mechanisms of new quality productive forces enabling the upgrading of the modern tourism system: Evidence from China. Sustainability 2025, 17, 2232. [Google Scholar] [CrossRef]
  44. Xu, S.; Wang, J.; Peng, Z. Study on the promotional effect and mechanism of new quality productive forces on green development. Sustainability 2024, 16, 8818. [Google Scholar] [CrossRef]
  45. Zhao, S.; Peng, D.; Wen, H.; Wu, Y. Nonlinear and spatial spillover effects of the digital economy on green total factor energy efficiency: Evidence from 281 cities in China. Environ. Sci. Pollut. Res. Int. 2022, 30, 81896–81916. [Google Scholar] [CrossRef]
  46. Yin, K.; Shen, X. Spatial effects of new quality productivity on the low-carbon transformation of energy consumption structure—Evidence from provincial data in China. Sustainability 2025, 17, 2091. [Google Scholar] [CrossRef]
  47. Wang, S.; Chen, F. Can new quality productivity promote the carbon emission performance—Empirical evidence from China. Sustainability 2025, 17, 567. [Google Scholar] [CrossRef]
  48. Zeng, M.; Zhang, W. Green finance: The catalyst for artificial intelligence and energy efficiency in Chinese urban sustainable development. Energy Econ. 2024, 139, 107883. [Google Scholar] [CrossRef]
  49. Luo, S.; Lei, W.; Hou, P. Impact of artificial intelligence technology innovation on total factor productivity: An empirical study based on provincial panel data in China. Natl. Account. Rev. 2024, 6, 172–194. [Google Scholar] [CrossRef]
  50. Wang, Y.; Shi, M.; Liu, J.; Zhong, M.; Ran, R. The impact of digital-real integration on energy productivity under a multi-governance framework: The mediating role of AI and embodied technological progress. Energy Econ. 2024, 142, 108167. [Google Scholar] [CrossRef]
  51. Chishti, M.; Xia, X.; Dogan, E. Understanding the effects of artificial intelligence on energy transition: The moderating role of Paris Agreement. Energy Econ. 2024, 131, 107388. [Google Scholar] [CrossRef]
  52. He, Q.; Xue, Y. Research on the influence of digital finance on the economic efficiency of energy industry in the background of artificial intelligence. Sci. Rep. 2023, 13, 14984. [Google Scholar] [CrossRef] [PubMed]
Figure 1. Research structure.
Sustainability 17 07012 g001
Figure 2. NQPF’s Moran scatter plot.
Sustainability 17 07012 g002
Figure 3. GTFEE’s Moran scatter plot.
Sustainability 17 07012 g003
Figure 4. LR test results.
Sustainability 17 07012 g004
Table 1. NQPF indicator system.
Primary
Level
Secondary
Level
Tertiary LevelExplanationUnitAttribute
Technological ProductivityInnovation ProductivityInnovation ResearchNumber of domestic patent authorizationsCount+
Innovation IndustryRevenue from high-tech industry businessesCNY 10,000+
Innovation ProductsInnovation experience of large-scale industrial enterprisesCNY 10,000+
Technical ProductivityTechnical EfficiencyLabor productivity of large-scale industrial enterprises%+
Technical R&DFull-time R&D personnel in large-scale industrial enterprisesh+
Technical ProductionDensity of initial installation of industrial robots%+
Green ProductivityResource-Efficient ProductivityEnergy IntensityEnergy consumption per unit of domestic production value%
Energy StructureConsumption of chemical energy per unit of domestic production value%
Water IntensityIndustrial water consumption per unit of domestic production value%
Environmentally Friendly ProductivityWaste RecyclingRatio of industrial solid waste recycling to total production volume%+
Wastewater DischargeIndustrial wastewater discharge per unit of domestic production value%
Air EmissionsIndustrial SO2 emissions per unit of domestic production value%
Digital ProductivityDigital Industrial ProductivityElectronic Information ManufacturingIntegrated circuit output10,000+
Telecommunication ServicesTotal telecom business volumeCNY 10,000+
Network CoverageNumber of broadband internet access terminalsCount+
Industrial Digital ProductivitySoftware ServicesNumber of software business employeesPeople+
Digital InformationOptical cable length per unit aream+
E-commerceE-commerce sales amountCNY 10,000+
Table 2. GTFEE indicator system.
IndicatorVariableVariable Description
Input IndicatorsCapital InvestmentFixed capital stock
R&D internal expenditure (CNY 10,000)
Labor InvestmentNumber of employed persons
Energy InvestmentTotal energy consumption (10,000 tons of standard coal)
Expected OutputRegional Gross ProductionRegional gross production value (CNY billion)
Undesirable OutputIndustrial WastewaterTotal wastewater discharge (10,000 tons)
Industrial Sulfur DioxideSO2 emissions in exhaust gas (10,000 tons)
Industrial Solid WasteTotal generation of general industrial solid waste (10,000 tons)
Environmental PollutionComprehensive environmental pollution index (Entropy Method)
Table 3. AI indicator system.
Primary
Indicator
Secondary IndicatorMeasurement Method
Intelligent InvestmentInternet Infrastructure InvestmentOptical cable length per unit area
Intelligent Economic InvestmentR&D expenditure in high-tech manufacturing
Intelligent Talent InvestmentR&D personnel in high-tech manufacturing
Intelligent Equipment InvestmentFixed asset investment in telecommunications, software, and information technology services
Intelligent ApplicationsSoftware Development and ApplicationRevenue from software products per capita in industrial enterprises
Intelligent Product DevelopmentRevenue from embedded systems per capita in industrial enterprises
Development of Intelligent EnterprisesRevenue from high-tech enterprise owners per capita in industrial enterprises
Adoption of Intelligent TechnologiesRevenue from new products in high-tech industries per capita in industrial enterprises
R&D OutputInnovation CapabilityNumber of patent applications/R&D personnel
AI Market Value-AddedTotal profits of high-tech manufacturing
AI Market ProfitAI market value-added/Total employment in high-tech manufacturing
AI Market ScaleGDP per unit of energy consumption (coal, electricity)
Social BenefitsNumber of patent applications/R&D personnel
Table 4. Descriptive statistics.
CategoryVariableExplanationMeanSDMinMax
Dependent VariableGTFEEGreen Total Factor Energy Efficiency0.8550.2740.1011.295
Independent VariableNQPFNew Quality Productive Forces0.1220.1200.0140.767
Moderating VariableAIArtificial Intelligence Level11.20810.4930.33761.846
Control VariablesEDLEconomic Development Level61,536.0930,331.6616413190,313
LFLLabor Force Level7.5910.7875.5458.864
RDIR&D Intensity0.0180.0120.0040.068
FBEGeneral Fiscal Budget Expenditure5457.9133125.171705.91018,533.080
ISIndustrial Structure1.2720.7190.5545.297
Table 5. Fixed-effects model regression results.
(1) lnGTFEE(2) lnGTFEE(3) lnGTFEE
lnNQPF0.196 ***
(4.90)
0.238 **
(2.51)
0.587 **
(2.12)
L.lnGTFEE 0.266 ***
(2.97)
lnEDL −0.163
(−1.15)
0.155
(1.57)
lnFBE 0.229
(1.7)
0.138
(1.47)
lnLFL −4.893 ***
(−3.34)
−0.640 **
(−2.17)
lnRDI −0.170
(−1.56)
0.557 **
(2.10)
lnIS −0.108 *
(−1.85)
−0.052
(−1.44)
Constant1.336 ***
(13.60)
10.483 ***
(3.36)
5.621 **
(2.50)
YearYesYesYes
CityYesYesYes
R20.48870.3450.503
Note: The values in ( ) represent t-values adjusted using clustered robust standard errors. ***, **, and * indicate significance at the 1%, 5%, and 10% levels, respectively.
Table 6. SDM regression results.
(1) lnGTFEE(2) Spatial lag lnGTFEE(3) Direct lnGTFEE(4) Indirect lnGTFEE(5) Total
lnGTFEE
lnNQPF0.362 ***
(4.75)
1.106 ***
(4.16)
0.333 ***
(4.33)
0.912 ***
(3.89)
1.246 ***
(5.22)
lnEDL−0.051
(−0.64)
−0.140
(−0.69)
−0.056
(−0.78)
−0.144
(-0.81)
−0.200
(−1.23)
lnFBE0.025
(0.23)
0.185
(0.78)
0.031
(0.28)
0.153
(0.79)
0.185
(1.00)
lnLFL−6.334 ***
(−6.51)
−3.388
(−1.34)
−6.211 ***
(−5.78)
−1.844
(−0.82)
−8.056 ***
(−3.32)
lnRDI−0.033
(−0.49)
0.180
(0.99)
−0.052
(−0.68)
0.170
(0.97)
0.118
(0.60)
lnIS−0.069
(−0.97)
0.284
(1.23)
−0.076
(−1.20)
0.245
(1.12)
0.169
(0.70)
CityYes
R20.2961
Note: The values in ( ) represent t-values adjusted using clustered robust standard errors. *** indicates significance at the 1%.
Table 7. Moderating effect model regression results.
VariableslnGTFEEVariableslnGTFEE
lnNQPF0.267 **
(2.66)
lnRDI−0.169
(−1.68)
lnAI−0.011 *
(−1.75)
lnIS−0.096
(−1.57)
lnAI × lnNQPF-c0.035 *
(1.71)
Constant9.934 ***
(3.48)
lnEDL−0.105
(−0.74)
YearYes
lnFBE0.279 *
(1.97)
CityYes
lnLFL−5.058 ***
(−3.17)
R20.3647
Note: The values in ( ) represent t-values adjusted using clustered robust standard errors. ***, **, and * indicate significance at the 1%, 5%, and 10% levels, respectively.
Table 8. Threshold test results.
ModelsThreshold ValueF Testp-Value10%5%1%
Single threshold0.535238.360.0013.27314.43518.315
Double threshold3.885119.290.0011.58412.77815.347
Table 9. Threshold model regression results.
Variables(1)
lnGTFEE
(2)
lnGTFEE
lnNQPF (lnAI ≤ 0.5352)−0.213 ***
(−4.89)
0.238 **
(2.51)
lnNQPF (0.5352 < lnAI ≤ 3.8851)0.029 *
(1.81)
lnNQPF (lnAI > 3.8851)1.209 ***
(3.87)
lnEDL0.554 ***
(10.65)
−0.163
(−1.15)
lnFBE0.450 ***
(7.50)
0.229
(1.7)
lnLFL−0.119
(−0.17)
−4.893 ***
(−3.34)
lnRDI0.312 ***
(6.77)
−0.170
(−1.56)
lnIS0.345 ***
(8.97)
−0.108 *
(−1.85)
Constant−10.800 ***
(−7.86)
10.483 ***
(3.36)
YearYesYes
CityYesYes
R20.9470.345
Note: The values in ( ) represent t-values adjusted using clustered robust standard errors. ***, **, and * indicate significance at the 1%, 5%, and 10% levels, respectively.
Table 10. Robustness test results.
VariablesAdjusting SampleEndogenous
Test
Replace Spatial Weight Matrix
(1)
lnGTFEE
(2) 2SLS
lnGTFEE
(3) Direct
lnGTFEE
(4) Indirect
lnGTFEE
(5) Total
lnGTFEE
lnNQPF0.220 **
(2.32)
0.216 **
(2.46)
0.355 ***
(4.40)
1.988 ***
(4.46)
2.343 ***
(5.16)
ControlsYesYesYesYesYes
YearYesYesYes
CityYesYesYes
R20.296 0.284
Note: The values in ( ) represent t-values adjusted using clustered robust standard errors. *** and ** indicate significance at the 1% and 5% levels, respectively.
Disclaimer/Publisher’s Note: The statements, opinions and data contained in all publications are solely those of the individual author(s) and contributor(s) and not of MDPI and/or the editor(s). MDPI and/or the editor(s) disclaim responsibility for any injury to people or property resulting from any ideas, methods, instructions or products referred to in the content.

