Empowering the Intelligent Transformation of the Manufacturing Sector Through New Quality Productive Forces: Value Implications, Theoretical Analysis, and Empirical Examination


Abstract
1. Introduction
2. Literature Review
2.1. Research on New Quality Productive Forces
2.2. Research on Intelligent Manufacturing
2.3. Research on the Impact of NQPFs on the Transformation of Manufacturing
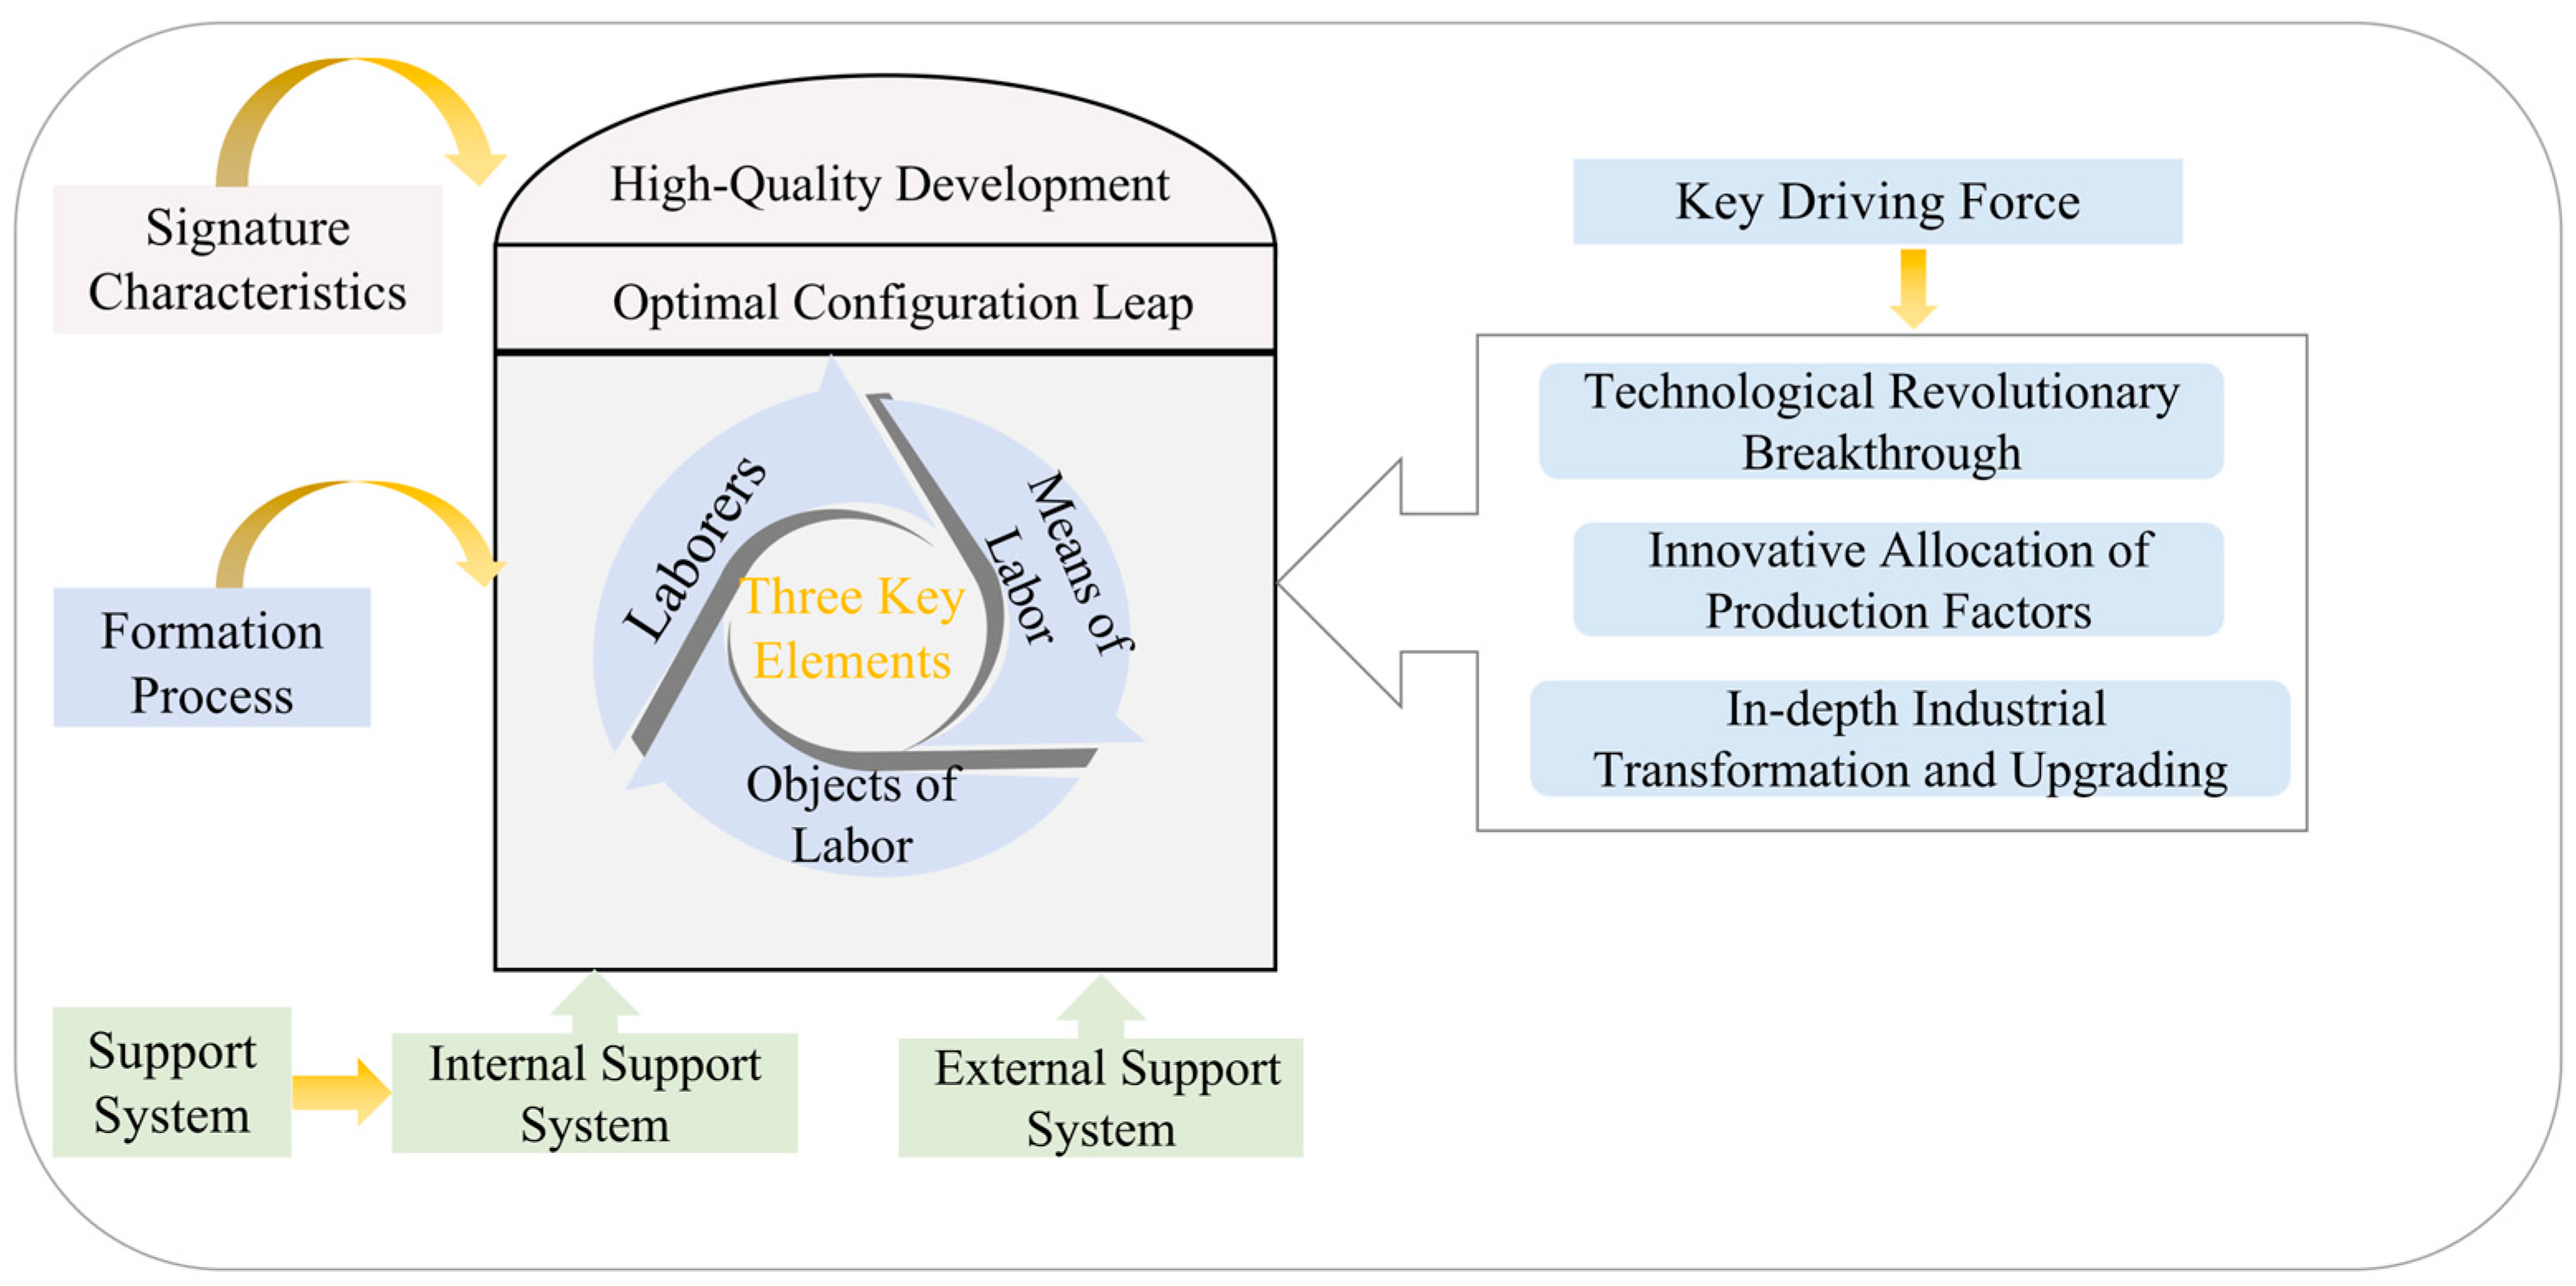
3. Mechanism Analysis: How NQPFs Drive the Intelligent Transformation of Manufacturing
3.1. Innovative Allocation Mechanism of Production Factors
3.2. Mechanism of Revolutionary Technological Breakthroughs
3.3. Mechanism of Deep Industrial Transformation and Upgrading
4. Research Design
4.1. Sample Selection and Data Sources
4.2. Model Specification and Variable Selection
4.3. Research Methodology
4.4. Construction of the Evaluation Index System for the Intelligent Transformation of Manufacturing and Indicator Weights
4.5. Construction of the Evaluation Index System for New Quality Productive Forces and Indicator Weights
5. Results and Analysis
5.1. National Trends in the Development of NQPF
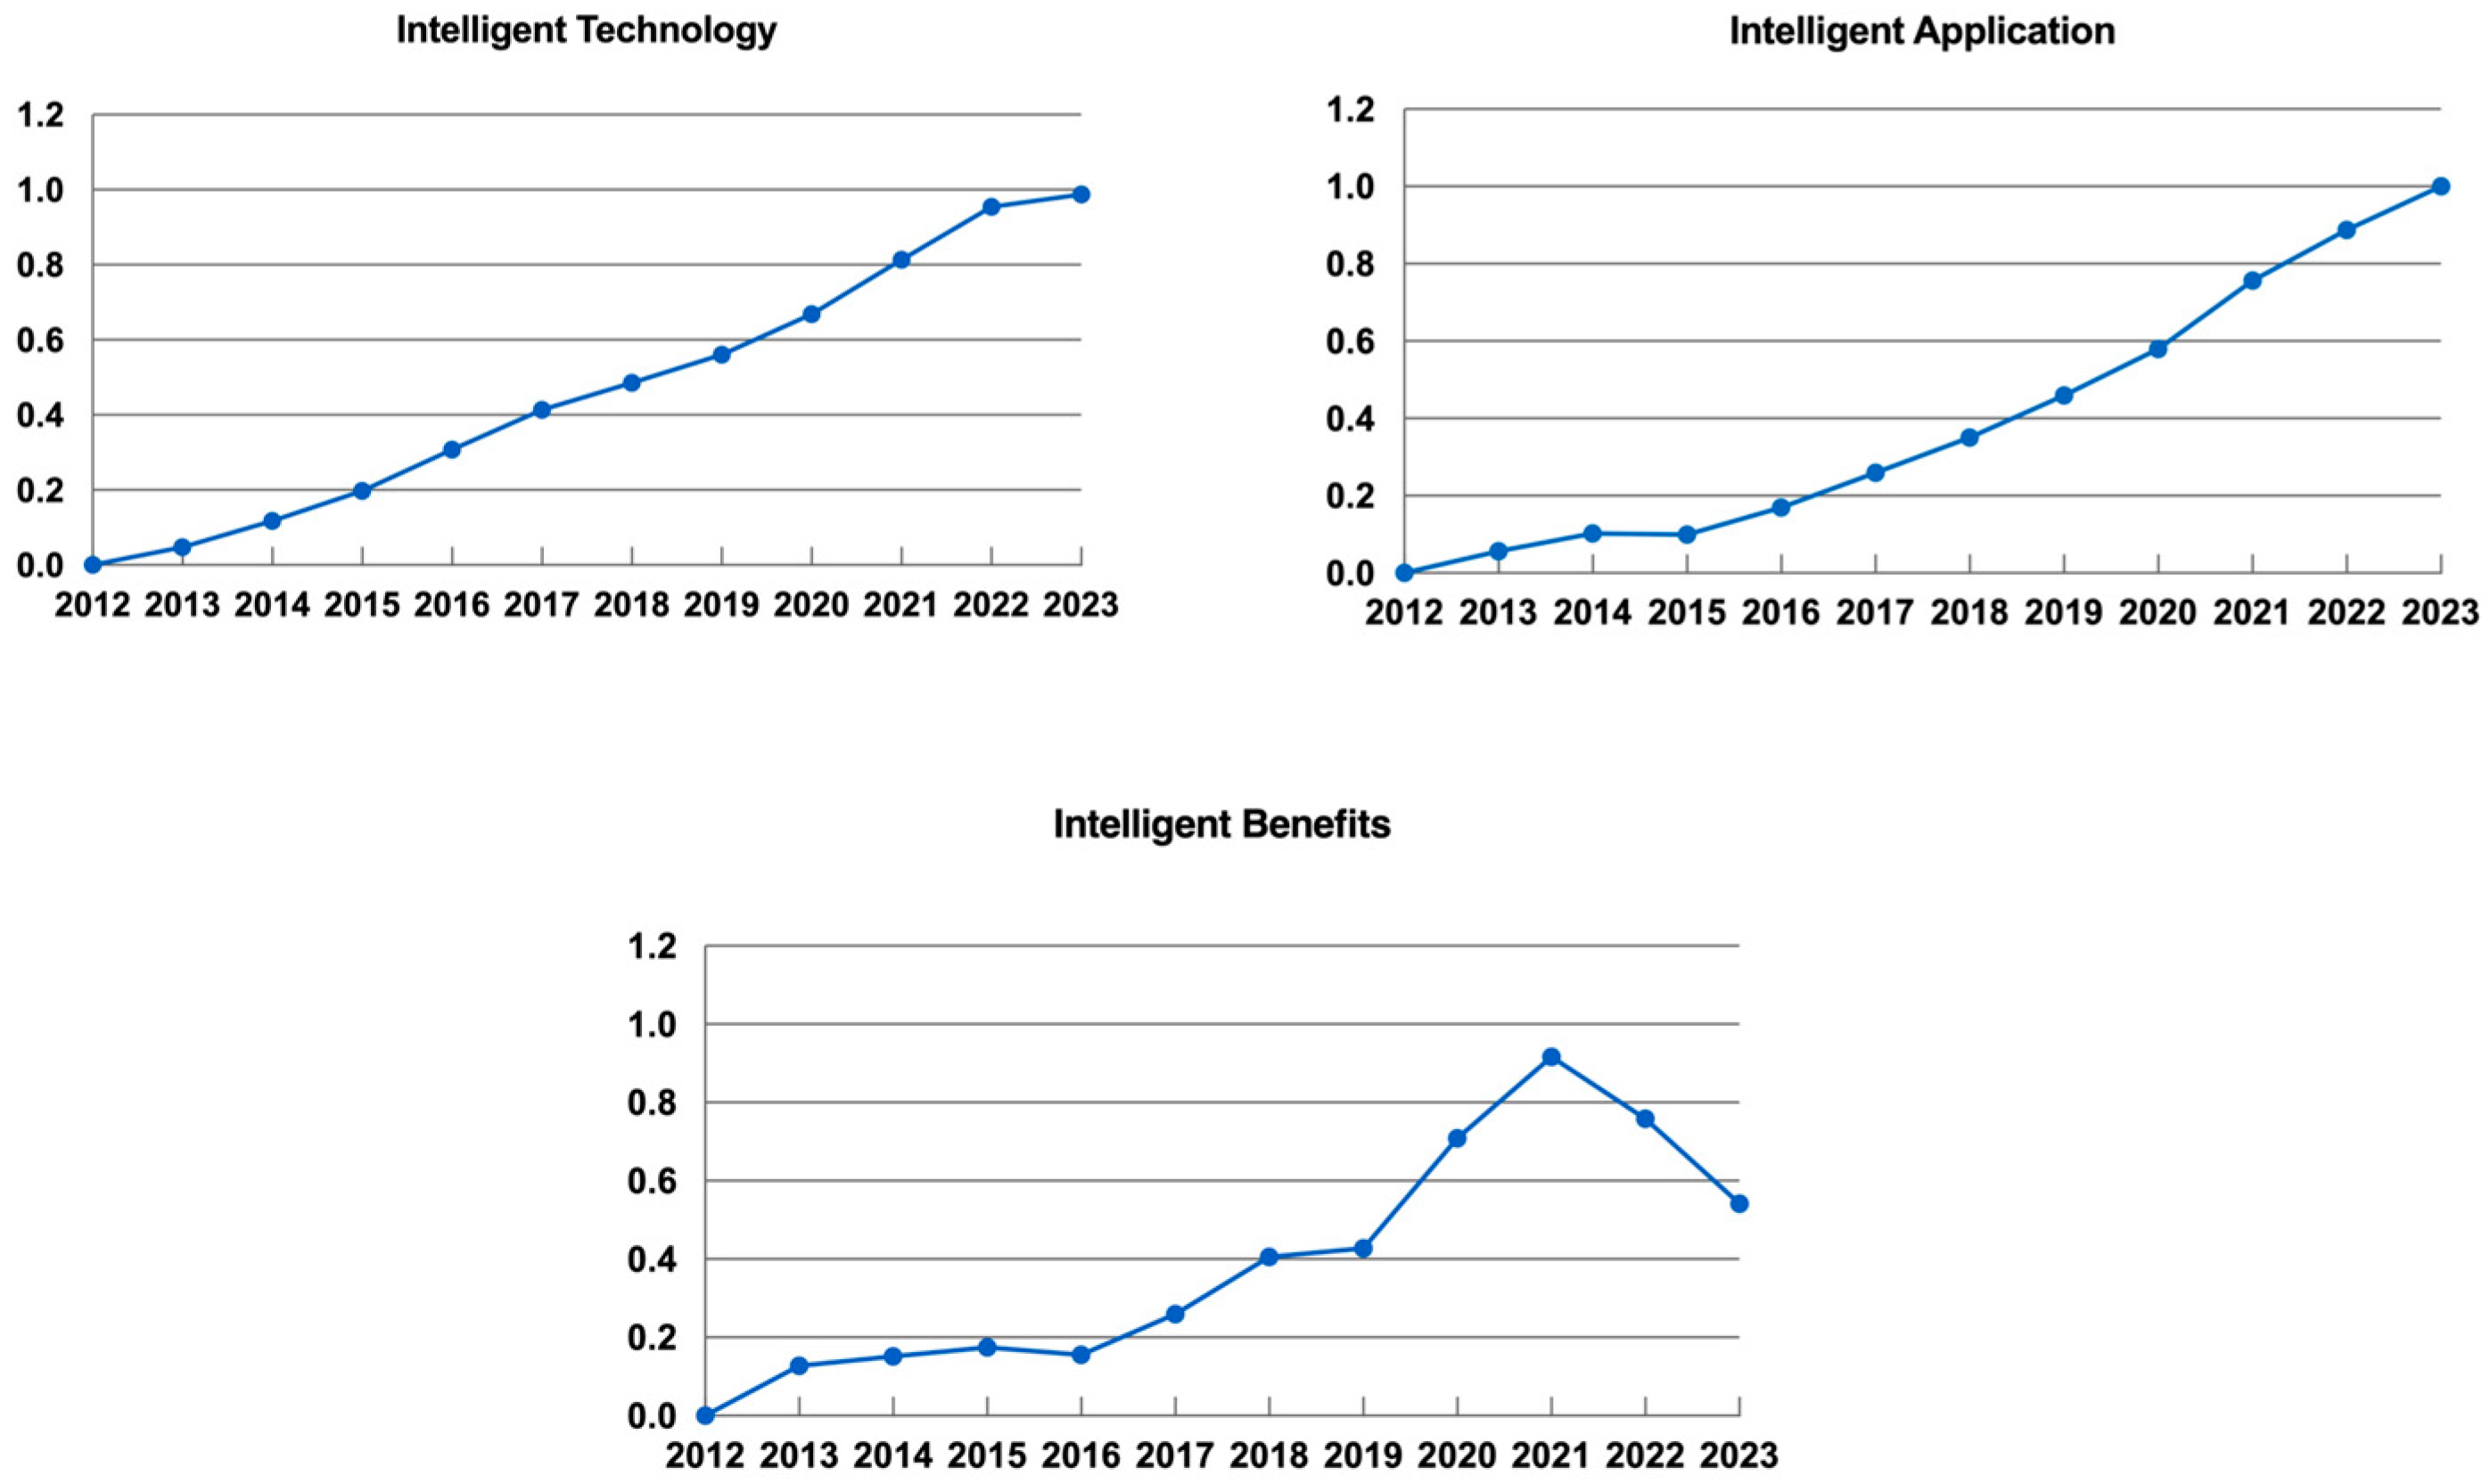
5.2. National Trends in Intelligent Transformation in Manufacturing
5.3. Variable Stationarity Test
5.4. Baseline Regression
5.5. Robustness Test
5.6. Endogeneity Test
6. Conclusions and Policy Recommendations
- (1)
- Optimizing the internal and external environment to lay a solid foundation for the intelligent transformation of manufacturing
- (2)
- Strengthening the three-dimensional mechanism to accelerate the intelligent transformation of the manufacturing industry
- (3)
- Mobilizing collective efforts for transformation and building a collaborative governance ecosystem for transformation.
7. Discussion
7.1. Research Limitations
7.2. Future Research Directions
Author Contributions
Funding
Institutional Review Board Statement
Informed Consent Statement
Data Availability Statement
Conflicts of Interest
References
- Vareshchenko, V.; Karpenko, L. Productive forces development and regional economy. Res. Innov. 2021, 84. [Google Scholar]
- Marx, K.; Engels, F. Collected Works; Lawrence & Wishart: London, UK, 2010; Volume 23. [Google Scholar]
- Huang, Q.H.; Sheng, F.F. The System of New Quality Productivity Forces: Factor Characteristics, Structural Carriers, and Functional Orientation. Reform 2024, 2, 15–24. (In Chinese) [Google Scholar]
- Luo, S.; Qiu, Y. Core Industry Clustering in the Central Digital Economy Enables New Quality Productivity Development: Theoretical Mechanisms and Empirical Tests. Available online: http://kns.cnki.net.http.hebutlib.proxy.hebut.edu.cn/kcms/detail/65.1211.f.20240403.1238.002.html (accessed on 29 July 2025).
- Guangqin, L.I.; Mengjiao, L.I. Provincial-level new quality productive forces in China: Evaluation, spatial pattern and evolution characteristics. Econ. Geogr. 2024, 44, 116–125. [Google Scholar]
- Liu, Y.; He, Z. Synergistic industrial agglomeration, new quality productive forces and high-quality development of the manufacturing industry. Int. Rev. Econ. Financ. 2024, 94, 103373. [Google Scholar] [CrossRef]
- Goldstein, A. China’s grand strategy under xi Jinping: Reassurance, reform, and resistance. Int. Secur. 2020, 45, 164–201. [Google Scholar] [CrossRef]
- Whyte, M.K. China’s economic development history and xi Jinping’s “China dream:” An overview with personal reflections. Chin. Sociol. Rev. 2021, 53, 115–134. [Google Scholar] [CrossRef]
- Lin, L.; Gu, T.; Shi, Y. The influence of new quality productive forces on highquality agricultural development in China: Mechanisms and empirical testing. Agriculture 2024, 14, 1022. [Google Scholar] [CrossRef]
- Yue, S.; Bajuri, N.H.; Khatib, S.F.; Lee, Y. New quality productivity and environmental innovation: The hostile moderating roles of managerial empowerment and board centralization. J. Environ. Manag. 2024, 370, 122423. [Google Scholar] [CrossRef]
- Ren, Y.; Ding, Z.; Liu, J. How green finance boosts carbon efficiency in agriculture: A quasi-experiment from China. China Agric. Econ. Rev. 2024, 16, 267–289. [Google Scholar] [CrossRef]
- Meng, J.; Han, W. The theory of new quality productive forces: A historical materialist interpretation. Econ. Res. J. (Jingji Yanjiu) 2024, 3, 29–33. [Google Scholar]
- Hornstein, A.; Krusell, P. Can technology improvements cause productivity slowdowns? NBER Macroecon. Annu. 1996, 11, 209–259. [Google Scholar] [CrossRef]
- Thatcher, M.E.; Oliver, J.R. The impact of technology investments on a firm’s production efficiency, product quality, and productivity. J. Manag. Inf. Syst. 2001, 18, 17–45. [Google Scholar] [CrossRef]
- Wei, C.H. The Basic Meaning, Historical Evolution and Practical Path of New Quality Productivity. Theory Reform 2023, 6, 25–38. [Google Scholar]
- Zhang, L.; Pu, Q.P. The connotation characteristic, theoretical innovation and value implication of new quality productivity. J. Chongqing Univ. (Soc. Sci. Ed.) 2023, 29, 137–148. (In Chinese) [Google Scholar]
- Hua, G.; Zeng, F.; Sun, H. Analyzing New Quality Productive Forces in New Energy Vehicle Companies Based on a New Multi-Criteria Decision Analysis Model. World Electr. Veh. J. 2024, 15, 503. (In Chinese) [Google Scholar] [CrossRef]
- Xu, S.; Wang, J.; Peng, Z. Study on the Promotional Effect and Mechanism of New Quality Productive Forces on Green Development. Sustainability 2024, 16, 8818. [Google Scholar] [CrossRef]
- Pu, Q.P.; Xiang, W. New Quality Productivity and Its Utilizations—New Driving Force for Chinese Modernization. J. Xinjiang Norm. Univ. (Philos. Soc. Sci.) 2024, 45, 77–85. [Google Scholar]
- Chin, T.; Li, Z.; Huang, L.; Li, X. How artificial intelligence promotes new quality productive forces of firms: A dynamic capability view. Technol. Forecast. Soc. Change 2025, 216, 124128. [Google Scholar] [CrossRef]
- Zhang, Z.; Li, J.; Tangnur, H. Measurement and Spatiotemporal Evolution of the Development Level of China’s New Quality Productive Forces. Stat. Decis. 2024, 9, 18–23. [Google Scholar]
- Wang, J.; Wang, R. New Quality Productivity: Index Construction and Spatiotemporal Evolution. J. Xi’an Univ. Financ. Econ. 2024, 37, 31–47. [Google Scholar]
- Gang, H.; Zhao, F. Research on the coupling and harmonization degree of new productive force and high-quality economic development. Financ. Res. Lett. 2025, 84, 107684. (In Chinese) [Google Scholar] [CrossRef]
- Zhu, Z.; Yang, F.; Li, W. Analysis of Three-dimensional Innovation Ecosystems and Level Measurement of New Quality Productive Forces. J. Yunnan Univ. Financ. Econ. 2024, 6, 1–14. [Google Scholar]
- Han, W.; Zhang, R.; Zhao, F. The measurement of new quality productivity and new driving force of the Chinese economy. J. Quant. Technol. Econ. 2024, 41, 5–25. [Google Scholar]
- Lu, J.; Guo, Z.; Wang, Y. Levels of development of new quality productivity, regional differences and paths to enhancement. J. Chongqing Univ. 2024, 30, 1–17. [Google Scholar]
- Xiao, Y.Z.; Zhang, X.L.; Liu, X. New quality productive forces and intra-firm pay gap: Based on the perspective of sharing development achievements. Econom. Rev. 2024, 3, 75–91. [Google Scholar]
- Wright, K.; Bourne, D.A. Manufacturing Intelligence; Addison-Wesley Longman Publishing Co., Inc.: Boston, MA, USA, 1988. [Google Scholar]
- Thoben, K.D.; Wiesner, S.; Wuest, T. “Industrie 4.0” and smart manufacturing-a review of research issues and application examples. Int. J. Autom. Technol. 2017, 11, 4–19. [Google Scholar] [CrossRef]
- Davis, J.; Edgar, T.; Porter, J.; Bernaden, J.; Sarli, M. Smart manufacturing, manufacturing intelligence and demand-dynamic performance. Comput. Chem. Eng. 2012, 47, 145–156. [Google Scholar] [CrossRef]
- Cheng, Z.; Li, W. Independent R and D, Technology introduction, and green growth in China’s manufacturing. Sustainability 2018, 10, 311. [Google Scholar] [CrossRef]
- Wang, T.M.; Tao, Y. The Present Situation and Industrialization Development Strategy of Industrial Robot Technology in China. J. Mech. Eng. 2014, 50, 1–13. (In Chinese) [Google Scholar]
- Sun, Z.Y. The Impact of Digital New Quality Productive Forces on High-quality Urban-rural Integration and Its Mechanism. China Bus. Mark. 2024, 38, 28–40. [Google Scholar]
- Yu, D.H. Connotation, path and power mechanism of high-quality development of manufacturing industry. Rev. Ind. Econ. 2020, 1, 13–32. [Google Scholar]
- Jia, G.L. The Third Industrial Revolution and Industrial Intelligence. Chin. Soc. Sci. 2016, 6, 87–106+206. [Google Scholar]
- Yang, G.Y.; Tang, L. Exploring the Connotations of New-quality Productivity and its Relationships with Others in the Perspective of Digital Inclusive Finance. J. Yunnan Minzu Univ. (Philos. Soc. Sci. Ed.) 2024, 41, 84–94. [Google Scholar]
- Lee, C.; Qin, S.; Li, Y. Does industrial robot application promote green technology innovation in the manufacturing industry? Technol. Forecast. Soc. Change 2022, 183, 121893. [Google Scholar] [CrossRef]
- Syam, N.; Sharma, A. Waiting for a sales renaissance in the fourth industrial revolution: Machine learning and artificial intelligence in sales research and practice. Ind. Mark. Manag. 2018, 69, 135–146. [Google Scholar] [CrossRef]
- Purdy, M.; Daugherty, P. Why Artificial Intelligence is the Future of Growth; Accenture: Brampton, ON, Canada, 2016; pp. 1–72. [Google Scholar]
- Liu, J.; Chen, J. Can Intelligence Promote the Transformation and upgrading of China’s industrial structure. Mod. Econ. Explor. 2021, 7, 105–111. [Google Scholar]
- Tang, Z.; Chi, Z. Research on the impact of industrial intelligence on the high-quality development of manufacturing industry. Contemp. Financ. Econ. 2021, 5, 102–114. [Google Scholar]
- Huang, R.; Shen, Z.; Yao, X. How does industrial intelligence affect total-factor energy productivity? Evidence from China’s manufacturing industry. Comput. Ind. Eng. 2024, 188, 109901. [Google Scholar] [CrossRef]
- Graetz, G.; Michaels, G. Robots at work. Rev. Econ. Stat. 2018, 100, 753–768. [Google Scholar] [CrossRef]
- Wang, S.; Du, A.M.; Lin, B. Micro-mechanisms of digitalization-driven financing for renewable energy: Growing capital pools and shifting flows. Res. Int. Bus. Financ. 2025, 73, 102633. [Google Scholar] [CrossRef]
- Lin, B.; Xu, C. Enhancing energy-environmental performance through industrial intelligence: Insights from Chinese prefectural-level cities. Appl. Energy 2024, 365, 123245. [Google Scholar] [CrossRef]
- Xu, C.; Zhang, H.L.; Lin, B. Achieving pollution abatement and carbon reduction synergistically: How can industrial robots play a role? J. Environ. Manag. 2025, 373, 123816. [Google Scholar] [CrossRef] [PubMed]
- Lin, C.; Xiao, S.; Yin, Z. How do industrial robots applications affect the quality upgrade of Chinese export trade? Telecommun. Policy 2022, 46, 102425. [Google Scholar] [CrossRef]
- Frey, C.B.; Osborne, M.A. The future of employment: How susceptible are jobs tocomputerisation? Technol. Forecast. Soc. Change 2017, 114, 254–280. [Google Scholar] [CrossRef]
- Autor, D.; Salomons, A. Is Automation Labor-Displacing? Productivity Growth, Employment, and the Labor Share; National Bureau of Economic Research: Cambridge, MA, USA, 2018. [Google Scholar]
- DeCanio, S.J. Robots and humans-complements or substitutes? J. Macroecon. 2016, 49, 280–291. [Google Scholar] [CrossRef]
- Acemoglu, D.; Restrepo, P. The race between man and machine: Implications oftechnology for growth, factor shares, and employment. Am. Econ. Rev. 2018, 108, 1488–1542. [Google Scholar] [CrossRef]
- Autor, D.H. Why are there still so many jobs? The history and future of workplace automation. J. Ofeconomic Perspect. 2015, 29, 3–30. [Google Scholar] [CrossRef]
- Berg, A.; Buffie, E.F.; Zanna, L.F. Robots, growth, and inequality. Financ. Dev. 2016, 53, 10–13. [Google Scholar]
- Aghion, P.; Antonin, C.; Bunel, S.; Jaravel, X. What are the labor and product market effects of automation? New evidence from France. SciencesPo 2020, hal-03403062. [Google Scholar]
- Negri, E.; Fumagalli, L.; Macchi, M. A review of the roles of digital twin in cps based production systems. Procedia Manuf. 2017, 11, 939–948. [Google Scholar] [CrossRef]
- Vial, G. Understanding digital transformation: A review and a research agenda. J. Strateg. Inf. Syst. 2019, 28, 118–144. [Google Scholar] [CrossRef]
- Asghari, M. The stringency of environmental regulations and technological change: A specific test of the porter hypothesis. Iran. Econ. Rev. 2010, 15, 95–115. [Google Scholar]
- Arthur, W.B. Competing technologies, increasing returns, and lock-in by historical events. Econ. J. 1989, 99, 116–131. [Google Scholar] [CrossRef]
- Brakman, S.; Garretsen, H.; Gigengack, R.; Van Marrewijk, C.; Wagenvoort, R. Negative feedbacks in the economy and industrial location. J. Reg. Sci. 1996, 36, 631–651. [Google Scholar] [CrossRef]
- Kuhn, T.S. The Structure of Scientific Revolutions; University of Chicago Press: Chicago, IL, USA, 1997. [Google Scholar]
- Perez, C. Technological Revolutions and Techno-economic Paradigms. Camb. J. Econ. 2010, 34, 185–202. [Google Scholar] [CrossRef]
- Zheng, X.; Zhang, J. New Quality Productive Forces Promote the Transformation and Upgrading of Manufacturing Industry: Value Orientation, Logical Mechanism, and Key Measures. J. Soc. Sci. Hunan Norm. Univ. 2024, 53, 104–113. (In Chinese) [Google Scholar]
- Huang, Z.; Shan, L.; Xu, Z. The impact of the development of new quality productive forces on the technical complexity of manufacturing export. Price Mon. 2024, 9, 70–80. (In Chinese) [Google Scholar]
- Song, Y.; Wang, Z. New quality productivity and manufacturing industry chain supply chain resilience: Theoretical analysis and empirical test. J. Henan Norm. Univ. (Nat. Sci. Ed.) 2024, 52, 29–42+2. (In Chinese) [Google Scholar]
- Cao, Y.; Hou, Y. Can the Intelligent Manufacturing Initiative Overcome the “Productivity Paradox”: A Quasi-Natural Experiment from Intelligent Manufacturing Pilot Demonstration Projects. China Soft Sci. 2024, 6, 23–32. (In Chinese) [Google Scholar]
- Zhao, X.; Li, X. Empirical Test of Relationship Between Digital New-quality Productivity and Modernization of Manufacturing Industry Chain. Stat. Decis. 2024, 40, 17–22. (In Chinese) [Google Scholar]
- Cai, Y. Influence and Mechanism of Digital New-quality Productivity on Manufacturing Resilience. Stat. Decis. 2025, 41, 19–24. (In Chinese) [Google Scholar]
- Li, L.; Bao, Y.; Liu, J. Criminal regulation of science and technology innovation risk: Practice, idea and paradigm. Stud. Sci. Sci. 2020, 38, 609–618+722. (In Chinese) [Google Scholar] [CrossRef]
- Guo, X.; Li, M.; Wang, Y.; Mardani, A. Does Digital Transformation Improve the Firm’s Performance? from the Perspective of Digitalization Paradox and Managerial Myopia. J. Bus. Res. 2023, 163, 113868. [Google Scholar] [CrossRef]
- Viollaz, M. Information and Communication Technology Adoption in Micro and Small Firms, Can Internet Access Improve Labour Productivity? Dev. Policy Rev. 2019, 37, 692–715. [Google Scholar] [CrossRef]
- Altenburg, T.; Schmitz, H.; Stamm, A. Breakthrough? China’s and India’s transition from production to innovation. World Dev. 2008, 36, 325–344. [Google Scholar] [CrossRef]
- Bashir, M.F.; Pan, Y.; Shahbaz, M.; Ghosh, S. How energy transition and environmental innovation ensure environmental sustainability? Contextual evidence from top-10 manufacturing countries. Renew. Energy 2023, 204, 697–709. [Google Scholar] [CrossRef]
- Nasiri, M.; Ukko, J.; Saunila, M.; Rantala, T. Managing the Digital Supply Chain: The Role of Smart Technologies. Technovation 2020, 96–97, 102121. [Google Scholar] [CrossRef]
- Li, J. Research on Evaluation Benchmark and Influencing Factors for China’s Manufacturing Intelligentization. China Soft Sci. 2020, 1, 154–163. [Google Scholar]


| Primary Dimension | Secondary Indicator | Description | Unit | Attribute |
|---|---|---|---|---|
| Intelligent Technology | Industrial robot deployment | Output of industrial robots | 10,000 sets | Positive |
| Fixed asset investment | Per capita fixed asset investment in IT and software sectors | CNY/person | Positive | |
| Optical cable coverage | Cable length per area unit | 1/m2 | Positive | |
| Industrial Internet infrastructure | Number of computers per 100 people | Units | Positive | |
| Intelligent Application | System integration | Main business income of IT services | CNY 100 million | Positive |
| New product projects | Number of new manufacturing product development projects | Projects | Positive | |
| R&D expenditure | Development expenditure on new manufacturing products | CNY 10,000 | Positive | |
| Patent applications | Number of invention patent filings in manufacturing | Cases | Positive | |
| Intelligent Benefits | Operating profit | Profit of high-tech manufacturing enterprises | CNY 100 million | Positive |
| Export performance | Export value of high-tech products | CNY 100 million | Positive |
| Primary Dimension | Secondary Indicator | Description | Weight (%) |
|---|---|---|---|
| Intelligent Technology | Industrial robot deployment | Output of industrial robots | 14.30% |
| Fixed asset investment | IT/software fixed investment per capita | 5.70% | |
| Optical cable coverage | Cable length per area | 8.50% | |
| Industrial Internet infrastructure | Computers per 100 persons | 8.76% | |
| Intelligent Application | System integration | IT services revenue | 8.59% |
| New product development projects | Manufacturing innovation activity | 15.32% | |
| R&D investment for new products | 10.45% | ||
| Invention patent filings | 9.95% | ||
| Intelligent Benefits | Operating profit | High-tech manufacturing profits | 7.68% |
| Export performance | Export value of high-tech products (billions of CNY) | 10.75% |
| Criterion Layer | Primary Indicator | Secondary Indicator | Tertiary Indicator | Attribute |
|---|---|---|---|---|
| Formative Process | Laborers | Training Investment | Human capital investment | Positive |
| Scientific investment | Positive | |||
| Educational investment | Positive | |||
| Labor Output | Contribution of the computer industry | Positive | ||
| Contribution of R&D and tech services | Positive | |||
| Output per capita | Positive | |||
| Wage per capita | Positive | |||
| Labor Quality | Health quality level | Positive | ||
| Employment perception level | Positive | |||
| Innovation awareness of laborers | Positive | |||
| Objects of Labor | New energy | Share of renewable energy generation | Positive | |
| Number of UHV transmission lines | Positive | |||
| Data elements | Big data generation | Positive | ||
| Big data processing | Positive | |||
| New quality industries | High-tech industries | Positive | ||
| Future industries | Positive | |||
| Advanced manufacturing | Positive | |||
| Electronic information industries | Positive | |||
| Means of Labor | Infrastructure | Traditional infrastructure | Positive | |
| Digital infrastructure | Positive | |||
| Production tools | Integrated circuit output (100 million units) | Positive | ||
| Key Drivers | Technological Breakthrough | Scientific innovation productivity | Innovation investment | Positive |
| Innovation output | Positive | |||
| Innovation and entrepreneurship ecosystem | Positive | |||
| Digital technology | Digital informatization | Positive | ||
| Digital interconnectivity | Positive | |||
| Digital economy development level | Positive | |||
| Industrial digitalization | Positive | |||
| Level of digital application | Positive | |||
| Deep Industrial Transformation | Green transformation | Resource consumption level | Positive | |
| Ecological governance capacity | Positive | |||
| Environmental protection | Positive | |||
| Informatization | Informatization investment level | Positive | ||
| Informatization capacity | Positive | |||
| Informatization output | Positive | |||
| High-end industries | New quality industrial chains | Positive | ||
| New services | Positive | |||
| Innovative Factor Allocation | Factor demand | Demand for technology | Positive | |
| Demand for knowledge | Positive | |||
| Demand for land | Positive | |||
| Productive relations restructuring | New quality industry clusters | Positive | ||
| Emerging shared economy models | Positive | |||
| Production efficiency | Positive | |||
| Production quality | Positive | |||
| Support Systems | Internal Support System | Fiscal policy | National fiscal allocation for science & technology | Positive |
| Education expenditure | Positive | |||
| Science expenditure | Positive | |||
| Government funding for R&D in large-scale enterprises | Positive | |||
| R&D funding for research and development institutions | Positive | |||
| Government funding in university R&D | Positive | |||
| Sci-tech policy | Number of technology incubators | Positive | ||
| Number of incubated enterprises in incubators | Positive | |||
| Number of makerspaces | Positive | |||
| Startups served by makerspaces | Positive | |||
| Number of national tech transfer institutions | Positive | |||
| Enterprises served by national transfer institutions | Positive | |||
| Number of national university science parks | Positive | |||
| Incubated enterprises in science parks | Positive | |||
| Financial policy | Digital inclusive finance index | Positive | ||
| Number of active VC institutions | Positive | |||
| Number of venture capital firms | Positive | |||
| Investment intensity of venture capital | Positive | |||
| External Support System | Trade openness | Trade structure | Positive | |
| Foreign trade dependence | Positive | |||
| Financial openness | Capital mobility | Positive | ||
| Openness of financial services trade | Positive | |||
| Investment openness | Foreign investment dependence | Positive | ||
| IT openness | Technological openness | Positive | ||
| Information openness | Positive | |||
| Institutional openness | Actual tariff rate | Positive | ||
| External business environment | Positive | |||
| Defining Characteristics | Optimized Structural Combination | Resource optimization | Labor productivity | Positive |
| Capital productivity | Positive | |||
| Land productivity | Positive | |||
| Energy productivity | Positive | |||
| Organizational efficiency | Total factor productivity | Positive | ||
| Industrial structure optimization | Positive | |||
| Market optimization | Share of retail sales in total industrial & agricultural output | Positive | ||
| Number of large-scale wholesale/retail enterprises | Positive | |||
| High-Quality Development | Innovation development | Investment efficiency | Positive | |
| Activity in technology transactions | Positive | |||
| China innovation index | Positive | |||
| Number of new industrial projects | Positive | |||
| Total fixed asset investment in new industries | Positive | |||
| Coordinated development | Urban–rural structure | Positive | ||
| Government debt burden | Positive | |||
| Green development | Safe disposal rate of household waste | Positive | ||
| Energy transformation efficiency | Positive | |||
| Green invention achievements | Positive | |||
| Energy consumption growth rate relative to GDP | Positive | |||
| Open development | Number of FDI contract projects | Positive | ||
| Total amount of FDI | Positive | |||
| Number of foreign-invested enterprises | Positive | |||
| Shared development | Income distribution | Positive | ||
| Social security | Positive | |||
| Public welfare | Positive |
| Principal Component | Eigenvalue | Variance Proportion | Cumulative Variance Proportion |
|---|---|---|---|
| Comp1 | 114.212 | 0.6964 | 0.6964 |
| Comp2 | 21.2109 | 0.1293 | 0.8257 |
| Comp3 | 8.90895 | 0.0543 | 0.8801 |
| Comp4 | 4.88405 | 0.0298 | 0.9099 |
| Comp5 | 3.72296 | 0.0227 | 0.9326 |
| Comp6 | 2.8978 | 0.0177 | 0.9502 |
| Comp7 | 2.5696 | 0.0157 | 0.9659 |
| Comp8 | 1.78239 | 0.0109 | 0.9768 |
| Comp9 | 1.54395 | 0.0094 | 0.9862 |
| Comp10 | 1.2107 | 0.0074 | 0.9936 |
| Comp11 | 1.05696 | 0.0064 | 1 |
| Year | NQPF |
|---|---|
| 2012 | 0.3483 |
| 2013 | 0.4038 |
| 2014 | 0.4077 |
| 2015 | 0.4762 |
| 2016 | 0.5529 |
| 2017 | 0.5701 |
| 2018 | 0.5378 |
| 2019 | 0.5214 |
| 2020 | 0.3698 |
| 2021 | 0.6348 |
| 2022 | 0.319 |
| 2023 | 0.592 |
| Year | Intelligent Technology | Intelligent Application | Intelligent Benefits |
|---|---|---|---|
| 2012 | 0.0000 | 0.0000 | 0.0000 |
| 2013 | 0.0474 | 0.0563 | 0.1276 |
| 2014 | 0.1172 | 0.1024 | 0.1514 |
| 2015 | 0.1976 | 0.0990 | 0.1745 |
| 2016 | 0.3074 | 0.1694 | 0.1559 |
| 2017 | 0.4138 | 0.2593 | 0.2591 |
| 2018 | 0.4852 | 0.3509 | 0.4052 |
| 2019 | 0.5605 | 0.4592 | 0.4279 |
| 2020 | 0.6687 | 0.5796 | 0.7081 |
| 2021 | 0.8136 | 0.7564 | 0.9160 |
| 2022 | 0.9541 | 0.8875 | 0.7585 |
| 2023 | 0.9878 | 1.0000 | 0.5412 |
| Variable Type | Original Series | |||
| Test Type (C, T, N) | ADF-Value | p-Value | Conclusion | |
| NQPF | (1, 1, 2) | 0.682 | 0.997 | Non-stationary |
| Intelligent Technology | (1, 0, 2) | −1.901 | 0.588 | Non-stationary |
| Intelligent Application | (1, 1, 0) | −0.862 | 0.922 | Non-stationary |
| Intelligent Benefits | (1, 1, 2) | −2.791 | 0.233 | Non-stationary |
| Degree of Government Intervention | (1, 0, 1) | −1.906 | 0.317 | Non-stationary |
| Level of Social Consumption | (1, 1, 1) | −1.839 | 0.613 | Non-stationary |
| Level of economic development | (1, 1, 0) | −2.876 | 0.207 | Non-stationary |
| Level of Education expenditure | (1, 1, 0) | −2.438 | 0.267 | Non-stationary |
| industry Index | (1, 0, 2) | −1.988 | 0.408 | Non-stationary |
| labor Index | (1, 1, 2) | 0.682 | 0.997 | Non-stationary |
| Variable Type | First-Difference Series | |||
| Test Type (C, T, N) | ADF-Value | p-Value | Conclusion | |
| NQPF | (1, 1, 2) | −2.38 | 0.362 | Non-stationary |
| Intelligent Technology | (1, 1, 2) | −3.777 | 0.074 | Non-stationary |
| Intelligent Application | (1, 1, 0) | −1.308 | 0.581 | Non-stationary |
| Intelligent Benefits | (1, 2, 2) | −3.443 | 0.003 | Stationary |
| Degree of Government Intervention | (1, 1, 0) | −3.648 | 0.079 | Stationary |
| Level of Social Consumption | (1, 1, 1) | −1.936 | 0.537 | Non-stationary |
| Level of economic development | (1, 1, 0) | −1.973 | 0.314 | Non-stationary |
| Level of Education expenditure | (0, 0, 1) | −2.343 | 0.039 | Non-stationary |
| industry Index | (1, 1, 2) | −1.453 | 0.107 | Stationary |
| labor Index | (1, 1, 2) | −2.38 | 0.362 | Non-stationary |
| Variable Type | Second-Difference Series | |||
| Test Type (C, T, N) | ADF-Value | p-Value | Conclusion | |
| NQPF | (1, 0, 2) | −3.683 | 0.036 | Stationary |
| Intelligent Technology | (0, 1, 2) | −2.889 | 0.01 | Stationary |
| Intelligent Application | (0, 0, 0) | −3.476 | 0.003 | Stationary |
| Intelligent Benefits | (1, 2, 2) | −2.97 | 0.009 | Stationary |
| Degree of Government Intervention | (0, 0, 1) | −3.018 | 0.008 | Stationary |
| Level of Social Consumption | (0, 0, 1) | −2.736 | 0.009 | Stationary |
| Level of economic development | (1, 1, 0) | −4.342 | 0.001 | Stationary |
| Level of Education expenditure | (0, 0, 0) | −3.682 | 0.002 | Stationary |
| industry Index | (0, 1, 2) | −6.57 | 0.001 | Stationary |
| labor Index | (1, 0, 2) | −3.683 | 0.036 | Stationary |
| (1) Intelligent Technology | (2) Intelligent Application | (3) Intelligent Benefits | |
|---|---|---|---|
| NQPF | 1.804 ** | 2.656 ** | 3.444 ** |
| (3.82) | (3.56) | (4.19) | |
| Degree of Government Intervention | −1.171 ** | −0.284 | −0.214 |
| (−5.60) | (−0.86) | (−0.54) | |
| Level of Social Consumption | 1.010 ** | 0.772 | 0.731 |
| (2.58) | (1.89) | (1.12) | |
| Fiscal Investment Level | 0.312 | −0.333 | −0.956 * |
| (2.03) | (−1.19) | (−4.48) | |
| industry Index | −0.463 ** | −1.013 | −1.107 |
| (−2.12) | (−1.88) | (−1.93) | |
| labor Index | −0.493 | −1.065 | −0.895 |
| (−1.09) | (−1.47) | (−1.27) | |
| _cons | 0.025 | −0.017 | −0.004 |
| (1.60) | (−1.80) | (−0.28) | |
| ind | No | No | No |
| N | 12 | 12 | 12 |
| R2 | 0.875 | 0.890 | 0.856 |
| Adj. R2 | 0.815 | 0.850 | 0.803 |
| (1) | (2) | (3) | (4) | (5) | (6) | |
|---|---|---|---|---|---|---|
| Intelligent Technology | Intelligent Application | Intelligent Benefits | Intelligent Technology | Intelligent Application | Intelligent Benefits | |
| PC1 | 0.758 ** | 1.055 *** | 1.502 *** | |||
| (0.198) | (0.173) | (0.079) | ||||
| Degree of Government Intervention | −1.351 *** | −0.498 ** | −0.602 *** | −1.351 *** | −0.498 ** | −0.602 *** |
| (0.218) | (0.156) | (0.083) | (0.218) | (0.156) | (0.083) | |
| Level of Social Consumption | 0.323 | −0.125 | −0.684 ** | 0.323 | −0.125 | −0.684 ** |
| (0.361) | (0.248) | (0.196) | (0.361) | (0.248) | (0.196) | |
| Level of Education expenditure | 0.309 | −0.372 | −0.929 *** | 0.309 | −0.372 | −0.929 *** |
| (0.169) | (0.200) | (0.068) | (0.169) | (0.200) | (0.068) | |
| industry Index | −0.135 | −0.542 ** | −0.473 ** | −0.135 | −0.542 ** | −0.473 ** |
| (0.344) | (0.211) | (0.162) | (0.344) | (0.211) | (0.162) | |
| labor Index | −0.534 | −0.791 | −1.037 *** | −0.534 | −0.791 | −1.037 *** |
| (0.655) | (0.478) | (0.238) | (0.655) | (0.478) | (0.238) | |
| PC2 | 0.758 ** | 1.055 *** | 1.502 *** | |||
| (0.198) | (0.173) | (0.079) | ||||
| _cons | −0.014 | −0.073 *** | −0.082 *** | −0.014 | −0.073 *** | −0.082 *** |
| (0.018) | (0.016) | (0.007) | (0.018) | (0.016) | (0.007) | |
| N | 12 | 12 | 12 | 12 | 12 | 12 |
| (1) | (2) | (3) | |
|---|---|---|---|
| Intelligent Technology | Intelligent Application | Intelligent Benefits | |
| NPQ | 1.960 * | 2.743 ** | 3.713 ** |
| (0.723) | (0.805) | (0.888) | |
| e_NPQ | 1.187 | 0.663 | 2.043 |
| (2.263) | (1.570) | (1.024) | |
| Degree of Government Intervention | −1.211 ** | −0.306 | −0.281 |
| (0.272) | (0.343) | (0.417) | |
| Level of Social Consumption | 0.947 * | 0.736 | 0.622 |
| (0.400) | (0.388) | (0.593) | |
| Level of Education expenditure | 0.349 | −0.312 | −0.890 ** |
| (0.274) | (0.295) | (0.254) | |
| labor Index | −0.480 | −1.022 | −1.136 * |
| (0.325) | (0.527) | (0.437) | |
| labor Index | −0.568 | −0.846 | −1.023 |
| (0.662) | (0.743) | (0.571) | |
| _cons | 0.026 | −0.017 | −0.003 |
| (0.016) | (0.010) | (0.012) | |
| N | 12 | 12 | 12 |
Disclaimer/Publisher’s Note: The statements, opinions and data contained in all publications are solely those of the individual author(s) and contributor(s) and not of MDPI and/or the editor(s). MDPI and/or the editor(s) disclaim responsibility for any injury to people or property resulting from any ideas, methods, instructions or products referred to in the content. |
© 2025 by the authors. Licensee MDPI, Basel, Switzerland. This article is an open access article distributed under the terms and conditions of the Creative Commons Attribution (CC BY) license (https://creativecommons.org/licenses/by/4.0/).
Share and Cite
Hu, Y.; Jia, X. Empowering the Intelligent Transformation of the Manufacturing Sector Through New Quality Productive Forces: Value Implications, Theoretical Analysis, and Empirical Examination. Sustainability 2025, 17, 7006. https://doi.org/10.3390/su17157006
Hu Y, Jia X. Empowering the Intelligent Transformation of the Manufacturing Sector Through New Quality Productive Forces: Value Implications, Theoretical Analysis, and Empirical Examination. Sustainability. 2025; 17(15):7006. https://doi.org/10.3390/su17157006
Chicago/Turabian StyleHu, Yinyan, and Xinran Jia. 2025. "Empowering the Intelligent Transformation of the Manufacturing Sector Through New Quality Productive Forces: Value Implications, Theoretical Analysis, and Empirical Examination" Sustainability 17, no. 15: 7006. https://doi.org/10.3390/su17157006
APA StyleHu, Y., & Jia, X. (2025). Empowering the Intelligent Transformation of the Manufacturing Sector Through New Quality Productive Forces: Value Implications, Theoretical Analysis, and Empirical Examination. Sustainability, 17(15), 7006. https://doi.org/10.3390/su17157006