1. Introduction
Bird’s-foot trefoil (
Lotus corniculatus L.) is a widely distributed perennial legume from the Fabaceae family, valued for its role in sustainable agriculture. It is commonly used for forage production, soil stabilization, and ecological restoration due to its nitrogen-fixing ability and tolerance to marginal soils and drought [
1,
2]. Given these ecological benefits and agronomic versatility, this species has become a focus of interest in breeding programs aimed at sustainable crop development [
3,
4,
5]. As a perennial plant, it is used for erosion control along roadsides and in soils with high salinity. It serves in ecological restoration as a nitrogen-fixing plant in symbiosis with soil bacteria (
rhizobia). Several wild animals, such as geese and deer, favor it as a food source, while it also provides a habitat for wildlife. Additionally, it is utilized as ground cover since it is a relatively long-living plant, and serves as a food source for livestock in pastures, either as green chop or for hay and silage production [
2,
3,
4,
6]. Since it can reseed itself, stands containing this species are long-standing [
7,
8]. Depending on the cultivar grown,
L. corniculatus can be upright/erect, semi-erect, or prostrate. Semi-erect plants are the most cultivated as a food source (green chop, silage, and hay, in pastures) [
7,
9,
10].
L. corniculatus prefers a humid temperate climate but can tolerate drought effectively. It thrives in a variety of soil conditions, enduring poor drainage, waterlogging, moderate levels of sodium, manganese, and aluminum, as well as high acidity and low fertility, better than other legumes. Additionally, it does not cause bloat in ruminants [
9,
11]. As it is relatively shallow-rooted, it unfortunately does not grow well in sandy soils [
7]. To establish this plant, the best pH range for the soil is 6.0–6.5, but it can tolerate a range of 5.5–7.5 as well [
3]. A pH below 5.5 results in reduced root growth [
11]. The persistence of the plant under defoliation from grazing poses a challenge, as growth is significantly reduced. Additionally, elevated soil acidity, low fertility, and dry weather result in a diminished quantity of dry matter produced [
12]. The plants can survive for 2 to 4 years, propagate vegetatively, and have tap-like roots that grow in the top 60 cm of soil, or even as deep as 120 cm, with side roots growing near the surface [
4]. The root system is well-established, heterogeneous in distribution, and covers a large surface area, particularly in the top 30 cm of soil [
13]. Morphological variation in
Lotus corniculatus cultivars includes upright, semi-erect, and prostrate growth forms, with upright types reaching heights of up to 90 cm [
3,
4,
14]. Temperature plays a key role in stem elongation, with optimal growth observed between 16 and 26 °C [
12]. Leaf morphology typically includes five leaflets arranged alternately, with size and petiole length significantly reduced under heat and drought stress [
9]. Such variations in above-ground traits are critical for evaluating adaptability under field conditions [
12]. The inflorescence of
Lotus corniculatus is bisexual and arranged in umbel-like cymes, with bright yellow flowers tinged with reddish-orange at the tips. These develop in a helical pattern at the apex of the stem and bloom from late spring to summer. Pollination is primarily mediated by bees [
3,
4,
8,
15]. Flowers are typically small (ca. 1 cm), pedicellate, and synsepalous [
16]. Mature seed pods are brown and have an indeterminate ripening period, typically described as late summer to autumn, containing roughly 380,000 seeds per half a kilogram. The pods consist of two halves twisted together spirally, which open to release the seeds into their surroundings (pod shattering).
Varying rates of swelling or shrinking in the pericarp, caused by rapid shifts from humid weather to high temperatures and low humidity, can result in pod shattering—a process through which plants disperse their seeds when the suitable conditions for germination are met. If the seeds are to be cultivated, pod dehiscence leads to a reduced harvest [
8,
15,
17]. Sudden shifts from humid to dry weather can adversely impact seed yield, potentially reducing it to as little as 50 kg/ha. Potential yields of bird’s-foot trefoil could even reach as high as 600 kg/ha if seed pod shattering did not occur [
8]. It is reported that
L. corniculatus yields approximately 8000–10,000 kg of dry matter per hectare, a quantity that is around 50 to 80% of alfalfa yields [
6].
The native species is reported to possess diploid populations, but is generally regarded as an allotetraploid (2n = 24) and is autoincompatible. It is theorized to have originated from the hybridization of diploid species such as
L. tenuis or
L. alpinus as the female parent, with
L. uliginosus serving as the male parent, followed by chromosome doubling. Alternatively, it may have arisen due to scenarios involving polyploidy, mutation, parthenogenesis, or artificial selection by ancient civilizations—since tetraploids might have been perceived as producing more abundantly—or potentially from multiple origins in Europe, Asia, or North Africa, with varying genetic mechanisms present in different regions. According to a study published in 1941 [
18] by Dawso et al., the authors found evidence of cyanogenic glucosides in
L. corniculatus, which has been later verified and further detailed in multiple works [
14,
19,
20,
21,
22,
23,
24,
25]. The production of these glucosides is influenced by the plant’s genotype, whether it is cyanogenic or acyanogenic, as well as by the plant’s maturity [
23]. The production of hydrogen cyanide, or prussic acid, through cyanogenesis in plants, may serve as a self-defense mechanism intended to deter herbivores from consuming them [
26,
27]. Bird’s-foot trefoil’s usefulness as livestock feed is due to its high feeding value, having a high protein content. The main organic acid it contains is lactic acid, which leads to improved hay conservation. A study by Cosman et al. [
28] suggests the nutritional value of
L. corniculatus hay obtained from mature plants in their third year of vegetation: total humidity hovers around 10–20%, fat 2–3%, cellulose 25–31%, ash 34–47%, protein 13–20%, of which digestible protein is present from 77 to 126 g/kg. The hay also contains calcium, potassium, phosphorus, tannins, and carotene, 54–113 mg/kg, which characterizes it as “high quality”—the standard for first-class hay classification based on carotene in the Republic of Moldova is 30 mg/kg. Bioactive components present in the plant’s different parts include flavonoids like kaempferol, quercetin, isorhamnetin, formononetin, biochanin A, demethylvestitol, catechin, and their derivatives [
29]. Its non-bloating property is due to the presence of the water-insoluble condensed tannins—also known as proanthocyanidins, flavonoid polymers—in a moderate concentration, as these reduce the methane or ammonia emissions originating from protein fermentation and even provide anthelminthic activity [
4,
6]. The compounds are released from the plant’s tissue through chewing and form insoluble complexes with the proteins present [
30]. These complexes are stable within a pH range of 3.5 to 7.0 and dissociate outside this range. Because of these complexes, proteins are not degraded in the rumen and are absorbed in greater quantities in the subsequent part of the ruminant’s digestive tract [
12]. The content of condensed tannins in
L. corniculatus is influenced by the temperature and soil moisture levels. Anuraga et al., 1993 [
12], reported that bird’s-foot trefoil exhibited a higher level of these tannins at lower temperatures (10–14 °C) compared to big trefoil (
L. pedunculatus Cav.).
However, low temperatures combined with the stress caused by unusually low moisture levels (dry periods) reduced tannin contents [
12]. Row spacing can have a significant impact on yield when it comes to harvesting
L. corniculatus seeds. In a study by Pankiw et al. (1977) [
31], a narrow spacing of 15 cm yielded the highest overall seed count in the three years the fields were harvested, at an average of 537 kg/ha. The seeding rates also influenced the harvests, with higher numbers (9.0 kg/ha sown) yielding more abundant results (456 kg/ha). Weed competition was more intense in less crowded rows, as spacing of 60–75 cm with lower seeding rates resulted in vigorous weed growth that interfered with harvests and diminished the yield. In contrast, row spacings of 15–30 cm with higher seeding rates were noted to be virtually weed-free and productive.
Additionally, the studies by Crespo and Gallego (2022) examine vegetative and reproductive traits, including pods per square meter, pod weight (g/square meter), average pod length (mm), average pod width (mm), average pod thickness (mm), average seeds per pod, and flowers per square meter, highlighting the influence of pedoclimatic conditions as well as the technology behind the externalization of these traits [
32]. In the breeding of fodder legumes, unlike other allogamous species, work is being conducted on the creation of synthetic varieties. These consist of several phenotypically similar components that are genetically distinct to maximize the expression of heterosis, both phenotypic (production) and adaptive. The synthetic variety is an artificial population resulting from sexual multiplication over a specified number of generations of the progeny of a natural multiple cross, involving a certain number of constituents (clones, lines, and families) selected for specific traits.
The collection and investigation of bird’s-foot trefoil (
Lotus corniculatus L.) genotypes from wild flora aligns with the goal of facilitating the identification and conservation of the naturally acquired genetic diversity of this species. This is particularly relevant given that local genotypes from the western regions of Romania exhibit specific adaptations to local growing conditions, such as drought, poor soils, and extreme temperatures [
31]. The relevance of these objectives lies in the sustainable use of native plant resources. Given their adaptation to drought, poor soils, and thermal extremes, local genotypes are essential for breeding programs targeting resilient forage crops in the context of climate change and ecological restoration.
Investigating genotypes from wild flora following their collection and conservation (ex situ—in gene banks, or in situ—in their natural habitats) is a crucial activity not only for breeding purposes, but also for ensuring future food security and adaptability to forthcoming climate shifts [
32,
33,
34]. Moreover, specialized studies have shown that the forest steppe area of western Romania benefits from distinct climatic and edaphic conditions, meaning that the genotypes collected from this region are representative of a unique ecological niche [
35].
In this study, we aimed to (1) collect various wild genotypes of Lotus corniculatus L. from diverse topographical regions of Romania, (2) investigate the externalization of morpho-productive traits and emphasize the interdependence between them in the natural conditions of the Banat Plain, and (3) select the best-performing genotypes for the development of new synthetic varieties.
These objectives align with a sustainability-oriented approach by addressing the need for ecological restoration, soil fertility enhancement, and the development of forage species adapted to harsh environments. By exploring native genetic diversity, this study supports both biodiversity conservation and climate-resilient agriculture [
36].
2. Materials and Methods
2.1. Germplasm Collection
The study’s genetic resources were composed of various wild genotypes of
L. corniculatus, collected from different topographical regions of Romania, specifically the forest steppe area of the western area of the country (
Figure 1). The new genotypes collected were introduced into the collection field, where individual plant studies were conducted, eliminating those with a low degree of adaptability.
Collection areas varied greatly in terms of environmental and soil conditions, ensuring a high degree of variability in the biological material.
The collection of
Lotus corniculatus genotypes was carefully planned both in terms of the plant’s developmental stage and the geographic areas targeted, with the primary aim of preserving the genetic diversity and adaptive traits of local populations. The main method employed was in situ collection, involving the manual extraction of soil monoliths and entire plants directly from their natural habitats, to retain the ecological context and local adaptations. In a few cases, seed material was collected using special paper seed bags. All collection sites were georeferenced using GPS to ensure accurate location tracking, and detailed documentation forms were completed, including species identification, geographic coordinates, collection date, and locality name [
37].
2.2. Conservation and Maintenance of Genotypes
Collected genotypes were maintained at Lovrin Agricultural Research and Development Station (LARDS) within the Forage Plant Breeding Department. Throughout the maintenance period, observations under the vegetative and generative periods were made to evaluate various characteristics. The aim of the study was to maintain and continue selecting the most valuable forms to use as potential parents for developing and creating new synthetic varieties. To establish the selection field, the land was plowed to a depth of 25–27 cm, followed by disking and rotary tilling to ensure a uniform seedbed. Fertilizers were applied as follows: 50–70 kg/ha P2O5 during plowing, and 50–70 kg/ha K2O along with 60–70 kg/ha N before transplanting. The field was divided and marked according to a general layout. Young potted plants from each genotype were transplanted at a spacing of 1 m between and within rows, with each plant representing an individual clone. After planting, each clone was watered and compacted to ensure proper root contact with the soil. Irrigation was applied whenever necessary to avoid water stress. Weekly maintenance included motor tilling between rows, manual weeding around clones, and targeted herbicide applications. These conditions allowed for the assessment of genotype adaptability and supported the selection and maintenance of valuable forms.
Following these observations and evaluations, the genotypes underwent mass selection to eliminate non-valuable forms, and the most valuable ones were retained for the creation of the initial material. The initial plant material consisted of 40 genotypes cultivated in a selection field. Of these, 18 genotypes were selected for conservation and maintenance at LARDS, based on their adaptability to the cultivation conditions used.
2.3. Study Design for the Selection of Genotypes Based on Yield Components and Pod Traits
For four years, the selection field was maintained, during which time the biometric fingerprint (bush size and shape, number of shoots, shoot height, proportion of vegetative and generative shoots, bush biomass at each cutting, leaf area, seed weight per plant, and thousand seed weight), resistance to biotic and abiotic factors, and the degree of clonal adaptation to abiotic environmental conditions (soil, water stress, drought, and low temperatures) were assessed, including the evaluation of resistance to specific diseases and pests (frequency and severity of attack). Following this assessment, elite plants—the most valuable genotypes—were chosen over several years. These elite plants were then crossbred with each other, and their offspring were studied in a dedicated field, known as the offspring field, while keeping half of the original seed from the elite plant. One half of the seed from each elite was sown in the offspring field, and the resulting offspring were monitored for two years, before the second selection cycle began. Between 2023 and 2024, after all observations, determinations, and selections, 18 genotypes were chosen as progeny, named from LV-LC-1 to LV-LC-18. Eighteen selected genotypes were examined in a study of morpho-productive traits and their correlations. For each offspring, the following morpho-productive traits were studied throughout the growing season: average pod length (mm), average pod width (mm), average pod thickness (mm), average seeds/pods, flowers/square meter, pod weight g/square meter, and pods per square meter.
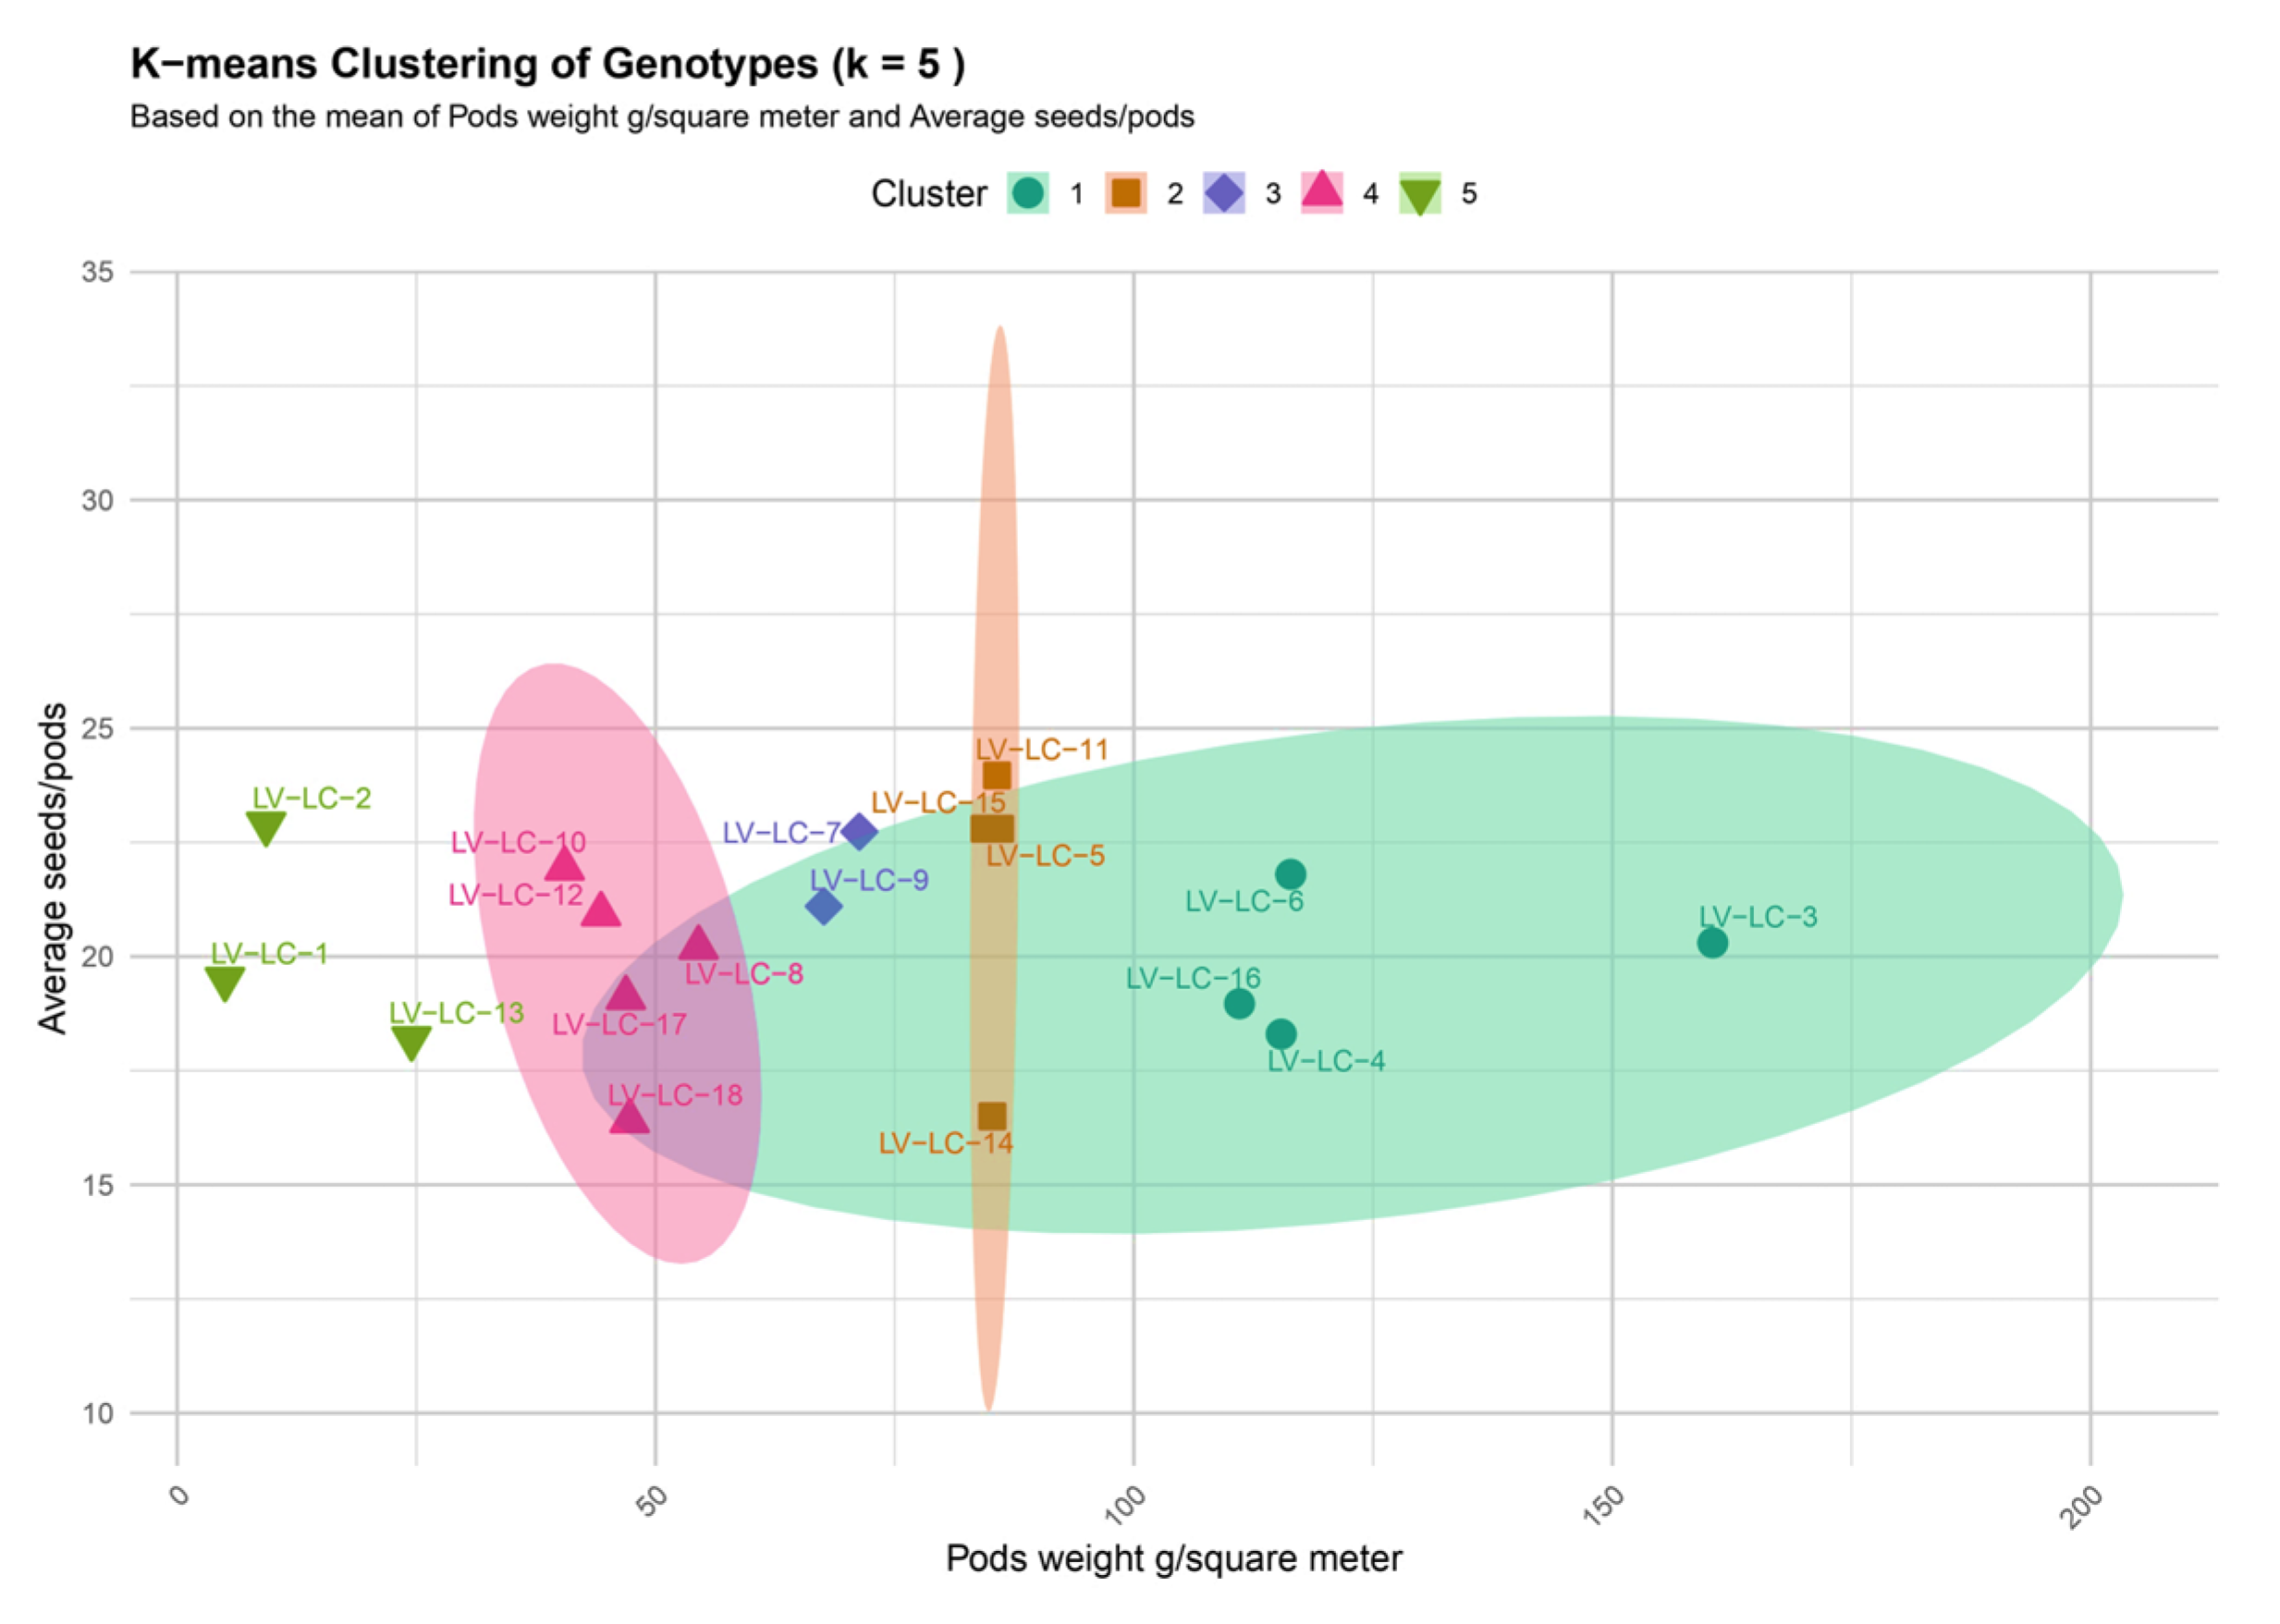
The offspring that demonstrated the best equilibrium of average seeds/pods and pod weight g/square meter were grouped into five clusters:
Cluster I—Genotypes with low productivity;
Cluster II—Genotypes with moderate potential for selection;
Cluster III—Genotypes with moderate productive potential;
Cluster IV—Genotypes with light pods and medium seed numbers;
Cluster V—Genotypes with high productive potential.
Genotypes with the best productive potential were then selected to take part in potential breeding programs aimed at improving yield-related traits in future generations.
2.4. Study Design for the Selection of Genotypes Based on Green Biomass Production Capacity and Forage Quality
Correlations were analyzed among four agro-physiological traits: plant height, number of leaves, green biomass production, and crude protein content. The protein content was determined from dried leaf samples using Near-Infrared Reflectance Spectroscopy (NIR), a rapid and non-destructive analytical technique suitable for the simultaneous evaluation of multiple forage quality parameters.
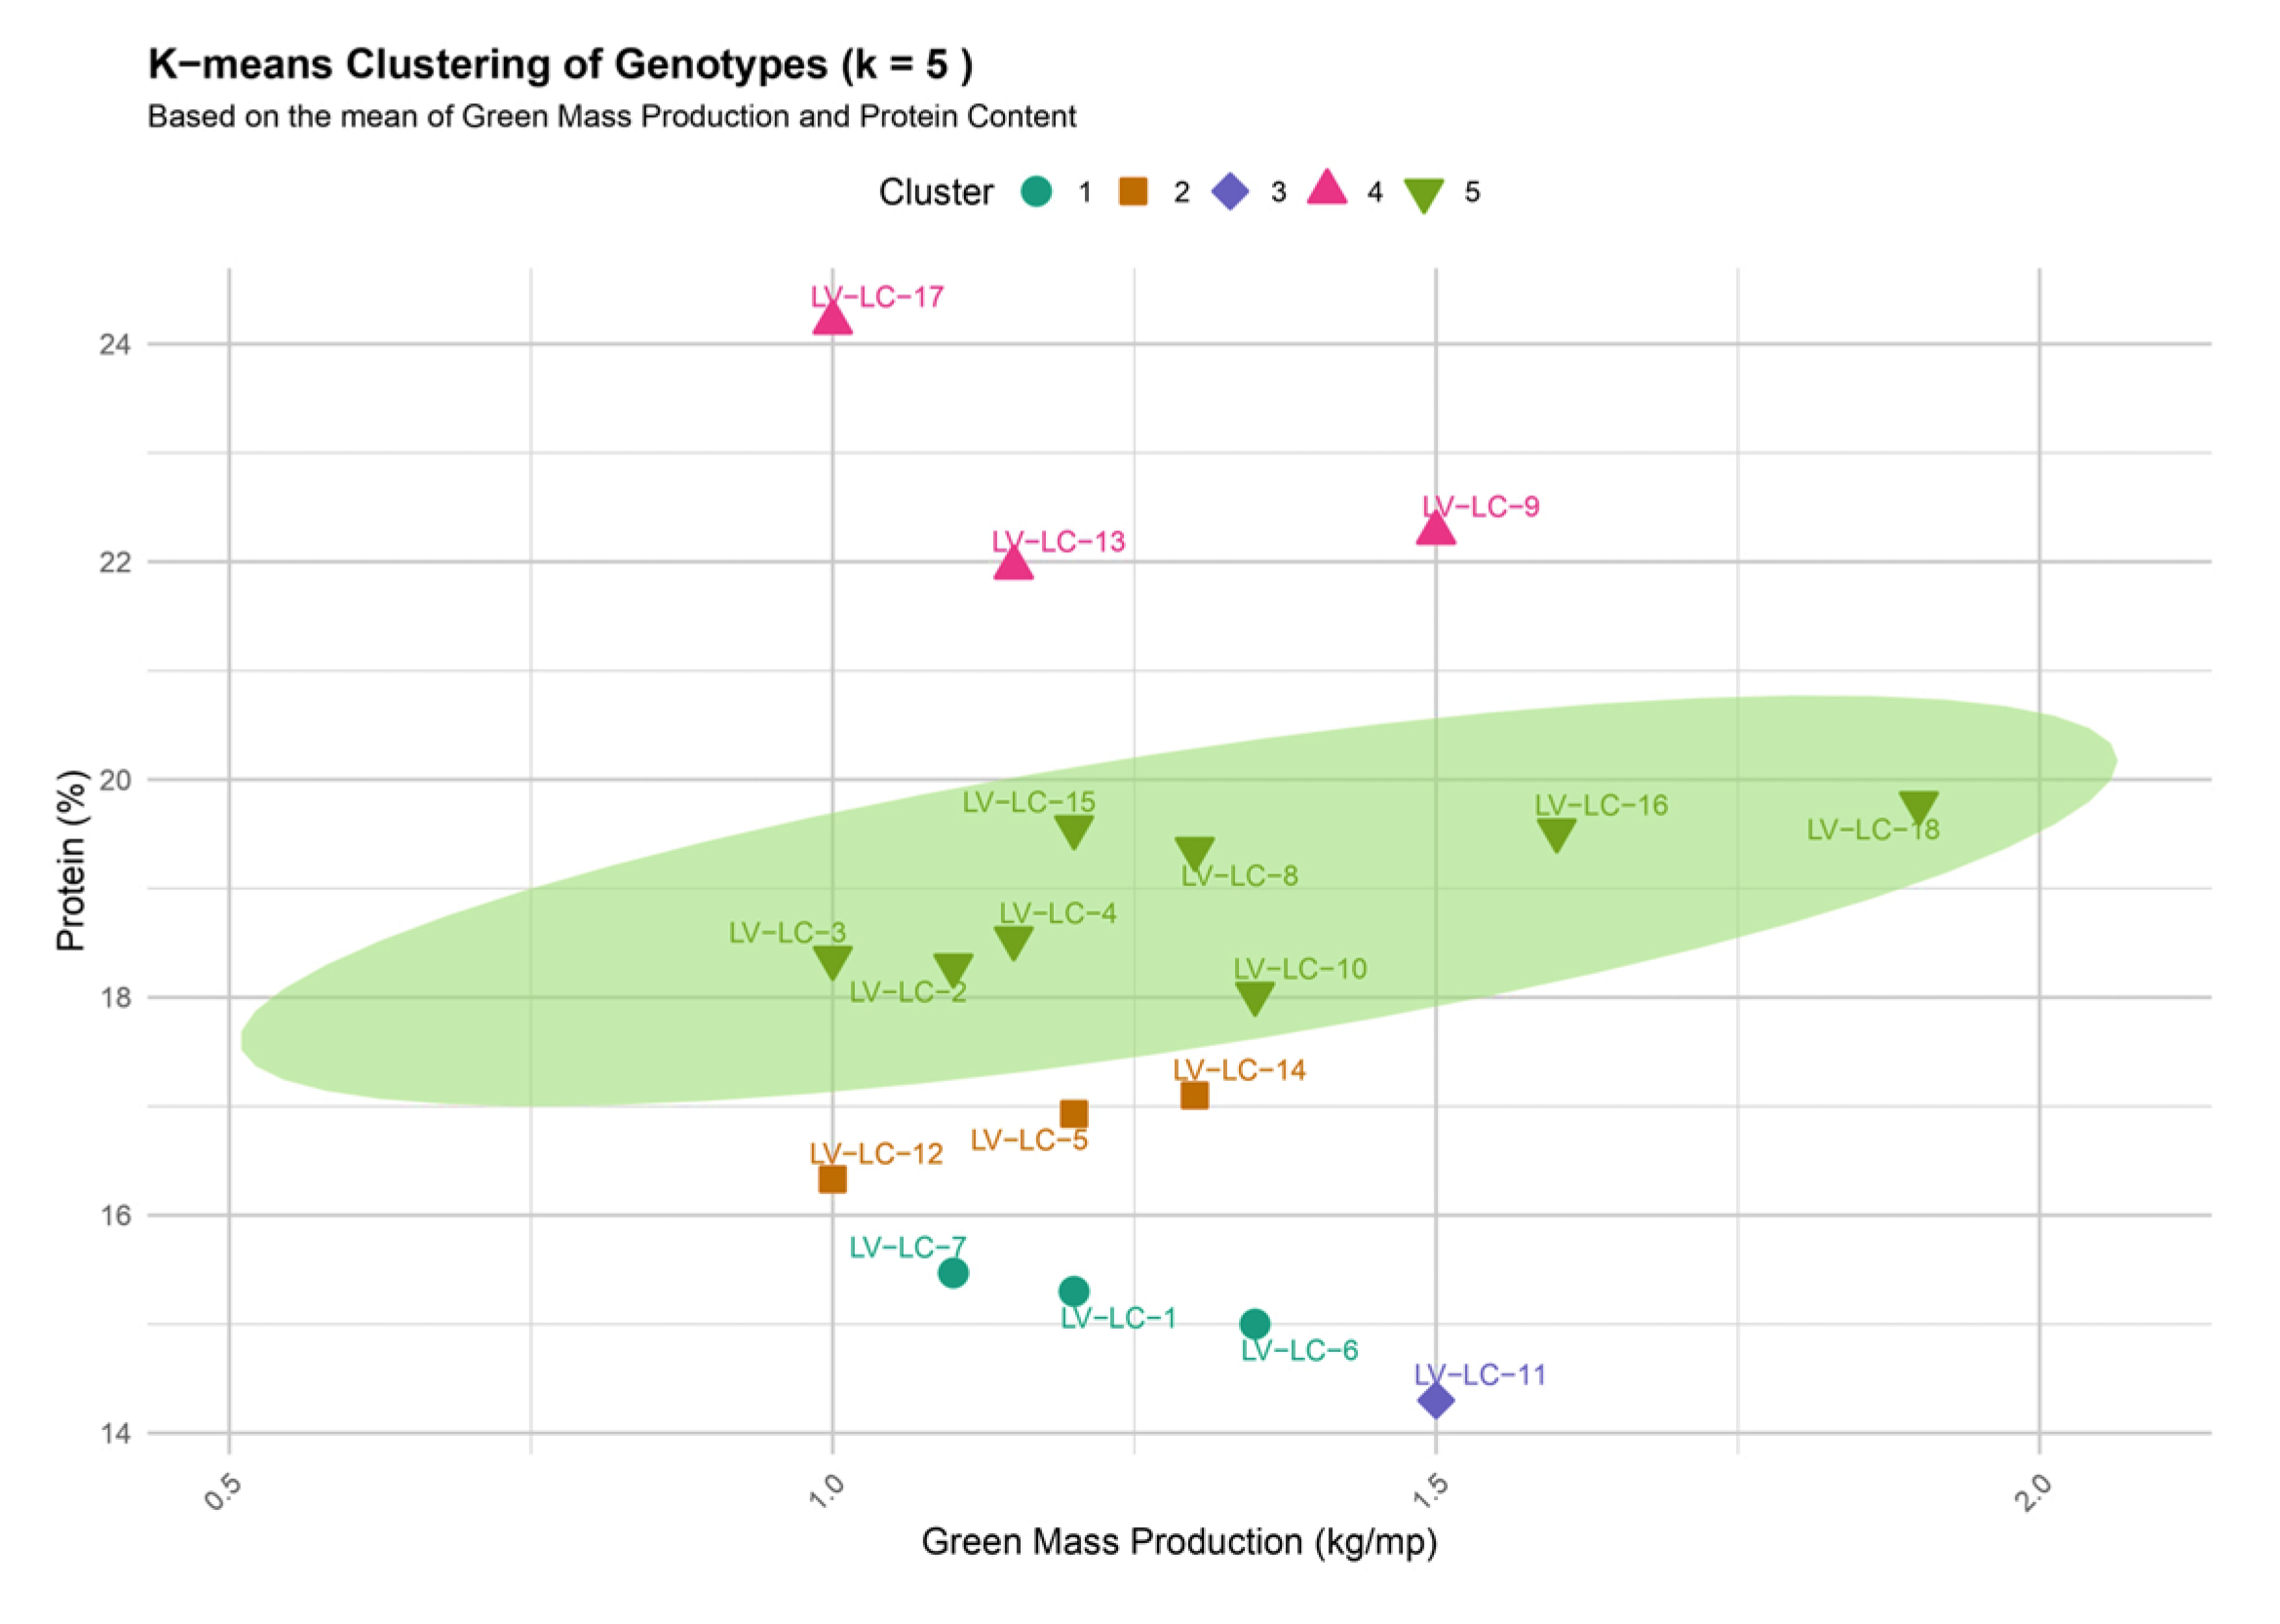
Based on green biomass production (yield potential) and protein content (forage quality), the 18 progeny genotypes (LV-LC-1 to LV-LC-18) were grouped into five clusters:
Cluster I—Genotypes with low green biomass production and low protein content; agronomically weak and unsuitable for breeding;
Cluster II—Genotypes with moderate biomass yield and average protein levels; show intermediate potential for selection;
Cluster III—Genotypes with high biomass production but low protein content; mainly suited for improving yield;
Cluster IV—Genotypes with high protein content but lower biomass accumulation; valuable for enhancing forage quality;
Cluster V—Genotypes combining high green biomass production with moderate to high protein content; identified as promising candidates for breeding programs focused on both productivity and nutritional improvement.
The genotypes from Cluster V, showing the highest combined potential, were selected for further evaluation and advancement in the breeding program.
2.5. Soil Conditions for the Study
Soil from the LARDS breeding field was placed on a typical chernozem soil, weakly gleized, epicalcareous, and medium clayey, which is dominant within the Galaţca Plain (Pesac-Lovrin-Teremia) and considered representative of a significant area of the low Banat Plain in Romania. The soil’s morphological and micromorphological properties indicate a developmental stage typical of chernisol-class soils, with a profile of Ap (horizontal plowing), Atp (horizontal modified by cultivation practices), Am (horizontal intermediate), AC (transition horizon), and Cca (horizon with calcium carbonate accumulation). Based on the analysis of the main chemical properties of the soil, we observe the following: the pH values show a weak alkaline reaction (7.3–8.4) between 20 and 100 cm, a moderately alkaline reaction (8.5–9.0) between 100 and 130 cm, and a strongly alkaline reaction (9.1–9.4) between 130 and 200 cm. Additionally, the soil is rich in calcium in its deeper layers (75–200 cm), has a high humus content on the surface and a low humus content at depth, and contains a normal amount of total nitrogen (0.171–0.120 mg N/100 g soil), reduced phosphorus (0.4–0.6 mg P2O5/100 g soil), and a moderate amount of potassium (9.00–17.5 mg K2O/100 g soil).
2.6. Environmental Conditions for the Study
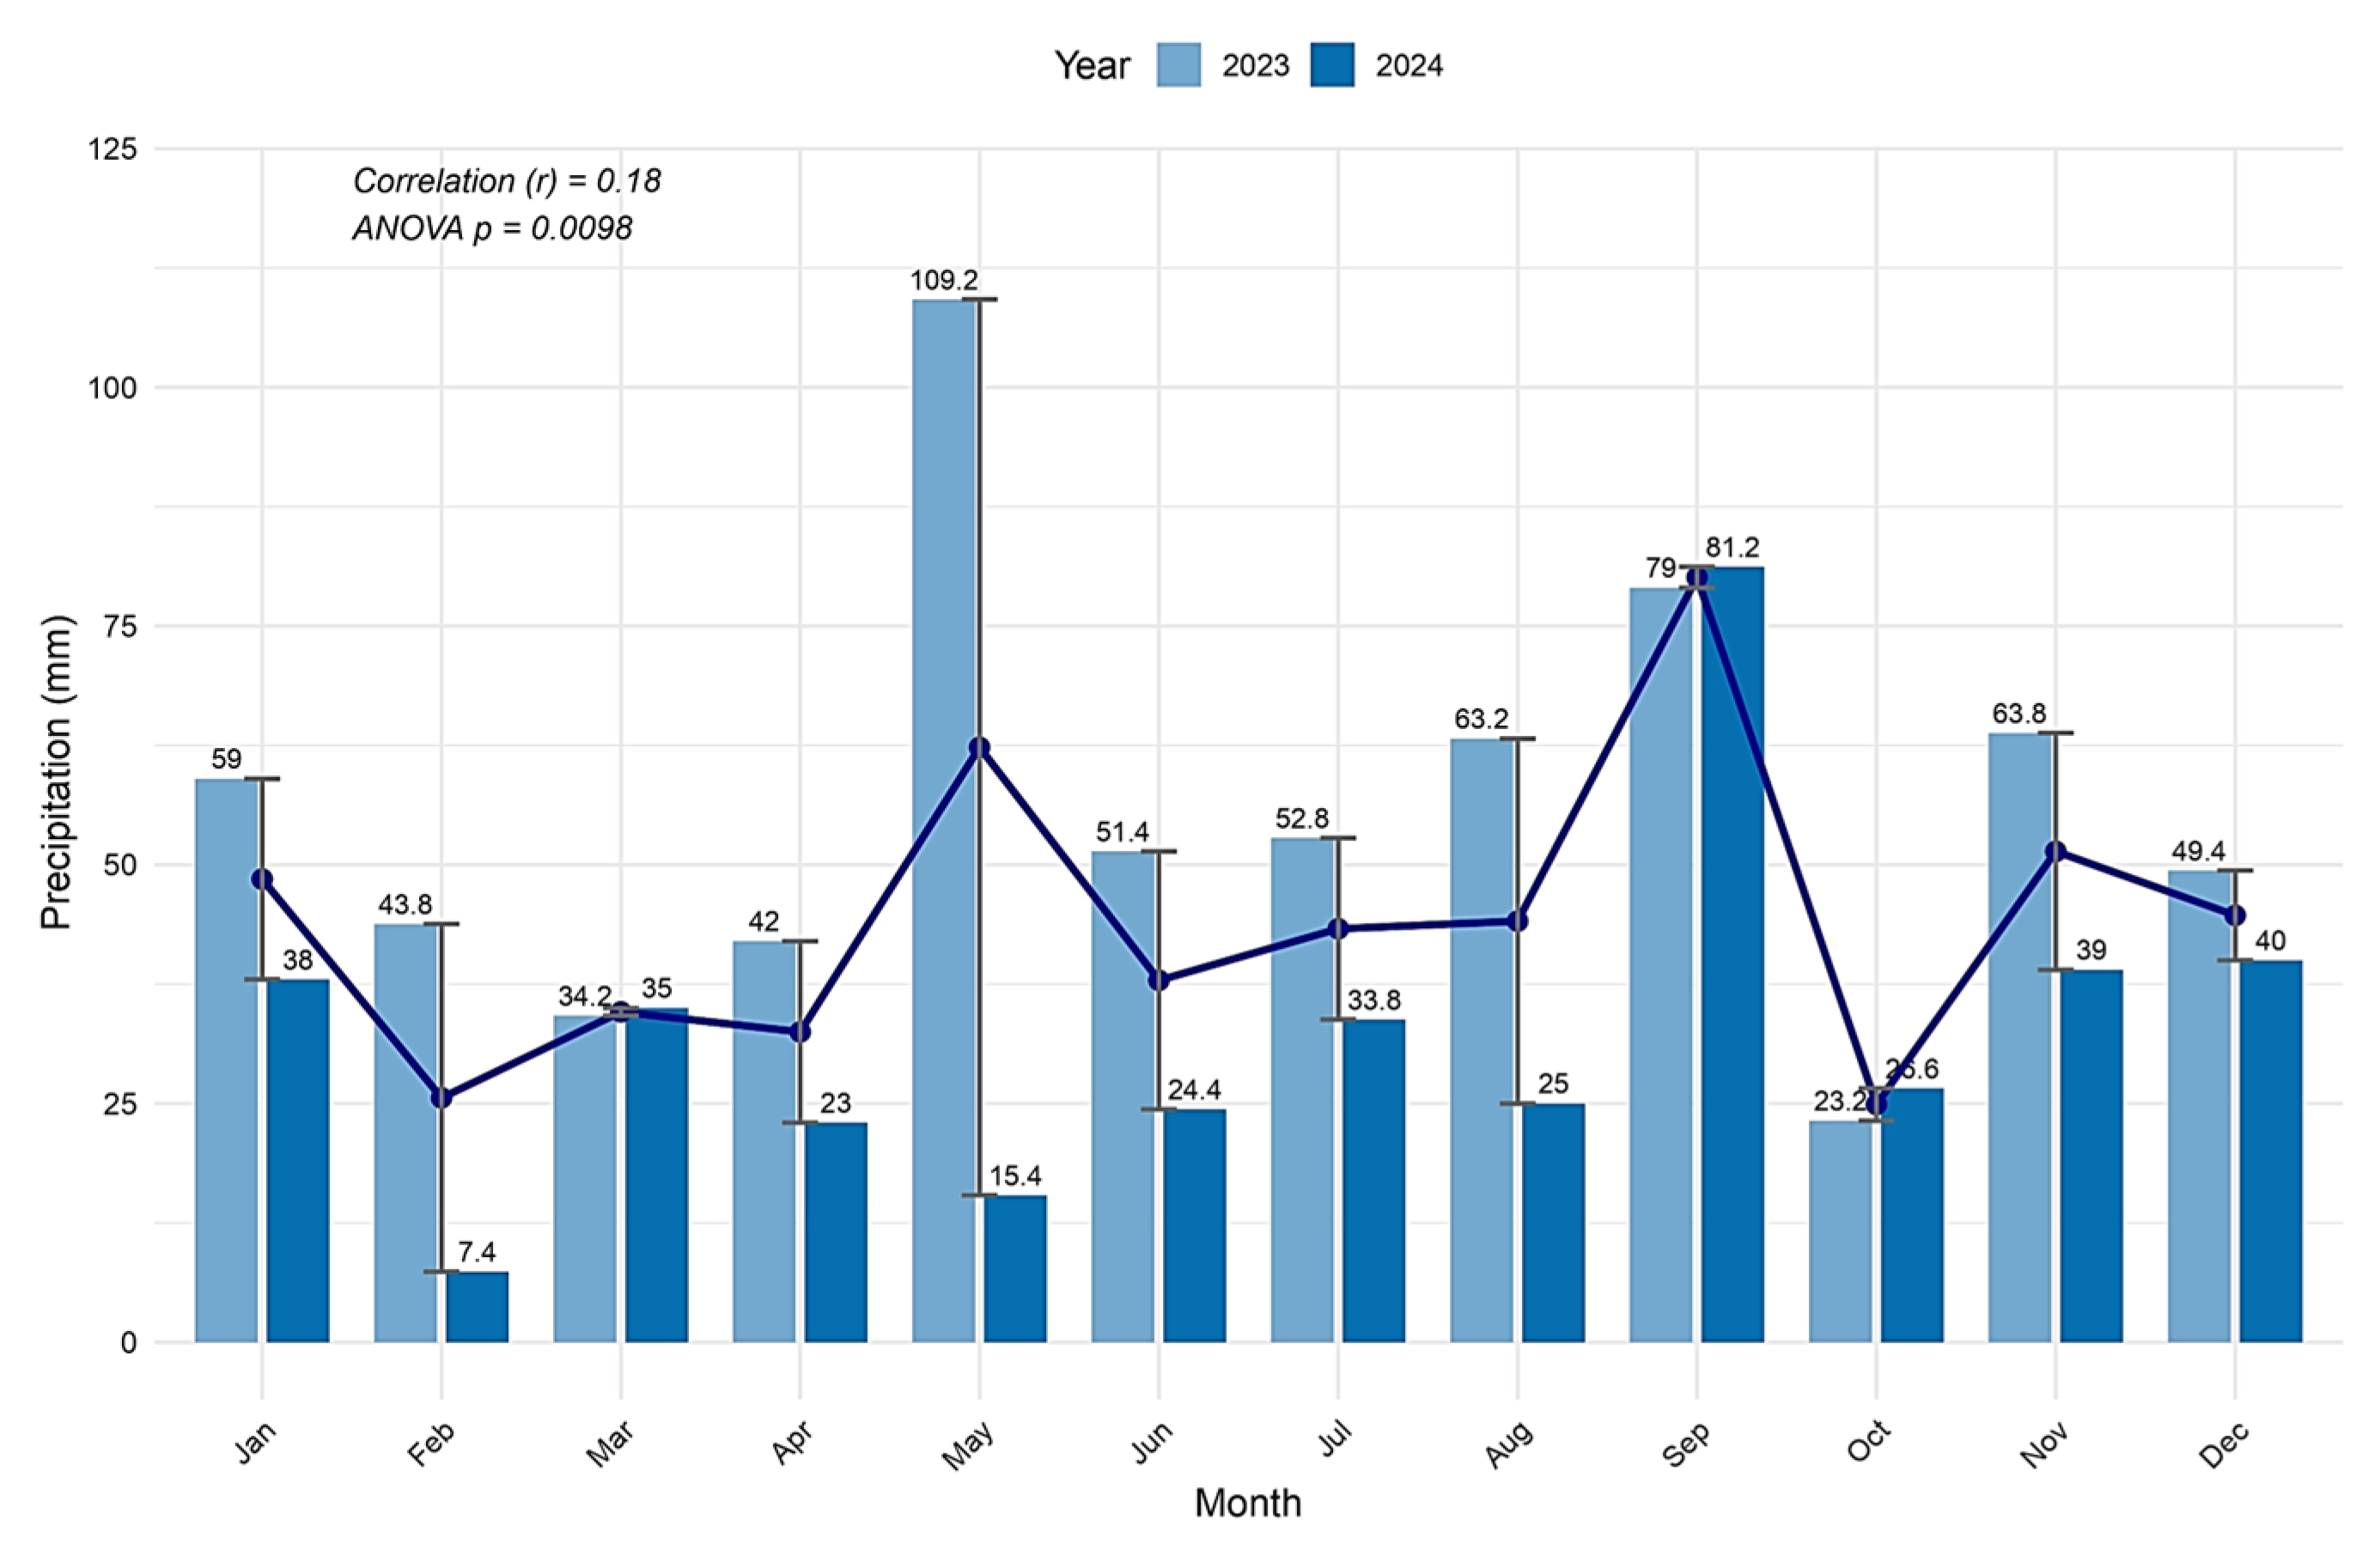
Analysis of the rainfall data from 2023 to 2024 reveals that it was an unusual year overall (
Figure 2). Precipitation levels were significantly below the multi-annual monthly average in most months. The total rainfall for the 2023–2024 agricultural year was 417.4 mm, with a shortfall of 104 mm compared to the multi-annual average.
During the crop growth period (April–August), rainfall totaled 121.6 mm, which is 134.6 mm less than the multi-annual monthly average. Over the 153-day period, there was no rainfall on 123 days, with only 2 days seeing more than 10 mm of precipitation. The remaining 26 days saw rainfall between 1 and 10 mm, and 12 days saw less than 1 mm of rainfall.
With an average annual temperature of 14.6 °C, the season was 3.6 °C warmer than the 70-year multi-annual average of 10.9 °C (
Figure 3). Temperatures consistently exceeded the multi-annual average throughout the crop’s growing period, with significant atmospheric heat also being recorded. The largest departures from the average occurred between February and July, with positive deviations of +7 °C in February, +4.3 °C in March, +3.1 °C in April, +3.8 °C in June, and +4.6 °C in July.
2.7. Statistical Analyses Used
All statistical analyses were conducted to assess genotypic variability, identify trait associations, and support selection strategies in Lotus corniculatus L. breeding. For the K-means clustering analysis, the number of clusters was set to k = 5. This choice was empirically determined after evaluating different values of k and was guided by the biological and agronomic interpretability of the resulting groups. The decision was further supported by Principal Component Analysis (PCA) and hierarchical clustering, which revealed clear differentiation into five distinct clusters based on productivity and quality traits. Analysis of variance (ANOVA) was performed to test for significant differences among genotypes regarding pod traits, yield components, green biomass production, and forage quality. The significance threshold was set at p < 0.05. Means were compared, and significance levels were reported for each trait. Trait associations were evaluated using Pearson correlation coefficients to identify linear relationships between pod morphological traits, green mass yield, and protein content.
All statistical analyses, including ANOVA, correlation matrices, clustering (K-means and hierarchical), and PCA, were conducted using R software v 4.4.2 with packages factoextra, ggplot2, and corrplot.
3. Results
The breeding of perennial legumes in grasslands, such as Lotus corniculatus L., for the development of new varieties, involves a process that begins with the study of a collection of cultivars and continues with the selection of elite lines from progeny fields, from which future synthetic varieties will be formed. Generally, selection applied to allogamous species (such as legumes that also form plant associations in grasslands) results in the development of genotypes that differ from the initial forms (which were not subjected to selection), due to the continuous recombination of genes in each generation.
Following the analyses carried out, we aimed to maintain the genotypes with important qualities in terms of forage potential, biomass yield, and forage quality. Additionally, we monitored the multiplication and fertility capacity by evaluating the number of pods per square meter and their weight.
3.1. Study of Genotypic Variability Based on Yield Components and Pod Traits
The analysis of variance (ANOVA) revealed statistically highly significant differences (p < 0.001) among the studied genotypes for all analyzed pod traits and production parameters.
Genetic variation among the genotypes can be exploited in breeding programs and can influence the selection of the new genotypes (
Table 1). Furthermore, the studied genotypes exhibit substantial morphological diversity. Indeed, this aspect reflects an important genetic resource for selecting superior genotypes and advantageous morphological traits that can contribute to crop stability and productivity.
The K-means clustering analysis (k = 5), based on the average pod weight (g/m
2) and the average number of seeds per pod, revealed five clusters according to their relative importance (
Figure 4).
Cluster I—Includes genotypes LV-LC-1, LV-LC-2, and LV-LC-13. According to the results, this group is characterized by low productivity.
Cluster II—Includes genotypes LV-LC-5, LV-LC-11, LV-LC-14, and LV-LC-15. The genotypes in this group are positioned in the mid-range for pod weight, with an average number of seeds per pod between 20 and 25. With moderate productive potential, they could be proposed for the selection of stable lines.
Cluster III—Includes genotypes LV-LC-7 and LV-LC-9. These show moderate productive potential.
Cluster IV—Includes genotypes LV-LC-8, LV-LC-10, LV-LC-12, LV-LC-17, and LV-LC-18. The genotypes in this group are characterized by low pod weight and an average number of seeds per pod.
Cluster V—Includes genotypes LV-LC-3, LV-LC-4, LV-LC-6, and LV-LC-16. The genotypes in this cluster show high values for pod weight (over 100 g/m2) and a moderate average number of seeds per pod. Moreover, this cluster contains the genotypes with the highest productive potential among those analyzed.
As a result of the conducted analyses, clear differentiation of the genotypes based on productive potential is observed, which facilitates selection and breeding decisions. The findings reveal that the genotypes in Cluster V (LV-LC-3, LV-LC-4, LV-LC-6, and LV-LC-16) present the highest potential for developing high-yielding lines.
3.2. Correlations Among Pods’ Morphological Traits and Productivity Parameters
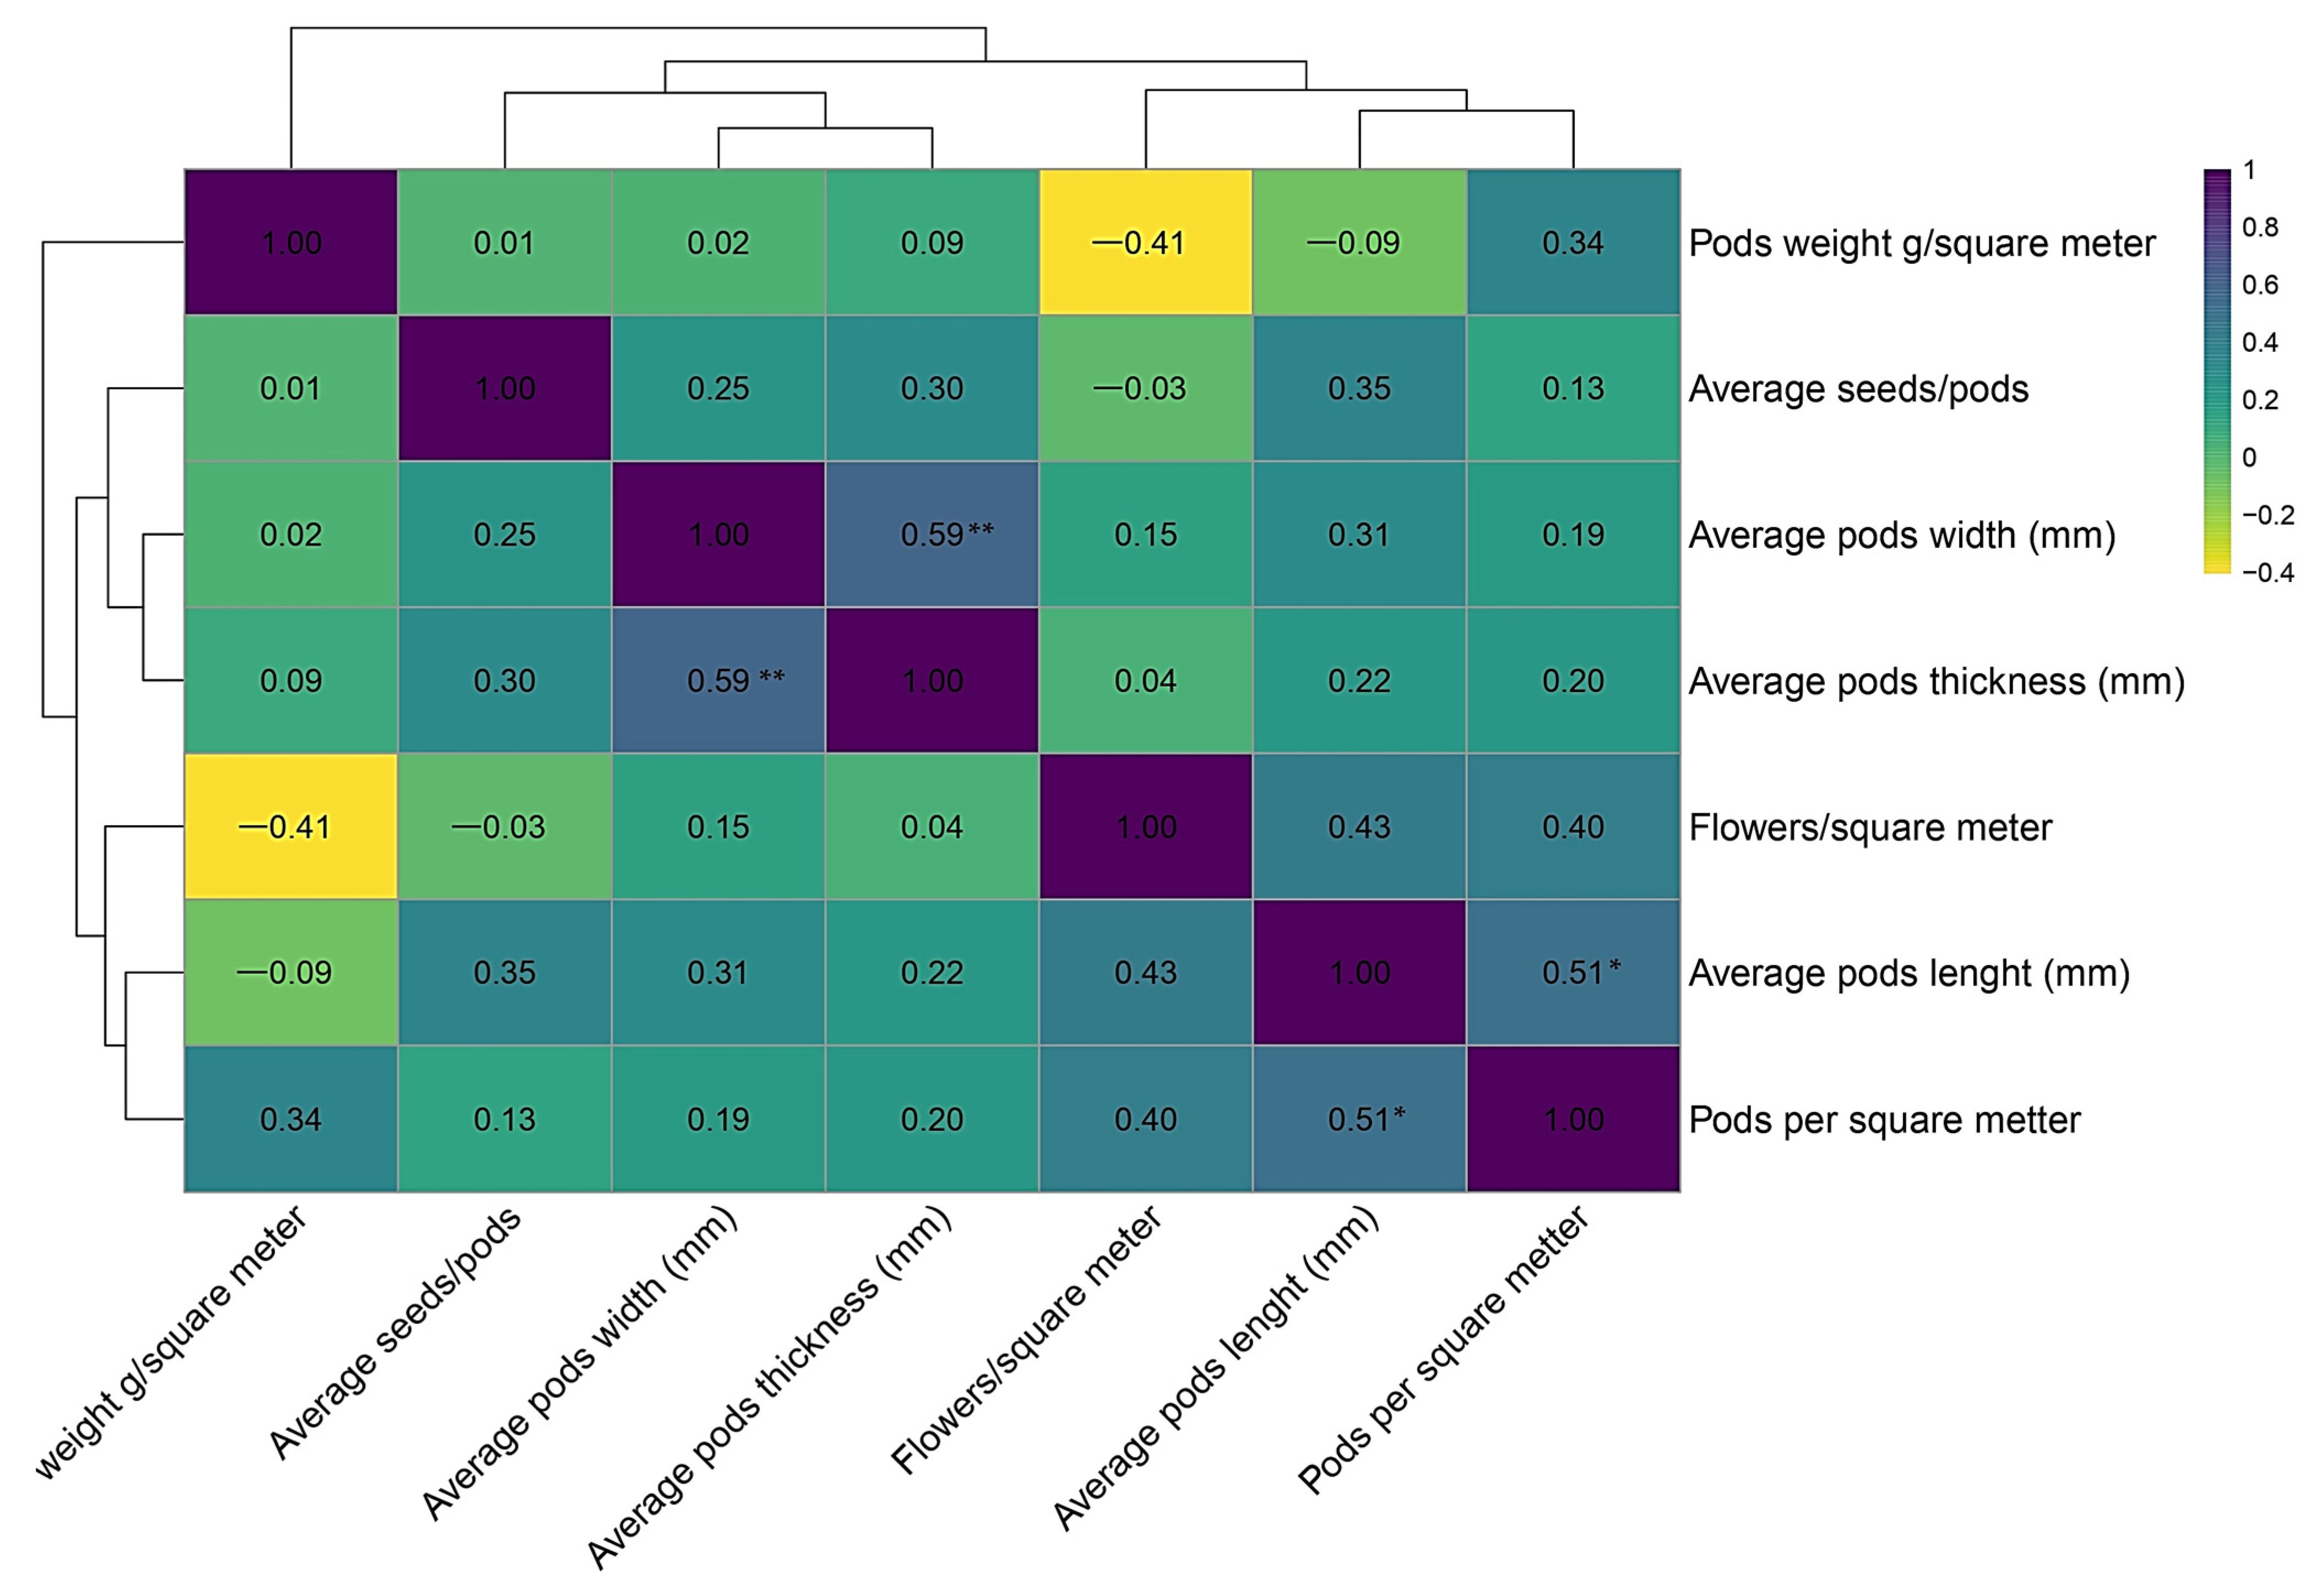
The correlation analysis between the morpho-productive elements of the 18 genotypes analyzed highlights relationships between the morphological traits of the pods and productivity components.
According to the results presented in
Figure 5, a moderate negative correlation is observed between “Pod weight g/square meter” and “Average pod width” (r = −0.41).
In contrast, “Average pod width” and “Average pod thickness” are positively correlated (r = 0.59), indicating a morphological association that can be exploited in selection. The positive correlation between “Average pod length” and “Pods per square meter” (r = 0.51) highlights the importance of pod length in determining their density, and implicitly, productivity.
On the other hand, the weak and non-significant correlations between “Average seeds/pod” and the other variables show that this parameter independently influences productivity. These results emphasize the need for an integrated approach in genotype selection, one that leverages the identified correlations to optimize both productivity and pod quality in breeding programs.
3.3. Study of Genotypic Variability Based on Green Biomass Production Capacity and Forage Quality
The ANOVA revealed statistically significant differences (
p < 0.001) among the studied genotypes for all evaluated characteristics: plant height, number of leaves, green biomass yield, and protein content. These differences confirm the existence of genetic variability among genotypes, indicating high potential for selection and breeding based on the analyzed traits (
Table 2).
The K-means clustering analysis (k = 5), based on the average green biomass yield (kg/m
2) and protein content (%), revealed five distinct clusters (
Figure 6):
Cluster I—Includes genotypes LV-LC-1, LV-LC-6, and LV-LC-7, characterized by low productive potential and reduced protein content. These genotypes are in the category of low agronomic performance;
Cluster II—Includes genotypes LV-LC-5, LV-LC-12, and LV-LC-14, with moderate levels of green biomass production and protein content;
Cluster III—Includes genotype LV-LC-11, which shows higher green biomass yield but low protein content;
Cluster IV—Includes genotypes LV-LC-9, LV-LC-13, and LV-LC-17, remarkable for their high protein content, but with lower green biomass yield, indicating potential for improvement in forage quality;
Cluster V—Includes genotypes LV-LC-2, LV-LC-3, LV-LC-4, LV-LC-8, LV-LC-10, LV-LC-15, LV-LC-16, and LV-LC-18, which combine high green biomass yield with moderate to high protein content, making them the most promising for selection and breeding.
The results obtained highlight a high degree of genetic variability among the analyzed genotypes. Cluster V stands out through its optimal combination of productivity and forage quality, representing a valuable resource for the development of high-performing new lines. At the same time, Cluster IV offers opportunities for improving forage quality through the selection of genotypes with elevated protein content. These findings underscore the importance of integrating multivariate analysis into breeding strategies, facilitating informed selection decisions and optimizing both yield and quality of forage from Lotus corniculatus L.
3.4. Correlations Among Analysis Between Green Mass Production, Protein Content, and Morphological Traits
The correlation analysis presented in
Figure 7 reveals a strong negative relationship between protein content and plant height (r = −0.64). This indicates that taller plants tend to have lower protein content, which may reflect a different allocation of metabolic resources. This negative association is important for selection strategies in breeding programs, as it highlights a trade-off between vegetative yield (plant height) and forage quality, specifically protein content.
Regarding the other variables, the correlations range from weak to moderate. Plant height shows a weak positive correlation (r = 0.25) with the number of leaves on the main stem, indicating a tendency for taller plants to have more leaves, possibly due to enhanced vegetative growth. Additionally, the number of leaves has a weak but positive correlation (r = 0.27) with green biomass yield, suggesting that a higher number of leaves may contribute to increased biomass.
Therefore, the absence of strong correlations between most variables indicates that these traits are partially independently controlled, which offers flexibility in genotype selection for the simultaneous improvement of diverse characteristics.
3.5. Analysis of Ghizdei Genotypes Using PCA Analysis
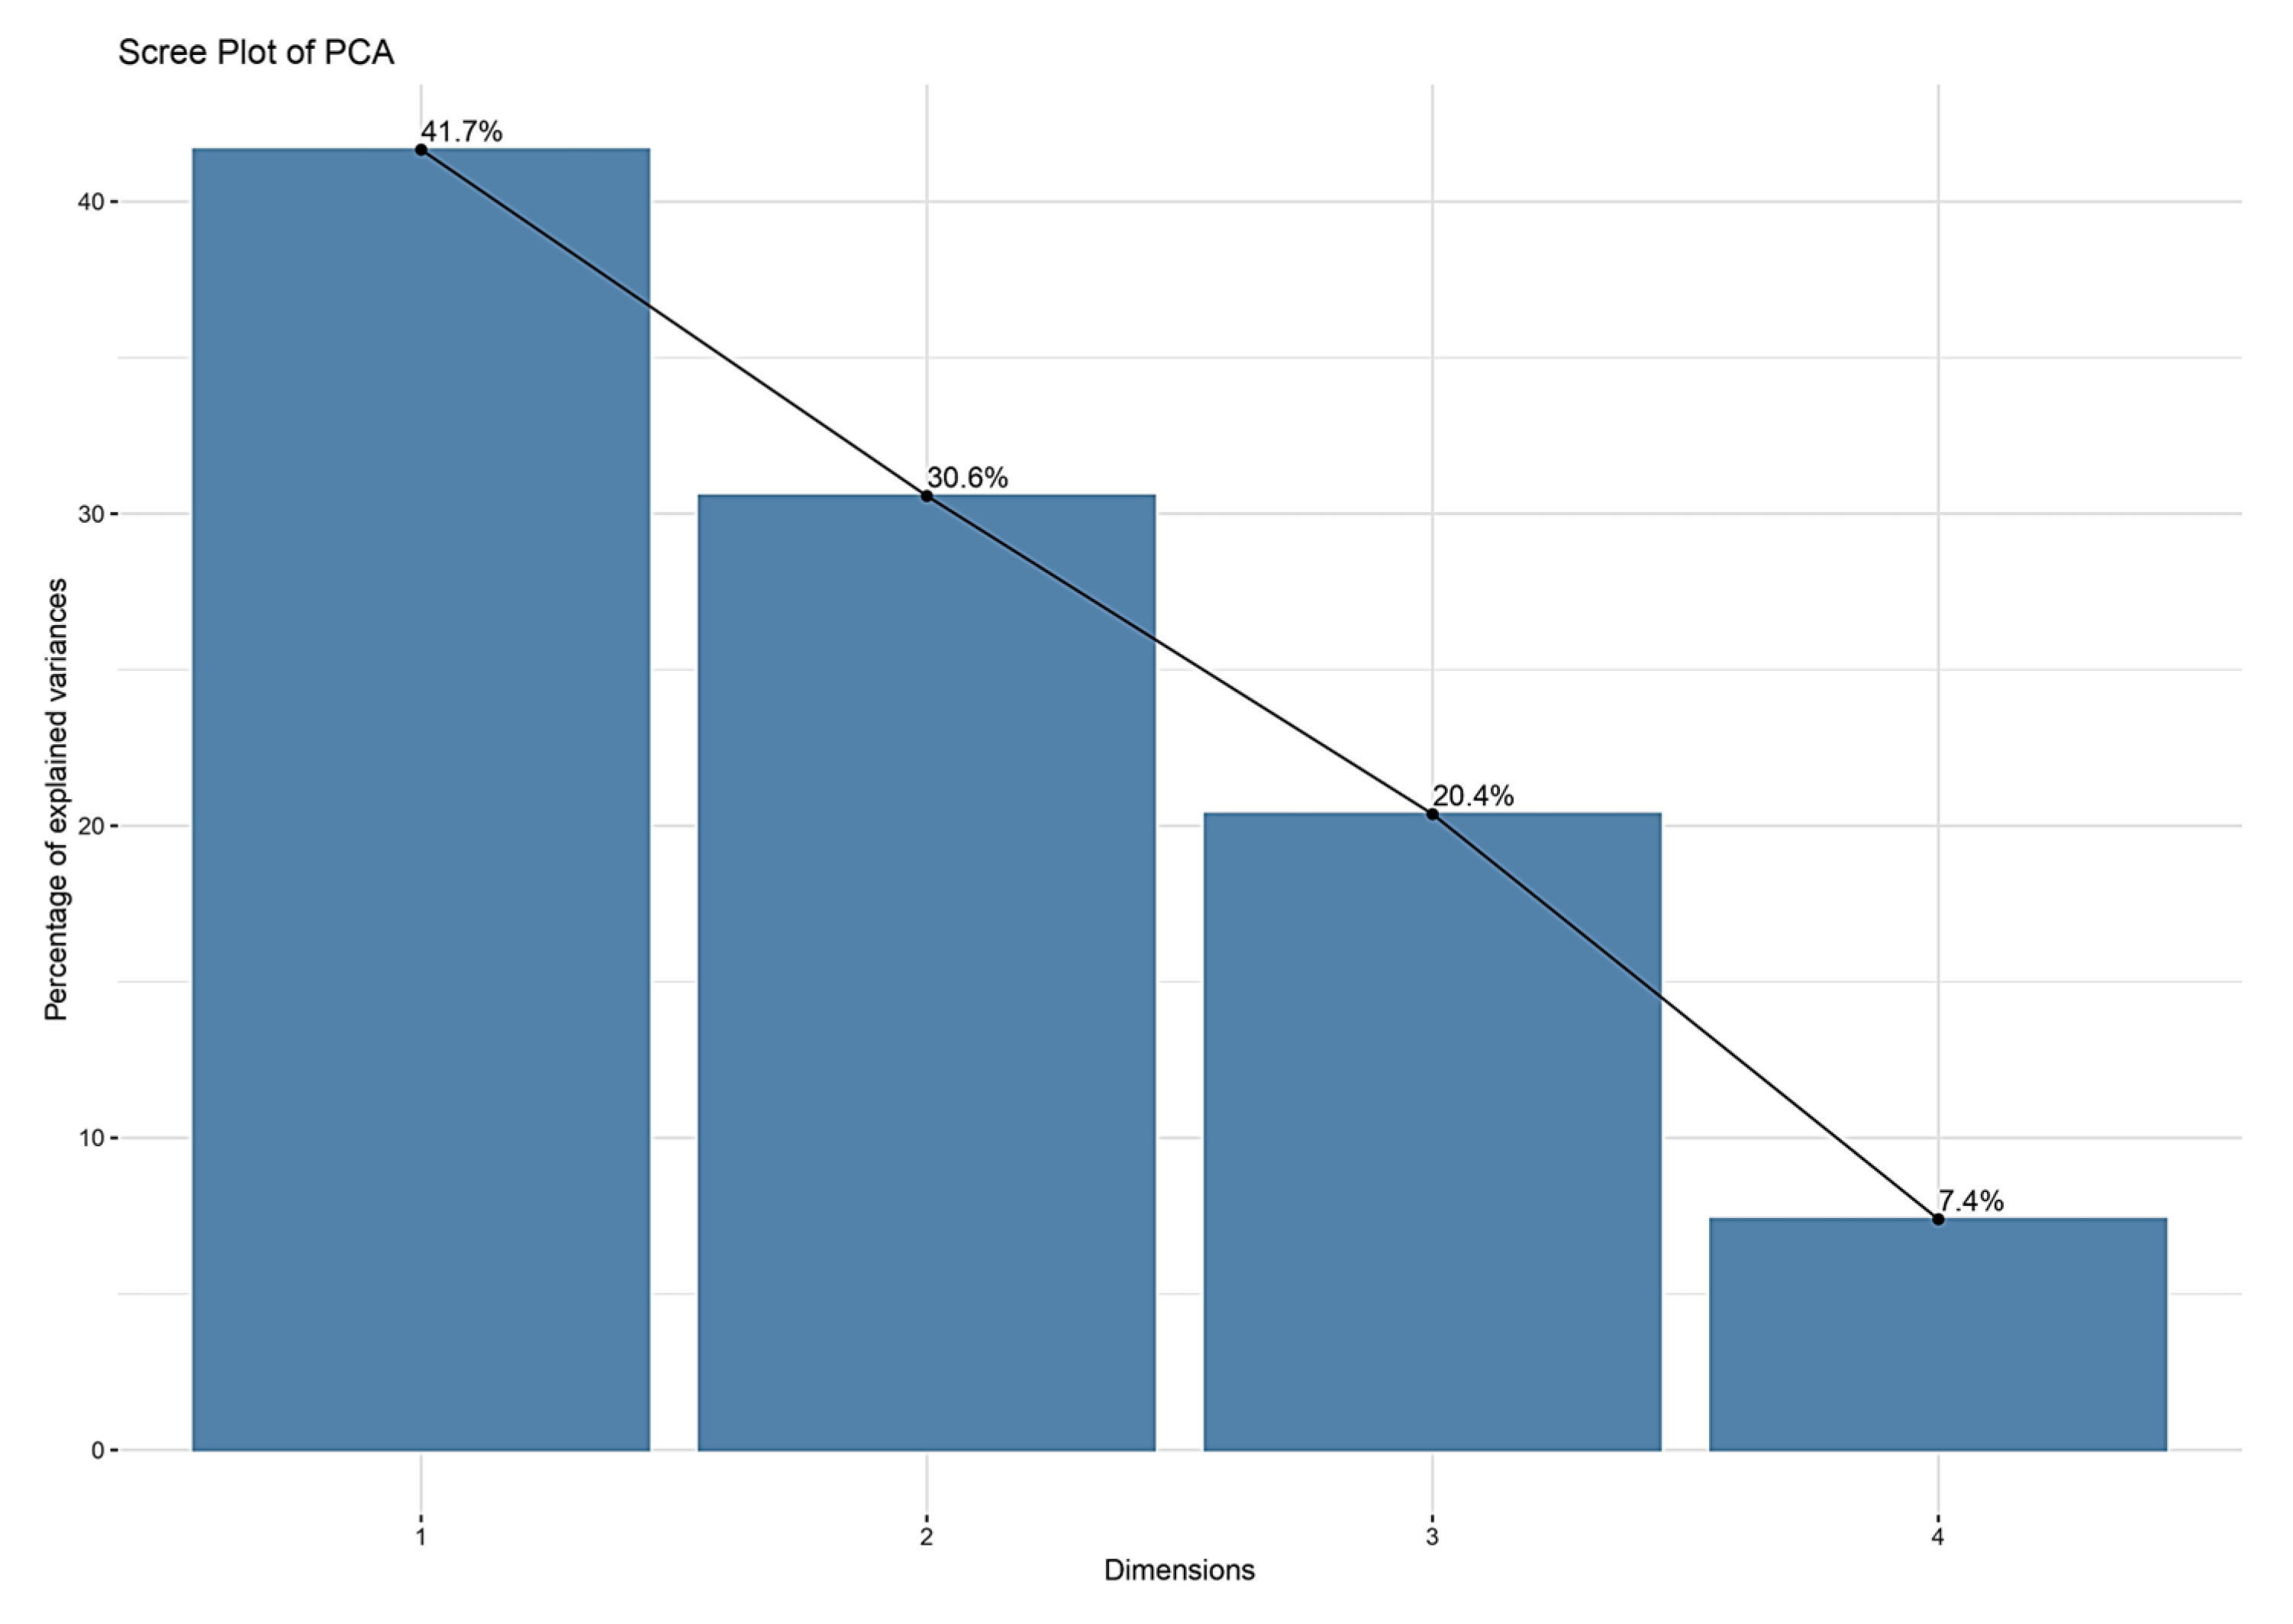
The scree plot shows the proportion of variance explained by each principal component. Usually, PC1 captures the highest variance, followed by PC2. The “elbow” after the first two components indicates that PC1 and PC2 are the most relevant for explaining variability in the dataset, and thus are essential for interpreting the relationships among the analyzed varieties (
Figure 8).
The biplot represents the distribution of 18 genotypes (LV-LC-1 to LV-LC-18) in the space defined by the first two principal components (PC1 and PC2), alongside the vectors representing the variables analyzed (
Figure 9). Genotypes near “Pods per square meter (pods/m
2)” (e.g., LV-LC-1, LV-LC-8, LV-LC-7) have higher pod density, while those close to “Average seeds per pod” and “Green biomass per square meter (kg/m
2)” (e.g., LV-LC-5, LV-LC-15) exhibit higher seed productivity and biomass. Genotypes near “Protein content (%)” (e.g., LV-LC-9, LV-LC-16, LV-LC-17, and LV-LC-18) tend to have higher protein content. This distribution highlights which genotypes are most strongly associated with specific traits, aiding in selection decisions (
Figure 9).
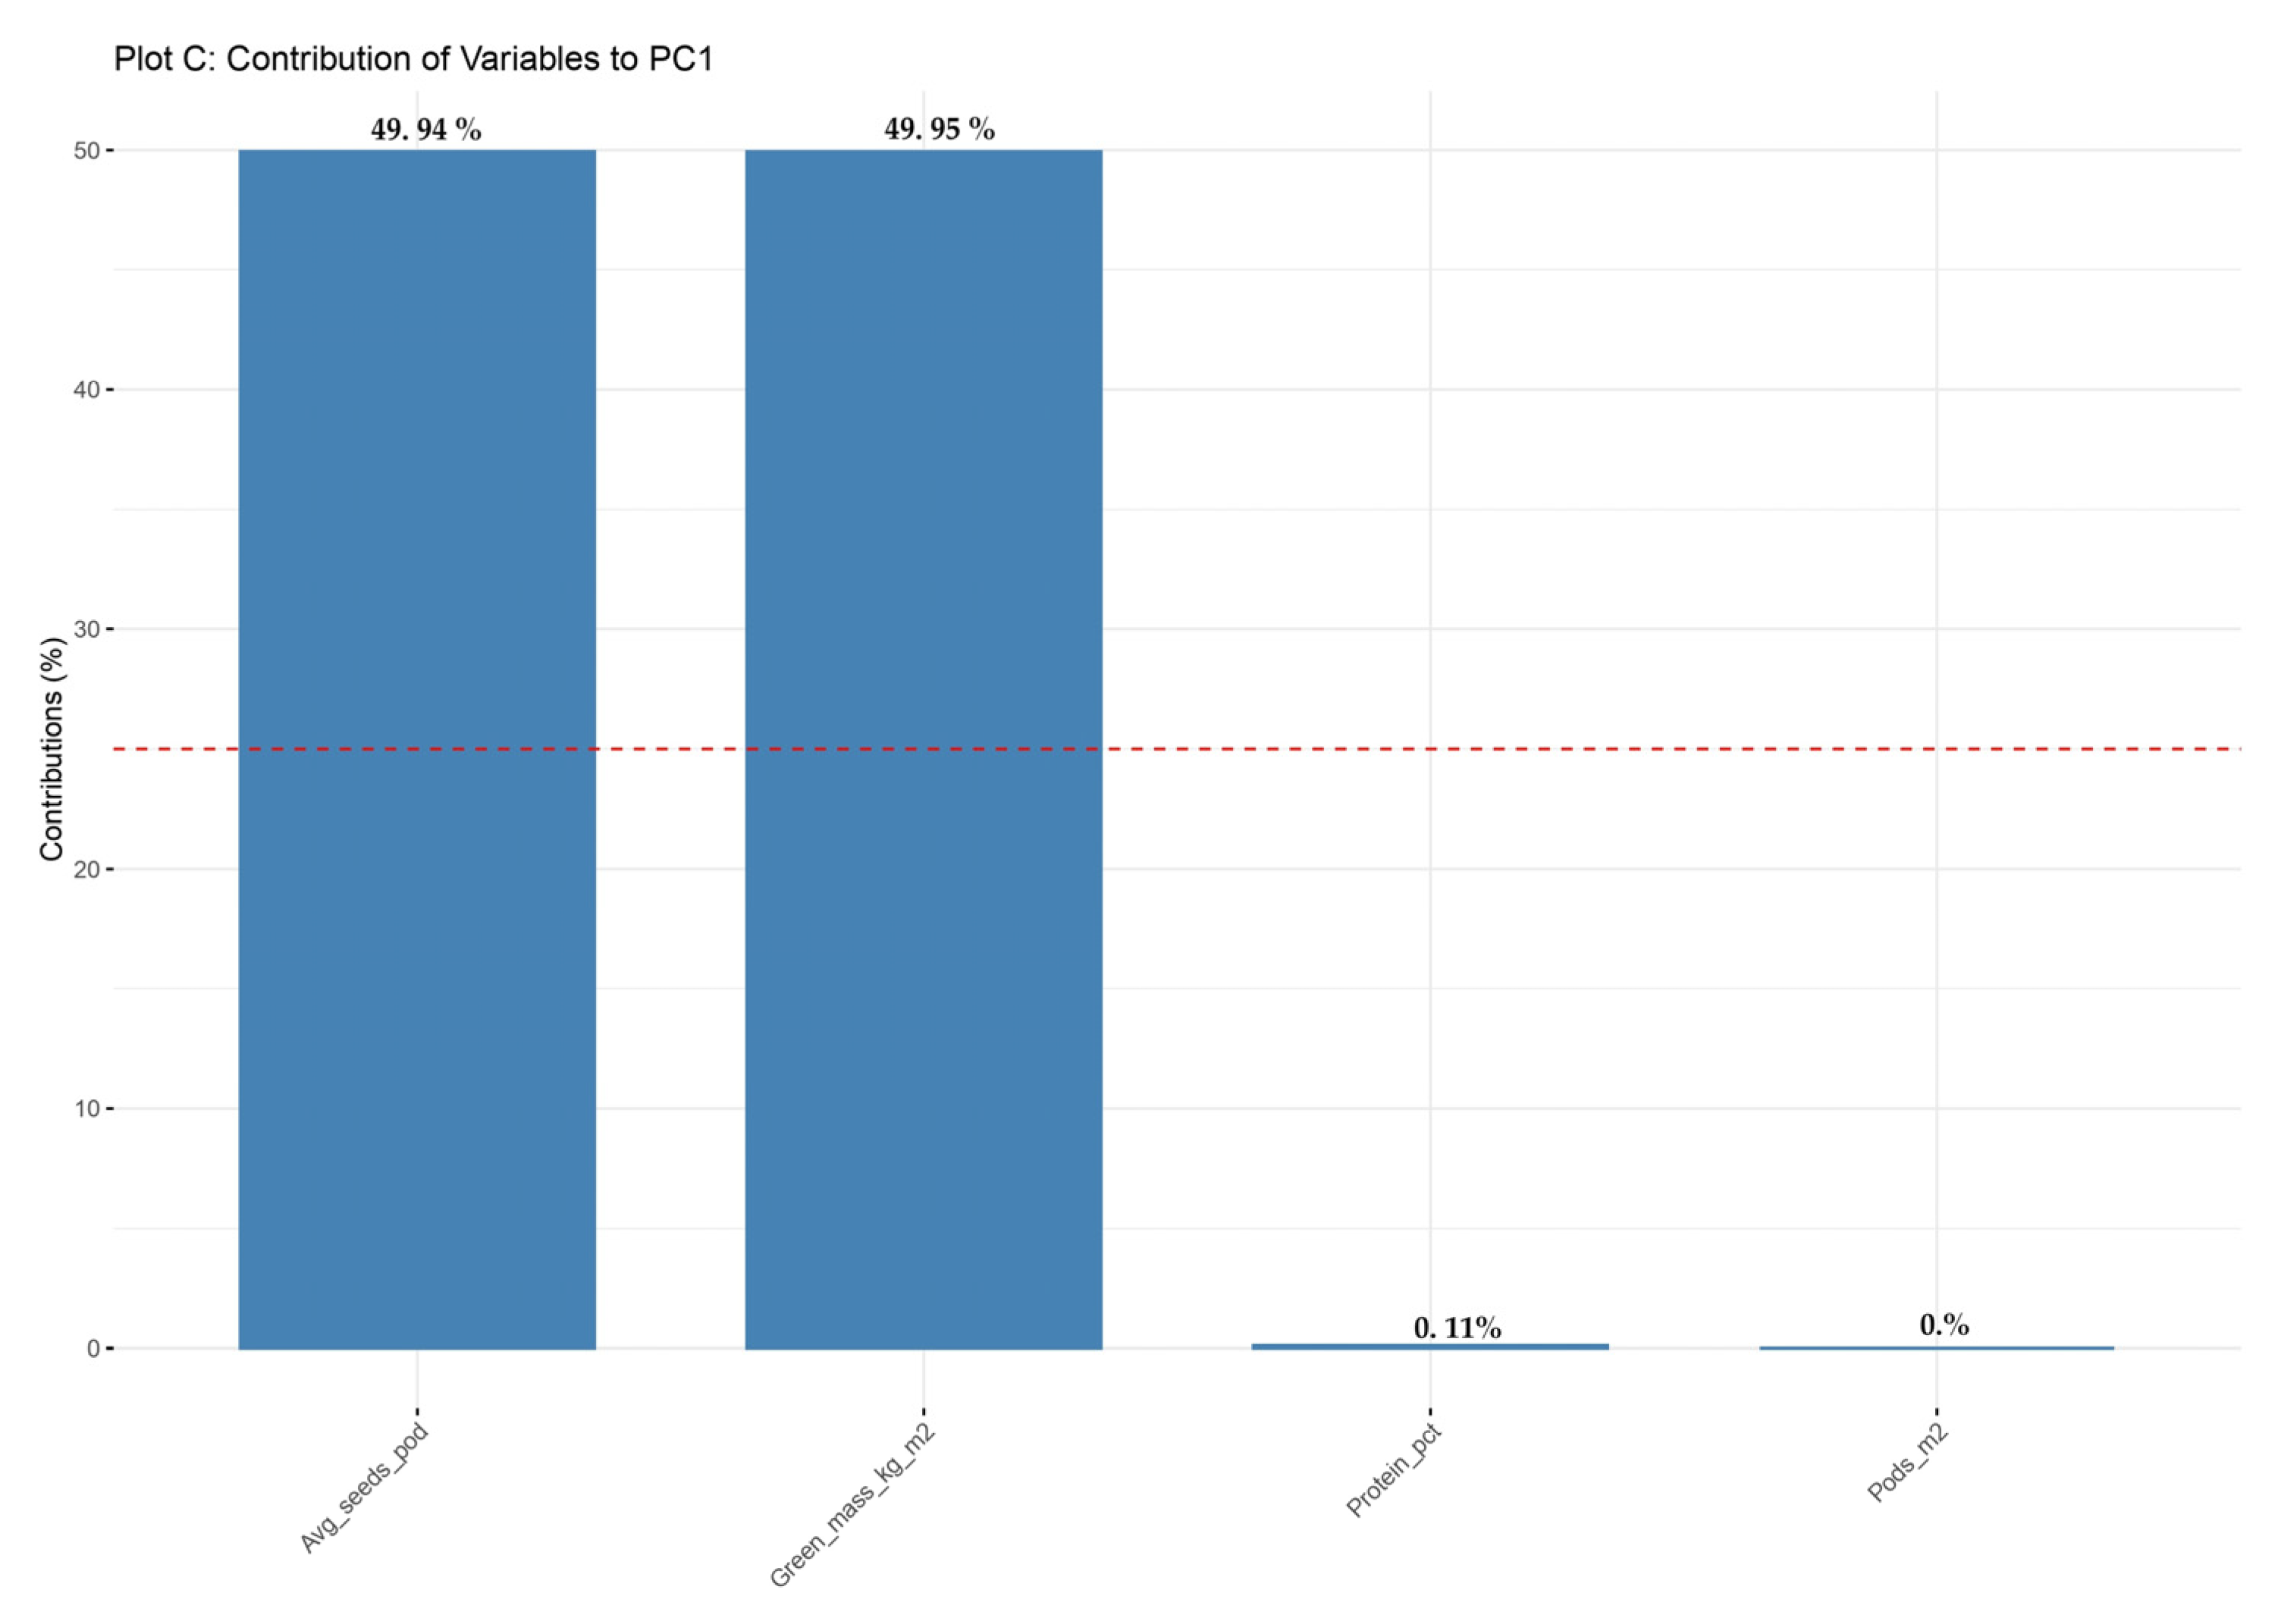
Figure 10 presents the contribution of each agronomic trait to the first principal component (PC1). The most influential traits are the average number of seeds per pod and the green biomass per square meter, each contributing approximately 50% to the total variation captured via PC1. This indicates that PC1 primarily reflects the variability associated with seed productivity and vegetative growth potential. In contrast, the number of pods per square meter and protein content (%) have a minor contribution, suggesting that these traits are less represented in the structure of the first principal component.
Figure 11 shows the contribution of each agronomic trait to the second principal component (PC2). The number of pods per square meter is the dominant contributor, accounting for over 50% of the variation, followed by protein content (%), which contributes approximately 45%. This indicates that PC2 primarily reflects the variability related to pod density and nutritional quality. In contrast, the average number of seeds per pod and green biomass per square meter contribute minimally to PC2, confirming that this component is less influenced by traits associated with overall productivity. Red dashed line represents the median of the phenotypic expression of the traits.
3.6. Hierarchical Clustering of Lotus corniculatus L. Genotypes Based on Agronomic Traits
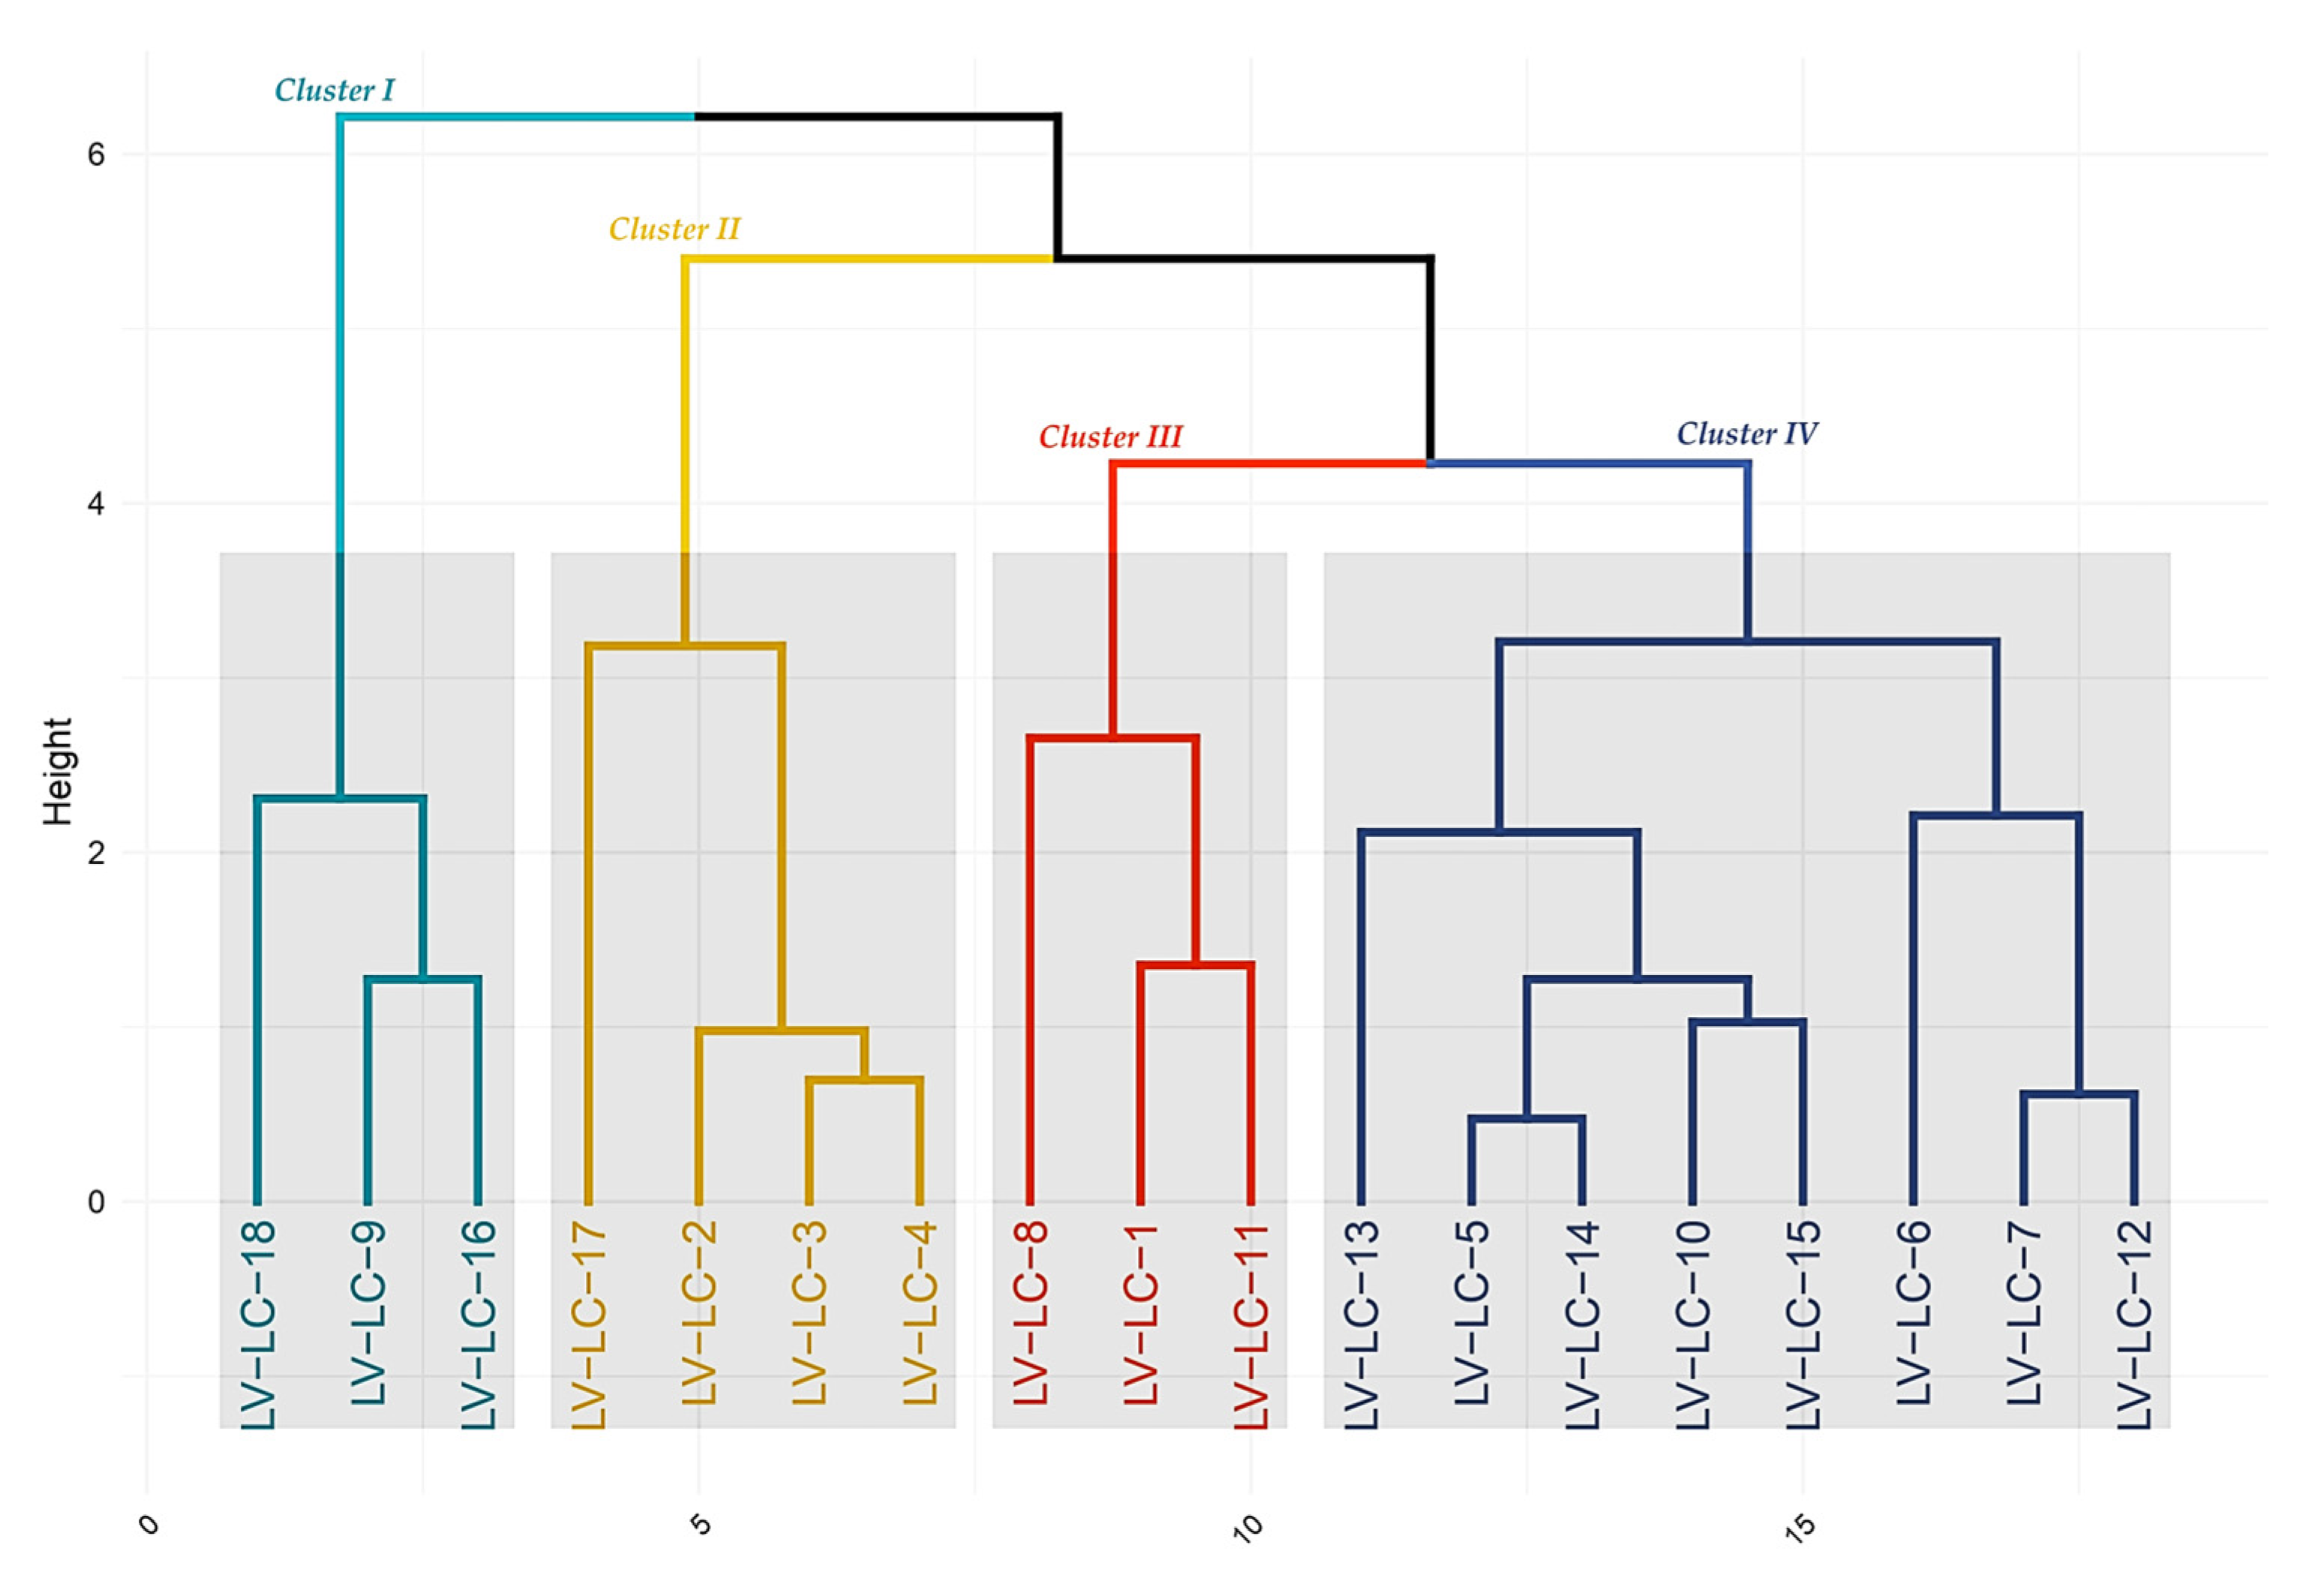
The dendrogram illustrates the hierarchical clustering of the 18 genotypes, highlighting distinct groups that share similar agronomic profiles (
Figure 12).
Cluster I (cyan)—Includes genotypes LV-LC-18, LV-LC-9, and LV-LC-16, characterized by balanced pod density and protein content—potential candidates for high-quality yields.
Cluster II (yellow)—Comprises LV-LC-17, LV-LC-2, LV-LC-3, and LV-LC-4, which show moderate productivity and biomass traits, suggesting adaptability and stability.
Cluster III (orange)—Contains LV-LC-8, LV-LC-1, and LV-LC-11, indicating a strong association with high pod density and possibly superior protein levels—promising selections for breeding programs targeting these traits.
Cluster IV (blue)—The largest cluster, with genotypes LV-LC-13, LV-LC-5, LV-LC-14, LV-LC-10, LV-LC-15, LV-LC-6, LV-LC-7, and LV-LC-12, displays a diverse but related trait profile, offering a valuable pool for multi-trait improvement strategies.
This dendrogram-based analysis reveals clear relationships among genotypes and provides a solid foundation for selecting promising candidates for further agronomic evaluation and breeding efforts.
4. Discussion
The study conducted on the variability of
Lotus corniculatus L. genotypes highlighted the genetic diversity within the 18 genotypes analyzed (LV-LC-1 to LV-LC-18), both from a morphological perspective and in terms of forage quality. Observations made by other authors emphasized the high potential for genetic variability in this species, both in terms of tolerance to abiotic stresses and forage potential [
38,
39].
The correlations identified between morphological traits and productivity traits are essential for understanding how these characteristics contribute to increasing the production capacity of the genotypes and for optimizing the selection process. The study confirms the findings of Striker et al. and Uribarri et al. (2007 and 2011) [
40,
41], according to which morphological traits such as pod length and plant height directly influence regeneration capacity and photosynthetic potential. In our studies, this positive correlation observed between pods’ length and their density (r = 0.51) is consistent with the conclusions of Yildiz et al. (2011) [
42] regarding the importance of these traits in selection for seed production.
Additionally, the strong negative correlation observed between plant height and protein content (r = –0.64) in this study reflects a well-documented physiological trade-off commonly found in forage species. This inverse relationship likely stems from a differential allocation of assimilates, wherein taller genotypes prioritize structural growth and carbon-based biomass accumulation—such as cellulose and lignin—over nitrogen assimilation for protein synthesis. This phenomenon was similarly reported by Alharbi et al. (2025), who observed a comparable trade-off in
Panicum maximum under intensified nutrient regimes, where increased vegetative mass coincided with a decline in crude protein levels [
43].
Such a pattern reinforces the “growth–quality trade-off” hypothesis, which suggests that biomass-oriented genotypes may dilute protein content due to metabolic prioritization (Dhatterwal et al., 2024; Mithöfer & Furch, 2024) [
44,
45]. This mechanism has critical implications in forage breeding, particularly in species like
Lotus corniculatus, where sustainable breeding objectives must balance between productivity and forage quality. In our own findings (
Section 3.4), this physiological antagonism is evident: genotypes with greater height and biomass accumulation (e.g., from
Cluster III) consistently showed reduced crude protein percentages, while those in
Cluster IV had elevated protein levels despite lower yields.
From a breeding standpoint, this trade-off should be leveraged strategically. For instance, in extensive forage systems, high-biomass genotypes may be preferred, while for intensive systems or ruminant nutrition, selections should emphasize protein-rich genotypes with sufficient—but not excessive—vegetative mass. The moderate to high-performing genotypes identified in Cluster V (e.g., LV-LC-3, LV-LC-4, and LV-LC-16) exemplify this compromise, showing stable green biomass yield alongside acceptable protein content. These genotypes represent a valuable foundation for dual-purpose breeding programs targeting both productivity and nutritional improvement.
To better elucidate the underlying interactions among traits, we recommend the implementation of multivariate techniques, such as path analysis or structural equation modeling, to separate direct from indirect effects and support targeted selection. This approach aligns with prior work by Falconer & Mackay (1996) [
46] and Wright (1934) [
47], and has proven effective in other perennial legume breeding programs. It would also complement the PCA-based clustering presented in
Section 3.5, which already reveals independence between key traits—offering flexibility in selecting genotypes with optimal combinations [
48,
49,
50].
Recent studies published in the specialized literature have analyzed the performance of local
Lotus corniculatus genotypes from Central and Eastern Europe, regions currently considered agroecologically similar to Western Romania [
33]. The similarity of these studies lies particularly in the cultivation of this species under low-moisture or water deficit conditions. For instance, Reyes-Díaz et al. (2024) tested four ecotypes of
Lotus corniculatus under moderate water deficit conditions (~85% field capacity) compared to optimal technological regimes [
51]. Among these, ecotype “202700” demonstrated superior drought tolerance, while others showed strong resilience to low winter temperatures. The performance of these ecotypes, when interpreted by Romanian researchers in the context of agroecological similarity, suggests that local genotypes resembling ecotype “202700” may ensure stable forage yields under irregular or reduced precipitation conditions. Such genotypes offer promising resilience for sustainable and organic farming systems in Romania’s western forest steppe zone [
31].
To further elucidate the physiological response of
Lotus corniculatus to water deficit, several genotypes were compared by assessing key physiological indicators such as the Relative Water Content (RWC), chlorophyll index, and photosynthetic pigment concentrations. It was observed that genotypes capable of maintaining a higher RWC and stable chlorophyll levels under drought stress conditions exhibit enhanced tolerance. This is likely due to the activation of physiological compensatory mechanisms, which allow for sustained photosynthetic activity even in arid environments [
52]. The development of such adaptive mechanisms reflects the link between local genotypes and climatic resilience, as these traits enable ongoing metabolic activity and biomass production during periods of moderate drought [
53]. These findings support the conclusion that local
Lotus corniculatus genotypes are well-adapted to dry environments and can maintain stable yields, especially under the increasingly variable precipitation regimes observed in Central and Eastern Europe [
54,
55].
Another argument for the collection and conservation of local
Lotus corniculatus genotypes is their regional applicability, based on the premise that genetic diversity can reveal Romanian regional lines (e.g., from Banat or Crișana) with specific adaptive traits—even in the absence of extensive field-based phenotypic evaluations. A recent genomic sequencing study involving nearly 300 genotypes produced a genomic variation map, which identified regional genetic structures, including those specific to western Romania. These structures highlight the genetic potential of selecting adaptive traits, such as drought tolerance and enhanced water use efficiency [
56].
Bird’s-foot trefoil (
Lotus corniculatus L.), which is a vegetatively propagating species, is improved by breeders aiming to create synthetic varieties composed of several phenotypically similar, but genetically distinct clones, to enable the expression of a maximum heterosis effect, both phenotypic (in terms of yield) and adaptive [
57].
Thus, in validating the breeding process for bird’s-foot trefoil, it is important for the breeder to understand how the targeted traits are expressed in the pedoclimatic context in which a new variety is developed. Monitoring the biological development of the collected material, followed by the application of selection over several generations, results in obtaining material richer in favorable genes and with a higher degree of uniformity.
In the context of both the breeding and agro-productive process, understanding the correlations between reproductive traits contributes to more efficient genotype selection and also to optimizing cultivation conditions in order to maximize green biomass or seed production. The results obtained indicate significant differences between genotypes for all the traits analyzed, ranging from pod dimensions to the number of flowers and productivity expressed through pod weight. This variability highlights the high potential for selecting and fixing favorable traits in future improved varieties. The K-means cluster analysis allowed for a clear delineation of five genetic groups based on pod weight and the number of seeds per pod. Among these, Cluster V (genotypes LV-LC-3, LV-LC-4, LV-LC-6, and LV-LC-16) stands out for its highest productive potential. These genotypes combined high pod weight with a moderate number of seeds, which may indicate optimal reproductive efficiency for forage use. On the other hand, Cluster I included low-yielding genotypes, which could represent an interesting genetic resource for traits such as adaptability to specific pedoclimatic conditions.
The correlations highlighted between traits offer insight into selection strategies. The positive correlation between pod length and pod density (r = 0.51) suggests that length may serve as an indirect indicator of production potential. In contrast, the negative correlation between pods’ width and their total weight (r = −0.41) suggests a potential morphological trade-off that must be balanced when selecting genotypes. The absence of significant correlations with the number of seeds per pod confirms that this parameter influences productivity in a more independent manner, requiring a targeted approach.
The strong negative correlation between plant height and protein content (r = −0.64) reveals an important agronomic trade-off. This suggests that genotype selection must balance vegetative yield with nutritional value. This compromise can be strategically leveraged depending on the intended use of the forage: extensive production or intensive grazing. Weak correlations between other traits suggest a partially independent genetic control, which offers breeders flexibility in selecting favorable trait combinations.
The PCA and hierarchical clustering provided a complex view of trait relationships in genotype selection. The distribution of genotypes in the PC1–PC2 space allowed for the identification of clear patterns between productivity and quality, offering a solid foundation for assisted selection. According to the results, genotypes LV-LC-3, LV-LC-4, LV-LC-6, and LV-LC-16 (
Cluster V) were identified as having high productive potential. Based on the analyzed data, it is confirmed that in
Lotus corniculatus L., the weak correlations between certain traits reflect partially independent genetic control, an aspect that provides breeders with a wide range of possibilities and high variability that they can exploit to their advantage, as also noted by Alvarez Vazquez et al. (2012) [
58]. An explanation for the increased variability lies in the predominantly allogamous nature of the species, correlated with its ability to form heterozygous populations, which confirms the validity of the strategy to develop synthetic varieties based on phenotypically similar but genetically diverse clones, with the goal of maximizing the heterosis effect [
59]. Moreover, the dendrogram based on the analyzed traits allowed for the classification of the genotypes.
Based on our results, the 18 selected
Lotus corniculatus genotypes exhibited substantial genetic diversity and complementary agronomic traits, allowing for the identification of elite parental lines with promising potential for synthetic variety development. These genotypes were evaluated under field conditions characterized by reduced rainfall and elevated temperatures, which closely simulate the increasing climatic pressures predicted for temperate agroecosystems [
52].
The selected genotypes demonstrated variable but complementary performances across key traits such as green biomass yield, crude protein content, pod weight, and seed productivity. Notably, the genotypes grouped in Cluster V—such as LV-LC-3, LV-LC-4, LV-LC-6, and LV-LC-16—showed the most favorable balance between yield and forage quality. These findings confirm their suitability for breeding programs aimed at improving both productivity and nutritional value under low-input and water-limited conditions.
Thus, the selection of these genotypes supports the strategic development of
L. corniculatus varieties with enhanced adaptability, persistence, and forage potential, offering a genetic foundation for sustainable, resilient, and regionally adapted forage systems in western Romania and similar agroecological zones [
60].
The resulting groups reflect synergies between traits, providing a framework for genotype selection. Cluster I, for example, may offer candidates an optimal balance between quality and quantity, while Cluster IV, the most diverse, represents a valuable genetic resource for multi-trait breeding. Based on the identified genetic variability, the selection of Lotus corniculatus L. genotypes can be strategically directed toward the development of lines with increased productivity and superior forage quality. The results indicate that integrating morpho-productive, biochemical, and statistical analyses can accelerate the breeding process and improve selection efficiency. Looking ahead, the use of these genotypes in various agroecosystems may significantly contribute to the development of sustainable agriculture.

