1. Introduction
Since the People’s Bank of China launched the e-CNY pilot in 2014, the program has expanded three times, moving from a handful of core cities to several province-wide trials. As both digital-economy infrastructure and a lever for RMB internationalization, the e-CNY carries high expectations [
1]. Yet the current pilots focus mainly on retail use-cases [
2]. Although merchants benefit from free, real-time, and freely convertible settlement, consumer uptake lags; slow adoption on the user side and uneven terminal upgrades on the merchant side have become structural hurdles [
3,
4]. Hardware costs, entrenched payment habits, and varied local rollout speeds together constrain deep penetration at the city level and dilute potential policy gains. Importantly, the e-CNY pilot’s success may have far-reaching implications beyond financial modernization, as digital finance can serve as a catalyst for narrowing socio-economic disparities and fostering sustainable and inclusive urban growth [
5].
Financial inclusion offers a key lens for assessing the e-CNY pilot’s socio-economic value, not only by expanding access to financial markets but also by promoting greater social equity, economic opportunity, and resilience against external shocks. The term refers to delivering affordable financial services to groups underserved by the traditional system [
6]. China’s policy agenda has increasingly stressed accessibility, ranging from rural-finance reform to digital-infrastructure investment. A former governor of the People’s Bank of China argued that inclusive finance strengthens the real economy and improves livelihoods [
7]. The State Council Communiqué, Guo Fa [2023] No. 15, likewise calls for “wider basic financial services and easier financing” over the next five years. Despite this high-level push, little quantitative work has linked city-level financial inclusion to concrete policies, leaving a gap in evidence that is tailored to China’s institutional context. Understanding how digital financial infrastructure can enhance equitable access and contribute to long-term urban sustainability is an urgent research frontier.
Most studies focus on the theoretical framework and implementation challenges of the e-CNY pilot [
1,
8,
9], with limited analysis on its city-level impact, mostly examining micro-level effects in specific cities, companies, businesses, or among consumers [
3,
10,
11,
12,
13,
14,
15]. These studies often rely on survey evidence or case-specific assessments, which limit generalizability. Few have explored how digital currency deployment interacts with structural urban factors such as commercial network density and mobility. Moreover, whether digital currency pilots can serve as levers for advancing equitable urban development and sustainability remains empirically unexplored. To fill this gap, the present study shifts the focus from individual-level behavior to city-level financial inclusion outcomes, using wholesale and retail enterprises as observable conduits of policy impact across a multi-city panel. In the process, it contributes to a broader view of how CBDC programs may influence regional equity and urban development trajectories.
Four research questions are posed: (i) Does the e-CNY pilot significantly enhance city-level financial inclusion and promote more equitable access to financial services? (ii) Which penetration path matters more—growth in the number of wholesale and retail merchants or an expansion of their sales? (iii) Do impacts differ across city characteristics? (iv) How do external mobility shocks, such as COVID-19 lockdowns, shape these penetration channels?
This study assembles a balanced panel of 271 prefecture-and-above cities for 2016–2022, employs both the PKU Digital Financial Inclusion Index [
16] and a self-constructed metric, combining a staggered difference-in-differences design with synthetic control (SDID-SCM) to mitigate time-varying unobservables beyond standard DID. At the mechanism stage, the study examines two channels, a merchant-coverage channel and a transaction-scale channel, while a migration-based mobility index captures lockdown-related shocks. The pilot significantly improves financial inclusion overall; the merchant-coverage channel carries the larger share, and its effect is amplified where mobility is constrained but tapers off in saturated commercial networks. Non-capital cities in the eastern and central regions gain the most, suggesting faster e-CNY pilot diffusion in areas with mid-to-high economic dynamism. These findings highlight the potential of e-CNY as a policy tool for both technical modernization and inclusive economic participation. It also supports resilient urban development aligned with the broader sustainability agenda.
The paper contributes in three ways. First, it offers the first city-level estimate of the e-CNY pilot’s impact on financial inclusion and maps regional penetration gaps, extending the scope of earlier micro-level studies. Unlike most prior work centered on consumers or firms, this study evaluates policy effects at the structural level, identifying broader patterns across diverse city types. Second, the SDID-SCM framework enhances causal identification relative to conventional approaches. Third, it clarifies how the e-CNY pilot works through merchant coverage and transaction scale, offering evidence for fine-tuning merchant incentives, infrastructure rollout, and use-case design. Overall, the study contributes new empirical insights on how digital currency policies can advance the dual goals of financial modernization and sustainable, inclusive urban growth.
2. Literature Review
First, this study focuses on the research area related to the pilot policy of e-CNY. Recent scholarship on the e-CNY framework falls into two broad streams. Macro-oriented studies examine its international status and economic and trade flows [
9,
17], cross-border payment systems and monetary policy [
1,
8], digital-factor markets [
18], and supply chain systems [
19], etc. These studies frame the e-CNY pilot as part of broader structural reforms for sustainable economic globalization. Micro-oriented work has focused on the behavior of the e-CNY pilot to users [
13,
15], retail innovation within commercial banks [
3,
4], competitive responses from third-party payment platforms [
10]; several authors remain cautious about the currency’s alleged advantages [
4,
20]. Compared to decentralized cryptocurrencies such as Bitcoin, which the Chinese government has restricted due to volatility and regulatory risks, the e-CNY is state-issued and centrally regulated, enabling it to serve targeted financial inclusion and regulatory objectives more effectively. Internationally, CBDC pilots such as the Bahamas’ Sand Dollar [
21], Nigeria’s eNaira, and Sweden’s e-krona [
22] offer valuable reference points for understanding localized approaches to digital currency implementation. However, comparative analyses of e-CNY in light of these international experiences remain limited, especially regarding their implications for urban financial inclusion and sustainable development. While prior case studies use Shenzhen data for simulation [
11], trace fiscal effects in Suzhou [
12], or discuss challenges in the Pearl River Delta [
23], these studies tend to focus on specific city pilots or firm-level behavior, lacking systematic assessment at the structural urban scale. The current study complements this body of work by shifting from fragmented micro analyses to a comprehensive, multi-city assessment of digital currency’s structural impact on financial inclusion.
Second, in terms of financial inclusion research, the research in this area is already relatively mature since the concept of financial inclusion was first proposed by the United Nations at the International Year of Microcredit Conference in 2005. Despite varied labels, the core idea of “financial exclusion” and “inclusive finance” remains the same: affordable services for underserved groups [
24]. In recent years, the study of financial inclusion has been gradually refined from the national level to the micro level and the regional level. From the regional perspective, domestic and foreign scholars have studied financial inclusion in the United Kingdom [
24], India [
25,
26,
27,
28,
29], China [
30], and Turkey [
31], and a set of mature and recognized metric models and methods has been developed. Recent spatial analyses emphasize how digital infrastructure gaps, SME financing capacity, and persistent urban–rural income inequalities jointly shape spatial disparities in financial inclusion [
32,
33,
34,
35,
36]. This shift reflects a broader trend from theoretical and national-level studies toward more granular assessments at the regional and city levels. Yet, despite these advances, a critical empirical gap persists: to what extent does the e-CNY pilot, an inherently policy-embedded and technology-driven innovation, advance financial inclusion, reduce systemic exclusion, and promote equitable urban transformation? This remains underexplored in the current literature. Bridging these gaps remains crucial for achieving inclusive and sustainable development goals, particularly Sustainable Development Goal 8 (Decent Work and Economic Growth) and Goal 10 (Reduced Inequalities). To address these gaps, this study investigates how the e-CNY pilot influences city-level financial inclusion, emphasizing observable commercial channels and structural factors. In the process, it builds on existing micro-level research but extends it toward structural analysis, using city-level data to identify broader regional patterns and assess equity-oriented outcomes.
3. Policy Background and Theoretical Assumptions
3.1. Policy Background
To mitigate financial risks arising from the dominance of the U.S. dollar, many countries have explored “de-dollarization” policies. Within this context, China launched the e-CNY pilot to promote RMB internationalization and reduce external monetary dependencies.
First, the e-CNY carries the same legal status as physical RMB and is included in M0 monetary aggregates. Second, compared to existing digital payment tools, it removes intermediary clearing layers and eliminates transaction fees [
17]. Third, its encrypted architecture allows secure and efficient payments, supporting cross-border trade and regulatory oversight while contributing to financial sovereignty [
37].
Under the joint framework of the Ministry of Commerce and PBOC, central and local governments coordinate policy design, deployment, and field implementation of e-CNY pilot work. In 2019, the People’s Bank of China officially announced the launch of the e-CNY pilot, designating Shenzhen, Chengdu, Suzhou, Xiong’ an New Area, and relevant Winter Olympics venues as the first batch of pilot cities; in 2020, six additional cities—Shanghai, Hainan, Changsha, Xi’an, Qingdao, and Dalian—were added as the second batch of pilot cities; in 2022, the pilot areas were further expanded to include Tianjin, Chongqing, Guangzhou, Fuzhou, Xiamen, and venues related to the Asian Games as the third batch of pilot areas.
As of April 2024, the e-CNY pilot has been extended to 17 provinces and 26 regions in China [
37], supporting diverse use-cases in retail, healthcare, and transport. According to data made public by the Suzhou Municipal Government, the e-CNY transaction volume in Suzhou exceeded CNY 3 trillion in 2023, realizing 1.11 million scenarios on the ground [
14]. The deepening integration of e-CNY into daily economic life illustrates its role not only as a financial infrastructure but also as a tool with potential social equity and inclusive development benefits.
3.2. The Relationship Between E-CNY Pilot, Financial Inclusion, and Sustainable Development
3.2.1. The Impact of E-CNY Pilot on Urban Financial Inclusion
Backed by the central bank and equipped with programmable features, the e-CNY embeds blockchain, IoT, and AI-based risk controls into the payment stack. On the demand side, zero fees and offline functionality lower both device and transaction hurdles, enabling unbanked or low-tech users to settle payments even without network access [
3]. On the supply side, a unified interface lets banks and payment firms plug into the e-CNY system, cutting account-opening and maintenance costs for small merchants. These features correspond to the “access–usage–quality” dimensions emphasized in financial inclusion theory [
5], which highlight the importance of lowering barriers and improving transaction efficiency for underserved users. Under the “needs–supply–institutions” triad [
30], improvements across these dimensions foster not only financial accessibility but also promote inclusive urban growth, contributing to sustainable economic development. In addition, Rogers’ diffusion of innovations theory [
38] suggests that policy-embedded digital innovations, when supported by institutional trust and ease of use, can accelerate adoption among lagging or vulnerable populations. The following hypothesis is therefore proposed:
H1. The e-CNY pilot significantly enhances financial inclusion, promoting more equitable and sustainable access to financial services at the city level.
3.2.2. The Mechanism of E-CNY Pilot’s Effect on the City’s Financial Inclusiveness
First, the e-CNY pilot policy may enhance financial inclusion by increasing the number and sales of wholesale and retail enterprises above the quota. On the supply side, the e-CNY pilot enjoys central-bank credibility and a secure design that strips out legacy clearing (UnionPay) and platform intermediaries (such as WeChat Pay and Alipay) [
10]. Lower fees and faster cash flow should widen merchant bargaining power and boost turnover [
3]. On the demand side, expanded retail networks serve broader consumer groups and generate stable employment, which supports both inclusive growth and community-level sustainability [
39,
40]. Financial inclusion, as a key component of inclusive economic growth, reflects equitable access to financial resources across social groups [
35]. Earlier work links higher retail sales and new retail penetration to better financial inclusion scores [
41,
42]. Building on this foundation, our study selects two key variables, merchant-coverage channel and transaction-scale channel, to empirically unpack the mechanisms through which the e-CNY pilot may influence financial inclusion. These two dimensions are intended to reflect how policy-driven digital infrastructure affects both the breadth and depth of financial access at the urban level. In this context, the e-CNY pilot can be seen as a tool for strengthening financial intermediation under Levine’s theory [
43], while the expansion of merchant infrastructure aligns with inclusive growth models that emphasize the importance of small businesses and service accessibility. If e-CNY adoption reduces payment frictions and strengthens retail business activity, it can broaden financial service coverage and indirectly support inclusive, resilient urban economies. The following hypothesis is therefore proposed:
H2. The e-CNY pilot enhances city-level financial inclusion by expanding merchant coverage and transaction scale, thereby supporting more inclusive and sustainable urban financial ecosystems.
Second, City characteristics may shape the policy effect. Theoretically, cities may respond differently to the same pilot policy due to variations in geographic location, size, and growth. Empirical studies have found stronger policy effects in southeastern regions or green eco-cities [
44]. This aligns with the theory of absorptive capacity, proposed by Cohen and Levinthal [
45], which suggests that a region’s ability to adopt and benefit from new technologies or policies depends on its institutional, human, and infrastructural capabilities. Additionally, place-based policy frameworks, as discussed by Barca et al. [
46], emphasize that spatial heterogeneity in development and institutional readiness can lead to divergent outcomes from nationally uniform interventions. In our context, such structural heterogeneity is reflected in differences in administrative status, geographic location, and urban mobility conditions, dimensions that shape digital infrastructure and governance capacity of cities to absorb and implement a centrally coordinated digital policy like the e-CNY pilot. Recognizing these disparities is essential for tailoring sustainable policy pathways. The following hypothesis is proposed:
H3. The financial inclusion impacts of the e-CNY pilot vary across city types, reflecting spatial heterogeneity in urban capacity for sustainable and inclusive development.
Third, the COVID-19 pandemic significantly restricted cross-regional flows of people and capital, directly impacting wholesale and retail activity by reducing offline consumption scenarios. The sharp decline in mobility not only undermines the transaction volumes that sustain the e-CNY’s “real-time settlement–cash flow acceleration” advantage but may also alter firms’ incentives to adopt the e-CNY pilot, thereby interfering with the policy’s effectiveness. In the early stages, the e-CNY pilot placed strong emphasis on offline promotion and in-store adoption [
2], particularly among wholesale and retail merchants. Mobility restrictions may have disrupted these efforts by limiting exposure, outreach, and transaction frequency in physical settings. At the same time, the e-CNY also supports online payments, zero transaction fees, and enhanced security, appealing to merchants during periods of heightened digital reliance. These contrasting mechanisms suggest that reduced mobility could either suppress or stimulate adoption, depending on local contexts. As noted by Angrist and Pischke [
47], ignoring external policy-interfering shocks, such as the pandemic, may bias causal inference and conflate treatment effects with background disruptions. Therefore, when evaluating the impact of the e-CNY pilot on financial inclusion, this study explicitly incorporates mobility as a contextual variable. As a major exogenous shock, the pandemic may shape how the policy unfolds across cities with different levels of disruption. By including migration intensity in the mechanism analysis, we aim to identify whether it moderates the policy’s effectiveness or alters its transmission pathway.
H4. Migration index has a significant moderating effect on the financial inclusion impact of the e-CNY pilot policy.
4. Research Design
4.1. Data Source and Sample Selection
According to the relevant government announcements, the first two batches of e-CNY pilots all started piloting in the year of the announcement, whereas the third wave was not rolled out until the second half of 2022 and, for the first time, shifted from individual cities to province-wide trials. Implementation speed and public attention vary markedly across jurisdictions. To ensure a sufficiently long pre- and post-window and to keep the dataset consistent, the study confines the study period to 2016–2022 and excludes the third-wave pilots, thereby avoiding a short post-treatment horizon and excessive heterogeneity in rollout.
The data are drawn from the PKU Digital Financial Inclusion Index [
16], EPSDATA, and CSMAR. Missing observations are supplemented with the China City Statistical Yearbook and China Regional Economic Statistical Yearbook; cities with extensive gaps are dropped, and the remaining small gaps are filled by linear interpolation. After cleaning, Shenzhen, Suzhou, and Chengdu were finally selected as the first batch of sub-pilot cities, while Shanghai, Changsha, Qingdao, Xi’an, and Dalian were selected as the second batch. The remaining 263 prefecture-level cities serve as controls. The final balanced panel, therefore, comprises 271 mainland cities for 2016–2022, excluding Tibet, Hong Kong, Macao, and Taiwan.
4.2. Explained Variables
The dependent variable is financial inclusion, which serves as an important indicator of social equity and sustainable urban development. It is measured through two complementary approaches: the PKU Digital Financial Inclusion Index and a self-constructed index.
The PKU index, released by the PBC School of Finance of Peking University, covers nine dimensions—coverage_breadth, usage_depth, payments, insurance, monetary_fund, investment, credit, credit_investigation, and digitization_level [
16]. Some dimensions (e.g., monetary_fund, investment) relate more to wealth management than to basic inclusion. To better reflect the core dimensions of inclusive and equitable access, only two sub-indices—coverage_breadth, usage_depth—are used, as these capture the basic capability of financial systems to serve disadvantaged and underserved groups, a key component of sustainable and inclusive growth.
Because
still omits the supply side of conventional channels, we build a complementary measure. Following the definition proposed by Sarma [
48], financial inclusion is measured by the extent to which all members of an economy can normally access, obtain, and use the services of the formal financial system. The study draws on Chinese studies [
34,
49,
50] and data availability to select six indicators listed in
Table 1 and aggregates them into a composite
index, providing a more holistic assessment of financial inclusion’s role in promoting balanced development and mitigating regional disparities.
In this paper, principal component analysis [
25] and factor analysis [
52] are adopted to calculate the weights of each dimension and thus obtain the financial inclusion score
. The specific procedure follows the method of Xiao Jing [
34]: using Stata 19.5 to process the original data, generate a standardized correlation matrix, perform the KMO and Bartlett tests to confirm the suitability of factor analysis, and then apply principal component analysis to extract the common factors. The results show that the cumulative contribution of the first three extracted factors reaches 82.19%, reflecting most of the variability of the original data. The first factor, with a weight of 0.5687, mainly captures aspects related to financial popularity (e.g., the number of people working in the financial industry) and the financial use dimension (e.g., loan balance per capita, deposit balance per capita), indicating that the popularity of financial resources and services exerts the greatest influence on financial inclusion. The second and third factors, with weights of 0.2252 and 0.2061, respectively, reflect the correlation between the density of financial networks and the distribution of financial institutions.
Compared to the PKU Digital Financial Inclusion Index, which includes several dimensions unrelated to basic financial access (such as investment or monetary funds), the
measure is specifically designed to align with the definition of financial inclusion as proposed by Sarma [
48] and applied in recent Chinese empirical studies. It captures core components across accessibility, supply, and usage—dimensions directly linked to the e-CNY pilot’s policy logic of expanding foundational financial services. While the
remains useful as a robustness benchmark, the
index provides a more comprehensive and policy-relevant representation of inclusive finance. Therefore, it is used as the primary outcome in analyses requiring higher coverage and construct flexibility, such as SCM and heterogeneity estimation.
After averaging the calculated city-level financial inclusion scores, a 3D bar chart is plotted to visualize regional disparities across China. Over time, financial services have become more accessible and widespread, indicating gradual progress in extending basic financial support to broader population groups, which is essential for promoting social equity and sustainable urban development. Meanwhile, as shown in
Figure 1, areas with higher financial inclusion are mainly concentrated in the Beijing-Tianjin-Hebei region, in economically developed coastal areas, and in the Shenzhen-Guangzhou corridor, reflecting stronger economic fundamentals and better institutional capacity to deliver inclusive services. In contrast, inland regions still face lower levels of inclusion, limited service coverage, and weaker affordability, posing challenges for achieving balanced development and inclusive sustainability goals. The result is further validated by the similarity of the ranking classification table presented in Xiao Jing’s [
34] paper.
4.3. Definition of Other Variables
The core explanatory variable of this paper is the e-CNY Pilot Dummy Variable , defined as the policy pilot interaction term (). When a city implements a pilot policy in the time period , then from that point onward it is assigned a value of 1; otherwise, it is assigned a value of 0. This staggered design reflects the gradual and regionally differentiated rollout of the e-CNY pilot, providing a natural quasi-experimental setting to assess its incremental contribution to urban financial inclusion and broader sustainable development goals.
Following Xiao Jing [
34], Fan Xiangmei et al. [
30], and Wang Qi et al. [
35], the paper controls for exogenous drivers that may affect financial inclusion and regional development capacity, including local economic output, labor market size, innovation activity, industrial structure, and public service provision. These variables are closely linked to the underlying socio-economic conditions that shape the inclusiveness, accessibility, and long-term resilience of urban financial ecosystems. Core control variables include the proportion of added value of the tertiary industry to the GDP (%)
, the average number of on-the-job workers (per 10,000 people)
, the science expenditure (log-transformed)
, the number of invention patents authorized (pieces)
, the number of industrial enterprises above scale (units)
, and the number of hospitals and health centers (units)
.
To account for the heterogeneous impact of COVID-19 lockdowns from 2019 to 2021, this paper constructs a time-varying lockdown intensity . City-level passenger turnover (10,000 persons) and freight turnover (10,000 tons) are first converted into overall z-scores and then averaged. The index tracks mobility constraints and business slowdowns across cities, enabling us to isolate the incremental role of digital financial infrastructure in promoting resilient and sustainable urban financial inclusion under external disruptions.
4.4. Modeling
This paper adopts a staggered difference-in-differences (SDID) design and uses the synthetic control method (SCM) as an additional verification. The decision to adopt SDID was made after careful consideration of alternative empirical strategies. Given substantial variation in treatment timing and the need to avoid estimation bias from heterogeneous adoption periods, SDID offers a robust quasi-experimental design. Moreover, the study considered alternatives such as Propensity Score Matching (PSM), Interrupted Time Series (ITS), and Regression Discontinuity Design (RDD), but found them less suitable. These methods either assume uniform treatment timing, require clearly defined thresholds, or cannot handle dynamic, regionally heterogeneous interventions. In contrast, the SDID approach flexibly accounts for both time and unit fixed effects and adjusts for the imbalance of treated and untreated groups in staggered settings.
To further reinforce internal validity and address potential concerns regarding counterfactual construction, the study incorporates SCM as an auxiliary method. SCM is especially useful when treatment units are few or diverse, as in our case, and provides an intuitive visualization of treatment effects relative to synthetically constructed control groups.
The combination of SDID and SCM is particularly well-suited to the context of China’s gradual, multi-round pilot policy rollout. In recent policy evaluation studies of similar staggered reforms in China—such as low-carbon city pilots [
53], smart city initiatives [
54], and green finance zones [
55,
56]—researchers have adopted SDID or SCM frameworks to account for asynchronous policy timing and region-specific characteristics. By applying both methods in parallel, this study ensures consistency of estimates and offers complementary validation, particularly given the relatively small number of treated units in early stages and the potential for treatment-control imbalance.
4.4.1. Staggered Difference-in-Differences Design
To estimate the average treatment effect of the e-CNY pilot, we adopt a staggered Difference-in-Differences (SDID) framework that accommodates policy rollout heterogeneity across cities and time. In recent years, the SDID design has been widely applied in quasi-experimental evaluations of phased policy interventions and regional pilot programs [
57,
58,
59,
60,
61], demonstrating strong performance in capturing temporal dynamics and avoiding bias from early or late adopters.
The baseline model is as follows:
where
denotes the city’s financial inclusion score at the time; the explained variable
represents the dummy variable of the
city’s implementation of the e-CNY pilot at the time
;
represents the city’s core control variable at the time;
is the random disturbance term;
represents the effect brought by the e-CNY pilot
; is the matrix coefficient of the core control variable. The Difference-in-Differences model controls for city fixed effects
and year fixed effects
, and all continuous variables are subjected to a two-sided 1% tail truncation. Standard errors are clustered at the city level, and all control variables pass the multicollinearity VIF test, with an average VIF of about 3.56, which does not exceed the reasonable threshold.
4.4.2. Synthetic Control Method
Introduced by Abadie and Gardeazabal [
62], SCM has become a standard tool in program evaluation, especially when the treatment group number is small. Compared with DID, it often yields more robust counterfactuals and has been widely used in pilot-policy studies at home and abroad [
53,
56,
63,
64,
65]. This dual strategy improves internal validity and provides nuanced evidence on whether digital financial infrastructure helps narrow regional gaps in financial access, an essential aspect of sustainability.
Specifically, let
cities be observed, with the city
treated and the remaining ones used as donors. Given the policy start year
, SCM assigns non-negative weights
to donor cities so that the weighted pre-treatment trajectory best matches that of the treated city. The resulting “synthetic city” serves as the counterfactual path absent the policy:
where
and
.
The optimal weight vector minimizes the weighted Euclidean distance:
where
is the predictor vector for the treated city,
stacks the predictors for donor cities, and
is a positive-semidefinite weighting matrix.
The treatment effect at time is . A positive and significant implies that the e-CNY pilot enhances city-level financial inclusion.
Because SCM presumes stable dynamics in the outcome series, the analysis relies mainly on the self-constructed inclusion index , which captures access, supply, and usage and thus offers a richer match space. The index is retained for SDID but is too parsimonious for reliable SCM matching.
4.4.3. Descriptive Statistics
Descriptive statistics for the variables are presented in
Table 2.
5. Empirical Results and Analysis
5.1. Baseline Regression Results
This paper calculates the policy effects of the e-CNY pilot using a staggered difference-in-differences approach and synthetic control, providing the baseline results in
Table 3, while controlling for both city fixed effects
and year fixed effects
. The baseline regressions were conducted separately for
and
, with control variables introduced sequentially.
As shown in
Table 3, the coefficients of the pilot policy dummy variables are positive in all four cases and are statistically significant at the 1% level. The coefficients in column (2) and column (4) are, respectively, slightly smaller than those in column (3) and column (4). Additionally, the constant term significantly decreases, while the adjusted R-squared shows a slight increase, suggesting the presence of factors influencing financial inclusion within the control variables. Overall, the regression results suggest that the implementation of the e-CNY pilot significantly promotes urban financial inclusion, improving the accessibility and effectiveness of financial services, thereby validating hypothesis H1.
To assess the practical relevance of the coefficient magnitude, we interpret the effect size in economic terms. The estimated coefficient of 0.1746 implies that, on average, cities included in the e-CNY pilot experienced a 13.9% increase in financial inclusion scores relative to the sample mean. This effect also corresponds to approximately 0.27 standard deviations, suggesting a moderate-to-strong policy impact. Given that changes in financial inclusion scores typically reflect long-term structural improvements, such a shift over the short implementation window highlights the real-world relevance of the pilot.
For the , the policy effect is smaller in magnitude but remains statistically significant, representing a 1.9% increase over the baseline level. This is consistent with the PKU index’s broader wealth-management dimensions, which may be less sensitive to short-term structural changes.
From a sustainability perspective, these results imply that the expansion of digital payment infrastructure helps address financial accessibility gaps at the urban level. Enhanced financial inclusion not only supports economic participation among previously underserved groups but also contributes to building a more inclusive, resilient, and socially equitable financial system, an important component of sustainable urban development.
5.2. Synthetic Control Comparison Results
Based on the overall positive effect of the digital RMB pilot using the baseline difference-in-differences model, this study further uses the synthetic control method to analyze representative pilot cities. Given that the synthetic control method requires matching and estimation for a single treated unit at a time [
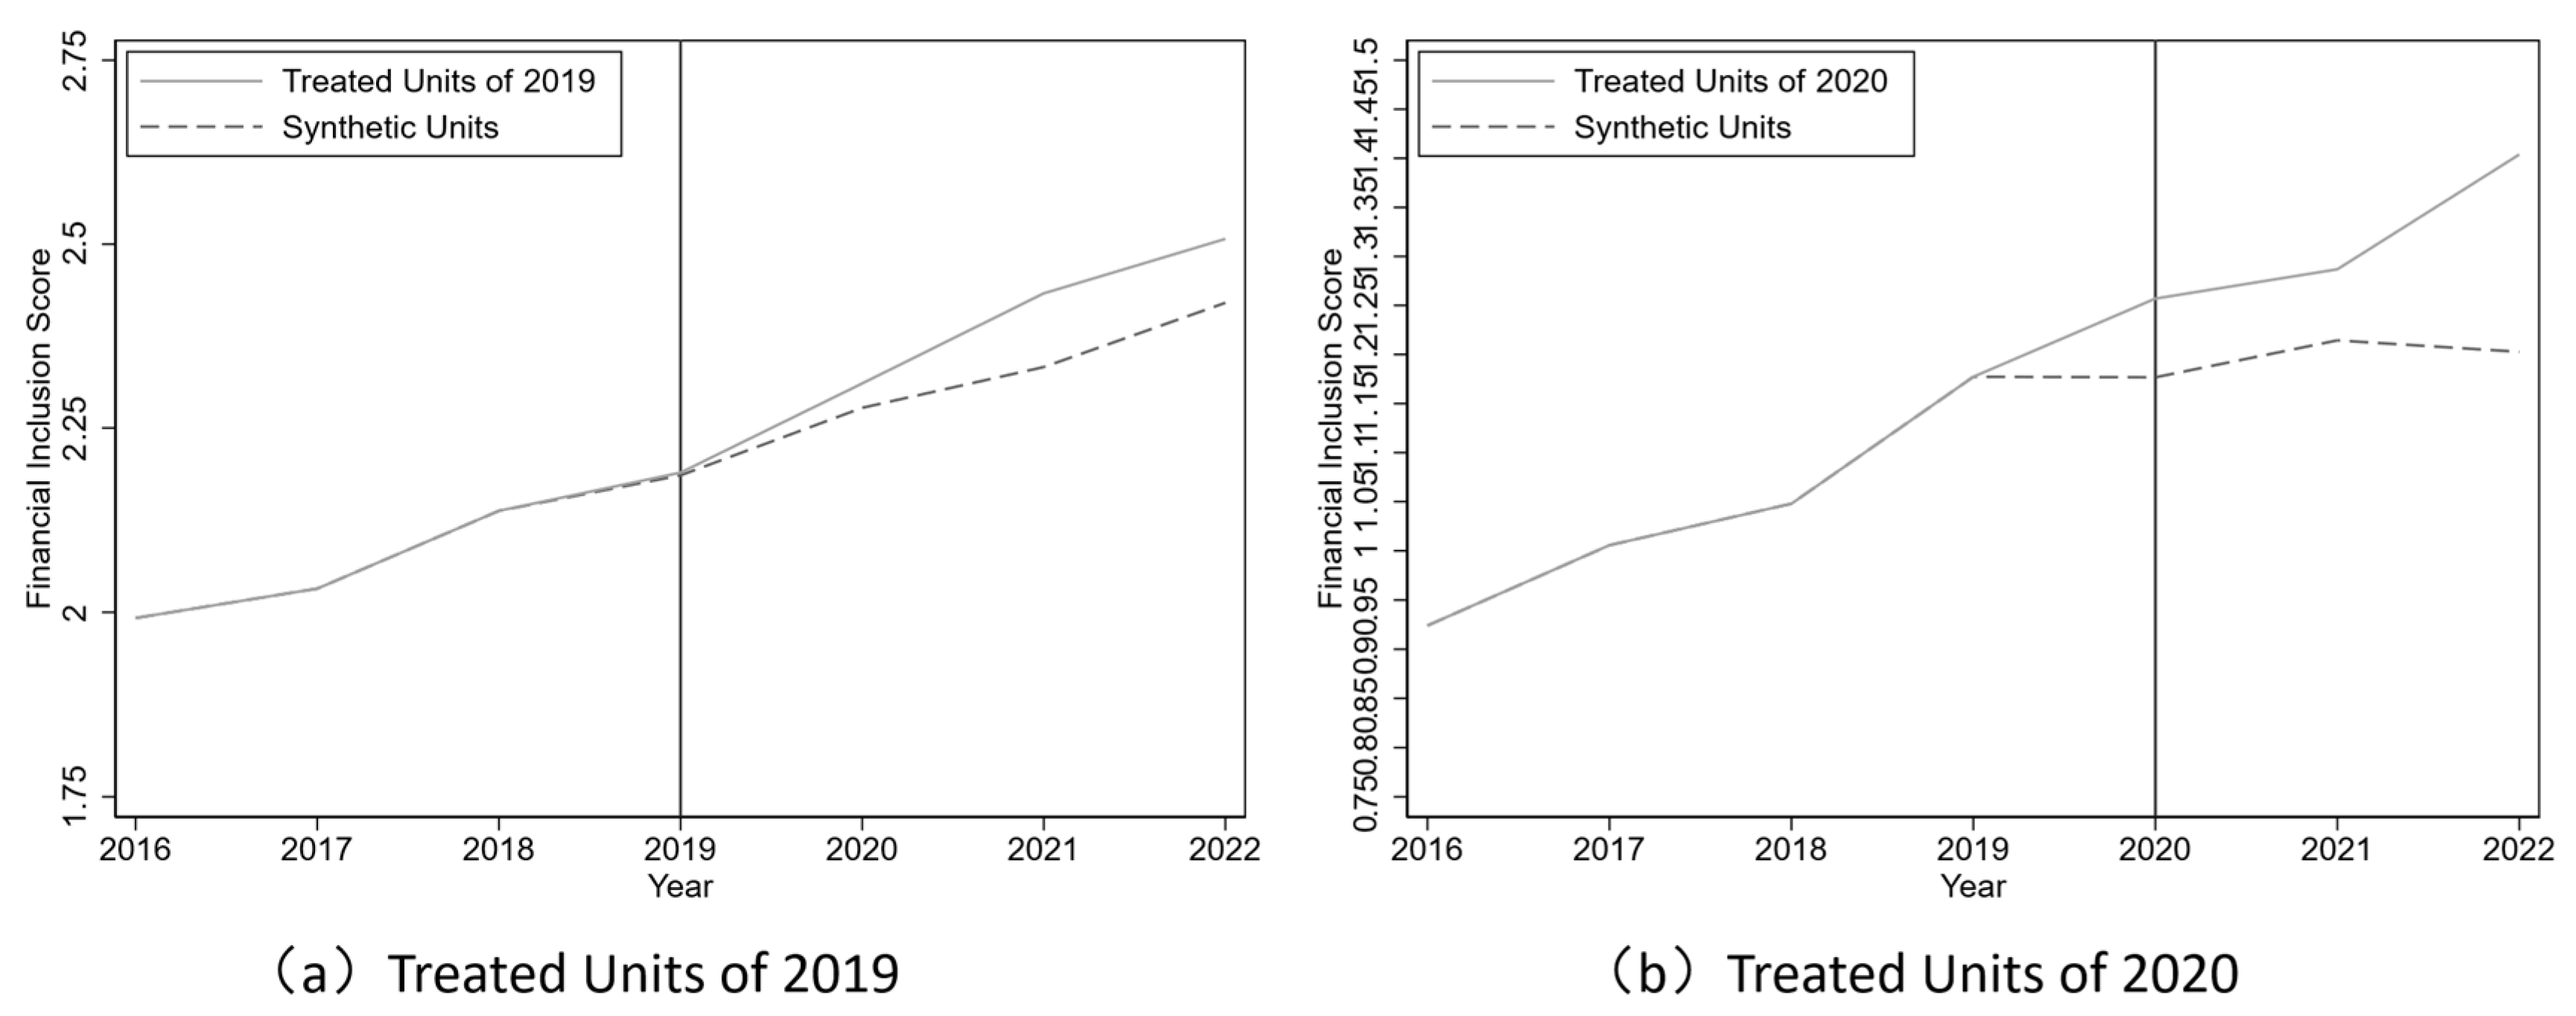
66], this study adopts two strategies for constructing control groups and identifying policy effects: First, the study treats the first batch of pilot cities in 2019 and the second batch of pilot cities in 2020 as a whole, constructs their synthetic control group, and evaluates the dynamic differences before and after the policy implementation; then, four representative cities, Suzhou, Shenzhen, Changsha, and Shanghai, are selected for individual-level synthetic control estimation to reveal the heterogeneous policy responses across cities.
Figure 2 aggregates the treated cities according to the policy implementation years (2019, 2020) to compare the overall effects of the policy at different points in time. It can be seen that the initial fitting of the two graphs is quite good, with the treatment groups in 2019 and 2020 showing clear deviations from the synthetic path after the pilot was launched, thus reinforcing the dynamic verification of the overall effect of the digital RMB policy; the 2020 pilot group began to diverge from the synthetic path in 2019, possibly because some pilot cities had already deployed financial infrastructure before the official announcement. Nevertheless, the path divergence further expanded after the pilot began, still indicating that the overall direction of the policy had a substantial impact.
Figure 3 shows the changes in financial inclusion in the four cities (Suzhou, Shenzhen, Changsha, and Shanghai) before and after the pilot policy, along with their dynamic comparison with the synthetic control group. In general, the financial inclusion levels in these pilot cities were higher than those in the synthetic control group after the pilot began, and the gap gradually widened over time, indicating that the digital RMB pilot had a certain positive impact on improving the inclusiveness of financial services.
The synthetic control method provides dynamic comparisons at both the batch level and individual level, further supporting the baseline regression conclusions, indicating that the digital RMB pilot has an overall positive effect, but the policy effects and response speeds vary across cities. This difference may stem from disparities in digital infrastructure construction, policy implementation, and the level of institutional coordination across regions.
To further examine the matching performance of synthetic controls,
Table 4 presents the top five donor cities and their associated weights for each treated city. The results suggest that most synthetic units successfully approximate the treated cities’ pre-treatment characteristics. Cities such as Taiyuan, Wuhan, and Chongqing are frequently selected as core donor cities, reflecting their similar urban scale, digital infrastructure readiness, and financial structure. These matches indicate a relatively good fit and reinforce the internal validity of the synthetic counterfactuals.
However, in the case of Shenzhen, the synthetic unit demonstrates notably poor pre-treatment alignment. This issue is clearly visible in
Figure 3b, where the estimated effects show high volatility. This weak fit is consistent with findings in Xu et al. [
67], which reported similarly problematic results when synthesizing Shenzhen using only Suzhou (with a weight of 1). Such results underscore the inherent difficulty of finding suitable donor cities for Shenzhen, likely due to its unique status as a high-tech hub with an atypical policy environment. This observation not only validates prior research but also serves as a caution for interpreting effect sizes for atypical urban cases like Shenzhen.
6. Robustness Tests and Heterogeneity Analysis
6.1. Parallel Trend Test
Since the validity of the staggered difference-in-differences model relies on the premise that the parallel trend assumption holds, a parallel trend test is required to verify that there is no significant difference between the experimental group and the control group before the policy is implemented. This paper draws on the event study method proposed by Jacobson et al. [
68] and follows Chen Zhen et al.’s [
55] strategy in selecting the base period, choosing the initial period of the research sample as the base period for the dynamic effect trend test. According to the results of the parallel trend test shown in
Figure 4, the estimated coefficients remain statistically insignificant at the 95% confidence level before the implementation of the e-CNY pilot, indicating that there is no systematic difference in financial inclusion levels between pilot and non-pilot cities before policy implementation. However, after the policy is implemented over time, the policy effect starts to weaken from the third year after policy implementation as its significance diminishes.
6.2. Individual Placebo Tests
To rule out the possibility that the positive effect is driven by other unobserved variables or random factors, this paper conducts an individual placebo test. The placebo test is implemented by randomly reassigning the policy treatment status across cities and estimating the model with these pseudo-policy dummy variables. If the coefficients are significantly different from the baseline estimates, it indicates that the original policy results are unlikely to be due to chance.
Figure 5 shows the results obtained by repeating the “pseudo-policy dummy variable” 1000 times, where the horizontal axis represents the estimated coefficients of the pseudo-policy dummy variables, the left vertical axis denotes the corresponding
p-values, and the right vertical axis illustrates the kernel density distribution. It can be seen that the estimated coefficients obtained from 1000 random samples range from −0.03 to 0.03, with a mean close to 0. The
p-value is generally greater than 0.1, and the distribution follows a normal pattern. The actual estimated coefficient is approximately 0.17, positioned on the right side of the distribution with a significant difference. This suggests that the true estimate is unlikely to be influenced by other policy effects or random factors, confirming the significance of the policy effect.
6.3. Permutation Test
To further validate the robustness of the policy effect identified by the synthetic control method, this study adopts the permutation test (Placebo-in-space Test) proposed by Abadie et al. [
69]. This approach treats each non-pilot city in the sample as a “pseudo-treated unit,” in turn, assuming it received the policy intervention in the same year, and estimates the difference between the actual and synthetic paths before and after the policy.
Following the procedures of Liu Naiquan et al. [
70] and Xu Mingze et al. [
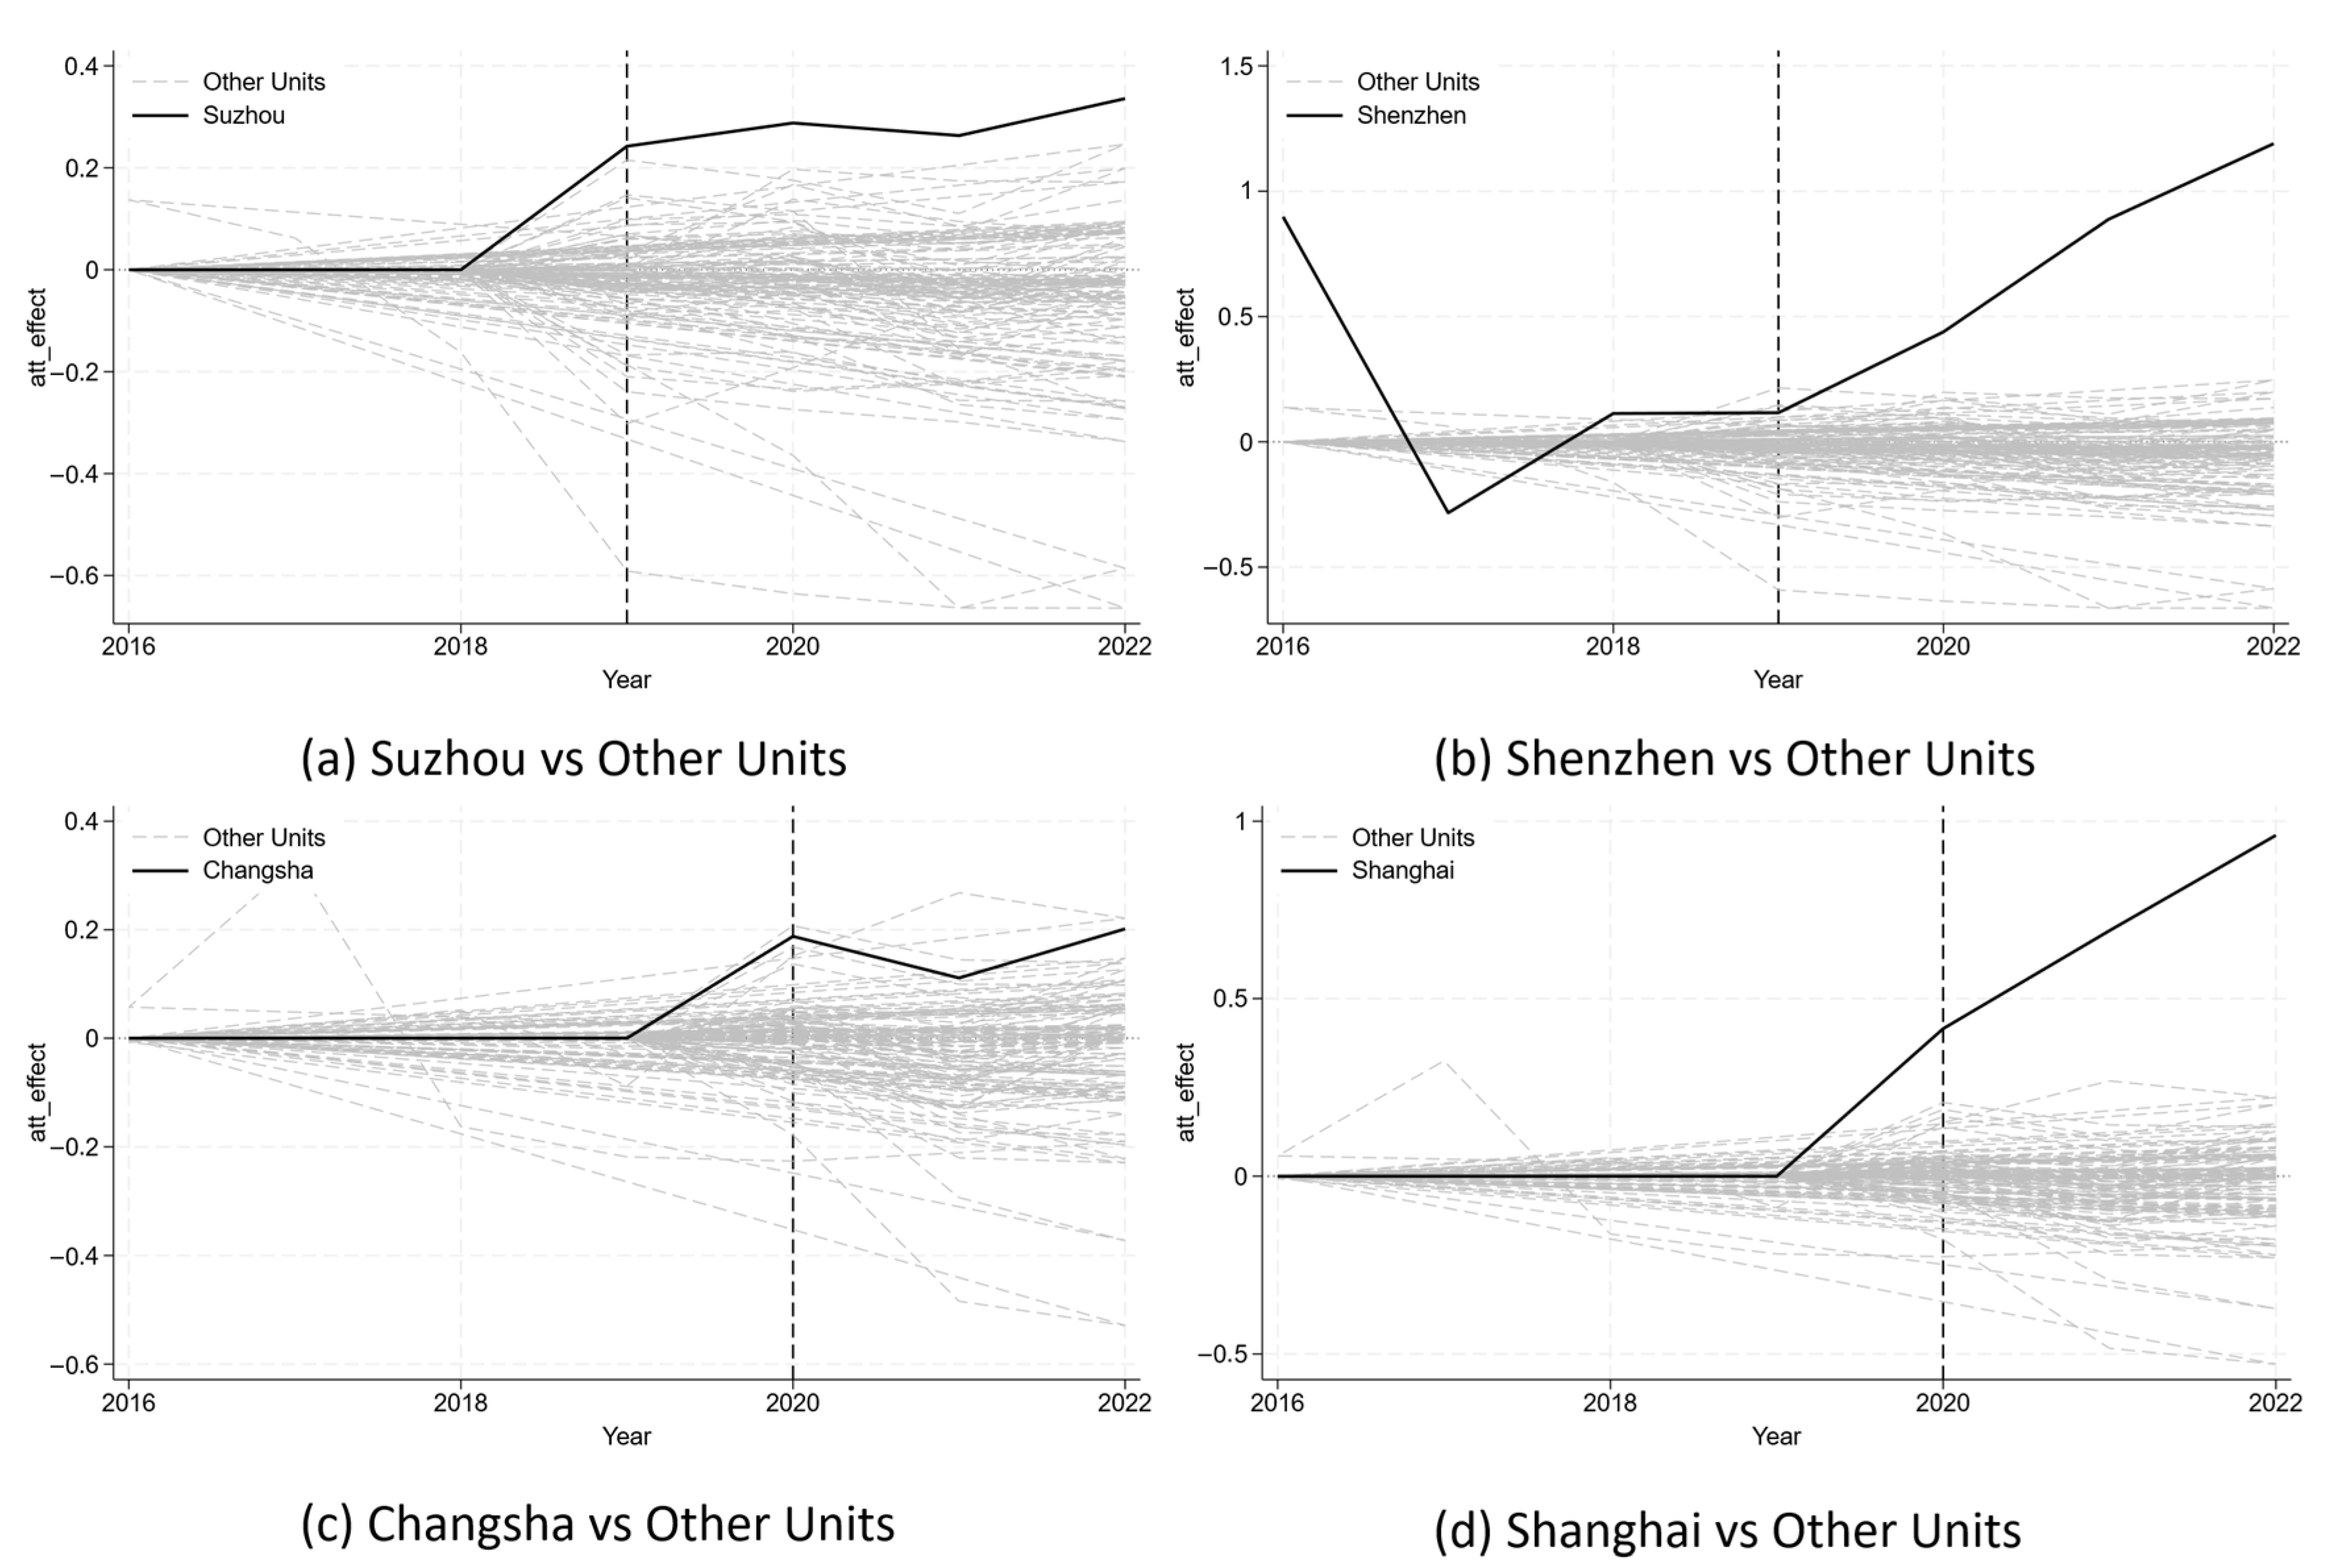
67], this study applies the permutation test to four typical pilot cities—Suzhou, Shenzhen, Changsha, and Shanghai. A fixed interval of 4 is used for random sampling, and the root mean square prediction error (RMSPE) during the pre-policy period is calculated. Cities with RMSPE values more than four times that of the target city are excluded. As a result, 68 well-matched placebo cities are selected for Suzhou, Shenzhen, and Shanghai, and 67 for Changsha.
As shown in
Figure 6, the black solid line represents the synthetic residual path for the actual treated city, and the gray dashed lines represent the synthetic residual paths for all placebo cities. A clear divergence emerges between the treated and placebo units after policy implementation, with the black line visibly higher than most gray lines. In particular, Suzhou and Changsha exhibit rapid divergence from their control groups after the pilot, while Shanghai shows a steady upward trend. Though the pre-treatment fit for Shenzhen is slightly less accurate, it still displays a clear positive deviation post-intervention, confirming the significance of its policy response.
To further evaluate the validity of the synthetic control construction, following the procedure of Olper et al. [
64], the study reports pre-treatment fit statistics based on the Root Mean Square Prediction Error (RMSPE) and covariate balance diagnostics.
Table 5 presents the RMSPE values during the pre-policy period for each treated city, along with the average values of key covariates in both the treated and synthetic units. The results indicate satisfactory pre-treatment matching for most cities, particularly Suzhou and Changsha, where the synthetic trajectories closely align with the actual outcomes. In contrast, Shenzhen exhibits a relatively high RMSPE and noticeable imbalance in several predictors, reflecting difficulties in constructing reliable counterfactuals for highly dynamic megacities. These patterns are consistent with prior observations and reinforce the importance of contextual heterogeneity in SCM-based evaluation.
6.4. Controlling for Other Competing Policy Disturbances
As cities may be affected by another policy introduced during the sample period, which may cause bias in the regression results, this study selects a policy that significantly overlaps with the pilot cities and timeframe for the robustness test. By reviewing policy documents from 2016 to 2022, this study selects the “Urban Renewal Pilot” as a competing one for robustness testing [
71]. The policy’s implementation program mentions urban information technology applications, encouraging comprehensive city planning that not only considers urban characteristics but also aims to “promote the construction of a new-type city based on digitization, networking, and intelligence”. We found that most digital-related policies were launched either significantly earlier or lacked sufficient coverage and comparability at the city level. The Urban Renewal Pilot is thus selected as the only overlapping and thematically relevant policy with adequate granularity and batch-based implementation for effective comparison.
As shown in
Table 6, after controlling for the competing policy, the coefficient of the e-CNY pilot variable remains statistically significant under both
and
, indicating that the estimated policy effect is generally robust. However, the “Urban Renewal Pilot” policy shows no significant effect on
, while exhibiting a significantly negative effect on
. Overall, these findings further suggest that the positive effect of the e-CNY pilot on financial inclusion is unlikely to be confounded by other concurrent policy shocks.
6.5. Heterogeneity Analysis
6.5.1. Categorization by City Administrative Attributes
To analyze the varying impact of the e-CNY pilot policy across different city attributes, this study classifies 271 provinces and cities into two groups: provincial capitals/municipalities directly under the central government, and other cities. The results in
Table 7 show that cities that are non-provincial capital/municipality exhibit a significant positive impact on financial inclusion following the implementation of the e-CNY pilot policy, with cities such as Qingdao, Dalian, and Suzhou standing out. In contrast, the policy effect in traditional provincial capitals is not significant, supporting Hypothesis H3. This heterogeneity may stem from the more developed financial systems and stronger economic foundations of provincial capital cities, which render the e-CNY pilot’s impact less pronounced, as it does not significantly extend beyond the existing financial framework. Although this study has controlled for variables such as industrial structure and infrastructure development, there are still some unobserved factors that may affect the results.
6.5.2. Categorization by Region
To investigate regional differences in the impact of the e-CNY pilot policy on financial inclusion, this study categorizes the control group into four regions—Central, East, North, and Northeast—following the National Bureau of Statistics’ “East-West-Central and Northeastern Region Dividing Methods”. As shown in
Table 8, the policy effects in the Northeast are negative and significant, while the other three regions exhibit positive and significant effects, confirming Hypothesis H3.
Specifically, the coefficients for the North and Northeast are significant but close to zero, while the coefficients for the Center and East are higher, reflecting the positive effect of the e-CNY pilot policy. The highest policy dummy coefficient appears in the Eastern region, led by Shanghai, Suzhou, Qingdao, and Shenzhen. This may be attributed to active policy promotion by local governments, effectively maximizing policy dividends. For example, in recent years, the Shenzhen government has actively advanced the digital economy and financial innovation. As a pilot city in the Greater Bay Area, Shenzhen has developed a comprehensive closed-loop ecosystem, driven by the collaboration of the People’s Bank of China, designated commercial banks, and cross-border merchants and consumers. This policy innovation is strategically aligned with the collective efforts of all stakeholders to enhance financial inclusion in the region [
11]. Furthermore, Shanghai, Suzhou, and Shenzhen are key hubs within the Yangtze River Delta and Pearl River Delta economic zones, respectively. The strong regional synergy within these economic zones accelerates the adoption of the e-CNY pilot and fosters the development of integrated financial services and digital payment ecosystems, thereby amplifying the overall policy impact.
7. Further Analysis: Mechanisms and Transmission Pathways
Building on the preceding regression and synthetic control analyses, this study finds that the e-CNY pilot has a significant positive effect on improving urban financial inclusion. However, a binary assessment of whether the policy works is insufficient to fully understand its underlying transmission mechanisms and implications for broader sustainable development and social equity. To better understand the transmission pathways through which digital currency contributes to financial inclusion and thereby supports long-term, equitable, and sustainable urban development, two dimensions of extended analysis are conducted. First, given that the implementation and effects of the e-CNY policy vary across cities, this study explores potential mediating variables to identify how the policy may exert influence through specific economic mechanisms. Second, external shocks such as the COVID-19 pandemic may impede financial access for vulnerable populations and compromise financial resilience, a key pillar of sustainable development. The analysis, therefore, also explores whether such shocks alter the transmission strength of the e-CNY pilot penetration. To this end, a migration-based mobility index is introduced to capture variations in urban dynamism and assess the extent to which economic resilience influences the inclusive and sustainable potential of digital currency systems.
7.1. The Mediating Mechanism Test
According to Hypothesis H2, which examines the relationship between the e-CNY pilot and wholesale and retail activities, this study incorporates relevant variables for analysis. Due to the limitations of the traditional three-stage mediation test [
72], this study adopts the four-stage mediation mechanism test method of Niu et al. [
73] and Zeng Guo-an et al. [
74]. Additionally, theoretical explanations are provided to enhance the empirical logic by clarifying the relationship between mediating and explanatory variables. The mediating mechanism model of this paper is as follows:
refers to the mediating variable, and the definitions of other variables remain consistent with Formula (1).
Specifically, the study includes the following: (a) Firm count : the number of wholesale and retail enterprises above the limit (count); (b) Firm sales : the total merchandise sales of the wholesale and retail enterprises above the limit (in CNY 100 million, log-transformed). The mediating variables are based on above-the-limit statistics, referring to enterprises that meet the national threshold (i.e., annual sales ≥ CNY 20 million for wholesalers and ≥ CNY 5 million for retailers).
Firm count is used to proxy the merchant-coverage channel, as it statistically reflects retail nodes with sufficient scale, operational stability, and service accessibility. Meanwhile, Firm sales is used to proxy the transaction-scale channel, as it captures the extent to which digital financial policies can boost overall market activity and, in turn, deepen the use of financial services.
Table 9 presents the mediation paths through which the e-CNY pilot influences financial inclusion. Columns (1) to (3) demonstrate that the pilot policy enhances inclusion primarily, firm count
, the number of above-the-limit wholesale and retail enterprises, representing the merchant-coverage channel. Columns (4) to (6) show that the policy also promotes inclusion by expanding firm sales
, capturing the transaction-scale channel. Across all six regressions, the key policy variable remains significantly positive, supporting the four-step mediation test and confirming Hypothesis H2. Further decomposition of mediation effects reveals that the e-CNY pilot generates an indirect effect of approximately 0.0686 via the merchant-coverage channel and 0.0353 via the transaction-scale channel, yielding a total indirect effect of 0.1039. Among these, the merchant-coverage channel accounts for about 66% of the total effect, while the transaction-scale channel contributes the remaining 34%. These results suggest that boosting the density of retail nodes plays a more central role in improving financial inclusion and advancing social equity, compared to simply expanding transaction volume, which tends to amplify the efficiency of existing networks rather than broadening access.
Meanwhile, referring to the mediation mechanism test suggested by Jiang Ting [
72], this study conducts a theoretical analysis of the relationship between the mediating variables and urban financial inclusion. Previous studies have shown that financial inclusion is closely linked to the development of the wholesale and retail sector, where commercial networks act both as points of capital circulation and as terminals for delivering financial services [
41,
42]. Higher consumption frequency helps foster consumer habits of using the e-CNY, while simultaneous growth in firm count and firm sales provides banks and payment providers with new data assets and customer entry points, thus promoting financial inclusion from both the supply and demand sides. According to Pittman et al. [
39], retail and wholesale activities stimulate economic activity and development by increasing society’s disposable capital. In the context of the pilot, above-the-limit wholesale and retail enterprises benefit from the e-CNY pilot’s zero intermediary fees and real-time settlement in both domestic and cross-border transactions. This lowers entry barriers for merchants and frees up cash flow, enabling firms to reinvest in supply expansion and market growth. The joint expansion of firm count and firm sales thus activates both the merchant-coverage channel and the transaction-scale channel, contributing not only to financial system efficiency but also to the broader goals of inclusive and sustainable urban development.
7.2. Moderation Mechanism and Transmission Pathways
After identifying the mediating role of merchant networks in the relationship between the e-CNY pilot and financial inclusion, this study further explores the moderating role of external economic conditions, particularly how shocks such as the COVID-19 pandemic may disrupt policy transmission. The downward diffusion of digital financial policies depends not only on institutional design and technological readiness but also on real-time economic mobility, population activity, and intercity economic connectivity during implementation.
To explore how local economic activity influences the strength of policy effects, the assessment introduces the migration index
as a moderating variable and uses it to assess the penetration capacity of the e-CNY pilot under varying city-level conditions. The migration index is constructed using daily population inflow and outflow data from Baidu Migration [
75]. It serves as a proxy for urban economic dynamism and population mobility. Since the migration index is only available from 2019 onward, our moderation analysis is confined to the 2019–2022 period, focusing on the critical stage after the policy rollout. Empirical findings and recent literature [
50] show that some cities experienced a temporary decline in financial inclusion following the pandemic, possibly due to retail channel disruptions and compressed consumer activity, suggesting that policy transmission may face structural bottlenecks.
Therefore, this study adopts moderated interaction models to capture this effect.
In the model, represents the migration index, and the other variables are defined consistently with previous specifications.
Table 10 presents the moderation regression results under different variable specifications. Mechanistically, the count of wholesale and retail enterprises reflects the “network node” dimension, indicating the infrastructure footprint of the e-CNY pilot; in contrast, enterprise sales represent the scale and vibrancy of commercial activity.
First, the merchant-coverage channel proves more critical. After incorporating the migration index, the mediation effect through firm count remains more significant than that through firm sales. This suggests that during the policy period, “how many merchants are available” matters more than “how much is being transacted” in improving financial inclusion. The success of the policy depends more on the density of financial infrastructure and the capacity of the commercial network than on total spending or transaction frequency, highlighting its role in fostering equitable access to financial services, especially for underserved urban populations. H4 is partially supported.
Second, the negative interaction terms reveal a “low-mobility, high-increment” pattern. As shown in column (1) of
Table 10, the coefficients on the interaction terms are significantly negative, indicating that the e-CNY pilot spurred a stronger increase in new wholesale and retail firms in cities with low mobility or stricter lockdowns. In contrast, in cities with high migration indices and saturated networks, the marginal effect of the policy diminished or even triggered structural consolidation. In low-mobility settings with limited digital infrastructure, the e-CNY pilot provides a low-cost entry point for traditional offline merchants. This creates a fill-in effect [
76], increasing node density and extending financial services to vulnerable groups, thereby supporting inclusive urban recovery. In contrast, in cities with ample mobility and dense networks, new payment scenarios are mostly embedded upgrades or online migrations, with smaller or redundant merchants being consolidated or crowded out—a crowding-out/consolidation effect [
77,
78]. By comparison, the interaction term for firm sales is also negative but negligible in magnitude, suggesting that transaction-scale gains mainly reflect incremental efficiency rather than contributing substantially to inclusive financial expansion.
Finally, transaction volumes appear insensitive to the migration index. In column (3), coefficients are statistically insignificant; in column (4), although the interaction term is significant, its magnitude is close to zero. This suggests that the transaction-scale channel mainly reflects efficiency gains in existing networks rather than substitution for new ones, rendering it less responsive to mobility variation.
Figure 7 provides a visual illustration of this pattern. In the left panel, cities with low migration levels show significantly greater policy-induced increases than those with high migration, whose confidence intervals are close to zero, indicating a minimal net effect. The right panel groups cities into low, medium, and high migration levels. Scatter plots and group-specific regression lines reveal that in high-migration cities, although the slope linking merchant coverage to financial inclusion is steeper, it exhibits greater volatility. By contrast, low-migration cities display more stable gains in financial inclusion from increased merchant coverage, supporting the distinction between the “fill-in” and “crowding-out” effects and reinforcing the results from
Table 10. Overall, the e-CNY pilot shows a “fill-in” expansion advantage in cities with limited mobility and underdeveloped commercial networks. It may thus play a stronger role in reducing regional disparities in financial access and advancing urban social equity. In contrast, in cities with higher mobility and mature markets, the policy tends to result in the consolidation of existing infrastructure and efficiency upgrading, improving transaction efficiency, but contributes less to expanding financial inclusion for underserved groups. In the early stage, the rollout of the e-CNY pilot relies heavily on policy incentives and infrastructure deployment. However, its resilience under external shocks is significantly constrained by the adaptability of usage scenarios and the capacity of the existing commercial network. Therefore, building a resilient digital financial ecosystem requires shifting policy emphasis from mere “coverage” to “deepening.” Such deepening supports financial sustainability and helps integrate vulnerable groups into the evolving financial landscape. This aligns with the broader goals of sustainable and inclusive development. Meanwhile, to sustain this deepening process, special attention should be paid to cities not yet included in current e-CNY trials, particularly those with limited mobility or underdeveloped commercial networks. These areas are likely to benefit most from digital financial integration, and thus require targeted support such as merchant subsidies, localized terminal deployment, and integration into online–offline service platforms.
8. Discussion
This study contributes to a growing body of literature that examines the social implications of central bank digital currencies (CBDCs) and digital finance. While much of the existing work has focused on the operational efficiency and technological design of CBDCs, relatively few studies have provided large-scale empirical assessments of their distributional outcomes, particularly in terms of inclusive financial access. In this regard, the present study provides complementary evidence to prior research by emphasizing how financial digitalization intersects with local structural conditions to shape policy outcomes. Moreover, while the long-term outcomes of CBDC adoption remain under active academic debate, this study provides empirical evidence that links digital currency policy to structural shifts in financial accessibility. By leveraging both official and self-constructed financial inclusion indicators, it offers a replicable framework for assessing regional policy spillovers in future CBDC research.
In contrast to studies that examine user preferences or institutional strategies, our work highlights the importance of infrastructure readiness and urban heterogeneity in determining the effectiveness of digital currency policies. The results underscore that technological deployment alone is insufficient; meaningful impact on financial inclusion depends on broader city-level characteristics such as mobility, saturation, and retail network density. This perspective aligns with recent discussions in the financial inclusion literature, which stress the spatial and contextual nature of access disparities.
The findings also contribute to the discourse on the Sustainable Development Goals (SDGs), particularly Goal 8 (Decent Work and Economic Growth) and Goal 10 (Reduced Inequalities). By documenting how the e-CNY pilot can enhance financial service access in underserved areas, especially under mobility constraints, the study supports a more nuanced understanding of how digital financial infrastructure can serve as a tool for inclusive and sustainable urban development.
9. Conclusions
Based on panel data from 271 cities between 2016 and 2022, this study employs a staggered difference-in-differences (SDID) model combined with the synthetic control method (SCM) to evaluate the policy impact of the e-CNY pilot program. The results show that the pilot significantly improves urban financial inclusion, thereby contributing to more equitable access to financial services, which is an essential component of sustainable socio-economic development. Mechanism analysis reveals that the policy effect transmits through two main channels: merchant coverage and transaction scale. The majority of the marginal gains are attributed to the merchant-coverage channel, while the transaction scale channel primarily reflects efficiency gains within existing networks, indicating that expanding basic financial access plays a more pivotal role in achieving inclusive growth. Furthermore, when accounting for economic mobility using a migration index, the impact of merchant density proves stronger in low-mobility cities but diminishes in already saturated urban markets. These results suggest that policy effectiveness hinges on the spatial configuration of financial infrastructure and local economic conditions.
Policy recommendations include improving supporting measures and incentive structures for e-CNY deployment, especially prioritizing investments in physical terminal infrastructure and merchant incentives, such as providing subsidies for merchants’ digital infrastructure upgrades and digital onboarding bonuses. Such measures are crucial not only for enhancing operational efficiency but also for narrowing regional service gaps and fostering financial equity as part of the broader sustainability agenda. Maintaining merchant activity through integrated online–offline scenarios can maximize the penetration multiplier and amplify inclusive financial benefits. For consumers, implementing incentive schemes such as randomized digital rebates or promotional e-CNY “red packets” during transactions could further enhance adoption and usage. As the e-CNY rollout expands in geographic scope, future pilot waves are expected to encompass more second- and third-tier cities. Given their typically lower baseline in financial infrastructure and mobility, these cities should not be overlooked. Instead, localized implementation strategies, tailored to varying institutional and commercial conditions, will be key to ensuring sustained traction and inclusive impact.
Due to data limitations, the mechanism variables used in this study are restricted to the number and sales of above-the-limit wholesale and retail enterprises, which do not fully capture the broader retail landscape or the participation of smaller businesses. As such, the results may underestimate the comprehensive impact of the e-CNY pilot on the sector. Moreover, this study does not fully capture the growth of payment terminals among small and micro businesses, nor the cross-channel deployment dynamics. Since these segments often represent vulnerable groups and underserved communities, future research should pay greater attention to their inclusion, which is fundamental for promoting long-term sustainability and inclusive economic growth. Meanwhile, this study does not incorporate bootstrap-based estimation of mediation effects, which could further enhance inference precision.
Future research can extend and deepen this study by improving methodological rigor, expanding data coverage, and exploring alternative measurement strategies. First, future work may consider applying bootstrap-based estimation or Monte Carlo resampling techniques in processing mediation effects, thereby improving the robustness and precision of empirical inference. Second, more appropriate mediator variables need to be explored, particularly those covering micro and small enterprises currently underrepresented in available datasets, to fully capture policy impacts on this crucial business segment. Third, to better evaluate the on-the-ground effectiveness of the e-CNY pilot initiatives, researchers should consider obtaining direct consumption and merchant-end payment data, such as merchant digital-wallet account openings, transaction flows, merchant categories, and enterprise scale. Future research may also explore the interaction or mutual reinforcement between structural and behavioral channels of policy transmission, for instance by testing interactive terms, causal sequences, or feedback loops across merchant coverage and transaction volume. Finally, future studies should identify more comprehensive outcome variables beyond financial inclusion, thereby providing broader insights into the e-CNY pilot’s role in promoting sustainable urban development and inclusive economic outcomes.


