1. Introduction
With the improvement in environmental awareness, consumers are increasingly inclined to a green lifestyle. In the survey by Accenture in 2019, nearly 80% of consumers surveyed say they intend to buy green products even more over the next five years [
1]. The Sustainable Consumer 2023 by Deloitte also shows that more consumers consider the green attributes of products when they make a purchase [
2]. Similarly, in a survey by PDI Technologies in 2023, 74% of consumers express concern about the environmental impact of products, and about 70% state that they are willing to pay a premium for green products [
3].
In view of the results of the above surveys, it is natural for firms to expect a promising outlook for green business. As a result, firms, especially manufacturing firms (manufacturers), have increasingly invested in green research and development (R&D) [
4], aiming to grasp the green market. From 2016 to March 2022, Apple issued a total of 4.7 billion dollars in bonds to support the development of green manufacturing and recycling technologies [
5]. In 2022, Lenovo announced plans to increase its green R&D investments in pursuit of net-zero emissions by 2025 [
6]. On 27 March 2023, Gree, a home appliance manufacturer in China, issued a 900 million RMB ultra-short-term green bond to support the R&D and production of air conditioners with the top level of energy efficiency [
7].
Despite tangible achievements, behind actively investing in green R&D, there is a looming concern in operations. Specifically, manufacturers may be overly bullish on the potential of green business [
8,
9] and keep an optimistic attitude toward green R&D. On the one hand, while consumers express the intention to buy green products in public, they may not do so [
10]. For example, The Elusive Green Consumer report uncovered that while 65% of interviewed consumers claim that they prefer to purchase green products, only approximately 26% do so. This indicates that the actual potential of green business may not be as great as manufacturers expect it to be. On the other hand, when investing in green R&D, manufacturers have an inherent green optimism: overestimating the potential of green business [
4,
8]. As highlighted in a social study in 2019 by Andrew Winston, 99% of firm CEOs argue that green business has a bright future [
11]. Driven by elusive green consumers and/or inherent green optimism, manufacturers may overestimate the market potential of green business and be optimistic about green R&D.
Despite having an optimistic preference for green R&D, manufacturers often have no demand information advantage over downstream retailers [
12]. Because retailers are closer to the end market, they can better forecast demand information [
13,
14]. With the large amount of sales data it collects, Wal-Mart can better forecast market demand and thus have a demand information advantage [
15]. Moreover, as e-commerce continues to boom, e-tailers (e.g., Amazon, JD.com, and Tmall) naturally accumulate large amounts of consumer data, such as clickstream and purchase history. With these data, e-tailers can also forecast market demand [
14]. Therefore, manufacturers, having an optimistic preference for green R&D, face the dilemma of inferior demand information. In this case, what is the impact of optimistic green R&D? As far as we know, no study has completed a quantitative analysis to investigate the impacts of optimistic green R&D on the green supply chain with demand information asymmetry. This serves as the motivation to investigate the following key questions:
(1) Within a green supply chain characterized by demand information asymmetry, is optimistic green R&D beneficial to information communication?
(2) Can optimistic green R&D bring higher profits for the manufacturer and have a positive impact on the downstream retailer’s profits?
(3) Does optimistic green R&D generate higher environmental performance?
To answer the research questions above, we focus on a two-tier green supply chain that includes a single manufacturer and a single retailer. Of these, the manufacturer invests in green R&D and can choose realistic green R&D or optimistic green R&D. Following Ma et al. [
4], we assume that green R&D is a one-time investment. Since retailers are closer to the end market, we assume that the retailer can better forecast market demand and thus have a demand information advantage. Based on the manufacturer’s green R&D, the retailer can create an information-sharing policy: sharing or not. Through this paper, we aim to clarify the implications of optimistic green R&D in the green system with demand information asymmetry. The contributions can be illustrated from theoretical and managerial perspectives.
1.1. Contribution to Literature
In the context of a supply chain, many scholars have explored green R&D and made significant contributions, such as Chen et al. [
16], Li et al. [
17], Hua et al. [
18], Dong et al. [
19], and Yu et al. [
20]. However, they often assume that the manufacturer is sufficiently rational to green R&D. As analyzed in the third paragraph of the Introduction, manufacturers may overestimate the market potential of green business and have an optimistic view of green R&D. Notably, although having an optimistic preference, the manufacturer often has no demand information advantage over the retailer. In this case, what is the impact of optimistic green R&D? As far as we know, no study has conducted a quantitative analysis on this question. To bridge this gap, this study aims to unravel optimistic green R&D in a green supply chain with demand information asymmetry.
1.2. Summary of Results
According to the research questions, we introduce the stylized model to explore the impacts of optimistic green R&D under information asymmetry and then find the following novel results.
First, optimistic green R&D leads to CEA (consumer environmental awareness) being counterproductive to the product’s green performance. The root reason is that optimistic green R&D induces the manufacturer to make an upwardly distorted decision on green R&D investment, which is improved by CEA. Thus, consumers should be careful about expressing their preference for green products because this action may lead to backfiring. Moreover, the retailer with a demand information advantage may hinder the manufacturer’s green R&D, weakening the product’s green performance. This is because the retailer may provide negative demand information to the manufacturer, which reduces the manufacturer’s enthusiasm for green R&D.
Second, optimistic green R&D impacts the retailer’s information policy significantly. Specifically, optimistic green R&D can lead to the retailer needing to consider not only the manufacturer’s efficiency in green R&D but also CEA when making an information-sharing decision. Notably, optimistic green R&D also increases the retailer’s feasible range to share demand information, facilitating demand information communication between the manufacturer and the retailer. The reason is that optimistic green R&D strengthens the beneficial green R&D investment improvement generated by information sharing, thus incentivizing the retailer to collaborate with the manufacturer on information.
Third, optimistic green R&D can maximize the profits of both the manufacturer and the retailer simultaneously, thereby bringing a win–win outcome. Nevertheless, optimistic green R&D cannot allow the manufacturer to earn more in most cases and even has a negative impact on the retailer’s interests, thereby leading to a loss–win or loss–loss outcome. Thus, the manufacturer needs to remain cautious about optimistic green R&D.
Finally, optimistic green R&D may generate lower environmental benefits, harming the environment. The reason is that optimistic green R&D (indirectly) results in a higher retail price and a lower market demand. When this negative effect of market demand reduction prevails, optimistic green R&D harms the environment. Given this, the government should not induce manufacturers to make blindly optimistic investments in green R&D.
The rest of this paper is presented as follows:
Section 2 reviews the related literature and highlights the distinctions of our study;
Section 3 outlines our study model;
Section 4 derives equilibrium decisions and examines the influences of optimistic green R&D and the retailer’s demand advantage upon green R&D;
Section 5 delves deeper into optimistic green R&D; and
Section 6 concludes the main results, managerial insights, and recommendations for further studies.
3. Model Framework
To answer the three research questions in the introduction, we consider a sustainable supply chain comprising a single green manufacturer and a single retailer. In this green system, the manufacturer conducts green R&D to enhance its product environmental performance and provides products to the retailer at a unit wholesale price
. To facilitate theoretical analysis, the unit production cost
is normalized to zero [
38]. For any
, the directionality of results is not changed. The retailer sells these products at the unit price
.
As consumers have environmental awareness, the environmental attributes of the products have a positive impact on market demand. In contrast, the pricing of the retailer negatively impacts its market demand, thanks to consumers’ sensitivity to retail prices. Considering this and to model demand information asymmetry, we follow the existing works in the field of operations management (e.g., Yu et al. [
13] and Wang et al. [
35]) and use a standard linear function to model a market demand, as shown below
where
represents a basic market scale.
is a random variable that captures the uncertainty in the market, with a mean of zero and a variance of
[
14,
20,
37].
(
) represents a green R&D effort by the manufacturer, reflecting the environmental attribute of the unit product.
measures consumer environmental awareness (CEA) and has two states:
and the possibility is
;
and the possibility is
. This reflects the existence of two consumer groups within the market. That is,
denotes a proportion of low-CEA consumers (
), while
denotes the proportion of high-CEA consumers (
). Then, the mean of
is
. Without loss of generality,
is normalized to
, then giving
.
3.1. Manufacturer’s Green R&D
To uncover the impacts of optimistic green R&D, we consider the two types of green R&D: realistic green R&D and optimistic green R&D. In addition, we also investigate pessimistic green R&D and find that the manufacturer does not adopt this R&D strategy.
Realistic green R&D. When investing in green R&D, the manufacturer may be sufficiently rational for the potential of green business, thereby keeping a realistic attitude for green R&D, as assumed by existing studies (e.g., Chen et al. [
16], Li et al. [
17], Hua et al. [
18], and Dong et al. [
19]). Thus, we characterize realistic green R&D as follows: the manufacturer conducts green R&D by taking a realistic view on the potential of green business, which neither underestimates the proportion of low-CEA consumers nor overestimates the proportion of high-CEA consumers. Then, the manufacturer’s belief about CEA is
.
Optimistic green R&D. As uncovered by White et al. [
10], while 65% of consumers claim that they prefer to buy green products, only approximately 26% do so. This indicates that the actual potential of green business may not be as great as the manufacturer expects it. Thus, when investing in green R&D, the manufacturer may well overestimate the potential of green business [
8,
9]. Given this, we characterize optimistic green R&D as follows: the manufacturer conducts green R&D by overestimating the proportion of high CEA consumers to be
(overestimating the potential of green business), here
. This modeling of optimistic preference is also adopted by Jiang and Liu [
29]. Then, the manufacturer’s belief about CEA is
. To facilitate the analysis, we focus on the completely optimistic case, i.e.,
. For any
, the key results are robust.
Assumption 1. Green R&D cost .
Green R&D often involves investment activities of diseconomies of scale or diminishing returns, such as the development of low-carbon materials and the upgrade of green manufacturing technologies. Thus, let
represent the green R&D cost, and we can derive
and
. For analytical tractability, we assume the green R&D cost of the manufacturer
, where
(
) represents the green R&D efficiency. This quadratic cost function is widely adopted in the literature on sustainable operations, such as Yu et al. [
20] and Li et al. [
29].
3.2. Demand Information Asymmetry
In a supply chain, because of a closer position to the end market than the manufacturer, the retailer often can possess more market demand information [
12,
13]. This results in demand information asymmetry. While Jin et al. [
8] investigated the influence of optimism, this assumption makes our study different from theirs. In Jin et al. [
8], demand information is symmetric.
To characterize demand information asymmetry and cover the impact of optimistic green R&D on demand information sharing, we adopt the demand forecast model to characterize this information advantage of the retailer. In previous studies, such as Yu et al. [
13], Wang et al. [
34], and Ha et al. [
38], the demand forecast model has also been used to characterize this information advantage of the retailer and study information sharing. Specifically, the retailer can have access to the demand signal
about the demand uncertainty
, and
serves as an unbiased estimator of
, i.e.,
. Further, we assume that given the signal
, the expectation of
follows a linear relationship with
, i.e.,
. This structure has been widely used by studies on information sharing (e.g., Yu et al. [
13], Tang et al. [
14], and Wang et al. [
37]). Here,
, indicating the retailer’s signal accuracy. Specifically, when
,
, which indicates that the signal
cannot provide useful information, and when
,
, which indicates that the signal
can provide perfect information, i.e.,
can be estimated by
perfectly.
To turn its information advantage into an economic benefit, the retailer can strategically decide to share this information with the manufacturer based on its green R&D strategy. Thus, the retailer faces two potential decisions: to either keep or share information.
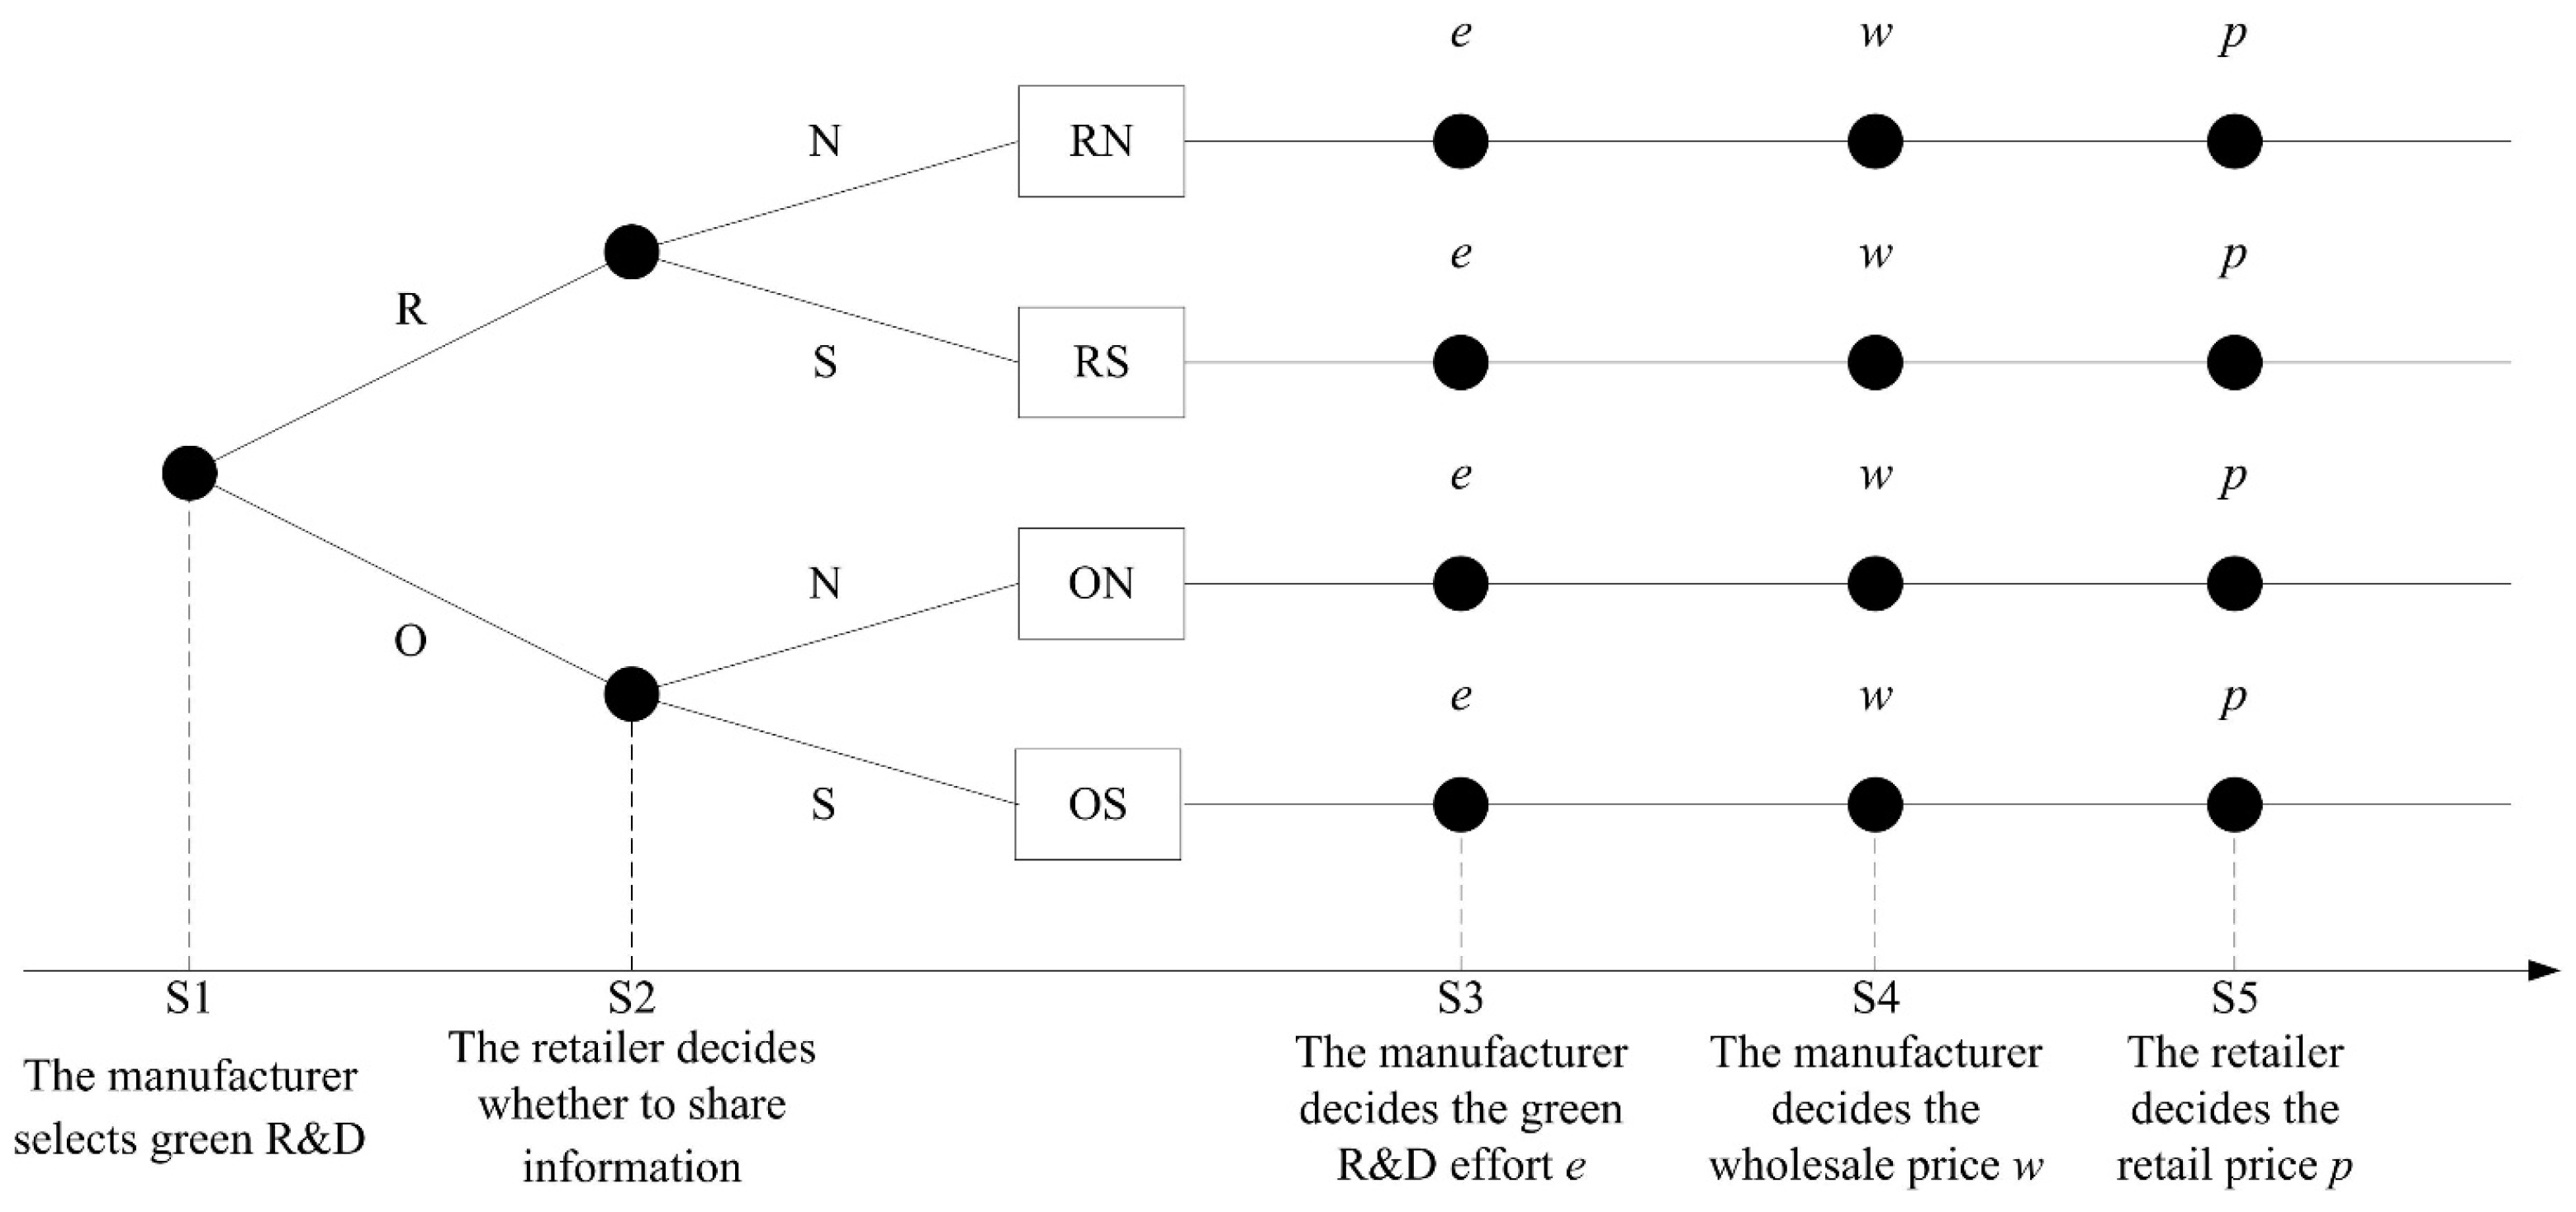
3.3. Sequence of Events
We consider a multistage game, which can be divided into the following five stages. For an intuitive understanding of how the game proceeds,
Figure 1 shows the sequence of the game.
In stage 1 (S1), the manufacturer chooses a green R&D: realistic green R&D (R) or optimistic green R&D (O).
In stage 2 (S2), based on the manufacturer’s green R&D (R or O), the retailer will choose a demand information sharing strategy: no sharing (N) or sharing (S). Then, there exist the four scenarios, i.e., RN, RS, ON, and OS.
In stage 3 (S3), under each scenario (i.e., RN, RS, ON, OS), the manufacturer decides the green R&D effort .
In stage 4 (S4), under each scenario (i.e., RN, RS, ON, OS), the manufacturer decides the wholesale price .
In stage 5 (S5), under each scenario (i.e., RN, RS, ON, OS), the retailer decides the retail price .
Finally, symbols in this paper are summarized in
Table 1.
4. Equilibrium Outcome and Analysis
Building upon the analysis above, the manufacturer’s green R&D strategy, whether realistic or optimistic, leads to two possible information scenarios for the retailer: keeping information or sharing it. Thus, under realistic green R&D, the two strategy scenarios will appear, namely RN and RS. Similarly, the two strategy scenarios also appear under optimistic green R&D, namely ON and OS. In this section, our purpose is to determine the optimal decisions under these strategy scenarios. Using backward induction, we can first derive the optimal retail price, then the optimal wholesale price, and finally the optimal green R&D effort.
4.1. Realistic Green R&D
No information sharing. When the manufacturer adopts realistic green R&D and then the retailer opts not to share information, the manufacturer’s belief about CEA level
is
and about
is
, while the retailer’s belief about
is
and about
is
. Thus, their expected profit functions can be expressed as
Then, based on Equations (2) and (3), we have Lemma 1.
Lemma 1. Under the strategy scenario RN, the equilibrium green R&D effort, wholesale price, and retail price, respectively, are
Lemma 1 indicates that under realistic green R&D, should satisfy . If , the optimal decisions (i.e., , , and ) will be negative or zero, thus losing economic sense.
Information sharing. When the manufacturer adopts realistic green R&D and then the retailer opts to share information, the manufacturer’s belief about CEA level
is still
, and yet about
, it is
; the retailer’s belief about
is
and about
is
. Thus, their expected profit functions can be written as
Then, based on Equations (4) and (5), we have Lemma 2.
Lemma 2. Under the strategy scenario RS, the equilibrium green R&D effort, wholesale price, and retail price, respectively, are
4.2. Optimistic Green R&D
No information sharing. When the manufacturer adopts optimistic green R&D and the retailer has no information sharing, the manufacturer’s belief about the CEA level
is
and about
is
, while the retailer’s belief about
is
and about
is
. Then, their expected profit functions can be written as
Then, based on Equations (6) and (7), we have Lemma 3.
Lemma 3. Under the strategy scenario ON, the equilibrium green R&D effort, wholesale price, and retail price, respectively, are
Lemma 1 indicates that under realistic green R&D, should satisfy . If , the optimal decisions (i.e., , , and ) will be negative or zero, thus losing economic sense.
Information sharing. When the manufacturer adopts optimistic green R&D and the retailer has information sharing, the manufacturer’s belief about
still is
and yet, about
, it is
; the retailer’s belief about
is
and about
is
. Then, their expected profit functions can be expressed as
Then, based on Equations (8) and (9), we have Lemma 4.
Lemma 4. Under the strategy scenario OS, the equilibrium green R&D effort, wholesale price, and retail price, respectively, are
Based on Lemmas 1, 2, 3, and 4, we have the optimal profits of the manufacturer and the retailer, which is summarized in
Table 2.
Moreover, we investigate how optimistic green R&D and demand information sharing influence green R&D investments, giving us Proposition 1.
Proposition 1. (1) ; if and if.
(2) and .
where and .
Proposition 1 (1) shows that optimistic green R&D always improves the product’s environmental performance, which is not changed by the retailer’s information sharing (i.e.,
), as shown in
Figure 2a. The reason is that the manufacturer overestimates the fraction of consumers with a high CEA level under optimistic green R&D. Thus, from the manufacturer’s perspective, the green product has a good market potential. Then, the manufacturer invests in a higher green R&D effort. In addition, Proposition 1 (1) also shows that the retailer with the demand information advantage may encourage or discourage green R&D of the upstream manufacturer, which depends on its demand signal
. The negative signal, i.e.,
, indicates that the market is depressing. Thus, information sharing induces the manufacturer to decrease the investment in green R&D, then
. The positive signal, i.e.,
, indicates that the market is booming. Then, information sharing encourages the manufacturer to increase the investment in green R&D, then
.
Figure 2b illustrates these analyses intuitively.
Proposition 1 (2) reveals that the manufacturer’s green R&D significantly affects the link between CEA (consumer environmental awareness) and the product’s environmental performance. Under realistic green R&D, an increase in CEA positively influences the product’s environmental performance because the manufacturer keeps an unbiased belief about the CEA level. Thus, as CEA rises, the manufacturer’s investment in green R&D also increases, which is illustrated by
Figure 2a. Under optimistic green R&D, CEA negatively impacts the product’s environmental performance. The reason is that under optimistic green R&D, the manufacturer overestimates the fraction of high CEA consumers, keeping a biased belief about CEA. Notably, such biased belief is close to the unbiased belief as CEA increases. That is, with CEA increasing, the green R&D effort under optimistic green R&D approaches that of realistic green R&D, as shown in
Figure 2a.
5. Impacts of Optimistic Green R&D
Section 4 gives each member’s optimal decisions and optimal profits of the manufacturer and the retailer. This section will uncover the impacts of optimistic green R&D.
5.1. The Impact on Information Sharing
To understand how optimistic green R&D affects the retailer’s information sharing, we first investigate its decision to share information under two green R&D strategies. By comparing the optimal profit without and with information sharing under the two green R&D, respectively, we obtain Proposition 2.
Proposition 2. The optimal information-sharing decision is shown as
(1) Under realistic green R&D, the retailer shares information if ;
(2) Under optimistic green R&D, the retailer shares information if and , or and .
where , and .
Figure 3 illustrates Proposition 2 visually.
Proposition 2 provides insights into how the retailer with the demand information advantage should decide on sharing information in response to the green R&D by the upstream manufacturer. Sharing information strengthens the manufacturer’s capability to make an informed green R&D decision, which generates the improvement effect of green R&D investment. Meanwhile, sharing information also allows the manufacturer to adjust the wholesale price decision more responsively, which exacerbates the double marginalization effect. Consequently, when the positive effect brought by information sharing outweighs its negative effect, the retailer will share information. Otherwise, it will keep the information.
Proposition 2 (1) uncovers that if the manufacturer adopts realistic green R&D, its R&D efficiency plays a key role in deciding whether the improvement effect of green R&D investment or the double marginalization effect prevails. In detail, when the efficiency is higher, i.e.,
, the improvement effect dominates the double marginalization effect, then inducing the retailer to opt for information sharing, as shown in the blue area of
Figure 3a.
Proposition 2 (2) shows that if the manufacturer adopts optimistic green R&D, both CEA (consumer environmental awareness) and green R&D efficiency are pivotal in deciding which effect dominates. This is because under optimistic green R&D, the manufacturer keeps a biased belief about CEA, allowing CEA to influence a balance between the improvement effect of green R&D investment and the double marginalization effect. When CEA is lower (higher), i.e.,
(
), the improvement effect will prevail if the green R&D efficiency is higher, i.e.,
(
). Then, the retailer opts to share information, as shown in the yellow area of
Figure 3b.
Next, by comparing the feasible range that the retailer shares information under realistic green R&D with that under optimistic green R&D, we obtain Proposition 3.
Proposition 3. Optimistic green R&D enlarges the retailer’s feasible range to share information.
As previously mentioned, under optimistic green R&D, the manufacturer keeps a biased belief about CEA, resulting in a distortion of the wholesale price and then exacerbating the double marginalization effect. Then, optimistic green R&D has the potential to be harmful to the retailer, weakening its willingness to share information. Significantly, Proposition 3 uncovers that if the manufacturer adopts optimistic green R&D, the retailer is more inclined to share information with it. This counterintuitive result arises because, under optimistic green R&D, even though the wholesale price is distorted, the manufacturer makes a higher green R&D effort, which amplifies the improvement effect of green R&D investment generated by information sharing. Consequently, if the manufacturer adopts optimistic green R&D, the retailer is incentivized to collaborate with it on information.
5.2. The Impact on Performance of the Manufacturer and the Retailer
To understand the impacts of optimistic green R&D on the performance of the manufacturer and the retailer, we need to investigate when manufacturers will opt for optimistic green R&D and then derive the equilibrium strategy in the sustainable supply chain.
Proposition 4. When, the manufacturer does not adopt optimistic green R&D, and when , the manufacturer adopts optimistic green R&D.
Proposition 4 shows that the willingness of the manufacturer to undertake optimistic green R&D is only related to its R&D efficiency. Optimistic green R&D leads to more R&D efforts from the manufacturer, as shown in Proposition 1 (1). Intuitively, one might expect that higher green R&D efficiency would make the manufacturer choose optimistic green R&D. However, Proposition 4 reveals that the manufacturer does not undertake optimistic green R&D when its R&D efficiency is high, i.e., . The reason lies in the fact that, in this case, the R&D effort under optimistic green R&D would be zero, which leads the manufacturer to lose the market. When the R&D efficiency is low, i.e., , such an extreme decision under optimistic green R&D will be improved, thus the green R&D effort is positive. Then, the manufacturer is more inclined to adopt optimistic green R&D.
The result of Proposition 4 is different from the findings of previous studies (e.g., Jin et al. [
8]). They found that optimism always adversely impacts the manufacturer. One explanation for this pertains to the difference in the investment cost. In their studies, the investment cost of the manufacturer is not a one-time cost, but rather is related to market demand. In this setting, although optimism improves demand (since the investment increases), it also increases costs accordingly. In contrast, when the R&D cost is a one-time cost, increased demand does not lead to a corresponding increase in investment costs. This allows the manufacturer to benefit from optimism. More importantly, as Proposition 3 suggests, optimistic green R&D encourages information cooperation, which is advantageous for the manufacturer. By examining optimistic green R&D under retailer demand information advantage, we shed light on the upside of optimism for the manufacturer, contributing to the literature on optimism.
Combining Propositions 2 and 4, the equilibrium strategy in the sustainable supply chain can be derived easily, as shown in
Table 3.
When
, the manufacturer adopts realistic green R&D, and then the retailer shares information if
, as shown in the blue area of
Figure 4; if
, the manufacturer adopts realistic green R&D and then the retailer opts not to share information, as shown in the orange area of
Figure 4.
When
, the manufacturer adopts optimistic green R&D and then the retailer shares information if
and
, or
and
, as shown in the yellow area of
Figure 4; if
and
, or
and
, the manufacturer adopts optimistic green R&D and then the retailer opts not to share information, as shown in the pink area of
Figure 4. Moreover,
Figure 4 visually illustrates that in most cases, the manufacturer is motivated to adopt optimistic green R&D.
By comparing the profits of the manufacturer and the retailer under four equilibrium strategies, we obtain Proposition 5.
Proposition 5. Optimistic green R&D leads to a win–win, loss–win, or loss–loss outcome for the manufacturer and the retailer, as shown in Table 4. Figure 5 is presented to visually illustrate the results of Proposition 5.
When
and
, or
and
, the manufacturer adopts optimistic green R&D, which induces the retailer to provide demand information to it. Then,
OS is the game equilibrium outcome. Consequently, optimistic green R&D can maximize profits of all members, bringing about an optimistic outcome, as shown in “
OS: win–win” in
Figure 5.
When
and
, or
and
, the manufacturer also adopts optimistic green R&D, yet this leads the retailer to keep information. Then,
ON is the game equilibrium outcome. As a result, optimistic green R&D does not maximize the manufacturer’s interest, yet it maximizes the retailer’s interest. This indicates that optimistic green R&D cannot create an optimistic outcome for the manufacturer, yet it can create an optimistic outcome for the retailer, as shown in “
ON: loss–win” in
Figure 5.
When
and
, or when
and
, the manufacturer still adopts optimistic green R&D, and then the retailer also still keeps demand information. Then,
ON is the game equilibrium outcome. However, in this case, optimistic green R&D fails to maximize interests for both the manufacturer and the retailer. This shows that optimistic green R&D cannot create an optimistic outcome for all members, as shown in “
ON: loss–loss” in
Figure 5.
Moreover, from the above analysis, it can be summarized that when the manufacturer cannot benefit from optimistic green R&D, the retailer still might benefit from this R&D behavior. Thus, it can be concluded that despite the manufacturer making a strategic decision before the retailer, the manufacturer does not enjoy a first-mover advantage.
5.3. The Impact on the Environment
To assess the environmental impact of optimistic green R&D, we refer to Yu et al. [
19] and define environmental benefits as
. Further, we attempt to obtain Proposition 6.
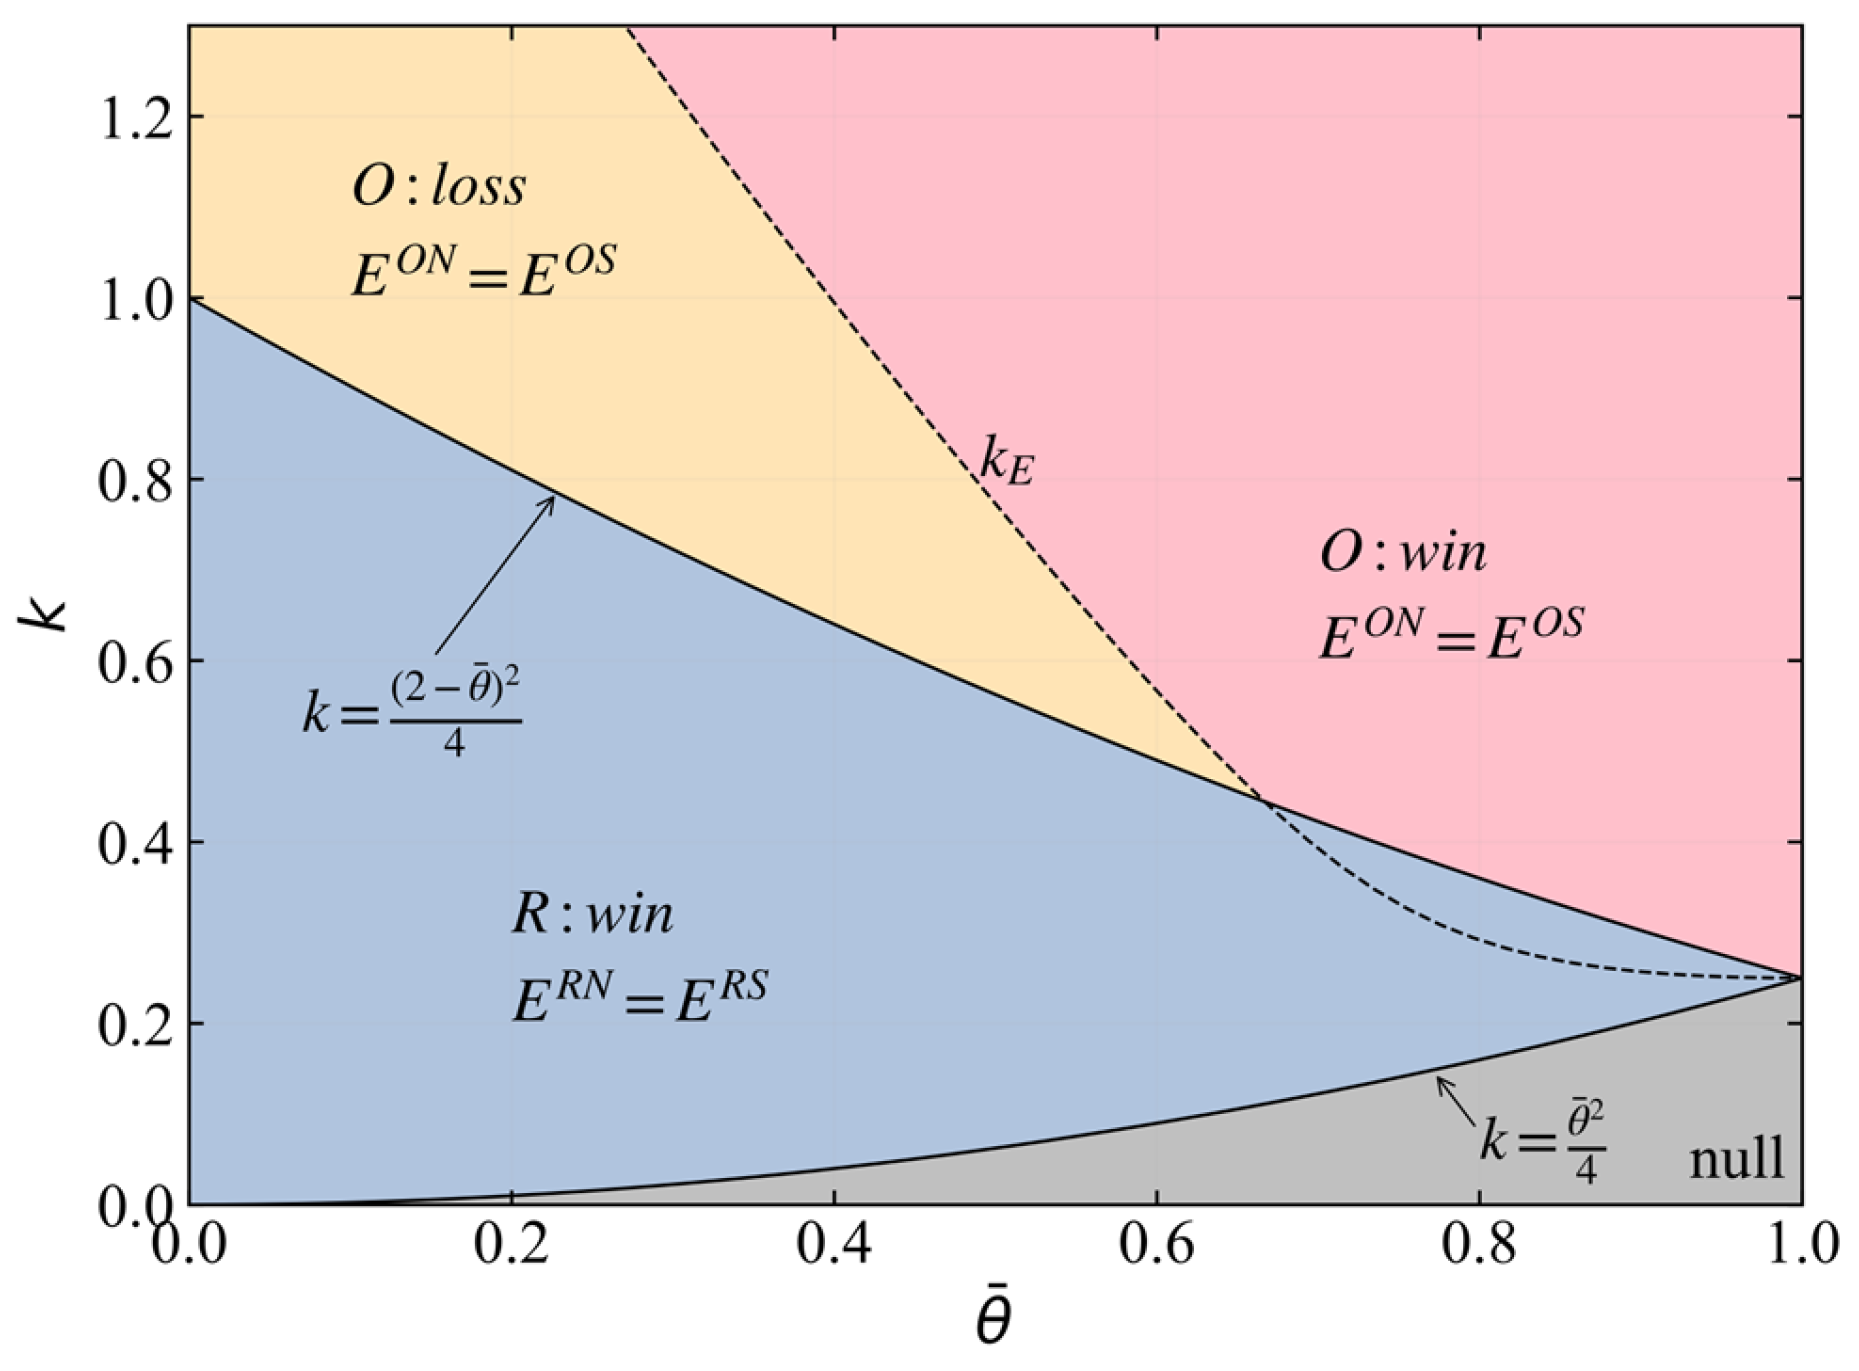
Proposition 6. When , optimistic green R&D will reduce environmental benefits, i.e., .
Figure 6 illustrates Proposition 6. As discussed previously, when
, the manufacturer pursues optimistic green R&D. However, this may negatively affect the environment. Specifically, when
, optimistic green R&D harms the environment, as indicated by “
O: loss” in
Figure 6. The reason is that optimistic R&D leads the manufacturer to make a more aggressive investment if its R&D efficiency is high (i.e.,
). This results in a significant increase in the retail price of the green product, causing a sharp decline in the market demand. As a result, the negative effect of optimistic green R&D outweighs its positive effect. Then, optimistic green R&D harms the environment. In contrast, when
and
, optimistic green R&D benefits the environment, as shown by “
O: win” in
Figure 6. This is because a lower green R&D efficiency (i.e.,
and
) restrains the manufacturer from making a more aggressive green R&D investment under optimistic green R&D, which is beneficial for the environment. Notably, when
, the manufacturer opts for realistic green R&D. This always benefits the environment, as indicated by “
R: win” in
Figure 6. As mentioned before, when
, the green R&D effort under optimistic green R&D will be zero. As a result, this allows realistic green R&D to benefit the environment.
In addition, from
Figure 6, we can observe that
and
. Thus, the retailer’s information sharing does not influence environmental benefits. As mentioned in Proposition 1 (1), information sharing may positively or negatively affect green R&D effort, indirectly leading demand to decrease or increase. Thus, under the two-effect interaction, information sharing does not change environmental benefits. In the proof of Proposition 6, we give theoretical analyses of the descriptions in
Figure 6.
6. Conclusions
In the field of operations management for green supply chains, studies on green R&D often argue that a manufacturer is sufficiently rational for green R&D. However, optimism is the underlying logic for investing in R&D. Then, when conducting green R&D, a manufacturer tends to keep an optimistic attitude. Importantly, despite having such an optimistic preference, a manufacturer often has no demand information advantage over a downstream retailer. Then, within a green supply chain with demand information asymmetry, what implications does a manufacturer’s optimistic green R&D have? Existing studies have not managed to reveal this. For this, we induce a stylized model to study this issue.
Our key findings are summarized as follows: (1) Optimistic green R&D favors the enhancement of the product’s environmental attribute. However, this benefit brought by optimistic green R&D will diminish and even disappear with increasing CEA (consumer environmental awareness). Moreover, within a green supply chain characterized by demand information asymmetry, the manufacturer’s green R&D might be hindered by the retailer with the demand information advantage. (2) Optimistic green R&D significantly impacts information sharing. On the one hand, under optimistic green R&D, when the retailer makes the information sharing decision, it needs to consider not only the manufacturer’s R&D efficiency but also CEA. Furthermore, the retailer may need to reduce the willingness to share information as CEA increases. Notably, optimistic green R&D increases the feasible range of information sharing, then benefiting information communication. (3) Within a green supply chain with demand information asymmetry, optimistic green R&D can maximize the profits of both the manufacturer and the retailer simultaneously, bringing a win–win optimistic outcome. However, on the whole, this R&D is more likely to lead to a loss–win outcome or even a loss–loss outcome. (4) Optimistic green R&D may be harmful to the environment, though it improves the product’s environmental attributes.
According to the above findings, we summarize several managerial insights and implications, as shown in
Table 5. On a more general note, these managerial insights and implications are potentially applicable to a broader class of investments that are demand-enhancing (e.g., low-carbon investment, product quality investment). It will be interesting to explore this in future research.
Several directions can be explored. First, we did not consider the role of the environmental tax. In reality, some countries implement this policy to improve the environment. Thus, under the constraint of environmental tax, optimistic green R&D can be further investigated. Second, we did not consider downstream competition. In reality, the manufacturer may sell the green product via multiple retailers. Thus, under the downstream competition scenario, it is crucial to study how optimistic green R&D affects the information sharing. Third, we assumed that there is no green R&D collaboration within the green supply chain. In reality, such cooperation may exist. Thus, an exciting avenue may be to investigate green R&D cooperation under demand information asymmetry.
7. The Proof of Lemmas and Propositions
Proof of Lemma 1. Based on Equation (3), we can derive . Then, by letting , we can derive the optimal retail price . Noting that , we can derive .
Under the RN scenario, since the retailer does not share demand information (or signal) with the manufacturer, from the (uninformed) manufacturer’s perspective, the optimal retail price . Then, by substituting into Equation (2), we can obtain . Since , we can derive the optimal wholesale price by letting . Noting that and , we can derive , thus .
Since , from the (uninformed) manufacturer’s perspective, the optimal retail price . Then, by substituting and into Equation (1) and noting that , we have . Since , we can derive the optimal green R&D effort by letting . Noting that , we can derive .
Finally, by substituting into , we can derive . By substituting and into , we can derive . Note that , thus .
The proof of Lemma 1 is completed. □
Proof of Lemma 2. Based on Equation (5), we can derive . By letting , we can derive the optimal retail price .
Since the retailer shares demand information, from the manufacturer’s perspective, the optimal retail price . By substituting into Equation (4), we can obtain . Since , we can derive the optimal wholesale price by letting . Since and , we derive .
By substituting and into Equation (4), we can derive .
Finally, by substituting into , we can derive . By substituting and into , we can derive .
The proof of Lemma 2 is completed. □
Proof of Lemma 3. Similar to the proof of Lemma 1, so we omit it. □
Proof of Lemma 4. Similar to the proof of Lemma 2, so we omit it. □
Proof of Proposition 1. (1) Based on Lemmas 1, 2, 3, and 4, we can derive
Thus, we have , where .
Similarly, based on Lemmas 1, 2, 3, and 4, we can derive
Since , may be positive, negative, or zero, we have the following:
when is positive, and ;
when is negative, and ;
when is zero, and .
Thus, based on the above analysis, we can determine , which depends on the signal , where .
(2) Based on Lemmas 1, 2, 3, and 4, we can derive
Thus, we have , where .
The proof of Proposition 1 is completed. □
Proof of Proposition 2. (1) Based on
Table 2, we can derive
By solving
, we can derive
and
.
Since , is not considered, we know that when ,.
(2) Based on
Table 2, we can derive
,
where .
By solving , we can derive and . Further, we know that when , ; when , ; when , .
Thus, we can determine that when and , or when and , .
The proof of Proposition 2 is completed. □
Proof of Proposition 3. Based on the proof of Proposition 2 (1), we can determine that under realistic green R&D, the threshold of the information sharing is . Thus, we can derive that when the manufacturer adopts realistic green R&D, the feasible range of the information sharing can be written as . Thus, we have Similarly, based on the proof of Proposition 2 (2), we can determine that under optimistic green R&D, the threshold of the information sharing is if , and the threshold of the information sharing is if . Thus, we can derive that when the manufacturer adopts optimistic R&D, the feasible range of the information sharing is written as . Then, we can determine .
Proof of Proposition 4. The constraint conditions on the equilibrium decisions under the two green R&D strategies are different. Thus, to investigate the manufacturer’s preference on optimistic green R&D, we need to focus on two cases, i.e., and .
(1) When , we can easily derive , where , because under optimistic green R&D, the manufacturer’s decisions (i.e., the green R&D effort and the wholesale price) will be zero if . Thus, in this case, realistic green R&D is the manufacturer’s optimal green R&D strategy.
(2) When
, we can derive
Then, we can determine that when
, optimistic green R&D is the manufacturer’s optimal green R&D strategy.
The proof of Proposition 4 is completed. □
Proof of Proposition 5. We have derived the equilibrium strategy in the green supply chain, as shown in analysis of Proposition 4. That is, the manufacturer adopts realistic green R&D and then the retailer does not share information (
RN); the manufacturer adopts realistic green R&D and then the retailer shares information (
RS); the manufacturer adopts optimistic green R&D and then the retailer does not share information (
ON); and the manufacturer adopts optimistic green R&D and then the retailer shares information (
OS). The feasible regions corresponding to these four equilibrium strategies are summarized in
Figure 4.
To investigate whether optimistic green R&D can lead to an optimistic outcome, we need to compare profits of the manufacturer and the retailer under the four equilibrium strategies.
We can derive that when
,
In addition, based on the proof of Proposition 4, we know that when , and . Thus, we know that when , .
Similarly, we can derive that when
,
where
.
By solving
, we have
Since
,
is not considered, we can determine that
when , ;
when , ;
when , .
Therefore, we determine that
when and , or when and , and .
Recall that when , and when and (or and ), the manufacturer adopts optimistic green R&D and the retailer shares information. That is, OS is the equilibrium strategy in the green supply chain. In this case, optimistic green R&D creates an optimistic outcome for the manufacturer and the retailer.
When , and when and (or and ), the manufacturer adopts optimistic green R&D and the retailer does not share information. That is, ON is the equilibrium strategy in the green supply chain. In this case, optimistic green R&D does not create an optimistic outcome for the manufacturer, yet it creates an optimistic outcome for the retailer.
When , and when and (or and ), the manufacturer adopts optimistic green R&D and the retailer does not share information. That is, ON is the equilibrium strategy in the green supply chain. In this case, optimistic green R&D does not create an optimistic outcome for the manufacturer or the retailer.
Finally, we can conclude that optimistic green R&D leads to a win–win, loss–win, or loss–loss outcome for the manufacturer and the retailer.
The proof of Proposition 5 is completed. □
Proof of Proposition 6. Based on Lemmas 3 and 4, we can derive that when ,
Further, we can derive
,
where .
By solving , we can obtain ,
where ,
,
.
Therefore, we can know that if . Further, we know that optimistic green R&D is beneficial to the environment if ; otherwise, optimistic green R&D is harmful to the environment.
In the following, we investigate the impact of realistic green R&D on the environment.
As analyzed before, when , under optimistic green R&D, the optimal decisions are zero. In this case, we can easily derive . Furthermore, based on Lemmas 4.1 and 4.2, we have . Thus, we can know that when , realistic green R&D benefits the environment.
The proof of Proposition 6 is completed. □


