
Research on the Implementation Effects, Multi-Objective Scheme Selection, and Element Regulation of China’s Carbon Market

Abstract
1. Introduction
2. Methodology
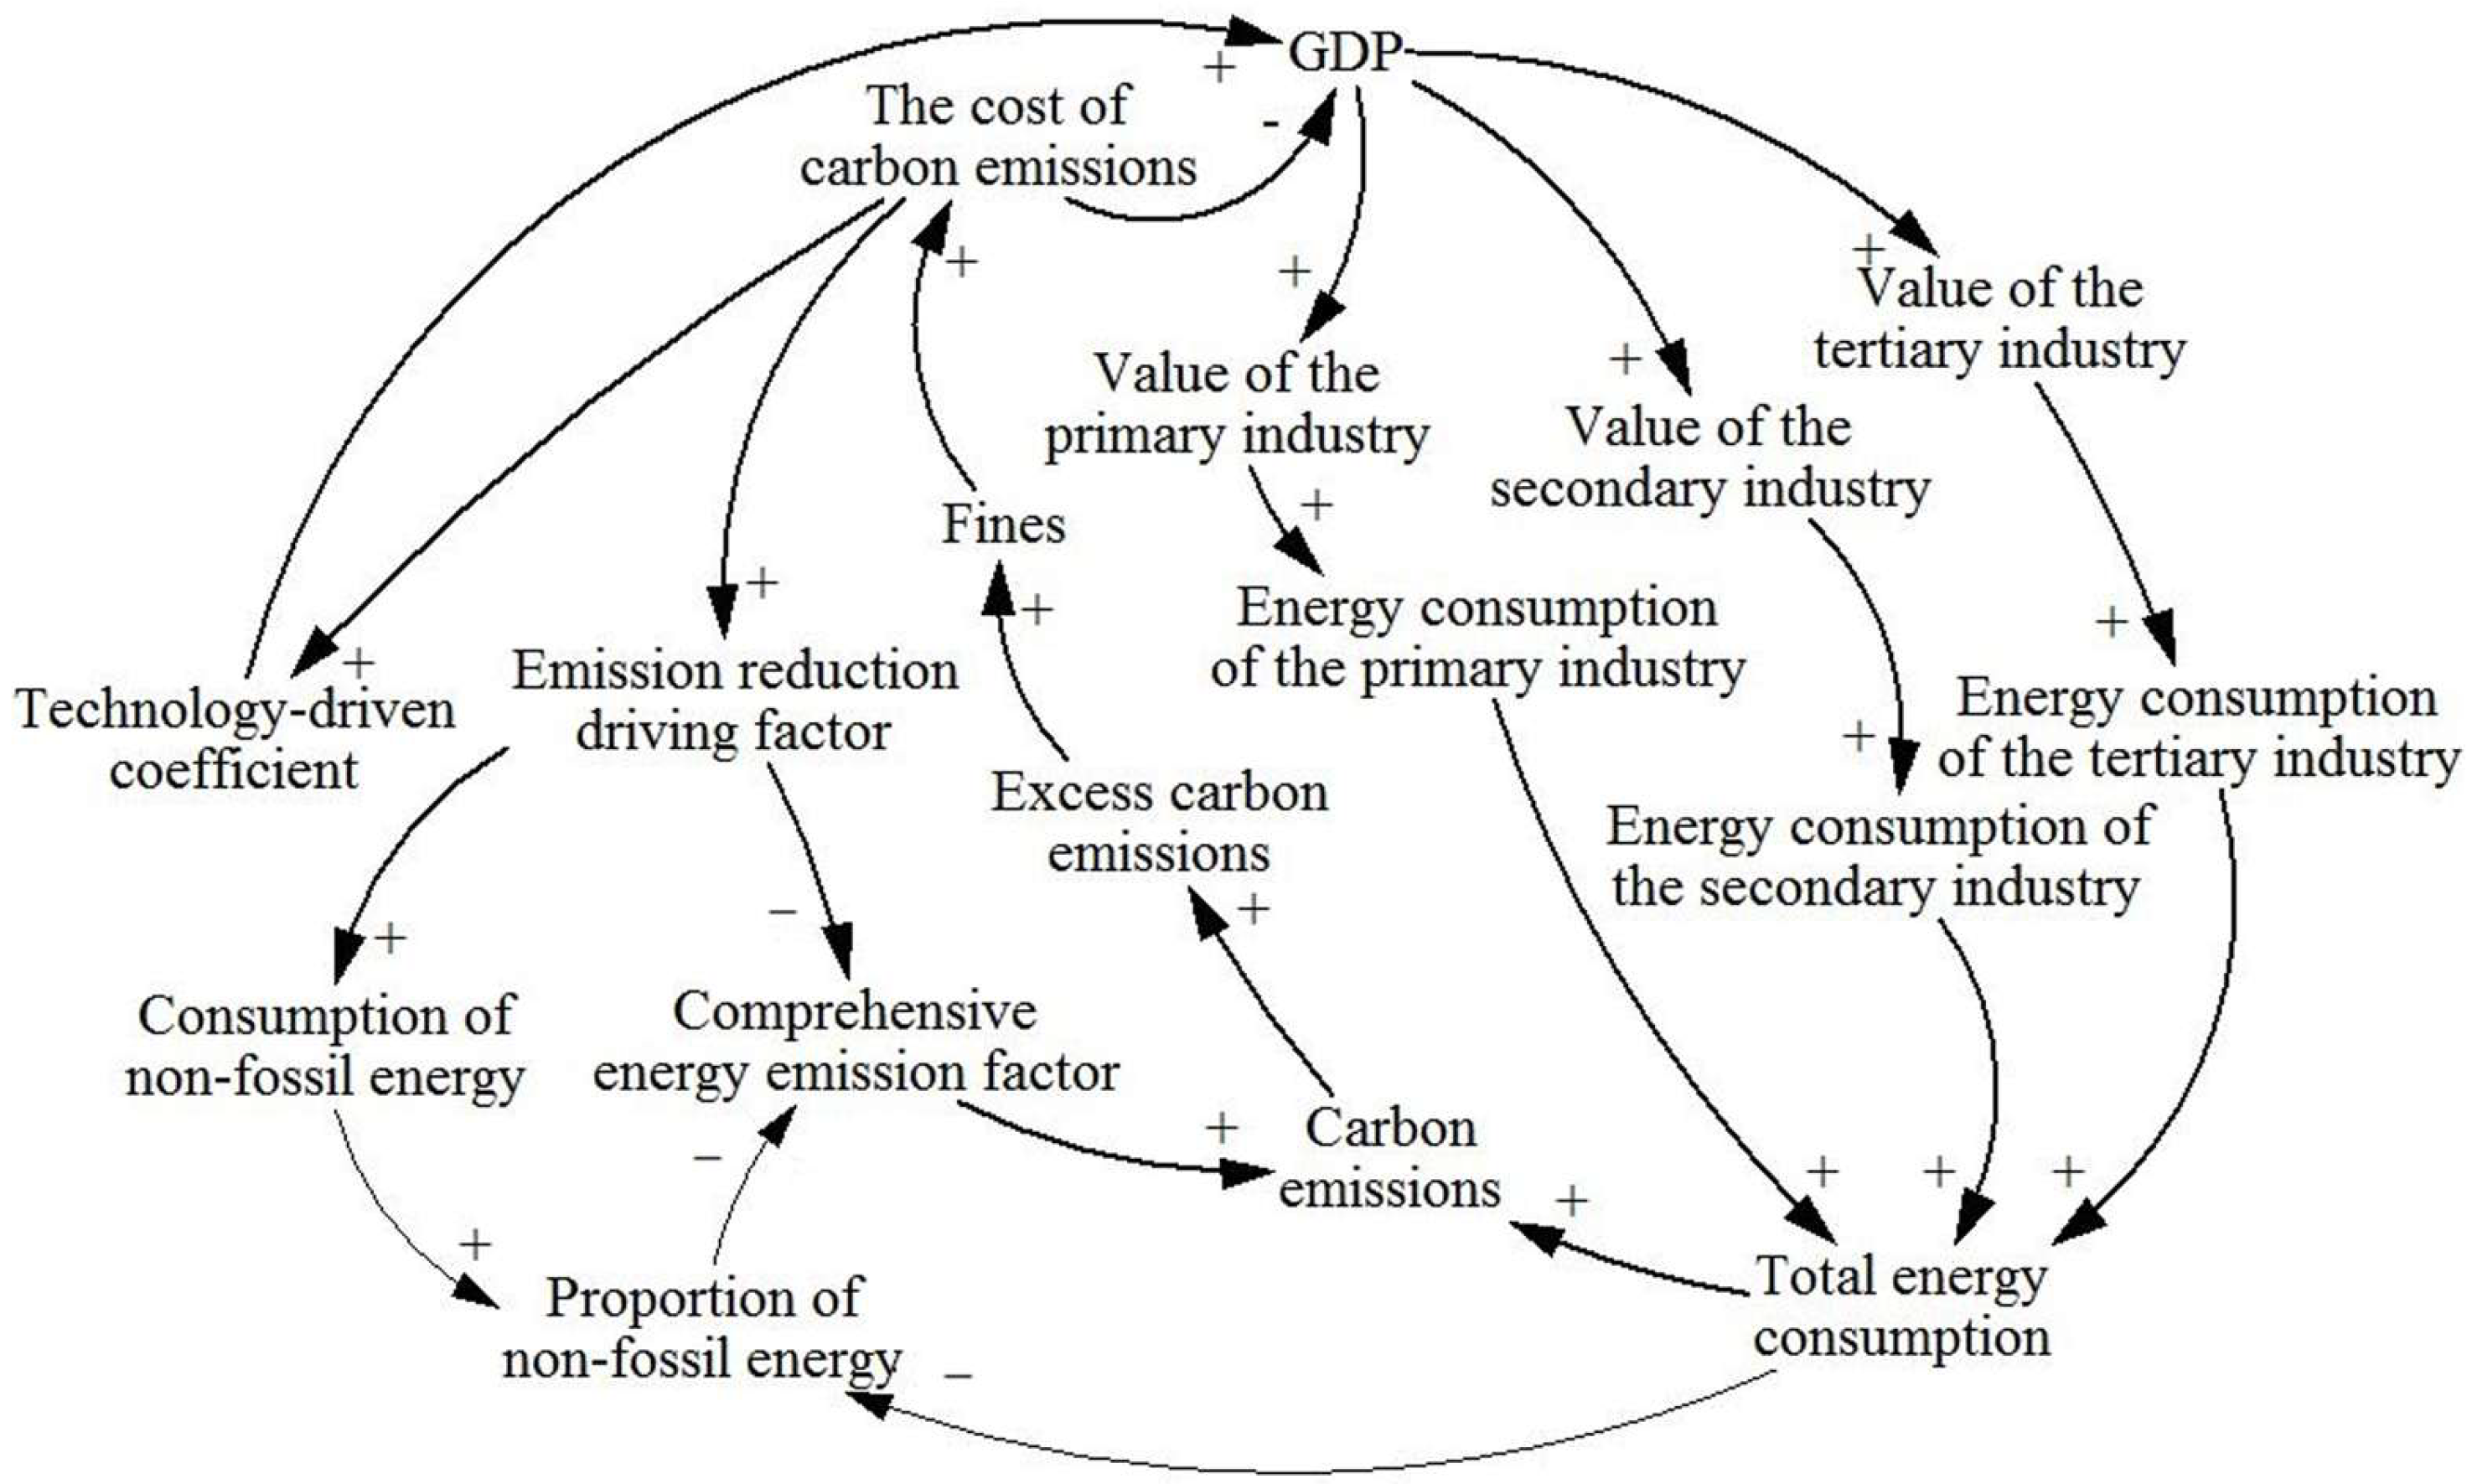
2.1. Causality
2.2. Main Equations and Parameter Settings
3. Empirical Simulation Analysis
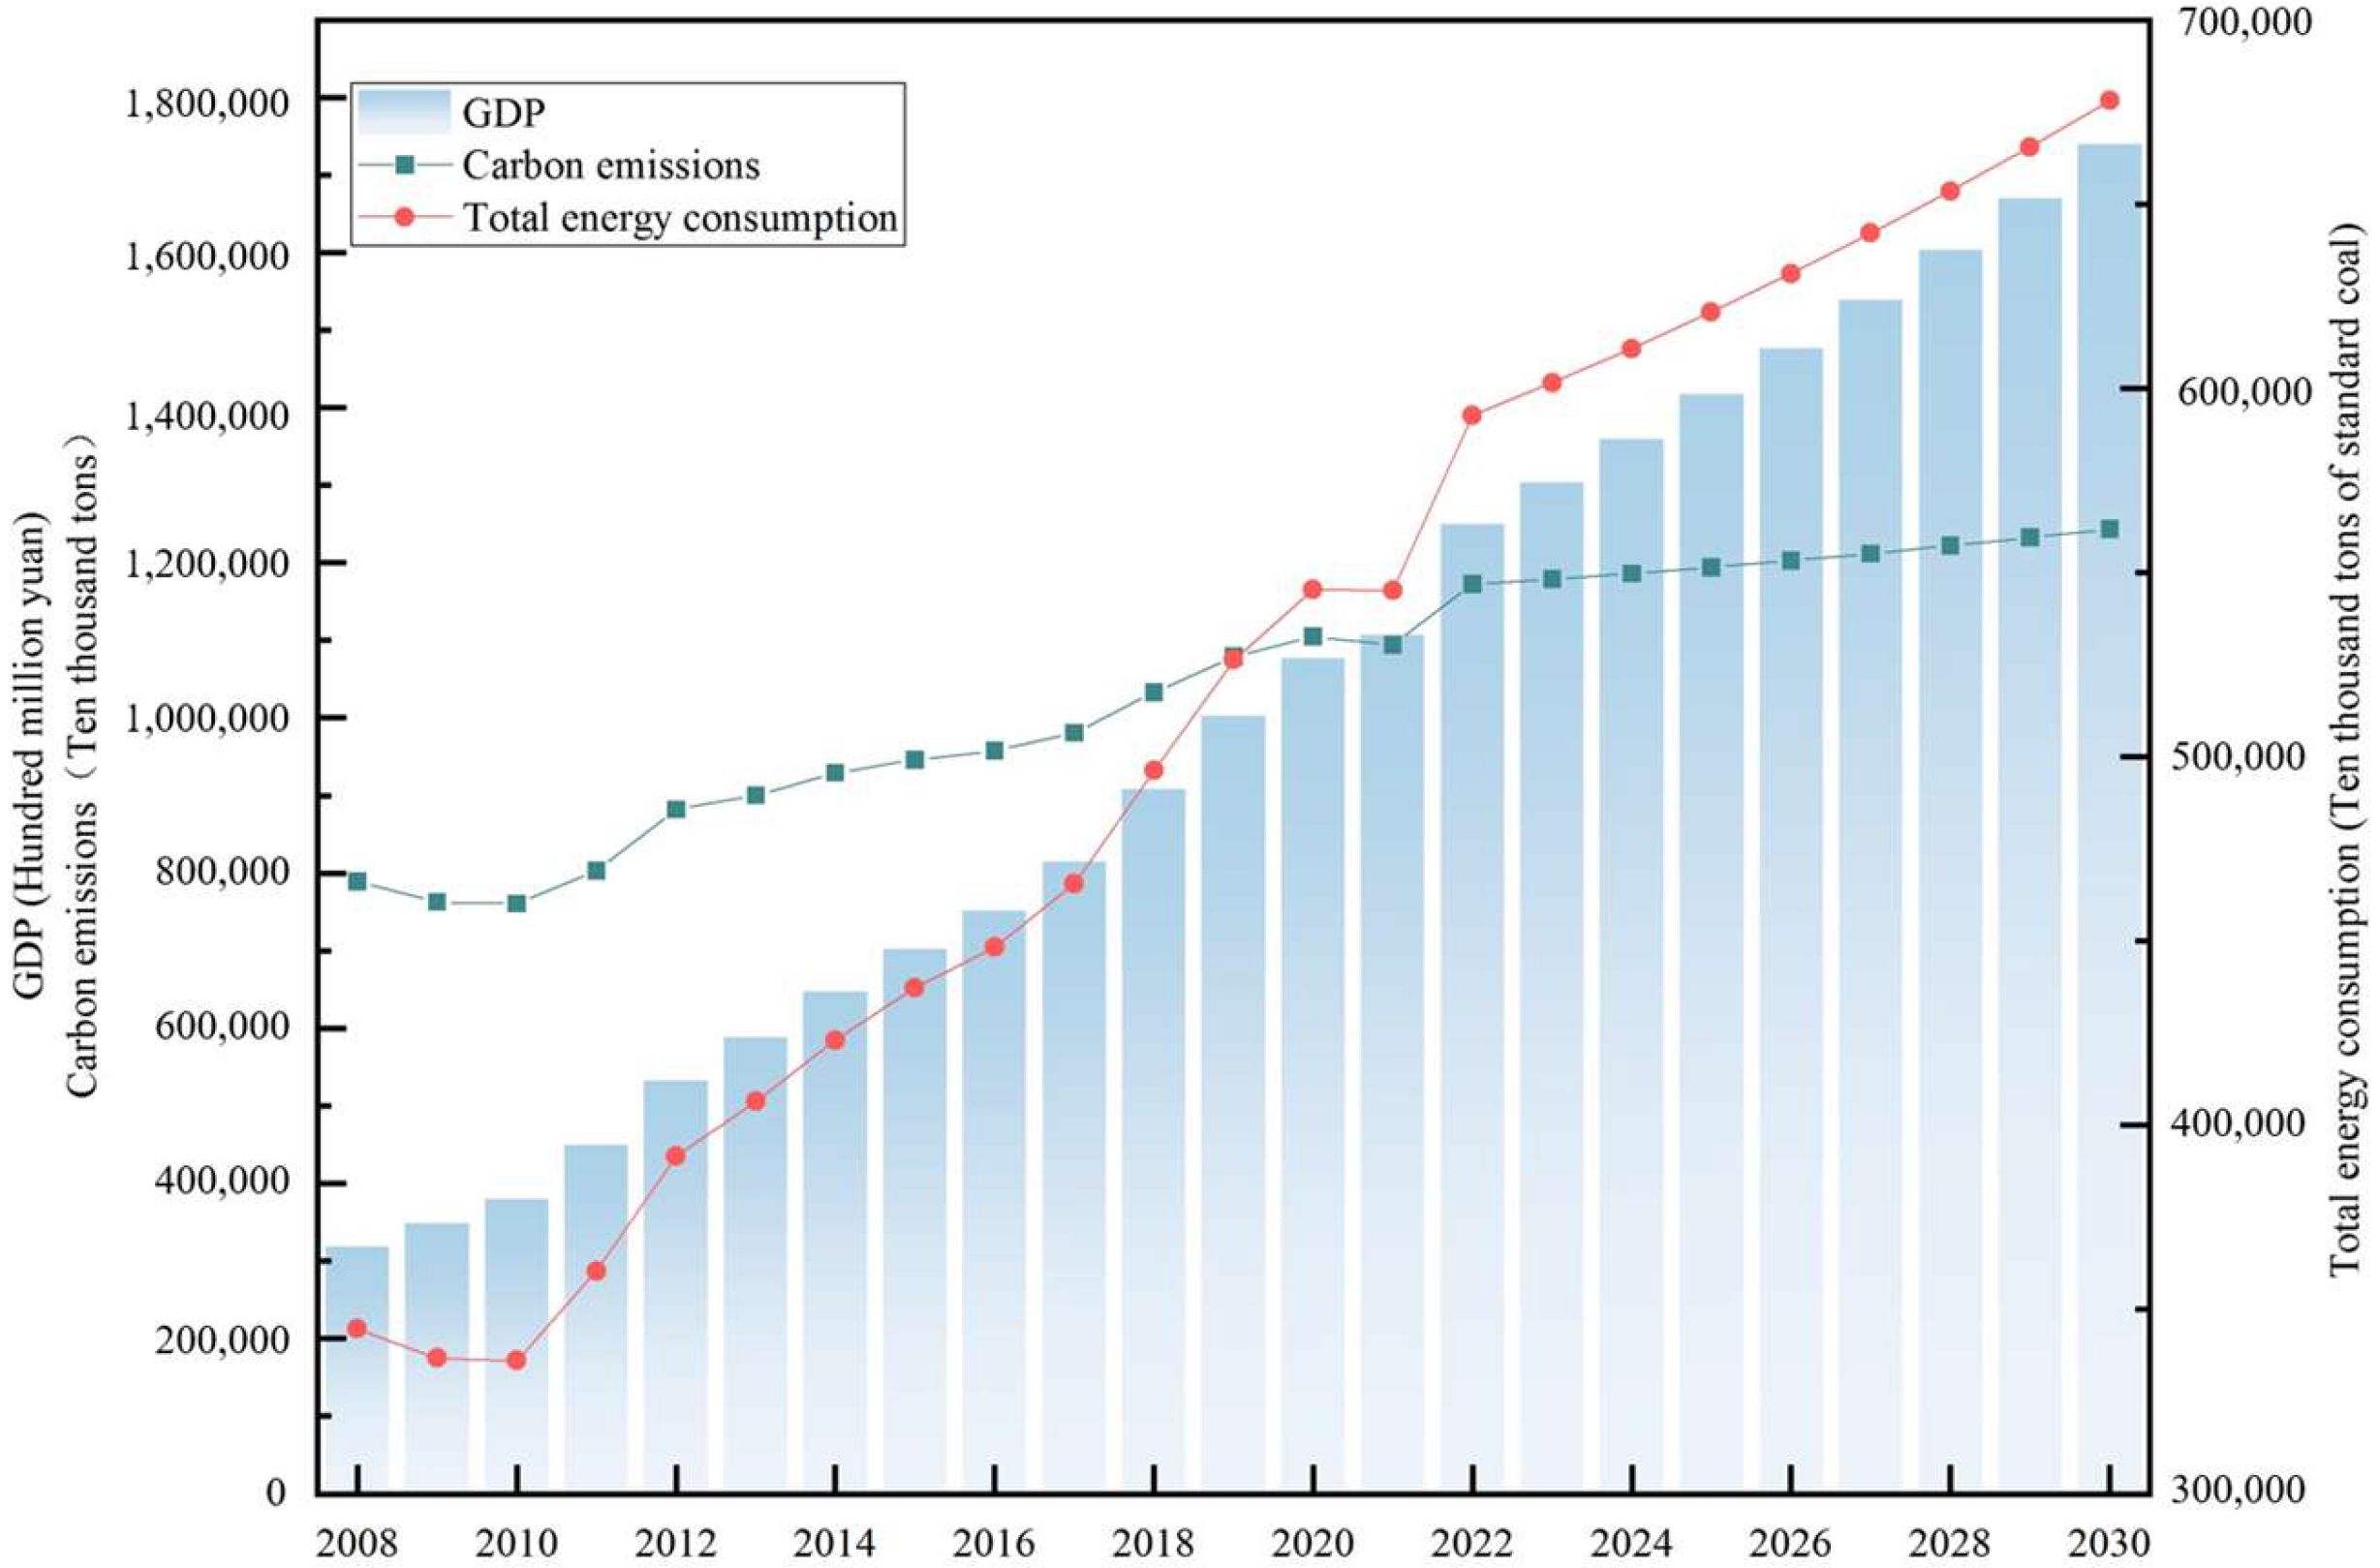
3.1. Model Validation
3.2. Scenario Setting
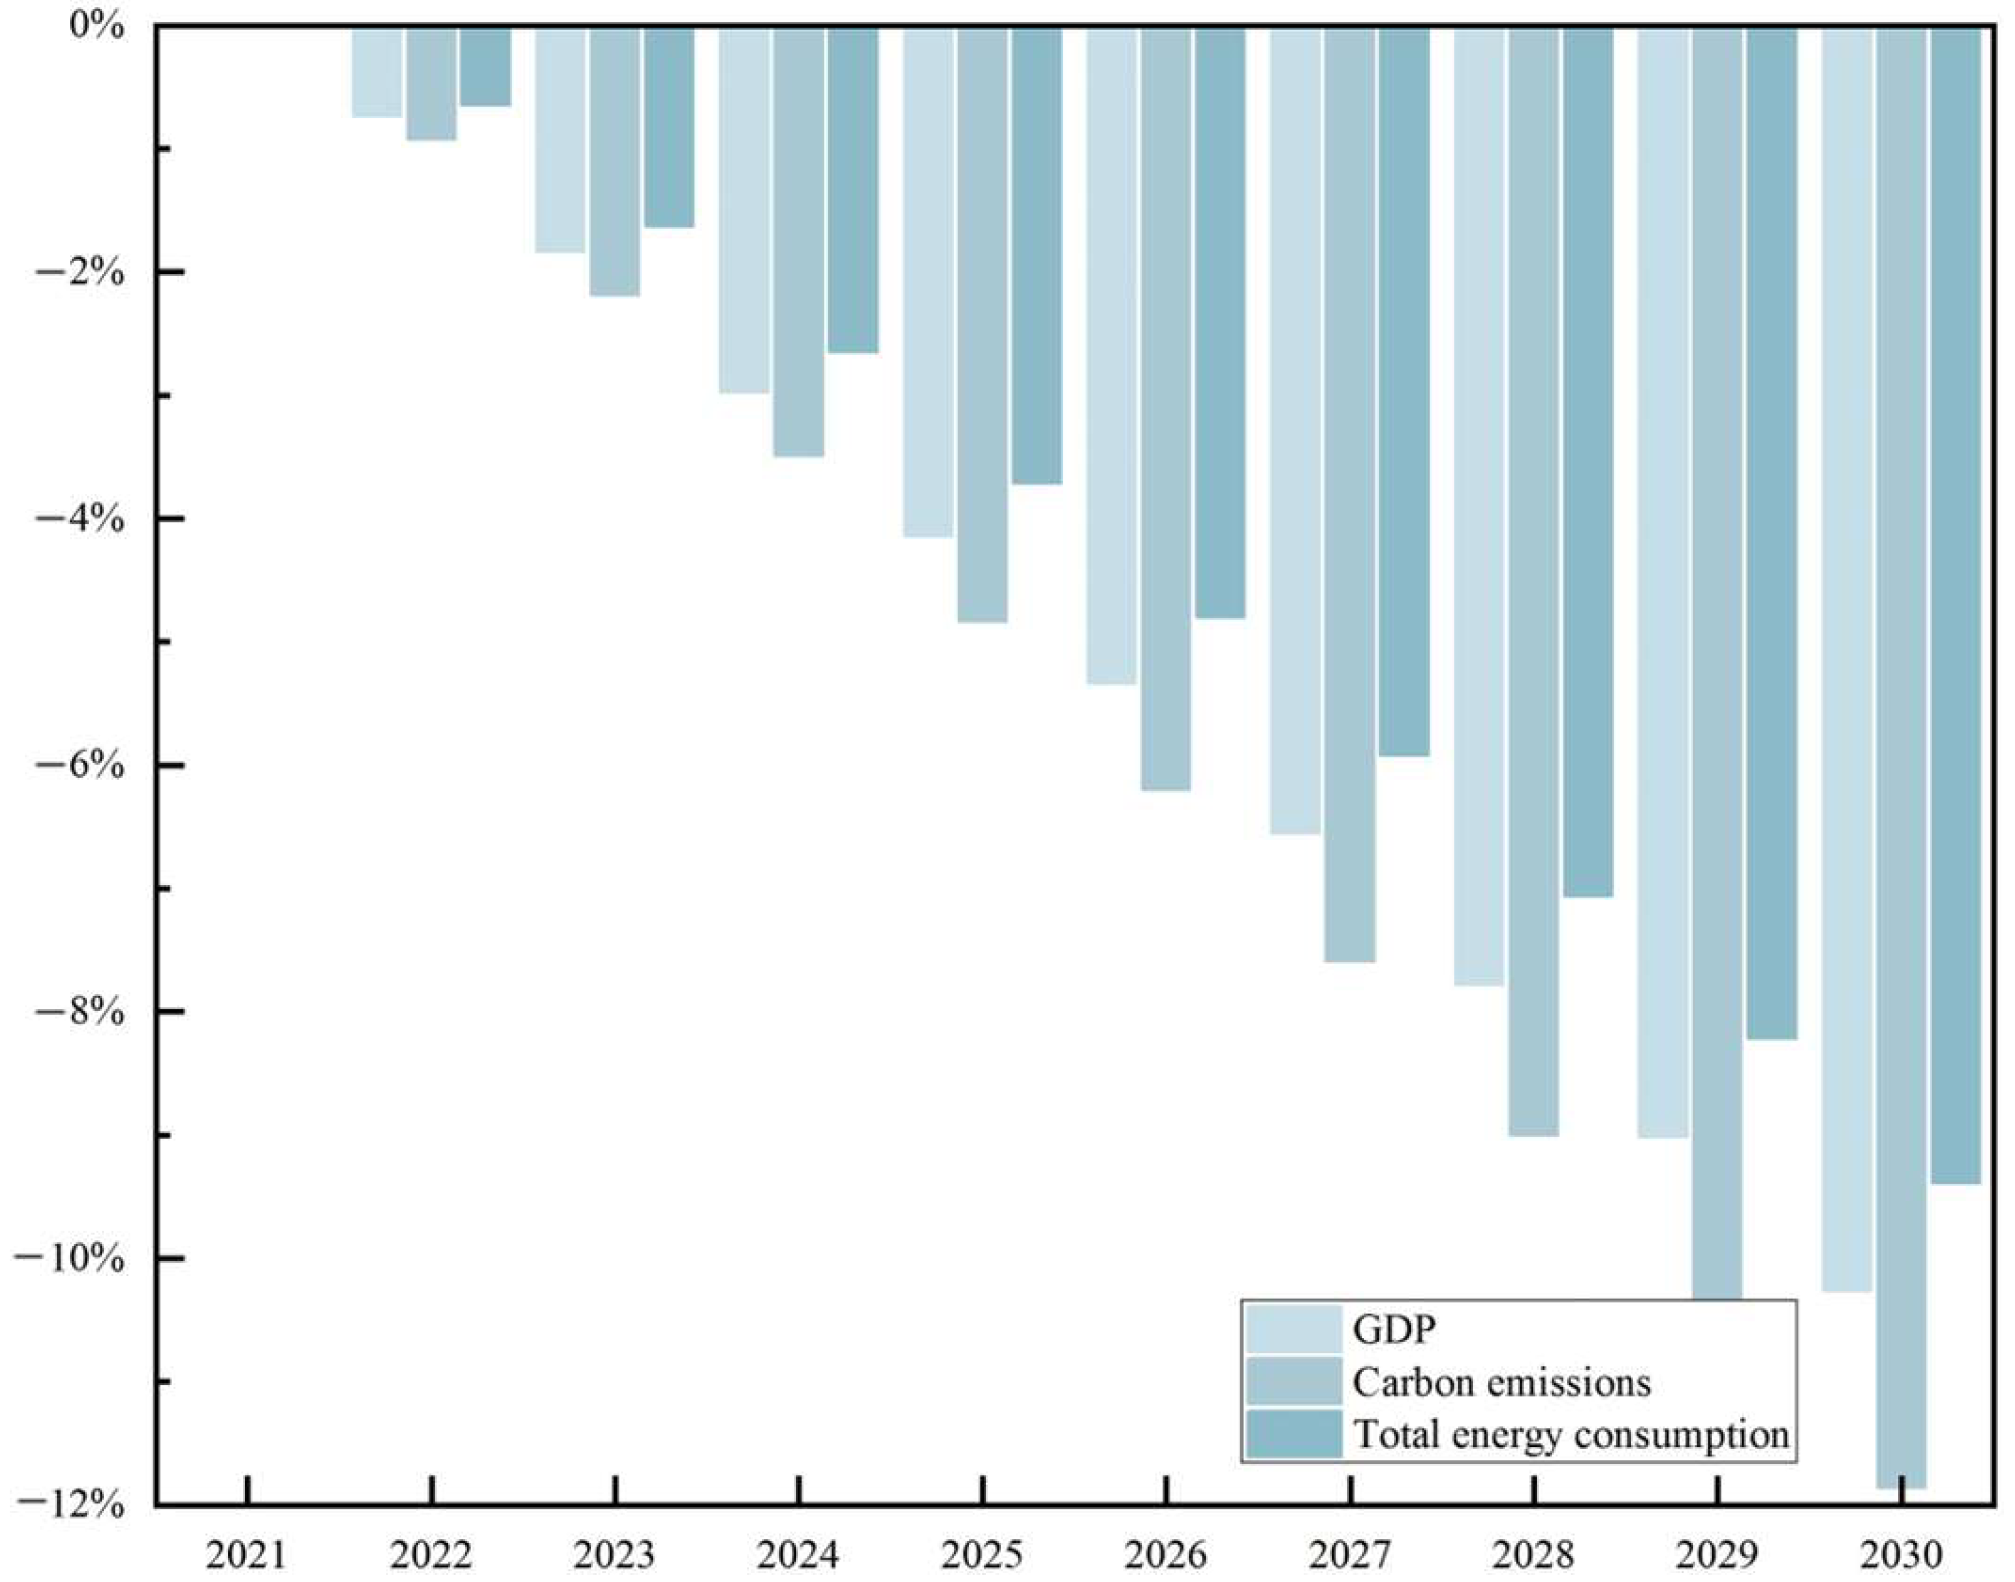
3.2.1. Impacts on the Economy, Carbon Emissions, and Energy Consumption
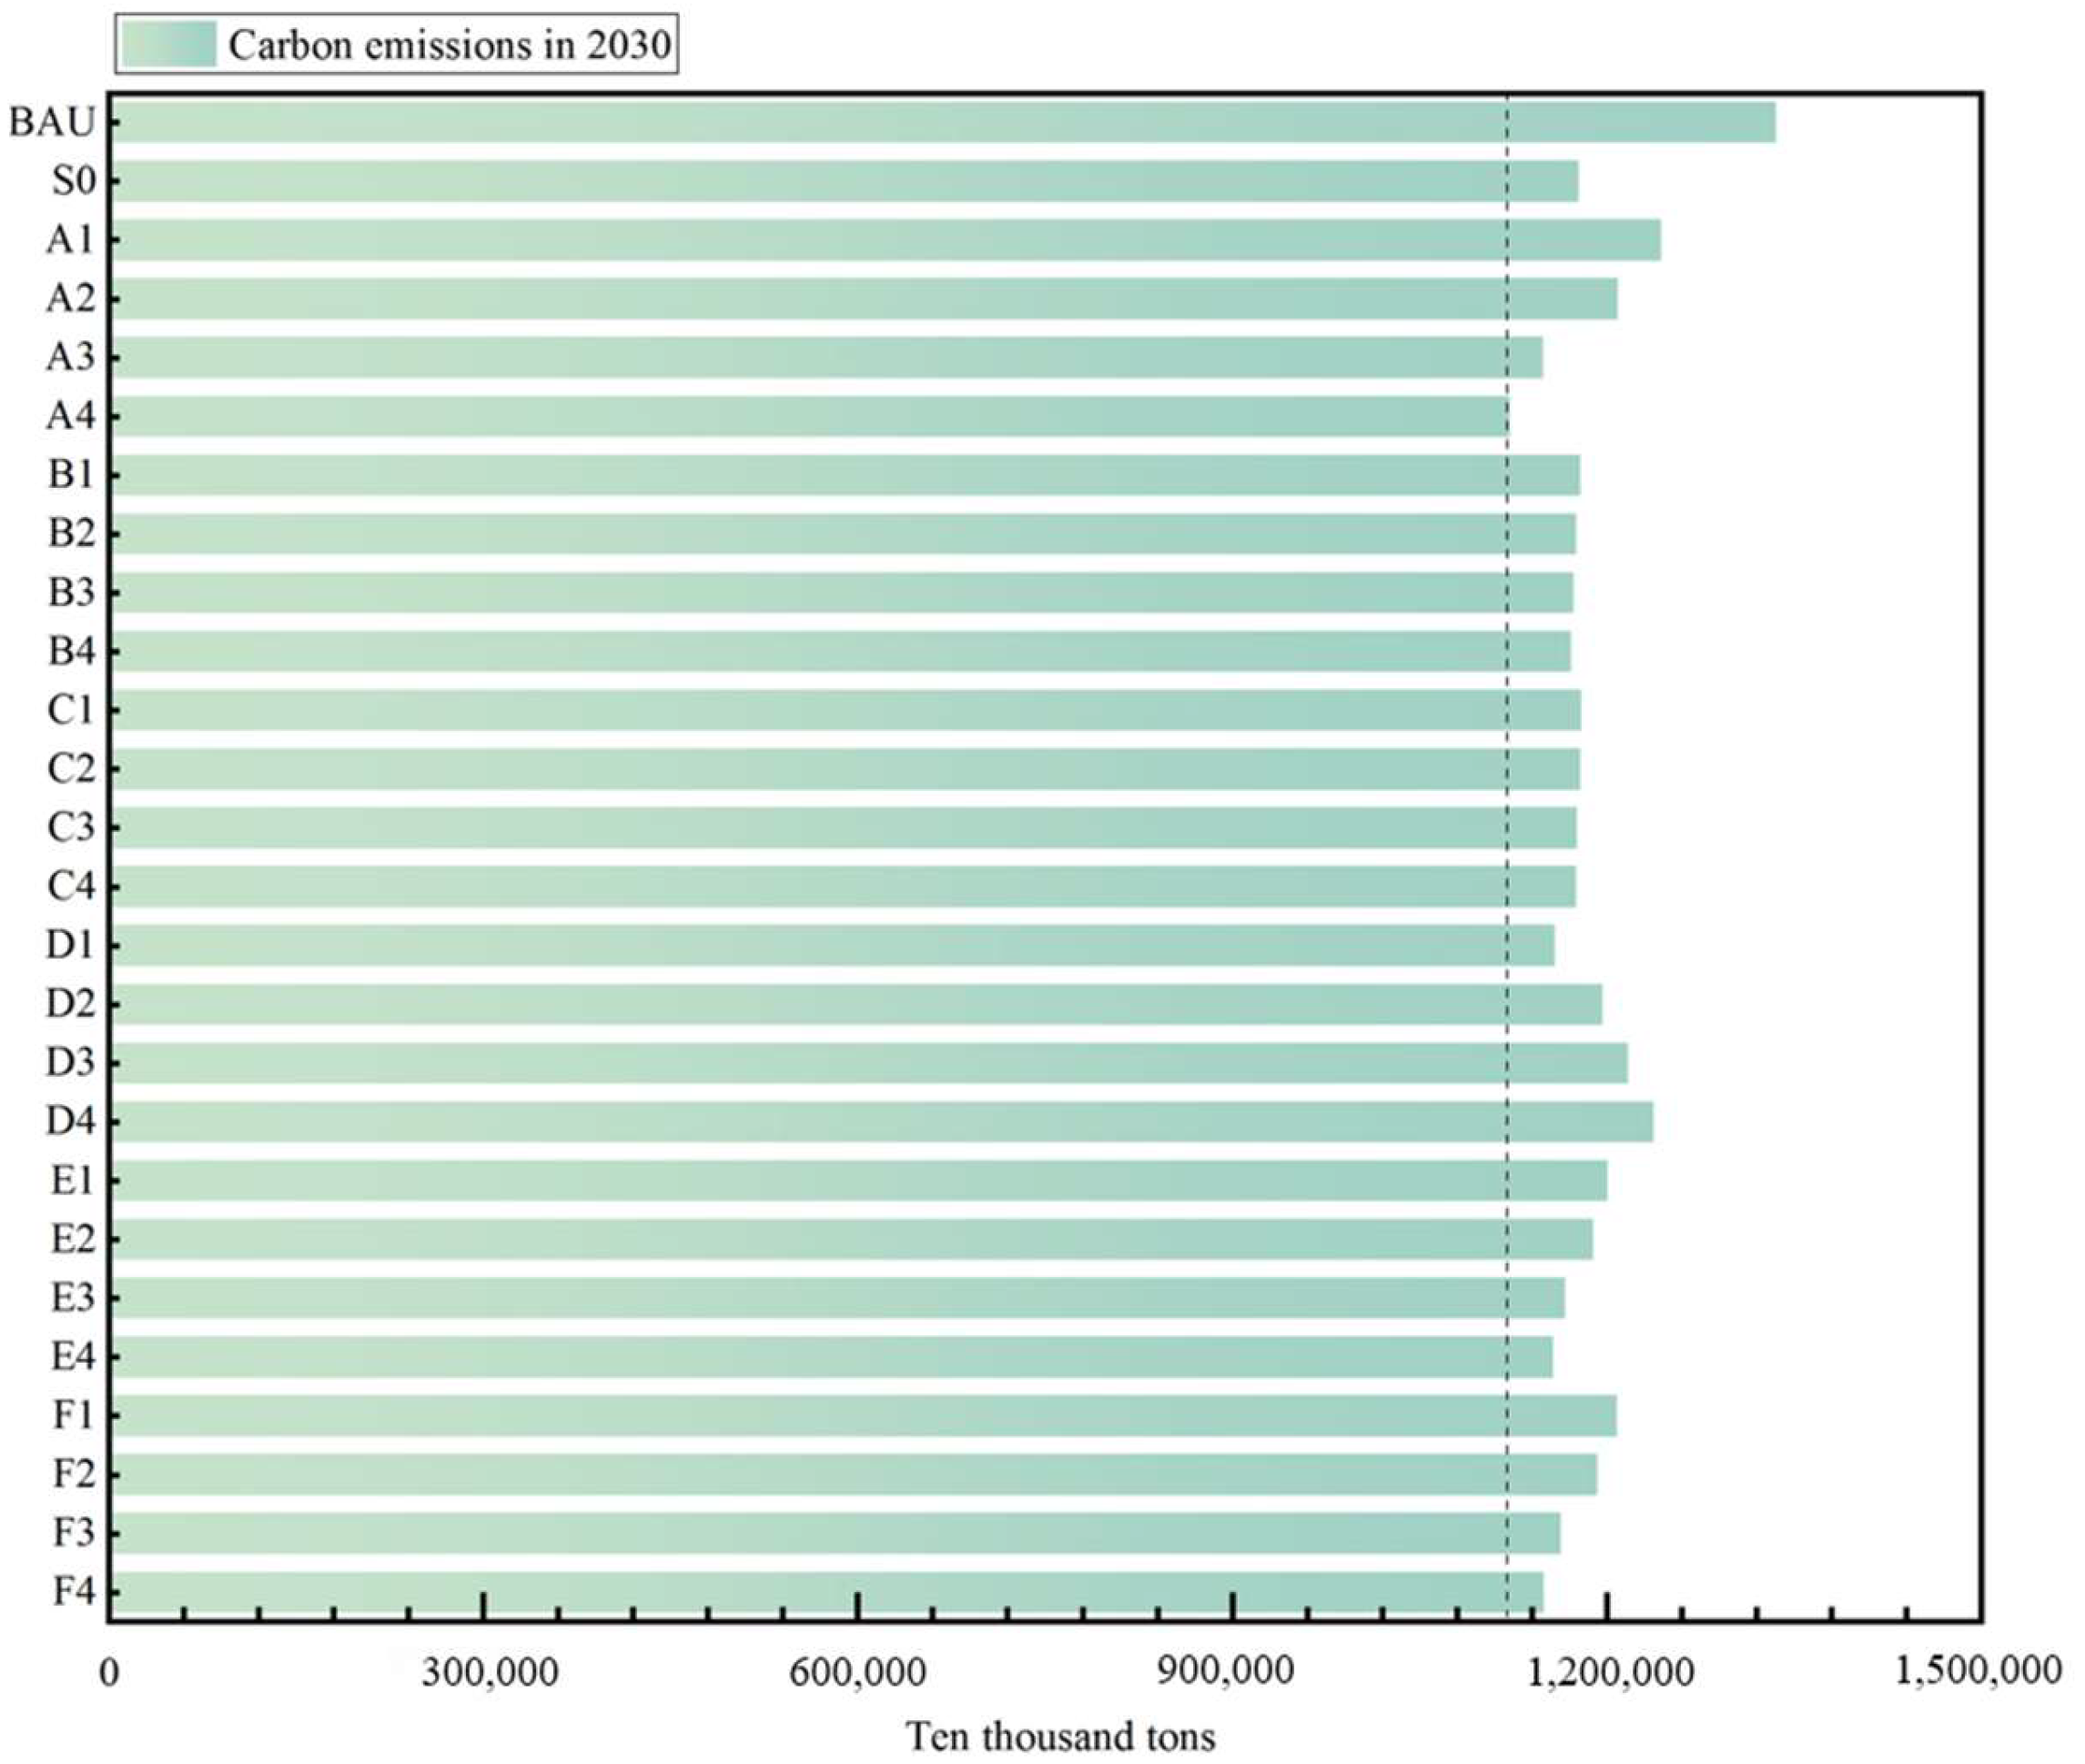
3.2.2. Impact of Different Scenarios
- (1)
- Impact of Carbon Prices
- (2)
- Impact of Quota Auctions
- (3)
- Impact of CCER Prices and Offset Ratios
- (4)
- Impact of Quota Reduction Rates
- (5)
- Impact of Penalty Severities
4. Discussion
4.1. Single-Objective Scheme Selection
4.1.1. Carbon Reduction Benefits
4.1.2. Economic Benefits
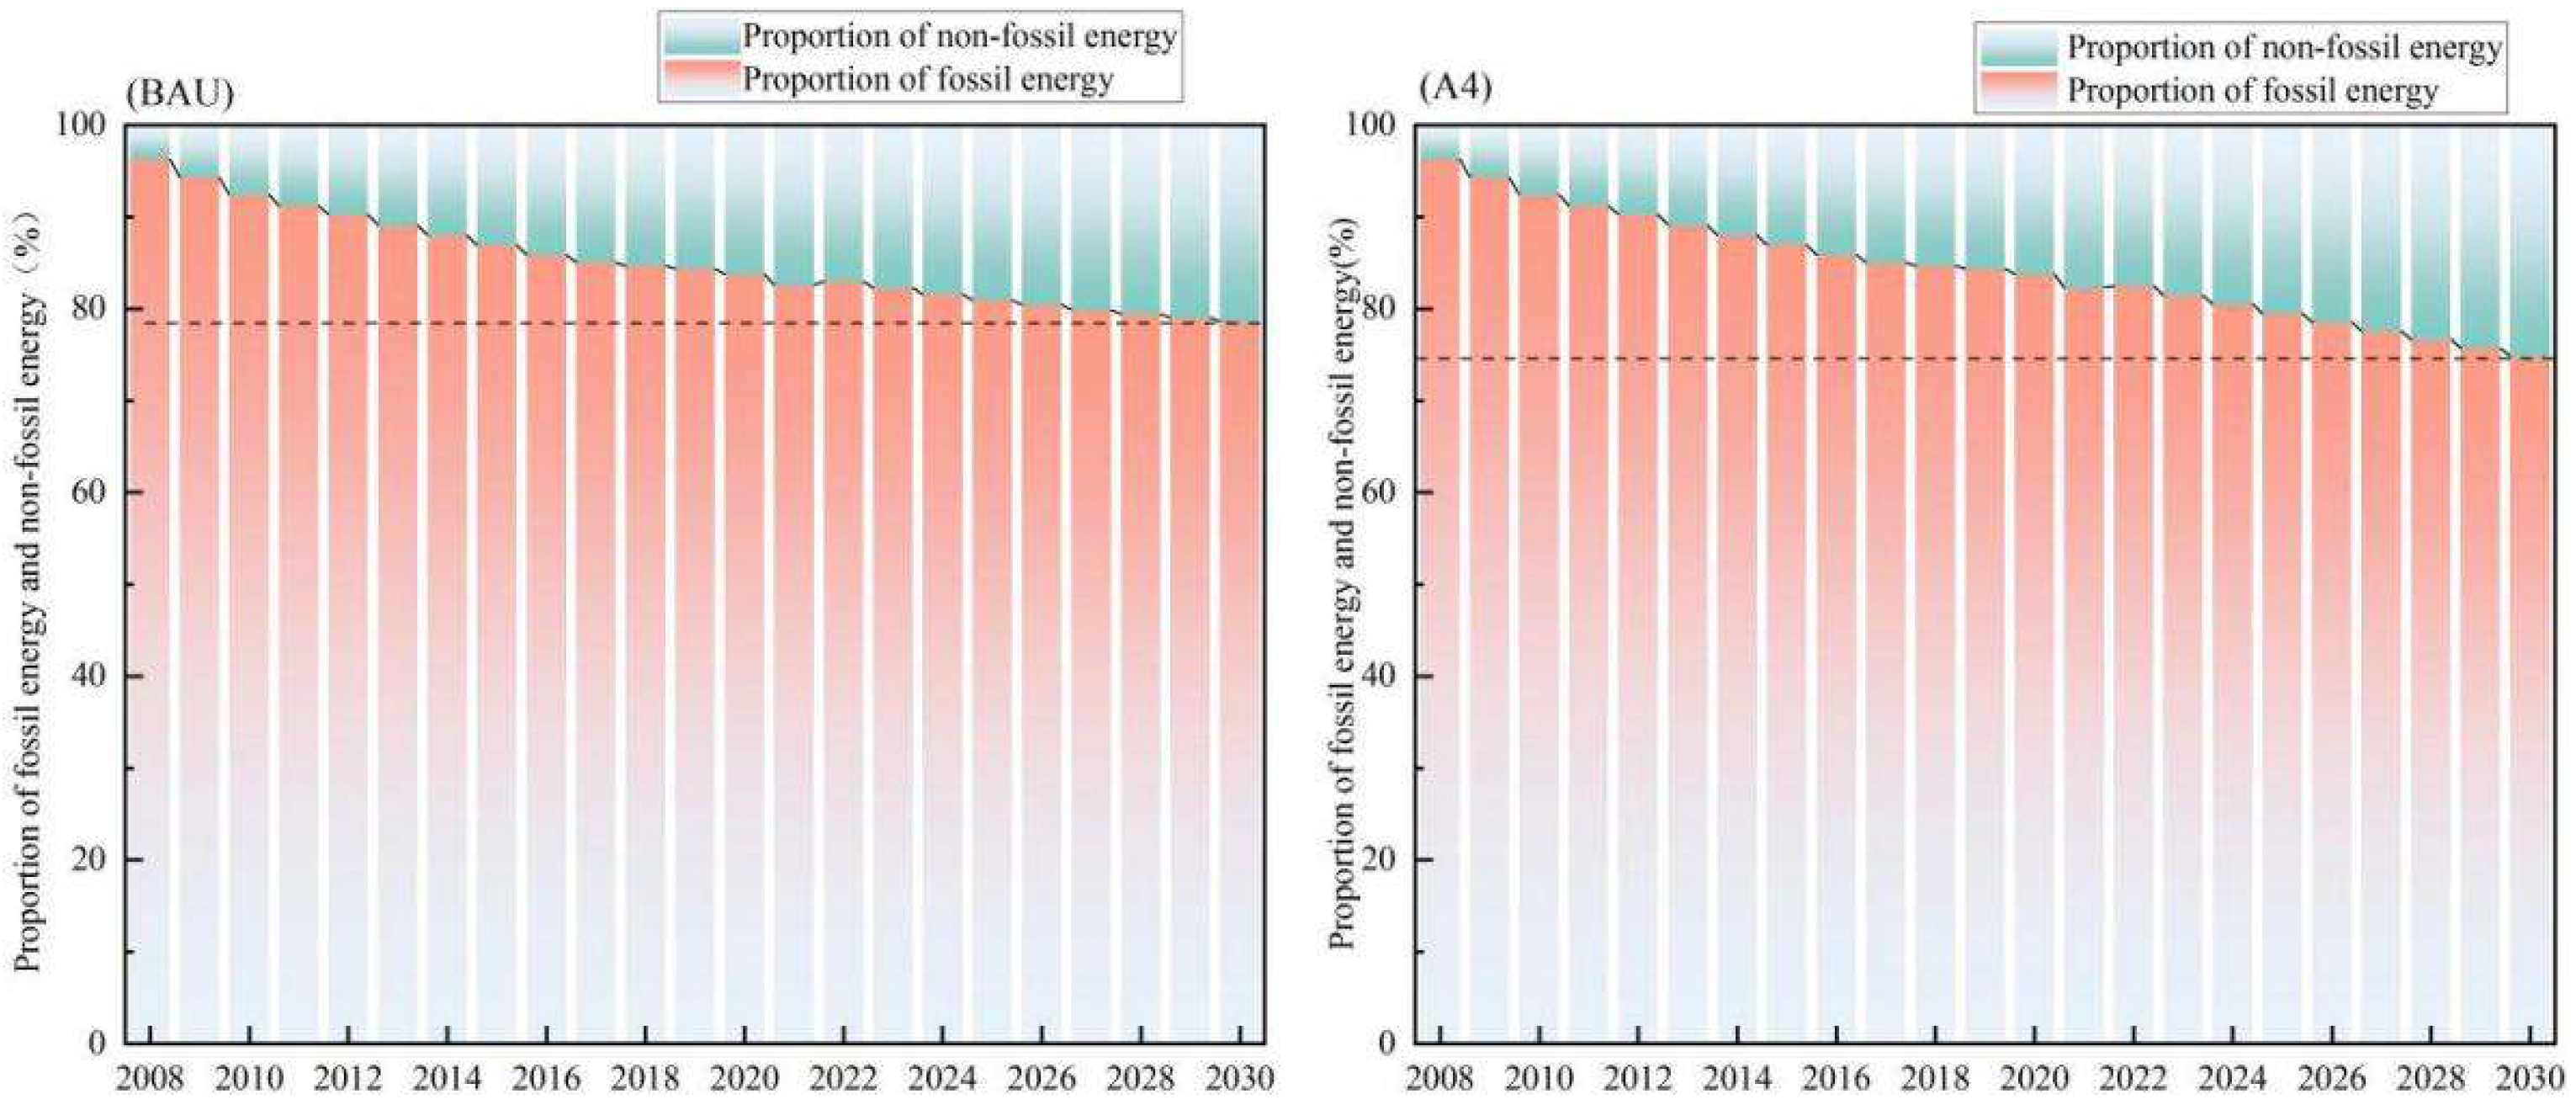
4.1.3. Energy Structure Benefits
4.2. Multi-Objective Scheme Selection
4.2.1. Carbon Emissions Reduction Target
4.2.2. Economic Development Target
4.2.3. Energy Structure Target
4.2.4. Multi-Objective Scheme Screening
4.3. Element Regulation of the Carbon Market Under Multi-Objective Constraints
5. Conclusions and Outlook
5.1. Conclusions
- (1)
- The implementation of China’s national carbon market significantly promotes carbon reduction. However, in the short term, it comes at the cost of sacrificing part of economic development. Long-term implementation of the carbon trading mechanism proves more beneficial for carbon reduction. In the short term, China’s national carbon market negatively impacts GDP growth, but its suppression effect on carbon emissions is stronger than the negative impact on economic development.
- (2)
- The effects of carbon reduction strengthen with increases in carbon price, quota auction, CCER price, penalty severity, and the quota reduction rate and weaken with an increase in the CCER offset ratio. The increase in the CCER offset ratio not only alleviates the economic impact of the carbon trading market but also reduces the carbon reduction effect. Therefore, the CCER offset ratio should not be set too leniently.
- (3)
- Gradually slowing down the quota reduction rate is more favorable for the coordinated development of carbon reduction, economic development, and energy structure targets. The E2 scenario is an optimized carbon market scenario that comprehensively considers carbon reduction, economic development, and energy structure targets. It reduces the quota reduction rate compared with the classic scenarios. Slowing down the quota reduction rate helps reduce the economic losses caused by the implementation of the carbon market and achieves coordination with other targets.
- (4)
- Under the constraints of carbon reduction, economic development, and energy structure targets, the reasonable range for carbon prices is between CNY 77.9 and CNY 118.9 per ton. The quota auction ranges from 0% to 23.4%. The reasonable range for the quota reduction rates is between 0.84% and 2.18%, with a penalty severity of 7.
5.2. Limitations and Outlook
Author Contributions
Funding
Institutional Review Board Statement
Informed Consent Statement
Data Availability Statement
Conflicts of Interest
References
- Ma, Y.; Feng, L. Analysis of the market effectiveness of pilot carbon emission trading markets in China. Oper. Res. Manag. Sci. 2022, 31, 195–202. [Google Scholar]
- Zhang, Y.; Li, S.; Luo, T.; Gao, J. The effect of emission trading policy on carbon emission reduction: Evidence from an integrated study of pilot regions in China. J. Clean. Prod. 2022, 265, 121843. [Google Scholar] [CrossRef]
- Lin, B.; Huang, C. Analysis of emission reduction effects of carbon trading: Market mechanism or government intervention. Sustain. Prod. Consum. 2022, 33, 28–37. [Google Scholar] [CrossRef]
- Wang, Y.; Guo, C.; Du, C.; Chen, X.-J.; Jia, L.-Q.; Guo, X.-N.; Chen, R.-S.; Zhang, M.-S.; Chen, Z.-Y.; Wang, H.-D. Carbon peak and carbon neutrality in China: Goals, implementation path and prospects. China Geol. 2021, 4, 720–746. [Google Scholar] [CrossRef]
- Huang, J.; Shen, J.; Miao, L. Carbon emissions trading and sustainable development in China: Empirical analysis based on the coupling coordination degree model. Int. J. Environ. Res. Public Health 2021, 18, 89. [Google Scholar] [CrossRef]
- Zhang, W.; Li, J.; Li, G.; Guo, S. Emission reduction effect and carbon market efficiency of carbon emissions trading policy in China. Energy 2020, 196, 117117. [Google Scholar] [CrossRef]
- Xu, L.; Chen, N.; Chen, Z. Will China make a difference in its carbon intensity reduction targets by 2020 and 2030? Appl. Energy 2017, 203, 874–882. [Google Scholar] [CrossRef]
- Oyewo, B. Corporate governance and carbon emissions performance: International evidence on curvilinear relationships. J. Environ. Manag. 2023, 334, 117474. [Google Scholar] [CrossRef]
- Qi, X.; Han, Y. Research on the evolutionary strategy of carbon market under “dual carbon” goal: From the perspective of dynamic quota allocation. Energy 2023, 274, 127265. [Google Scholar] [CrossRef]
- Munnings, C.; Morgenstern, R.; Wang, Z.; Liu, X. Assessing the design of three carbon trading pilot programs in China. Energy Policy 2016, 96, 688–699. [Google Scholar] [CrossRef]
- Chen, J. Study on the improvement of China’s carbon emission trading system under the goal of “Double Carbon”. Int. J. Educ. Humanit. 2024, 14, 85–90. [Google Scholar] [CrossRef]
- Feng, T.; Li, R.; Zhang, H.; Gong, X.; Yang, Y. Induction mechanism and optimization of tradable green certificates and carbon emission trading acting on electricity market in China. Resour. Conserv. Recycl. 2021, 169, 105487. [Google Scholar] [CrossRef]
- Ye, Q.; Gao, C.; Jiang, G. The structure design of China blockchain carbon market for the future big data environment. J. Manag. World 2022, 38, 229–249. [Google Scholar]
- Ye, F.; Xiong, X.; Li, L.; Li, Y. Measuring the effectiveness of the Chinese Certified Emission Reduction scheme in mitigating CO2 emissions: A system dynamics approach. J. Clean. Prod. 2021, 294, 125355. [Google Scholar] [CrossRef]
- Zhang, J.; Wang, Z.; Tang, L.; Yu, L. The simulation of carbon emission trading system in Beijing-Tianjin-Hebei region: An analysis based on system dynamics. Chin. J. Manag. Sci. 2016, 24, 1–8. [Google Scholar]
- Dall-Orsoletta, A.; Uriona-Maldonado, M.; Dranka, G.; Ferreira, P. A review of social aspects integration in system dynamics energy systems models. Int. J. Sustain. Energy Plan. Manag. 2022, 36, 33–52. [Google Scholar] [CrossRef]
- Wei, C.; Wu, Z.; Xing, J.; Jin, G. Trade-off or synergy? Dynamic analysis and policy insights on land use functions in China. Environ. Impact Assess. Rev. 2024, 105, 107399. [Google Scholar] [CrossRef]
- Bolwig, S.; Bazbauers, G.; Klitkou, A.; Lund, P.D.; Blumberga, A.; Gravelsins, A.; Blumberga, D. Review of modelling energy transitions pathways with application to energy system flexibility. Renew. Sustain. Energy Rev. 2019, 101, 440–452. [Google Scholar] [CrossRef]
- Doblinger, C.; Dowling, M.; Helm, R. An institutional perspective of public policy and network effects in the renewable energy industry: Enablers or disablers of entrepreneurial behaviour and innovation? Entrep. Reg. Dev. 2016, 28, 126–156. [Google Scholar] [CrossRef]
- Zhang, Z.; Chen, H. Dynamic interaction of renewable energy technological innovation, environmental regulation intensity and carbon pressure: Evidence from China. Renew. Energy 2022, 192, 420–430. [Google Scholar] [CrossRef]
- Rudnik, K.; Hnydiuk-Stefan, A.; Li, Z.; Ma, Z. Short-term modeling of carbon price based on fuel and energy determinants in EU ETS. J. Clean. Prod. 2023, 417, 137970. [Google Scholar] [CrossRef]
- Sato, M.; Rafaty, R.; Calel, R.; Grubb, M. Allocation, allocation, allocation! The political economy of the development of the European Union Emissions Trading System. Wiley Interdiscip. Rev. Clim. Change 2022, 13, e796. [Google Scholar] [CrossRef]
- Bellora, C.; Fontagné, L. EU in search of a Carbon Border Adjustment Mechanism. Energy Econ. 2023, 123, 106673. [Google Scholar] [CrossRef]
- Jin, C.; Lv, Z.; Li, Z.; Sun, K. Green finance, renewable energy and carbon neutrality in OECD countries. Renew. Energy 2023, 211, 279–284. [Google Scholar] [CrossRef]
- Zhou, K.; Li, Y. Carbon finance and carbon market in China: Progress and challenges. J. Clean. Prod. 2019, 214, 536–549. [Google Scholar] [CrossRef]
- Jia, Y. Does carbon emission trading affect economic growth? Macroeconomics 2017, 12, 72–81+136. [Google Scholar] [CrossRef]
- Tang, L.; Shi, J.; Bao, Q. Designing an emissions trading scheme for China with a dynamic computable general equilibrium model. Energy Policy 2016, 97, 507–520. [Google Scholar] [CrossRef]
- Liu, Y.; Liu, S.; Shao, X.; He, Y. Policy spillover effect and action mechanism for environmental rights trading on green innovation: Evidence from China’s carbon emissions trading policy. Renew. Sustain. Energy Rev. 2022, 153, 111779. [Google Scholar] [CrossRef]
- Liu, C.; Ma, C.; Xie, R. Structural, innovation and efficiency effects of environmental regulation: Evidence from China’s carbon emissions trading pilot. Environ. Resour. Econ. 2020, 75, 741–768. [Google Scholar] [CrossRef]
- Hu, Y.; Li, R.; Du, L.; Ren, S.; Chevallier, J. Could SO2 and CO2 emissions trading schemes achieve co-benefits of emissions reduction? Energy Policy 2022, 170, 113252. [Google Scholar] [CrossRef]
- Xia, X.; Zeng, X.; Wang, W.; Liu, C.; Li, X. Carbon constraints and carbon emission reduction: An evolutionary game model within the energy-intensive sector. Expert Syst. Appl. 2024, 244, 122916. [Google Scholar] [CrossRef]
- Liu, N.; Fan, L.; Li, S.; Chen, X.; Mao, L. The influence of the carbon trading system on the enterprise’s carbon emission reduction performance. Syst. Eng. 2022, 40, 13–23. [Google Scholar]
- Ren, Y.; Huynh, T.; Liu, P.; Narayan, S. Is the carbon emission trading scheme conducive to promoting energy transition? Some empirical evidence from China. Energy Econ. 2024, 134, 107629. [Google Scholar] [CrossRef]
- Dang, S.; Cao, S.; Li, J.; Zhang, X. Dynamic incentive mechanism design for regulation-aware systems. Int. J. Intell. Syst. 2022, 37, 1299–1321. [Google Scholar] [CrossRef]
- Liu, Y.; Zhou, K. The impact of Chinese industrial carbon emission trading policies. Forum Sci. Technol. China 2018, 9, 156–165. [Google Scholar]
- Slater, H.; Wang, H.; Li, R. China Carbon Pricing Survey 2022; ICF: Beijing, China, 2023; Available online: http://lvsefazhan.cn/index.php/msg/2037.html (accessed on 1 February 2023).
- IIGF. China Carbon Market Annual Report 2024; Institute of Finance and Sustainability: Beijing, China, 2024; Available online: https://www.cenews.com.cn/news.html?aid=1187985 (accessed on 15 January 2025).
- IIGF. China Carbon Market Annual Report 2023; Institute of Finance and Sustainability: Beijing, China, 2023; Available online: https://www.cenews.com.cn/news.html?aid=1188064 (accessed on 31 January 2025).
- Zhao, W. Research on the Mechanism Design of China’s National Carbon Market. Master’s Thesis, Shaanxi Normal University, Xi’an, China, 2021. Available online: https://link.cnki.net/doi/10.27292/d.cnki.gsxfu.2021.002089 (accessed on 1 June 2021).
- Gallagher, K.S.; Zhang, J.; Orvis, R. Guide to Chinese Climate Policy; Harvard Kennedy School, Belfer Center for Science and International Affairs: Cambridge, MA, USA, 2019; Available online: https://chineseclimatepolicy.oxfordenergy.org/book-content/domestic-policies/emissions-trading/ (accessed on 1 November 2021).
- Regional Greenhouse Gas Initiative. Program Design. Available online: https://www.rggi.org/program-overview-and-design/elements (accessed on 23 January 2025).
- The Government of the People’s Republic of China. Interim Regulations on the Administration of Carbon Emissions Trading. 2024. Available online: https://www.gov.cn/zhengce/zhengceku/202402/content_6930138.htm (accessed on 1 February 2024).
- Wang, Y.; Wang, Y. Feasibility and optimal pathway of China’s double targets for carbon reduction—The perspective of energy structure optimization. China Environ. Sci. 2019, 39, 4444–4455. [Google Scholar]
- Su, Y.; Liu, X.; Ji, J.; Ma, X. Role of economic structural change in the peaking of China’s CO2 emissions: An input-output optimization model. Sci. Total Environ. 2021, 761, 143306. [Google Scholar] [CrossRef]
- Su, K.; Lee, C. When will China achieve its carbon emission peak? A scenario analysis based on optimal control and the STIRPAT model. Ecol. Indic. 2020, 112, 106138. [Google Scholar] [CrossRef]
- Elzen, M.; Fekete, H.; Höhne, N.; Admiraal, A.; Forsell, N.; Hof, A.F.; Olivier, J.G.; Roelfsema, M.; van Soest, H. Greenhouse gas emissions from current and enhanced policies of China until 2030: Can emissions peak before 2030? Energy Policy 2016, 89, 224–236. [Google Scholar] [CrossRef]
- Sun, M.; Li, C.; Xing, Z. Analysis of key influencing factors and scenario prediction of China’s carbon emission under carbon neutrality. High Volt. Eng. 2023, 49, 4011–4022. [Google Scholar]
- Zhou, X. China’s per Capita GDP will Reach 17,800 US Dollars by 2030. Caijing, 13 November 2019. Available online: http://m.caijing.com.cn/api/show?contentid=4627301 (accessed on 20 September 2023).


| Variables | Abbreviations | Units | Equation Settings or Data Sources |
|---|---|---|---|
| Change in GDP | Cig | CNY 100 million | Cig = GDP × Ggr – Tcoce + Tdc × GDP |
| GDP | GDP | CNY 100 million | GDP = Cig |
| Change in quota | Ciq | 10,000 tons | Ciq = Qrr × Tq |
| Total quota | Tq | 10,000 tons | Tq = Ciq |
| Auctioned quota | Aq | 10,000 tons | Aq = Qa × Tq |
| Auction cost | Ac | CNY 100 million | Ac = Ap × Aq/10,000 |
| Fines | Fin | CNY 100 million | Fin = Ps × Cp × Ece/10,000 |
| Excess carbon emissions | Ece | 10,000 tons | Ece = Ce − Tq − Ctv |
| CCER transaction volume | Ctv | 10,000 tons | Ctv = Ce × Ceror |
| Cost of carbon emissions | Tcoce | CNY 100 million | Tcoce = Ctv × Cerp/10,000 + Ac + Fin |
| Energy consumption of the primary industry | Ecotpi | 10,000 tons of standard coal | Ecotpi = Eiotpi × Votpi |
| Energy consumption of the secondary industry | Ecotsi | 10,000 tons of standard coal | Ecotsi = Eiotsi × Votsi |
| Energy consumption of the tertiary industry | Ecotti | 10,000 tons of standard coal | Ecotti = Eiotti × Votti |
| Total residential energy consumption | Trec | 10,000 tons of standard coal | Trec = Pcec × Tp |
| Total energy consumption | Tec | 10,000 tons of standard coal | Tec = Trec + Ecotpi + Ecotsi + Ecotti |
| Carbon Emission | Ce | 10,000 tons | Ce = Ceefr × Tec |
| GDP per capita | Gpc | CNY 100 million/10,000 people | Gpc = GDP/Tp |
| Total population | Tp | 10,000 people | Tp = Cip |
| Total residential energy consumption | Trec | 10,000 tons of standard coal | Trec = Pcec × Tp |
| Change in population | Cip | 10,000 people | Cip = Pgr × Tp |
| Value of the primary industry | Votpi | CNY 100 million | Votpi = 0.0594 × GDP + 14,981 (R2 = 0.98) |
| Value of the secondary industry | Votsi | CNY 100 million | Votsi = 0.349 × GDP + 45,668 (R2 = 0.99) |
| Value of the tertiary industry | Votti | CNY 100 million | Votti = 0.5916 × GDP + 60,649 (R2 = 0.99) |
| Technology investment | Ti | CNY 100 million | Ti = 1781.8 × (Time − 2007) + 1328.3 (R2 = 0.97) |
| Per capita energy consumption | Pcec | 10,000 tons of standard coal/10,000 people | Pcec = 0.0408 × Gpc + 0.1574 (R2 = 0.99) |
| Energy intensity of the primary industry | Eiotpi | 10,000 tons of standard coal/CNY 100 million | IF THEN ELSE (Time < 2017, −0.037 × LN (Time−2006) + 0.222, −0.087 × LN (Time − 2006) + 0.3439) (R2 = 0.94; R2 = 0.98) |
| Energy intensity of the secondary industry | Eiotsi | 10,000 tons of standard coal/CNY 100 million | −0.316 × LN(Time − 2006) + 1.6877 (R2 = 0.96) |
| Energy intensity of the tertiary industry | Eiotti | 10,000 tons of standard coal/CNY 100 million | −0.071 × LN(Time − 2006) + 0.345 (R2 = 0.95) |
| Per capita energy consumption | Pcec | 10,000 tons of standard coal/10,000 people | 0.0408 × Gpc + 0.1574 (R2 = 0.99) |
| Population growth rate | Pgr | Dmnl | exogenous variables, sources: China Statistical Yearbook |
| GDP growth rate | Ggr | Dmnl | exogenous variables, sources: China Statistical Yearbook |
| Technological-driven coefficient | Tdc | Dmnl | exogenous variables, sources: reference [35] |
| Carbon price (S0) | Cp | CNY/ton | exogenous variables, sources: reference [36] |
| Quota auction (S0) | Qa | Dmul | exogenous variables, sources: reference [37] |
| CCER price (S0) | Cerp | CNY/ton | exogenous variables, sources: reference [38] |
| CCER offset ratio (S0) | Ceror | Dmul | exogenous variables, sources: reference [39] |
| Quota reduction rate (S0) | Qrr | Dmul | exogenous variables, sources: reference [40,41] |
| Penalty severity (S0) | Ps | Dmul | exogenous variables, sources: reference [42] |
| Year | GDP (CNY 100 Million) | Carbon Emissions (10,000 Tons) | Total Energy Consumption (10,000 Tons of Standard Coal) | ||||||
|---|---|---|---|---|---|---|---|---|---|
| Fitted Value | Actual Value | Error | Fitted Value | Actual Value | Error | Fitted Value | Actual Value | Error | |
| 2008 | 319,245 | 319,244.61 | 0.00% | 789,379 | 734,321.02 | −7.50% | 344,650 | 320,611 | −7.50% |
| 2009 | 348,518 | 348,517.74 | 0.00% | 762,673 | 769,194.1 | 0.85% | 336,787 | 336,126 | −0.20% |
| 2010 | 380,476 | 412,119.26 | 7.68% | 760,476 | 812,900.59 | 6.45% | 336,106 | 360,648 | 6.80% |
| 2011 | 449,909 | 487,940.18 | 7.79% | 803,195 | 881,567.84 | 8.89% | 360,406 | 387,043 | 6.88% |
| 2012 | 532,682 | 538,579.95 | 1.10% | 881,958 | 900,885.63 | 2.10% | 391,630 | 402,138 | 2.61% |
| 2013 | 587,966 | 592,963.23 | 0.84% | 900,147 | 926,143.05 | 2.81% | 406,391 | 416,913 | 2.52% |
| 2014 | 647,336 | 643,563.1 | −0.59% | 929,262 | 937,297.59 | 0.86% | 423,087 | 428,334 | 1.22% |
| 2015 | 702,575 | 688,858.22 | −1.99% | 946,073 | 938,369.98 | −0.82% | 437,275 | 434,113 | −0.73% |
| 2016 | 752,024 | 746,395.06 | −0.75% | 958,019 | 940,585.46 | −1.85% | 448,258 | 441,492 | −1.53% |
| 2017 | 814,836 | 832,035.95 | 2.07% | 980,792 | 959,711.84 | −2.20% | 465,614 | 455,827 | −2.15% |
| 2018 | 908,330 | 919,281.13 | 1.19% | 1,032,960 | 979,055.61 | −5.51% | 496,213 | 471,925 | −5.15% |
| 2019 | 1,003,570 | 986,515.2 | −1.73% | 1,079,430 | 998,804.41 | −8.07% | 526,243 | 487,488 | −7.95% |
| 2020 | 1,076,970 | 1,013,567 | −6.26% | 1,104,860 | 1,011,637.22 | −9.22% | 545,399 | 498,314 | −9.45% |
| 2021 | 1,106,510 | 1,149,236.98 | 3.72% | 1,093,970 | 1,054,989.45 | −3.69% | 545,016 | 525,896 | −3.64% |
| 2022 | 1,254,620 | 1,204,724 | −4.14% | 1,179,190 | 1,078,169.72 | −9.37% | 594,511 | 541,000 | −9.89% |
| Average Error | 2.66% | 4.68% | 4.55% | ||||||
| Scenario Settings | Policy Settings | ||||||
|---|---|---|---|---|---|---|---|
| Carbon Prices (CNY/Ton) | Quota Auctions | CCER Prices (CNY/Ton) | CCER Offset Ratios | Quota Reduction Rates | Penalty Severities | ||
| Baseline Scenario | BAU | 0 | 0 | 0 | 0 | 0 | 0 |
| Classic Scenario | S0 | 85 | 5% | 65 | 10% | 2.5% | 7 |
| Carbon prices | A1 | 35 | 5% | 65 | 10% | 2.5% | 7 |
| A2 | 60 | 5% | 65 | 10% | 2.5% | 7 | |
| A3 | 110 | 5% | 65 | 10% | 2.5% | 7 | |
| A4 | 135 | 5% | 65 | 10% | 2.5% | 7 | |
| Quota auctions | B1 | 85 | 1% | 65 | 10% | 2.5% | 7 |
| B2 | 85 | 10% | 65 | 10% | 2.5% | 7 | |
| B3 | 85 | 15% | 65 | 10% | 2.5% | 7 | |
| B4 | 85 | 20% | 65 | 10% | 2.5% | 7 | |
| CCER prices | C1 | 85 | 5% | 35 | 10% | 2.5% | 7 |
| C2 | 85 | 5% | 50 | 10% | 2.5% | 7 | |
| C3 | 85 | 5% | 80 | 10% | 2.5% | 7 | |
| C4 | 85 | 5% | 95 | 10% | 2.5% | 7 | |
| CCER offset ratios | D1 | 85 | 5% | 65 | 5% | 2.5% | 7 |
| D2 | 85 | 5% | 65 | 15% | 2.5% | 7 | |
| D3 | 85 | 5% | 65 | 20% | 2.5% | 7 | |
| D4 | 85 | 5% | 65 | 25% | 2.5% | 7 | |
| Quota reduction rates | E1 | 85 | 5% | 65 | 10% | 0.5% | 7 |
| E2 | 85 | 5% | 65 | 10% | 1.5% | 7 | |
| E3 | 85 | 5% | 65 | 10% | 3.5% | 7 | |
| E4 | 85 | 5% | 65 | 10% | 4.5% | 7 | |
| Penalty severities | F1 | 85 | 5% | 65 | 10% | 2.5% | 5 |
| F2 | 85 | 5% | 65 | 10% | 2.5% | 6 | |
| F3 | 85 | 5% | 65 | 10% | 2.5% | 8 | |
| F4 | 85 | 5% | 65 | 10% | 2.5% | 9 | |
Disclaimer/Publisher’s Note: The statements, opinions and data contained in all publications are solely those of the individual author(s) and contributor(s) and not of MDPI and/or the editor(s). MDPI and/or the editor(s) disclaim responsibility for any injury to people or property resulting from any ideas, methods, instructions or products referred to in the content. |
© 2025 by the authors. Licensee MDPI, Basel, Switzerland. This article is an open access article distributed under the terms and conditions of the Creative Commons Attribution (CC BY) license (https://creativecommons.org/licenses/by/4.0/).
Share and Cite
Ma, Y.; Miao, L.; Feng, L. Research on the Implementation Effects, Multi-Objective Scheme Selection, and Element Regulation of China’s Carbon Market. Sustainability 2025, 17, 6955. https://doi.org/10.3390/su17156955
Ma Y, Miao L, Feng L. Research on the Implementation Effects, Multi-Objective Scheme Selection, and Element Regulation of China’s Carbon Market. Sustainability. 2025; 17(15):6955. https://doi.org/10.3390/su17156955
Chicago/Turabian StyleMa, Yue, Ling Miao, and Lianyong Feng. 2025. "Research on the Implementation Effects, Multi-Objective Scheme Selection, and Element Regulation of China’s Carbon Market" Sustainability 17, no. 15: 6955. https://doi.org/10.3390/su17156955
APA StyleMa, Y., Miao, L., & Feng, L. (2025). Research on the Implementation Effects, Multi-Objective Scheme Selection, and Element Regulation of China’s Carbon Market. Sustainability, 17(15), 6955. https://doi.org/10.3390/su17156955