Abstract
Carbon storage is a critical factor for ensuring the provision of ecosystem services such as biodiversity conservation, particularly in nature reserves. Understanding the spatial and temporal dynamics of carbon storage within China’s nature reserves (NRs) is essential for evaluating their role in ecosystem conservation. Using NDVI values, we assessed vegetation carbon storage in NRs across China from 2000 to 2015. The results revealed a 63.06% increase in carbon storage within NRs over the 15-year period, with forest vegetation and grassland vegetation carbon storage increasing by 60.05% and 86.33%, respectively. Approximately 90% of NRs exhibited positive growth rates, with higher increases observed in northeastern and western China compared to other regions. While the carbon density of forest vegetation in NRs exceeded that of areas outside reserves, grassland vegetation displayed the opposite trend. Overall, vegetation carbon storage in NRs demonstrated a significant upward trajectory over the study period. These findings highlight the importance of nature reserves in safeguarding forest carbon functions; however, their protective effect on grassland vegetation carbon function was less pronounced.
1. Introduction
Nature Reserves (NRs) are widely regarded as a primary strategy for protecting biodiversity, which is increasingly threatened by human activities and environmental pollution [1,2]. Since the establishment of China’s first NR in 1956, both the number and total area of NRs have expanded rapidly [3,4]. By the end of 2015, China had established 2763 NRs, covering 15.68% of its terrestrial land area. Among these, 428 NRs are nationally designated (accounting for 10.04% of China’s land surface), with the remainder classified as local reserves. Studies have demonstrated that NRs not only safeguard biodiversity [5,6], but also deliver critical ecosystem services, such as climate change mitigation [7,8] and enhanced ecosystem resilience [9]. However, significant imbalances persist in China’s NR network: highly biodiverse tropical forests remain underrepresented, while arid-region vegetation types with limited biodiversity are overrepresented; and dispersed NR distributions in regions with low protection ratios undermine conservation efficacy. Geographically, NR coverage increases—and fragmentation decreases—from southeastern to western China. This spatial pattern highlights the critical role of NRs in protecting key taxa, including endangered wild plants [10].
Carbon sequestration and storage stand out as particularly vital ecosystem services, given the compounding threats of climate change to global biodiversity and ecosystems [11,12,13], especially when interacting with stressors like habitat fragmentation [14]. These processes are intrinsically linked to other ecosystem traits and functions, including plant diversity and productivity [15,16,17]. Consequently, analyzing carbon storage alone provides a robust foundation for assessing ecosystem functionality [18,19].
In China, the rapid rise in carbon emissions since the early 21st century has emerged as a critical environmental challenge at both the local and global scales. Between 2000 and 2012, national carbon emissions surged from 3.35 billion metric tons (Mt) to 8.25 billion Mt—an increase of more than twofold [20]—with per capita emissions reaching 7.2 metric tons by 2013, exceeding the European average. Enhancing carbon storage is increasingly viewed as a key mitigation strategy. Thus, analyzing temporal trends in carbon stocks within NRs has been essential for evaluating their effectiveness in bolstering ecosystem services and reducing carbon emissions in recent decades.
Studies have reported that the spatial distribution of carbon sequestration does not align with the locations of nature reserves in China. Compared to the nature reserve network’s 15.1% coverage of China’s total land area, these reserves contribute only 11.0% of national carbon sequestration [21]. Furthermore, most prior research has focused on individual reserves, with limited studies examining temporal and spatial variations in vegetation carbon storage across China’s national network of nature reserves in recent decades.
To explore spatial and temporal variations in carbon (C) stocks in NRs, this study addresses the following questions: How have C stocks changed in NRs from 2000 to 2015? In which regions has carbon storage in NRs increased or decreased?
2. Methods
The individual plot biomass datasets from Luo et al. [22] and Song et al. [23] were used to derive national forest and grassland vegetation biomass, while 1:1,000,000-scale Chinese vegetation atlas vector data was employed to extract forest and grassland vegetation types. These datasets were integrated with monthly MODIS-NDVI imagery (250 m resolution) from 2000 to 2015 into multivariate linear regression models, enabling the estimation of total vegetation biomass across China’s forest and grassland ecosystems over this 15-year period. Final C stocks were calculated using a biomass-to-carbon conversion factor of 0.5 [24]. Each vegetation type was analyzed separately, yielding distinct regression models for different vegetation types.
The spatial layer of NRs was then applied to isolate and quantify carbon storage and its temporal dynamics specifically within the NR network. The resulting annual linear regression equations (Appendix A) were used to estimate carbon storage in China’s forest and grassland ecosystems. Changes in carbon storage were expressed as percentage growth rates.
3. Results
3.1. Temporal Trends in Carbon Storage
The carbon storage of all vegetation in nature reserves (NRs) increased by 63.06% over the 15-year period, with forest vegetation and grassland vegetation rising by 60.05% and 86.33%, respectively (Figure 1A). Within forest vegetation in NRs, warm-temperate deciduous broad-leaved forests exhibited the largest increase (3607.79%), followed by temperate needleleaf–deciduous broad-leaved mixed forests (2214.93%), cold-temperate coniferous forests (913.13%), and subtropical evergreen broad-leaved forests (37.44%). In contrast, tropical monsoon forests experienced a decline of −50.68% (Figure 1B).
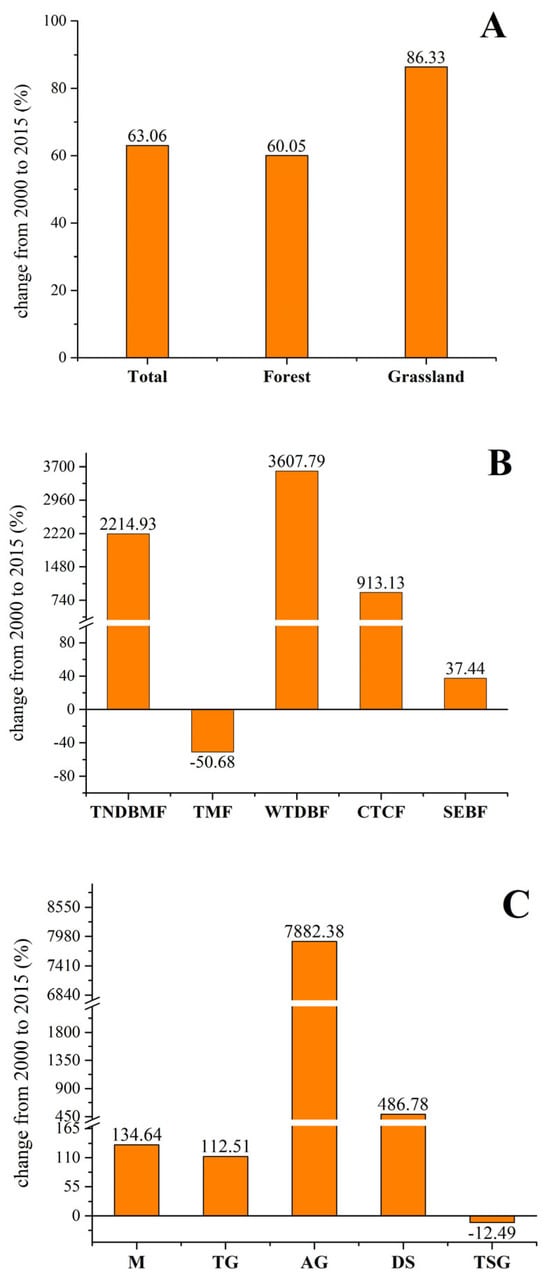
Figure 1.
Carbon storage dynamics in tropical monsoon forests and tropical shrub–grasslands within nature reserves (NRs) from 2000 to 2015. (A) Growth rates of total vegetation carbon storage in NRs, including forests and grasslands. (B) Aggregate changes in carbon storage across five forest vegetation types: TNDBMF: temperate needleleaf–deciduous broad-leaved mixed forest; TMF: tropical monsoon forest; WTDBF: warm-temperate deciduous broad-leaved forest; CTCF: cold-temperate coniferous forest; SEBF: subtropical evergreen broad-leaved forest. (C) Aggregate changes in carbon storage across five grassland vegetation types: M: meadow; TG: typical grassland; AG: alpine grassland; DS: desert steppe; TSG: tropical shrub–grassland.
For grassland vegetation in NRs, carbon storage generally increased, except for in tropical shrub–grassland. Alpine grasslands showed the most significant growth (7882.38%), followed by desert steppes (486.78%), meadows (134.64%), and typical grasslands (112.51%), while the carbon storage of tropical shrub–grassland decreased slightly (−12.49%) (Figure 1C).
The proportion of total vegetation carbon storage in NRs increased by 2.01% relative to the national total, with the carbon storage of forests and grasslands increasing by 2.12% and 1.75%, respectively (Figure 2A). From 2000 to 2015, the proportion of forest vegetation carbon storage within NRs (relative to the national total) increased across all forest types. Tropical monsoon forests exhibited the largest gain (14.97%), followed by warm-temperate deciduous broad-leaved forests (2.35%), cold-temperate coniferous forests (1.51%), subtropical evergreen broad-leaved forests (1.39%), and temperate needleleaf–deciduous broad-leaved mixed forests (0.19%) (Figure 2B).
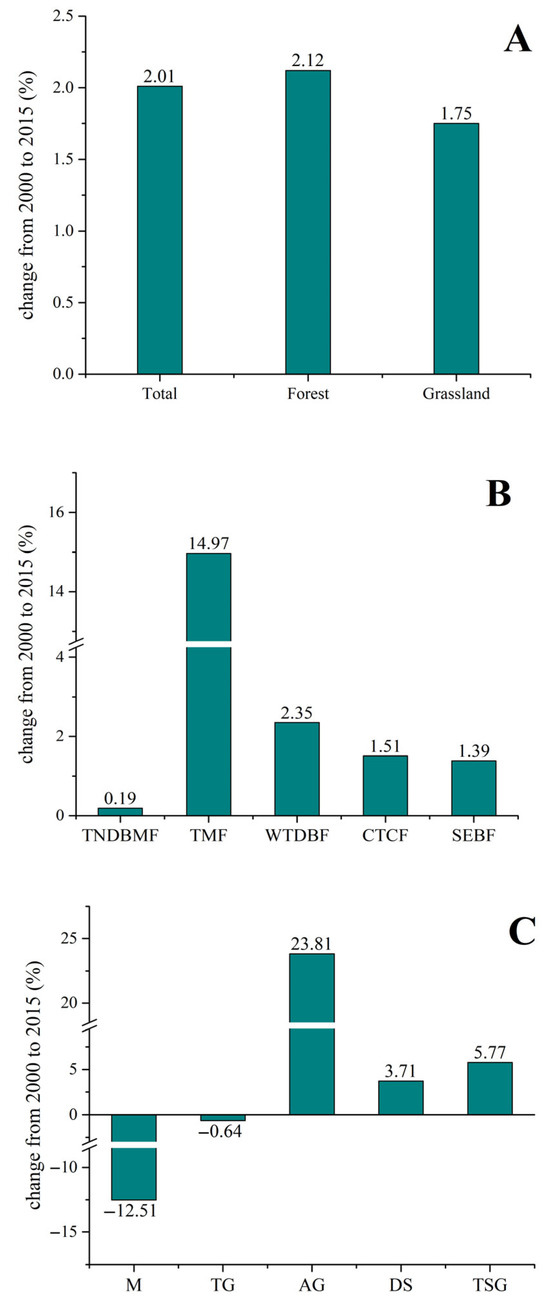
Figure 2.
Changes in the proportion of carbon storage within nature reserves (NRs) relative to the national total, alongside declines in specific grassland types (2000–2015). (A) Growth in the proportion of total vegetation carbon storage in NRs, including forests and grasslands. (B) Relative changes in carbon storage proportions for five forest vegetation types: TNDBMF: temperate needleleaf–deciduous broad-leaved mixed forest; TMF: tropical monsoon forest; WTDBF: warm-temperate deciduous broad-leaved forest; CTCF: cold-temperate coniferous forest; SEBF: subtropical evergreen broad-leaved forest. (C) Relative changes in carbon storage proportions for five grassland vegetation types: M: meadow; TG: typical grassland; AG: alpine grassland; DS: desert steppe; TSG: tropical shrub–grassland.
For grassland vegetation, the proportion of carbon storage in NRs declined for two types, but increased for three others. Alpine grasslands showed the most substantial rise (23.81%), followed by tropical shrub–grasslands (5.77%) and desert steppes (3.71%). In contrast, meadows experienced a larger decrease (−12.51%) compared to typical grasslands (−0.64%) (Figure 2C).
3.2. Spatial Distribution of Carbon Growth Rates in Various NRs
Not all nature reserves (NRs) exhibited positive trends in carbon storage. While 90% of NRs showed overall growth, the rate of increase was notably higher in northeastern and western China compared to other regions (Figure 3A). Carbon storage in the remaining NRs declined over the 15-year period, particularly in northern Heilongjiang Province and southern China, with the most significant reductions occurring in NRs within tropical monsoon rainforest areas (Figure 3B).
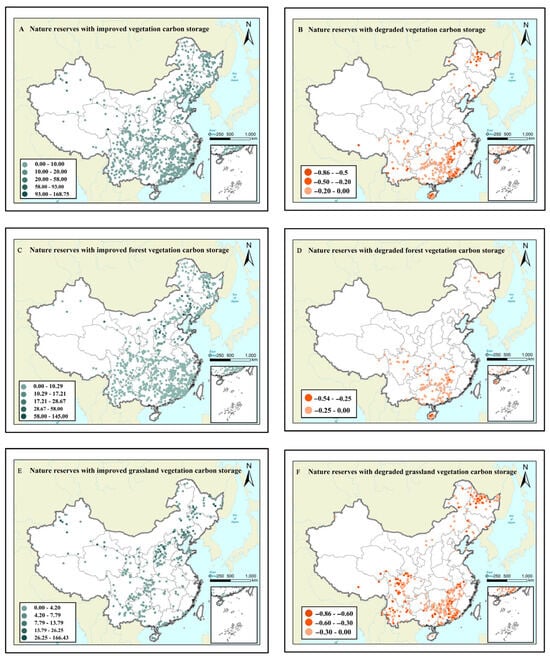
Figure 3.
Spatial distribution of total (A,B), forest (C,D), and grassland (E,F) carbon storage growth rate in each nature reserve over 15-year period.
3.3. Differences in Carbon Density Between Inside and Outside of Nature Reserves
By 2015, the total area of nature reserves (NRs) in China reached 138.76 million hectares (ha), with a combined vegetation carbon storage of 1395.08 teragrams (Tg)—comprising 1212.85 Tg in forest vegetation and 182.23 Tg in grassland vegetation. The carbon density of forest vegetation within NRs exceeded that of regions outside NRs, a trend consistent across all forest types. In contrast, the grassland carbon density outside NRs was higher than that within protected areas, with this pattern observed across grassland types, except for tropical shrub–grassland (Table 1). These results indicate that nature reserves played a significant role in safeguarding forest C stocks, but were less effective in protecting grassland vegetation C stocks.

Table 1.
Comparison of vegetation carbon density between inside and outside of nature reserves.
4. Discussion
4.1. Heterogeneity in Vegetation-Specific Carbon Storage Trends
Overall, carbon storage in NRs exhibited an increasing trend over the 15-year period, with grassland carbon storage growing at a higher rate than forest carbon storage. However, trends varied significantly across vegetation types. Forest carbon stocks in NRs located within cold-temperate, temperate, and warm-temperate zones showed consistent growth. This trend may be partly attributed to the expansion in the number and area of forested NRs. Additionally, prior to 2010, China’s Six Key Forestry Programs (SKFPs)—including initiatives like the Natural Forest Protection Program (NFPP) [25]—promoted sustainable forestry policies, fostering the development of NRs. These programs contributed to forest ecosystem protection through measures such as expanding forest coverage, reducing timber harvesting, implementing economic incentives for reforestation, and combating soil erosion and desertification.
Notably, tropical monsoon forests in NRs experienced a striking decrease of 190.92 Tg in carbon stocks from 2000 to 2015. While increased tree species diversity enhances carbon sequestration and ecosystem services [26], insufficient differentiation in forest quality has led to large-scale deforestation and plantation expansion, even within protected areas like Hainan [27]. During the study period, rubber and pulp plantations expanded extensively, driven by their economic superiority over natural tropical rainforests. This shift reduced biodiversity and severely diminished ecosystem carbon storage capacity [28]. Studies confirm that regrowth of tropical secondary forests and plantations cannot offset carbon emissions from deforestation, resulting in net carbon loss in tropical regions [23]. Furthermore, invasive species in China’s tropics destabilize ecosystems by competing with native species, spreading disease, and altering habitats [29]. For example, Ganshiling Nature Reserve hosts 46 invasive plant species (3.5% of its seed plant diversity), while Hainan Bawangling Nature Reserve has 38 invasive species across 17 families [30,31].
Despite these challenges, the carbon storage coverage of tropical forests in China’s NRs remains substantially higher than that in non-protected forests. This finding underscores NRs’ critical role in mitigating damage to tropical monsoon forests, even amid nationwide deforestation pressures.
Alpine grasslands exhibited the highest carbon storage growth rate among all grassland types. Carbon storage in alpine grassland NRs was minimal in 2000 (0.28 Tg), but increased substantially to 22.36 Tg by 2015, reflecting significant growth. Furthermore, fractional vegetation coverage in NRs across the Qinghai–Tibet Plateau rose by 0.6% (from 31.5% to 32.1%) between 2000 and 2015. As a result, the net primary productivity (NPP) also increased steadily over the same period. Human disturbances in these NRs decreased dramatically from 6.46% to 5.32%, attributable to stricter restrictions on activities in critical reserves such as Qiangtang, Altun Mountains, Selin Co, and Haizi Mountain [32].
Grassland biomass on the Qinghai–Tibet Plateau also increased overall, driven largely by climate change. Rising temperatures have advanced the start of the vegetation growing season, potentially extending its duration—a factor strongly linked to biomass accumulation and carbon storage [32].
In contrast, tropical shrub–grassland carbon stocks in NRs declined slightly, particularly in southeastern China. Most NRs in this region prioritize wetland and forest ecosystems, with minimal focus on tropical shrub–grassland conservation. Urbanization and other human activities have fragmented habitats, undermining ecosystem integrity [33]. Nonetheless, the proportion of protected grasslands nationwide has increased, signaling gradual improvements in grassland ecosystem management.
As the largest terrestrial ecosystem globally and in China, grasslands hold immense ecological and economic value. Restoration efforts have boosted biodiversity by 32.44% and ecosystem services by 30.43% [34], underscoring the urgency of enhancing the protection and management of grassland ecosystems within NRs.
4.2. Spatial Patterns of Carbon Storage Growth in Nature Reserves
Ninety percent of NRs exhibited positive growth in carbon storage, with the highest growth rates observed in NRs located in northwestern and northeastern China. The trends in forest and grassland carbon stock changes within NRs closely mirrored national patterns. From 2000 to 2015, northeastern China expanded both the number and area of NRs, while enhancing their management and protection. Concurrently, climate change influenced vegetation biomass and carbon storage in NRs, particularly in the northeast, where drought frequency decreased [35,36], and precipitation improved—conditions favorable for vegetation growth [37]. Grassland productivity (NDVI) showed a strong positive correlation with precipitation, as adequate moisture is critical for plant development [38].
In arid and semi-arid northwestern China, NRs with the highest carbon storage growth rates were concentrated on the Loess Plateau, where carbon sequestration increased markedly over the 15-year period. Mixed broad-leaved–conifer forests contributed the most to these gains, while bare land and sparse vegetation also yielded modest carbon storage increases [39]. Large-scale afforestation initiatives, such as the Three-North Shelter Forest Program (TNSFP) and the “Grain for Green” policy, significantly bolstered forest protection [39,40]. The 15-year rise in forest carbon storage underscores the effectiveness of NRs and reforestation policies in restoring ecosystems on the Loess Plateau.
The growth rate of carbon stocks in eastern and southeastern NRs was low, with some NRs exhibiting a negative growth trend. We found that deficiencies in NR management systems were a key factor undermining their effectiveness in eastern and southeastern China [41].
First, population growth and human activity disturbances—including reduced per capita ecological carrying capacity and dramatic increases in ecological footprints—have degraded NRs in these regions [42]. Second, the limited spatial scale of NRs constrains their impact: small- and medium-sized NRs comprise 92.32% of all reserves, and their distribution across provinces is disproportionate to provincial land areas. National NRs in southwestern and northwestern China have higher protection rates compared to those in other regions [43]. Third, conflicts between economic development and natural resource protection hinder NR establishment. Eastern and southeastern China, as the nation’s economic hubs, prioritize economic growth over ecological conservation, with economic factors outweighing environmental considerations in NR planning [42].
Additionally, fragmented governance—such as overlapping responsibilities across government levels and mismanagement of multi-category protected areas—has further impeded NR effectiveness in southeastern China. Addressing these challenges through coordinated management and balancing priorities across protected areas is critical to advancing biodiversity conservation and ecosystem resilience.
4.3. Effectiveness of Nature Reserves in Forest C Conservation
Our results indicate that the forest carbon density in NRs exceeds that in unprotected areas, whereas grassland carbon density shows the opposite trend. Additionally, despite the decrease in carbon storage of tropical seasonal rainforests both nationally and within NRs, the proportion of tropical monsoon forest carbon storage in NRs relative to the national total increased during the study period. This finding demonstrates that NRs mitigate carbon storage loss in tropical monsoon forests, as protected areas experienced less severe degradation compared to unprotected regions. Notably, the rise in this proportion for tropical monsoon forests surpassed gains in other forest types, underscoring the critical role of NRs in safeguarding China’s forest carbon functions.
To counter environmental degradation caused by industrial and economic development, China has established NRs alongside key ecological functional zones and biodiversity priority areas. However, calculations reveal that NRs exhibit higher carbon density than other ecological protection zones, including key ecological function areas, important ecological function areas, and biodiversity priority zones (Figure 4). This disparity stems from stricter boundary enforcement, hierarchical management practices, and robust legal frameworks governing newly established NRs [43]. Studies confirm that strict NR management—prohibiting natural resource exploitation within protected zones—enhances ecosystem service value. Compared to other protected areas, NRs provide superior benefits in carbon storage, carbon sequestration, and recreation at national and global scales [43].
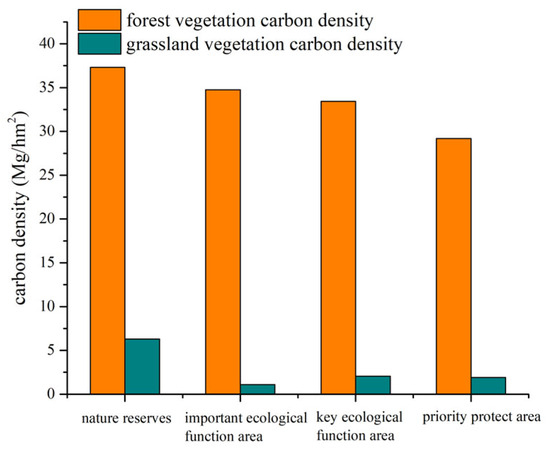
Figure 4.
Comparison of vegetation carbon density in four kinds of protected areas in China.
5. Conclusions
Vegetation carbon storage in China’s NRs exhibited a clear upward trend from 2000 to 2015, with the proportion of NR organic carbon stocks relative to the national total increasing over recent decades. NRs effectively mitigated carbon loss in tropical monsoon forests, reducing degradation within their boundaries compared to unprotected areas. Notably, northeastern and western NRs achieved higher carbon stock growth rates than other regions. While NRs played a vital role in preserving forest carbon functions, no comparable benefits were observed for grassland ecosystems.
Therefore, we recommend that policymakers should focus on the following:
Strengthening the establishment and management of grassland ecosystem-focused NRs in Inner Mongolia. Expanding protected areas in eastern and southeastern China to better encompass forest ecosystems.
Mitigating human and economic pressures on NRs by balancing urban development with conservation priorities; controlling invasive species in tropical rainforests and subtropical evergreen broad-leaved forests; and enhancing connectivity between fragmented protected areas to reduce ecological disruption. For policymakers, aligning NR development with China’s distribution of NRs is critical. While NRs are managed across multiple government tiers, national-scale assessments of protected area planning are essential to ensure coherence and efficacy.
For policymakers, it is crucial to balance the establishment of various NR types in alignment with China’s distribution of natural resources. Although NRs are managed across different government levels, it is essential to assess the rationale for the construction of protected areas on a national scale.
Author Contributions
Conceptualization, B.S. and Y.C.; methodology, B.S.; software, B.S.; validation, B.S. and Y.C.; formal analysis, B.S.; investigation, B.S.; resources, B.S.; data curation, B.S.; writing—original draft preparation, B.S.; writing—review and editing, B.S.; visualization, B.S.; project administration, B.S.; funding acquisition, B.S. All authors have read and agreed to the published version of the manuscript.
Funding
This study was supported by the National Key R&D Program of China (2024YFE0210600).
Institutional Review Board Statement
Not applicable.
Informed Consent Statement
Not applicable.
Data Availability Statement
Data is unavailable due to privacy or ethical restrictions. When the readers need them, please contact the correspond author.
Acknowledgments
We thank Xiaojun Kou from Beijing Normal University who gave many suggestions and comments on this paper which greatly helped to improve it.
Conflicts of Interest
The authors declare no conflict of interest.
Appendix A
Table A1.
Carbon storage calculation model for different forest vegetation types (Mg/ha).
Table A1.
Carbon storage calculation model for different forest vegetation types (Mg/ha).
| Vegetation Type | Year | Stepwise Linear Regression Model |
|---|---|---|
| Temperate needleleaf–deciduous broad-leaved mixed forest | 2000 | y = 96.59 + 222.63x3 − 287.34x4 + 404.88x5 − 334.14x6 − 217.22x10 + 257.08x11 |
| 2015 | y = 66.31 + 73.33x2 + 98.38x6 − 145.78x8 − 84.48x10 − 65.43x11 | |
| Subtropical evergreen broad-leaved forest | 2000 | y = 10.049 − 71.307x2 + 75.923x3 − 59.199x4 + 128.159x5 − 88.66x6 + 74.742x7 − 150.962x8 + 161.085x9 |
| 2015 | y = 13.748 + 44.422x5 − 55.584x8 + 26.475x10 + 13.440x11 + 42.723x12 | |
| Cold-temperate coniferous forest | 2000 | y = 120.83 + 718.92x3 − 592.93x4 + 857.76x5 − 1277.34x7 + 678.67x8 − 324.84x9 + 143.85x11 |
| 2015 | y = 551.82 + 392.79x1 − 459.45x3 − 180.40x5 − 524.87x8 + 258.99x10 | |
| Tropical rainforest | 2000 | y = −1050.6 − 4307.7x2 + 6206.4x3 − 2296.7x4 + 2915.6x5 − 2783.3x6 + 1340.7x7 + 1433.9x10 − 1146.5x1 |
| 2015 | y = 4109.3 − 804.5x1 − 572.0x2 − 1321.2x3 + 9068.9x4 + 1982.9x6 − 6828.0x7 + 475.7x8 + 1291.4x10 + 3422.7x11 – 11,218.2x12 | |
| Warm-temperate deciduous broad-leaved forest | 2000 | y = 65.711 − 94.681x2 + 168.834x3 − 101.352x8 |
| 2015 | y = 40.05 + 32.01x + 38.31x2 + 32.17x4 − 86.79x5 + 73.47x6 + 56.24x7 − 117.51x8 + 61.02x9 − 49.29x10 |
Note: y represents vegetation biomass.
Table A2.
Carbon storage calculation model for different grassland vegetation types (g/m3).
Table A2.
Carbon storage calculation model for different grassland vegetation types (g/m3).
| Grassland Type | Steppe Regionalization | Distribution Reginon | Unitary Linear Model |
|---|---|---|---|
| Meadow steppe | Northeast grassland | Central part of northeast | y = 8708.54 NDVI − 2218.58 |
| Desert steppe | Inner Mongolia grassland | Xilin Gol League, Inner Mongolia Autonomous Region | y = 6874.37 NDVI − 2154.14 |
| Typical steppe | y = 4830.21 NDVI − 1837.76 | ||
| Meadow steppe | y = 7963.35 NDVI − 3393.17 | ||
| Desert steppe | Loess Plateau grassland | Inner Mongolia, Gansu, and Ningxia | y = 5673.47 NDVI − 463.63 |
| Semi-arid warm shrub | Warm-temperate grassland in North China | Hebei, Shanxi, and Shaanxi | y = 10,305.05 NDVI − 2255.59 |
| Desert steppe and montane steppe | Xinjiang grassland | Xinjiang | y = 6916.80 NDVI − 553.00 |
| Meadow steppe | Xinjiang grassland | Southern mountain area of Urumqi in middle section of northern slope of Tianshan Mountains | y = 10,490.51 NDVI − 1881.69 |
| Alpine meadow | Qinghai–Tibet Plateau grassland | y = 7485.98 NDVI − 2301.23 | |
| Humid tropical shrub–grassland | Southern meadow | y = 12,418.85 NDVI − 4353.07 | |
| Yew grass meadow | Qinghai–Tibet Plateau grassland | Mountainous area in southern suburbs of Urumqi, northern slope of Tianshan Mountains | y = 66.72 NDVI − 1142.19 |
| Alpine wormwood meadow | y = 65.31 NDVI − 780.70 | ||
| Moss meadow | y = 70.54 NDVI − 1374.84 | ||
| Alpine meadow | y = 1030.06 NDVI |
Note: y represents vegetation biomass.
References
- Strassburg, B.B.N.; Iribarrem, A.; Beyer, H.L.; Cordeiro, C.L.; Crouzeilles, R.; Jakovac, C.C.; Junqueira, A.B.; Lacerda, E.; Latawiec, A.E.; Balmford, A.; et al. Global priority areas for ecosystem restoration. Nature 2020, 586, 724–729. [Google Scholar] [CrossRef]
- Jenkins, C.N.; Joppa, L. Expansion of the global terrestrial protected area system. Biol. Conserv. 2009, 142, 2166–2174. [Google Scholar] [CrossRef]
- Chen, Y.; Tang, Z.; Fang, J. Distribution of nature reserves and status of biodiversity protection in China. Biodivers. Sci. 2009, 17, 664–674. [Google Scholar] [CrossRef]
- Zhu, P.; Huang, L.; Xiao, T.; Wang, J. Dynamic changes of habitats in China’s typical national nature reserves on spatial and temporal scales. J. Geogr. Sci. 2018, 28, 778–790. [Google Scholar] [CrossRef]
- Weiskopf, S.R.; Isbell, F.; Arce-Plata, M.I.; Di Marco, M.; Harfoot, M.; Johnson, J.; Lerman, S.B.; Miller, B.W.; Morelli, T.L.; Mori, A.S.; et al. Biodiversity loss reduces global terrestrial carbon storage. Nat. Commun. 2024, 15, 4354. [Google Scholar] [CrossRef] [PubMed]
- Bruner, A.G.; Gullison, R.E.; Rice, R.E.; da Fonseca, G.A.B. Effectiveness of parks in protecting tropical biodiversity. Science 2001, 291, 125–128. [Google Scholar] [CrossRef]
- Soares-Filho, B.; Moutinho, P.; Nepstad, D.; Anderson, A.; Rodrigues, H.; Garcia, R.; Dietzsch, L.; Merry, F.; Bowman, M.; Hissa, L.; et al. Role of Brazilian Amazon protected areas in climate change mitigation. Proc. Natl. Acad. Sci. USA 2010, 107, 10821–10826. [Google Scholar] [CrossRef]
- Sang, W.; Ma, K.; Axmacher, J.C. Securing a Future for China’s Wild Plant Resources. BioScience 2011, 61, 720–725. [Google Scholar] [CrossRef]
- Game, E.T.; Bode, M.; McDonald-Madden, E.; Grantham, H.S.; Possingham, H.P. Dynamic marine protected areas can improve the resilience of coral reef systems. Ecol. Lett. 2009, 12, 1336–1346. [Google Scholar] [CrossRef]
- Sun, S.; Sang, W.; Jan Christoph, A. China’s national nature reserve network shows great imbalances in conserving the country’s mega-diverse vegetation. Sci. Total Environ. 2020, 137159. [Google Scholar] [CrossRef]
- Thomas, C.D.; Anderson, B.J.; Moilanen, A.; Eigenbrod, F.; Heinemeyer, A.; Quaife, T.; Roy, D.B.; Gillings, S.; Armsworth, P.R.; Gaston, K.J.; et al. Reconciling biodiversity and carbon conservation. Ecol. Lett. 2013, 16, 39–47. [Google Scholar] [CrossRef]
- Anderson-Teixeira, K.J. Prioritizing biodiversity and carbon. Nat. Clim. Change 2018, 8, 667–668. [Google Scholar] [CrossRef]
- Hisano, M.; Searle, E.B.; Chen, H.Y.H. Biodiversity as a solution to mitigate climate change impacts on the functioning of forest ecosystems. Biol. Rev. 2018, 93, 439–456. [Google Scholar] [CrossRef] [PubMed]
- Isbell, F.; Tilman, D.; Polasky, S.; Loreau, M.; Bardgett, R. The biodiversity-dependent ecosystem service debt. Ecol. Lett. 2015, 18, 119–134. [Google Scholar] [CrossRef] [PubMed]
- Tang, Z.; An, H.; Deng, L.; Wang, Y.; Zhu, G.; Shangguan, Z. Effect of desertification on productivity in a desert steppe. Sci. Rep. 2016, 6, 27839. [Google Scholar] [CrossRef]
- Thompson, I.D.; Okabe, K.; Parrotta, J.A.; Brockerhoff, E.; Jactel, H.; Forrester, D.I.; Taki, H. Biodiversity and ecosystem services: Lessons from nature to improve management of planted forests for REDD-plus. Biodivers. Conserv. 2014, 23, 2613–2635. [Google Scholar] [CrossRef]
- Adhikari, K.; Hartemink, A.E. Linking soils to ecosystem services—A global review. Geoderma 2016, 262, 101–111. [Google Scholar] [CrossRef]
- Mo, L.; Zohner, C.M.; Reich, P.B.; Liang, J.; de Miguel, S.; Nabuurs, G.-J.; Renner, S.S.; Hoogen, J.v.D.; Araza, A.; Herold, M.; et al. Integrated global assessment of the natural forest carbon potential. Nature 2023, 624, 92–101. [Google Scholar] [CrossRef]
- Juan, C.Á.-Y.; Martin, D. Enhancing ecosystem function through conservation threatened plants increase local carbon storage in tropical dry forests. Trop. Conserv. Sci. 2015, 8, 10. [Google Scholar] [CrossRef]
- Li, A.J.; Zhang, A.Z.; Zhou, Y.X.; Yao, X. Decomposition analysis of factors affecting carbon dioxide emissions across provinces in China. J. Clean. Prod. 2017, 141, 1428–1444. [Google Scholar] [CrossRef]
- Xu, J.; Melick, D.R. Rethinking the effectiveness of public protected areas in southwestern China. Conserv. Biol. 2007, 21, 318–328. [Google Scholar] [CrossRef] [PubMed]
- Song, Q.-H.; Tan, Z.-H.; Zhang, Y.-P.; Sha, L.-Q.; Deng, X.-B.; Deng, Y.; Zhou, W.-J.; Zhao, J.-F.; Zhao, J.-B.; Zhang, X.; et al. Do the rubber plantations in tropical China act as large carbon sinks? Iforest-Biogeosci. For. 2014, 7, 42–47. [Google Scholar] [CrossRef]
- Fang, J.; Chen, A.; Peng, C.; Zhao, S.; Ci, L. Changes in Forest Biomass Carbon Storage in China Between 1949 and 1998. Science 2001, 292, 2320–2322. [Google Scholar] [CrossRef] [PubMed]
- Wang, G.; Innes, J.L.; Lei, J.; Dai, S.; Wu, S.W. China’s Forestry Reforms; American Association for the Advancement of Science: Washington, DC, USA, 2007; pp. 230–236. [Google Scholar]
- Ruiz-Jaen, M.C.; Potvin, C. Can we predict carbon stocks in tropical ecosystems from tree diversity? Comparing species and functional diversity in a plantation and a natural forest. New Phytol. 2011, 189, 978–987. [Google Scholar] [CrossRef] [PubMed]
- Zhai, D.-L.; Xu, J.-C.; Dai, Z.-C.; Cannon, C.H.; Grumbine, R.E. Increasing tree cover while losing diverse natural forests in tropical Hainan, China. Reg. Environ. Change 2013, 14, 611–621. [Google Scholar] [CrossRef]
- Zhai, D.-L.; Cannon, C.H.; Slik, J.F.; Zhang, C.-P.; Dai, Z.-C. Rubber and pulp plantations represent a double threat to Hainan’s natural tropical forests. J. Environ. Manag. 2012, 96, 64–73. [Google Scholar] [CrossRef]
- Axmacher, J.C.; Sang, W.; van Kleunen, M. Plant invasions in China—Challenges and chances. PLoS ONE 2013, 8, e64173. [Google Scholar] [CrossRef]
- Zhang, Z.R.; Xing, F. The Composition and Origin of Alien Plants in Ganshiling Nature Reserve in Hainan, China. Guizhou Agric. Sci. 2011, 39, 31–33. [Google Scholar]
- Hu, X.H.; Xiao, Y.A.; Zen, J.J. Investigation and analysis on alien plants in Bawangling national nature reserves. J. Jinggangshan Univ. (Nat. Sci. Ed.) 2011, 32, 131–136. [Google Scholar]
- Liu, S.; Yin, Y.; Cheng, F.; Hou, X.; Dong, S.; Wu, X.; Bond-Lamberty, B. Spatio-temporal variations of conservation hotspots based on ecosystem services in Xishuangbanna, Southwest China. PLoS ONE 2017, 12, e0189368. [Google Scholar] [CrossRef]
- Ren, Y.; Lü, Y.; Fu, B. Quantifying the impacts of grassland restoration on biodiversity and ecosystem services in China: A meta-analysis. Ecol. Eng. 2016, 95, 542–550. [Google Scholar] [CrossRef]
- Cong, D.; Zhao, S.; Chen, C.; Duan, Z. Characterization of droughts during 2001–2014 based on remote sensing: A case study of Northeast China. Ecol. Inform. 2017, 39, 56–67. [Google Scholar] [CrossRef]
- Zhou, L.; Wu, J.; Mo, X.; Zhou, H.; Diao, C.; Wang, Q.; Chen, Y.; Zhang, F. Quantitative and detailed spatiotemporal patterns of drought in China during 2001–2013. Sci. Total Environ. 2017, 589, 136–145. [Google Scholar] [CrossRef] [PubMed]
- Yang, G.A.; Bao, X.; Chen, H.; Liu, Y. Huang;Study of the vegetation cover change and its driving factors over Xinjiang during 1998–2007. J. Glaciol. Geocryol. 2009, 3, 436–445. [Google Scholar]
- Mao, D.; Wang, Z.; Luo, L.; Ren, C. Integrating AVHRR and MODIS data to monitor NDVI changes and their relationships with climatic parameters in Northeast China. Int. J. Appl. Earth Obs. Geoinf. 2012, 18, 528–536. [Google Scholar] [CrossRef]
- Zhang, J.; Liu, M.; Zhang, M.; Yang, J.; Cao, R.; Malhi, S.S. Changes of vegetation carbon sequestration in the tableland of Loess Plateau and its influencing factors. Environ. Sci. Pollut. Res. Int. 2019, 26, 22160–22172. [Google Scholar] [CrossRef]
- Sun, Y.; Zhu, J.; Yan, Q.; Hu, Z.; Zheng, X. Changes in vegetation carbon stocks between 1978 and 2007 in central Loess Plateau, China. Environ. Earth Sci. 2016, 75, 312–328. [Google Scholar] [CrossRef]
- Xu, W.; Xiao, Y.; Zhang, J.; Yang, W.; Zhang, L.; Hull, V.; Wang, Z.; Zheng, H.; Liu, J.; Polasky, S.; et al. Strengthening protected areas for biodiversity and ecosystem services in China. Proc. Natl. Acad. Sci. USA 2017, 114, 1601–1606. [Google Scholar] [CrossRef]
- Liu, X.; Jiang, D.; Wang, Q.; Liu, H.; Li, J.; Fu, Z. Evaluating the Sustainability of Nature Reserves Using an Ecological Footprint Method: A Case Study in China. Sustainability 2016, 8, 1272. [Google Scholar] [CrossRef]
- Guo, Z.; Cui, G.; Yang, J. Establishment of Nature Reserves in Administrative Regions of Mainland China. PLoS ONE 2015, 10, 13. [Google Scholar] [CrossRef]
- Wu, J.; Gong, Y.; Wu, J. Spatial distribution of nature reserves in China: Driving forces in the past and conservation challenges in the future. Land Use Policy 2018, 77, 31–42. [Google Scholar] [CrossRef]
- Liu, P.; Jiang, S.; Zhao, L.; Li, Y.; Zhang, P.; Zhang, L. What are the benefits of strictly protected nature reserves? Rapid assessment of ecosystem service values in Wanglang Nature Reserve, China. Ecosyst. Serv. 2017, 26, 70–78. [Google Scholar] [CrossRef]
Disclaimer/Publisher’s Note: The statements, opinions and data contained in all publications are solely those of the individual author(s) and contributor(s) and not of MDPI and/or the editor(s). MDPI and/or the editor(s) disclaim responsibility for any injury to people or property resulting from any ideas, methods, instructions or products referred to in the content. |
© 2025 by the authors. Licensee MDPI, Basel, Switzerland. This article is an open access article distributed under the terms and conditions of the Creative Commons Attribution (CC BY) license (https://creativecommons.org/licenses/by/4.0/).