Article

Corridors of Suitable Distribution of Betula platyphylla Sukaczev Forest in China Under Climate Warming

by
Bingying Xie
1,
Huayong Zhang
1,*,
Xiande Ji
2,
Bingjian Zhao
1,
Yanan Wei
1,
Yijie Peng
1 and
Zhao Liu
1
1
Theoretical Ecology and Engineering Ecology Research Group, School of Life Sciences, Shandong University, Qingdao 266237, China
2
Energy Conversion Group, Energy and Sustainability Research Institute Groningen, Faculty of Science and Engineering, University of Groningen, Nijenborgh 6, 9747AG Groningen, The Netherlands
*
Author to whom correspondence should be addressed.
Sustainability 2025, 17(15), 6937; https://doi.org/10.3390/su17156937 (registering DOI)
Submission received: 19 June 2025 / Revised: 28 July 2025 / Accepted: 29 July 2025 / Published: 30 July 2025
(This article belongs to the Section Sustainable Forestry)

Abstract

Betula. platyphylla Sukaczev (B. platyphylla) forest is an important montane forest type. Global warming has impacted its distribution. However, how it affects suitable distribution across ecoregions and corresponding biodiversity protection measures remains unclear. This study used the Maxent model to analyze the suitable distribution and driving variables of B. platyphylla forest in China and its four ecoregions. The minimum cumulative resistance (MCR) model was applied to construct corridors nationwide. Results show that B. platyphylla forest in China is currently mainly distributed in the four ecoregions; specifically, in Gansu and Shaanxi Province in Northwest China, Heilongjiang Province in Northeast China, Sichuan Province in Southwest China, and Hebei Province and Inner Mongolia Autonomous Region in North China. Precipitation and temperature are the main factors affecting suitable distribution. With global warming, the suitable areas in China including the North, Northwest China ecoregions are projected to expand, while Northeast and Southwest China ecoregions will decline. Based on the suitable areas, we considered 45 corridors in China, spanning the four ecoregions. Our results help understand dynamic changes in the distribution of B. platyphylla forest in China under global warming, providing scientific guidance for montane forests’ sustainable development.

1. Introduction

Forests are a crucial type of terrestrial ecosystem and a key component in the global carbon sink [1,2]. They exerts significant influence on maintaining ecological balance, biodiversity, and carbon sequestration [1,3,4,5]. Global warming has already had an impact on the distribution patterns of forest [6,7]. For example, global warming has led forests to shift towards higher latitudes or higher altitudes [8], and the process of habitat fragmentation is also intensifying. These changes impair forests’ ability to absorb and store carbon, hinder gene exchange among species, and reduce genetic diversity [9,10,11,12,13], posing a major threat to ecosystems. Ecological corridor construction has become an indispensable approach to alleviate habitat fragmentation and enhance the stability of forest ecosystems [14,15]. Effective corridors require connectivity not only among extant forest patches but also with areas identified as climatically suitable in future projections, establishing dynamic conduits for species migration under changing climate regimes.
Betula. platyphylla Sukaczev (B. platyphylla) is widely distributed in China. B. platyphylla serves as a vital element in China’s primary forest and secondary forest [16], characterized by its rapid growth rate, cold hardiness, and drought tolerance [17,18]. Global warming has caused the habitat of B. platyphylla species to shrink and expand [19]. Currently, the research on B. platyphylla concentrates on the impact of climate change on the radial growth of B. platyphylla forest [20,21], genetic improvement [22], the physiological mechanisms of stress resistance [22,23,24], and the evolution of species distribution pattern under global warming [19,25,26]. Although the distribution patterns of B. platyphylla have been studied at the species level, there are few studies on ecological corridor construction amid global warming trends. Therefore, studying the suitable distribution of B. platyphylla and constructing ecological corridors under global warming is a vital approach to address climate change and achieve sustainable development.
The Maxent model (maximum entropy model) is one of the important ecological niche model approaches in ecological research [27,28,29]. It can utilize species distribution data and environmental factors to analyze and predict the suitable distribution [26]. Ecological corridors can be constructed according to the suitable distribution. Dynamic graph theory models can simulate how species maintain or adjust their connecting paths in a dynamic and unstable environment [30,31]. However, dynamic models require continuous updates of input data and incur relatively high operational costs. The minimum cumulative resistance (MCR) model is currently the most widely applied method for constructing ecological corridors [32,33,34]. The MCR model integrates information on biological interactions through resistance surfaces [35]. This method quantitatively measures the separation of ecological patches and determined the optimal species migration routes through spatial analysis [36]. In addition, using the gravity model, the significance of ecological corridors can be compared, and the grades of ecological corridors between patches can be evaluated [37].
B. platyphylla in China can be divided into four ecoregions (Northwest, Southwest, Northeast, and North China) based on the six major regions of China. In this study, the Maxent model was employed to forecast suitable habitats for B. platyphylla at both the national scale and within these four ecoregions. The MCR model was employed to determine the corridors for the diffusion of B. platyphylla forest. The aims of this research were as follows: (1) to analyze the distribution patterns of B. platyphylla forest and their driving factors in different ecoregions; (2) to predict the distribution and migration of the suitable areas of B. platyphylla forest in four ecoregions under future climate change scenarios; (3) to calculate the comprehensive landscape resistance surface (LRS) according to the MCR model and construct corridors of B. platyphylla forest in China. This study aims to furnish a scientific basis for the protection and of B. platyphylla forest.

2. Materials and Methods

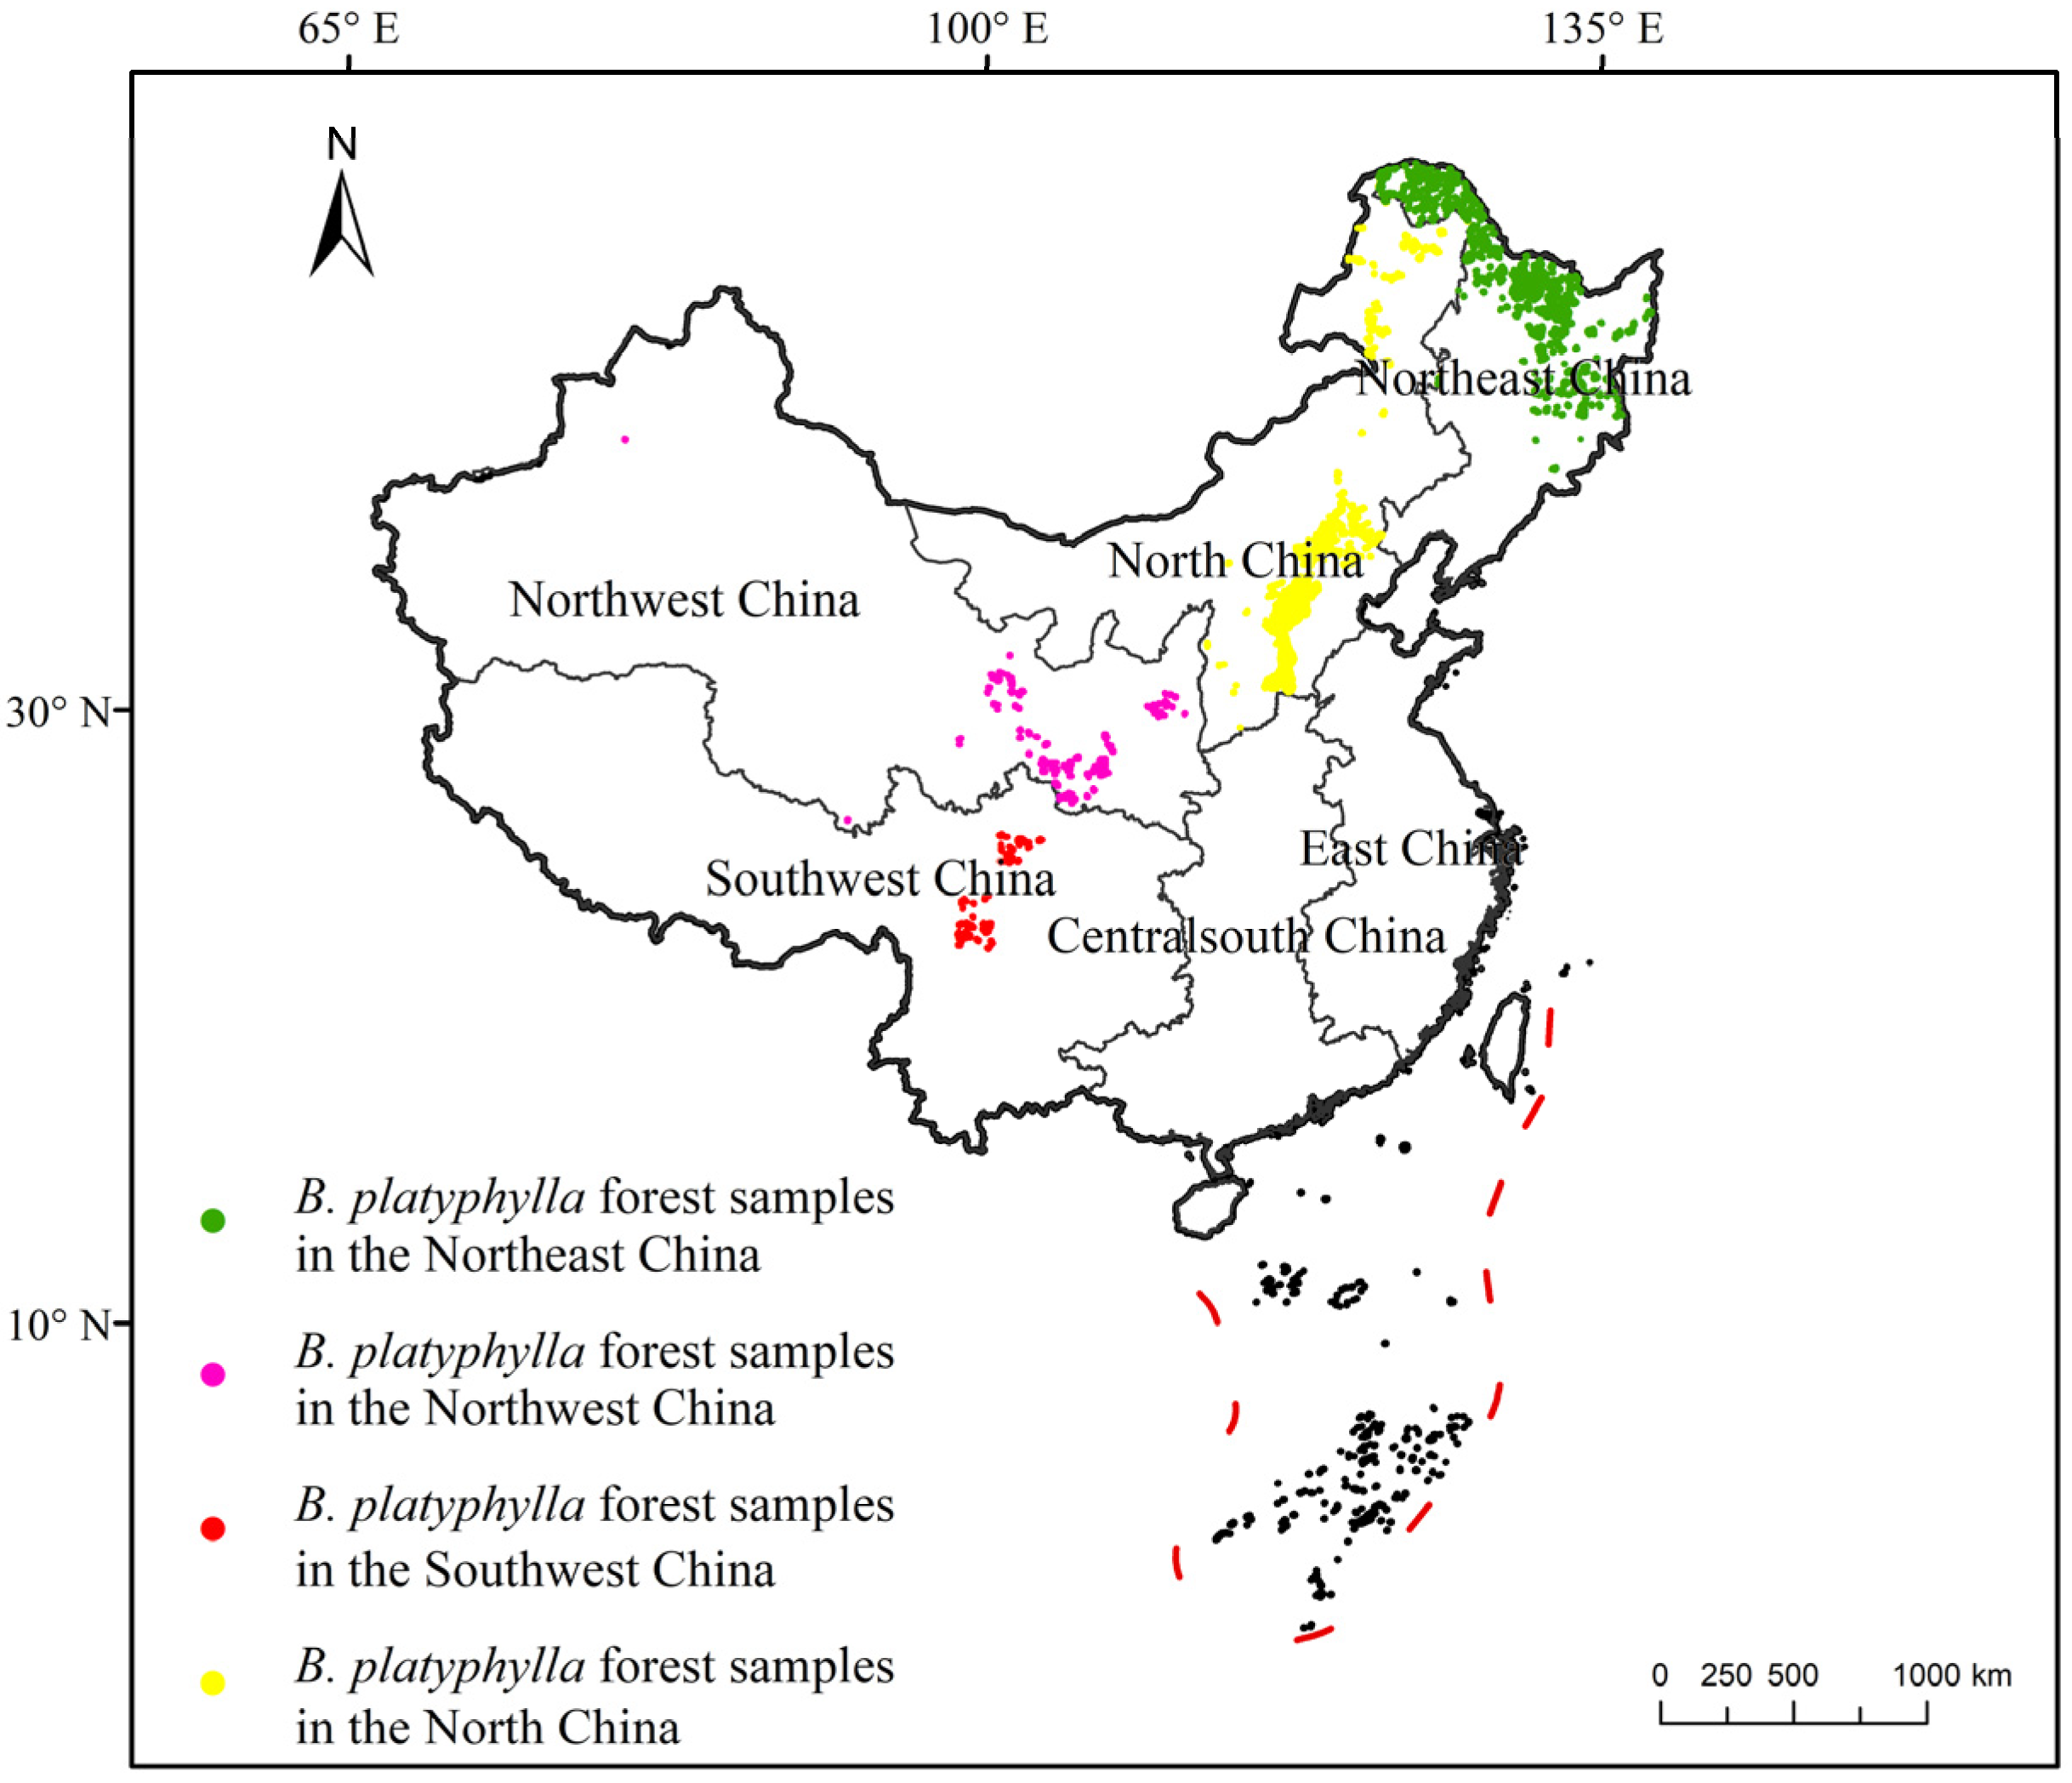
2.1. Data Sources and Data Processing

The base map of China, including data for the six major regions of China, was acquired from the Resource and Environmental Science Data Platform (https://www.resdc.cn/ accessed on 20 November 2024). Distribution data for the B. platyphylla forest were obtained from the Vegetation Atlas of China 1:1,000,00 [38] at a spatial resolution of 1 km × 1 km grid. To guarantee modeling precision, ENMToolsv1.4.4 software was applied to remove closely situated points, retaining one point in each 5 km × 5 km grid [39]. Finally, 6995 spatial distribution points of B. platyphylla forest were retained. According to the six major regions of China, B.platyphylla forest was divided into four ecoregions: Northwest, Southwest, Northeast, and North China (Figure 1). Northwest China has an arid to semi-arid climate with significant daily temperature variations. This region primarily supports scattered populations of B. platyphylla. Across Northwest China, annual mean temperatures range from −18.7 °C to 15.8 °C, while annual precipitation varies between 11 mm and 1226 mm. Northwest China has a temperate continental monsoon climate and serves as one of the primary natural ranges of B. platyphylla. Across Northeast China, annual mean temperatures range from −6.1 °C to 11.6 °C, while annual precipitation varies between 378 mm and 1010 mm. Southwest China exhibits complex climatic variability and steep elevational gradients. Within this region, B. platyphylla predominantly grows in mid-to-high-altitude zones, existing on the edge of its potential habitat suitability. Across Southwest China, annual mean temperatures range from −17.3 °C to 24.1 °C, while annual precipitation varies between 27 mm and 3064 mm. North China features a semi-arid to semi-humid temperate climate, where primary B. platyphylla forests have been significantly impacted by human activity in certain areas. Across North China, annual mean temperatures range from −6.4 °C to 14.5 °C, while annual precipitation varies between 33 mm and 708 mm. We ran the Maxent model separately for each of the four ecoregions and once more independently at the national scale, with variable contribution values extracted individually.
This research selected 38 environmental factors (Table 1). The contemporary climate data, future climate data, and elevation data were acquired from Worldclim (https://worldclim.org/ accessed on 24 January 2024) at a spatial resolution of 5 km × 5 km grid. Slope data and aspect data were extracted from elevation data by surface analysis tools in ArcGIS10.8. The soil data was obtained from National Tibetan Plateau Data Center (https://data.tpdc.ac.cn/ accessed on 1 March 2024) at a spatial resolution of 1 km × 1 km grid. The human footprint dataset (HFP) had a spatial resolution of 1 km × 1 km (http://creativecommons.org/licenses/by/4.0/ accessed on 31 July 2024) [40]. NDVI data were obtained from the Resource and Environmental Science Data Platform (https://www.resdc.cn/ accessed on 31 July 2024), with a spatial resolution of 1 km × 1 km. The land cover dataset (CLCD) was derived from Yang, with a spatial resolution of 30 m × 30 m [41]. Finally, the Resample tool in ArcGIS was used to unify the resolution to 5 km × 5 km.
Future climate change scenarios were obtained from the BCC-CSM2-MR model within CMIP6. The BCC-CSM2-MR model showed better performance in modeling tropospheric temperatures and atmospheric circulation over East Asia [42]. Furthermore, the spatial correlation coefficient between BCC-CSM2-MR and the actual observational data is significantly better than the average of most CMIP6 models [43], overcoming the issue of most models excessively overestimating soil moisture. Low (SSP126), medium (SSP245), relatively high (SSP370), and maximum (SSP585) emission scenarios for the 2030s (averaged over 2021–2040), 2050s (averaged over 2041–2060), 2070s (averaged over 2061–2080), and the 2090s (averaged over 2081–2100) were selected. Considering the comparative stability of soil and topographic factors, we postulated that these factors would remain unchanged [44].
To minimize the impact of multicollinearity in environmental factors, 38 environmental factors were imported into the ENMTools for the Pearson correlation coefficient test. A Pearson correlation coefficient greater than 0.8 was used as the threshold to eliminate multicollinearity factors [45]. This threshold avoided the impact of redundant variables on model stability while retaining the main environmental gradients. When the correlation coefficient of the two factors was greater than 0.8, we selected the one with the higher contribution rate. Finally, 19 environmental factors were selected at the national scale. On the local scale, 20 environmental factors were retained in the Northwest China, 19 in Northeast China, 18 in North China, and 21 in Southwest China (Table S1).

2.2. Calculation of Suitable Areas and Recognize of Driving Variables

The pruned environmental and distribution data of four ecoregions and China were input into the Maxent model. A random selection of 75% occurrence records was designated for training, with the remaining 25% reserved for testing [46]. After 10 repeated runs, the results were exported in Logistic format [47]. The value of the area under the receiver operating characteristic curve (AUC) was employed to evaluate the results’ accuracy [48].
Based on the ASC data output by Maxent model, the natural breaks method was used to classify the suitable areas into four categories [49]: unsuitable, marginally, moderately, and highly suitable. The grid areas of each suitable area under each climate scenario were calculated in ArcGIS. For assessing migration status in suitable areas, the mean center approach was used to compute the centroid of highly suitable area distributions [50]. The average elevation of the highly suitable areas was obtained by combining the elevation data with the data for the highly suitable areas.
The jackknife method was employed to evaluate major environmental variables affecting species distribution, enabling analysis of their contribution proportions to the model. The response curve showed the relationship between environmental variables and suitable areas [51]. We ran the Maxent model separately in the four ecoregions, and independently at the national scale. Contributions of variables were extracted individually. Response curves showed that ecological variable ranges with an occurrence probability exceeding 0.5 were optimal for plant growth conditions.

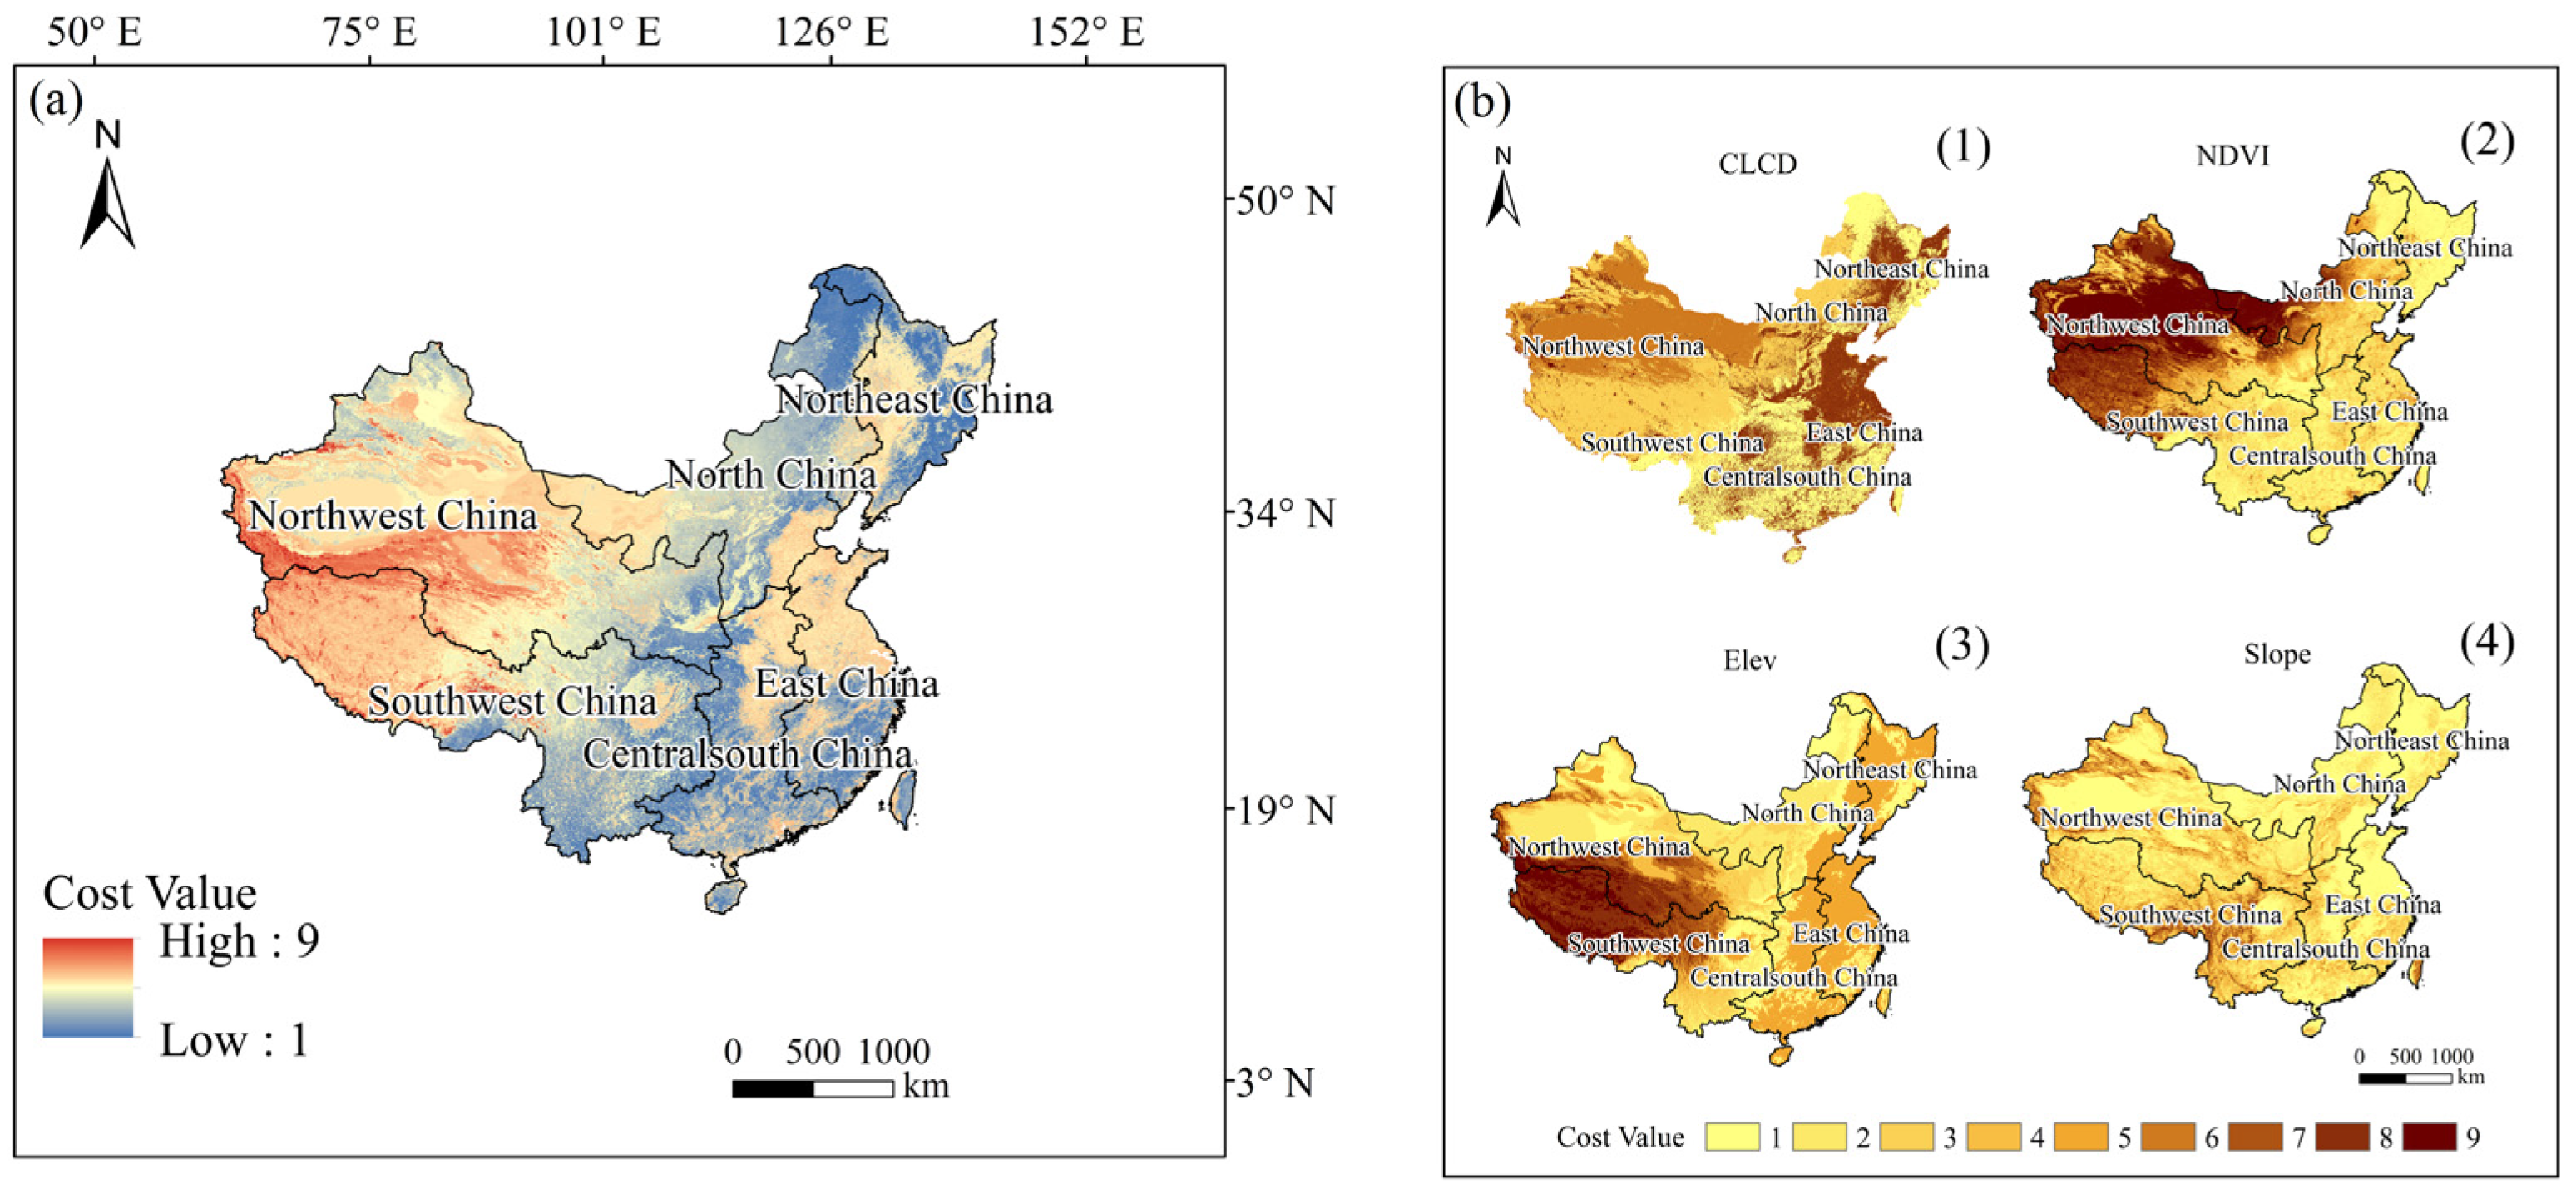
2.3. Construct of Ecological Corridors

As a key hub in the ecological corridors, ecological source areas are crucial for improving the overall functional connectivity of the landscape and alleviating the population isolation caused by habitat fragmentation. This study employed fuzzy overlay techniques in ArcGIS to integrate current and projected suitable habitats of B. platyphylla forest, generating resilient habitat zones supporting persistent survival. The reclassify tool in ArcGIS was applied to divide the highly and moderately stable suitable areas into suitable areas, and the rest were classified as unsuitable areas [47]. After dichotomization, the suitable stable areas were imported into the startGTB 2.8 software to conduct MSPA analysis, and the core areas were obtained [52]. The top ten core areas in terms of area were selected as the ecological source surface, and the Feature to Point tool was then used to obtain ten ecological source sites. Since the ecological source points were selected according to the areas suitable for B. platyphylla in China, the ecological corridors were only applicable at the national scale in China.
By overlaying and analyzing land use types, NDVI, elevation, and slope, the ecological resistance pattern of the diffusion of B. platyphylla forest was reflected. This overcame the deviation caused by the simplification of ecological processes in single-dimensional modeling. Therefore, we used the land use type, NDVI, elevation, and slope to build the LRS. The resistance gradient was divided into nine resistance classes (1–9) and statistical analysis software (yaahp 10.1) was utilized to obtain the weights of each resistance factor. Combining the weights of four indicators (raster data) in ArcGIS created the LRS (Figure 2) [53].
We applied cost path analysis in ArcGIS to the LRS, determining the minimum resistance value between sources, thus generating potential corridors [53]. The distribution of the ecological corridors was obtained by using the Raster to Polyline tool in ArcGIS. We adopted the gravity model to calculate the interaction forces (Table S2) [54]. We employed the natural breakpoint method to partition resistance value intervals [55] for identifying first-level, second-level, and general ecological corridors [32] (784.34 to 3302.21 were the first level ecological corridors, 237.57 to 784.34 were the second-level corridors, and 8.43 to 237.57 were the general corridors). In the actual construction, the first and second level corridors should be given priority, and the general corridors should be supplemented. However, the corridors identified in this study are potential and thus require field validation.
G i j = N i N j D i j 2 = 1 P i × ln S i 1 P j × ln S j L i j L max 2 = L max 2 ln S i ln S j L i j 2 P i P j
The force of interaction between ecological source sites is represented by Gij. Ni and Nj indicate the weight values of two ecological source sites, while Dij represents the standardized potential ecological resistance between ecological source sites. The overall ecological resistance value between ecological source sites is Lij; the greatest value is Lmax. Si is ecological source site i’s area. Sj is ecological source site j’s area. Pi is the resistance of ecological source site i, and Pj is the resistance of ecological source site j.
Finally, we calculated two first-level corridors, five second-level corridors, and 38 general corridors.

3. Results

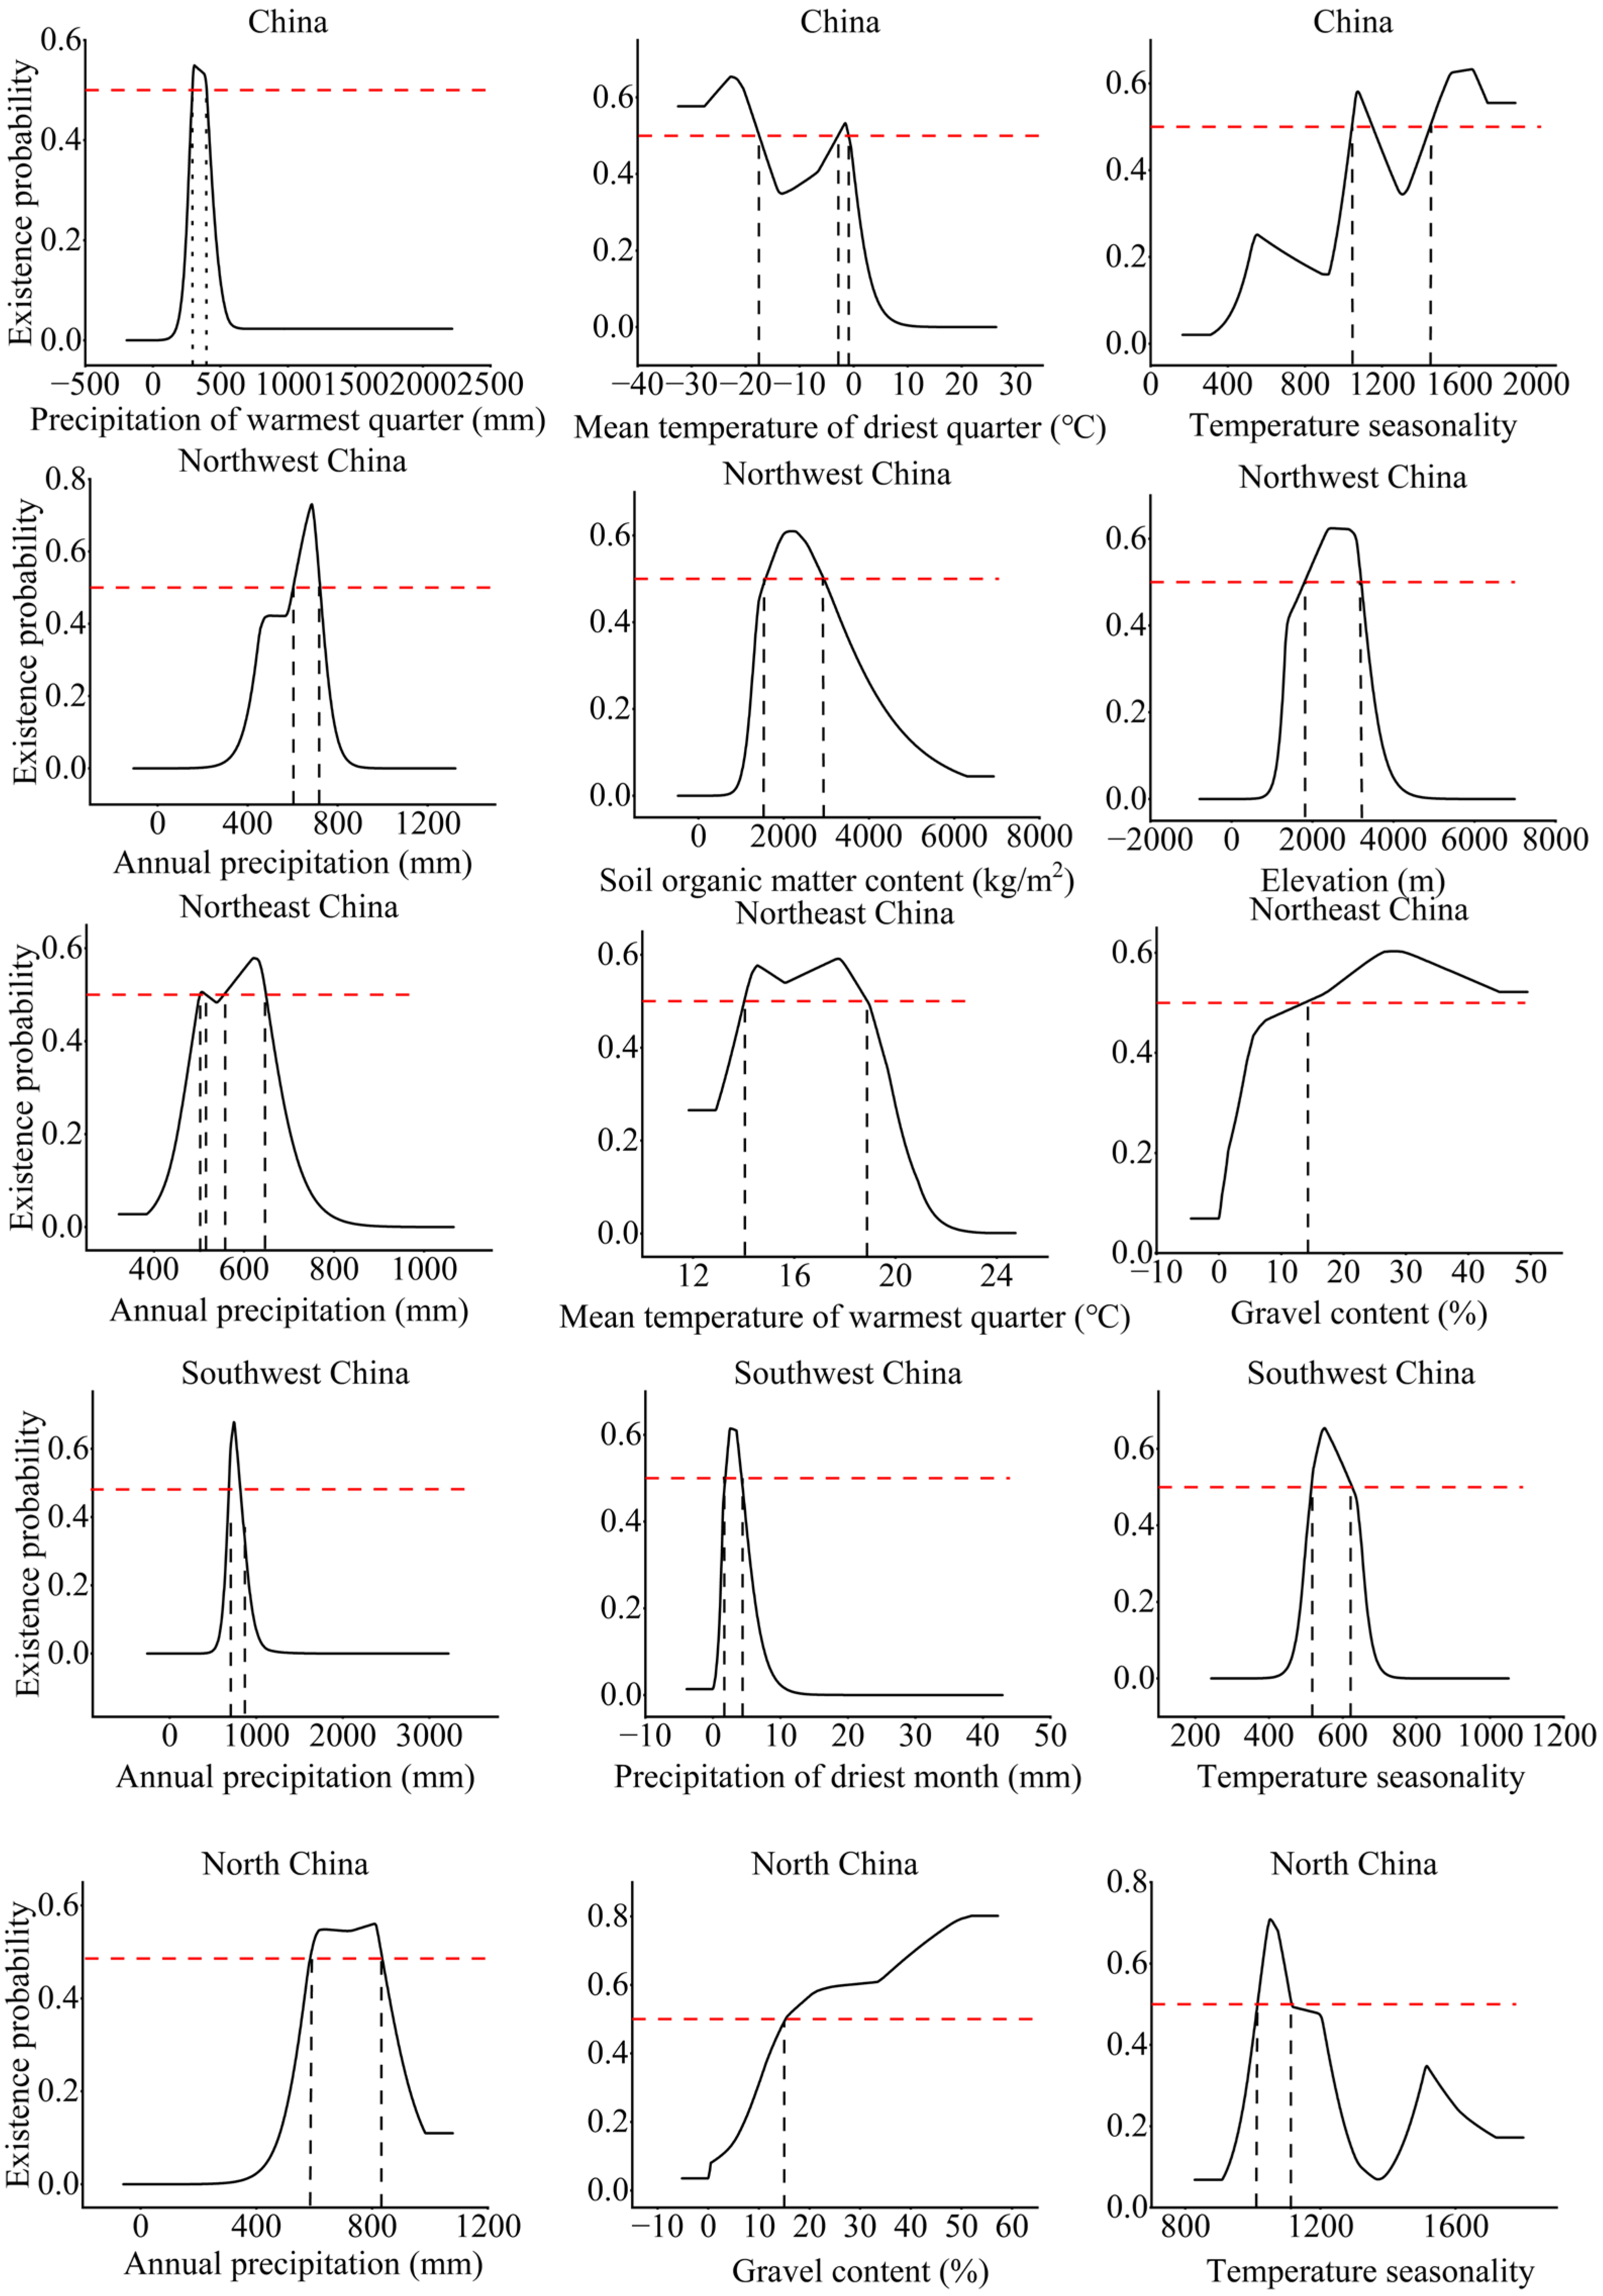
3.1. Suitable Distribution and Driving Factors

The suitable areas of B. platyphylla forest are predominantly distributed in the Northwest, Northeast, Southwest, and North China ecoregions, accounting for 18.54%, 29.31%, 15.11%, and 32.69% of the total suitable areas. The highly and moderately suitable areas account for 32.87% and 25.92% of the total suitable areas and are mainly distributed in the Northeast and North China ecoregions. The marginally suitable areas account for 41.21% of the total suitable areas and are mainly distributed in the Northwest and Southwest ecoregions (Figure 3a).
In Northwest China, B. platyphylla forest is mainly distributed in Gansu Province and Shaanxi Province, located near the Huanglong Mountain, Liupan Mountains, and Qinling Mountains, and the suitable areas account for 6.24% of the ecoregion (Figure 3b). In Northeast China, B. platyphylla forest is mainly distributed in Heilongjiang Province, located near the Yilehuli Mountain, Lesser Khingan Range, Zhangguangcai Range, and Laoye Mountain, and the suitable areas account for 48.10% of the ecoregion (Figure 3c). In Southwest China, B. platyphylla forest is mainly distributed in Sichuan Province, located near the Daxue Mountains and Qionglai Mountains, and the suitable areas account for 7.19% of the ecoregion (Figure 3d). In North China, B. platyphylla forest is mainly distributed in Hebei Province and the Inner Mongolia Autonomous Region, located near the Qilaotu Mountain, Damaqun Mountains, and Taihang Mountains, and the suitable areas account for 32.73% of the ecoregion (Figure 3e).
Distribution of B. platyphylla forest in China was significantly affected by climate variables, followed by soil and terrain variables. Their percentage contribution was 80.5%, 9.3% and 9.9%; permutation importance was 61.7%, 15%, and 23%. Meanwhile, the HFP variable (0.1%, 0.3%) was less significant. Precipitation in the warmest quarter (Bio18, 44.5% and 33.6%), mean temperature of the driest quarter (Bio9, 18.20% and 6.2%), and temperature seasonality (Bio4, 8.8% and 1.2%) were the main drivers (Figure 4a). In China, the precipitation of warmest quarter suitable for the growth of B. platyphylla forest ranged from 292.94 mm to 396.55 mm, the mean temperature of the driest quarter was below −17.49 °C or ranged from −2.88 °C to −0.94 °C, and the temperature seasonality ranged from 1045.40 to 1150.64 or was above 1449.11 (Figure 5).
The suitable distribution of B. platyphylla forest in Northwest China (Figure 4b) was primarily influenced by annual precipitation (Bio12, 46.2% and 25.4%), soil organic matter density (SOCD, 19.2% and 49.8%), and elevation (Elev, 11.3% and 4.4%). Mean temperature of the warmest quarter (Bio10, 31.9% and 1.5%), gravel content (CF, 14.8% and 2.4%), and annual precipitation (Bio12, 9.6% and 17%) were the main environmental factors impacting the suitable distribution of B. platyphylla in Northeast China (Figure 4c). B. platyphylla forest in Southwest China (Figure 4d) was greatly influenced by annual precipitation (Bio12, 28.3% and 34%), precipitation in the driest month (Bio14, 23.7% and 1.1%), and temperature seasonality (Bio4, 14.8% and 13.5%). Distribution of B. platyphylla forest in North China (Figure 4e) indicated a marked relationship with annual precipitation (Bio12, 45% and 36%), gravel content (CF, 22.1% and 1.6%), and temperature seasonality (Bio4, 6.9% and 0.6%).
In Northwest China, the annual precipitation suitable for the growth of B. platyphylla forest ranged from 603.71 mm to 721.00 mm, the soil organic matter density ranged from 1578.55 kg/m2 to 2941.10 kg/m2, and the elevation ranged from 1802.41 m to 3202.09 m. In the Northeast China, the annual precipitation suitable for the growth of B. platyphylla forest was in the ranges 502.79 mm to 515.44 mm and 555.62 mm to 648.62 mm. The gravel content was higher than 13.75%, and the mean temperature in the warmest quarter ranged from 14.02 °C to 18.88 °C. In Southwest China, the annual precipitation suitable for the growth of B. platyphylla forest ranged from 688.72 mm to 807.17 mm, the precipitation in the driest month ranged from 1.86 mm to 4.24 mm, and the temperature seasonality ranged from 515.29 to 625.13. In North China, the annual precipitation suitable for the growth of B. platyphylla forest ranged from 591.49 mm to 830.64 mm. The gravel content was higher than 15.33%, and the temperature seasonality ranged from 1014.65 to 1114.97 (Figure 5).

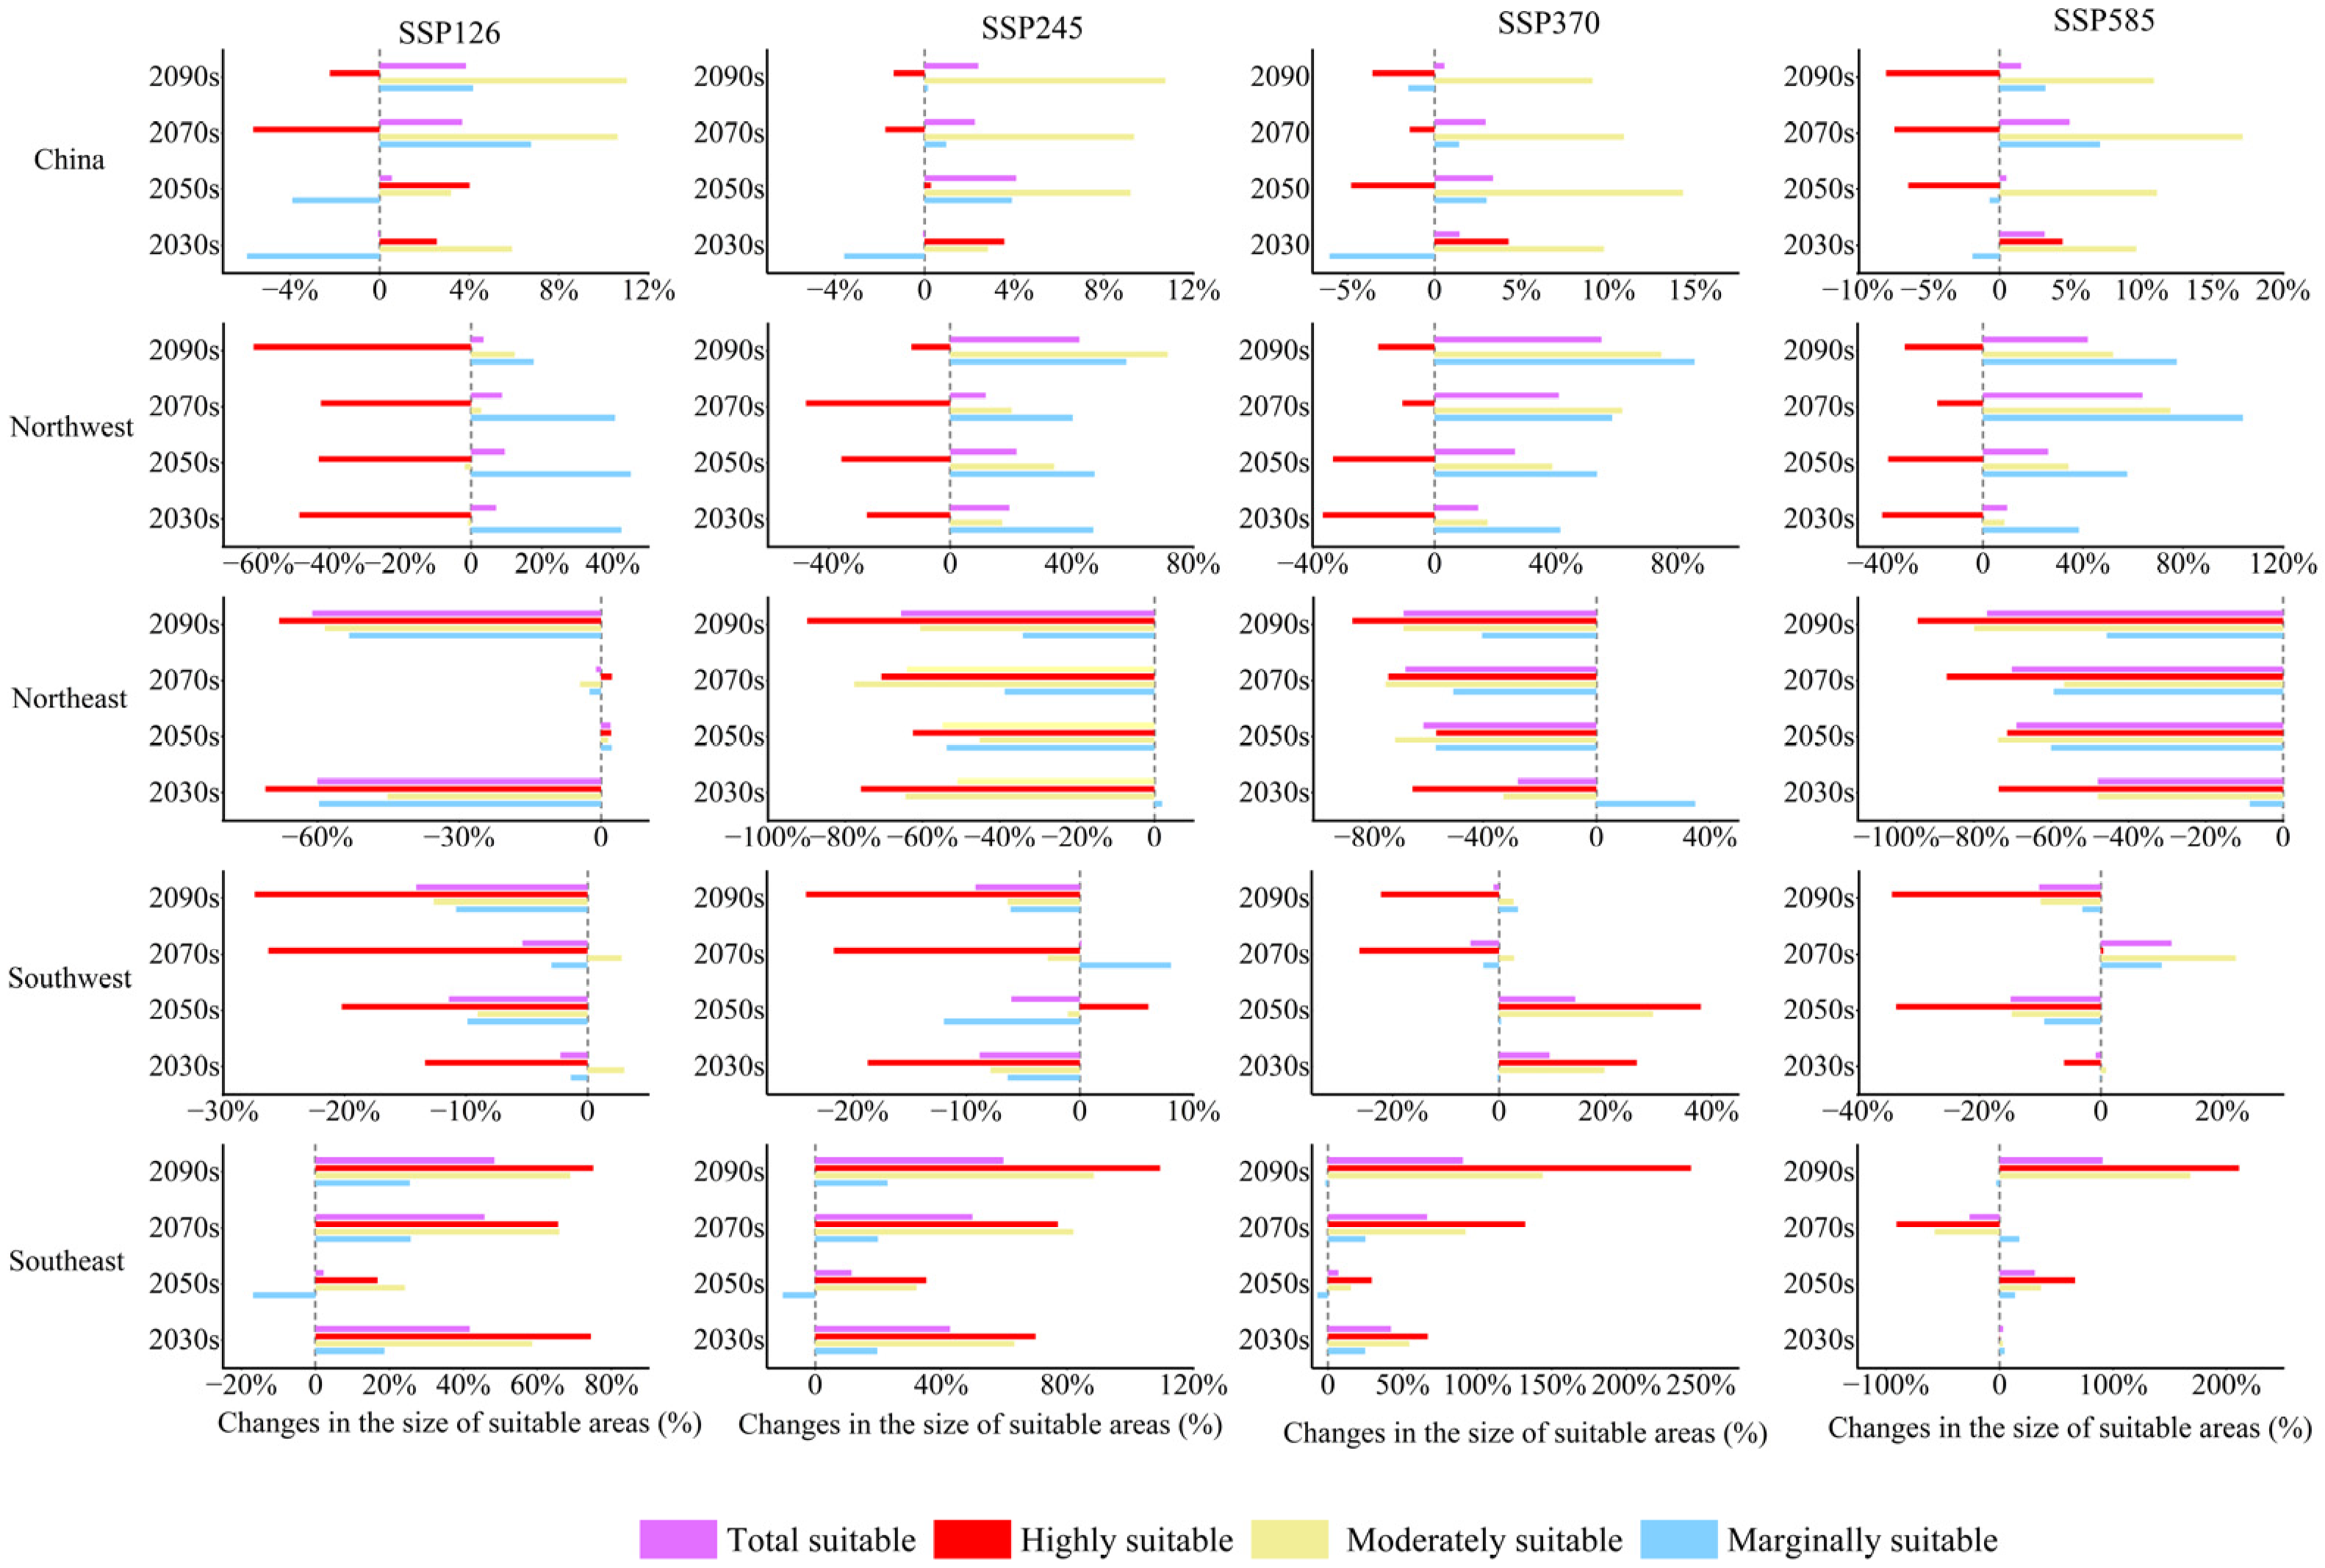
3.2. The Contraction and Expansion of the Suitable Areas

Compared with the existing suitable areas, the total and moderately suitable areas of B. platyphylla forest distributed in China showed an expanding trend (except 2030s-SSP126 and 2030s-SSP126). The highly suitable areas first expanded and then contracted, while the marginally suitable areas first contracted and then expanded (Figure 6). Under the SSP126, SSP245, and SSP370 scenarios, the suitable areas showed a trajectory of first migrating to lower latitudes and then to higher latitudes (Figure 7). Under the SSP585 scenario, the distribution was basically horizontal. The distribution migrated to higher elevations under 16 scenarios (Figures S1 and S2 and Tables S3 and S4).
Regarding the distribution in the Northwest China, the total, marginally and moderately suitable areas of B. platyphylla forest expanded under 16 scenarios (Table S3). The highly suitable areas contracted under all 16 scenarios, migrating towards higher latitudes and elevations (Figure S3 and Table S4). In Northeast China, the suitable areas of B. platyphylla forest showed a shrinking trend under SSP126, SSP245, SSP370, and SSP585 scenarios (Table S3). Under 16 scenarios, B. platyphylla forest generally migrated to higher latitudes (Figure S4). Under the SSP126 scenario, it generally migrated to lower elevations, and in the SSP245, SSP370, and SSP585 scenarios, it basically migrated to higher elevations (Table S4). In the Southwest China, under the SSP126 and SSP245 scenarios, the total, highly, moderately, and marginally suitable areas of B. platyphylla forest contracted (Table S3). Under the SSP370 scenario, the total and highly suitable areas expanded in the 2030s and 2050s, and contracted in the 2070s and 2090s. The moderately suitable areas expanded in all four decades. The marginally suitable areas did not change obviously. Under the SSP585 scenario, the total, moderately and highly suitable areas contracted in 2030s, 2050s, and 2090s (the moderately suitable areas showed an expanding trend under 2030s-SSP585), and expanded in 2070s. The marginally suitable areas contracted in 2050s and 2090s, respectively, and expanded in the 2070s. A trend of horizontal migration and migration towards higher elevations areas was evident under all 16 scenarios (Figure S5 and Table S4). Regarding distribution in the North China, under the SSP126, SSP245, and SSP370 scenarios, the total, highly, and moderately suitable areas all expanded (Table S3). The marginally suitable areas contracted in the 2050s and expanded in the 2030s, 2070s, and 2090s. Under the SSP585 scenario, the total, highly, moderately, and marginally suitable areas expanded in the 2050s and 2090s (Figures S1 and S2 and Table S3), migrating to lower latitudes (Figure S6) and higher elevations (2070s-SSP370, 2090s-SSP370 and 2090s-SSP585 to higher latitudes).

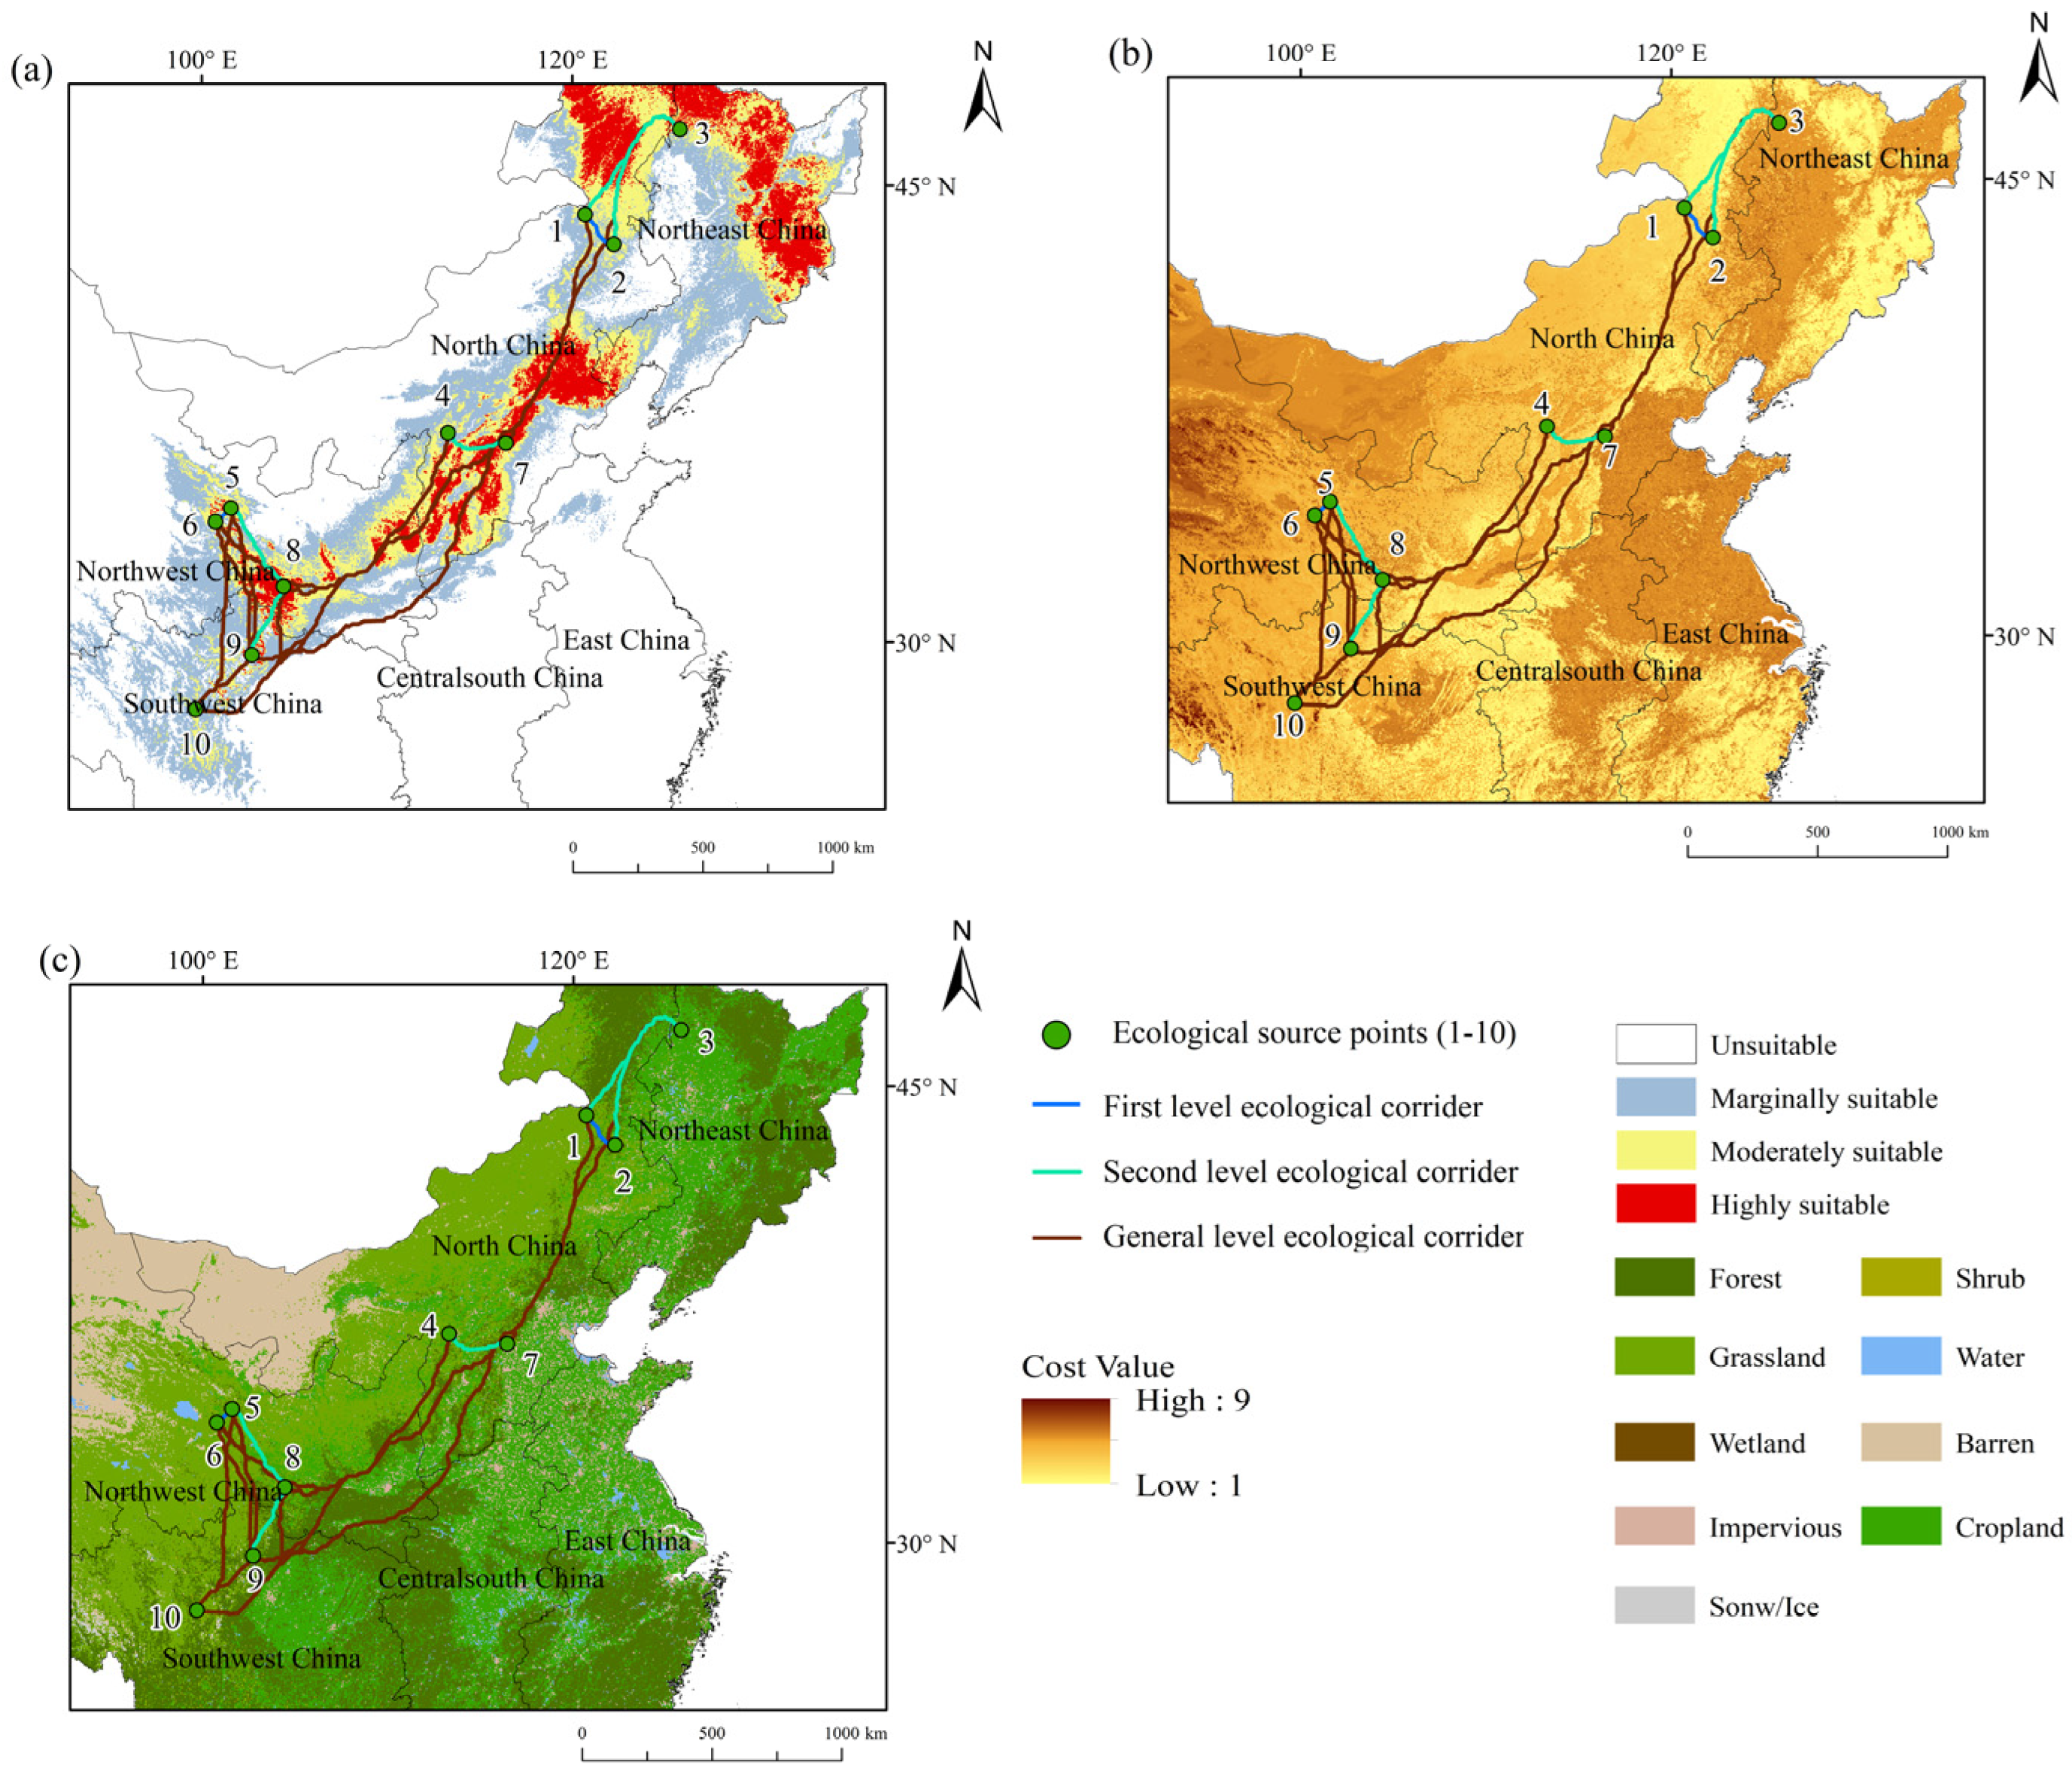
3.3. Construction of Ecological Corridors

In this study, 45 ecological corridors were considered, including two first level ecological corridors, five second-level ecological corridors, and 38 general ecological corridors. The longest corridor was 3281.00 km in length (Table S5), which belonged to the group of general ecological corridors and connected the four ecoregions of Northeast, North, Northwest, and Southwest China. The first-level ecological corridors were distributed in North and Northwest China, totaling 244.91 km in length. The second-level ecological corridors were all distributed in the ecoregions of Northeast, North, Northwest, and Southwest China, totaling 2166.38 km. The longest one was 652.52 km in length, connecting the Northeast and North China ecoregions (Figure 8).
According to the distribution of suitable areas, the ecological source points, first-level corridors, and second-level corridors were all located within the stable moderately and highly suitable areas for B. platyphylla forest. Ten general corridors passed through unsuitable areas (Figure 8a). Regarding the comprehensive resistance value, the resistance value of ecological source point 2 was the lowest, reaching 1.34, and the resistance value of ecological source point 3 was the highest, as high as 4.79. The resistance values of the 10 ecological source points were all lower than 5, indicating that the hindrance to the spread of B. platyphylla forest was small (Figure 8b). In terms of land use types, ecological source point 1 and ecological source point 3 were located in agricultural land. The land use types where ecological source point 2 and ecological source point 10 were located in forests. The land use type where ecological source points 4–9 were located was grassland (Figure 8c).

4. Discussion

Maxent is a species distribution modeling (SDM) method trained using species presence points and pseudo-absence points. It demonstrates strong adaptability and predictive performance, being particularly widely applied in situations lacking systematic survey data [56,57]. However, the method also has some sources of error. For example, sampling bias poses a challenge. In the current study, B. platyphylla occurrence points were primarily derived from existing databases. These data often concentrate on research-intensive regions, potentially leading to uneven spatial distribution of samples. Furthermore, the pseudo-absence points may have included locations where the species was actually present but remained undetected or unrecorded. These errors could have impacted the learning process of the Maxent model. Despite these challenges, Maxent still exhibited robust performance in integrating imperfect data and revealing the key environmental drivers of species-environment relationships. In this study, the average test AUC value for B. platyphylla across China was 0.80, while the average test AUC values for B. platyphylla in the four ecoregions (Northwest, Northeast, Southwest, and North China) were 0.97, 0.80, 0.98, and 0.88, indicating that our predictions possessed a relatively high degree of reliability and that the model exhibited favorable simulation performance [48,58]. Additionally, the test AUC values for B. platyphylla at the ecoregional scale were higher than those at the national scale, suggesting that the analysis at the ecoregional scale was more accurate.
The distribution pattern of vegetation is principally governed by climate [59,60]. The research on the distribution data of B. platyphylla species has showed that annual precipitation exerts the strongest impact on the distribution of B. platyphylla in China [25]. Our research results are slightly different. In this paper, the precipitation in the warmest season (Bio18) exerts the strongest impact on the distribution of B. platyphylla forest in China. The warmest quarter typically represents the crucial growth phase for B. platyphylla forest. In this specific period, the high summer temperatures enhance leaf transpiration, accelerating water loss. If concurrent rainfall is insufficient, the effective soil moisture declines, and root water uptake fails to meet transpiration demands, leaving plants subject to water stress [61,62]. In addition, the high summer temperatures cause stomatal closure, which severely restricts carbon dioxide supply and directly inhibits the key reactions of photosynthesis [18,63]. The precipitation in the warmest season influences the distribution pattern by affecting these physiological processes of B. platyphylla.
Temperature and precipitation influenced the distribution of mountain vegetation [64], among which the impact of precipitation is relatively prominent [65]. Li et al. [66] analyzed forest dynamics across varying precipitation zones and found that precipitation had an impact on the survival rates of forests in North China, which is similar to our findings. In this paper, the annual precipitation represents the primary determinant of the distribution of B. platyphylla forest in the Northwest, Southwest and North China ecoregions. Among these three ecoregions, Northwest China is most affected by the annual precipitation. This is related to the fact that the Northwest China has low precipitation, strong water evaporation, and an arid climate [67,68]. The average summer temperature in Northeast China exceeds the maximum temperature suitable for the growth of B. platyphylla forest [69], which exerts a significant influence on the distribution of B. platyphylla forest. Yuan et al. [70] revealed the important role of temperature in the growth of Northeast Chinese temperate forests using Pearson correlation analysis and moving window analysis. Similarlu, our results indicate that the mean temperature in the warmest season has a relatively large impact on the distribution of B. platyphylla forest in Northeast China. The impact of soil on vegetation distribution should not be overlooked either. Studies have shown that gravel can increase the porosity of the soil [71], providing more and larger channels for water, enabling water to infiltrate into the soil more quickly. This viewpoint supports our conclusion, indicating that gravel content is critical for the distribution of B. platyphylla forest in the ecoregions of North China and Northeast China.
Affected by global warmings, the distribution pattern of B. platyphylla forest is undergoing changes. Using Maxent, Geng et al. [25] analyzed the distribution of suitable areas for B. platyphylla species in China. The research shows that against a background of global warming, the total suitable and highly suitable areas for B. platyphylla species in China present an expanding trend. Our results also indicate that the total area suitable for B. platyphylla forest in China is showing an expanding trend, but the highly suitable area shows a shrinking trend in the 2070s. The reasons for these different results may be the different future climate scenarios selected. That study used CMIP5, while this paper uses CMIP6. Compared with CMIP5, CMIP6 shows closer correspondence to future climate and achieves higher predictive precision [72]. In our study, precious species such as Korean pine (Pinus koraiensis), Amur linden (Tilia amurensis), and Prince Rupprecht’s larch (Larix principis-rupprechtii) persist in the vicinity of B. platyphylla forest. However, as climate change expands the suitable habitat range for B. platyphylla forest, these valuable species may face increased threats. Therefore, forest resource management and ecological corridor planning must give prominence to monitoring the changing dynamics of B. platyphylla forest.
Under the background of global warming, the changes in suitable areas for B. platyphylla forest vary across different ecoregions. Liu et al. [19] analyzed the changes in the suitable areas of B. platyphylla species in Inner Mongolia region through Maxent. The results show that under the SSP245 scenario, the suitable areas present a shrinking trend, which is different from our results. Our analysis reveals that the suitable areas of B. platyphylla forest in the ecoregions of Northwest and North China are showing an expanding trend. The reason for the inconsistent results may be the difference in sampling points. The sampling points in this paper were in the B. platyphylla forest, while the distribution points selected by Liu were those of individual B. platyphylla tree species. Affected by global warming, the suitable areas for many species show a shrinking trend [73,74,75]. Zhang et al. [76] discovered that almost all woody plant species in Yunnan Province demonstrate a tendency to contract. Lin et al. [77] found that the suitable areas of Aralia elata in Northeast China will shrink in the future. Our analysis reveals that the suitable areas of B. platyphylla forest in the ecoregions of Southwest and Northeast China are showing a shrinking trend, which is consistent with the previous research findings. However, under the low-carbon emission climate scenario, the distribution of areas highly suitable for B. platyphylla forest in the ecoregions of Northeast China shows a slight expansion trend. However, it shows a shrinking trend under the high-carbon emission scenario. This is attributable to the fact that low-carbon emissions exert a less pronounced impact on the climate. In contrast, high-carbon emissions will precipitate a more erratic climate and culminate in extreme meteorological conditions, ultimately impinging on the stability of habitats [78,79]. In Northeast China, the total suitable area for B. platyphylla forest decreases under the 2070s-SSP126 climate scenario, which is consistent with Liu’s research [80]. However, the highly suitable areas increase. This may be because under the low-emission scenario SSP126, areas that were originally less suitable due to cold temperatures have now become suitable as a result of climate warming. This temperature increase elevates their suitability status, allowing them to transition into the highly suitable areas, thereby resulting in an overall expansion of the highly suitable areas.
With global warming, vegetation has migrated towards high-altitude and -latitude regions [81,82,83]. Khan et al. [84] used a machine learning algorithm to predict the impact of climate change on the future spread of Quercus leucotrichophora. The results show that it will migrate towards high latitude and altitude. This is similar to our findings; the distribution of B. platyphylla forest in China and in the ecoregions of Northwest and Northeast China shows a general trend of migrating towards high-latitude and -altitude regions. However, North China may be subject to relatively intense human interference, resulting in a trend of B. platyphylla forest migrating towards low latitudes. The research has found that Betula albosinensis, which belongs to the same family and genus as B. platyphylla, will migrate horizontally in the future [44]. This is consistent with our findings for the migration direction of B. platyphylla forest in Southwest China.
In the face of habitat fragmentation, the construction of corridors is critical. In the actual construction of ecological corridors, ecological source areas with larger area and greater patch importance should be considered [52]. In this article, Ecological source 3 has the largest areas, reaching 4.56 × 10⁵ km2; there are two second-level corridors and the longest ecological corridor passes through Ecological source 3. Therefore, it is recommended to focus on constructing Ecological source 3 during the construction process. The existing land use situation should also be taken into full consideration during the ecological corridor construction to minimize the occupation of extensive construction and cropland areas within the corridors. It is recommended to mainly use forest land, supplemented by grassland, to form a vegetation system consisting of forests, shrubs, and grasslands. This kind of corridor exhibits strong connectivity, which is conducive to species communication among B. platyphylla forest. Moreover, it has greater stability in the face of external environmental changes. Furthermore, given the limited budget, we suggest concentrating resources on the first level corridors to ensure their absolute functionality. For second-level and general corridors, interventions with low cost and high cost-effectiveness should be adopted. Funds should be precisely allocated to maintain the basic functions of the ecological network at the minimum cost.

5. Conclusions

B. platyphylla forest is an important primary forest and secondary forest that assumes a pivotal role in maintaining ecosystem stability. We used the Maxent model to analyze the suitable distribution and driving variables of B. platyphylla forest in China and different ecoregions. The MCR model was applied to construct the minimum resistance corridors between ecological source areas. The gravity model was adopted to classify these corridors. The following conclusions can be drawn:
(1)
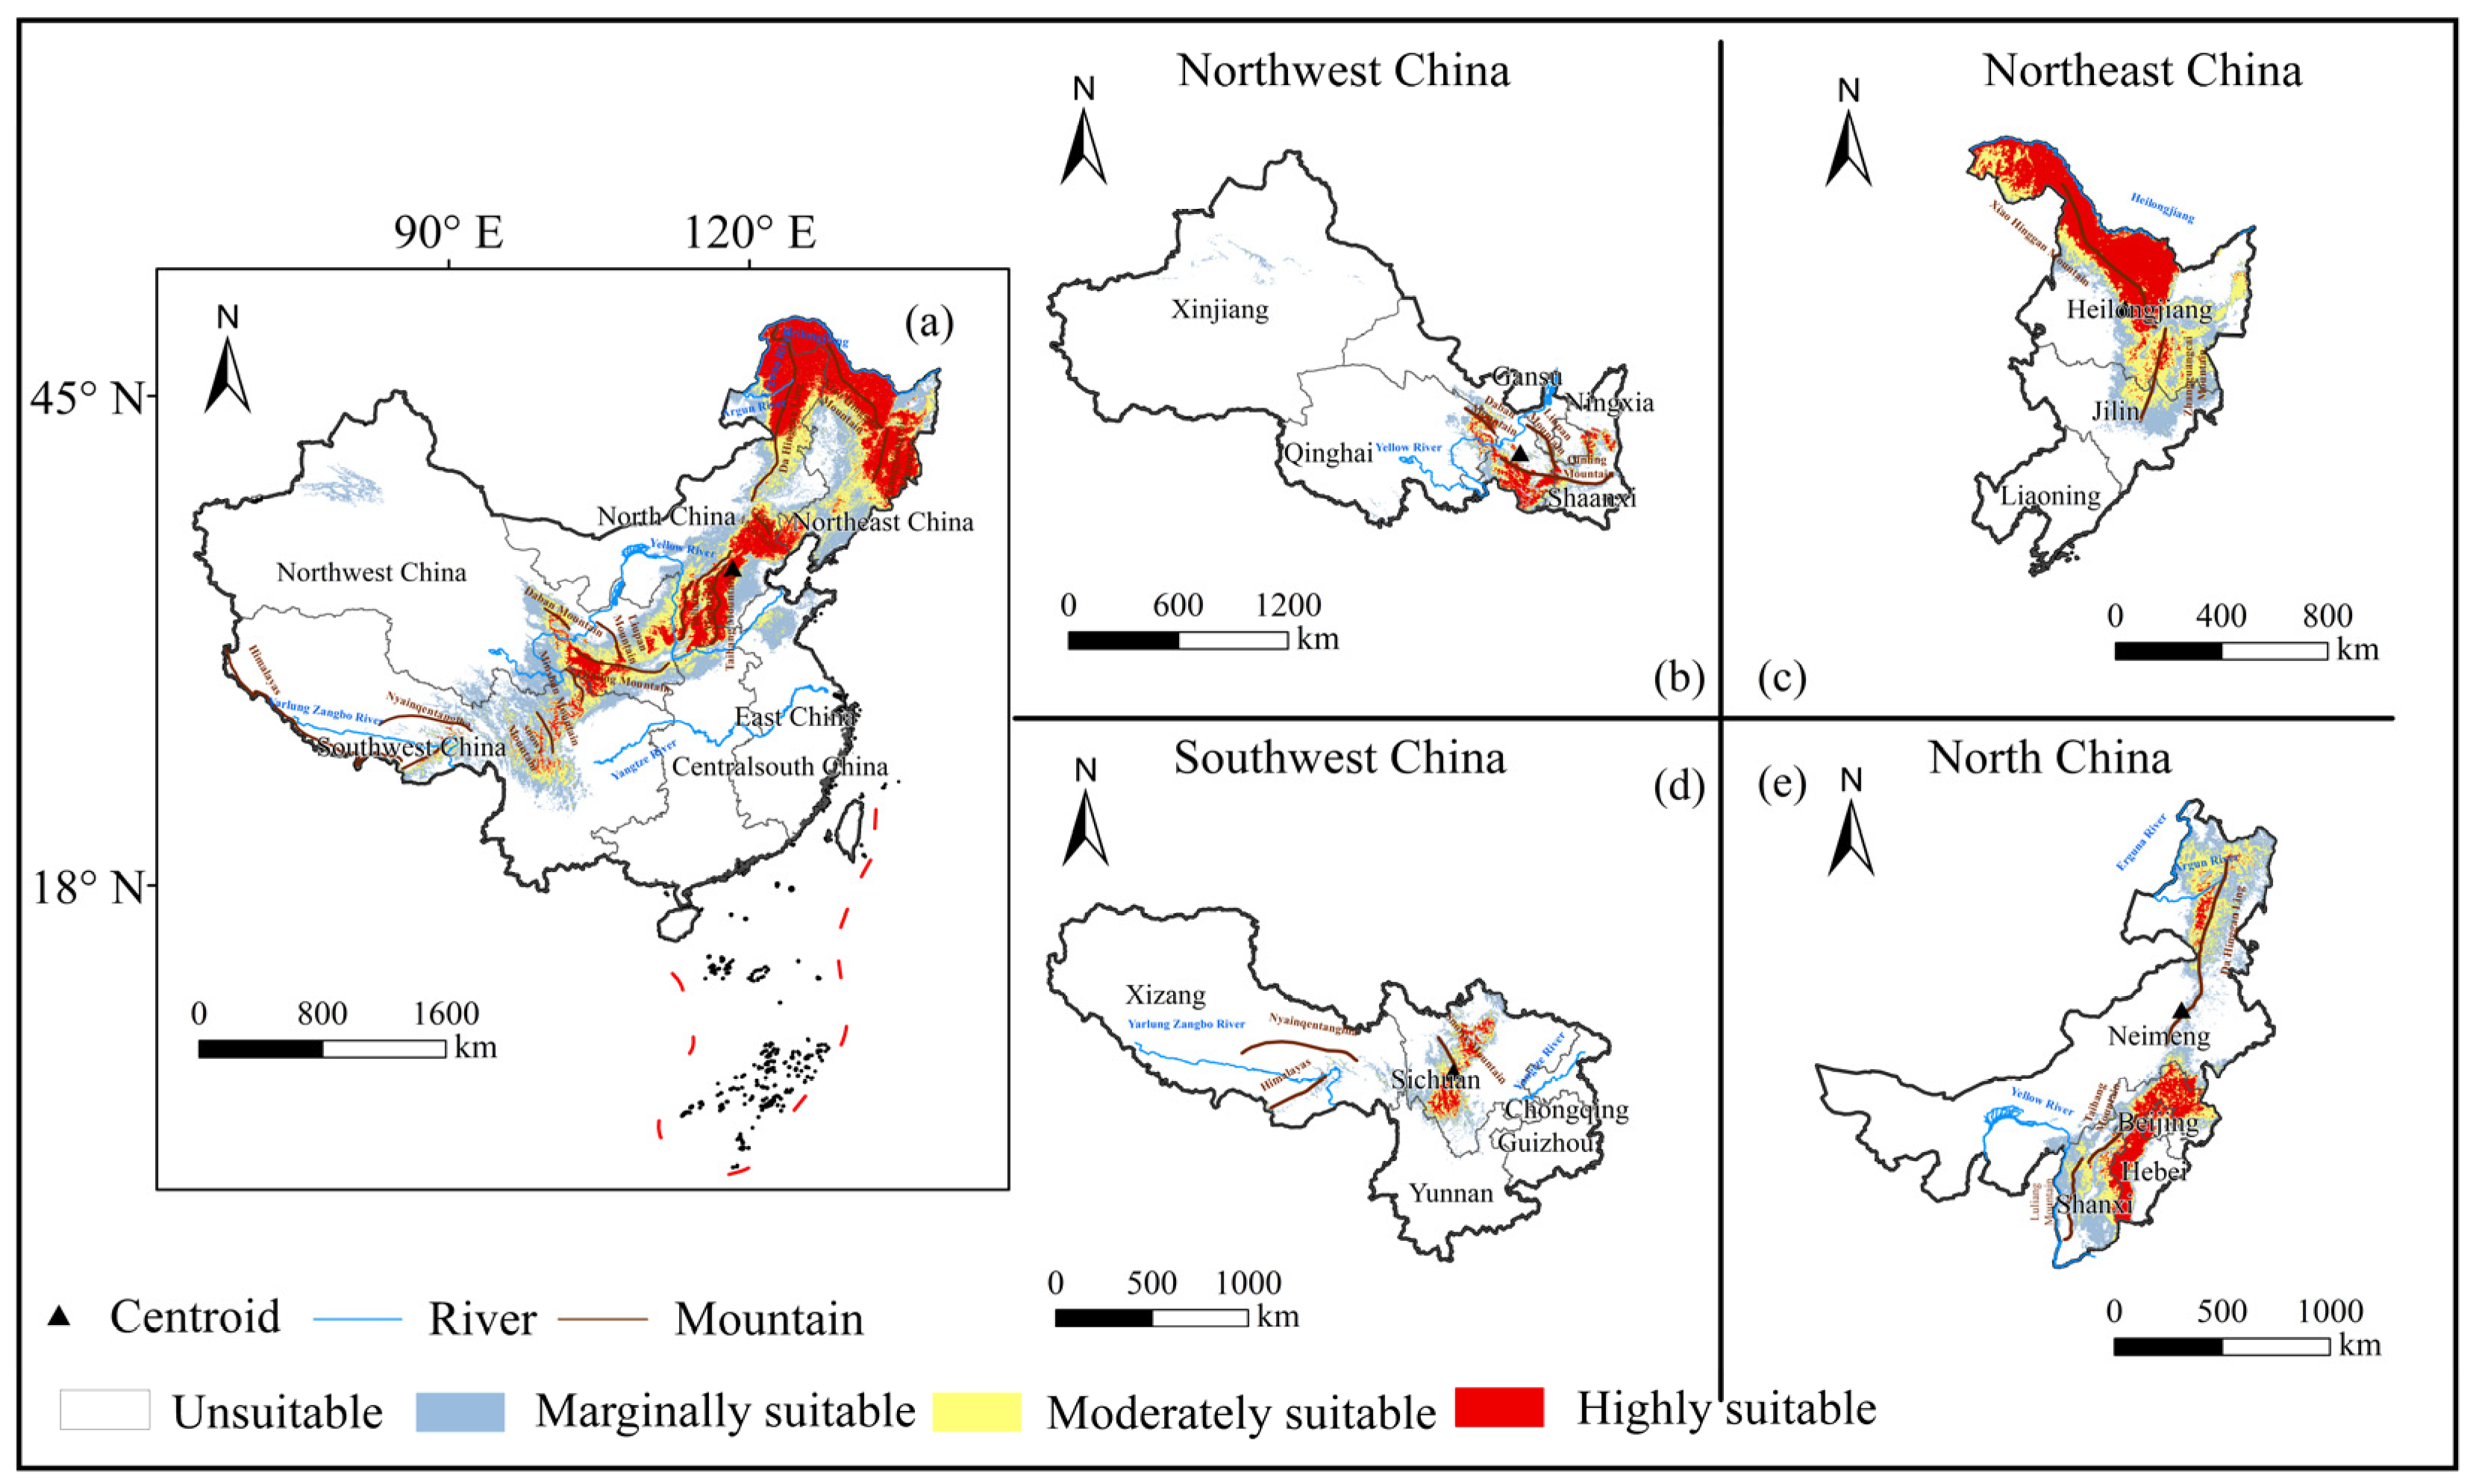
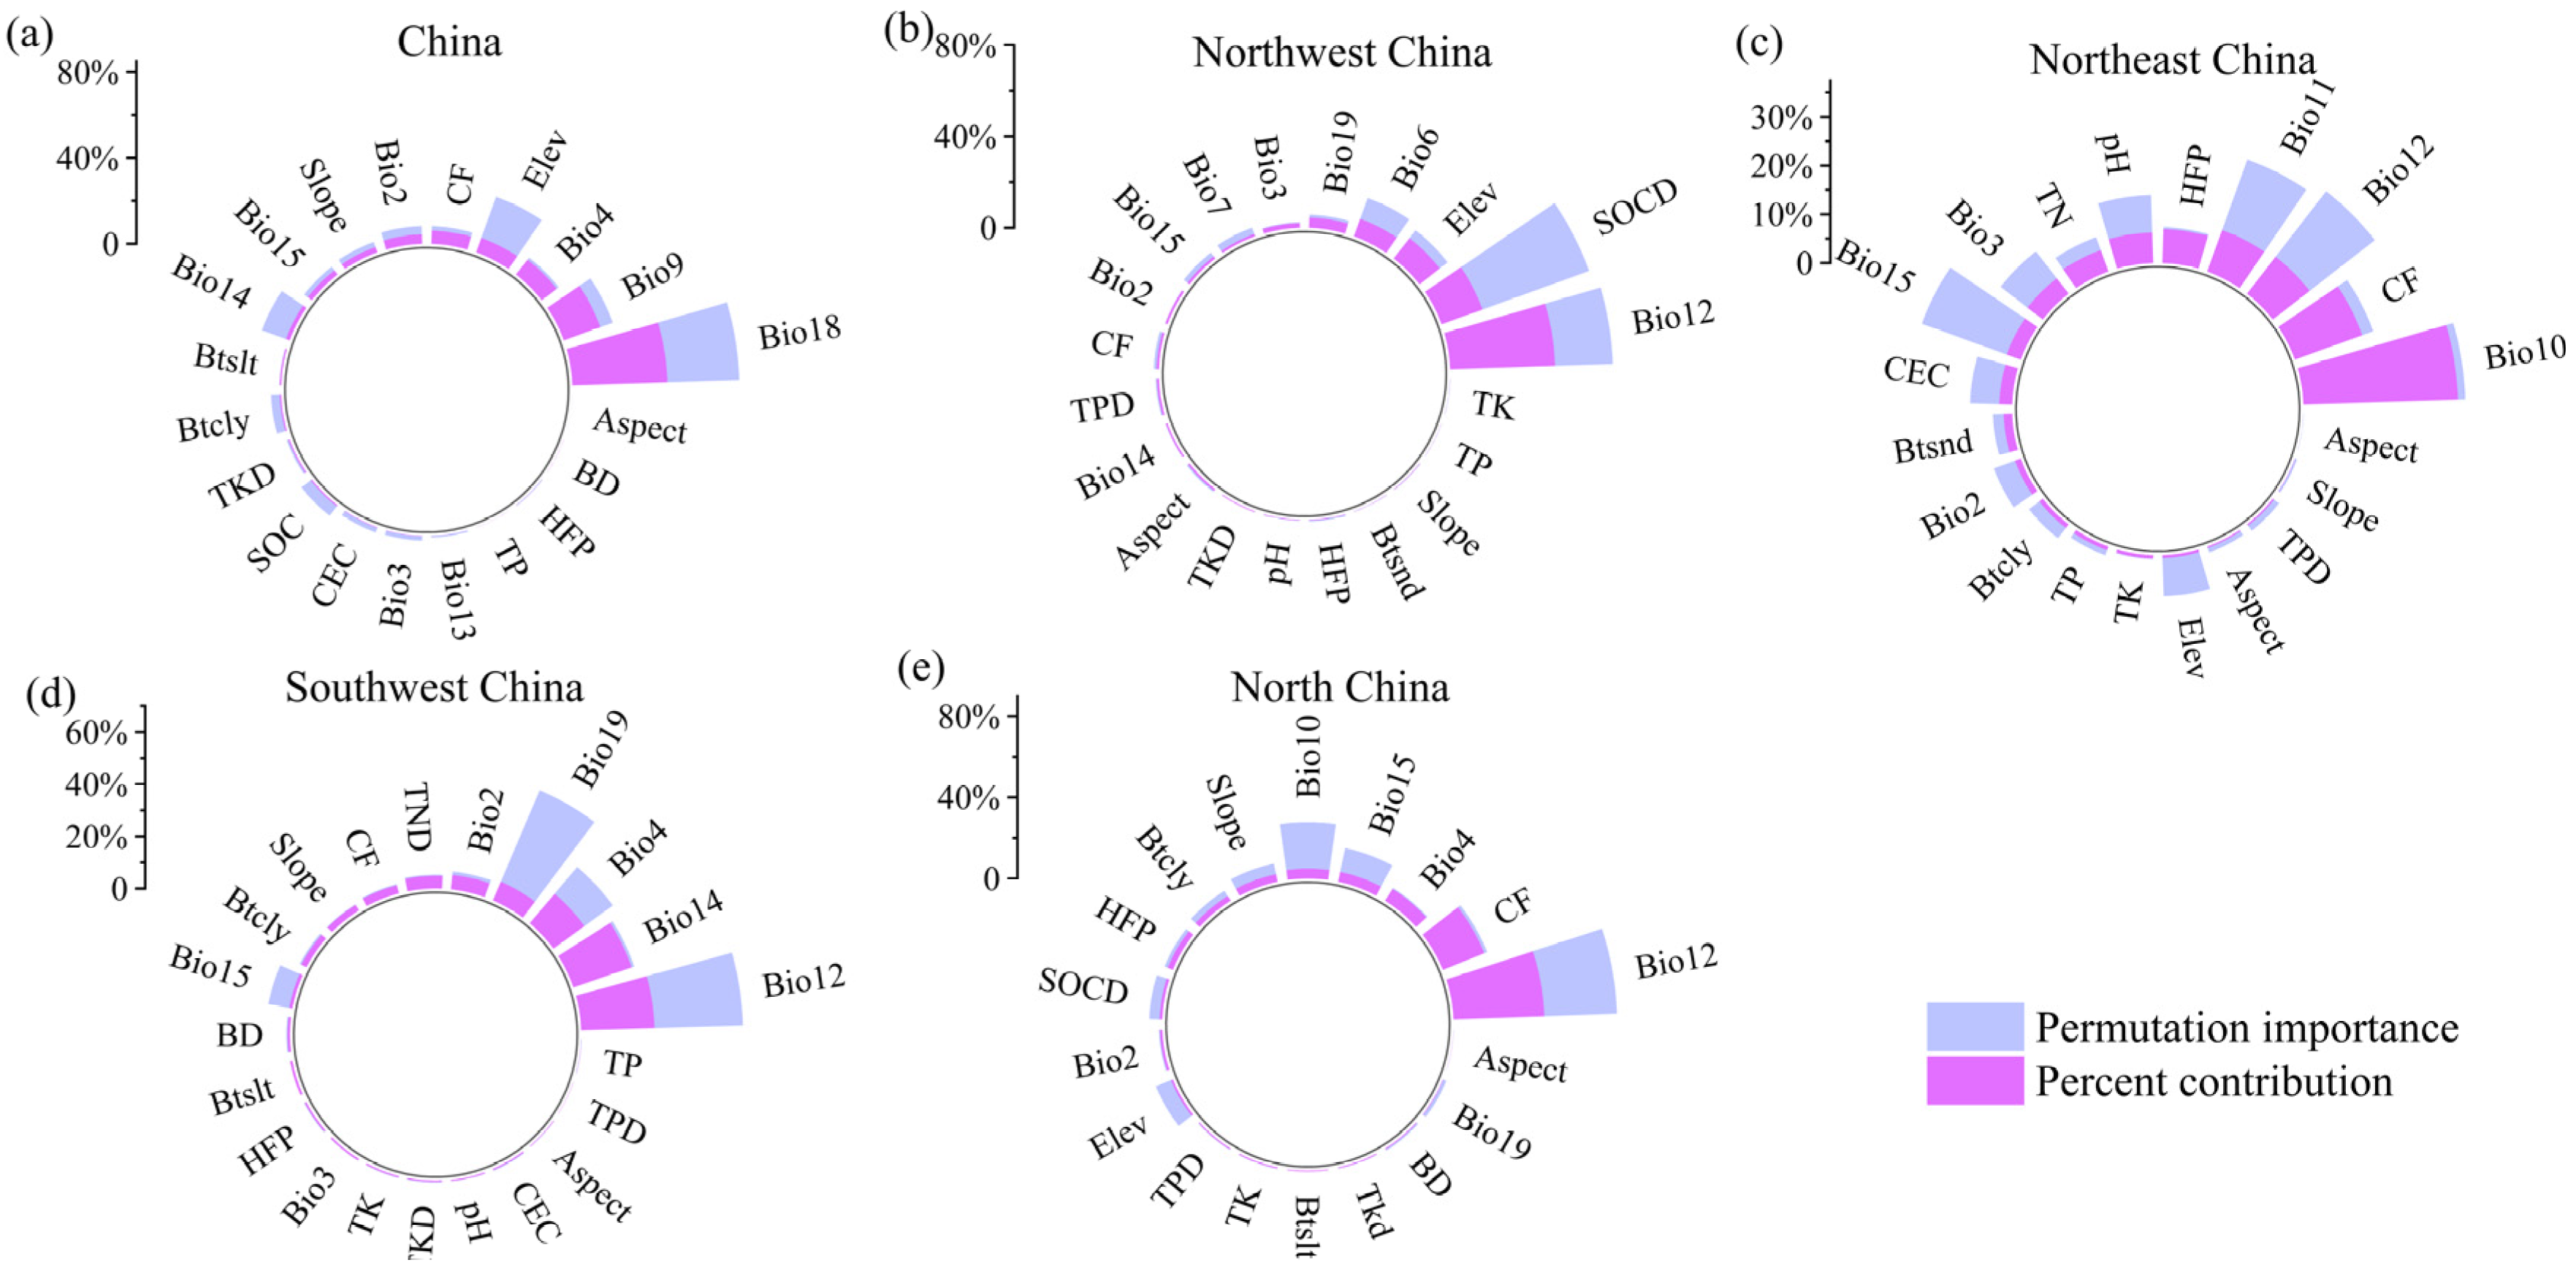
The highly suitable areas for B. platyphylla forest distributed in China are mainly concentrated in the Northeast and North China ecoregions, and precipitation in warmest quarter was the main environmental factor. In Northwest China, the highly suitable areas for B. platyphylla forest are in Gansu and Shaanxi Provinces; in Southwest China, in Sichuan Province; in North China, in Hebei Province and Inner Mongolia Autonomous Region. Annual precipitation is the main environmental factor in these three ecoregions. In Northeast Chin, the highly suitable areas for B. platyphylla forest are in Heilongjiang Province, and the mean temperature of the warmest quarter is the main factor affecting its distribution.
(2)
The total suitable areas of B. platyphylla forest showed an expanding trend in China, as well as in the ecoregions of North China and Northwest China, and a declining trend in the ecoregions of Northeast China and Southwest China. Therefore, ecological buffer zones should be designated to prevent excessive expansion of B. platyphylla forest from encroaching on the habitats of other rare tree species in the North China and Northwest China. In Northeast and Southwest China, logging and human activities should be strictly restricted to enhance the forest’s adaptability.
(3)
In total, 45 ecological corridors were identified, including 2 first-level corridors, 5 second-level corridors, and 38 general corridors. During ecological corridor construction, the existing patterns of land use must be carefully considered. It is advisable to primarily utilize forest land, with grassland as a supplement, and ensure that the ratio of construction to cultivated land within the corridors remains minimal.
This study helps us to understand the habitat of B. platyphylla forest in different ecoregions of China and provides valuable scientific guidance for maintaining the ecosystem stability of B. platyphylla forest.

6. Future Work

Our research still requires further work, such as field validation and the incorporation of land use change predictions, to further verify and optimize the corridors.

Supplementary Materials

The following supporting information can be downloaded at: https://www.mdpi.com/article/10.3390/su17156937/s1, Figure S1: Potential suitable areas of B. platyphylla forest under SSP126 and SSP245 climate conditions; Figure S2: Potential suitable areas of B. platyphylla forest under SSP370 and SSP585 climate conditions; Figure S3. The centroid change of B. platyphylla forest in Northwest China.; Figure S4. The centroid change of B. platyphylla forest in Northeast China.; Figure S5. The centroid change of B. platyphylla forest in Southwest China.; Figure S6. The centroid change of B. platyphylla forest in North China.; Table S1. Environmental factors involved in modeling; Table S2: The interaction force matrix of ecological source in gravity model; Table S3. Area and percentage of each scenario.; Table S4: The mean elevation of the highly adaptive areas; Table S5: Length of ecological corridor.

Author Contributions

Conceptualization, B.X.; methodology, B.X.; software, B.X.; validation, B.X. and H.Z.; formal analysis, B.X. and H.Z.; investigation, B.X. and H.Z.; resources, H.Z.; data curation, B.X.; writing—original draft preparation, B.X.; writing—review and editing, B.X., H.Z., X.J., B.Z., Y.W., Y.P. and Z.L.; visualization, B.X. and H.Z.; supervision, H.Z.; project administration, H.Z.; funding acquisition, H.Z. All authors have read and agreed to the published version of the manuscript.

Funding

This research was funded by the Discipline Construction Program of Huayong Zhang, Distinguished Professor of Shandong University, School of Life Sciences (61200082363001).

Institutional Review Board Statement

Not applicable.

Informed Consent Statement

Not applicable.

Data Availability Statement

All links to input data are reported in the manuscript and all output data are available upon request to the authors.

Conflicts of Interest

The authors declare no conflicts of interest.

References

  1. Wu, Y.Y.; Zheng, J.; Gao, J.; He, X.R.; Liu, X.L.; Chen, Y.Y.; Liu, J.C.; Li, C.X. Functional Diversity Explains Ecosystem Carbon Storage in Subtropical Forests. Glob. Change Biol. 2025, 31, e70120. [Google Scholar] [CrossRef]
  2. Deng, J.J.; Zhou, W.M.; Dai, L.M.; Yuan, Q.; Zhou, L.; Qi, L.; Yu, D.P. The Effects of Shrub Removal on Soil Microbial Communities in Primary Forest, Secondary Forest and Plantation Forest on Changbai Mountain. Microb. Ecol. 2023, 85, 642–658. [Google Scholar] [CrossRef]
  3. Taubert, F.; Fischer, R.; Groeneveld, J.; Lehmann, S.; Müller, M.S.; Rödig, E.; Wiegand, T.; Huth, A. Global patterns of tropical forest fragmentation. Nature 2018, 554, 519–522. [Google Scholar] [CrossRef]
  4. Ma, J.; Li, J.W.; Wu, W.B.; Liu, J.J. Global forest fragmentation change from 2000 to 2020. Nat. Commun. 2023, 14, 3752. [Google Scholar] [CrossRef]
  5. Liu, L.; Wang, L.J.; Song, L.K.; Sheng, M.Y. Carbon sequestration law by phytoliths in the bamboo forests: Insights for the management of phytolith carbon sink. Glob. Ecol. Conserv. 2025, 58, e03491. [Google Scholar] [CrossRef]
  6. Khatiwala, S.; Primeau, F.; Hall, T. Reconstruction of the history of anthropogenic CO2 concentrations in the ocean. Nature 2009, 462, 346-U110. [Google Scholar] [CrossRef] [PubMed]
  7. Gruber, N.; Bakker, D.C.E.; DeVries, T.; Gregor, L.; Hauck, J.; Landschuetzer, P.; McKinley, G.A.; Mueller, J.D. Trends and variability in the ocean carbon sink. Nat. Rev. Earth Environ. 2023, 4, 119–134. [Google Scholar] [CrossRef]
  8. Samaras, D.A.; Damianidis, C.; Fotiadis, G.; Tsiftsis, S. Effect of climate change on fir forest communities in the mountains of South-Central Greece. Eur. J. Environ. Sci. 2022, 12, 39–50. [Google Scholar] [CrossRef]
  9. Taylor, C.; Lindenmayer, D.B. Temporal fragmentation of a critically endangered forest ecosystem. Austral Ecol. 2020, 45, 340–354. [Google Scholar] [CrossRef]
  10. Lin, X.; Zhen, S.Y.; Zhao, Q.; Hu, X.S. A New Paradigm for Assessing Detailed Dynamics of Forest Landscape Fragmentation. Forests 2024, 15, 1212. [Google Scholar] [CrossRef]
  11. Anderegg, W.R.L.; Ballantyne, A.P.; Smith, W.K.; Majkut, J.; Rabin, S.; Beaulieu, C.; Birdsey, R.; Dunne, J.P.; Houghton, R.A.; Myneni, R.B.; et al. Tropical nighttime warming as a dominant driver of variability in the terrestrial carbon sink. Proc. Natl. Acad. Sci. USA 2015, 112, 15591–15596. [Google Scholar] [CrossRef] [PubMed]
  12. Duffy, K.A.; Schwalm, C.R.; Arcus, V.L.; Koch, G.W.; Liang, L.Y.L.; Schipper, L.A. How close are we to the temperature tipping point of the terrestrial biosphere? Sci. Adv. 2021, 7, eaay1052. [Google Scholar] [CrossRef]
  13. Sitch, S.; Huntingford, C.; Gedney, N.; Levy, P.E.; Lomas, M.; Piao, S.L.; Betts, R.; Ciais, P.; Cox, P.; Friedlingstein, P.; et al. Evaluation of the terrestrial carbon cycle, future plant geography and climate-carbon cycle feedbacks using five Dynamic Global Vegetation Models (DGVMs). Glob. Change Biol. 2008, 14, 2015–2039. [Google Scholar] [CrossRef]
  14. Shen, X.Y.; Rezaei, T.; Kachenchart, B.; Tanhan, P.; Chaiyarat, R. Optimal region connection: Establishing effective ecological corridors for biodiversity conservation in Yunnan Province, China. Ecol. Indic. 2024, 169, 112918. [Google Scholar] [CrossRef]
  15. Beita, C.M.; Murillo, L.F.S.; Alvarado, L.D.A. Ecological corridors in Costa Rica: An evaluation applying landscape structure, fragmentation-connectivity process, and climate adaptation. Conserv. Sci. Pract. 2021, 3, e475. [Google Scholar] [CrossRef]
  16. Liu, D.; An, Y.; Li, Z.; Wang, Z.H.; Zhao, Y.H.; Wang, X.C. Differences and similarities in radial growth of Betula species to climate change. J. For. Res. 2024, 35, 40. [Google Scholar] [CrossRef]
  17. Gao, R.M.; Shi, X.D.; Wang, J.R. Comparative studies of the response of larch and birch seedlings from two origins to water deficit. New Zeal. J. For. Sci. 2017, 47, 14. [Google Scholar] [CrossRef]
  18. Ritonga, F.N.; Ngatia, J.N.; Song, R.X.; Farooq, U.; Somadona, S.; Lestari, A.T.; Chen, S. Abiotic stresses induced physiological, biochemical, and molecular changes in Betula platyphylla: A review. Silva Fenn. 2021, 55, 10516. [Google Scholar] [CrossRef]
  19. Liu, L.F.; Qin, F.C.; Liu, Y.; Hu, Y.N.; Wang, W.F.; Duan, H.; Li, M.Y. Forecast of potential suitable areas for forest resources in Inner Mongolia under the Shared Socioeconomic Pathway 245 scenario. Ecol. Indic. 2024, 167, 112694. [Google Scholar] [CrossRef]
  20. Dolezal, J.; Ishii, H.; Kyncl, T.; Takahashi, K.; Vetrova, V.P.; Homma, K.; Sumida, A.; Hara, T. Climatic factors affecting radial growth of Betula ermanii and Betula platypylla in Kamchatka. Can. J. For. Res. 2010, 40, 273–285. [Google Scholar] [CrossRef]
  21. Takahashi, K.; Azuma, H.; Yasue, K. Effects of climate on the radial growth of tree species in the upper and lower distribution limits of an altitudinal ecotone on Mount Norikura, central Japan. Ecol. Res. 2003, 18, 549–558. [Google Scholar] [CrossRef]
  22. Zhang, Q.H.; Pei, X.N.; Xu, L.F.; Lu, X.B.; Wen, B.Y.; Li, Y.L.; Wang, L.K.; Dong, G.Z.; Shi, W.L.; Hu, X.Q.; et al. Genetic Improvement of Betula platyphylla Suk. in China: A Review. Phyton-Int. J. Exp. Bot. 2022, 91, 1585–1599. [Google Scholar] [CrossRef]
  23. Zhang, X.; Yu, J.J.; Qu, G.Z.; Chen, S. The cold-responsive C-repeat binding factors in Betula platyphylla Suk. positively regulate cold tolerance. Plant Sci. 2024, 341, 112012. [Google Scholar] [CrossRef]
  24. Lei, X.J.; Liu, Z.Y.; Li, X.P.; Tan, B.; Wu, J.; Gao, C.Q. Screening and functional identification of salt tolerance HMG genes in Betula platyphylla. Environ. Exp. Bot. 2021, 181, 104235. [Google Scholar] [CrossRef]
  25. Geng, W.L.; Li, Y.Y.; Sun, D.Q.; Li, B.; Zhang, P.Y.; Chang, H.; Rong, T.Q.; Liu, Y.; Shao, J.W.; Liu, Z.Y.; et al. Prediction of the potential geographical distribution of Betula platyphylla Suk. in China under climate change scenarios. PLoS ONE 2022, 17, e0262540. [Google Scholar] [CrossRef] [PubMed]
  26. Zhao, X.N.; Zheng, Y.T.; Wang, W.; Wang, Z.; Zhang, Q.F.; Liu, J.C.; Zhang, C.T. Habitat Suitability Evaluation of Different Forest Species in Lvliang Mountain by Combining Prior Knowledge and MaxEnt Model. Forests 2023, 14, 438. [Google Scholar] [CrossRef]
  27. Tsiftsis, S.; Djordjevic, V.; Tsiripidis, I. Neottia cordata (Orchidaceae) at its southernmost distribution border in Europe: Threat status and effectiveness of Natura 2000 Network for its conservation. J. Nat. Conserv. 2019, 48, 27–35. [Google Scholar] [CrossRef]
  28. Jha, A.; Praveen, J.; Nameer, P.O. Contrasting occupancy models with presence-only models: Does accounting for detection lead to better predictions? Ecol. Model. 2022, 472, 110105. [Google Scholar] [CrossRef]
  29. Ahmadi, M.; Hemami, M.R.; Kaboli, M.; Shabani, F. MaxEnt brings comparable results when the input data are being completed; Model parameterization of four species distribution models. Ecol. Evol. 2023, 13, e9827. [Google Scholar] [CrossRef]
  30. Men, D.; Pan, J.H. Integrating key species distribution and ecosystem service flows to build directed ecological network: Evidence from the Shiyang River Basin, China. J. Environ. Manag. 2025, 381, 125183. [Google Scholar] [CrossRef]
  31. Yagoobi, S.; Sharma, N.; Traulsen, A. Categorizing update mechanisms for graph-structured metapopulations. J. R. Soc. Interface 2023, 20, 20220769. [Google Scholar] [CrossRef]
  32. Wu, Y.H.; Qin, F.C.; Li, L.; Dong, X.Y. Construction and optimisation of watershed scale ecological network: A case study of kuye river basin. Front. Environ. Sci. 2024, 12, 1364568. [Google Scholar] [CrossRef]
  33. Yuan, Q.; Li, R. The negative impacts of human activities on the ecological corridor in the karst highly urbanized area are gradually diminishing: A case study from the karst mountain cities in Southwest China. Ecol. Indic. 2023, 157, 111257. [Google Scholar] [CrossRef]
  34. Li, P.X.; Liu, C.G.; Sun, W. Quantifying changes of landscape connectivity based on ecological process simulation in a rapidly urbanized city: Nanjing, China. Environ. Earth Sci. 2021, 80, 644. [Google Scholar] [CrossRef]
  35. Liu, M.X.; Li, L.; Wang, S.Y.; Xiao, S.R.; Mi, J.L. Forecasting the future suitable growth areas and constructing ecological corridors for the vulnerable species Ephedra sinica in China. J. Nat. Conserv. 2023, 73, 126401. [Google Scholar] [CrossRef]
  36. Fu, H.X.; Zhang, T.; Wang, J.G. Evaluating suitability of development and construction with of minimum cumulative resistance model for a mountain scenic area in Jinyun Xiandu, China. Ecol. Eng. 2024, 202, 107240. [Google Scholar] [CrossRef]
  37. Luo, L.Z.; Yang, C.X.; Chen, R.R.; Liu, W.P. Comprehensive Land Consolidation Zoning Based on Minimum Cumulative Resistance Model-A Case Study of Chongqing, Southwest China. Land 2023, 12, 1935. [Google Scholar] [CrossRef]
  38. Hou, X.Y. Vegetation Atlas of China; Chinese Academy of Science, the Editorial Board of Vegetation Map of China Scientific Press: Beijing, China, 2001. [Google Scholar]
  39. Warren, D.L.; Beaumont, L.J.; Dinnage, R.; Baumgartner, J.B. New methods for measuring ENM breadth and overlap in environmental space. Ecography 2019, 42, 444–446. [Google Scholar] [CrossRef]
  40. Mu, H.W.; Li, X.C.; Wen, Y.A.; Huang, J.X.; Du, P.J.; Su, W.; Miao, S.X.; Geng, M.Q. A global record of annual terrestrial Human Footprint dataset from 2000 to 2018. Sci. Data 2022, 9, 176. [Google Scholar] [CrossRef] [PubMed]
  41. Yang, J.; Huang, X. The 30 m annual land cover dataset and its dynamics in China from 1990 to 2019. Earth Syst. Sci. Data 2021, 13, 3907–3925. [Google Scholar] [CrossRef]
  42. Tokarska, K.B.; Stolpe, M.B.; Sippel, S.; Fischer, E.M.; Smith, C.J.; Lehner, F.; Knutti, R. Past warming trend constrains future warming in CMIP6 models. Sci. Adv. 2020, 6, eaaz9549. [Google Scholar] [CrossRef]
  43. Sang, Y.H.; Ren, H.L.; Shi, X.L.; Xu, X.F.; Chen, H.S. Improvement of Soil Moisture Simulation in Eurasia by the Beijing Climate Center Climate System Model from CMIP5 to CMIP6. Adv. Atmos. Sci. 2021, 38, 237–252. [Google Scholar] [CrossRef]
  44. Zhang, H.Y.; Zhou, Y.; Ji, X.D.; Wang, Z.Y.; Liu, Z. Climate Change Drives the Adaptive Distribution and Habitat Fragmentation of Betula albosinensis Forests in China. Forests 2025, 16, 184. [Google Scholar] [CrossRef]
  45. Li, M.; Zhang, Y.; Yang, Y.S.; Wang, T.X.; Wu, C.; Zhang, X.J. Prediction of Historical, Current, and Future Configuration of Tibetan Medicinal Herb Gymnadenia orchidis Based on the Optimized MaxEnt in the Qinghai-Tibet Plateau. Plants-Basel 2024, 13, 645. [Google Scholar] [CrossRef]
  46. Yang, W.J.; Sun, S.X.; Wang, N.X.; Fan, P.X.; You, C.; Wang, R.Q.; Zheng, P.M.; Wang, H. Dynamics of the distribution of invasive alien plants (Asteraceae) in China under climate change. Sci. Total Environ. 2023, 903, 166260. [Google Scholar] [CrossRef] [PubMed]
  47. Zhang, H.Y.; Li, J.P.; Zou, H.C.; Wang, Z.Y.; Zhu, X.Y.; Zhang, Y.H.; Liu, Z. Distribution Pattern of Suitable Areas and Corridor Identification of Endangered Ephedra Species in China. Plants 2024, 13, 890. [Google Scholar] [CrossRef] [PubMed]
  48. Swets, J.A. Measuring the accuracy of diagnostic systems. Science 1988, 240, 1285–1293. [Google Scholar] [CrossRef]
  49. Peterson, A.T.; Cohoon, K.P. Sensitivity of distributional prediction algorithms to geographic data completeness. Ecol. Model. 1999, 117, 159–164. [Google Scholar] [CrossRef]
  50. Yang, M.; Zhao, H.X.; Xian, X.Q.; Liu, H.; Li, J.Y.; Chen, L.; Liu, W.X. Potential global geographical distribution of Lolium temulentum L. under climate change. Front. Plant Sci. 2022, 13, 1024635. [Google Scholar] [CrossRef]
  51. Goncharenko, I.; Krakhmalnyi, M.; Velikova, V.; Ascencio, E.; Krakhmalnyi, A. Ecological niche modeling of toxic dinoflagellate Prorocentrum cordatum in the Black Sea. Ecohydrol. Hydrobiol. 2021, 21, 747–759. [Google Scholar] [CrossRef]
  52. Feng, M.; Zhao, W.M.; Zhang, T. Construction and Optimization Strategy of County Ecological Infrastructure Network Based on MCR and Gravity Model-A Case Study of Langzhong County in Sichuan Province. Sustainability 2023, 15, 8478. [Google Scholar] [CrossRef]
  53. Liang, C.; Zeng, J.; Zhang, R.C.; Wang, Q.W. Connecting urban area with rural hinterland: A stepwise ecological security network construction approach in the urban-rural fringe. Ecol. Indic. 2022, 138, 108794. [Google Scholar] [CrossRef]
  54. Zhao, S.M.; Ma, Y.F.; Wang, J.L.; You, X.Y. Landscape pattern analysis and ecological network planning of Tianjin City. Urban For. Urban Green. 2019, 46, 126479. [Google Scholar] [CrossRef]
  55. Wang, X.K.; Xie, X.Q.; Wang, Z.F.; Lin, H.; Liu, Y.; Xie, H.L.; Liu, X.Z. Construction and Optimization of an Ecological Security Pattern Based on the MCR Model: A Case Study of the Minjiang River Basin in Eastern China. Int. J. Environ. Res. Public Health 2022, 19, 8370. [Google Scholar] [CrossRef]
  56. Kaky, E.; Nolan, V.; Alatawi, A.; Gilbert, F. A comparison between Ensemble and MaxEnt species distribution modelling approaches for conservation: A case study with Egyptian medicinal plants. Ecol. Inform. 2020, 60, 101150. [Google Scholar] [CrossRef]
  57. Ramírez-Rodríguez, R.; Rocha, J.; Crespí, A.L.; Amich, F. Modelling the present potential habitat distribution of the near-threatened endemic species Silene marizii: Implications for conservation. Plant Biosyst. 2025, 159, 154–163. [Google Scholar] [CrossRef]
  58. He, P.; Li, J.Y.; Li, Y.F.; Xu, N.; Gao, Y.; Guo, L.F.; Huo, T.T.; Peng, C.; Meng, F.Y. Habitat protection and planning for three Ephedra using the MaxEnt and Marxan models. Ecol. Indic. 2021, 133, 108399. [Google Scholar] [CrossRef]
  59. Grieger, R.; Capon, S.J.; Hadwen, W.L.; Mackey, B. Spatial variation and drivers of vegetation structure and composition in coastal freshwater wetlands of subtropical Australia. Mar. Freshw. Res. 2021, 72, 1746–1759. [Google Scholar] [CrossRef]
  60. Zhao, D.S.; Zhu, Y.; Wu, S.H.; Zheng, D. Projection of vegetation distribution to 1.5 °C and 2 °C of global warming on the Tibetan Plateau. Glob. Planet. Change 2021, 202, 103525. [Google Scholar] [CrossRef]
  61. Koike, T.; Kitao, M.; Quoreshi, A.M.; Matsuura, Y. Growth characteristics of root-shoot relations of three birch seedlings raised under different water regimes. Plant Soil 2003, 255, 303–310. [Google Scholar] [CrossRef]
  62. Xiao, C.W.; Sang, W.G.; Wang, R.Z. Fine root dynamics and turnover rate in an Asia white birch forest of Donglingshan Mountain, China. For. Ecol. Manag. 2008, 255, 765–773. [Google Scholar] [CrossRef]
  63. Ranney, T.G.; Bir, R.E.; Skroch, W.A. Comparative drought resistance among 6 species of birch (Betula)—Influence of mild water-stress on water relations and leaf gas-exchange. Tree Physiol. 1991, 8, 351–360. [Google Scholar] [CrossRef]
  64. Schmitt, C.B.; Senbeta, F.; Woldemariam, T.; Rudner, M.; Denich, M. Importance of regional climates for plant species distribution patterns in moist Afromontane forest. J. Veg. Sci. 2013, 24, 553–568. [Google Scholar] [CrossRef]
  65. Pinilla-Buitrago, G.E. Predicting potential range shifts using climatic time series and niche models: A Neotropical montane shrew’s case. Ecol. Inform. 2023, 77, 102212. [Google Scholar] [CrossRef]
  66. Li, H.; Xu, F.; Li, Z.C.; You, N.S.; Zhou, H.; Zhou, Y.; Chen, B.Q.; Qin, Y.W.; Xiao, X.M.; Dong, J.W. Forest Changes by Precipitation Zones in Northern China after the Three-North Shelterbelt Forest Program in China. Remote Sens. 2021, 13, 543. [Google Scholar] [CrossRef]
  67. Yang, J.H.; Li, Y.Q.; Zhou, L.; Zhang, Z.Q.; Zhou, H.K.; Wu, J.J. Effects of temperature and precipitation on drought trends in Xinjiang, China. J. Arid Land 2024, 16, 1098–1117. [Google Scholar] [CrossRef]
  68. Wang, B.; Dong, X.G.; Wang, Z.H.; Qin, G.Q. Characterizing Spatiotemporal Variations of Soil Salinization and Its Relationship with Eco-Hydrological Parameters at the Regional Scale in the Kashi Area of Xinjiang, China from 2000 to 2017. Water 2021, 13, 1075. [Google Scholar] [CrossRef]
  69. Li, J.; Gong, Q.; Zhao, L.W. Climatic features of summer temperature in Northeast China under warming background. Chin. Geogr. Sci. 2005, 15, 337–342. [Google Scholar] [CrossRef]
  70. Yuan, D.Y.; Zhu, L.J.; Cherubini, P.; Li, Z.S.; Zhang, Y.D.; Wang, X.C. Species-specific indication of 13 tree species growth on climate warming in temperate forest community of northeast China. Ecol. Indic. 2021, 133, 108389. [Google Scholar] [CrossRef]
  71. Yu, J.; Wu, C.J.; Jia, C.J.; Xu, W.Y. Study of variation of pore properties in gravel soil under triaxial loading based on discrete element method. Curr. Sci. 2021, 121, 801–809. [Google Scholar] [CrossRef]
  72. Harvey, B.J.; Cook, P.; Shaffrey, L.C.; Schiemann, R. The Response of the Northern Hemisphere Storm Tracks and Jet Streams to Climate Change in the CMIP3, CMIP5, and CMIP6 Climate Models. J. Geophys. Res. Atmos. 2020, 125, e2020JD032701. [Google Scholar] [CrossRef]
  73. Yao, W.H.; Wang, Z.H.; Fan, Y.; Liu, D.Y.; Ding, Z.Y.; Zhou, Y.M.; Hu, S.Y.; Zhang, W.; Ou, J. Prediction of Potential Habitat Distributions and Climate Change Impacts on the Rare Species Woonyoungia septentrionalis (Magnoliaceae) in China Based on MaxEnt. Plants 2025, 14, 86. [Google Scholar] [CrossRef]
  74. Hadinejad, M.; Naghipour, A.A.; Ebrahimi, A.; Naimi, B. Modeling the effect of climate change on the distribution of plant communities in Zayandeh-Rud basin, Iran. Environ. Monit. Assess. 2025, 197, 479. [Google Scholar] [CrossRef]
  75. Li, X.X.; Yang, D.S.; Wang, J.J.; Pan, G. Prediction of the change in suitable growth area of Sabina tibetica on the Qinghai-Tibetan plateau using MaxEnt model. Front. For. Glob. Change 2025, 8, 1465416. [Google Scholar] [CrossRef]
  76. Zhang, M.G.; Zhou, Z.K.; Chen, W.Y.; Cannon, C.H.; Raes, N.; Slik, J.W.F. Major declines of woody plant species ranges under climate change in Yunnan, China. Divers. Distrib. 2014, 20, 405–415. [Google Scholar] [CrossRef]
  77. Lin, X.K.; Chang, B.L.; Huang, Y.Q.; Jin, X. Predicting the impact of climate change and land use change on the potential distribution of two economic forest trees in Northeastern China. Front. Plant Sci. 2024, 15, 1407867. [Google Scholar] [CrossRef] [PubMed]
  78. Raghunathan, N.; Francois, L.; Dury, M.; Hambuckers, A. Contrasting climate risks predicted by dynamic vegetation and ecological niche-based models applied to tree species in the Brazilian Atlantic Forest. Reg. Environ. Change 2019, 19, 219–232. [Google Scholar] [CrossRef]
  79. Lemordant, L.; Gentine, P. Vegetation Response to Rising CO2 Impacts Extreme Temperatures. Geophys. Res. Lett. 2019, 46, 1383–1392. [Google Scholar] [CrossRef]
  80. Liu, Y.; Yang, Q.; Li, S.H.; Zhang, Y.W.; Xiang, Y.Z.; Yang, Y.; Zhang, J.X. Spatiotemporal Dynamics of Ilex macrocarpa Distribution Under Future Climate Scenarios: Implications for Conservation Planning. Forests 2025, 16, 370. [Google Scholar] [CrossRef]
  81. Dong, P.B.; Wang, L.J.; Qiu, D.Y.; Liang, W.; Cheng, J.L.; Wang, H.Y.; Guo, F.X.; Chen, Y. Evaluation of the environmental factors influencing the quality of Astragalus membranaceus var. mongholicus based on HPLC and the Maxent model. BMC Plant Biol. 2024, 24, 697. [Google Scholar] [CrossRef]
  82. Wu, C.W.; Xu, X.X.; Zhang, G.J.; Cheng, B.B.; Han, S. Predicting the potential suitable habitat for Tamarix chinensis under climate change based on CMIP6 in China. Appl. Ecol. Environ. Res. 2022, 20, 2845–2863. [Google Scholar] [CrossRef]
  83. Bai, J.Y.; Wang, H.C.; Hu, Y.K. Prediction of Potential Suitable Distribution of Liriodendron chinense (Hemsl.) Sarg. in China Based on Future Climate Change Using the Optimized MaxEnt Model. Forests 2024, 15, 988. [Google Scholar] [CrossRef]
  84. Khan, Z.; Ali, S.A.; Parvin, F.; Mohsin, M.; Shamim, S.K.; Ahmad, A. Predicting the effects of climate change on prospective Banj oak (Quercus leucotrichophora) dispersal in Kumaun region of Uttarakhand using machine learning algorithms. Model. Earth Syst. Environ. 2023, 9, 145–156. [Google Scholar] [CrossRef]
Figure 1. Distribution of B. platyphylla forest in China.
Sustainability 17 06937 g001
Figure 2. Construction of comprehensive landscape resistance surface. (a) comprehensive landscape resistance; (b1) the resistance surface of the land cover dataset (CLCD); (b2) the resistance surface of NDVI; (b3) the resistance surface of elevation (Elev); (b4) the resistance surface of slope.
Sustainability 17 06937 g002
Figure 3. Suitable areas of B. platyphylla under current climate conditions: (a) suitable areas in China; (b) suitable areas in Northwest China; (c) suitable areas in Northeast Chin; (d) suitable areas in Southwest Chin; (e) suitable areas in North China.
Sustainability 17 06937 g003
Figure 4. Percent contribution and permutation importance of environment variables: (a) B. platyphylla in China; (b) B. platyphylla in Northwest China; (c) B. platyphylla in Northeast China; (d) B. platyphylla in Southwest Chin; (e) B. platyphylla in North China.
Sustainability 17 06937 g004
Figure 5. The response curve of the dominant variables.
Sustainability 17 06937 g005
Figure 6. Changes in the suitable areas of B. platyphylla forest.
Sustainability 17 06937 g006
Figure 7. The centroid change of B. platyphylla forest in China.
Sustainability 17 06937 g007
Figure 8. Ecological corridors of B. platyphylla forest: (a) suitable areas in China; (b) land use type; (c) construction of comprehensive landscape resistance surface.
Sustainability 17 06937 g008
Table 1. Environmental variables influencing Maxent.
CategorySymbolEnvironmental VariablesUnit
BioclimaticBio1Annual mean temperature°C
Bio2Mean diurnal range°C
Bio3Isothermality\
Bio4Temperature seasonality\
Bio5Max temperature of warmest month°C
Bio6Min temperature of coldest month°C
Bio7Temperature annual range°C
Bio8Mean temperature of wettest quarter°C
Bio9Mean temperature of driest quarter°C
Bio10Mean temperature of warmest quarter°C
Bio11Mean temperature of coldest quarter°C
Bio12Annual precipitationmm
Bio13Precipitation of wettest monthmm
Bio14Precipitation of driest monthmm
Bio15Precipitation seasonality\
Bio16Precipitation of wettest quartermm
Bio17Precipitation of driest quartermm
Bio18Precipitation of warmest quartermm
Bio19Precipitation of coldest quartermm
SoilBDSoil bulk densityg/cm3
BtclyClay contentg/kg
BtsltSilt contentg/kg
BtsndSand contentg/kg
CECCation exchange capacitycmol/kg
CFGravel content%
pHPower of hydrogen\
SOCSoil organic matterg/kg
SOCDSoil organic matter densitykg/m2
TKTotal potassiumg/kg
TKDTotal potassium contentkg/m2
TNTotal nitrogeng/kg
TNDTotal nitrogen contentkg/m2
TPTotal phosphorusg/kg
TPDTotal phosphorus contentkg/m2
TerrainElevElevationm
AspectAspect°
SlopeSlope°
HFPHFPHuman Footprint\
Disclaimer/Publisher’s Note: The statements, opinions and data contained in all publications are solely those of the individual author(s) and contributor(s) and not of MDPI and/or the editor(s). MDPI and/or the editor(s) disclaim responsibility for any injury to people or property resulting from any ideas, methods, instructions or products referred to in the content.

