Article

Examining the Impacts of Land Resources and Youth Education on Agricultural Livelihood in Battambang Province

by
Dyna Chin
1,*,
Sanara Hor
1,*,
Soksan Seng
1,
Sophak Pok
1,
Lyhour Hin
2,
Chaneng Yin
1,
Sotheavy Kin
1,
Nuch Sek
1,
Sopharith Nou
1,
Sokhieng Chhe
1,
Thapkonin Chhoengsan
1,
Pengkheang Mol
1,
Chetha Chea
1,
Sambath Eun
1,
Linna Long
1 and
Hitoshi Shinjo
3
1
Faculty of Land Management and Land Administration, Royal University of Agriculture, Phnom Penh 12108, Cambodia
2
Faculty of Agriculture Engineering, Royal University of Agriculture, Phnom Penh 12108, Cambodia
3
Laboratory of Soil Science, Graduate School of Agriculture, Kyoto University, Yoshida-Honmachi, Sakyo-Ku, Kyoto 606-8501, Japan
*
Authors to whom correspondence should be addressed.
Sustainability 2025, 17(15), 6866; https://doi.org/10.3390/su17156866
Submission received: 5 June 2025 / Revised: 29 June 2025 / Accepted: 14 July 2025 / Published: 28 July 2025

Abstract

Since the end of the Civil War, Cambodia has pursued economic development to enhance livelihoods, particularly in rural areas, where land is a critical resource. Previous studies have indicated that the country has changed land use and land cover. However, they have not explained how these changes can improve the livelihoods of local communities, thereby mitigating their negative impacts through an asset-based approach. Battambang Province, in the northwestern region, was the battleground until political integration in 1996. Since then, the province has been home to immigrants exploring the lands for livelihood. Thus, this study aims to examine agricultural livelihoods in the villages of Dei Kraham and Ou Toek Thla, located west of Battambang Town. These were selected because of their common characteristics. Adopting a quantitative approach and a sustainable livelihood framework, this study employed stratified random sampling to select 123 families for interviews across three population subgroups: old settlers, new settlers, and young settlers. In situ information was collected using structured questionnaires and analyzed using Kruskal–Wallis tests to assess the livelihood assets underlying the physical, natural, human, financial, and social capital. The statistical analysis results reveal no significant differences (p-value = 0.079) in livelihood assets between the strata at the village level. Meanwhile, significant differences were observed in physical, human, and financial capital between old and young settlers when examining the subgroups (p-value 0.000). The extent of the land resources held by old settlers was associated with household income and livelihoods related to agriculture. Based on livelihood asset scores, nearly half of the new settlers (0.49–0.5) and a quarter of the young settlers (0.47) are vulnerable groups requiring support. The youth will soon face an uncertain future if they do not prioritize education.

1. Introduction

The Cambodian political and economic landscape has undergone significant changes since the end of the Civil War. The 1991 Paris Peace Agreement ended the conflict between the Cambodian Government and Democratic Kampuchea troops, leading to the UNTAC-supervised first election in 1993. In 1996, the win–win policy facilitated political integration, marking the end of three decades of civil war [1]. The country became the 10th ASEAN member in 1999 [2] and advanced its socio-economic development, joining the World Trade Organization in 2003 [2]. These movements have significantly transformed household economies [3].
Land resources, which are crucial for agriculture, play a significant role in enhancing livelihoods. People in rural areas across the country depend on land to sustain their livelihoods, as evidenced by widespread changes in land use and cover [4]. This phenomenon has attracted the interest of both national and international drivers of change. In the northeastern region of the country, market accessibility has led to the expansion of agricultural land for cash crop production, such as cassava and cashew [5], resulting in a transition from swidden agriculture to commercial farming [5,6]. In Battambang Province, local efforts to boost commercial crops have also mirrored the trends in the northeastern region [7]. In 2021, the drivers of LULCC (land use and land cover change) confirmed that trade liberalization policies and rural development projects, such as landmine clearance and road development, accelerated the shift from forestry to agriculture [8]. Thus, trade liberalization policies and improved access to and from village markets have encouraged rural populations to adopt a land use scheme that includes commercial cropping to meet market demands [9]. Previous anecdotal evidence has provided clarity regarding drivers of land use change, such as trade liberalization policies and rural development projects. However, it does not fully explain the local livelihood involved.
Studies on livelihoods are crucial, as they can help mitigate land use issues. For example, during the neoclassical era, improvements in livelihoods or economic development focused on rural labor markets [10]. By contrast, as land resources are also essential for rural livelihood development [11], studies on land use are necessary to understand local livelihoods [12,13]. Increased research on rural livelihoods in the early 1990s provided anecdotal insights into rural poverty alleviation and improvements in living standards by introducing the Sustainable Livelihood Framework (SLF) [14]. This was essential for economic diversification [15] and the promotion of sustainable livelihoods for future generations [16] in the 21st century. Globally, research on rural livelihood has gained prominence, aligning with the political goals of eradicating poverty and hunger [16].
Studies on sustainable livelihoods, including the measurement, evaluation, and development of livelihood models, aim to ensure the improvement of rural livelihoods. Thus, anecdotal evidence suggests that education, the resource regime, and infrastructure access are vital for enhancing livelihood strategies in Kampong Chhnang, Kampong Spue, and Kampong Thom [17], and integrating off-farm employment with improved social networking and education can reduce reliance on natural resources, such as land [18,19], to improve the conditions of the rural poor [20]. However, local dependence on land for agriculture creates vulnerability when linked to the global agriculture market [21]. There is a lack of examination of livelihood asset portfolios, which vary across different ecological and economic contexts within the country.
This article aims to empirically apply the SLF to examine local livelihood assets (LA), focusing on human, natural, financial, physical, and social capital, to identify local vulnerabilities and enhance the understanding of the livelihoods of local people in Northwestern Cambodia. Specifically, it addresses the following questions: (1) Are there differences in livelihoods within the study villages? (2) Can we examine the livelihoods of different population groups? (3) What are household livelihood strategies? (4) Are local people earning sufficient income from agriculture, and if not, how do they address this issue? (5) Which population groups are the most vulnerable?
In the 21st century, studies on sustainable rural livelihoods have sought to gain a deeper understanding of existing conditions, including their intensity and complexity, and the associated migration to identify ways to create more desirable outcomes for people [14]. A sustainable livelihood is expected to provide better access to basic needs, opportunities for enhancement, and a sense of identity and belonging by producing and distributing services and resources that ensure economic viability and social status [22].
Since then, approaches and frameworks have been established to ensure sustainable livelihood. These may include people-centered approaches, as well as an adaptation of assets and strategies, national and global linkages, and institutional arrangements [23]. The objective is to establish a sustainable livelihood framework that takes into account vulnerability, livelihood resources, institutional arrangements, and livelihood strategies and outcomes. Livelihood assets or resources, including human, natural, financial, social, and physical capital, are key elements that draw the attention of researchers and development institutes to better understand the context of the community and different group populations [24]. Thus, understanding livelihood assets—the resource base of communities and households [25]—proves to be essential for understanding the conditions local people need to create for their families to be preferred [14,25].
Globally, the United Nations Development Programme introduced a simple method to visualize local livelihoods by adopting the livelihood asset pentagon [26], which has been found in various studies. The capital can be visualized to characterize population groups. Therefore, group vulnerability can be identified, and through intervention, asset variability needs to address specific group vulnerabilities within the livelihood contexts [24,27].
Livelihood assets can be measured and evaluated using simple models according to differences in ecological or economic context. For example, livelihood assets demonstrated an increase from 0.56 in 2006 to 0.71 in 2010, with participants scoring 0.77 and non-participants scoring 0.51. These differences in livelihood assets were statistically significant, as indicated by the Kruskal–Wallis test for non-parametric data analysis, applied to understand local livelihoods in the Baishuijiang National Nature Reserve, Northwest China [11,12]. In Ecuador, evaluating and measuring livelihood assets is necessary to understand the indigenous context, such as that of Guangaje Centro, Tingo Pucará, and Curinge. All scored below 0.5 for human, physical, and financial capital, thereby requiring intervention investment. Post-intervention, the livelihood assets score averaged between 0.4 and 0.6. However, the natural and social capital scores ranged between 0.6 and 0.9 [28]. Both investigations used index scores (0–1) to measure and evaluate rural livelihood assets, which are necessary for intervention investment.
In Stung Treng Province, Cambodia, evaluating livelihood capital could potentially identify the vulnerability context through principal component analysis. The Heckman model, with Wilcoxon, Kruskal–Wallis, and chi-square tests, was employed to classify population group vulnerability. The authors found that high levels of human, physical, and social capital could enable households to benefit from the environmental extraction of fish. However, enhanced human and social capital could also promote off-farm employment, reducing livelihood dependency on land and forest resources and promoting environmental stability in the face of forest degradation [18]. This research presents a challenging method for exploring the relationship between environmental income and rural livelihood, but it does not reveal the weaknesses of investment intervention. Hence, a simple model needs to be adopted.
Based on the series of questions presented in the Section 1 and the literature review in this section, we deliberately set the following research hypotheses: Hypothesis 1 mainly focuses on different livelihood assets of the population groups living in two villages, including the five types of capital, and Hypothesis 2 aims for a deep understanding of the livelihood of sub-population groups and identify the most vulnerable group.
Hypothesis 1.
Different villages have different livelihood assets. This is because Dei Kraham villagers have better access to development projects, so they can access additional services than Ou Toek Thla villagers.
Hypothesis 2.
New settlers and the young generation, the sub-population groups, are vulnerable due to low natural and human capital, thereby requiring intervention.

2. Materials and Methods

2.1. Study Location and Sampling Methods

After the end of the Khmer Rouge Regime (1975–1979), Cambodia’s socio-economic disruption stemmed from civil war. There were approximately 2.8 million mortality-affected adults, reshaping demographic structure. The population subgroup aged 45–49 reaches a 1.5 sex ratio, indicating gender imbalance. Education system collapse caused the population aged between 14 and 18 in 1975 to have the lowest levels of education in 2000. These scarred human capital formation until the mid-1990s [29]. The country′s GDP ranged from around KHR 349 (in 1996) to KHR 466 billion (by 2000), which was heavily dependent on rice production on 87% of the cultivated land [30]. Socio-economic records are difficult to find at the provincial level during that time, and livelihood studies are necessary to conduct in a particular location.
Figure 1 shows the study location. This study was conducted in Battambang Province, which has undergone significant historical and transformational changes in both land use and governance since the 1700s. From 1775 to 1907, known as the Lord Governor Era, the province was under Thai influence. Thereafter, it became a French protectorate until 1953. Following independence from France in 1953, development and investment projects were initiated until the onset of the civil war in 1970, which lasted until 1989. During this period, the province was under the rule of the Khmer Republic (1970–75), the Khmer Rouge (1975–79), and the People’s Republic of Kampuchea (1979–89), receiving significant migration from the southern provinces, such as Kampot or Kampong Spue [31]. The study deliberately selected Dei Kraham village (DK) and Ou Toek Thla village (OT), located approximately 124 km west of Battambang Town, with OT located approximately 10 km east of DK. The two study villages, located in the Ta Saen Commune in Kamrieng District, were selected for their common characteristics: (1) DK was established around 1979 by the Khmer Rouge and has existed ever since; (2) OT, a hamlet of DK, was formed 3–5 years later for land resource exploration; and (3) both villages consist mainly of migrants from Cambodia’s southern provinces with few original inhabitants from Battambang. These characteristics make them representative of similar villages along the Cambodian–Thai border of the northwest plateau region.
The population recorded an increase over three decades. Two years after the political integration, in 1998, the Cambodian census recorded the population of DK as 295 villagers (or 60 families) [32], which surged to 1491 villagers in 2008, while OT had 309 villagers in the same year [33].
The field observations recorded a total population of 1480 villagers (741 females) or 355 families in DK and 730 villagers (357 females) in OT across 156 families. The villages were divided into three main population subgroups: old settlers (OS), new settlers (NS), and the young generation (YG). Clustering of the population subgroups was based on characteristics, migration periods, background, and land accessibility. See Table 1 for details.
Three population subgroups were classified based on villagers’ characteristics, migration period, background, and land accessibility (Table 2). The first group, known as old settlers (OS), primarily from southern provinces such as Takeo and Kampot, consisted of former Khmer Rouge soldiers who served between 1970 and 1979 and retired between 1979 and 1996. They began to settle permanently in these villages between 1990 and 2002, acquiring forest lands whose size could be expanded based on the number of family members and labor force for agriculture, starting in 1993.
The second group, the new settler (NS) families, comprised mostly ordinary people, with a few former Khmer Rouge and government soldiers, who relocated from their hometowns between 1970 and 2018, settling in this region between 1981 and 2016. Between 1970 and 1980, they were soldiers and then looked for livelihood opportunities from 1981. Until 1996, they settled these villages permanently. Most were from the same province as the OS families, with few variations. They migrated to this region to access land resources by purchasing land or seeking employment opportunities.
The children of the OS and NS families constituted the third group, the young generation (YG). More than 80% of this subgroup was born in this region between 1970 and 2000 and is currently aged 23 to 53. The oldest among the YG, over 45 years old, initially lived and were born elsewhere before their families moved to this region.
In this study, fieldwork was conducted in three different stages: 14–23 January 2023, 12–25 February 2023, and 22–31 May 2023. First and second, we conducted field observation in Samlout, Kamrieng, Phnum Proek, and Sampov Lun and targeted villages or hamlets that were established after the end of the civil war. During this period, we conducted in-depth interviews with the villagers’ chief, commune officers, and agricultural officers to collect background information related to village structure and livelihood activities. The information was used for selecting the study villages and developing the questionnaire. Third, we conducted interviews with local villagers in the selected villages.

2.2. Sampling Method and Size

We adopted the stratified random-sampling method to ensure representative coverage of the population subgroups living in the two-study villages in order to achieve a sufficient sample size [34]; the sampling size estimation equations [35] are as follows:
Equation (1): Estimate the total sample size by village
n v = N v 1   +   N v e 2
where n v is the total sample size for each village, e 2 is the error margin of 10% (0.1), and N v the total population of each village. We then estimated the sample size of each stratum based on n v .
Equation (2): Sampling size estimation by stratum
n i =   N i . n v N v
where n i and N i denote, respectively, the total sample size and total population of each stratum. After determining the sample size, households were selected randomly from the voter list, excluding emigrated and immigrated families. This estimation was to improve the representativeness of the population groups [34] and to understand the subgroup [36].

2.3. Livelihood Assets and Indicators

Based on field observations, a series of indicators were designed and selected to examine livelihood assets, including physical, natural, human, financial, and social capital [11,14,27,37]. These indicators were grounded in SLF and were selected to reflect the local reality, dynamics, and land accessibility. SLF could provide a comprehensive tool for a people-centered analysis to understand how the selected population subgroups utilize, access, and transform capitals to sustain their livelihood [38]. Meanwhile, at the same time, responses related to yes/no, ranking, ratio, and a few numbers help villagers easily remember and recognize the situation due to the context sensitivity of the post-conflict zone of Cambodia′s northwestern province. Thus, these selections align with the SLF principle [24,27], which is adopted by similar studies to measure and monitor rural livelihood [11]. Table 3 illustrates the livelihood assets and capital indicators for evaluation.
For physical capital (Cp), we included indicators, such as “ household fixed assets,” “household durable goods,” and “household energy structure” [11]. Although fuelwood remains the primary energy source, villagers have begun using gasoline, diesel, cooking gas, and grid electricity, which were incorporated into the questions [37].
For natural capital (Cn), we pinpointed “land and water resources” [5,7] and “forest resources” [12,14] due to their importance for survival and agricultural expansion. We also accessed “household environment” because it relates to the well-being of the household livelihood system [23,49].
For human capital (Ch), the study emphasized “Formal education” and “Education service” [40] established by the government since the political integration. “Health status” and “dependency ratio” have been introduced to reflect the impact of health on livelihood outcomes [42,50].
In terms of social capital (Cs), the study selected “social network,” “community actions,” and “traditions,” such as mutual aid in agriculture, and religion and activities practiced by locals to create availability in their transitional social networks and relationships [11,44,45,46].
For financial capital (Cf), we used the core indicator of “household annual income in 2022–23” generated from commercial crops, mainly cassava, and included “household expenditure” questions, i.e., yes/no to simplify recall [47,48]. “Household income sources” were adopted to better understand livelihood diversification [41]. The details of the indicators, question types, and measurement models are provided in Table 3.

2.4. Measuring Livelihood

Table 4 shows the average livelihood scores for every population subgroup in each village, calculated using the equations provided. Weighting methods were adopted to examine local livelihood [11]. The results were visualized in three ways based on the questionnaire data.
First, for “Yes” and “No” questions (e.g., “whether…” or “do…”), scoring was calculated using Equation (3).
Equation (3): Scoring a yes/no question [11]
I n = Y e s % × 1 + N o % × 0
Second, for questions with a status ranking from good to poor, the scoring mode is shown in Equation (4).
Equation (4): Scoring scale question and answer from 1 through 3 [11]
I n = G o o d % × 1 + A v e r a g e % × 0.66 + P o o r % × 0.33
Third, we used Equation (5) to estimate the daily income per individual (aged 15–64 years) related to “HH annual income” earned from agriculture.
Equation (5): Estimating the daily per capita income of the working-age population [47]
D p = Y f F m . D y P L
where D p is the daily income per person, Y f is the HH annual income from agriculture, F m is the number of active family members, aged 15–64 years ( F m = a g e i 15 a g e i 64 | ), D y is the number of days in a year (365 days), and P L is the poverty line in rural Cambodia, i.e., KHR 8908.00 (USD 2.196)/day [51]. The average exchange rate of the KHR against the USD was the average exchange rate evaluated by NBC, i.e., KHR/USD 4110, in 2023 [52]. We then adopted the conditions to score this indicator, as shown in (6).
Equation (6): Scoring answers related to household annual income modified from (4)
I n = 0.33   i f   D p < 0 0.66   i f   D p = 0 1.00   i f   D p > 0
Finally, the financial, human, physical, natural, and social capital values were calculated using Equation (7):
Equation (7): Calculation of livelihood capital [11]
C = n = 1 n I n T n
where C (0 ≤ C ≤ 1) is the criteria score for the types of capital, n is the indicator index ( n = 1, 2, 3, …), I n is the indicator value, and T n denotes the total number of questions and answers.
The mean “Livelihood Asset” per person is calculated as:
Equation (8): Calculation of livelihood assets [11]
L A = C p + C n + C h + C f + C s 5
where C p , C n , C h , C f , and C s denote the physical, natural, human, financial, and social capital, respectively. A higher L A indicates a better livelihood.

2.5. Data Analysis

To compare livelihoods among the respondents, the study adopted the Kruskal–Wallis test, a rank-based non-parametric method, at the error level of 5%, to identify statistically significant differences between the population groups [11]. The data were entered into Google Sheets for easy sharing with the co-authors, and the analysis used the “dplyr v. 1.1.4” package [53] in R version 4.4.0. Data manipulation followed R Cookbook [54] and “ggplot2 v. 3.5.1” package [55], and MS Excel was used for visualization. Data analysis was conducted at two levels: the village and population subgroups.

3. Results

In village-level livelihood discussions, the percentages were based on the total sample size of each village. For the population subgroups, the percentages were derived from the sample size of each stratum.

3.1. Village Level Analysis

The data analysis suggests that livelihood assets are not significantly different between the villagers in DK and OT, except for human and financial capital, which indicate a significant difference (p < 0.001 and p < 0.003; see Table 5). Educational attainment was empirically low in both groups. In DK, 58% of the villagers attended elementary school, 16% attended secondary school, 4% attended high school, and 1% attended university. In comparison, in OT, 69% of the villagers attended elementary school, 10% attended secondary school, and 2% attended high school 2%. The illiteracy rate in DK was 2% higher than that in OT.

3.2. Livelihood Analysis for Population Subgroups

The analysis illustrates a significant difference in livelihood assets among the population subgroups in the study locations, with a chi-squared value = 23.878, df = 5, and p-value = 0.0002. The four livelihood capital types, namely Cp, Ch, Cs, and Cf, were significantly different, with p-values ranging from 0.0009 to 0.026. Cn was an exception. The detailed comparison results for each population subgroup are provided in Table 6.
According to the Kruskal–Wallis test, the results indicate insignificant differences between the DK and OT villagers, except in human (Ch) and financial (Cf) capital. In general, the livelihood assets are similar across villages, and income is generated primarily from agriculture. Significant differences were observed between the population subgroups. Thus, the following section details the subgroup characteristics.

3.3. Livelihood at the Two Villages

The statistical test indicates that livelihood assets were not significantly different between DK and OT villagers. However, the empirical data reveal distinct characteristics (Figure 2). Low education levels caused a reliance on agriculture in both villages. In DK, only 1% of household heads had attended university, 4%, high school, 16%, secondary school, and 58% had attended elementary school, while 2% were illiterate. Consequently, 46% of villagers depended on farming, 41% on wage labor, 7% on pensions, and 7% on off-farm businesses. For secondary jobs, 12% of DK relied on farms, 24% on wage labor (mostly in Thailand), 1% on pensions, and 5% on off-farm businesses. Annual family income ranged between KHR 1,338,720 (USD 325.72) and KHR 228,698,000 (USD 55,644.28), translating into KHR 2292 (USD 0.56) to KHR 313,285 (USD 76.25) per day per working-age population. This implies that 28% of the villagers earned below the poverty line, including 24% aged between 16–64 years old and 4% aged ≥ 65 years old, with the majority of NS.DK families.
In OT, 2% had attended high school, 10% secondary school, and 69% elementary school, while 18% were illiterate. Their primary sources of income were farming, accounting for 53%, wage labor 35%, off-farm businesses 8%, and pensions 4%. Regarding secondary jobs, farming accounted for 8%, wage labor for 27%, and off-farm businesses for 12%. The earnings ranged between KHR 334,680 (USD 81.43) and KHR 100,404,000 (USD 24,429.2) per family annually, or between KHR 458 (USD 0.11) to KHR 137,540 (USD 33.46) per day per working-age population. As a result, 43% of the OT families lived below the poverty line, including 29% and 14% of the population aged 16–64 years old and older than or equal to 65 years old. Mostly, they are OS.OT families who depend upon their children.

3.4. Population Subgroups’ Livelihood

3.4.1. OS Family Livelihoods

OS families in both villages showed significant differences in livelihood assets, including Cp (p = 0.026), Ch (p = 0.023), and Cf (p = 0.001), while the overall livelihood assets were significant, with a p-value of 0.003 (see Table 6). OS.DK families had a livelihood score of 0.58, which is slightly better than OS.OT’s 0.51 (see Figure 3, left). After the civil war, these subgroups began logging forest land for agriculture, making natural resources central to livelihood improvement.
In DK, OS.DK Families acquired an average of 6.94 hectares of farmland, with 7%, aged 60–68 years, being landless (dependent upon children). The average annual income per family was KHR 46,488,646.00 (USD 11,311.11). The minimum daily income of a working-age household was KHR 3668 (USD 0.89), with a maximum of KHR 313,285 (USD 76.23) per working-age population. Of these families, 21% earned below the poverty line and were indebted to microfinance institutions for agricultural improvement, but with a low dependency ratio (see Figure 4: landholdings and annual income).
Regarding human capital, OS.DK families prioritized formal education for their children, despite limited access to school for household heads due to war. Educational attainment among the household heads was as follows: elementary school: 50%, secondary school: 14%, high school: 7%, and illiterate: 29%. In contrast, their first children have higher education attainment: 21% at elementary, 29% at secondary, 7% at high school levels, and 43% at university. The families’ second children attend elementary, secondary, and high school, each at 21%, 29% at university, and illiterate 7%, respectively.
OS.OT families arrived a few years after OS.DK families, sent by their army division to acquire land for their livelihood. On average, OS.OT families owned 2.7 ha, with 11% (two families only) being landless and aged between 52 and 74 years. Annual income was KHR 6,226,288.00 (USD 1514.91) per family, and the average daily income was KHR 6224 (USD 1.51), with a minimum of KHR 458 (USD 0.11) and a maximum of KHR 40,753 (USD 9.91). Due to lower incomes, 78% of OS.OT families lived below the poverty line.
OS.OT families had the highest education levels, with 5% having attended secondary school, 89%, elementary school, and 6% being illiterate. Regarding their children’s education, 44% of the first children of these families attended elementary school, 50% secondary school, and 6% did not attend school. The second child had a higher illiteracy rate (or not yet due), with 39%, and 39% attended elementary school, 17% secondary school, and 6% attended university.
Energy use demonstrated insignificant differences. However, a notable variation was noted in grid electricity access. In DK, 100% of OS families received grid electricity, compared to 67% in OT. Consequently, 77% of the OT.OS families used solar power versus 21% of DK.OS families. Gasoline and diesel were locally available to all OS families. See Appendix A for detailed empirical data on the physical capital of each population subgroup.

3.4.2. NS Family Livelihoods

In general, the overall livelihood assets of NS families in the two villages indicated an insignificant difference, with a p-value of 0.822 (Table 6). Livelihood asset scored 0.49 and 0.50 (Figure 3, middle panel). However, social capital was significant, with a p-value of 0.033. NS families settled in this region through relatives or friends, unlike OS families, and accessed land for farming through purchases and requests.
NS.DK families owned an average of 4.81 hectares for residential and agricultural use. Their annual income ranged from KHR 3,012,120 (USD 732.59) to KHR 51,540,720 (USD 12,540.32), with 37% living below the poverty line, with a daily income of KHR 4075 (USD 0.99) per capita for the lower income and KHR 70,604 (USD 17.17) per capita for the higher income.
Table 7 presents the education levels of the household head of the second child of NS families. NS.DK families had low education levels, with the highest being secondary school, due to the lack of schools during the war. Despite this, they place great importance on their children’s education as a means of improving their families’ futures.
NS.OT families earned between KHR 3,346,800 (USD 814.3) and KHR 55,780,000 (USD 13,571.78) annually, with per capita incomes ranging from KHR 2445 (USD 0.59) to KHR 50,941 (USD 12.39). Approximately 71% of NS.OT families lived above the poverty line.
Although, like NS.DK families, NS.OT families prioritized education, financial constraints, poor road accessibility, and long distances to school made it challenging for them to send their children to school. For a comparison of landholdings per family and their annual incomes, see Figure 4.

3.4.3. YG Family Livelihoods

According to the Kruskal–Wallis test, the YG.DK and YG.OT families had significant LA, Ch, and Cf values, with p-values of 0.026, 0.001, and 0.023, respectively (Table 6). YG.DK families have better livelihood assets than those living in OT (Figure 2, right panel). The heads of the YG.DK and YG.OT families were aged between 23 and 53 years, with an average of 34 years. YG.DK families possessed higher education levels, with more children acquiring education, which enhanced their chances of university attendance. In contrast, YG.OT families had lower education levels and less participation in education (Table 8).
YG.DK families owned lands between 0.04 ha to 27 ha for agricultural or residential purposes, varying by age and land transfer. Their annual income was between KHR 1,673,400.00 (USD 407.15) and KHR 167,340,000.00 (USD 40,715.33). Approximately 20% of the population subgroups earned below the poverty line, with daily incomes of KHR 2292 (USD 0.56) and KHR 229,233 (USD 55.77) per person.
YG.OT families earned between KHR 5,912,680.00 (USD 1438.61) to KHR 100,404,000.00 (USD 24,429.2) annually. Their daily incomes were between KHR 8100 (USD 1.97) and KHR 137,540 (USD 33.46). About 14% of the villagers were below the poverty line.

4. Discussion

Agriculture is the primary source of livelihood in this region, supporting diversified agricultural practices and eradicating poverty. Old settlers have better access to land, which they have expanded for commercialization. New settlers seek land to improve their livelihood. The commercialization of farms, e.g., large cassava farms in this study location, could help sustain the livelihoods of the poor by providing job opportunities [56] and can potentially eradicate poverty, but it is a key factor for land change drivers [7,8,57].
Land is crucial for livelihood improvement and future prospects, particularly for the younger generations. Commercial agriculture has long been a key source of income for locals, enabling the modernization of farming and family support. Locals use income to gain better access to media, such as TV, radio, smartphones, and the Internet, for opportunities to adopt modern farming practices [58]. This connectivity also supports small and medium enterprises in local agricultural markets [59] and makes local decisions on education as a long-term investment for the younger generation. See Appendix A for details on physical capital.
Land resources are becoming scarce owing to population pressure and agricultural expansion for commercialization. For example, in DK, the population surged from 295 villagers in 1998 [32] to 1491 in 2008 [33] and 1480 in 2023, limiting the land resources that the villagers have transformed into commercial farms. Consequently, the Roneam Daun Sam Wildlife Sanctuary, initially covering 178,000 ha, was revoked in 2018 in this region due to population pressure and agricultural expansion [60]. Thus, land is already in short supply, limiting accessibility. NS families, who had late access, are mostly becoming landless agricultural workers because of land resource limitations.
Commercialized agriculture has been conducted by local people, providing a general annual income that is used to modernize agricultural activities and enhance their livelihoods. This mechanism can help diversify careers within the livelihood structure, which is a strategy based on agricultural commercialization, to enhance overall livelihood profiles (Table 9). As locals engage in global economic trends, they face market uncertainties [61].
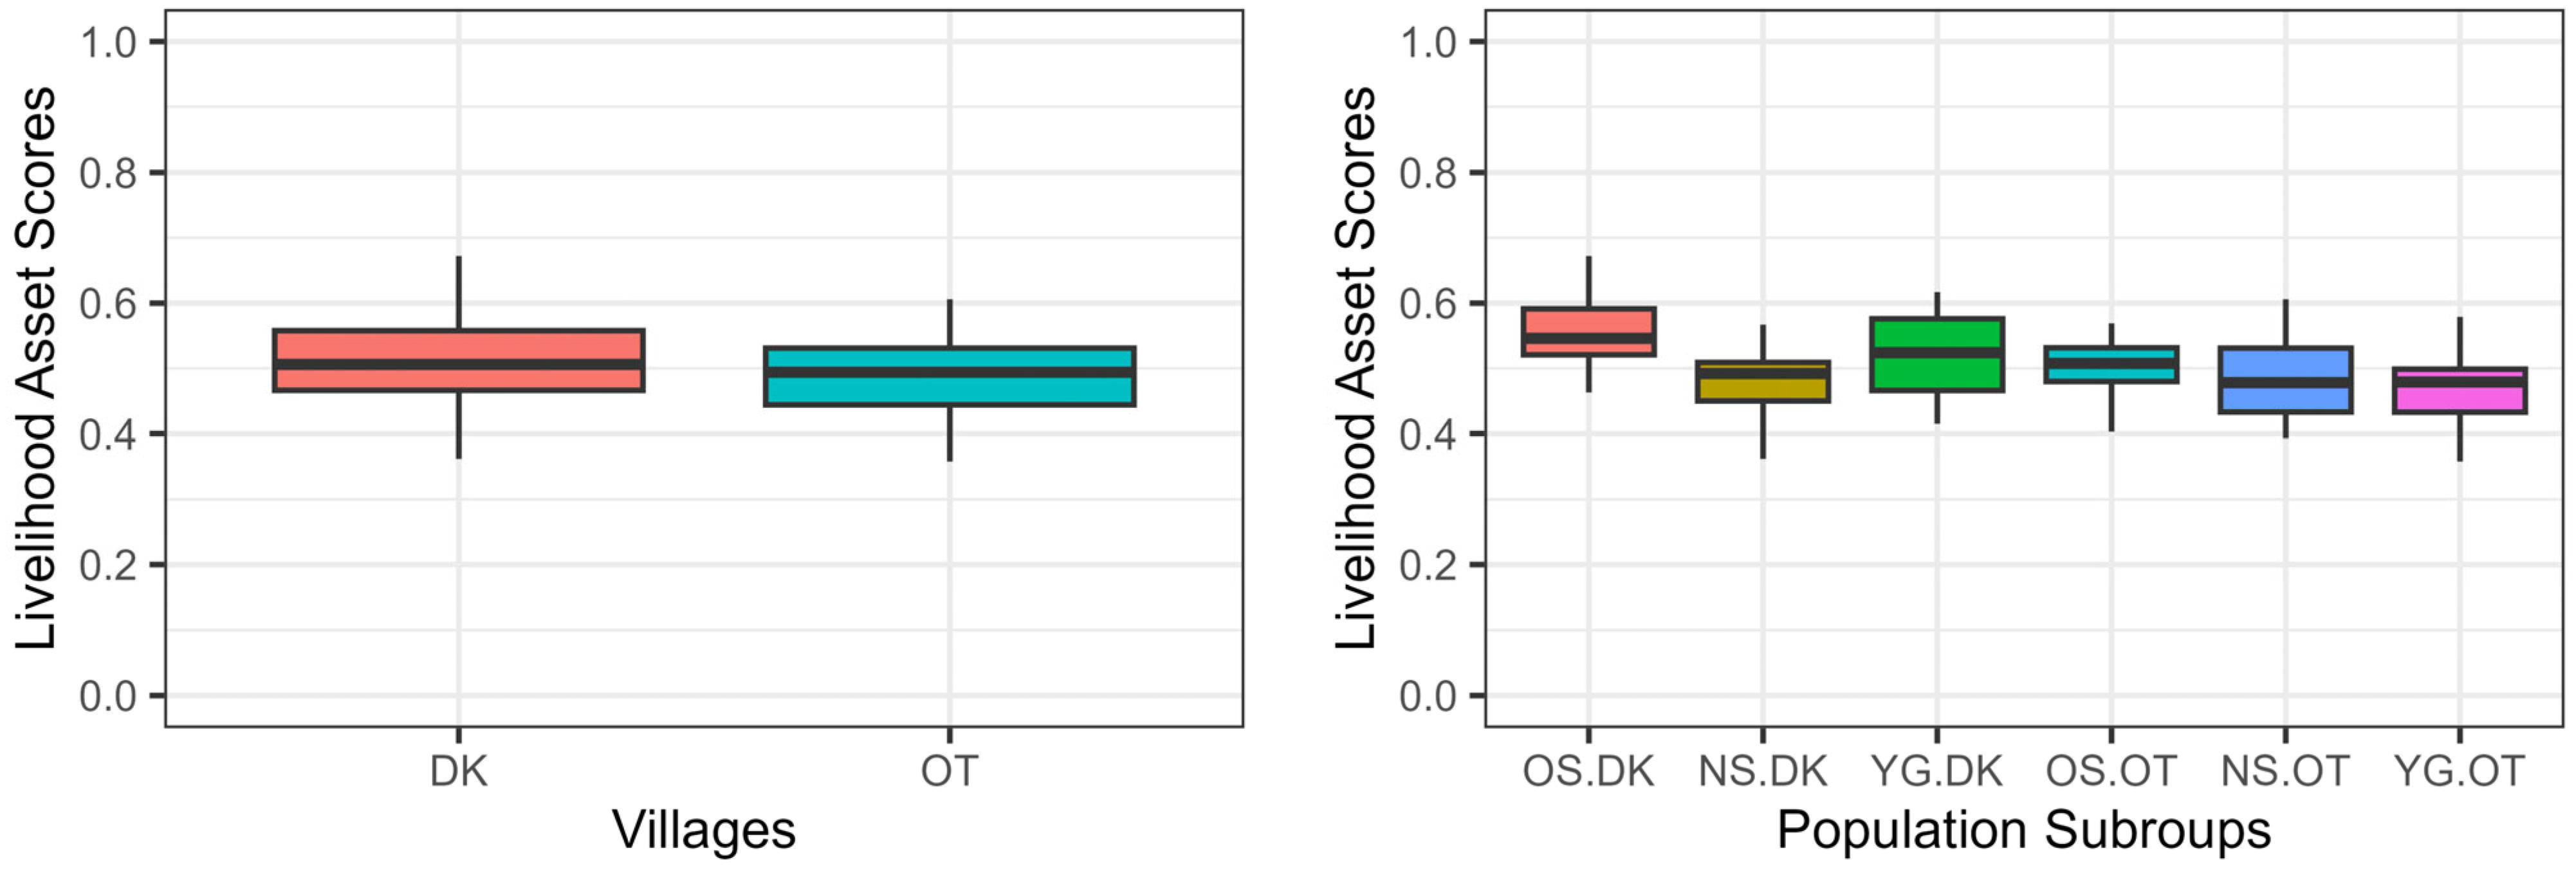
In this study, we analyzed local livelihoods at two levels. At the village level, we found that DK villagers have a livelihood assets score ranging from 0.32 to 0.73, and OT villagers have a livelihood assets score between 0.33 and 0.62 (Table 5). The livelihood asset score ranges from zero (worse) to one (excellent). About 46% of DK villagers have a livelihood asset score below 0.5, compared to 53% of OT villagers (See Figure 5, left).
Considering the population subgroups, livelihood measurements indicate vulnerability groups; 14% of OS.DK families scored lower than 0.5, compared to 60% of NS.DK, 44% of YG.DK, 33% of OS.OT, 58.82% of NS.OT, and 71.43% of YG.OT families. Therefore, YG.OT families were the most vulnerable group, followed by NS.DK and NS.OT families (Figure 5, right panel).
Accessing the livelihoods of population subgroups can enhance our understanding of subgroup vulnerability. A Sustainable Livelihood Framework can effectively examine local livelihood conditions [14]. Focusing solely on daily income reveals that a significant portion of the population aged 15–64 years is below the poverty line in Equation (5) [47]. Using the livelihood pentagon from the scoring methods for measurement and evaluation [11] will provide clearer information about local livelihoods and help identify vulnerable groups.
The estimated daily income of the working-age population is similar to the Cambodian national poverty line reported by the World Bank in 2022. In general, the population living in poverty is 17% less than the national poverty line of 24% on plateaus, 23% in the mountains, and 23% in rural areas, on average [51]. By comparing the sample size of each village, the study found that 28% of DK villagers are living below the poverty line, compared to 43% of OT villagers. Considering the working-age population (16–64 years old), the poor are 24% in DK and 29% in OT. OT villagers mostly have lower incomes because this village is farther and more remote than DK, where development projects, such as roads, schools, and markets, are easier for villagers.
Education plays a vital role in the development of livelihoods. Microeconomic analyses indicate that education positively affects household distribution and overall livelihood improvement [40]. Thus, villagers, especially OS families with higher education levels, prioritize expanding agricultural land to enhance their economic status and secure their children’s education pathways.
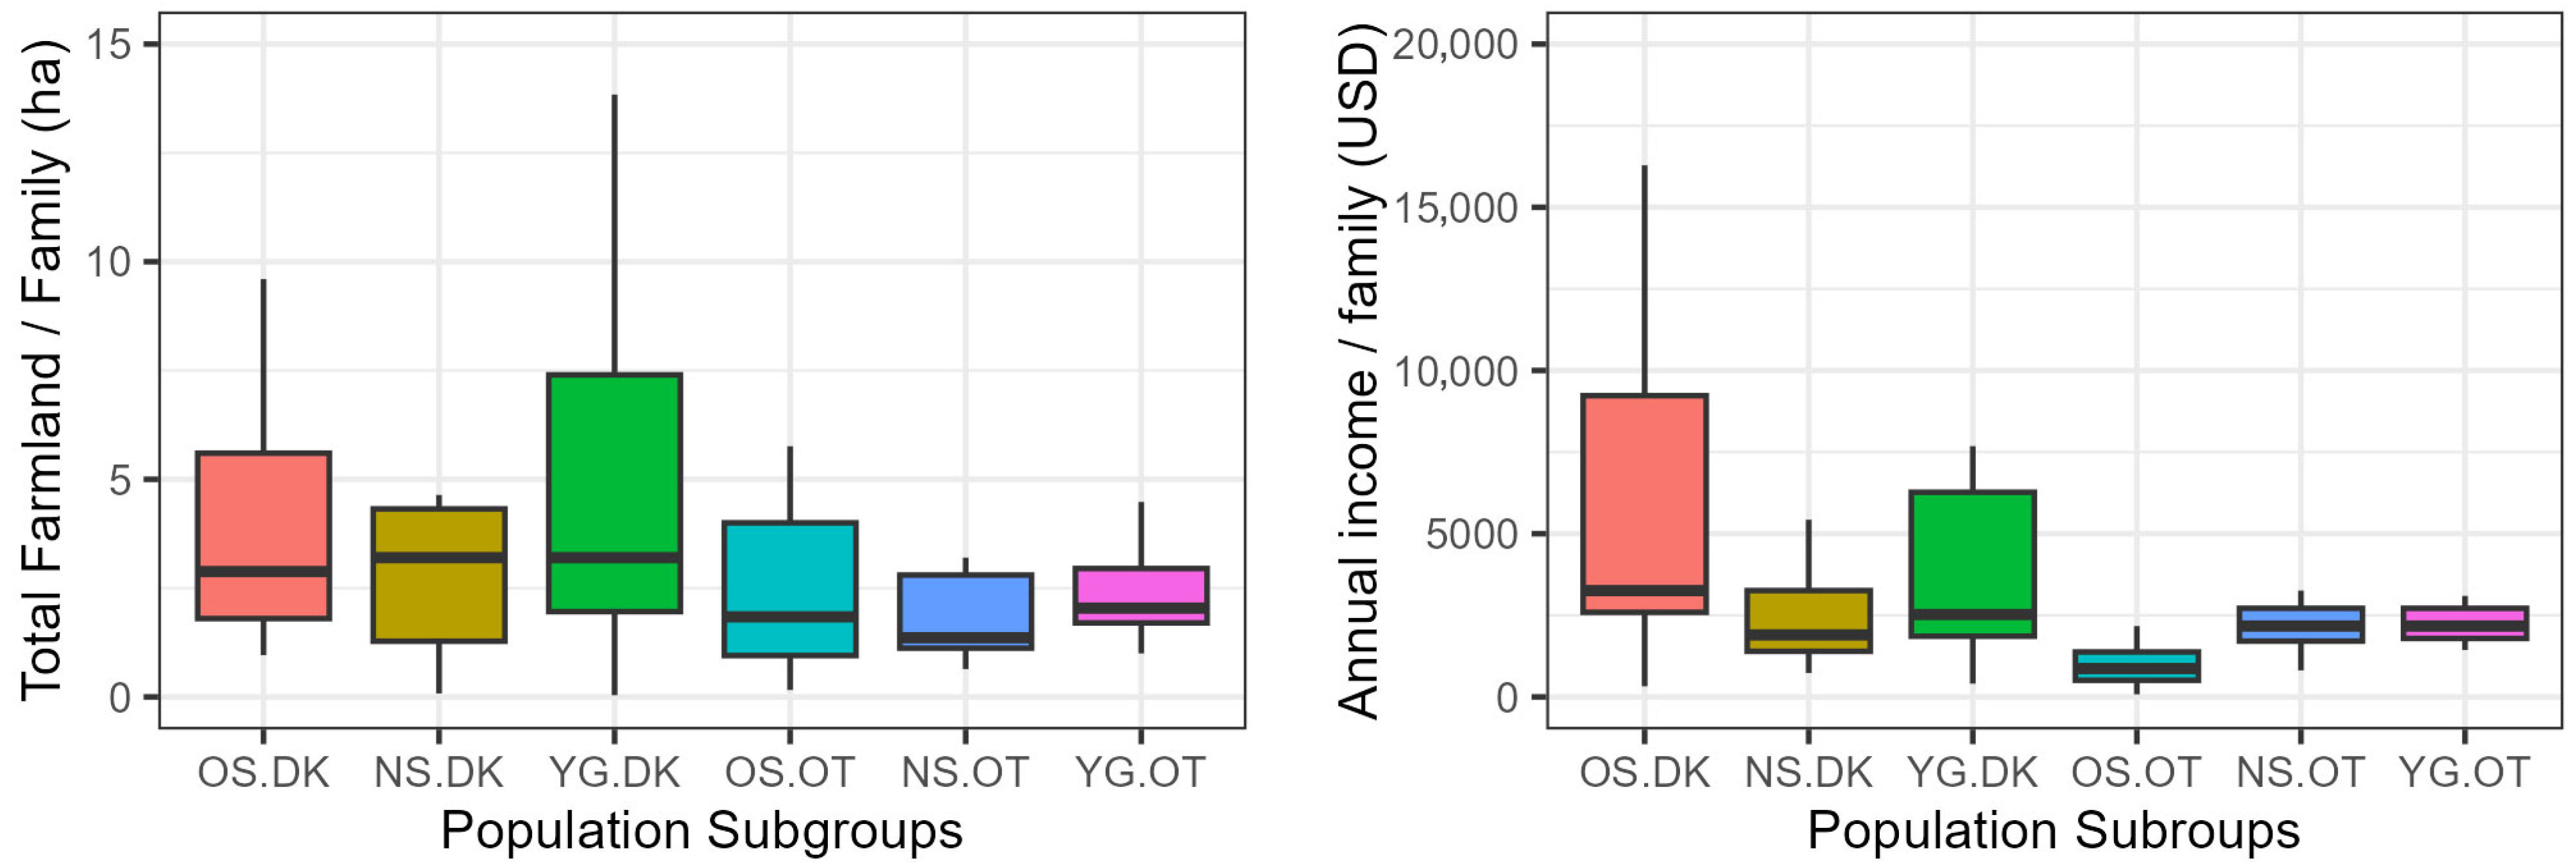
Young education influences agricultural livelihood, which is often passed down through generations. According to the livelihood score in Table 4, the data indicate that YG has human capital scores of 0.47–0.55 in OT and DK, with LA scores of 0.47 and 0.53, which are statistically significant. Within the low livelihood score, we observed significant differences for Ch and Cf (Table 6), which varied by education levels, ranging from illiterate to university (Table 8), and their annual income, on average, was USD 4906.90, which they earned from agricultural lands of 5.4 ha. Approximately 36% of YG families with education levels ranging from illiterate to secondary school are wage laborers. In practice, OS families acquired land resources to sustain their livelihoods and generate income to support their living and YG’s education, hoping their children will gain better knowledge to secure and improve job opportunities. By contrast, when YG is unable to access the education system, they remain dependent on limited land resources and face insecure job opportunities for their livelihood.
This study used cross-sectional data, which could help identify local vulnerabilities and improve the understanding of the livelihoods of local people in Northwestern Cambodia. However, it has a limitation related to its cross-sectional study design to collect in situ information at a specific point in time rather than providing time-series data. As noted by Kemodel 2018, it requires repeated findings to capture the livelihood dynamic [62]. In practice, cross-sectional data, adopted by scholars globally, allow us to explore status through providing evidence that offers relevant insights to improve understanding of rural conditions [63]. Thus, the cross-sectional data used in this study necessarily open a window for further investigation.
On the positive side, the study allows for a quick examination of rural livelihood conditions, highlighting the important of understanding livelihood dynamic process involved Ellis (1999) [64], whose approach can inform future study on rural livelihood, similar to the working efforts of Pritchard et al. (2019) who used the data from cross-sectional study to investigate non-farm livelihoods for securing and diversifying food and dietary options for rural Myanmar [65].
We adopted non-parametric data analysis because the collected data are ordinal and do not assume normal distribution, involving population subgroup comparison. The ordinal response from the household survey consists of perception. However, we score those responses. In this case, non-parametric methods, such as the Kruskal–Wallis test, could provide a statistically robust method to assess significant differences because the test employs ordinal data with three or more samples using the chi-square test, which is flexible with respect to the level of measurement of the test variable [66,67].
In general, non-parametric methods have been adopted by various scholars, especially in the fields of livelihood studies. The test is appropriately adopted to compare multiple independent villager groups to assess significant differences in ordinal data regardless of normal distribution [68]. Its result can be interpreted with a significance threshold of p < 0.05 to indicate the statistically significant [68,69] because the marginal error is not explicitly considered. High attention is paid to the mean rank, and neither the trend nor the sample effect was discussed [70].

5. Conclusions

Cambodia’s economy has been transformed since the end of the Civil War, with land becoming a crucial resource for improving agricultural livelihoods. The locals have shifted from subsistence to commercial agriculture. This study adopted a sustainable livelihood framework and examined population group vulnerability by analyzing physical, natural, human, social, and financial capital to identify three population subgroups in the study location: the OS, NS, and YG families. To examine local livelihoods, this study separately analyzed in situ information in two stages: village-level and population subgroup evaluation.
Notably, the analysis results indicated insignificant differences between the DK and OT but significant differences among the subgroups of the population. At the village level, human and financial capital are significantly different, resulting in the DK villagers’ livelihood assets being better than those of the OT villagers. Hence, Hypothesis 1 was rejected because the livelihood assets, in general, were not different. However, the model has the potential to evaluate livelihood capital.
The sub-population groups, NS and YG, are facing a vulnerability that requires intervention because of the low nature of the lands, and a formal education level would reduce future uncertainty. Physical, human, and financial capital are key differentiating factors when examining the subpopulation groups. This is because OS.DK benefits from land acquired after the war, better enhancing its capital than OS.OT. NS families face socio-economic challenges, often becoming laborers rather than landowners due to “first come, first served.” They are among the most vulnerable, and many are landless agrarian workers.
The YG families, who either inherited or purchased land after marriage, demonstrate varying characteristics based on education levels and opportunities. YG.DK had higher education levels than YG.OT, reflecting the importance of education in overcoming limited land resources. Financial capital significantly influences physical capital. Therefore, there is an urgent need to enhance both human and financial capital for the NS and YG families. Thus, Hypothesis 2 was accepted.
In conclusion, land is essential to improve livelihoods in rural Cambodia. OS families are relatively secure and are facing aging issues, but the NS.DK and NS.OT families are considered vulnerable groups that require attention, while YG.DK and YG.OT families are facing an uncertain future, with education being necessary for the long-term sustenance of their livelihoods and those of future generations.
This method can be applied to examine local livelihoods in a specific context, offering insights into livelihood assets, weaknesses, and vulnerability groups. For future investigations, studies on livelihood trajectory would need to improve the understanding of how local people escape from, or get trapped in, poverty after the long decades of the post-civil war period. The exploration will help identify the drivers that contribute to enhancing rural livelihood sustainability, with efforts to reduce inequality.

Author Contributions

Conceptualization, D.C. and S.H.; data curation and analysis, D.C.; investigation, D.C., S.H., S.S., S.P., C.Y., S.K., N.S., S.N., S.C., T.C., P.M. and H.S.; supervision, S.H. and H.S.; data validation, D.C., S.H., L.H., S.P. and H.S.; proofing, S.H. and H.S.; writing original draft, D.C.; Writing—review and editing, S.H., H.S., S.P. and L.H.; Administration, C.C., S.E. and L.L. All authors have read and agreed to the published version of the manuscript.

Funding

This work is funded by the Royal Government of Cambodia to the Faculty of Land Management and Land Administration, the Royal University of Agriculture, the Ministry of Agriculture, Forestry and Fisheries, through the Higher Education Improvement Project of the General Department of Higher Education, the Ministry of Education, Youth, and Sport, under the World Bank Credit No. 6221-KH.

Institutional Review Board Statement

The protocol of the current study was approved by the Royal University of Agriculture on 6 January 2023.

Informed Consent Statement

Informed consent was obtained from all subjects involved in the study.

Data Availability Statement

The interviewed data is available on request from the corresponding authors, D.C. and S.H.

Acknowledgments

We are grateful to Division of Research and Innovation (DRI), Royal University of Agriculture, the Graduate School of Agriculture (GSA) and the Graduate School of Global Environmental Studies (GSGES), Kyoto University, Japan. Izuru Saizen from the Regional Planning Laboratory, Higuchi from the Laboratory, and Shinya Funakawa from the Soil Science Laboratory, who provided hospitality for long-term collaboration.

Conflicts of Interest

The authors declare no conflict of interest.

Abbreviations

The following abbreviations are used in this manuscript:
KHRKhmer Reil
DKDei Kraham Village
OTOu Toek Thla Village
OSOld settler
NSNew settler
YGYoung generation of OS and NS
OS.DKOld settler families living in DK Village
NS.DKNew settler families living in DK Village
YG.DKNew generation families or youth generation families living in DK Village
OS.OTOld settler families living in the OT Village
NS.OTNew settler families living in the OT Village
YG.OTNew generation families or youth generation families living in the OT Village
Formal EducationA structured system of learning, such as schools, colleges, and universities. Cambodian formal education is elementary school (6 years), secondary school (3 years), and high school (3 years) before entering university.
UniversityThe Cambodian structure of levels in the Cambodia Qualification Framework classifies universities into two categories: Technical and Vocational Education and Training and Higher Education, which adopts a credit system.

Appendix A

Table A1. Detailed Physical Capital in Percentage.
IndicatorsMaterials or ToolsDK VillageOT Village
OSNSYGOSNSYG
HH Fixed assetFarmlands10094.2910010088.2478.57
House10094.299610094.1285.71
House with road access10097.1496100100100
Farmlands with road access10025.715655.5652.9464.29
Irrigation42.8614.293211.1117.6521.43
Durable goodsPower tillage57.142.861616.675.887.14
Tractors42.865.71205.565.887.14
Harvesters7.1404000
Power generator14.2914.29827.785.8821.43
Motors92.8682.868483.3382.3571.43
Cars35.715.712405.8814.29
Pumps85.7131.435672.2241.1850
Sprayers85.7134.297294.4464.7164.29
Disc plows35.715.71325.565.887.14
TVs10045.715277.7841.1828.57
PCs008000
Freezers85.718.57125.5611.767.14
Washing28.5704007.14
Mobiles10094.2910088.8910085.71
HH Energy structureGasoline92.8685.719685.7170.5983.33
Battery5045.71605064.7155.56
Grid10074.296857.1458.8266.67
Fuel92.8685.719685.7182.3588.89
Solar21.4328.574085.7182.3577.78

References

  1. Chhay, P.; Soeun, P.; Sambath, N. Policy Paper: The Success of Win-Win Policy and Peace Building Process in Cambodia. Cambodia J. Basic Appl. Res. 2022, 4, 82–90. [Google Scholar]
  2. Sok, S. Cambodia Enters the WTO: Lessons Learned for Least Developed Countries; Asian Development Bank Institute: Tokyo, Japan, 2005. [Google Scholar]
  3. Sok, K. Dynamics of Rural Household Activities and Poverty at Diversified Agro-Ecosystems of Tonle Sap Lake in Battambang Province, Cambodia; Institut National d’Etudes Supérieures Agronomiques de Montpellier: Montpellier, France, 2023. [Google Scholar]
  4. Fox, J.; McMahon, D.; Poffenberger, M.; Vogler, J. Land for My Grandchildren: Land-Use and Tenure Change In Ratanakiri: 1989–2007; CFi&EWC: Phnom Penh, Cambodia, 2008. [Google Scholar]
  5. Hor, S.; Saizen, I.; Tsutsumida, N.; Watanabe, T.; Kobayashi, S. The Impact of Agricultural Expansion on Forest Cover in Ratanakiri Province, Cambodia. J. Agric. Sci. 2014, 6, 46–59. [Google Scholar] [CrossRef]
  6. Hor, S.; Mizuno, K.; Kobayashi, S.; Watanabe, T. The Traditional Practice of Swidden Cultivation in the Djarai Ethnic Communities of Northeastern Cambodia. J. Jpn. Agric. Syst. Soc. 2014, 30, 131–141. [Google Scholar] [CrossRef]
  7. Kong, R.; Diepart, J.C.; Castella, J.C.; Lestrelin, G.; Tivet, F.; Belmain, E.; Bégué, A. Understanding the Drivers of Deforestation and Agricultural Transformations in the Northwestern Uplands of Cambodia. Appl. Geogr. 2019, 102, 84–98. [Google Scholar] [CrossRef]
  8. Sourn, T.; Pok, S.; Chou, P.; Nut, N.; Theng, D.; Rath, P.; Reyes, M.R.; Prasad, P.V.V. Evaluation of Land Use and Land Cover Change and Its Drivers in Battambang Province, Cambodia from 1998 to 2018. Sustainability 2021, 13, 11170. [Google Scholar] [CrossRef]
  9. Leisz, S.J.; Yasuyuki, K.; Fox, J.; Masayuki, Y.; Rambo, T.A. Land Use Changes in the Uplands of Southeast Asia: Proximate and Distant Causes. Southeast Asian Stud. 2009, 47, 237–243. [Google Scholar]
  10. Lewis, W.A. Economic Development with Unlimited Supplies of Labour. Manch. Sch. 1954, 22, 139–191. [Google Scholar] [CrossRef]
  11. Chen, H.; Zhu, T.; Krott, M.; Calvo, J.F.; Ganesh, S.P.; Makoto, I. Measurement and Evaluation of Livelihood Assets in Sustainable Forest Commons Governance. Land Use Policy 2013, 30, 908–914. [Google Scholar] [CrossRef]
  12. Kamwi, J.M.; Chirwa, P.W.C.; Manda, S.O.M.; Graz, P.F.; Kätsch, C. Livelihoods, Land Use and Land Cover Change in the Zambezi Region, Namibia. Popul. Environ. 2015, 37, 207–230. [Google Scholar] [CrossRef]
  13. Mahdi; Shivakoti, G.P.; Schmidt-Vogt, D. Livelihood Change and Livelihood Sustainability in the Uplands of Lembang Subwatershed, West Sumatra, Indonesia, in a Changing Natural Resource Management Context. Environ. Manag. 2009, 43, 84–99. [Google Scholar] [CrossRef] [PubMed]
  14. Chambers, R.; Conway, G.R. Sustainable Rural Livelihood: Practical Concepts for the 21st Century; Institute of Development Studies: Brighton, UK, 1991; Volume 72. [Google Scholar]
  15. Reardon, T.; Taylor, J.E. Agroclimatic Shock, Income Inequality, and Poverty: Evidence from Burkina Faso. World Dev. 1996, 24, 901–914. [Google Scholar] [CrossRef]
  16. Franco, I.B.; Minnery, J. SDG 1 No Poverty. In Actioning the Global Goals for Local Impact; Springer: Singapore, 2020; pp. 5–21. [Google Scholar]
  17. Jiao, X.; Pouliot, M.; Walelign, S.Z. Livelihood Strategies and Dynamics in Rural Cambodia. World Dev. 2017, 97, 266–278. [Google Scholar] [CrossRef]
  18. Nguyen, T.T.; Do, T.L.; Bühler, D.; Hartje, R.; Grote, U. Rural Livelihoods and Environmental Resource Dependence in Cambodia. Ecol. Econ. 2015, 120, 282–295. [Google Scholar] [CrossRef]
  19. Lonn, P.; Mizoue, N.; Ota, T.; Kajisa, T.; Yoshida, S. Evaluating the Contribution of Community-Based Ecotourism (CBET) to Household Income and Livelihood Changes: A Case Study of the Chambok CBET Program in Cambodia. Ecol. Econ. 2018, 151, 62–69. [Google Scholar] [CrossRef]
  20. Felkner, J.S.; Lee, H.; Shaikh, S.; Kolata, A.; Binford, M. The Interrelated Impacts of Credit Access, Market Access and Forest Proximity on Livelihood Strategies in Cambodia. World Dev. 2022, 155, 105795. [Google Scholar] [CrossRef]
  21. Hought, J.; Birch-Thomsen, T.; Petersen, J.; de Neergaard, A.; Oelofse, M. Biofuels, Land Use Change and Smallholder Livelihoods: A Case Study from Banteay Chhmar, Cambodia. Appl. Geogr. 2012, 34, 525–532. [Google Scholar] [CrossRef]
  22. Manion, H.K. International Social Problems: A Systems Perspective. In International Encyclopedia of the Social & Behavioral Sciences: Second Edition; Elsevier B.V.: Amsterdam, The Netherlands, 2015; Volume 12, pp. 542–549. [Google Scholar] [CrossRef]
  23. Scoones, I. Sustainable Rural Livelihoods: A Framework for Analysis; Institute of Development Studies: Brighton, UK, 1998; Volume 72. [Google Scholar]
  24. Department for International Development (DFID). Sustainable Livelihoods Guidance Sheets; DFID: London, UK, 1999.
  25. Chambers, R. Rural Development Putting the Last First; Pearson Education Limited: London, UK, 1983; Volume 60, ISBN 9780582644434. [Google Scholar]
  26. United Nations Development Programme (UNDP). Guidance Note: Application of the Sustainable Livelihoods Framework in Development Project; UNDP: New York, NY, USA, 2017. [Google Scholar]
  27. Carney, D. Sustainable Livelihoods Approaches: Progress and Possibilities for Change. Secretary 2003, 2008, 67. [Google Scholar]
  28. Blackmore, I.; Iannotti, L.; Rivera, C.; Waters, W.F.; Lesorogol, C. A Formative Assessment of Vulnerability and Implications for Enhancing Livelihood Sustainability in Indigenous Communities in the Andes of Ecuador. J. Rural. Stud. 2023, 97, 416–427. [Google Scholar] [CrossRef]
  29. de Walque, D. The Socio-Demographic Legacy of the Khmer Rouge Period in Cambodia. Popul. Stud. 2006, 60, 223–231. [Google Scholar] [CrossRef] [PubMed]
  30. Livingstone, I. Development Planning in a Re-Emergent Cambodia: The First Socio-economic Development Plan, 1996–2000. J. Asia Pac. Econ. 1998, 3, 207–222. [Google Scholar] [CrossRef]
  31. Han, S.S.; Lim, Y. Battambang City, Cambodia: From a Small Colonial Settlement to an Emerging Regional Centre. Cities 2019, 87, 205–220. [Google Scholar] [CrossRef]
  32. National Institute of Statistics (NIS). Cambodian Population Census 1998; National Institute of Statistics, Ministry of Planning: Phnom Penh, Cambodia, 1998.
  33. National Institute of Statistics (NIS). Cambodian Population Census 2008; National Institute of Statistics, Ministry of Planning: Phnom Penh, Cambodia, 2008.
  34. Cochran, W.G. Sampling Techniques, 3rd ed.; Wiley: Hoboken, NJ, USA, 1977; ISBN 978-0-471-16240-7. [Google Scholar]
  35. Yamane, T. Statistics: An Introductory Analysis; Harper & Row: New York, NY, USA, 1967. [Google Scholar]
  36. Bryman, A. Social Research Methods, 5th ed.; Oxford University Press: Oxford, UK, 2016. [Google Scholar]
  37. Trung Thanh, H.; Tschakert, P.; Hipsey, M.R. Moving up or Going under? Differential Livelihood Trajectories in Coastal Communities in Vietnam. World Dev. 2021, 138, 105219. [Google Scholar] [CrossRef]
  38. Natarajan, N.; Newsham, A.; Rigg, J.; Suhardiman, D. A Sustainable Livelihoods Framework for the 21st Century. World Dev. 2022, 155, 105898. [Google Scholar] [CrossRef]
  39. Ravallion, M. Poverty and Inequality Measures. In The Economics of Poverty; Ravallion, M., Ed.; Oxford University Press: New York, NY, USA, 2016; pp. 219–289. ISBN 9780190212766. [Google Scholar]
  40. Tran, T.A.; Tran, T.Q.; Tran, N.T.; Nguyen, H.T. The Role of Education in the Livelihood of Households in the Northwest Region, Vietnam. Educ. Res. Policy Pract. 2020, 19, 63–88. [Google Scholar] [CrossRef]
  41. Bhatti, M.A.; Godfrey, S.S.; Ip, R.H.L.; Kachiwala, C.; Hovdhaugen, H.; Banda, L.J.; Limuwa, M.; Wynn, P.C.; Ådnøy, T.; Eik, L.O. Diversity of Sources of Income for Smallholder Farming Communities in Malawi: Importance for Improved Livelihood. Sustainability 2021, 13, 9599. [Google Scholar] [CrossRef]
  42. Ayana, G.F.; Megento, T.L.; Kussa, F.G. The Extent of Livelihood Diversification on the Determinants of Livelihood Diversification in Assosa Wereda, Western Ethiopia. GeoJournal 2022, 87, 2525–2549. [Google Scholar] [CrossRef]
  43. Feldstein, M.; Liebman, J.B. Chapter 32 Social Security. In Handbook of Public Economics; Auerbach, A.J., Feldstein, M., Eds.; Elsevier: Amsterdam, The Netherlands, 2002; pp. 2245–2324. [Google Scholar]
  44. Wijers, G.D.M. Navigating a River by Its Bends: A Study on Transnational Social Networks as Resources for the Transformation of Cambodia. Ethn. Racial Stud. 2014, 37, 1526–1545. [Google Scholar] [CrossRef]
  45. Kobayashi, S. Cultural Innovation in the Face of Modernization: A Study of Emerging Community-Based Care in Rural Cambodia. South East Asia Res. 2020, 28, 231–247. [Google Scholar] [CrossRef]
  46. Cook, B.R.; Satizábal, P.; Touch, V.; McGregor, A.; Diepart, J.-C.; Utomo, A.; Harrigan, N.; McKinnon, K.; Srean, P.; Tran, T.A.; et al. Historical Agrarian Change and Its Connections to Contemporary Agricultural Extension in Northwest Cambodia. Crit. Asian Stud. 2024, 56, 1–28. [Google Scholar] [CrossRef]
  47. US Census Bureau How the Census Bureau Measures Poverty. Available online: https://www.census.gov/topics/income-poverty/poverty/guidance/poverty-measures.html (accessed on 5 January 2024).
  48. Haughton, J.; Khandker, S.R. Handbook on Poverty and Inequality; The World Bank: Washington, DC, USA, 2009; ISBN 978-0-8213-7613-3. [Google Scholar]
  49. Li, T.; Singh, R.K.; Cui, L.; Xu, Z.; Liu, H.; Fava, F.; Kumar, S.; Song, X.; Tang, L.; Wang, Y.; et al. Navigating the Landscape of Global Sustainable Livelihood Research: Past Insights and Future Trajectory. Environ. Sci. Pollut. Res. 2023, 30, 103291–103312. [Google Scholar] [CrossRef]
  50. Mphande, F.A. Rural Livelihood. In Infectious Diseases and Rural Livelihood in Developing Countries; Springer Singapore: Singapore, 2016; pp. 17–34. [Google Scholar]
  51. Karamba, W.; Tong, K.; Salcher, I. Cambodia Poverty Assessment Toward A More Inclusive and Resilient Cambodia; The World Bank Group: Phnom Penh, Cambodia, 2022. [Google Scholar]
  52. National Bank of Cambodia (NBC). Annual Report 2023; NBC: Phnom Penh, Cambodia, 2023; Volume 5.
  53. Wickham, H.; François, R.; Henry, L.; Müller, K.; Vaughan, D. A Grammar of Data Manipulation “Dplyr” 2023. Available online: https://dplyr.tidyverse.org/ (accessed on 13 July 2025).
  54. Teetor, P. R Cookbook. Loukides, M., Ed.; O’Reilly Media: Sebastopol, CA, USA, 2011; ISBN 9780596809157. [Google Scholar]
  55. Wickham, H.; Chang, W.; Henry, L.; Pedersen, T.L.; Takahashi, K.; Wilke, C.; Woo, K.; Yutani, H.; Dunnington, D.; van den Brand, T. Create Elegant Data Visualisations Using the Grammar of Graphics 2024, 354. Available online: https://ggplot2.tidyverse.org/reference/ggplot2-package.html (accessed on 13 July 2025).
  56. Giger, M.; Reys, A.; Anseeuw, W.; Mutea, E.; Kiteme, B. Smallholders’ Livelihoods in the Presence of Commercial Farms in Central Kenya. J. Rural. Stud. 2022, 96, 343–357. [Google Scholar] [CrossRef]
  57. Hor, S. The Transition of Farming Systems Causing Forest Degradation in Ratanakiri Province, Cambodia; Kyoto University: Kyoto, Japan, 2014. [Google Scholar]
  58. Asuman, M.K.A.; Moodley, S. Livelihood Improvement Through Participatory Mass Communications: A Study on Community Radio and the Lives of Women in Northern Ghana. In Indigenous African Language Media; Springer Nature Singapore: Singapore, 2023; pp. 381–399. [Google Scholar]
  59. Wicaksono, T.; Nugroho, A.D.; Lakner, Z.; Dunay, A.; Illés, C.B. Word of Mouth, Digital Media, and Open Innovation at the Agricultural SMEs. J. Open Innov. Technol. Mark. Complex. 2021, 7, 91. [Google Scholar] [CrossRef]
  60. RGC Revocation Snoul Wildlife Sanctuary in Kratie Province and Roneam Daun Sam Wildlife Sanctuary in Battambang Province; Royal Government: Phnom Pen, Cambodia, 2018.
  61. Nicod, T.; Bathfield, B.; Bosc, P.-M.; Promkhambut, A.; Duangta, K.; Chambon, B. Households’ Livelihood Strategies Facing Market Uncertainties: How Did Thai Farmers Adapt to a Rubber Price Drop? Agric. Syst. 2020, 182, 102846. [Google Scholar] [CrossRef]
  62. Kesmodel, U.S. Cross-Sectional Studies—What Are They Good For? Acta Obstet. Gynecol. Scand. 2018, 97, 388–393. [Google Scholar] [CrossRef]
  63. Majbauddin, A.; Otani, S.; Tsunekawa, A.; Haregeweyn, N.; Abeje, M.T.; Nigussie, Z.; Alam, I.; Qing, Q.; Masumoto, T.; Kurozawa, Y. The Influence of Income and Livelihood Diversification on Health-Related Quality of Life in Rural Ethiopia. Int. J. Environ. Res. Public Health 2020, 17, 2709. [Google Scholar] [CrossRef]
  64. Ellis, F. Rural Livelihood Diversity in Developing Countries: Evidence and Policy Implications; Overseas Development Institute: London, UK, 1999. [Google Scholar]
  65. Pritchard, B.; Rammohan, A.; Vicol, M. The Importance of Non-Farm Livelihoods for Household Food Security and Dietary Diversity in Rural Myanmar. J. Rural. Stud. 2019, 67, 89–100. [Google Scholar] [CrossRef]
  66. Argyrous, G. Statistics for Social Research; Springer Nature: Dordrecht, The Netherlands, 1997. [Google Scholar] [CrossRef]
  67. Warne, R.T. Statistics for the Social Sciences; Cambridge University Press: Cambridge, UK, 2017. [Google Scholar] [CrossRef]
  68. Baffoe, G.; Matsuda, H. An Empirical Assessment of Rural Livelihood Assets from Gender Perspective: Evidence from Ghana. Sustain. Sci. 2018, 13, 815–828. [Google Scholar] [CrossRef]
  69. Ulukan, D.; Bergkvist, G.; Lana, M.; Fasse, A.; Mager, G.; Öborn, I.; Chopin, P. Combining Sustainable Livelihood and Farm Sustainability Approaches to Identify Relevant Intensification Options: Implications for Households with Crop-Based and Gathering-Based Livelihoods in Tanzania. Ecol. Indic. 2022, 144, 109518. [Google Scholar] [CrossRef]
  70. Beltrán-Tolosa, L.M.; Cruz-Garcia, G.S.; Ocampo, J.; Pradhan, P.; Quintero, M. Rural Livelihood Diversification Is Associated with Lower Vulnerability to Climate Change in the Andean-Amazon Foothills. PLoS Clim. 2022, 1, e0000051. [Google Scholar] [CrossRef]
Figure 1. Map of the study locations. Ou Toek Thla can be written as Ou Tuek Thla that can be found in some documents.
Sustainability 17 06866 g001
Figure 2. Comparing livelihoods of the villagers living in the two villages.
Sustainability 17 06866 g002
Figure 3. Illustrating the livelihood of OS Families, NS Families, and YG Families living in DK and OT Village. From left to right, the first livelihood pentagon compares OS.DK and OS.OT, NS.DK and NS.OT in the middle, and YG.DK and YG.OT on the right.
Sustainability 17 06866 g003
Figure 4. Boxplot compares HH landholding (left) and HH annual income (right) per family in 2023.
Sustainability 17 06866 g004
Figure 5. Livelihood asset score by villages (left) and population groups (right).
Sustainability 17 06866 g005
Table 1. Number of total families collected during field observation in 2023.
VillagesTotal FamiliesMigrated FamiliesSettled Families
OSNSYGOSNSYGOSNSYG
DK Village601671281337354713093
OT Village4526855252402433
Note: The number of settled families was adopted for sample size estimation because of availability. This data was collected during field observation.
Table 2. Population subgroup categorized and classification summarized.
SubgroupsCharacteristicsMigrated PeriodsBackgroundLand Accessibility Methods
Old Settlers (OS)Former Khmer Rouge SoldiersAfter 1979, they evacuated to this region and settled permanently in the 1990s.Served military 1970–1979; completely retired by 1996Started clearing forest lands in 1993, expanded through family labor.
New Setters (NS)Mostly civilians, some ex-soldiersAccessed/settled 1981–2002 (access for trading daily commodity only)Look for available land resources and job opportunitiesPurchased lands or wage labor to obtain access to land tenure security.
Young Generation (YG)OS and NS childrenBorn 1970–2000 in this regionRooted in the settlement and diverse originsMostly inherited from parents and expected land access, socially integrated.
Table 3. Livelihood assets and capital indicators question types with model usages.
CapitalsIndicatorsQuestions/AnswersMeasurement ModelsReferences
PhysicalHH Fixed AssetsYes/No(1)[11]
HH Durable GoodsYes/No(1)
HH Energy StructureYes/No(1)
NaturalLand and water resourcesYes/No(1)[12,14]
Forest resourcesYes/No(1)[11]
HH EnvironmentRanking (1–3)(2)[39]
HumanFormal educationRanking (1–3)(2)[40]
Education serviceYes/No(1)
Health statusRanking (1–3)(2)[41]
HH Dependency RatioRatio(2)[42]
Social securityYes/No(1)[43]
SocialSocial networkRanking (1–3)(2)[44]
TraditionsRanking (1–3)(1)[44,45]
Community actionsYes/No(1)[46]
FinancialHH annual incomesNum., Ranking(3,4)[47]
HH income sourcesRanking(1)[41]
HH expenditureYes/No(1)[47,48]
Note: Questionnaire design concepts are based on the above references. “Num., ranking” is numeric; ranking 1, 2, and 3 denote good, average, and poor, respectively.
Table 4. Means of livelihood values of the population groups from the study locations.
CapitalsHousehold (HH)
Indicators
DK   ( n v = 74) OT   ( n v = 49)
OS   ( n i = 14) NS   ( n i = 35) YG   ( n i = 25) OS   ( n i = 18) NS   ( n i = 17) YG   ( n i = 14)
IWCVIWCVIWCVIWCVIWCVIWCV
PhysicalHH Fixed assets0.890.720.650.510.760.610.730.610.710.560.70.56
HH Durable goods0.55 0.24 0.35 0.34 0.26 0.27
HH Energy structure0.71 0.64 0.72 0.74 0.72 0.73
NaturalLand and water resources0.720.390.640.370.690.380.670.380.660.370.680.32
Forest resources0.01 0.02 0.03 0.01 0.02 0.01
HH Environment0.44 0.45 0.42 0.46 0.42 0.28
HumanFormal education0.390.640.090.550.150.550.10.530.080.510.10.47
Education service0.6 0.55 0.63 0.61 0.57 0.55
Health status or conditions0.86 0.94 0.88 0.76 0.86 0.76
HH Dependency ratio0.78 0.61 0.52 0.72 0.59 0.45
Social security0.59 0.54 0.6 0.48 0.46 0.49
SocialTraditions (Dhamma)0.810.530.750.470.790.520.860.540.80.520.740.49
Communication0.13 0.01 0.06 0.04 0.04 0.02
Social network0.66 0.64 0.72 0.72 0.72 0.7
FinancialHH Incomes as cash0.780.630.620.550.780.570.420.510.620.540.690.52
HH Income sources0.43 0.19 0.11 0.3 0.24 0.02
HH Expenditure0.52 0.77 0.88 0.61 0.71 0.9
Livelihood Assets by Subgroups 0.58 0.49 0.53 0.51 0.50 0.47
Livelihood Assets by Villages0.52 0.50
Note: DK and OT are Dei Kraham and Toek Thla village, HH = household, IW = indicator weight, and CV = capital value.
Table 5. Data statistics for livelihood assets between DK and OT.
Mean Rank by CapitalsCpCnChCsCfLA
DK Village0.5830.3770.5670.5000.5710.520
OT Village0.5790.3590.5070.5180.5220.497
Descriptive StatisticsNMeanMedianStdevMin.Max.
DK 740.5200.5220.0710.3190.728
OT490.4970.4970.0590.3280.616
Kruskal–Wallis TestChi-SquareDfp-Value
Cp0.02910.864
Cn1.43510.231
Ch9.89210.001
Cs2.31910.128
Cf8.67910.003
LA3.08510.079
Note: Stdev = the standard deviation, df = degree of freedom, Min. = minimum, and Max. = maximum, and p-value, probability, indicates likelihood of statistical analysis results to assume the null hypothesis is true, as significant or non-significant difference.
Table 6. Results of comparison of population subgroups.
Kruskal-Wallis
Test
OS.DK vs. OS.OTNS.DK vs. NS.OTYG.DK vs. YG.OT
Chi-Squaredfp-ValueChi-SquareDfp-ValueChi-Squaredfp-Value
Cp4.89610.0260.97510.3230.45410.500
Cn0.24610.6190.01310.9062.89710.088
Ch5.13210.0231.21710.27011.74310.000
Cs0.03210.8584.52410.0330.52210.469
Cf10.37810.0010.18510.6665. 15110.023
LA8.33410.0030.05510.8224.83510.026
Note: Appreciation used in this article is explained in the note of Table 1. For example, OS.OT is referred to as “Old Settler Families living in Toek Thla Village” or “OS family at OT Village”.
Table 7. The percentages of HH education levels of the NS Families (percentages).
FamiliesEducation LevelsHH HeadFirst ChildSecond Child
NS.DKUniversity02.90
High School08.62.9
Secondary School11.4322.917.1
Elementary School65.7157.157.1
Illiterate/Not yet due22.868.622.9
NS.OTUniversity000
High School011.80
Secondary School5.8823.517.6
Elementary School64.7158.870.6
Illiterate/Not yet due29.415.911.8
Note: For HH Head, they did not participate in education because of the Civil War between 1975 and 1979. For first and second child, they did not participate in education system due to lack of facilities, according to reports by local people.
Table 8. Education levels of YG families in the two locations (percentages).
FamiliesEducation LevelsHH HeadFirst ChildSecond Child
YG.DKUniversity480
High School884
Secondary School24288
Elementary School524036
Illiterate121652
YG.OTUniversity000
High School014.37.1
Secondary School28.5721.40
Elementary School505042.9
Illiterate21.4314.350
Table 9. Jobs in the agriculture sector by villages and population subgroups (percentage).
No.Types of JobsDK VillageOT Villages
OSNSYGOSNSYG
1Agrarian worker0.0031.4332.0027.7823.5328.57
2Agripreneur0.002.868.0011.110.0021.43
3Business7.142.860.000.000.000.00
4Full-time farmer64.298.5716.0027.7817.657.14
5Landless agricultural worker7.1445.7128.0011.1158.8221.43
6Pluriactive farmer21.435.718.0011.110.007.14
7Stay at home0.000.000.0011.110.000.00
8Unknown0.002.868.000.000.0014.29
Disclaimer/Publisher’s Note: The statements, opinions and data contained in all publications are solely those of the individual author(s) and contributor(s) and not of MDPI and/or the editor(s). MDPI and/or the editor(s) disclaim responsibility for any injury to people or property resulting from any ideas, methods, instructions or products referred to in the content.

