Article

How Does the Construction of New Generation of National AI Innovative Development Pilot Zones Affect Carbon Emissions Intensity? Empirical Evidence from China

by
Lu Wang
1,
Ziying Zhao
2,
Xiaojun Xu
1,*,
Xiaoli Wang
1 and
Yuting Wang
1
1
School of Economics and Management, Yanshan University, Qinhuangdao 066004, China
2
School of Business and Management, Jilin University, Changchun 130015, China
*
Author to whom correspondence should be addressed.
Sustainability 2025, 17(15), 6858; https://doi.org/10.3390/su17156858
Submission received: 2 July 2025 / Revised: 22 July 2025 / Accepted: 25 July 2025 / Published: 28 July 2025
(This article belongs to the Special Issue Artificial Intelligence and Sustainable Development)

Abstract

At a critical juncture in the global low-carbon transition, the role of artificial intelligence (AI) in facilitating low-carbon growth has become increasingly significant. To accelerate the integration of AI with socio-economic development, China has established National New Generation Artificial Intelligence Innovation and Development Pilot Zones (AIPZ). However, the specific impact of these zones on low-carbon development remains unclear. This study utilized panel data from 30 provinces in China from 2013 to 2022 and employed the multi-period difference-in-differences (DID) model and the spatial autoregressive difference-in-differences (SARDID) model to examine the carbon emissions reduction effects of the AIPZ policy and its spatial spillover effects. The findings revealed that the policy significantly reduced carbon emissions intensity (CEI) across provinces, with an average reduction effect of 6.9%. The analysis of the impact mechanism confirmed the key role of human, technological, and financial resources. Heterogeneity analysis indicated varying effects across regions, with more significant reductions in eastern and energy-rich areas. Further analysis using the SARDID model confirmed spatial spillover effects on CEI. This paper aims to enhance understanding of the relationship between AIPZ and CEI and provide empirical evidence for policymakers during the low-carbon transition. By exploring the potential of the AIPZ policy in emissions reduction, it proposes targeted strategies and implementation pathways for policymakers and industry participants to promote the sustainable development of China’s low-carbon economy.

1. Introduction

With the intensification of global climate change, carbon emissions have become a focal point of international concern [1]. Large-scale carbon emissions are a primary contributor to global warming. The environmental crises they engender, including frequent extreme weather events, rising sea levels, and accelerated biodiversity loss, pose significant threats to the sustainable development of human society [2]. As the world’s largest carbon emitter, China has ranked first globally in carbon emissions since 2006 [3]. According to data from the International Energy Agency (IEA) in the “Global Energy Review 2025,” China’s carbon emissions in 2024 remained largely unchanged from 2023, totaling 12.6 billion tons, which accounts for one-third of global carbon emissions [4]. This underscores China’s unique position and significant responsibilities in global climate governance.
Although the Chinese government has made significant strides in reducing carbon emissions through a series of effective measures, such as promoting energy structure adjustments and accelerating industrial upgrades [5], the limitations of traditional policy tools have become increasingly apparent. Some companies have resorted to production cuts to meet emissions reduction targets, leading to decreased productivity and economic performance losses [6,7]. This model of sacrificing the economy for the environment runs counter to sustainable development goals. Therefore, exploring innovative policy tools that can both promote carbon emissions reductions and improve economic efficiency has become the key to breaking the deadlock.
In the global effort to combat climate change, technological innovation serves as a crucial driver of low-carbon development. As a representative of digital technology, artificial intelligence (AI) is transforming the landscape of various industries. During the post-pandemic economic recovery phase, AI technology has exhibited remarkable adaptability, not only accelerating economic reconstruction but also offering significant support to developing countries in addressing challenges in key areas by enhancing productivity and fostering innovation [8]. In terms of market size, global investment in AI technology reached approximately $315.8 billion and is projected to grow to $815.9 billion by 2028 [9]. China’s AI industry is developing particularly rapidly, with the core industry scale expected to exceed $50 billion. The country boasts more than 4300 enterprises and advanced infrastructure, including 2.8 million 5G base stations and over 2500 smart factories, which have collectively increased production efficiency by 34.8% while reducing carbon emissions by 21.2% [10]. Breakthroughs in AI technology and the expansion of application scenarios provide new strategies and tools for addressing carbon emissions [5,11]. AI demonstrates significant potential in carbon emissions governance by optimizing energy production and consumption structures, enhancing energy utilization efficiency, and driving green technological innovation [12]. For instance, AI-driven smart grid systems can monitor and regulate power supply and demand in real time, thereby reducing energy waste [13]. Additionally, AI-based carbon footprint tracking technology can accurately identify high-emission processes, providing a scientific basis for policymaking [14]. Furthermore, AI applications in new energy development, industrial process optimization, and smart city construction also offer technological support for achieving a low-carbon transition [15].
To maximize the environmental benefits of AI technology in the low-carbon transition, it is crucial to promote the effective diffusion and application of AI through thoughtful policy design [16]. In recent years, the Chinese government has been dedicated to advancing AI technology, establishing 18 national new-generation AI innovation and development pilot zones (AIPZ), in batches, in 2019, 2020, and 2021. This policy aims to accelerate the implementation of AI technology through policy guidance and to facilitate the low-carbon transition in key sectors such as energy, transportation, and industry [17]. However, existing studies have primarily concentrated on the environmental benefits of AI technology itself, overlooking the spatial spillover effects of AI technology diffusion driven by policy. Therefore, this paper focuses on the AIPZ policy as its research subject, utilizing panel data from 30 provinces in China from 2013 to 2022. It employs both the multi-period difference-in-differences (DID) model and the spatial autoregressive difference-in-differences (SARDID) model to systematically investigate the following issues. First, does the AIPZ policy significantly reduce carbon emissions intensity (CEI) in pilot regions? Second, through which channels does the policy effect manifest? Third, does the policy effect exhibit spatial spillover—meaning, does the implementation of the AIPZ policy in one region influence carbon emissions in neighboring regions? Fourth, do policy effects vary significantly across different regions? This analysis not only enhances our understanding of the environmental impacts of AI but also provides practical guidance for policymakers to tailor interventions based on specific regional circumstances.
The main contributions of this paper are threefold. First, this study incorporates the spatial spillover effects of carbon emissions into a unified analytical framework for assessing the policy effects of AIPZ. This approach expands on existing research on the environmental impacts of AI and provides new theoretical directions for future investigations. Second, we develop a framework based on the resource-based view to analyze the impact of the AIPZ policy on carbon emissions through three dimensions: human, technological, and financial resources. This framework offers a novel theoretical perspective for understanding policy effects and enriches the research landscape in related fields. Third, at the methodological level, we employ the SARDID model to capture the spatial dependence of carbon emissions and analyze the spatial spillover effects of the AIPZ policy on CEI. This methodology provides a more scientific and accurate approach to the research.
The structure of this paper is organized as follows: Section 2 reviews existing studies in the literature and proposes hypotheses; Section 3 outlines the research methods and describes the data; Section 4 presents the empirical analysis; Section 5 examines spatial spillover effects in greater detail; and Section 6 offers conclusions and policy recommendations.

2. Literature Review and Research Hypotheses

2.1. Policy Background

As an emerging disruptive technology, AI has become the central driving force behind the latest wave of industrial transformation, exerting extensive and profound impacts on current and future socio-economic development [18]. To capitalize on the significant strategic opportunities presented by the development of AI and to expedite the establishment of an innovative nation and a world-class science and technology powerhouse, the Chinese government released the “The New Generation of Artificial Intelligence Development Plan” in 2017. This plan explicitly states that by 2030, China’s AI theories, technologies, and applications will achieve world-leading status, with substantial advancements anticipated in the intelligent economy and society. In response to this developmental need, the Ministry of Science and Technology released the “Construction Guidelines for National New Generation Artificial Intelligence Innovation Development Pilot Zones” in 2019, proposing to build AIPZ in cities with abundant AI innovation resources and a strong development foundation. In 2020, the Ministry of Science and Technology further released the “Revised Guidelines”, suggesting establishing and building approximately 20 pilot zones by 2023. Currently, China has established 18 AI pilot zones in phases, encompassing 17 cities and 1 county (see Table 1). The primary objective of creating these AI pilot zones is to innovate institutional mechanisms, integrate valuable resources, and develop an ecosystem that fosters AI advancement [19,20]. This initiative aims to comprehensively enhance AI innovation capabilities and standards [21]. These pilot zones serve not only as pioneers and test beds but also as platforms with which to evaluate AI development frameworks, including mechanisms, policies, and standards. Their goal is to establish comprehensive policies and foster an environment conducive to AI research, innovation, and social integration [22].

2.2. Resource-Based View Theory

The resource-based view (RBV) theory suggests that a firm’s resources and its ability to utilize them are crucial for sustainable development and value enhancement. Barney [23] elaborated on the RBV theory based on two key assumptions: the heterogeneous distribution of resources among firms and the limited mobility of those resources. He argued that differences in resource endowments among firms over time are the source of competitive advantage. Early RBV focused on tangible resources; however, as the theory evolved, intangible resources gained importance in competitive advantage research. Wernerfelt [24] argued that a firm’s competitive advantages stem from its resources, with intangible resources being as crucial as tangible ones, which can be imitated.
From the RBV perspective, a firm’s resource endowment refers to the competitive advantage derived from resource heterogeneity. Resource endowment includes all resources that provide competitive advantages such as human resources, technological equipment, market resources, and technological capabilities. Grant [25] highlighted the foundational role of financial, physical, human, technological, reputational, and organizational resources in corporate strategy. Das and Teng [26] analyzed resource integration and competitive advantages using financial, managerial, physical, and technological resources. Additionally, Sha and Li [27] identified human, technological, and financial resources as key factors influencing corporate innovation. These studies suggest that human, technological, and financial resources are critical for market activities and innovation. Human resources are the primary drivers of innovation; their knowledge and skills significantly influence the efficiency of technology application. Technical resources serve as the core driving force behind low-carbon transformation, incorporating essential elements of innovation such as research and development (R&D) investment. Financial resources provide the material foundation necessary for technological R&D. Based on this framework, this study identifies human, technical, and financial resources as key variables for investigating the mechanisms through which resource endowments are critical for analyzing the impact of the AIPZ policy on carbon emissions.

2.3. Research Hypotheses

2.3.1. The Impact of the AIPZ Policy on CEI

In an era of rapid advancements in AI technology and the comprehensive development of sustainable strategies, China faces the formidable challenge of reducing carbon emissions. Academic circles have engaged in extensive discussions regarding the potential of AI to mitigate carbon emissions, presenting a range of perspectives. Some scholars express concerns that the widespread application of AI technology may lead to a significant increase in energy consumption and cooling of resource demands for new infrastructure, ultimately resulting in higher carbon emissions [28]. Taking large models, such as GPT-3, GPT-4, and Grok3, as examples, the computational power required for their training has significantly surpassed previous levels. The training of GPT-3 alone consumed approximately 1.29 million kilowatt-hours of electricity, resulting in the emission of over 550 tons of carbon dioxide [29]. Meanwhile, the high-performance GPUs that support these models typically rely on liquid cooling or air-conditioning systems for thermal management, with the energy consumption of cooling systems accounting for 25% to 40% of a data center’s total power consumption [30]. The combined consumption of computing power, electricity, and cooling not only drives up operational costs but also exacerbates carbon emissions. Conversely, others argue that the benefits of carbon emissions reductions attributed to AI may be offset by the electricity consumed during its operation [31]. Consequently, minimizing the energy consumption of AI itself has emerged as a critical area of research.
Despite concerns, from a macro and long-term view, the AIPZ policy exhibits significant, multidimensional positive effects on carbon emissions reduction [3,32]. First, during the initial planning stage of production and operations, AIPZ construction enables enterprises to use AI for accurate carbon emissions simulations and predictions [33], optimizing production processes and energy allocation plans in advance to avoid high-energy, high-emission methods and to establish a low-carbon foundation [34]. Second, during the production stage, AI integration enhances machinery capabilities, enabling automatic operation adjustments [35]. Unlike traditional equipment, AI-controlled machinery senses real-time production environment changes and modifies parameters, improving efficiency and minimizing waiting and idle time by optimizing production scheduling and equipment coordination [36]. AI systems also dynamically adjust equipment power based on demand, preventing energy waste and reducing per-unit output energy consumption. Third, in the energy management phase, the AIPZ policy actively promotes the optimization of energy production systems and consumption structures by facilitating the application of AI technology in energy management [37]. AI algorithms optimize energy supply scheduling and allocation, adjusting generation proportions in real time [38]. Energy consumption is allocated based on production progress and equipment load, reducing waste and lowering CEI. Based on this analysis, we propose the following hypothesis:
Hypothesis 1.
The AIPZ policy can effectively reduce CEI.

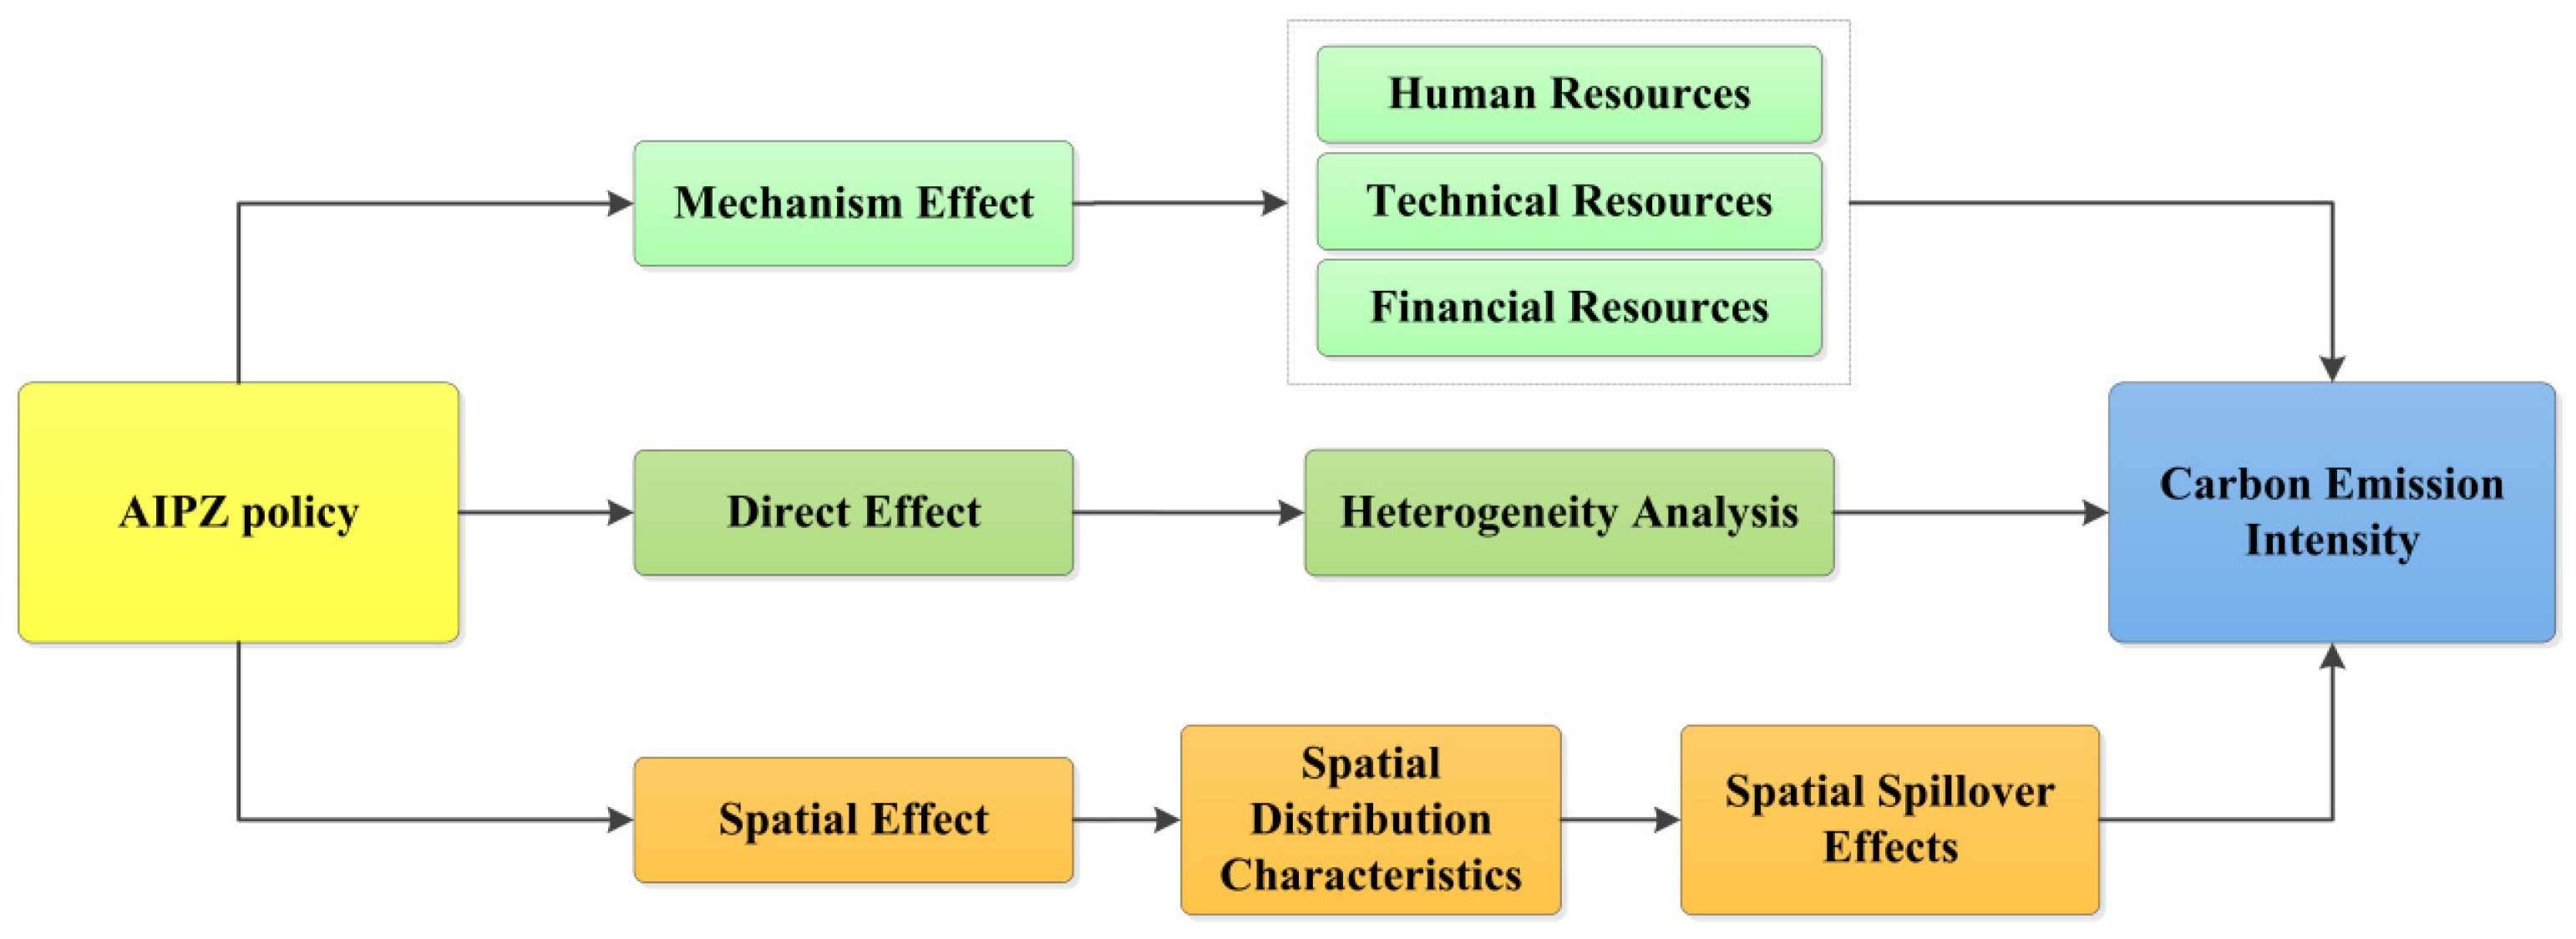
2.3.2. The Mechanism of the AIPZ Policy on CEI

Based on the RBV theoretical framework, the AIPZ policy has restructured regional resources by positioning human resources as the intellectual core, technological resources as the means of transformation, and financial resources as the source of economic support. This paper analyzes the impact of the AIPZ policy on carbon emissions intensity through these three pathways.
First, human resources are essential to regional innovation and low-carbon development. The establishment of AIPZ pilot zones has attracted a substantial number of AI-related research talents and innovative labor forces. These individuals have made significant advancements in AI algorithm optimization, model construction, and system development, applying their findings across key sectors such as energy, transportation, and industry. This has effectively enhanced the levels of automation and intelligence in production processes, resulting in a notable reduction in energy consumption per unit of output and CEI [39]. Furthermore, these talents also contribute to regional management and decision-making, leveraging advanced theories to achieve low-carbon goals [3,40].
Second, technological resources are a crucial driver of carbon emissions reduction. The AIPZ policy promotes AI application and innovation, fostering green technological progress [41,42]. On the one hand, policies have encouraged enterprises to enhance their investments in R&D related to new energy and energy management. This has resulted in the advancement of technologies, such as intelligent energy management systems, which effectively monitor and control energy consumption, thereby minimizing waste and reducing carbon emissions. On the other hand, the AIPZ policy fosters the deep integration of AI technology with traditional green technologies, utilizing AI algorithms to optimize the efficiency of renewable energy generation and enhance the intelligence of energy storage and allocation. This integration ultimately facilitates a high-efficiency, low-carbon transformation of production processes.
Third, financial resources are essential for the successful implementation of AI technology and low-carbon development. The AIPZ policy provides financial support for low-carbon initiatives in the region through government funding and industrial capital investment [43]. Simultaneously, the AIPZ policy promotes the deep integration of AI with traditional industries by directing social capital investment, particularly in green finance. Green finance facilitates financial support for AI technology research and application through specialized loans, green bonds, and other financial instruments, thereby optimizing capital allocation and enhancing the efficiency of capital utilization. This, in turn, establishes a robust economic foundation for regional low-carbon development [44]. Based on this analysis, we propose the following hypothesis:
Hypothesis 2.
The AIPZ policy reduces CEI through human, technological, and financial resources.

2.3.3. Spatial Spillover Effects of the AIPZ Policy on CEI

Against regional economic integration and digital technology advancement, the effects of the AIPZ policy extend beyond local CEI, potentially generating spatial spillover effects. First, there is the radiation effect of technology diffusion. The AIPZ policy boosts AI development and application in pilot zones, creating spillover effects. Surrounding regions can enhance their own AI technology capabilities by imitating, absorbing, and learning from the technological innovations of the pilot zones [45]. This knowledge spillover and technological diffusion not only facilitate the digital and intelligent transformation of surrounding regions but also enhance production efficiency and optimize energy utilization, thereby reducing CEI [46]. Second, there are the synergistic effects of industrial linkages. The implementation of the AIPZ policy is often accompanied by the restructuring and expansion of regional industrial chains. AI industry clusters, formed in central cities through policy guidance, establish close vertical divisions of labor with surrounding areas via supply-chain collaboration and industrial support. This industrial linkage not only optimizes the efficiency of regional resource allocation but also fosters the low-carbon transformation of adjacent areas through technology spillovers and industrial synergy, ultimately reducing their CEI [47]. Third, there is the flow effect of innovative elements. As pilot zones evolve, certain innovative elements tend to disseminate to neighboring areas, particularly in the sharing of green technologies and products. This flow of innovative elements and resource sharing has fostered low-carbon technological innovation and green industrial development in adjacent regions, thereby facilitating the cross-regional dissemination of carbon emissions reduction effects [48]. Based on this analysis, we propose the following hypothesis:
Hypothesis 3.
The inhibitory effect of the AIPZ policy on CEI has a spatial spillover effect.
In summary, combining theoretical analysis and the above hypotheses, this study proposes the following theoretical framework (see Figure 1).

3. Research Design

3.1. Baseline Model

To assess the impact of the AIPZ policy on CEI, this study employs a multi-period difference-in-differences (DID) approach. Compared to other methods, such as matching, synthetic control, or machine learning, the multi-period DID model effectively controls for unobserved heterogeneity and clearly elucidates the causal relationship of the policy. On the one hand, the DID model offers distinct advantages in addressing challenges related to policy evaluation; on the other hand, the multi-period DID model employed in this study captures changes in policy effects over time, providing an opportunity for in-depth research on the long-term impact of these policies [49,50]. By comparing data from various time points before and after the policy’s implementation, we can observe trends in CEI across provinces and accurately measure the effectiveness of the pilot zone construction. Although machine learning methods have advantages in capturing complex nonlinear relationships, this study focuses on identifying the average treatment effect of AIPZ policies on carbon emissions intensity, emphasizing the interpretability and policy implications of the results. Therefore, multi-period DID and spatial econometric methods are adopted as the main empirical strategies. Based on this analysis, the following multi-period DID model has been constructed:
C E I i t = α 0 + α 1 A I P Z i t + α 2 C o n t r o l i t + μ i + λ t + ε i t ,
where i and t represent the province and time, respectively; CEit denotes the carbon emissions intensity of province i at time t; AIPZit is the interaction term that combines the AI innovation pilot zones indicator and the time dummy variable, where 1 indicates treatment and 0 otherwise; Controlit represents the control variable; λi denotes the individual fixed effect; μt represents the time fixed effect; εit represents the random error; and α1 measures the treatment effect of the policy. If α1 < 0 and is statistically significant, it indicates that the AIPZ policy significantly reduces the provincial CEI; otherwise, it suggests that the policy’s effect is not significant.
To examine the path of the AIPZ policy on CEI, this study adopts the testing methods proposed by Alesina and Zhuravskaya [51] and Baron et al. [52]. Under the condition that the coefficient in Equation (1) is significant, mechanism variables are used as the dependent variable, and policy shocks are used as the independent variable in the regression. The specific equation is as follows:
M e c h a n i s m i t = α 0 + α 1 A I P Z i t + α 2 C o n t r o l i t + μ i + λ t + ε i t ,
In Equation (2), Mechanismit represents the mechanism variables through which the AIPZ policy influences outcomes such as human, technological, and financial resources. Unlike Equation (1), which directly measures CEI, Equation (2) focuses on assessing the impact of the policy on these mechanism variables, thereby elucidating the transmission pathways of the policy effects. The definitions of the other variables remain consistent with those in Equation (1).

3.2. Variable Selection and Interpretation

3.2.1. Dependent Variable

This study selects carbon emissions intensity (CEI) as the dependent variable. Compared to total carbon emissions, CEI is more critical, as it more accurately reflects the relationship between environmental pollution and economic development. Following the methodology of Zhang and Wang [53], total carbon emissions are measured as the sum of Scope 1, Scope 2, and Scope 3 emissions; regional CEI is calculated as the ratio of total carbon emissions to gross domestic product (GDP). Figure 2 illustrates the spatial distribution of CEI across China’s 30 provinces. Over the decade from 2013 to 2022, China’s overall CEI exhibited a significant and sustained downward trend. Specifically, the western region had the highest CEI, followed by the central region, whereas the eastern region had the lowest CEI.

3.2.2. Explanatory Variable

The explanatory variable in this paper is the AIPZ policy dummy variable, which is represented by the interaction of time dummy variables and region dummy variables. According to the key time points outlined in the “Guidelines for the Construction of National New Generation Artificial Intelligence Innovation and Development Pilot Zones,” the period from 2019 to 2021 includes 16 provinces and municipalities. This study designates these pilot zones as pilot regions and assigns them a value of 1. Furthermore, the time at which each pilot province or municipality was first designated as a pilot zone is utilized as the policy implementation time point, which is also assigned a value of 1.

3.2.3. Mechanism Variables

This study identifies key mechanism variables from three aspects, human resources, technological resources, and financial resources, to examine the impact of the AIPZ policy on CEI.
Human resources are evaluated from two dimensions: talent scale and talent structure. Talent scale is assessed using the full-time equivalent (FTE) of R&D personnel in large-scale industrial enterprises, and directly reflects the quantity of human resources allocated to R&D activities. Talent structure is characterized by the ratio of employed personnel in the information transmission, software, and information technology services sector to the year-end permanent resident population. This ratio indicates the composition of talent within the relevant industry in relation to the regional population.
Technological resources are evaluated from two perspectives: the quantity and quality of green technological innovation. According to Li et al. [54], the quantity of green technological innovation is measured by the number of green patent applications per 10,000 individuals, which reflects the output of green technological innovation in terms of quantity. Conversely, the quality of green technological innovation is assessed by the number of green invention patent applications per 10,000 individuals. Invention patents possess higher technical content and innovation, making this indicator a more accurate representation of the quality level of green technological innovation.
Financial resources are evaluated from two perspectives: the green financial scale and green financial efficiency. The green financial scale is measured by the ratio of the regional green credit balance to GDP, reflecting the extent to which green finance supports the economy. Green financial efficiency is assessed by the reduction in carbon emissions per unit of green credit, indicating the actual effectiveness of green finance in promoting energy conservation, reducing emissions, and lowering CEI.

3.2.4. Control Variables

To accurately assess the impact of the AIPZ policy on CEI, this study draws on the research findings of Ouyang et al. [55], Ding et al. [46], and Yin et al. [42]. to scientifically and reasonably select control variables. Among these, the Urbanization Level (URB) is measured by the proportion of the urban population to the total population. The Industrialization Level (IND) is represented by the ratio of industrial added value to regional GDP. The Technology Market Development Level (MAR) is quantified by the ratio of technology market transaction volume to GDP. The Financial Development Level (FIN) is measured by the ratio of total deposits and loans of financial institutions to GDP. The Degree of Openness (OPEN) is calculated by the ratio of total goods imports and exports to GDP. Finally, the Social Consumption Level (CON) is reflected by the ratio of total retail sales of consumer goods to GDP. These variables aim to capture the multifaceted factors that may influence the relationship between the development of the pilot zones and CEI. Table 2 provides definitions for these variables.

3.3. Data Sources

Although AIPZ was only published in 2019, the sample for this study began in 2013. On the one hand, 2013 marked a pivotal moment in China’s artificial intelligence sector, as it began to gain traction and attract policy attention. At this stage, the initial signs of technological development were emerging, making it an appropriate starting point to capture early-stage characteristics. On the other hand, to exclude pre-existing trend differences and ensure that the multi-period DID identification has a sufficiently long and effective pre-processing window, the sample start time must also be set to 2013. Therefore, this study selected 30 provinces (excluding the Hong Kong Special Administrative Region, the Macao Special Administrative Region, Tibet, and Taiwan) as research subjects from 2013 to 2022. The data primarily originate from the China Statistical Yearbook, the China Industrial Statistics Yearbook, the China Science and Technology Statistics Yearbook, the China Energy Statistics Yearbook, and the provincial statistical yearbooks for the corresponding years. Some control variables were obtained from the EPS database. To address missing values in certain years, linear interpolation was employed to fill in the gaps. Additionally, all variables measured in monetary terms were adjusted to real values, using 2012 as the base year.
Table 3 presents descriptive statistics for a dataset comprising 300 observations for each variable. The standard deviation for all 14 variables is below 3, indicating moderate variability. The CEI has a maximum value of 11.654, a minimum of 8.145, a mean of 9.586, and a standard deviation of 0.736. This suggests that some provinces experience significant carbon emissions pressures during economic development, while others have achieved notable results in energy conservation, emissions reduction, or industrial optimization, resulting in substantial variations in CEI across provinces. As a mechanism variable, the standard deviation of QGTI is the highest at 2.205, reflecting significant regional differences in QGTI, likely due to varying levels of emphasis on green innovation technologies among provinces. Control variables exhibit relatively low standard deviations, indicating minimal variation in their maximum, minimum, and average values, which demonstrates their stability. Additionally, the VIF values for each variable range from 1.15 to 3.82, all below 10, indicating no significant multicollinearity. Therefore, no modifications to the model were necessary [56].

4. Empirical Results and Analysis

4.1. Benchmark Regression Analysis

Table 4 presents the results of the benchmark regression analysis, which examines the impact of the AIPZ policy on CEI. In column (1), we did not include any control variables or fixed effects; the estimated coefficient of AIPZ was −0.258, significant at the 1% level. In column (2), we introduced control variables and the estimated coefficient of AIPZ decreased but remained significantly negative. Furthermore, in column (3), we added control variables and fixed effects. The estimated coefficient of AIPZ is −0.069, suggesting that the AIPZ policy reduced the average provincial CEI by 6.9% after accounting for relevant factors. This decrease indicates that uncontrolled factors were present in the initial model, confirming the effectiveness of our selected controls. These results support Hypothesis 1 and align with the innovation-driven development theory, which emphasizes the role of technological innovation in regional sustainable development. The AIPZ policy directs innovative resources to enhance AI applications in energy management and production, promoting industrial upgrading and improving energy efficiency, thus reducing reliance on high-carbon energy sources and lowering provincial CEI. Additionally, the adjusted R-squared value increased, indicating improved model explanatory power.

4.2. Robustness Tests

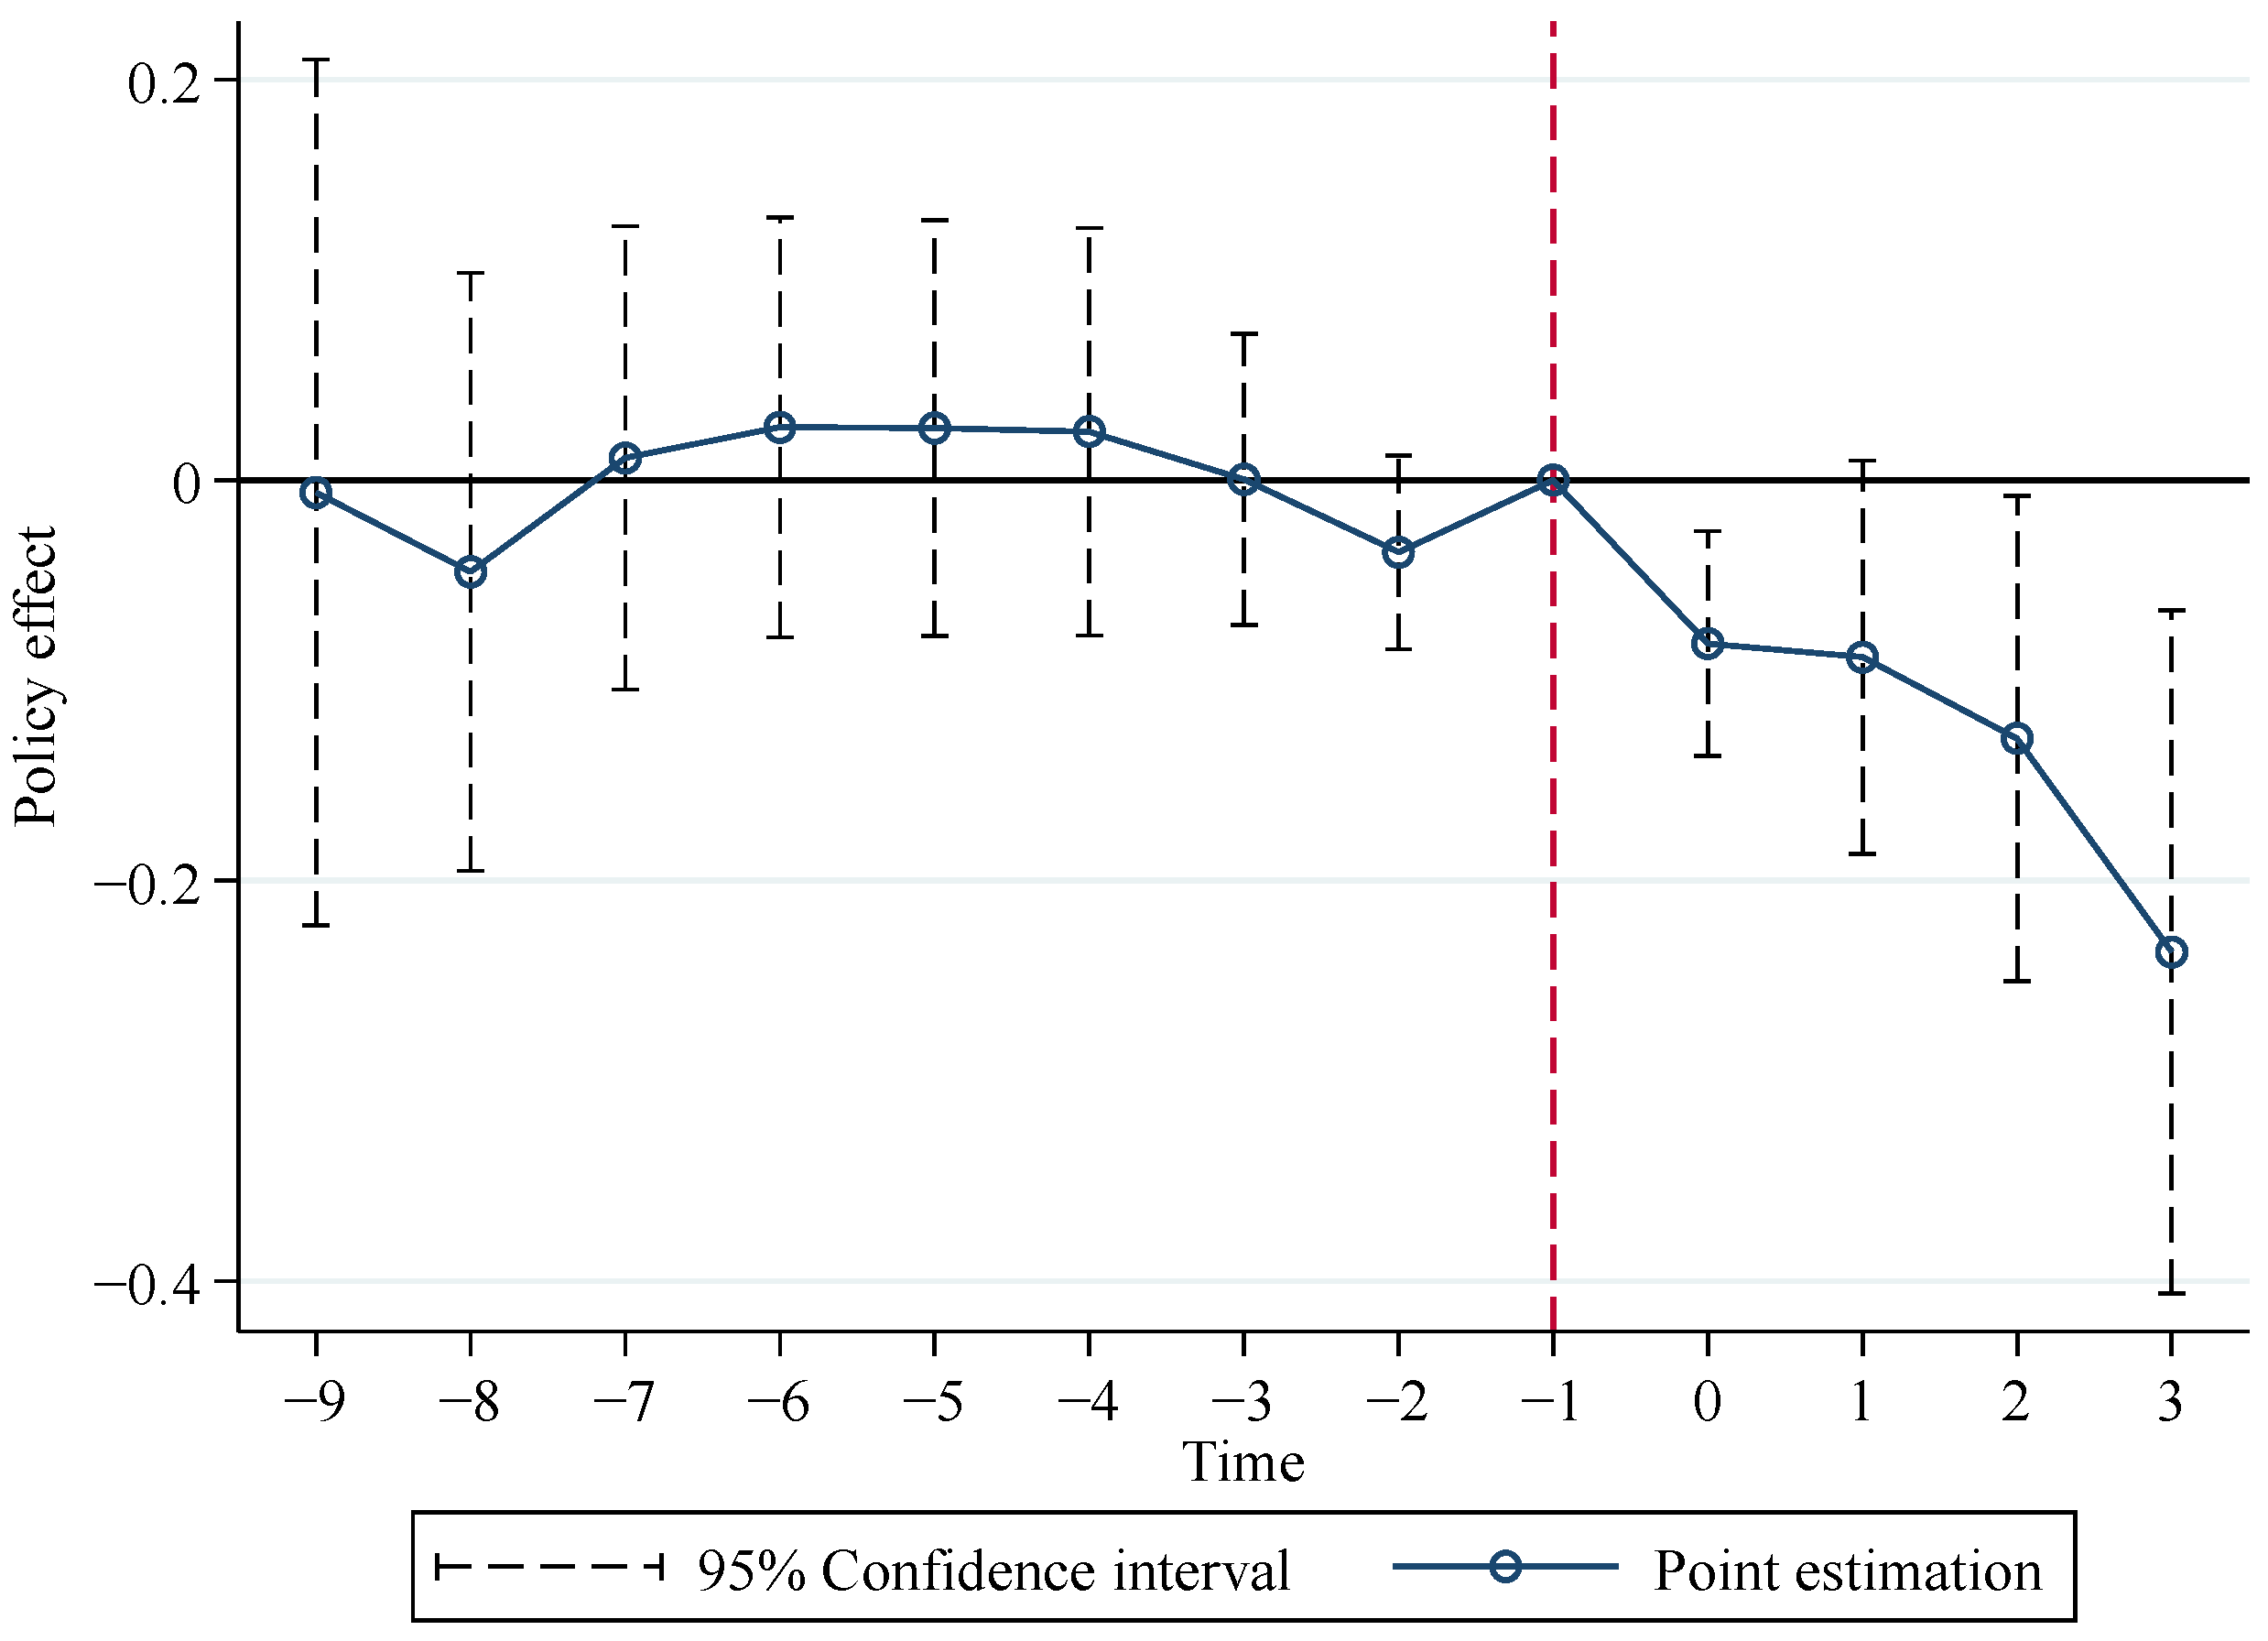
4.2.1. Pre-Test Trend Analysis

Before the implementation of the AIPZ policy, CEI changes between the treatment and control groups showed no statistically significant systematic differences, which is crucial for the unbiased estimation in the double-difference identification strategy [57]. Thus, this study uses the event study method to assess the parallel trend assumption. Initially, we created dummy variables for the years ranging from 1 to 9 years before the AIPZ policy implementation, as well as for the implementation year and the next three years. Subsequently, we re-estimated the regression equation using these variables, with the starting year of the sample (−9) as the base period. Based on multi-period DID, the following event study model was constructed:
C E I i t = α 0 + α k k 9 3 A I P Z i t k + α 2 C o n t r o l i t + μ i + λ t + ε i t ,
where k denotes the time elapsed since the province was first included in the pilot program list and AIPZitk represents the implementation status of the AIPZ policy in a specific year. The remaining variables are consistent with Equation (1). To mitigate potential issues arising from the use of dummy variables, this study employs the period immediately preceding the implementation of the AIPZ policy as the baseline group to specifically examine the policy effects before and after its implementation.
Figure 3 illustrates that prior to the implementation of the AIPZ policy, the regression coefficients exhibited fluctuations around zero and were not statistically significant, thereby indicating that the assumption of no prior trend parallelism was not rejected. Following the implementation of the AIPZ policy, both the treatment group and the control group began to demonstrate negative differences, suggesting that the AIPZ policy exerts a significant inhibitory effect on CEI. As time progresses and supplementary policies are progressively enhanced, the emissions reduction impact of the AIPZ policy is expected to strengthen. These findings validate the rationality of the parallel trend assumption and the robustness of the benchmark model.

4.2.2. Placebo Test

To mitigate the influence of omitted variables and spurious regression that may impact the AIPZ policy, this study implemented a placebo test by randomly generating various virtual experimental and control groups. Specifically, samples were randomly selected from two dimensions: time and region, pertaining to the implementation of the AIPZ policy, in order to create pseudo-treatment groups. The baseline model was re-estimated and the sampling process was executed 500 times. The estimated coefficients were utilized to generate kernel density plots and p-value distribution plots. As illustrated in Figure 4, the p-values associated with these virtual treatment effects predominantly cluster around zero, suggesting that the observed impact of the AIPZ policy on CEI in our baseline regression model is unlikely to be attributable to random factors or systematic biases in the model specification.

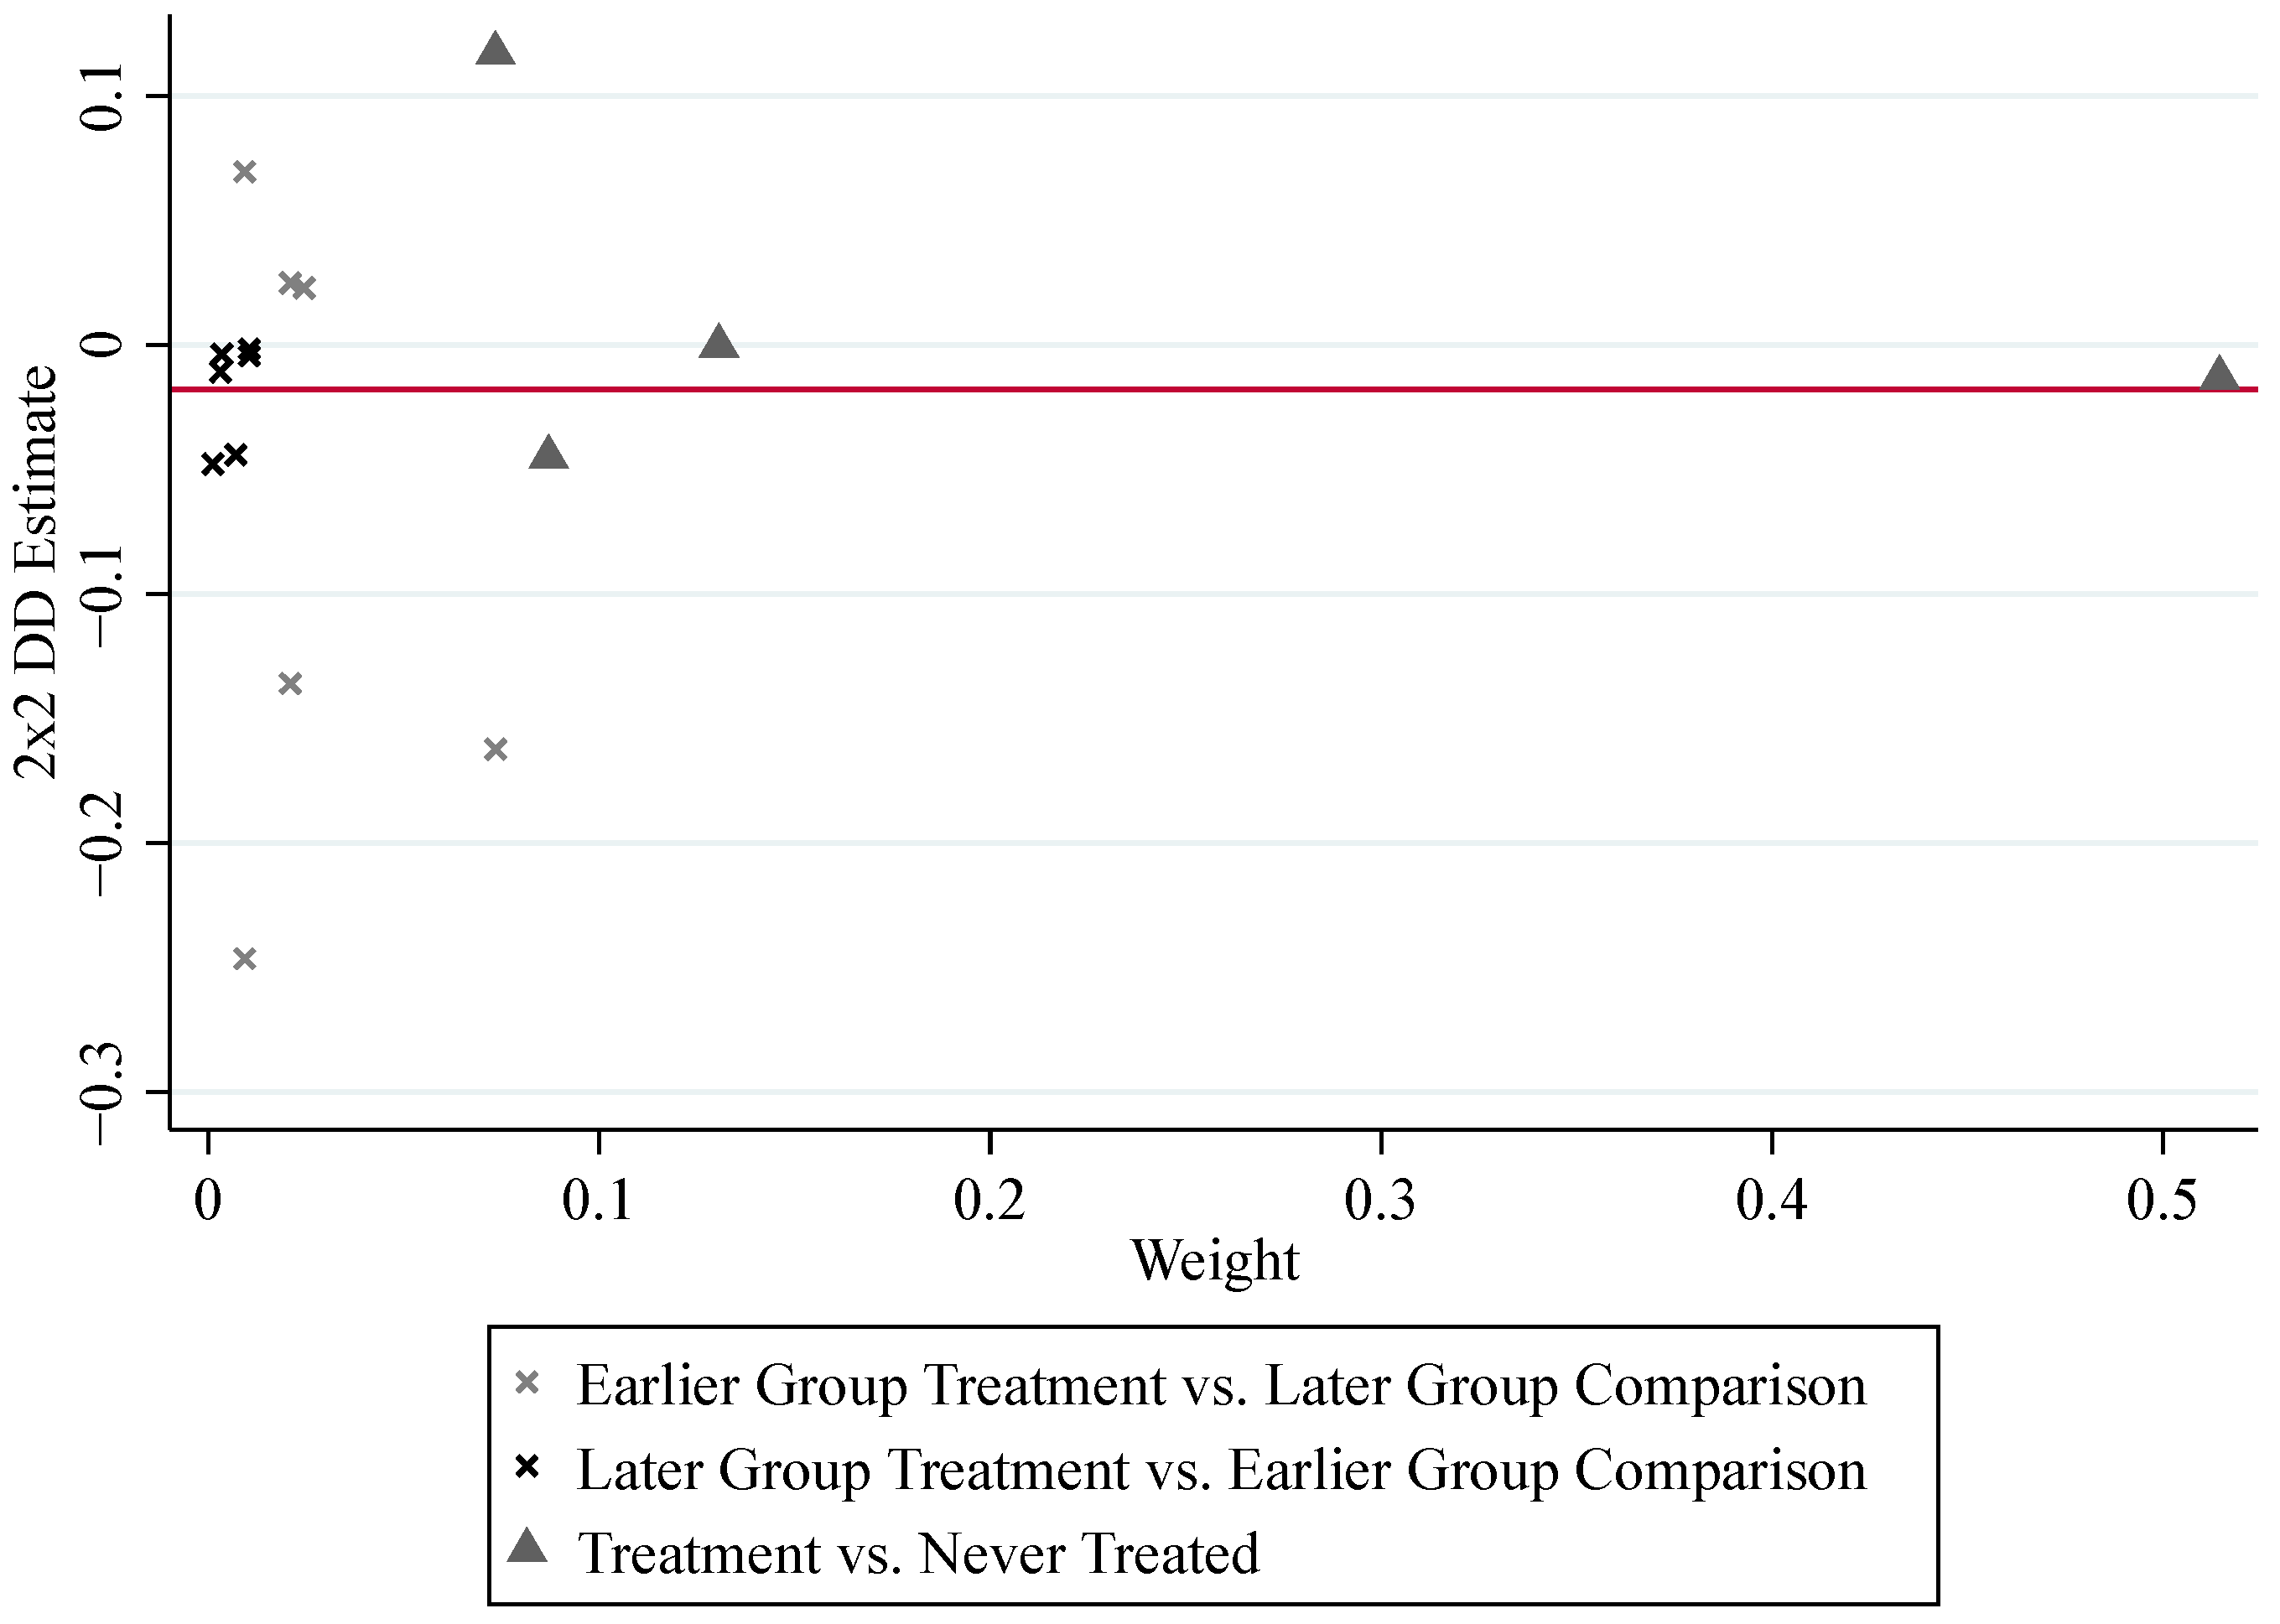
4.2.3. Heterogeneous Treatment Effect

Goodman-Bacon [58] showed that even with a valid parallel trends assumption, a two-way fixed effects model may introduce estimation bias and yield coefficients that deviate from the true parameter values. Therefore, this paper uses Goodman-Bacon’s methodology to decompose multi-period DID estimates in the benchmark regression model.
The overall DID estimate is systematically decomposed into three distinct groups: Group (1) represents the comparative effect of the treatment administered to the earlier group compared with the later group; Group (2) reflects the treatment effect of the later group compared to the earlier group; and Group (3) illustrates the effect of treatment versus no treatment. Figure 5 displays each 2 × 2 DID estimate along with its corresponding weights derived from the regression model. These estimation results are derived from the regression analysis evaluating the impact of the AIPZ policy on CEI.
In Figure 5, the horizontal axis denotes the weights, while the vertical axis represents individual 2 × 2 DID estimates. The red horizontal line indicates the overall estimate of 0.258. Among the three 2 × 2 DID groups, Group (1) and Group (3) do not introduce bias into the results, as their estimated coefficients are both negative, consistent with the results of the baseline regression, and their combined proportion accounts for 96.5% of the total weight in the overall DID estimate. Conversely, Group (2) has a problematic treatment group, which may introduce bias into the results; however, its proportion in the overall DID estimate is relatively small. This suggests that the regression results obtained using the two-way, fixed multi-period DID model remain robust.

4.2.4. Instrumental Variables Method

The Ministry of Science and Technology mandates that pilot zones possess robust scientific and educational resources, as well as AI industries and infrastructure that facilitate local digital development. This suggests that pilot zones are selectively chosen, leading to regional self-selection bias. To address this issue, the study employs the instrumental variable (IV) method. Following the approach of Ouyang et al. [54], optical fiber density is chosen as the instrumental variable (IV_FO) for two primary reasons: first, it serves as a direct indicator of digital infrastructure levels, which influence the penetration of AI technology and correlate with the intensity of AI industry policies; second, it indirectly impacts CEI through its effect on AIPZ policy, without any other direct pathways.
Table 5 presents the regression results. Column (1) indicates that all coefficients of the instrumental variables in the first stage are significantly positive at the 1% level, confirming that the relevance principle of instrumental variables is satisfied. Additionally, the F statistic in the first stage exceeds 10, adhering to the empirical rule. Furthermore, the C–D Wald F statistic surpasses the 10% critical value associated with the Stock–Yogo test, indicating that there are no issues with weak instrumental variables. Column (2) demonstrates that after the introduction of the instrumental variables, the policy continues to exert a negative impact on CEI at the 1% significance level, consistent with the conclusions drawn from the baseline regression.

4.2.5. Other Robustness Tests

Other robustness tests include the following:
(1)
Replacing the explanatory variable
We replaced the dependent variable CEI with carbon emissions. Specifically, total carbon emissions were measured using the natural logarithm of total carbon emissions (Carbon). The regression results are shown in Column (1) of Table 6, where the coefficient of AIPZ is significantly negative. This finding strongly supports the conclusion that the AIPZ policy effectively reduces carbon emissions across provinces, providing robust evidence for the conclusions of this study.
(2)
Lagging control variables by one period
To mitigate potential reverse causality concerns, all control variables were lagged by one period prior to conducting the regression analysis. Column (2) of Table 6 shows that the coefficient of AIPZ continues to exhibit a significantly negative value. This finding further substantiates the robustness of the conclusions drawn from the benchmark regression.
(3)
Outlier removal
Considering the significant differences between conventional provinces and central municipalities across various dimensions, this study excluded Beijing, Tianjin, Shanghai, and Chongqing to prevent these disparities from affecting the research outcomes. The regression analysis was conducted solely with the sample of conventional provinces [59]. Column (3) of Table 6 shows that the coefficient of AIPZ remains significantly negative. This finding suggests that, even after excluding samples from the municipalities, the policy continues to exert a persistent inhibitory effect on CEI. Consequently, the effect of the policy is consistent nationwide and is not influenced by the unique circumstances of specific regions.
(4)
Excluding the influence of other policies
In 2013 and 2016, China launched pilot programs for carbon emissions trading policies, which may have influenced the CEI of various provinces. To mitigate the potential impact of these carbon emissions trading policies on the empirical results of this study, we constructed a dummy variable representing the policy and incorporated it into the baseline regression analysis. Column (4) of Table 6 shows that the coefficient of AIPZ remains significantly negative. This finding indicates that the carbon emissions trading policy did not exert undue influence on the baseline conclusions of this study, thereby further validating the robustness of the research findings.
Table 6. Results of other robustness tests.
Variables(1)(2)(3)(4)
CarbonCEICEICEI
AIPZ−0.050 **
(0.021)
−0.058 **
(0.023)
−0.068 **
(0.035)
−0.069 **
(0.031)
Constant10.332 ***
(0.289)
10.276 ***
(0.431)
11.404 ***
(0.497)
10.813 ***
(0.544)
controlsYesYesYesYes
Individual FixedYesYesYesYes
Time FixedYesYesYesYes
R-squared0.4360.3740.9830.714
N300270260300
Note: *** and ** represent significance levels of 1% and 5%, respectively.

4.3. Mechanism Analysis

The estimation results of the benchmark regression indicate that the AIPZ policy has a significant inhibitory effect on CEI. To further analyze the underlying mechanisms of this policy effect, this section integrates the theoretical explanatory framework developed in the previous section with the established research framework to examine three key dimensions: human, technological, and financial resources. Table 7 presents the specific results of the mechanism regression.
Columns (1) and (2) present the regression results with TST and TSC as the dependent variables, respectively. The estimated coefficients of AIPZ are both significantly positive at the 10% level, indicating that the AIPZ policy has a positive impact on TST and TSC. In summary, the AIPZ policy has contributed positively to the reduction in CEI by promoting the efficient allocation and systematic flow of human resources.
Columns (3) and (4) present the regression results with QGTI and QGTQ as the dependent variables, respectively. The estimated coefficients of AIPZ are both significantly positive at least at the 5% level, indicating that the AIPZ policy has had a positive impact on QGTI and QGTQ. In summary, the AIPZ policy has contributed positively to the reduction in CEI by optimizing and enhancing technical resources.
Columns (5) and (6) present the regression results with GFS and GFT as the dependent variables, respectively. The estimated coefficients of AIPZ are all significantly positive at the 5% level, indicating that the AIPZ policy has a positive impact on GFS and GFT. Comparing the coefficients, the coefficient is larger when GFT is the dependent variable. This is because the AIPZ policy not only guides capital investment into green industries to expand their scale but also focuses on improving market mechanisms and optimizing regulation to enhance capital utilization efficiency and reduce resource waste, thereby exerting a more significant effect on improving green financial efficiency. In summary, the AIPZ policy has contributed positively to the reduction in CEI by promoting the rational allocation and efficient use of financial resources.
Based on the analysis, the AIPZ policy has significantly reduced CEI by promoting efficient resource flow and the rational allocation of human, technological, and financial resources. These mechanisms underscore the policy’s guiding role in resource development and demonstrate how entities can achieve coordinated economic and environmental progress through sustained resource investment, thereby fulfilling sustainable development goals. This outcome strongly supports Hypothesis 2.

4.4. Heterogeneity Analysis

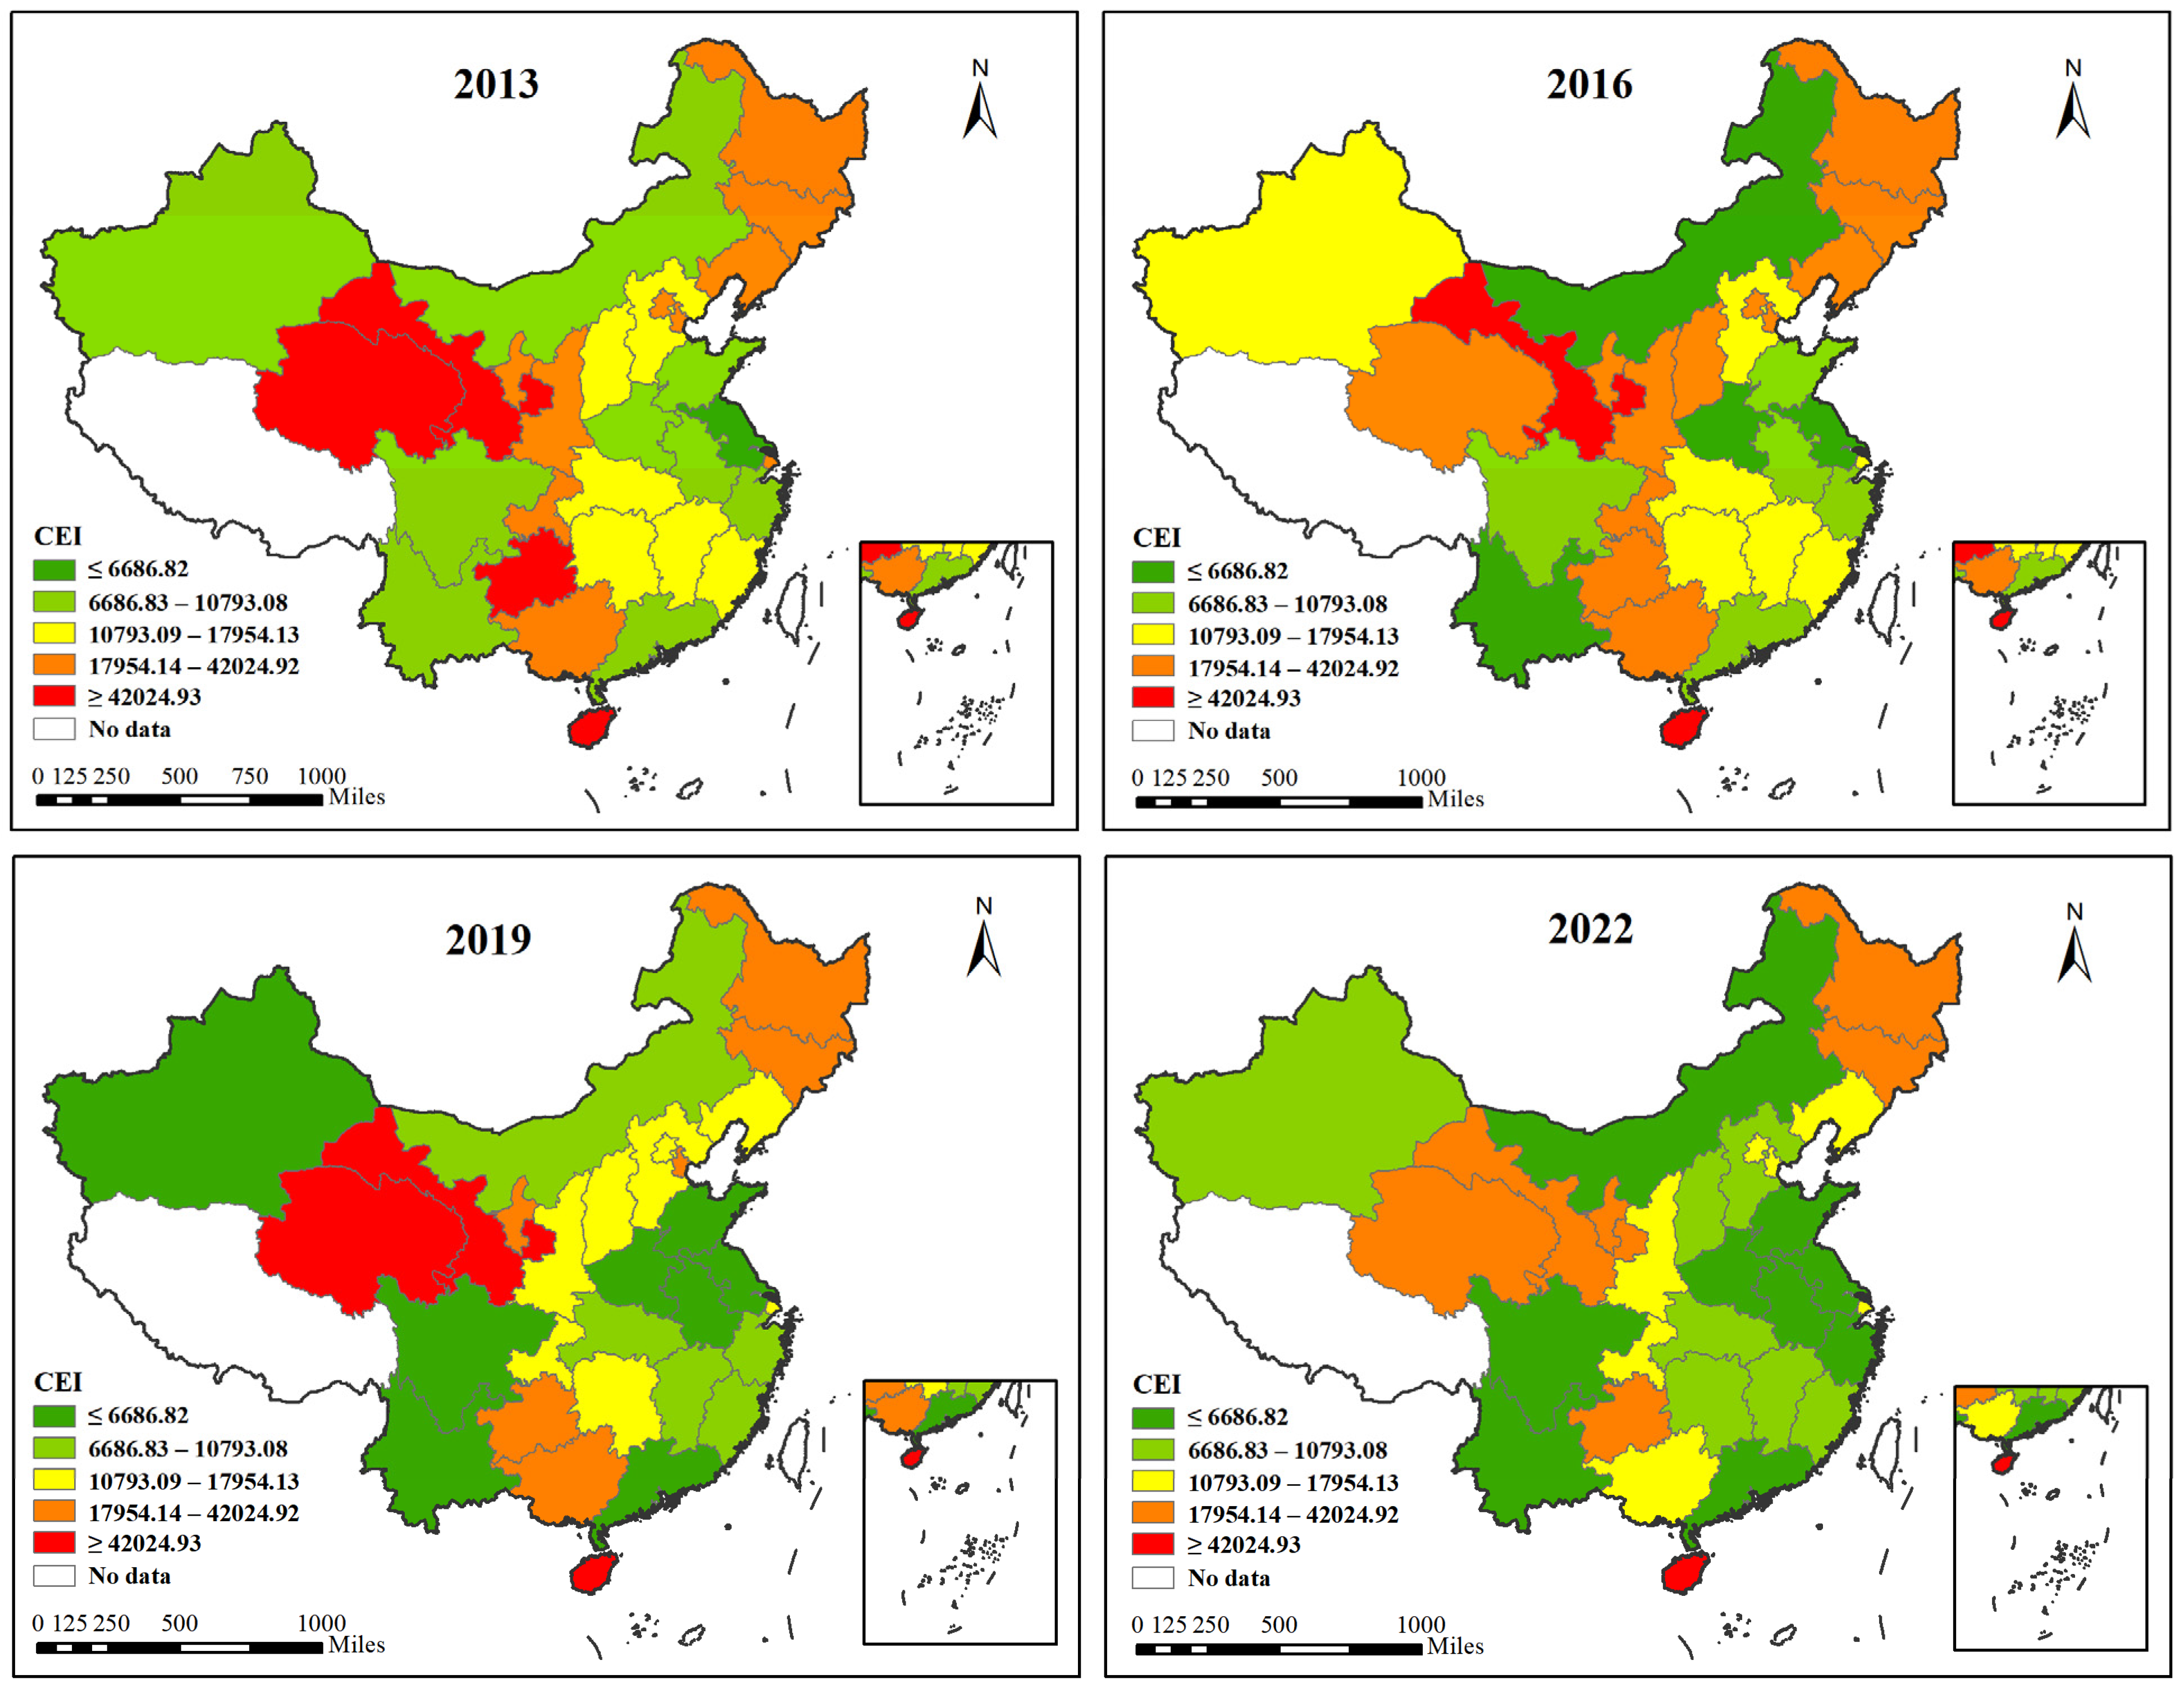
4.4.1. Geographical Differences Based on Location

Regional disparities in resource endowments and economic foundations create uneven innovation capabilities, resulting in varying policy effects on CEI. To address this issue, the study divides the sample into eastern, central, and western regions for separate regression analyses. The results are presented in Table 8 (1)–(3). Column (1) indicates that the AIPZ policy has the most significant impact on CEI in the eastern region, with a coefficient of −0.064. This suggests that the policy effectively reduces CEI in this area. However, in columns (2) and (3), the coefficients of AIPZ in the central and western regions are not statistically significant, implying that the policy has a minimal effect on CEI in these areas. This discrepancy may be attributed to the eastern region’s advanced development and economic advantages, which facilitate swift AI adoption across production stages and promote energy conservation. Additionally, this region boasts abundant innovation resources and a concentrated talent pool, providing a solid foundation for the implementation of AI technology. In contrast, the central region, dominated by traditional industries and facing challenges related to industrial transformation, along with the western region, characterized by weaker economies and underdeveloped infrastructure, encounter significant difficulties in AI adoption. Consequently, the AIPZ policy yields minimal reductions in CEI in these regions.

4.4.2. Regional Differences Based on Energy Endowments

Significant differences in energy endowments exist across regions, with the abundance of energy resources directly influencing a region’s energy supply structure and the direction of its industrial development. This study employs k-means clustering analysis to categorize energy resources, identifying regions with both abundant and scarce energy resources. This clustering method enables us to group the research samples into subgroups with intrinsic similarities, facilitating a more precise assessment of the specific impact of the AIPZ policy on CEI in different regions. As shown in Table 8, column (4) indicates that the AIPZ policy has a significant impact on CEI in energy-rich regions at the 10% significance level, with a coefficient of −0.089. This suggests that the implementation of the AIPZ policy contributes to a reduction in CEI in energy-rich regions. This effect is attributed to the ability of energy-rich regions to better utilize their abundant energy resources during policy implementation, integrate AI technology to optimize energy allocation, and enhance energy utilization efficiency, thereby achieving a reduction in CEI. Conversely, column (5) shows that the coefficient of AIPZ is not significant in energy-scarce regions. This is primarily due to the inherent bottlenecks in energy supply faced by energy-scarce regions, which make it challenging to effectively improve energy utilization efficiency in the short term, even with the introduction of the AIPZ policy and technologies.

5. Further Discussion

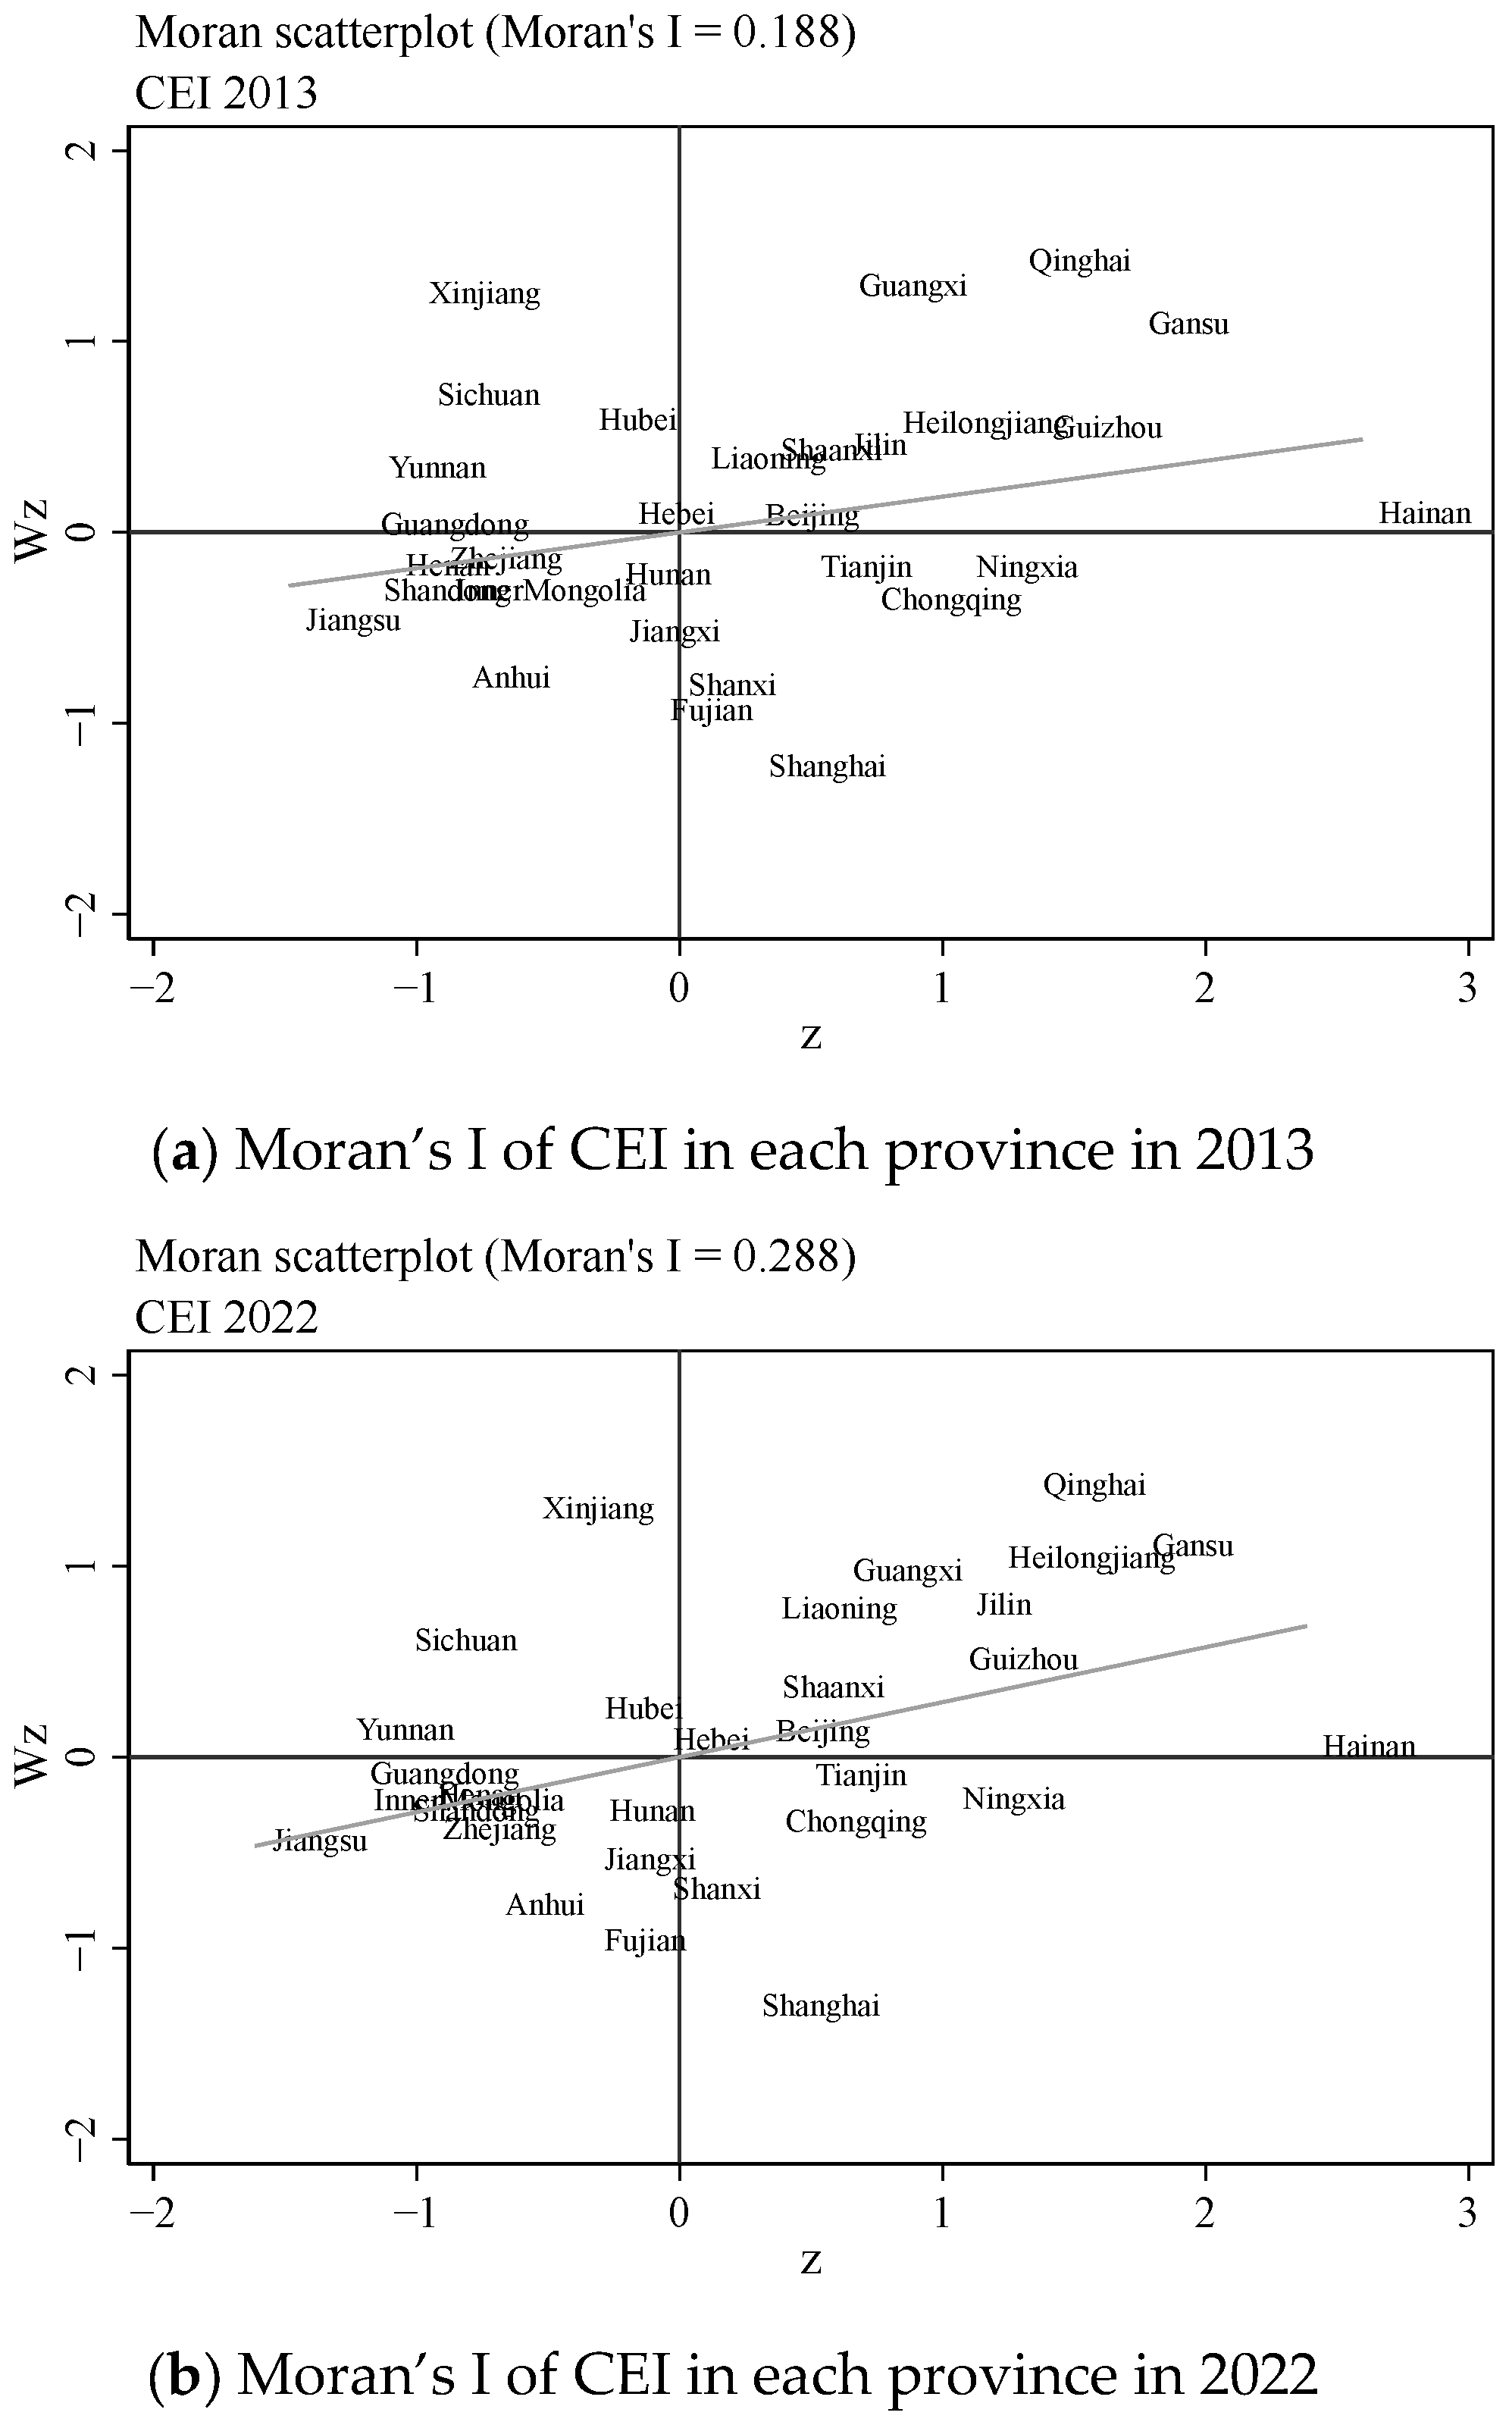
5.1. Spatial Autocorrelation Test

To investigate the spillover effects of carbon emissions reduction in regions with similar economic development, selecting an appropriate spatial weighting matrix is essential. Carbon reduction is influenced by both geographical factors and economic development. Regions with comparable economies often share industrial, energy, technological, and policy characteristics, which facilitate regional interactions and spillover effects. This study employs a spatial economic distance matrix to more effectively capture these interactions among economically similar regions. Additionally, it utilizes per capita GDP to evaluate provincial economic disparities, constructing an economic distance matrix that uses the inverse of economic distance as weights.
Before conducting the spatial econometric analysis, Moran’s I test was initially employed to examine spatial autocorrelation. Table 9 presents the Moran’s I values for all provinces concerning the CEI variable from 2013 to 2022. The test results indicate that the Moran’s I values for all years remained above 0, and that the index values have generally passed the significance test since 2017. Further analysis reveals that the Moran’s I values in 2013 and 2016 were relatively low, indicating weaker spatial clustering of CEI during these two years. However, as time progressed, the spatial clustering phenomenon of CEI gradually strengthened and the CEI values across provinces began to exhibit more pronounced spatial correlations.
The Moran’s I scatter plots of CEI for 2013 and 2022 illustrate the changes in the spatial agglomeration intensity of CEI. As shown in Figure 6, the distribution of CEI in 2013 was relatively scattered and largely random. In contrast, by 2022, the observed values for most provinces were concentrated in the first and third quadrants, indicating significant high–high and low–low agglomeration characteristics. Furthermore, from the perspective of local spatial characteristics, the CEI values of most provinces in the eastern regions demonstrate a radiating and driving effect, whereas the CEI values in most provinces in the western regions remain generally low.

5.2. Spatial Econometric Model Setting and Testing

The AIPZ policy may lead to the spatial clustering of CEI through resource flows. This paper develops a spatial econometric model to analyze the effects of the AIPZ policy on CEI. To ensure applicability, the most appropriate model was selected based on testing standards, resulting in the establishment of a comprehensive generalized nested spatial (GNS) model, as follows
C E I i t = ρ W C E I i t + δ W A I P Z i t + α 2 C o n t r o l i t + μ i + λ t + ε i t ε i t = λ W ε i t + ζ i t
where WAIPZit represents the spatial lag term of the explanatory variable; WCEIit denotes the spatial lag term of the explained variable; Wεit represents the spatial lag term of the error term; W represents the spatial weight matrix; and ζit represents the disturbance term. When δ = 0 and λ = 0, the model is SAR; when ρ = 0 and δ = 0, the model is SEM; when λ = 0, the GNS model becomes the SDM model. The above three models are generally the most commonly used; this paper mainly uses the LM method to test and select the optimal model.
Table 10 demonstrates that the LM_lag and R_LM_lag statistics are significant when employing the economic distance spatial weight matrix, while the LM_error statistics are not significant. This finding supports the appropriateness of the spatial lag model. Nan et al. [60] emphasize that spatial spillover effects during economic development primarily reflect the diffusion of carbon emissions, further validating the effectiveness of the spatial lag model in explaining these externalities. A Hausman test revealed a non-significant p-value, indicating that random effects are more suitable than fixed effects. Consequently, this study utilized the random effects spatial lag model (SARDID) for the subsequent regression analysis.

5.3. Spatial Spillover Effect Analysis

Table 11 presents the regression results obtained from the SARDID model, along with a decomposition of spatial effects. Column (1) indicates that the spatial lag regression coefficient (Rho) is significantly positive at the 10% level, suggesting that CEI exhibits substantial spatial dependence. Specifically, the CEI of a certain region is influenced to some extent by the CEI of neighboring provinces, with the CEI of adjacent regions tending to increase as the CEI of the focal region rises. Therefore, it is essential to construct a spatial panel model to more accurately describe and analyze the spatial correlation and dynamic changes in CEI.
This study uses partial differential methods to analyze the impact of the AIPZ policy on CEI, addressing potential biases from regression coefficients [61]. The direct effect measures the average impact on carbon intensity within a region, while the indirect effect assesses the influence on neighboring regions. The total effect combines both to evaluate the overall impact of the AIPZ policy on CEI across all regions.
Columns (2) to (4) of Table 11 indicate that both the direct and total effects of AIPZ are significantly negative at the 5% level. This finding suggests that the AIPZ policy effectively reduces a region’s CEI and has a positive impact on emissions reduction. The negative coefficient for the indirect effect of the AIPZ policy implies significant spillover effects on adjacent regions. In contrast, while FIN, OPEN, and CON exhibit positive direct effects, their indirect effects are insignificant, indicating a localized influence. This phenomenon may be attributed to regional variations in industrialization, technological advancement, financial growth, and openness, which likely limit spatial spillover effects.

6. Conclusions and Recommendations

This study investigates the New Generation Artificial Intelligence Innovation and Development Pilot Zones initiative as a quasi-natural experiment, utilizing panel data from 30 Chinese provinces (2013–2022). It employs multi-period DID and SARDID models to evaluate the carbon emissions reduction effects of the AIPZ policy, along with its spatial spillover effects. The primary findings are as follows:
(1)
The baseline regression analysis indicates that the AIPZ policy significantly reduces CEI, achieving an average emissions reduction of 6.9% per province. Robustness tests further support this conclusion;
(2)
The mechanism analysis indicates that human, technological, and financial resources are essential for achieving the emissions reduction goals of the AIPZ policy. A skilled workforce enhances AI research and development, advanced green technologies improve energy efficiency, and adequate financial support is critical for the successful implementation of projects;
(3)
The heterogeneity analysis indicates that the AIPZ policy affects CEI differently across various regions. Eastern regions, characterized by strong economies and high levels of innovation, achieve greater emissions reductions compared to central and western regions. Additionally, energy-rich areas demonstrate significant reductions, underscoring the necessity of integrating AI with traditional energy industries to reduce carbon emissions;
(4)
Spatial lag models indicate that the AIPZ policy not only exerts effects within its regions but also generates significant negative impacts on adjacent regions, demonstrating pronounced spatial spillover effects.
The findings of the above study have important policy implications.
First, the government should enhance its systematic support for the environmentally sustainable application of artificial intelligence. Currently, China is actively promoting the deep integration of the Digital China initiative and the “dual carbon” strategy. The AIPZ policy has already demonstrated the crucial role of artificial intelligence in facilitating green and low-carbon transformation. It is recommended that the national government further refine its top-level design, expand the coverage of pilot regions, and establish a long-term, stable fiscal incentive mechanism. The focus should be on strengthening financial guidance and tax incentives for research, development, and the practical application of emissions reduction technologies, thereby providing more robust policy support for AI companies and research institutions.
Second, to enhance emissions reduction effectiveness, it is essential to coordinate key resources such as human capital, technology, and finance. Currently, China faces several challenges, including the uneven regional distribution of high-end AI talent, inconsistent standards for green technology applications, and an incomplete green financial system. It is recommended to establish an AI Talent Special Program in pilot regions to promote collaborative training among industry, academia, and research institutions. This initiative aims to cultivate interdisciplinary talent with expertise in both AI and environmental science. Additionally, support should be provided for the development of AI-based carbon emissions management and energy efficiency optimization platforms to improve corporate emissions reduction efficiency. Furthermore, AI carbon emissions reduction projects should be integrated into the green finance support system, with enhanced assessment standards for green loans and green bonds to mitigate financing barriers and risks for enterprises during the green transition process.
Third, differentiated policies should be developed based on local conditions to address the significant variations in the effectiveness of AIPZ’s emissions reduction efforts across different regions. The central and western regions, which possess relatively weaker innovation capabilities, should enhance their AI-driven emissions reduction capacity through financial support from the central government, technical assistance, and project incubation. In contrast, the eastern regions should leverage their industrial and technological advantages to focus on key sectors, such as industry, construction, and transportation, establishing benchmark projects that demonstrate the effectiveness of carbon emissions reduction. Additionally, energy-rich regions should prioritize the low-carbon transformation of traditional high energy-consuming industries, such as coal, power, and petrochemicals, through AI, while fostering new drivers for local green growth.
Finally, the spatial spillover effects of AIPZ policies should be emphasized and mechanisms for regional coordination must be established. Given the current challenges to inter-regional governance coordination, it is advisable for the national government to promote the development of a cross-provincial Green Collaboration Platform to facilitate institutionalized cooperation in areas such as data interoperability, the alignment of technical standards, and the integration of green industrial chains. In key regions, including the Beijing-Tianjin-Hebei area, the Yangtze River Delta, and the Guangdong–Hong Kong-Macao Greater Bay Area, pilot projects for cross-regional collaboration can be initiated to explore pathways for collaborative governance.
This study has achieved certain results in the relevant field. However, there are still the following limitations: First, there is the policy time effect. The AIPZ policy has been implemented since 2019, which is a relatively short period of time, and the policy effects have not yet been fully realized. In addition, the external shock of the COVID-19 pandemic has disrupted the normal economic order and carbon emissions trends, increasing the difficulty of accurately assessing the policy effects. Second, there are limitations to the model’s method. Current spatial econometric models rely on predefined spatial weight matrices, which may fail to fully capture complex regional spatial relationships, potentially leading to an underestimation of carbon emissions spillover effects. Future research can be advanced in two directions. In terms of data, expanding data sources to collect enterprise-level data and conducting in-depth analyses of the specific mechanisms through which artificial intelligence influences carbon emissions. In terms of models, future research can include integrating geographic and economic information to optimize models, more accurately reflecting regional dependencies, and comprehensively analyzing carbon emission spillover effects.

Author Contributions

Conceptualization, L.W. and Z.Z.; methodology, Z.Z.; software, L.W.; validation, X.X.; formal analysis, L.W.; investigation, Y.W.; resources, X.X.; data curation, Z.Z.; writing—original draft preparation, L.W.; writing—review and editing, Z.Z.; visualization, X.X.; supervision, X.W.; project administration, X.X.; funding acquisition, X.X. All authors have read and agreed to the published version of the manuscript.

Funding

This research was funded by grants from the Science and Technology Project of Hebei Provincial Education Department (No. 2023213).

Institutional Review Board Statement

Not applicable.

Informed Consent Statement

Not applicable.

Data Availability Statement

Data will be made available upon request.

Acknowledgments

We would like to thank the editor and anonymous reviewers for their constructive comments and suggestions for improving the manuscript.

Conflicts of Interest

The authors declare that they have no known competing financial interests or personal relationships that could have appeared to influence the work reported in this paper.

References

  1. Ma, Z.; Xiao, H.; Li, J.; Chen, H.; Chen, W. Study on how the digital economy affects urban carbon emissions. Renew. Sustain. Energy Rev. 2025, 207, 114910. [Google Scholar] [CrossRef]
  2. Ma, R.; Bu, S. Evaluation and mitigation of carbon emissions in energy industry. Renew. Sustain. Energy Rev. 2025, 212, 115329. [Google Scholar] [CrossRef]
  3. Feng, L.; Qi, J.; Zheng, Y. How can AI reduce carbon emissions? Insights from a quasi-natural experiment using generalized random forest. Energy Econ. 2025, 141, 108040. [Google Scholar] [CrossRef]
  4. The International Energy Agency. Global Energy Review 2025; IEA: Paris, France, 2025; Available online: https://www.iea.org/reports/global-energy-review-2025#overview (accessed on 17 July 2025).
  5. Zhou, W.; Zhuang, Y.; Chen, Y. How does artificial intelligence affect pollutant emissions by improving energy efficiency and developing green technology. Energy Econ. 2024, 131, 107355. [Google Scholar] [CrossRef]
  6. An, K.; Wang, C.; Cai, W. Low-carbon technology diffusion and economic growth of China: An evolutionary general equilibrium framework. Struct. Change Econ. Dyn. 2023, 65, 253–263. [Google Scholar] [CrossRef]
  7. He, G.; Wang, S.; Zhang, B. Watering down environmental regulation in China. Q. J. Econ. 2020, 135, 2135–2185. [Google Scholar] [CrossRef]
  8. Piccialli, F.; Di Cola, V.S.; Giampaolo, F.; Cuomo, S. The role of artificial intelligence in fighting the COVID-19 pandemic. Inf. Syst. Front. 2021, 23, 1467–1497. [Google Scholar] [CrossRef]
  9. International Data Corporation. Worldwide AI and Generative AI Spending Guide; IDC: Framingham, MA, USA, 2024; Available online: https://my.idc.com/getdoc.jsp?containerId=IDC_P33198 (accessed on 18 July 2025).
  10. Forward-Looking Industry Research Institute. Analysis of the Current Status and Development Prospects of the Machine Learning Market in China in 2021. Forward-Looking Economist. 2021. Available online: https://baijiahao.baidu.com/s?id=1712049652611421985&wfr=spider&for=pc (accessed on 20 July 2025).
  11. Jiang, W.; Hu, Y.; Zhao, X. The impact of artificial intelligence on carbon market in China: Evidence from quantile-on-quantile regression approach. Technol. Forecast. Soc. Change 2025, 212, 123973. [Google Scholar] [CrossRef]
  12. Du, Z.; Xu, J.; Lin, B. What does the digital economy bring to household carbon emissions?—From the perspective of energy intensity. Appl. Energy 2024, 370, 123613. [Google Scholar] [CrossRef]
  13. Zhang, G.; Ma, S.; Zheng, M.; Li, C.; Chang, F.; Zhang, F. Impact of digitization and artificial intelligence on carbon emissions considering variable interaction and heterogeneity: An interpretable deep learning modeling framework. Sustain. Cities Soc. 2025, 125, 106333. [Google Scholar] [CrossRef]
  14. Cho, H.; Ackom, E. Artificial Intelligence (AI)-driven approach to climate action and sustainable development. Nat Commun 2025, 16, 1228. [Google Scholar] [CrossRef] [PubMed]
  15. Wang, Q.; Li, Y.; Li, R. Ecological footprints, carbon emissions, and energy transitions: The impact of artificial intelligence (AI). Hum. Soc. Sci. Commun. 2024, 11, 1043. [Google Scholar] [CrossRef]
  16. Cong, R.; Han, T.; Wang, P.; Zhao, L.; Gu, X.; Li, Z.; Qu, S.; Wei, Y. Advances and Prospects in Artificial Intelligence for Climate Change Governance. J. Beijing Inst. Technol. (Soc. Sci. Ed.) 2025, 27, 37–47. [Google Scholar] [CrossRef]
  17. Huang, Y.; Liu, S.; Gan, J.; Liu, B.; Wu, Y. How does the construction of new generation of national AI innovative development pilot zones drive enterprise ESG development? Empirical evidence from China. Energy Econ. 2024, 140, 108011. [Google Scholar] [CrossRef]
  18. Mijit, R.; Hu, Q.; Xu, J.; Ma, G. Greening through AI? The impact of Artificial Intelligence Innovation and Development Pilot Zones on green innovation in China. Energy Econ. 2025, 146, 108507. [Google Scholar] [CrossRef]
  19. Rane, N.; Choudhary, S.; Rane, J. Leading-edge Artificial Intelligence (AI), Machine Learning (ML), Blockchain, and Internet of Things (IoT) technologies for enhanced wastewater treatment systems. SSRN Electron. J. 2024. Available online: https://papers.ssrn.com/sol3/papers.cfm?abstract_id=4641557 (accessed on 24 July 2025).
  20. Wang, Z.; Zhang, T.; Ren, X.; Shi, Y. AI adoption rate and corporate green innovation efficiency: Evidence from Chinese energy companies. Energy Econ. 2024, 132, 107499. [Google Scholar] [CrossRef]
  21. Rasheed, M.Q.; Yuhuan, Z.; Ahmed, Z.; Haseeb, A.; Saud, S. Information communication technology, economic growth, natural resources, and renewable energy production: Evaluating the asymmetric and symmetric impacts of artificial intelligence in robotics and innovative economies. J. Clean Prod. 2024, 447, 141466. [Google Scholar] [CrossRef]
  22. Lin, B.; Yang, Y. Building efficiency: How the national AI innovation pilot zones enhance green energy utilization? Evidence from China. J. Environ. Manag. 2025, 387, 125945. [Google Scholar] [CrossRef]
  23. Barney, J. Firm Resources and Sustained Competitive Advantage. J. Manag. 1991, 17, 99–120. [Google Scholar] [CrossRef]
  24. Wernerfelt, B. A resource-based view of the firm. Strateg. Manag. J. 1984, 5, 171–180. [Google Scholar] [CrossRef]
  25. Grant, R.M. The resource-based theory of competitive advantage: Implications for strategy formulation. Calif. Manag. Rev. 1991, 33, 114–135. [Google Scholar] [CrossRef]
  26. Das, T.K.; Teng, B.S. Resource and risk management in the strategic alliance making process. J. Manag. 1998, 24, 21–42. [Google Scholar] [CrossRef]
  27. Sha, W.; Li, Y. Reverse technology spillover effects of OFDI, knowledge management and regional innovation capabilities. World Econ. Stud. 2018. Available online: https://kns.cnki.net/kcms2/article/abstract?v=mdHrqfOh4rH0vr8w8D1jnABSYLbkiUcLJG4RthhSG2-CnKiXyqQ9-xDnREuiRI4sjjQO7O4LOjGvG052Ofnlz_IXcGRBHqfUAHHo2YK_KpBGwK9A58QKnpLyU6C2DNoY-fwftPxYfgjRYH1MF1Af4pi6nX6weN0Ag5iOYjIg679beoocd_a8TvQeGYZi_qc5&uniplatform=NZKPT (accessed on 24 July 2025).
  28. Taddeo, M.; Tsamados, A.; Cowls, J.; Floridi, L. Artificial intelligence and the climate emergency: Opportunities, challenges, and recommendations. One Earth 2021, 4, 776–779. [Google Scholar] [CrossRef]
  29. Ariyanti, S.; Suryanegara, M.; Arifin, A.S.; Nurwidya, A.I.; Hayati, N. Trade-off between energy consumption and three configuration parameters in artificial intelligence (AI) training: Lessons for environmental policy. Sustainability 2025, 17, 5359. [Google Scholar] [CrossRef]
  30. Capozzoli, A.; Primiceri, G. Cooling Systems in Data Centers: State of Art and Emerging Technologies. In Proceedings of the 7th International Conference on Sustainability in Energy and Buildings (SEB-15), Lisbon, Portugal, 1–3 July 2015; pp. 484–493. [Google Scholar] [CrossRef]
  31. Luan, F.; Yang, X.; Chen, Y.; Regis, P.J. Industrial robots and air environment: A moderated mediation model of population density and energy consumption. Sustain. Prod. Consum. 2022, 30, 870–888. [Google Scholar] [CrossRef]
  32. Zhang, K.; Kou, Z.; Zhu, P.; Qian, X.; Yang, Y. How does AI affect urban carbon emissions? Quasi-experimental evidence from China’s AI innovation and development pilot zones. Econ. Anal. Policy 2025, 85, 426–447. [Google Scholar] [CrossRef]
  33. Delanoë, P.; Tchuente, D.; Colin, G. Method and evaluations of the effective gain of artificial intelligence models for reducing CO2 emissions. J. Environ. Manag. 2023, 331, 117261. [Google Scholar] [CrossRef]
  34. Zhong, W.; Liu, Y.; Dong, K.; Ni, G. Assessing the synergistic effects of artificial intelligence on pollutant and carbon emission mitigation in China. Energy Econ. 2024, 138, 107829. [Google Scholar] [CrossRef]
  35. Liang, S.; Yang, J.; Ding, T. Performance evaluation of AI driven low carbon manufacturing industry in China: An interactive network DEA approach. Comput. Ind. Eng. 2022, 170, 108248. [Google Scholar] [CrossRef]
  36. Cavalcanti, J.H.; Kovacs, T.; Ko, A.; Pocsarovszky, K. Production system efficiency optimization through application of a hybrid artificial intelligence solution. Int. J. Comput. Integr. Manuf. 2024, 37, 790–807. [Google Scholar] [CrossRef]
  37. Fontoura, L.; Luiz de Mattos Nascimento, D.; Neto, J.V.; Gusmão Caiado, R.G. Energy Gen-AI technology framework: A perspective of energy efficiency and business ethics in operation management. Technol. Soc. 2025, 81, 102847. [Google Scholar] [CrossRef]
  38. Ahmad, T.; Zhang, D.; Huang, C.; Zhang, H.; Dai, N.; Song, Y.; Chen, H. Artificial intelligence in sustainable energy industry: Status Quo, challenges and opportunities. J. Clean Prod. 2021, 289, 125834. [Google Scholar] [CrossRef]
  39. Awaworyi Churchill, S.; Inekwe, J.; Smyth, R.; Zhang, X. R&D intensity and carbon emissions in the G7: 1870–2014. Energy Econ. 2019, 80, 30–37. [Google Scholar] [CrossRef]
  40. Allal-Chérif, O.; Yela Aránega, A.; Castaño Sánchez, R. Intelligent recruitment: How to identify, select, and retain talents from around the world using artificial intelligence. Technol. Forecast. Soc. Change 2021, 169, 120822. [Google Scholar] [CrossRef]
  41. Tian, H.; Zhao, L.; Yunfang, L.; Wang, W. Can enterprise green technology innovation performance achieve “corner overtaking” by using artificial intelligence?—Evidence from Chinese manufacturing enterprises. Technol. Forecast. Soc. Change 2023, 194, 122732. [Google Scholar] [CrossRef]
  42. Yin, K.; Cai, F.; Huang, C. How does artificial intelligence development affect green technology innovation in China? Evidence from dynamic panel data analysis. Env. Sci Pollut Res 2022, 30, 28066–28090. [Google Scholar] [CrossRef]
  43. Bahoo, S.; Cucculelli, M.; Goga, X.; Mondolo, J. Artificial intelligence in Finance: A comprehensive review through bibliometric and content analysis. SN Bus Econ 2024, 4, 23. [Google Scholar] [CrossRef]
  44. Zeng, M.; Zhang, W. Green finance: The catalyst for artificial intelligence and energy efficiency in Chinese urban sustainable development. Energy Econ. 2024, 139, 107883. [Google Scholar] [CrossRef]
  45. Liu, J.; Chang, H.; Forrest, J.Y.L.; Yang, B. Influence of artificial intelligence on technological innovation: Evidence from the panel data of china’s manufacturing sectors. Technol. Forecast. Soc. Change 2020, 158, 120142. [Google Scholar] [CrossRef]
  46. Ding, T.; Li, J.; Shi, X.; Li, X.; Chen, Y. Is artificial intelligence associated with carbon emissions reduction? Case of China. Resour. Policy 2023, 85, 103892. [Google Scholar] [CrossRef]
  47. Li, L.; Li, M.; Ma, S.; Zheng, Y.; Pan, C. Does the construction of innovative cities promote urban green innovation? J. Environ. Manag. 2022, 318, 115605. [Google Scholar] [CrossRef]
  48. Wang, Q.; Sun, T.; Li, R. Does artificial intelligence promote green innovation? An assessment based on direct, indirect, spillover, and heterogeneity effects. Energy Environ. 2025, 36, 1005–1037. [Google Scholar] [CrossRef]
  49. Zhang, H.; Tan, X.; Liu, Y.; He, C. Exploring the effect of emission trading system on marginal abatement cost-based on the frontier synthetic difference-in-differences model. J. Environ. Manag. 2023, 347, 119155. [Google Scholar] [CrossRef] [PubMed]
  50. Ball, L.; Sheridan, N. Does Inflation Targeting Matter? In The Inflation-Targeting Debate; Bernanke, B.S., Woodford, M., Eds.; University of Chicago Press: Chicago, IL, USA, 2004; pp. 249–276. [Google Scholar]
  51. Alesina, A.; Zhuravskaya, E. Segregation and the quality of government in a cross section of countries. Am. Econ. Rev. 2011, 101, 1872–1911. [Google Scholar] [CrossRef]
  52. Baron, R.M.; Kenny, D.A. The moderator-mediator variable distinction in social psychological research: Conceptual, strategic, and statistical considerations. J. Pers. Soc. Psychol. 1986, 51, 1173–1182. [Google Scholar] [CrossRef] [PubMed]
  53. Zhang, X.; Wang, F. Hybrid input-output analysis for life-cycle energy consumption and carbon emissions of China’s building sector. Build. Environ. 2016, 104, 188–197. [Google Scholar] [CrossRef]
  54. Li, H. Does industrial robot adoption inhibit environmental pollution in China? An empirical study on energy consumption and green technology innovation. J. Environ. Manag. 2025, 373, 123392. [Google Scholar] [CrossRef]
  55. Ouyang, J.; Wei, D.; Wang, Y. The Impact of Artificial Intelligence on New Qualitative Productivity: Based on New Generation of Artificial Intelligence Innovation and Development Pilot Zone Policy Effects. Soft Sci. 2025, 39, 28–36. [Google Scholar] [CrossRef]
  56. Qin, M.; Su, A.H.; Li, R.; Su, C.W. Speculation, climate or pandemic: Who drives the Chinese herbal medicine bubbles? China Econ. Rev. 2024, 87, 102213. [Google Scholar] [CrossRef]
  57. Besley, T.; Case, A. Unnatural Experiments? Estimating the Incidence of Endogenous Policies. Econ. J. 2000, 110, 672–694. [Google Scholar] [CrossRef]
  58. Goodman-Bacon, A. Difference-in-differences with variation in treatment timing. J. Econom. 2021, 225, 254–277. [Google Scholar] [CrossRef]
  59. Liu, Y.; Dong, X.; Dong, K. Pathway to prosperity? The impact of low-carbon energy transition on China’s common prosperity. Energy Econ. 2023, 124, 106819. [Google Scholar] [CrossRef]
  60. Nan, S.; Huo, Y.; You, W.; Guo, Y. Globalization spatial spillover effects and carbon emissions: What is the role of economic complexity? Energy Econ. 2022, 112, 106184. [Google Scholar] [CrossRef]
  61. Lesage, J.P.; Pace, R.K. Introduction to Spatial Econometrics; CRC Press: Boca Raton, FL, USA, 2009; pp. 27–47. [Google Scholar]
Figure 1. Theoretical framework.
Sustainability 17 06858 g001
Figure 2. Spatial distribution of CEI in 30 provinces in China.
Sustainability 17 06858 g002
Figure 3. Parallel trend test: verifying the pre-treatment trends between the treatment and control groups.
Sustainability 17 06858 g003
Figure 4. Placebo test: assessing the robustness of the policy effect using a placebo treatment.
Sustainability 17 06858 g004
Figure 5. Goodman-Bacon decomposition: decomposing the multi-period DID estimate to identify potential biases in treatment effects.
Sustainability 17 06858 g005
Figure 6. Moran’s I of CEI in each province in 2013 and 2022.
Sustainability 17 06858 g006
Table 1. Summary table of AIPZ approval information.
Policy YearRegionNumber of Regions with Policies
2019Beijing, Shanghai, Tianjin, Shenzhen, Hangzhou, Hefei, Deqing7
2020Chongqing, Chengdu, Xi’an, Jinan, Guangzhou, Wuhan6
2021Suzhou, Changsha, Zhengzhou, Shenyang, Harbin5
Table 2. Definition of variables.
VariablesDefinitionDescription or Calculation Method
CEICarbon emissions intensityNatural logarithm of revenue per unit of carbon emissions.
AIPZPolicy dummy variableA value of 1 is assigned if a province implemented an AI pilot zone in the pilot year and in subsequent years; otherwise, a value of 0 is assigned.
URBUrbanizationThe proportion of the urban population in relation to the total population.
INDIndustrializationIndustrial added value as a percentage of regional GDP.
MARTechnology market development levelThe transaction volume of the technology market divided by the regional gross domestic product.
FINFinancial development levelThe total of deposits and loans divided by the regional GDP.
OPENTrade openness(Total value of goods imported and exported * exchange rate of the US dollar to RMB)/Regional GDP
CONSocial consumptionThe total sales of consumer goods in a society divided by the regional gross domestic product.
TSCScale of talentThe full-time equivalent of R&D personnel in large-scale industrial enterprises (person-years).
TSTTalent structureThe proportion of employed personnel in urban units of the information transmission, software, and information technology service industry among the permanent residents at the end of the year.
QGTIThe number of green technology innovationsThe logarithm of the number of green patent applications per 10,000 people.
QGTQThe quality of green technological innovationThe logarithm of the number of green invention patent applications per 10,000 individuals.
GFSThe scale of green financeThe ratio of regional green credit to regional GDP.
GFTGreen finance efficiencyThe reduction in carbon emissions resulting from the implementation of the green credit program by the unit.
Table 3. Descriptive statistics of variables.
VariablesNMeanSDMinMax
CEI3009.5860.7368.14511.654
AIPZ3000.1400.3480.0001.000
URB3000.6140.1140.3790.896
IND3000.3220.0750.1000.510
MAR3000.0200.0310.0000.191
FIN3003.5351.0851.9127.622
OPEN3000.2660.2570.0081.257
CON3000.3910.0600.1800.504
TSC30010.7191.4027.05413.557
TST3000.3640.6750.0824.623
QGTI3001.7332.2050.13814.602
QGTQ3000.8821.4300.05910.963
GFS3000.0760.1270.0000.862
GFT3001.2870.8510.1294.908
Table 4. Benchmark regression results.
Variables(1)(2)(3)
CEICEICEI
AIPZ−0.258 ***
(0.032)
−0.069 **
(0.030)
−0.069 **
(0.031)
URB −4.102 ***
(0.258)
−1.953 **
(0.878)
IND −0.688 *
(0.378)
−0.874
(0.516)
MAR −2.634 ***
(0.998)
−1.464
(1.060)
FIN 0.140 ***
(0.032)
0.143 ***
(0.041)
OPEN 0.486 ***
(0.120)
0.138
(0.095)
CON 0.022
(0.249)
−0.160
(0.273)
Constant9.622 ***
(0.127)
11.756 ***
(0.341)
10.813 ***
(0.544)
Individual FixedNONOYes
Time FixedNONOYes
R-squared0.1920.6830.714
N300300300
Note: Standard errors are shown in parentheses; ***, **, and * represent significance levels of 1%, 5%, and 10%, respectively. The following tables are the same.
Table 5. Results of endogeneity tests using two-stage least squares estimation.
Variables(1)(2)
First StageSecond Stage
AIPZCEI
AIPZ −2.8731 ***
(0.594)
IV_FO0.2281 ***
(0.043)
controlsYesYes
Individual FixedYesYes
Time FixedYesYes
N300300
F statistic15.90
C–D Wald F statistic27.981
(16.38)
Note: The values in parentheses for the C–D Wald F statistic correspond to the 10% critical values for Stock–Yogo. *** represents statistical significance at the 1% level.
Table 7. Results of mechanism analysis.
Variables(1)(2)(3)(4)(5)(6)
TSTTSCQGTIQGTQGFSGFT
AIPZ0.062 *
(0.033)
0.101 *
(0.060)
0.424 ***
(0.137)
0.244 **
(0.109)
0.052 **
(0.021)
0.350 **
(0.132)
Constant3.835 **
(1.496)
7.799 ***
(0.809)
15.089 **
(5.760)
10.868 *
(5.839)
1.312 **
(0.597)
−2.020
(1.693)
controlsYesYesYesYesYesYes
Individual FixedYesYesYesYesYesYes
Time FixedYesYesYesYesYesYes
R-squared0.6010.4150.7680.5850.2490.642
N300300300300300300
Note: ***, **, and * represent significance at the 1%, 5%, and 10% levels, respectively.
Table 8. Results of heterogeneity analysis.
Variables(1)(2)(3)(4)(5)
CEICEICEICEICEI
AIPZ−0.085 **
(0.030)
0.021
(0.044)
−0.058
(0.062)
−0.089 *
(0.047)
−0.060
(0.037)
Constant9.853 ***
(0.747)
14.054 ***
(1.105)
12.968 ***
(0.858)
12.522 ***
(0.648)
9.929 ***
(0.599)
controlsYesYesYesYesYes
Individual FixedYesYesYesYesYes
Time FixedYesYesYesYesYes
R-squared0.8860.8360.6600.6980.769
N11080110100200
Note: ***, **, and * represent significance at the 1%, 5%, and 10% levels, respectively.
Table 9. Global Moran’s I test results of CEI.
YearMoran’s Ip-ValueYearMoran’s Ip-Value
20130.1880.19320180.2600.086
20140.2130.14620190.2780.069
20150.2580.08820200.2790.069
20160.1940.18120210.2810.066
20170.2520.09220220.2880.061
Table 10. Results of the suitability test for spatial model selection.
Inspection TypeStatisticp-Value
LM_Error4.2330.000
R_LM_Error2.4380.118
LM_Lag17.9620.000
R_LM_Lag16.1670.000
Table 11. Results of spillover effect test.
Variables(1)(2)(3)(4)
MainDirectIndirectTotal
AIPZ−0.061 **
(0.030)
−0.062 **
(0.030)
−0.067 **
(0.033)
−0.129 ***
(0.046)
URB−3.799 ***
(0.306)
−3.849 ***
(0.250)
−0.373 *
(0.220)
−4.222 ***
(0.239)
IND−0.775 **
(0.364)
−0.767 **
(0.383)
−0.081
(0.075)
−0.848 *
(0.434)
MAR−2.475 ***
(0.956)
−2.419 **
(0.992)
−0.225
(0.169)
−2.644 **
(1.071)
FIN0.122 ***
(0.031)
0.119 ***
(0.036)
0.012
(0.008)
0.131 ***
(0.039)
OPEN0.435 ***
(0.116)
0.437 ***
(0.111)
0.042
(0.026)
0.479 ***
(0.120)
CON0.005
(0.237)
0.020
(0.222)
0.002
(0.025)
0.022
(0.242)
Rho0.095 *
(0.054)
sigma2_e0.012 ***
(0.001)
Individual FixedYesYesYesYes
Time FixedYesYesYesYes
R-squared0.6860.6860.6860.686
N300300300300
Note: ***, **, and * represent significance at the 1%, 5%, and 10% levels, respectively.
Disclaimer/Publisher’s Note: The statements, opinions and data contained in all publications are solely those of the individual author(s) and contributor(s) and not of MDPI and/or the editor(s). MDPI and/or the editor(s) disclaim responsibility for any injury to people or property resulting from any ideas, methods, instructions or products referred to in the content.

