Abstract
Cities serve as the primary arenas for achieving the strategic objectives of “carbon peak and carbon neutrality”. This study employed the LMDI method to systematically analyze the evolution trend of energy-related carbon emissions in Hong Kong and their influencing factors from 1980 to 2023. The main findings are as follows: (1) Hong Kong’s energy consumption structure remains dominated by coal and oil. Influenced by energy prices, significant shifts in this structure occurred across different periods. Imported electricity from mainland China, in particular, has exerted a promoting effect on the optimization of its energy consumption mix. (2) Economic output and population concentration are the primary drivers of increased carbon emissions. However, the contribution of economic growth to carbon emissions has gradually weakened in recent years due to a lack of new growth drivers. (3) Energy consumption intensity, energy consumption structure, and carbon intensity are the primary influencing factors in curbing carbon emissions. Among these, the carbon reduction impact of energy consumption intensity is the most significant. Hong Kong should continue to adopt a robust strategy for controlling total energy consumption to effectively mitigate carbon emissions. Additionally, it should remain vigilant regarding the potential implications of future energy price fluctuations. It is also essential to sustain cross-border energy cooperation, primarily based on electricity imports from the Pearl River Delta, while simultaneously expanding international and domestic supply channels for natural gas.
1. Introduction
Global carbon emissions continue to increase, with human activities exerting the most substantial influence on climate change. The Earth’s climate system is nearing an irreversible tipping point, and the urgent need for substantially reducing carbon emissions has become a critical priority [1,2,3]. The Paris Agreement calls for the global community to achieve the peak of carbon dioxide emissions as soon as feasible [4]. For this reason, the international community has been actively engaging in discussions regarding scientific strategies for emission reduction and temperature control. According to the “2024 Global Carbon Neutrality Annual Progress Report”, over 150 countries or regions have established carbon peaking or carbon neutrality targets. Cities serve as the primary arenas for achieving the strategic objectives of “carbon peaking and carbon neutrality”. Urban areas globally occupy approximately 3% of the land but generate more than 75% of the global GDP and account for over 70% of the total emissions [5,6]. As the world’s largest carbon-emitting country, over 85% of China’s carbon emissions are attributed to urban areas [7]. Cities have emerged as pivotal areas for managing carbon dioxide emissions [8,9,10,11,12,13,14]. The extent to which cities can effectively leverage their multi-dimensional functions across various domains—such as promoting the clean, low-carbon, and efficient use of energy; encouraging low-carbon lifestyles and construction paradigms; and facilitating low-carbon transformations in industries, buildings, transportation, and other sectors—will directly determine the successful and timely achievement of the strategic goals of “carbon peaking” and “carbon neutrality”.
Previous studies have focused on carbon emissions resulting from energy consumption at the city level in China. The majority of these studies concentrate on international metropolises such as Beijing, Shanghai, and Guangzhou, where rapid economic growth has significantly driven up both energy demand and carbon emissions [8,15]. Prior to 2008, Hong Kong’s total GDP significantly outpaced that of major mainland cities, including Beijing, Shanghai, and Guangzhou. However, as the reform and opening-up policy progressed, the GDP growth rate of mainland cities accelerated, leading to a gradual reduction in the GDP gap. Subsequently, after 2008, mainland cities began to surpass Hong Kong in terms of total GDP. Due to the disparities in economic growth rates, the growth rate of total energy consumption in Hong Kong is significantly lower than that in mainland Chinese cities. Taking Beijing, Shanghai, Tianjin, Chongqing, Guangzhou, and Hong Kong as case studies, Chong et al. have found that although economic growth and energy intensity are the most critical drivers influencing emission changes, the mechanisms through which various driving factors affect carbon emission levels differ significantly across cities and industrial sectors [3]. As one of the highly developed cities in China, Hong Kong has actively implemented measures to address climate change. In the “Hong Kong Climate Change Blueprint 2030+”, a target of reducing carbon emissions intensity by 65% to 70% from the 2005 level by 2030 was established. According to available data, Hong Kong’s carbon emissions intensity decreased by 23.73% in 2010 and by 37.33% in 2018, both figures being compared to the 2005 baseline. However, the current carbon emissions intensity in Hong Kong remains significantly distant from the 2030 goal. During the process of energy transition, Hong Kong places particular emphasis on regulatory measures, such as the Buildings Energy Efficiency Ordinance [16]. Dong et al. applied the STIRPAT model in conjunction with machine learning techniques to forecast building carbon emissions in Hong Kong; meanwhile, the results indicate that, in the absence of effective mitigation measures, both electricity demand and carbon emissions will continue to increase along the current trajectory [17]. Similar findings were reported by Wang et al., who predicted the buildings’ carbon emissions for each city in the Guangdong-Hong Kong-Macao Greater Bay Area (GBA) [18]. On 18 February 2019, the Central Committee of the Communist Party of China and the State Council issued the Outline Development Plan for the GBA. The plan proposes to “advance ecological civilization construction, establish a high-quality living environment that is conducive to residency, business operations, and tourism, reinforce and elevate Hong Kong’s role as an international financial, shipping, and trade center as well as an international aviation hub, and cultivate a more competitive global metropolis.” These new development objectives impose elevated standards for Hong Kong’s green and low-carbon development trajectory. In November 2020, the Chief Executive of the Hong Kong Special Administrative Region announced in the “2020 Policy Address” that Hong Kong would strive to achieve carbon neutrality by 2050. This target precedes the national-level goal of achieving carbon neutrality by 2060 by a decade. As such, the pursuit of carbon neutrality will necessitate accelerated and more urgent action in Hong Kong.
Hong Kong is currently at a pivotal stage in achieving its carbon neutrality objective. The strategies for promoting carbon reduction and realizing the vision of decreasing carbon emission intensity while attaining carbon neutrality constitute one of the key research topics in Hong Kong today [17,19,20,21,22]. Leung et al. conducted an empirical study on greenhouse gas emissions in Hong Kong from 1988 to 1998, revealing that carbon emissions in Hong Kong were primarily attributable to coal usage and reached a phased peak in 1993 [23]. To calculated the greenhouse gas emissions of the logistics industry in Hong Kong from 2007 to 2012 and revealed that carbon emissions from shipping far exceeded those from land transportation [24]. To et al. conducted a comprehensive analysis of greenhouse gas emissions from the power industry in Hong Kong between 2002 and 2015 using a full life cycle approach. Meanwhile, the study demonstrated that these emissions predominantly stemmed from coal and natural gas usage, while the integration of renewable energy and alternative energy sources within the power system remained relatively limited [25]. Zhou et al. systematically compiled the carbon dioxide emission inventory for the GBA and its surrounding regions using the inventory analysis method. These studies revealed that Guangzhou, Shaoguan, and Hong Kong were the top three cities in terms of total emissions, whereas Macao, Shenzhen, and Hong Kong exhibited the lowest carbon emission intensities among the region [26,27]. To et al. investigated the intricate interrelationship among greenhouse gas emissions, energy structure, population size, and economic development in Hong Kong; the research result indicates that economic growth has a significant impact on fossil energy demand and carbon emissions [28]. Huang et al. employed the EEBT and STIRPAT methodologies to investigate the embodied carbon emissions and their influencing factors in Hong Kong’s import and export trade between 1990 and 2015. The research findings revealed that Hong Kong acted as a net importer of carbon emissions, with economic growth and foreign trade exerting substantial drivers [29]. Dou et al. conducted a comprehensive study on carbon footprint from 2000 to 2015 and found that the trend of direct carbon emissions resulting from local energy consumption remained stable with a slight decrease, while indirect carbon emissions constituted a significantly larger proportion in Hong Kong [30]. As an international financial center, Hong Kong has been the focus of a study by Cao et al. [31], who found a significant negative correlation between a firm’s carbon emissions and its future stock returns in the Hong Kong stock market. Meanwhile, enhancing cooperation in local and regional carbon markets [32] and power system [33] can help reduce the cost of carbon emission mitigation for Hong Kong.
As an international metropolis in a developing country, Hong Kong exhibits typical regional characteristics in resource endowment, energy structure, development model, and technological level, etc. Nevertheless, there remains a notable gap in comparative analyses regarding the dynamic mechanisms of carbon emissions across different developmental stages within a specific region. As an international metropolis, Hong Kong faces significant challenges due to its severe scarcity of energy resources. In addition to relying heavily on international energy imports, there is currently insufficient in-depth research into the emission reduction potential of regional energy interconnection. Hong Kong is currently in a critical transition phase of low-carbon development. It is imperative to conduct in-depth research on how to further decouple energy consumption and carbon emissions from economic growth. This study, by analyzing historical factors, focuses on Hong Kong’s carbon dioxide emissions from 1980 to 2023 as the research subject to investigate the dynamic evolution and influencing factors of carbon emissions in Hong Kong. On one hand, this contributes to achieving carbon peaking and carbon neutrality; on the other hand, it also provides valuable experiential references for mainland cities such as Beijing, Shanghai, and Guangzhou. The marginal contribution of this study can be primarily summarized as follows: (1) By defining the accounting boundary for urban carbon emissions in Hong Kong, this study undertook a rigorous analysis of total energy consumption data. It is essential to take into account its role as an international shipping center, as these functions significantly influence total energy demand. The total energy consumption figures calculated in this study differ from those reported in existing databases, primarily due to variations in the methodologies used to estimate petroleum product volumes—particularly the distinction between sales figures and actual local consumption. (2) Based on the classic LMDI model, this study separated total energy consumption into two components: total fossil energy consumption and total non-fossil energy consumption, including renewable energy and purchased electricity. It primarily investigated the effects of energy consumption intensity, energy consumption structure, and energy carbon intensity (carbon intensity of fossil energy consumption) on carbon emissions in Hong Kong. (3) While annual analyses of factors influencing carbon emissions contribute to a better understanding of their underlying drivers, they remain inadequate in providing robust support for the development of effective policy measures. By delineating stages of socio-economic development, this study conducted comparative analyses of the driving mechanisms of urban carbon emissions under varying policy contexts, thereby broadening the application scenarios of the LMDI model and enhancing its relevance to real-world policy frameworks.
2. Literature Review
Research on urban-scale carbon emissions primarily centers on two key areas (Table 1): total carbon emission accounting and the analysis of influencing mechanisms. The former constitutes the foundational aspect of urban carbon emission studies, whereas the latter is crucial for the development of effective urban carbon mitigation policies. A central challenge in the total accounting of urban-scale carbon emissions involves determining appropriate accounting methodologies and defined scopes [34,35]. The primary methods employed include emissions inventory analysis and emissions simulation inversion. The accuracy of the inventory analysis method is contingent upon the statistical reliability of energy consumption data. The IPCC has contributed to the widespread adoption of this method by issuing the “1996 IPCC Guidelines for National Greenhouse Gas Inventories” and the “2006 IPCC Guidelines for National Greenhouse Gas Inventories,” which facilitate horizontal comparisons. As a result, the inventory analysis method is extensively used in carbon emission accounting across multiple scales, including national, provincial, and municipal levels. Currently, this method demonstrates strong applicability, with its key advantages being the capacity for time series analysis over consecutive periods and the ability to account for carbon emissions based on different industrial sectors and energy types. The emissions simulation inversion based on remote sensing primarily utilizes DMSP-OLS, NPP-VIIRS, and other nighttime light imagery to simulate and estimate carbon emissions. However, such satellite-based carbon emissions simulation inversion demands high data accuracy and is constrained by the resolution of carbon emission monitoring instruments, which may lead to certain inaccuracies in urban-scale carbon emission estimates. Nevertheless, with continuous improvements in the accuracy of remote sensing data and the increasing availability of POI (Point of Interest) data, emissions simulation inversion techniques can serve as a valuable supplement and provide important cross-validation for urban-scale carbon emission accounting. Clarifying the influencing factors of carbon dioxide emissions is a critical issue for effectively controlling and reducing emissions. In recent years, scholars worldwide have employed various analytical frameworks, including the IPAT model [36,37], the STIRPAT model (a stochastic form on the basis of the IPAT framework) [38,39,40], the index decomposition analysis (IDA) model [41,42] and the structural decomposition analysis (SDA) model [43,44], to investigate the determinants of carbon emissions. Research on the impact mechanisms of urban-scale carbon emissions primarily employs methodologies such as IDA, SDA, and regression analysis to identify the key drivers influencing the growth of urban carbon emissions (Table 1). Both IDA and SDA approaches are similar in that they decompose a total indicator, such as energy consumption or carbon emissions, into the product or sum of multiple contributing factors. However, SDA is typically applied in conjunction with Input–Output (IO) analysis, which limits its frequency and scope of application compared with IDA. Among various IDA models, the LMDI method has been extensively adopted in emission decomposition studies due to its absence of residual decomposition and its ability to effectively address the “0” value issue [41,45,46].

Table 1.
Examples of city-level carbon emissions studies in China.
3. Materials and Methods
3.1. Materials
Regarding the research on carbon emissions in Hong Kong, most studies rely on international databases or research reports [87,88], which may lead to certain discrepancies in data sources. In this study, the data sources primarily include the “Hong Kong Annual Digest of Statistics”, “Hong Kong Energy Statistics Annual Report”, and the “Hong Kong Energy Statistics” issued by the Census and Statistics Department of the Hong Kong Special Administrative Region and the “Hong Kong Energy End Use Data” provided by the Electrical and Mechanical Services Department of the Hong Kong Special Administrative Region, as well as relevant research reports from the Development Bureau of the Hong Kong Special Administrative Region. The energy consumption data spanning from 1980 to 2023 were extracted from the above materials. The total energy consumption data encompass coal, oil, natural gas, renewable energy, and imported electricity, with the unit being millions of tons of oil equivalent (Mtoe). Population size and economic aggregate data were sourced from the “Hong Kong Annual Digest of Statistics”. Additionally, for comparative purposes, total energy consumption from BP (https://www.bp.com (accessed on 8 May 2025)), population size, and GDP data from the World Bank’s WDI database (http://datatopics.worldbank.org/world-development-indicators (accessed on 8 May 2025)) were utilized. The population size was measured in units of thousands, while the economic aggregate data were converted based on 1980 USD, with the unit being billion dollars. Through the application of the selected decomposition model, a yearly analysis was conducted to identify the driving factors influencing carbon emissions in Hong Kong. Therefore, all economic-related data should be adjusted to constant prices in order to accurately analyze annual change trends. This study utilized GDP data (constant 1980 USD) based on official current GDP data from the World Bank to enhance the credibility and authority of the findings.
3.2. Total Carbon Emissions Accounting
As a complex system encompassing population, economy, industry, energy, resources, and technology [21], cities are not only internally interconnected but also increasingly linked with one another due to regional interdependence [89,90,91]. The primary challenge in calculating total carbon emissions at the urban scale involves precisely defining urban boundaries and determining the scope of the calculation [15,34,35,92]: the first accounting system quantifies the total direct carbon emissions within the urban boundary; the second accounting system accounts for the direct carbon emissions resulting from the consumption of imported energy, electricity, and heat originating outside the urban boundary; the third accounting system evaluates the indirect carbon emissions (embodied carbon) associated with urban consumer goods and services. The first accounting system, namely, the direct energy-related emissions, is estimated by the reference approach or sectoral approach recommended by the IPCC Guidelines for National Greenhouse Gas Inventories. The second accounting system, namely, the emissions of cross-boundary electricity, requires a clear understanding of the origin of electricity trade and the emission factors associated with the importing regions. Hong Kong imports electricity from the Daya Bay Nuclear Power Plant via the China Southern Power Grid. As this energy source does not produce carbon emissions, the associated emissions from this portion of the power supply are not accounted for in Hong Kong’s carbon emission inventory [30]. The third accounting system, namely, the embodied emissions associated with trade, relies on refined trade data or the MRIO model. The existence of regional interdependence indicates that current urban carbon accounting should incorporate cross-boundary electricity emissions and the embodied emissions associated with trade. However, access to long-term refined trade data or MRIO datasets is highly limited, which significantly hinders the implementation of this accounting approach. Therefore, total energy-related carbon emissions calculated in this study represent the direct emissions from the first accounting system. Energy-related carbon emissions are calculated based on fossil energy combustion (including coal, oil, and gas) arising during the transformation process and final consumption [2,93], emissions from wastes and agriculture, and fugitive emissions from oil and gas systems are not included in this study. Total energy-related carbon emissions are quantified using the inventory analysis method recommended by the IPCC’s administrative territorial scope [94], along with relevant carbon emission coefficients. The calculation formula is as follows:
Among these variables, i denotes the type of energy consumption, and C represents the total amount of carbon emissions. Ei indicates the consumption of energy type i. NCVi refers to the net calorific value of fuel for energy type i, which is the heat generated per physical unit of energy combustion. CCi signifies the carbon content of energy type i, representing the carbon dioxide emissions per unit of net calorific value generated by energy i. Oi denotes the combustion oxidation rate of energy type i. The term 44/12 represents the molecular weight ratio of carbon dioxide emissions to carbon.
3.3. The Extended Kaya Identity
Based on the Kaya Identity, drivers for carbon dioxide emissions are decomposed into four key dimensions: population size, per capita GDP, energy consumption intensity, and carbon intensity of energy consumption [95,96,97,98]. The corresponding expression formulas are presented as follows:
In Formula (2), P denotes population size, G denotes the GDP, E denotes total energy consumption, G/P represents the per capita GDP, E/G indicates the energy consumption intensity, and C/E signifies the carbon intensity of energy consumption.
The Kaya identity has been extended in previous studies [99,100,101,102,103], and its mathematical formulation is presented as follows:
In Formula (3), FEi represents the consumption of fossil energy i; p = P, which is the population size; g = G/P, which is per capita GDP; e = E/G, which represents the energy consumption intensity; s = FE/E, which represents the proportion of fossil energy consumption; f = C/FE, which represents the carbon intensity of fossil energy consumption. Currently, the energy consumption structure is undergoing continuous diversification. The classical Kaya Identity primarily focuses on the impact of total energy consumption on carbon dioxide emissions but overlooks the shifting proportions of non-fossil energies, such as wind power, photovoltaic power, and biomass, within overall energy consumption, as well as the changing proportions of fossil energies, including coal, oil, and natural gas. s (energy consumption structure) is primarily utilized to reflect the changes in the proportion of fossil and non-fossil energy sources within the energy consumption structure. A decrease in the total consumption of fossil energy in a given region is largely attributable to the rising share of non-fossil energy consumption, highlighting the transformation in the composition of non-fossil energy usage. The variable f (carbon intensity of fossil energy consumption) is primarily utilized to reflect variations in the proportional contributions of coal, oil, and natural gas within total fossil energy consumption. Regional carbon emissions predominantly stem from the consumption of fossil fuels. However, due to differences in carbon emission factors among coal, oil, and natural gas, changes in their respective consumption proportions ultimately influence regional carbon emissions. Therefore, the Kaya identity is extended to investigate the influence of energy structure on carbon emissions, enabling more diversified and in-depth analysis of the factors affecting carbon emissions.
3.4. The Logarithmic Mean Divisia Index
This study developed the LMDI model by extending the Kaya identity, and the corresponding calculation formula is presented as follows:
In Formulas (4) and (5), is the difference in carbon dioxide emissions from year 0 to year t. This difference comprises five components: the population size effect (); the economic output effect (); the energy consumption intensity effect (); the energy consumption structure effect (); and the carbon intensity of energy consumption effect (), which is simply referred to as the carbon intensity effect in this study. For the purpose of maintaining consistent expression, in this study, the terms C, carbon emissions, and carbon dioxide emissions are all used interchangeably to represent energy-related CO2.
4. Results
4.1. Energy Consumption in Hong Kong
For the precise calculation of total energy consumption in Hong Kong, it is essential to consider the city’s role as an international shipping center, which significantly influences its urban energy demands. Taking the international database as a reference, from 1980 to 2023, total energy consumption in Hong Kong increased from 6.57 million tons of oil equivalent (Mtoe) to 21.58 Mtoe. The discrepancies between the total energy consumption of Hong Kong calculated in this study and that reported in existing databases primarily stem from differences in the calculation of total oil product consumption, specifically the distinction between the sales volume of oil products and their local consumption volume. Through a detailed verification of the “Hong Kong Energy Statistics” and the “Hong Kong Energy End Use Data”, it was found that there are notable discrepancies between the sales and consumption figures for aviation gasoline and kerosene, as well as for gasoline, kerosene, diesel, and fuel oil in Hong Kong. The proportion of aviation gasoline and kerosene consumed in Hong Kong relative to total sales exhibited fluctuations, increasing from 0.80% in 1983 to 18.12% in 2008, before gradually declining to less than 0.2% in 2023. The share of gasoline consumption in Hong Kong as a percentage of total sales fluctuated and increased from 89.04% in 1983 to 97.75% in 2023. Kerosene consumption in Hong Kong consistently accounted for over 90% of total sales on average, with all kerosene being consumed domestically since 2018. Diesel consumption in Hong Kong as a proportion of total sales experienced fluctuations, decreasing from 88.71% in 1983 to 42.59% in 2018, followed by an increase to 66.59% in 2023. Fuel oil consumption in Hong Kong as a percentage of total sales steadily declined from 56.97% in 1983 to 0.9% in 2014, after which fuel oil was sold in Hong Kong but no longer consumed locally.
Based on the aforementioned analysis, this study systematically quantified the total energy consumption in Hong Kong (as shown in Figure 1). From 1980 to 2023, the total energy consumption in Hong Kong rose from 5.3 million tons of oil equivalent (Mtoe) to 12.4 Mtoe. From 1980 to 1993, the total energy consumption rose from 5.3 Mtoe in 1980 to 12.3 Mtoe in 1993, indicating a rapid growth trend with an average annual growth rate of 7.16%. Between 1993 and 1997, the total energy consumption experienced a slight decline, decreasing from 12.3 Mtoe to 11.5 Mtoe in 1997. This reduction was primarily attributed to the decreased consumption of coal, which resulted from Hong Kong’s initiation of purchasing electricity from the Chinese mainland starting in 1993 [30]. From 1997 to 1999, the total energy consumption in Hong Kong experienced a significant increase, primarily attributed to the sustained decline in diesel prices, which in turn stimulated a rapid rise in diesel consumption (Figure 2). From 1999 to 2007, the total energy consumption exhibited a fluctuating yet gradually declining trend. While the consumption of coal continued to increase, the price of diesel rose significantly from its lowest point in 1999 to its peak in 2007, leading to a rapid decline in diesel consumption. From 2007 to 2009, the total coal consumption experienced a decline, while the overall energy consumption exhibited a relatively rapid downward trend. Between 2009 and 2014, the total energy consumption remained stable with a slight increase during this period, reaching 14.3 Mtoe in 2014, corresponding to an average annual growth rate of 1.05%. From 2014 to 2019, the total energy consumption in Hong Kong remained relatively stable with a gradual decline, decreasing from 14.3 Mtoe in 2014 to 13.9 Mtoe in 2019. During this period, the average annual change rate of energy consumption was −0.53%. From 2019 to 2023, owing to the significant impact of the global COVID-19 pandemic, the total energy consumption experienced a sharp decline, falling from 13.9 Mtoe in 2019 to 12.4 Mtoe in 2023.
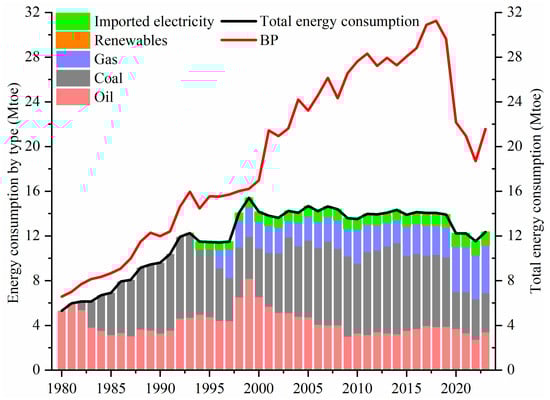
Figure 1.
Total energy consumption and the energy consumption structure in Hong Kong from 1980 to 2023.
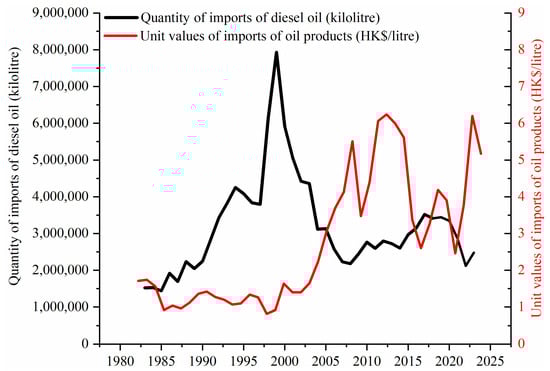
Figure 2.
The evolution trend of diesel prices and diesel consumption in Hong Kong from 1980 to 2023.
As illustrated in Figure 1, the energy consumption in Hong Kong has primarily consisted of coal and diesel. The share of coal consumption increased from 12.55% in 1982 to 61.55% in 1993, followed by fluctuations and a decline to 24.21% in 1999. Subsequently, the proportion of coal consumption rose again from 24.21% in 1999 to 56.85% in 2014, before experiencing further fluctuations and decreasing to 28.47% in 2023. The proportion of oil consumption exhibited fluctuations and declined from nearly 100% in 1980 to 53.02% in 1999, followed by a further decrease to 27.28% in 2023. Oil consumption is significantly influenced by variations in oil prices. Taking diesel as an example (as shown in Figure 2), the trend of diesel consumption in Hong Kong demonstrates an inverse relationship with changes in diesel prices. Specifically, diesel consumption tends to decrease when prices rise and increase when prices fall. The consumption of natural gas and imported electricity has exhibited a consistent upward trend. The proportion of natural gas consumption increased from 0.23% in 1995 to 19.48% in 2019, and subsequently surged to 34.54% in 2023. Similarly, the proportion of purchased electricity consumption steadily rose from 0.31% in 1993 to 8.07% in 2023. In 1995, natural gas was incorporated into the energy consumption mix as a substitute for a portion of coal-fired power generation. Between 1995 and 1999, there was a noticeable decline in coal usage. The first gas-fired power generation unit was established in Hong Kong in 1996. Since then, the average share of natural gas in the energy consumption structure has remained at approximately 17%. Hong Kong began to increase the use of imported electricity in 1993. The Daya Bay Nuclear Power Plant in Shenzhen started operation in 1993. Energy consumption in 1993 and beyond included electricity imported from the Chinese mainland (Figure 3). The Daya Bay Nuclear Power Plant is jointly developed and operated by Guangdong Nuclear Power Investment Co., Ltd. and Hong Kong Nuclear Power Investment Co., Ltd. The Daya Bay Nuclear Power Plant, as the first large-scale commercial nuclear power plant on the Chinese mainland, supplies 70% of the electricity it generates to Hong Kong, accounting for approximately one quarter of its social electricity consumption. In 2015, 80% of the electricity generated by the Daya Bay Nuclear Power Plant was transmitted to Hong Kong. Following this, the power generation capacity of local power plants progressively diminished, leading to an increased import of electricity from the Chinese mainland and a corresponding reduction in coal consumption in Hong Kong. Since 2006, wind power generation has been integrated into the local energy supply system. Renewable energy sources primarily comprise biomass energy, photovoltaic power, and wind power in Hong Kong.
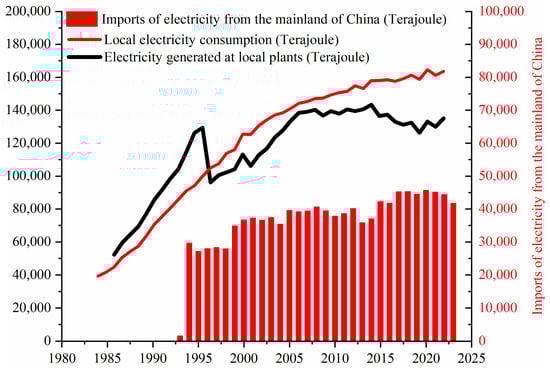
Figure 3.
Local electricity consumption and electricity generated at local plants and imports of electricity during 1980–2023.
4.2. Total Carbon Emissions and Carbon Emission Structure in Hong Kong
Since this study focused on quantifying direct emissions within Hong Kong’s urban area, carbon emissions resulting from air passenger and cargo transportation, as well as international maritime transportation, are excluded from the total carbon dioxide emissions of Hong Kong. It can be observed from Figure 4 that carbon emissions in Hong Kong are predominantly attributed to coal consumption, which constitutes a relatively large proportion of total carbon emissions. The peak occurred in 1991, when coal consumption accounted for 70.12% of the total carbon emissions. This similar result can also be found in [23,25].
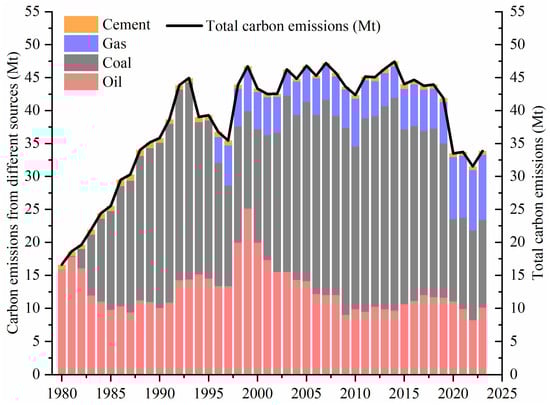
Figure 4.
Total carbon emissions and carbon emissions from different sources from 1980 to 2023 in Hong Kong.
Between 1980 and 2023, Hong Kong’s carbon emissions underwent a phase of rapid increase, followed by stabilization, and eventually a decline. Carbon emissions experienced a rapid increase from 1980 to 1993, rising from 16.6 million tons in 1980 to 44.9 million tons in 1993. From 1993 to 1997, carbon emissions in Hong Kong exhibited a downward trend. This decline was primarily attributed to the reduction in local coal consumption, which led to a decrease in carbon emissions to 35.5 million tons in 1997. During this period, the average annual change rate of carbon emissions was −5.91%. From 1997 to 1999, the rapid increase in local energy consumption led to a relatively swift rise in carbon emissions, with an average annual growth rate of 15.38%. Between 1999 and 2007, carbon emissions in Hong Kong remained relatively stable. From 2007 to 2009, a downward trend emerged. From 2009 to 2014, carbon emissions in Hong Kong exhibited a gradual increase, rising from 43.6 million tons in 2009 to 47.4 million tons in 2014. During this period, the average annual growth rate of carbon emissions was 1.58%. From 2014 to 2023, as a result of reduced coal consumption, carbon emissions in Hong Kong progressively declined.
It can be observed from Figure 5 that carbon emissions in Hong Kong are primarily attributed to the power industry and transportation, which account for average proportions of 68.7% and 17.1%, respectively. The contribution of buildings to carbon emissions remains relatively stable at approximately 4.1%. Meanwhile, the proportion of industrial combustion in carbon emissions exhibits a fluctuating downward trend.
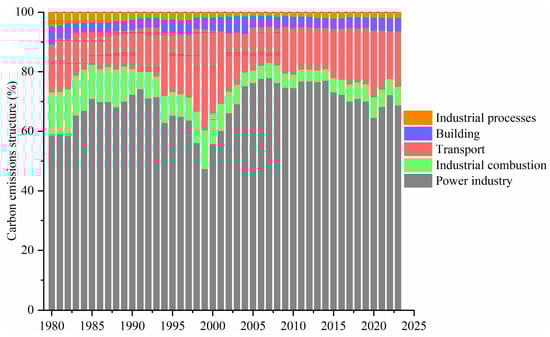
Figure 5.
Carbon emissions from different sectors from 1980 to 2023 in Hong Kong.
Overall, Hong Kong has witnessed four distinct phases of carbon emission peaks in 1993, 1999, 2007, and 2014. Among these, the total carbon emissions in 2007 and 2014 reached the highest levels among the four peaks over the past four decades. However, does this indicate that 2014 marked the apex of Hong Kong’s carbon emissions? Moving forward, continued efforts toward emission reduction remain imperative.
4.3. Decomposition Analysis of Carbon Emission Based on LMDI
Through the application of the LDMI decomposition model, a yearly analysis was conducted to identify the driving factors influencing carbon emissions in Hong Kong.
The contribution effects of population size (), economic output (), energy intensity (), energy structure (), and carbon intensity () were quantitatively analyzed across different years from 1980 to 2023 (Figure 6). Economic output serves as one of the primary factors driving the growth of carbon emissions in Hong Kong, whereas energy intensity acts as a key factor in restraining this growth.
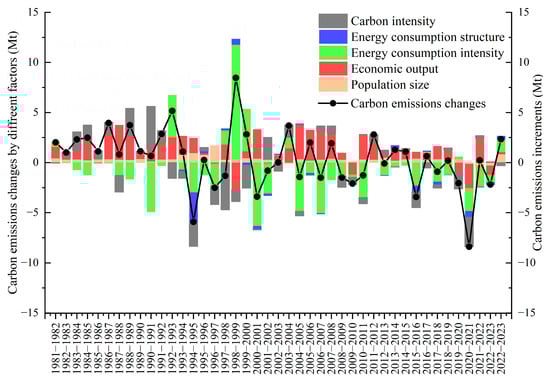
Figure 6.
Decomposition analysis of annual carbon emissions from 1980 to 2023 in Hong Kong.
The annual analysis provides comprehensive insights into drivers for emissions. However, it lacks robust support for the development of effective policy measures. This study overcomes the limitations of prior research that has not adequately accounted for factors such as stages of socio-economic development, regional development policies, and related measures. Through a comprehensive research framework incorporating multivariate and multi-period analytical techniques, it elucidates the underlying mechanism of multi-factor carbon emissions influencing regional disparities. Hong Kong has witnessed four distinct phases of carbon emission peaks in 1993, 1999, 2007, and 2014. Furthermore, significant events such as the 1997 Asian financial crisis, the 2007 global financial crisis, and the 2019 global outbreak of the COVID-19 pandemic have exerted notable influences on Hong Kong’s socio-economic development. Therefore, based on the time points of the phased carbon emission peaks and troughs with selected key socio-economic events since 1980, the characteristics of changes in its energy consumption structure, and the evolution of carbon emissions (Figure 7), this study divided the carbon emissions of Hong Kong over the past four decades into eight distinct evolutionary stages: 1980–1993, 1993–1997, 1997–1999, 1999–2007, 2007–2010, 2010–2014, 2014–2019, and 2019–2023 (Figure 8). This classification is informed by a combination of historical context and empirical data analysis.
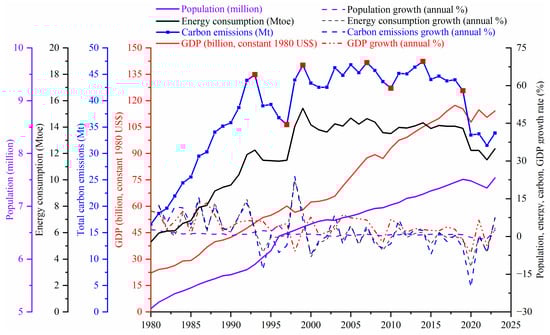
Figure 7.
The socio-economic development status and energy-carbon dynamics of Hong Kong since 1980.
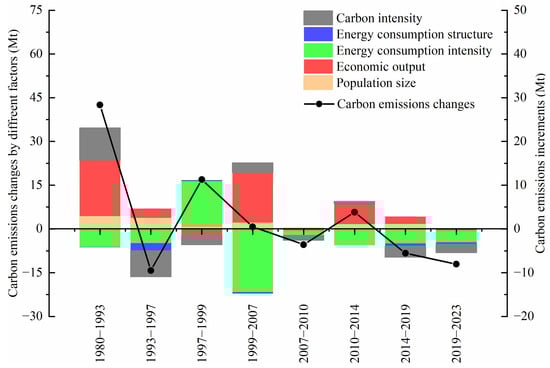
Figure 8.
Decomposition of emissions in different stages from 1980 to 2023 in Hong Kong.
Between 1980 and 2023, Hong Kong’s carbon emissions underwent a phase of rapid increase, followed by stabilization, and eventually a decline. Among the decomposed influencing factors, economic output and population size generally exhibit a positive correlation with carbon emissions. As an export-oriented economy, Hong Kong is highly susceptible to external environmental influences and exhibits significant economic volatility. Consequently, its contribution to carbon emissions varies across different stages. The third stage (1997–1999) and fifth stage (2007–2010) were adversely impacted by the financial crisis, while the eighth stage (2019–2023) was negatively influenced by the global COVID-19 pandemic. In other stages, economic output contributed positively to the increase in carbon emissions. However, with the deceleration of economic development, the extent to which economic growth drives carbon emissions has gradually diminished. Over the past four decades, the economic output effect has led to an increase in carbon emissions by 45.61 million tons, representing the most significant factor influencing carbon emission growth and contributing 264.09%. The population size effect ranks second in terms of its contribution to emission increases, with a contribution rate of 84.66%.
Energy consumption intensity, energy consumption structure, and carbon intensity collectively exert a restraining influence on carbon emissions in Hong Kong. Among these factors, the e effect is the most significant, playing a crucial role in suppressing the growth of carbon emissions. This effect results in a reduction of 32.3 million tons of carbon emissions, effectively offsetting the increase in carbon emissions driven by economic growth. Energy consumption intensity is closely associated with economic development and exhibits significant fluctuations across different stages. In the third stage (1997–1997), it demonstrates a positive effect, primarily attributed to the influence of the Asian financial crisis, during which GDP experienced negative growth while local energy consumption surged rapidly. Conversely, e displayed a negative effect in the remaining seven stages. Following the stabilization of total energy consumption in Hong Kong after 1999, energy consumption intensity has generally contributed to the mitigation of carbon emissions.
The s effect shows a weak negative effect on carbon emissions in Hong Kong. In the second stage (1993–1997), due to the introduction of nuclear power from the Chinese mainland, Hong Kong’s import of electricity from the Chinese mainland has been increasing continuously, playing a significant role in reducing emissions. The f effect generally plays a role in curbing carbon emissions. The extent of its effect at each stage is influenced by changes in coal consumption. As coal in Hong Kong is mainly used for power generation, the introduction of nuclear power and natural gas from the Chinese mainland after 1993 for power generation led to a significant decline in coal consumption during the second stage. The carbon intensity effect had the greatest carbon reduction effect during the second stage. During the first, fourth, and sixth stages, due to the increase in coal consumption, the carbon intensity effect had a carbon-increasing effect. During the second, third, fifth, seventh, and eighth stages, coal consumption decreased, playing a role in carbon reduction. Overall, the carbon intensity effect showed a relatively weak negative effect, reducing carbon emissions by 6.26 million tons.
First stage: 1983–1993. During this period, Hong Kong’s economy was large in scale and grew rapidly. Carbon emissions and per capita carbon emissions showed a rapid growth trend. With the rapid economic development, the demand for electricity in Hong Kong continued to rise. Facing the situation of a large population and limited land with scarce resources, the problem of electricity supply in Hong Kong gradually emerged. At the same time, due to the increase in oil prices in the Middle East, the power supply pattern that solely relied on oil for power generation would be difficult to sustain. To reduce dependence on oil, in 1982, Hong Kong began to adjust its energy structure and adopted coal-fired power generation, which was low in cost and stable in supply. As a result, coal consumption increased significantly and reached its peak in 1993. Under the combined influence of various factors, carbon emissions in Hong Kong grew relatively fast. Economic output was the main factor contributing to the increase in carbon emissions. During this period, Hong Kong’s total GDP increased by 1.91 times and per capita GDP increased by 1.74 times. The increase in carbon emissions caused by the g effect was 17.23 million tons. Due to the fact that Hong Kong’s energy consumption was mainly fossil energy during this period, the s effect was relatively small, reducing carbon emissions by 0.11 million tons.
Second stage: 1993–1997. During this period, the economic growth rate of Hong Kong slowed down, and carbon emissions, per capita carbon emissions, and carbon emissions intensity all dropped significantly, with average annual decline rates of 5.91%, 8.12%, and 9.90%, respectively. In 1993, the Daya Bay Nuclear Power Plant was completed, with 70% of its electricity output sent to Hong Kong, accounting for approximately one quarter of the total electricity consumption in Hong Kong. Coal imports and usage dropped sharply in Hong Kong. At the same time, natural gas power generation was introduced, further reducing coal imports. During this period, carbon emissions decreased significantly. Due to the substantial reduction in total energy consumption, carbon intensity was the most significant factor in curbing emissions, reducing carbon emissions by 8.98 million tons. Hong Kong began importing nuclear power from the Chinese mainland in 1993 and introduced natural gas power generation in 1995, replacing some coal-fired power generation, leading to a significant reduction in coal consumption [33]. Both the energy consumption intensity effect and the energy consumption structure effect were strong negative factors, reducing carbon emissions by 4.87 million tons and 2.57 million tons, respectively. Population size was the most influential factor, contributing an increase of 3.8 million tons. During this period, the growth rate of GDP was slower compared with the first phase. Therefore, compared with the first phase, the effect of economic output on the growth of carbon emissions weakened, contributing an increase of 3.14 million tons.
Third stage: 1997–1999. During this period, following its return, Hong Kong experienced the outbreak of the Asian financial crisis and a subsequent economic recession. The average annual GDP decline was 1.78%, yet energy consumption exhibited rapid growth. Carbon emissions, carbon intensity per thousand US dollars of GDP, and per capita carbon emissions all increased significantly, with respective average annual growth rates of 15.38%, 17.47%, and 14.35%. During this phase, Hong Kong’s carbon emissions demonstrated a relatively rapid upward trend. Due to limited growth in imported electricity and reduced natural gas usage, the most significant factors influencing emission reduction during this period were the carbon intensity and the economic output effect. Simultaneously, energy consumption grew rapidly, with energy consumption intensity being the primary driver of carbon emission growth, contributing an additional 15.63 million tons of carbon emissions. The population size effect and the energy consumption structure effect exhibited relatively minor impacts on emission increases.
Fourth stage: 1999–2007. China’s accession to the WTO significantly propelled the development of Hong Kong’s re-export trade, financial sector, and transportation industry. Additionally, since 2003, the signing of the “Closer Economic Partnership Arrangement (CEPA)” between the Chinese mainland and Hong Kong, along with the implementation of the “Individual Travel Scheme”, has facilitated rapid growth in both Hong Kong’s financial sector and tourism industry. During this period, Hong Kong achieved an average annual GDP growth rate of 5.28%, while carbon emissions exhibited a relatively slow average annual growth rate of 0.18%. The carbon intensity per thousand US dollars of GDP and per capita carbon emissions demonstrated downward trends, with average annual decline rates of 4.84% and 0.39%, respectively. Overall, carbon emissions in Hong Kong during this phase were characterized by a stable and gradual increase. Economic output emerged as the predominant factor influencing the rise in carbon emissions. Specifically, the economic output effect generated a substantial increase of 17.17 million tons of carbon emissions. The population size effect also contributed positively, resulting in an additional 2.15 million tons of carbon emissions. Furthermore, the carbon intensity effect, driven by increased coal consumption, led to an additional 3.37 million tons of carbon emissions. Conversely, despite the rapid economic development during this period, total energy consumption slightly decreased. The energy intensity effect played a significant role in reducing carbon emissions by 21.66 million tons. Lastly, due to the growing reliance on imported electricity from the Chinese mainland, the energy structure effect exhibited a minor negative impact.
Fifth stage: 2007–2009. This phase was significantly influenced by the global financial crisis of 2007. During this period, GDP contracted at an average annual rate of 0.19%. Carbon emissions, carbon emissions intensity, and per capita carbon emissions all exhibited substantial declines. In Hong Kong, carbon emissions experienced a slight decrease during this time. Due to the profound impact of the economic crisis, the g effect remained relatively stable in 2008 but demonstrated a negative trend in 2009. The economic downturn suppressed approximately 0.54 million tons of carbon emissions. Meanwhile, the p effect exerted a modest positive influence. Coal consumption decreased slightly during this period. The f effect played a limited role in emission reductions. Given the decline in both total energy consumption and economic activity, the e effect had a significant impact on emission reductions. Lastly, the energy consumption structure effect manifested as a minor negative influence, reducing carbon emissions by approximately 0.13 million tons.
Sixth stage: 2010–2014. During this phase, adhering to the principle of maintaining a free-market economy, Hong Kong implemented a range of economic policies, leading to a gradual recovery in economic growth. In 2014, carbon emissions reached a phased peak. Both total carbon emissions and per capita carbon emissions increased during this period. Conversely, carbon emissions per thousand US dollars of GDP decreased, exhibiting an average annual decline rate of 2.15%. Overall, Hong Kong experienced a slight increase in carbon emissions during this timeframe. Among the various factors influencing carbon emissions, the e effect was the sole factor that mitigated emission growth. Economic output remained the most significant driver. Population size played a relatively minor role. During this period, there was a decrease in both natural gas consumption and electricity imports, while coal consumption increased. The f effect and s effect demonstrated relatively small positive impacts.
Seventh stage: 2014–2019. In recent years, as the global economy has faced increasing downward pressure, the mainland’s economy has experienced rapid growth, whereas Hong Kong’s economic development has lacked new momentum. The expansion rate of the financial sector has gradually decelerated, and the competitiveness and status of Hong Kong as a global trade hub have been progressively eroded. During this period, Hong Kong’s GDP growth slowed compared with previous periods, with an average annual growth rate of 2.80%. Carbon emissions, carbon intensity per thousand US dollars of GDP, and per capita carbon emissions all exhibited a declining trend. Continuous growth in Hong Kong’s electricity imports from the Chinese mainland during this period demonstrated a negative energy structure effect. The import of electricity also contributed to a decrease in coal consumption for power generation, leading to a carbon intensity effect that significantly reduced carbon emissions by 3.88 million tons. Energy consumption intensity remained the most critical factor in suppressing carbon emission growth, primarily due to the slowing economic development and reduced local energy consumption. Economic output continued to be the dominant factor driving the increase in carbon emissions during this phase; however, its impact diminished notably compared with earlier stages. The p effect manifested as a relatively minor positive influence.
Eighth stage: 2019–2023. Owing to the profound impact of the global COVID-19 pandemic, there was a notable decline in population size, economic output, energy consumption, and carbon emissions during this period. Hong Kong sustained the downward trend in carbon emissions observed in the preceding phase, achieving a reduction of 8.03 million tons. At this stage, the population size effect emerged as the sole factor stimulating an increase in carbon emissions, contributing an additional 0.14 million tons. The e effect continued to be the most significant factor in emission mitigation. During this period, both oil and coal supplies, which were heavily reliant on international markets, experienced varying degrees of decline. Meanwhile, Hong Kong received an increased supply of natural gas from the Chinese mainland, leading to a rapid rise in the proportion of natural gas consumption. Carbon intensity effect served as the second most important factor in curbing carbon emission growth, reducing emissions by 2.92 million tons. Additionally, the supply of renewable electricity, particularly biofuels and photovoltaic power, witnessed substantial growth, enabling the energy structure effect to continue playing a role in mitigating carbon emission growth, with a reduction of 0.63 million tons.
5. Conclusions and Discussion
5.1. Conclusions
Between 1980 and 2023, Hong Kong’s carbon emissions underwent a phase of rapid increase, followed by stabilization, and eventually a decline. Coal consumption constituted the primary source of carbon emissions in Hong Kong. This study employed the Kaya identity and the LMDI factor decomposition model to quantitatively analyze the impact of multiple factors on carbon emissions in Hong Kong from 1980 to 2023, yielding the following primary conclusions: (1) Economic output emerged as the predominant factor driving the increase in carbon emissions in Hong Kong. Its contribution varied across different stages of development. Given the vulnerability of Hong Kong’s economy to external factors and its inherent volatility, as the economic growth rate gradually decelerated, the influence of the economic output effect also diminished accordingly. The population size effect served as a significant driver of carbon emission growth, second only to the economic output effect. Its impact on carbon emissions at various stages remained relatively stable. (2) The energy consumption intensity effect played a crucial role in mitigating the growth of carbon emissions in Hong Kong, largely counterbalancing the emissions induced by economic growth. Energy consumption intensity is closely linked to economic development and exhibits substantial fluctuations across different stages. In the third stage, it demonstrated a positive effect, primarily due to the repercussions of the Asian financial crisis, which led to negative GDP growth while energy consumption surged rapidly. Conversely, the remaining seven stages all exhibited negative effects, with the fourth stage achieving the most pronounced emission reduction outcome. (3) The energy consumption structure effect performed a restraining effect on carbon emissions in Hong Kong. Its influence varied at different stages and was relatively small. The main reason was that the change in the use of clean energy in Hong Kong was relatively small. Hong Kong began to import nuclear power from the Chinese mainland in the second stage, and the emission reduction effect of the energy consumption structure effect gradually emerged and remained stable. (4) The carbon intensity effect generally played a role in restraining the growth of carbon emissions. Its degree of influence at different times was affected by the change in coal consumption. In the first, fourth, and sixth stages, due to the increase in coal consumption, the carbon intensity effect played a role in increasing emissions. In the second, third, fifth, seventh, and eighth stages, coal consumption decreased, and the carbon intensity effect played a role in reducing emissions. Overall, the carbon intensity effect had a relatively weak negative effect.
Compared with previous study [3], Hong Kong exhibits consistent findings with those observed in Beijing, Shanghai, Tianjin, and Chongqing; the economic growth effect and energy intensity effect are the most critical factors influencing carbon emission changes. Compared with a similar study previously conducted in Suzhou [8], scale-related factors such as economic output and technological factors such as energy consumption intensity have profound effects on changes in energy consumption, as well as carbon emissions in Suzhou and Hong Kong during similar development stages. Compared with similar study previously conducted in Guangzhou [15], imported electricity had a significant emissions mitigation effect in Guangzhou and Hong Kong.
5.2. Discussion
Cities serve as key entities in achieving the strategic objectives of “carbon peak and carbon neutrality”. At present, Hong Kong is at a crucial stage in its efforts to realize carbon neutrality. How to achieve this goal while simultaneously reducing carbon emission intensity has become an urgent and significant research priority for the city. To accurately assess Hong Kong’s total energy consumption, it is essential to take into account its role as an international shipping center, as these functions significantly influence total energy demand. The total energy consumption figures calculated in this study differ from those reported in existing databases, primarily due to variations in the methodologies used to estimate petroleum product volumes—particularly the distinction between sales figures and actual local consumption.
Over the past four decades, the increase in energy consumption in Hong Kong, driven by population growth, economic development, and transformations in its energy structure, has directly or indirectly affected carbon emissions. While annual analyses of factors influencing carbon emissions contribute to a better understanding of their underlying drivers, they remain inadequate in providing robust support for the development of effective policy measures. This study overcomes the limitations of prior research that has not adequately accounted for factors such as stages of socio-economic development, regional development policies, etc. Through a comprehensive research framework incorporating multivariate and multi-period analytical technique, it elucidates the underlying mechanism of multi-factor carbon emissions influencing regional disparities. In the context of constructing a new development paradigm within the GBA, advancing Hong Kong’s green and sustainable development has emerged as a critical strategic objective at the current stage. Presently, Hong Kong’s contribution to carbon emission reduction, particularly in terms of energy consumption structure and carbon intensity, remains relatively modest. Enhancing the impact of these two factors in reducing emissions will be a key pathway for Hong Kong to achieve its low-carbon transition in the future. The energy consumption structure in Hong Kong remains predominantly reliant on fossil fuels and is significantly influenced by fluctuations in energy prices. Consequently, it is essential to effectively implement emergency prevention and control measures in response to price changes, thereby mitigating the impact of such fluctuations on the energy consumption structure. Hong Kong should continue to enhance regional energy cooperation and actively explore energy interconnection within the GBA. On one hand, it is essential to maintain a stable long-term contract for the Daya Bay Nuclear Power Plant, ensuring that its pricing remains largely unaffected by international market fluctuations. On the other hand, a long-term natural gas supply agreement has already been signed with the West-East Gas Pipeline Project, guaranteeing a reliable supply of natural gas at competitive prices below those typically found in the international market. As a significant portion of coal consumption in Hong Kong is utilized for power generation, it is imperative to proactively introduce additional clean energy sources for electricity production. Future plans should consider increasing the import of electricity from the Daya Bay Nuclear Power Plant while enhancing natural gas-based power generation to gradually replace coal consumption. This approach will contribute to optimizing Hong Kong’s energy consumption structure.
The existence of regional interdependence indicates that current urban carbon accounting should incorporate the embodied emissions associated with trade. However, access to long-term refined trade data is highly limited, which significantly hinders the implementation of this accounting approach. As a leading international financial center and shipping hub, Hong Kong is well positioned to strengthen its long-term research initiatives focused on carbon emissions associated with trade and shipping in the future. Due to limitations in data availability, this study was unable to obtain energy consumption data for specific industries. As a result, the industrial structure factor was not incorporated into the decomposition model. Industrial structure serves as a critical factor influencing regional carbon emissions, thereby warranting a comprehensive and in-depth investigation.
Author Contributions
F.W. and C.W.: conceptualization, methodology, formal analysis, validation, visualization, writing—original draft. C.S. and S.C.: formal analysis, data curation, validation. C.W.: data curation, visualization. Q.Z.: founding, supervision. All authors have read and agreed to the published version of the manuscript.
Funding
This research was supported by the Science and Technology Projects of Zhejiang Province (2022C03168), and the Major project of Wenzhou Science & Technology Bureau (ZG2024042), the National Natural Science Foundation of China (42371317), the Guangdong Basic and Applied Basic Research Foundation (2023A1515030098), the Project of Guangzhou Xinhua University (2024KYZDZK01, 2024J039-2, S202413902023) and the GDAS Special Project of Science and Technology Development (2020GDASYL-20200102002).
Institutional Review Board Statement
Not applicable.
Informed Consent Statement
Not applicable.
Data Availability Statement
The authors have not obtained permission to publish the data. Therefore, the data can be obtained from the corresponding author upon reasonable request.
Conflicts of Interest
The authors declare no conflicts of interest.
References
- Tollefson, J. Diagnosing Earth: The science behind the IPCC’s upcoming climate report. Nature 2021. [Google Scholar] [CrossRef]
- Friedlingstein, P.; O’Sullivan, M.; Jones, M.W.; Andrew, R.M.; Hauck, J.; Landschützer, P.; Le Quéré, C.; Li, H.; Luijkx, I.T.; Olsen, A.; et al. Global Carbon Budget 2024. Earth Syst. Sci. Data 2025, 17, 965–1039. [Google Scholar] [CrossRef]
- Chong, W.H.B.; Guan, D.; Guthrie, P. Comparative Analysis of Carbonization Drivers in China’s Megacities. J. Ind. Ecol. 2012, 16, 564–575. [Google Scholar] [CrossRef]
- Meinshausen, M.; Lewis, J.; McGlade, C.; Gütschow, J.; Nicholls, Z.; Burdon, R.; Cozzi, L.; Hackmann, B. Realization of Paris Agreement pledges may limit warming just below 2 °C. Nature 2022, 604, 304–309. [Google Scholar] [CrossRef]
- Elmqvist, T.; Andersson, E.; Frantzeskaki, N.; McPhearson, T.; Olsson, P.; Gaffney, O.; Takeuchi, K.; Folke, C. Sustainability and resilience for transformation in the urban century. Nat. Sustain. 2019, 2, 267–273. [Google Scholar] [CrossRef]
- Keith, M.; Birch, E.; Buchoud, N.J.A.; Cardama, M.; Cobbett, W.; Cohen, M.; Elmqvist, T.; Espey, J.; Hajer, M.; Hartmann, G.; et al. A new urban narrative for sustainable development. Nat. Sustain. 2023, 6, 115–117. [Google Scholar] [CrossRef]
- Dhakal, S. Urban energy use and carbon emissions from cities in China and policy implications. Energy Policy 2009, 37, 4208–4219. [Google Scholar] [CrossRef]
- Wang, C.; Wang, F.; Huang, G.; Wang, Y.; Zhang, X.; Ye, Y.; Lin, X.; Zhang, Z. Examining the Dynamics and Determinants of Energy Consumption in China’s Megacity Based on Industrial and Residential Perspectives. Sustainability 2021, 13, 764. [Google Scholar] [CrossRef]
- Parrish, D.D.; Zhu, T. Clean Air for Megacities. Science 2009, 326, 674–675. [Google Scholar] [CrossRef]
- Acuto, M.; Parnell, S.; Seto, K.C. Building a global urban science. Nat. Sustain. 2018, 1, 2–4. [Google Scholar] [CrossRef]
- Duren, R.M.; Miller, C.E. Measuring the carbon emissions of megacities. Nat. Clim. Change 2012, 2, 560–562. [Google Scholar] [CrossRef]
- Rosenzweig, C.; Solecki, W.; Hammer, S.A.; Mehrotra, S. Cities lead the way in climate-change action. Nature 2010, 467, 909–911. [Google Scholar] [CrossRef]
- Li, Y.; Lin, J.; Wang, Q.; Zhuang, X.; Zhang, Q.; Chen, D.; Zhou, T.; Dang, N. Evolutionary Analysis of the Spatial and Temporal Patterns of Coupled Coordination between Environmental Regulation Intensity and Net Carbon Emissions from Land Use in the Bohai Rim Region. J. Fujian Norm. Univ. (Nat. Sci. Ed.) 2024, 40, 29–39. [Google Scholar]
- Zhang, Q.; Lin, J.; Wang, Q.; Chen, D.; Zhou, T.; Dang, N.; Zhuang, X.; Li, Y.; Luo, D. The Impact of Main Functional Area Strategy on Regional Energy Consumption Carbon Emission: A Case Study of Fujian Province. J. Fujian Norm. Univ. (Nat. Sci. Ed.) 2024, 40, 30–43. [Google Scholar]
- Wang, C.; Wu, K.; Zhang, X.; Wang, F.; Zhang, H.; Ye, Y.; Wu, Q.; Huang, G.; Wang, Y.; Wen, B. Features and drivers for energy-related carbon emissions in mega city: The case of Guangzhou, China based on an extended LMDI model. PLoS ONE 2019, 14, e0210430. [Google Scholar] [CrossRef] [PubMed]
- Wong, P.; Lai, J. Energy Transitions in Cities: A Comparative Analysis of Policies and Strategies in Hong Kong, London, and Melbourne. Energies 2025, 18, 37. [Google Scholar] [CrossRef]
- Dong, H.; Zhang, L. Transition towards carbon neutrality: Forecasting Hong Kong’s buildings carbon footprint by 2050 using a machine learning approach. Sustain. Prod. Consum. 2023, 35, 633–642. [Google Scholar] [CrossRef]
- Wang, X.; Li, Y.; You, K. Revealing the Historical Peak Situation of CO2 Emissions from Buildings in the Great Bay Area. Buildings 2025, 15, 1927. [Google Scholar] [CrossRef]
- Cai, M.; Shi, Y.; Ren, C. Developing a high-resolution emission inventory tool for low-carbon city management using hybrid method—A pilot test in high-density Hong Kong. Energy Build. 2020, 226, 110376. [Google Scholar] [CrossRef]
- Chen, L.; Huo, C. Impact of Green Innovation Efficiency on Carbon Emission Reduction in the Guangdong-Hong Kong-Macao GBA. Sustainability 2021, 13, 13450. [Google Scholar] [CrossRef]
- Wang, C.; Ye, Y.; Huang, Z. Synergistic development in the Guangdong-Hong Kong-Macao Greater Bay Area: Index measurement and systematic evaluation based on industry-innovation-infrastructure-institution perspectives. J. Clean. Prod. 2024, 434, 140093. [Google Scholar] [CrossRef]
- Luo, Y.; Shen, J.; Liang, H.; Sun, L.; Dong, L. Supporting building life cycle carbon monitoring, reporting and verification: A traceable and immutable blockchain-empowered information management system and application in Hong Kong. Resour. Conserv. Recycl. 2024, 208, 107736. [Google Scholar] [CrossRef]
- Leung, D.Y.C.; Lee, Y.T. Greenhouse gas emissions in Hong Kong. Atmos. Environ. 2000, 34, 4487–4498. [Google Scholar] [CrossRef]
- To, W.M. Greenhouse gases emissions from the logistics sector: The case of Hong Kong, China. J. Clean. Prod. 2015, 103, 658–664. [Google Scholar] [CrossRef]
- To, W.M.; Lee, P.K.C. GHG emissions from electricity consumption: A case study of Hong Kong from 2002 to 2015 and trends to 2030. J. Clean. Prod. 2017, 165, 589–598. [Google Scholar] [CrossRef]
- Zhou, Y.; Shan, Y.; Liu, G.; Guan, D. Emissions and low-carbon development in Guangdong-Hong Kong-Macao Greater Bay Area cities and their surroundings. ApEn 2018, 228, 1683–1692. [Google Scholar] [CrossRef]
- Zhou, Y.; Li, K.; Liang, S.; Zeng, X.; Cai, Y.; Meng, J.; Shan, Y.; Guan, D.; Yang, Z. Trends, Drivers, and Mitigation of CO2 Emissions in the Guangdong–Hong Kong–Macao Greater Bay Area. Engineering 2023, 23, 138–148. [Google Scholar] [CrossRef]
- To, W.-M.; Lee, P.K.C. Energy Consumption and Economic Development in Hong Kong, China. Energies 2017, 10, 1883. [Google Scholar] [CrossRef]
- Huang, R.; Lv, G.; Chen, M.; Zhu, Z. CO2 emissions embodied in trade: Evidence for Hong Kong SAR. J. Clean. Prod. 2019, 239, 117918. [Google Scholar] [CrossRef]
- Dou, X.; Deng, Z.; Sun, T.; Ke, P.; Zhu, B.; Shan, Y.; Liu, Z. Global and local carbon footprints of city of Hong Kong and Macao from 2000 to 2015. Resour. Conserv. Recycl. 2021, 164, 105167. [Google Scholar] [CrossRef]
- Cao, J.; Zhan, X.; Zhang, W.; Zhang, Y. The return predictability of carbon emissions: Evidence from Hong Kong and Singapore. Pac.-Basin Financ. J. 2023, 82, 102177. [Google Scholar] [CrossRef]
- Zheng, J.; Li, X.; Nam, K.-M. Impacts of local and regional carbon markets in Hong Kong and China’s Greater Bay Area: A dynamic CGE analysis. Energy Policy 2025, 204, 114651. [Google Scholar] [CrossRef]
- Peng, W.; Chen, Y.; Wang, S. Synergistic decarbonization strategies for high-density cities and their neighboring areas: A case for Hong Kong and Guangdong’s power system. ApEn 2025, 396, 126173. [Google Scholar] [CrossRef]
- Arioli, M.S.; D’Agosto, M.d.A.; Amaral, F.G.; Cybis, H.B.B. The evolution of city-scale GHG emissions inventory methods: A systematic review. Environ. Impact Assess. Rev. 2020, 80, 106316. [Google Scholar] [CrossRef]
- Chen, G.; Shan, Y.; Hu, Y.; Tong, K.; Wiedmann, T.; Ramaswami, A.; Guan, D.; Shi, L.; Wang, Y. Review on City-Level Carbon Accounting. Environ. Sci. Technol. 2019, 53, 5545–5558. [Google Scholar] [CrossRef]
- Waggoner, P.E.; Ausubel, J.H. A framework for sustainability science: A renovated IPAT identity. Proc. Natl. Acad. Sci. USA 2002, 99, 7860–7865. [Google Scholar] [CrossRef]
- Chertow, M.R. The IPAT Equation and Its Variants. J. Ind. Ecol. 2000, 4, 13–29. [Google Scholar] [CrossRef]
- York, R.; Rosa, E.A.; Dietz, T. STIRPAT, IPAT and ImPACT: Analytic tools for unpacking the driving forces of environmental impacts. Ecol. Econ. 2003, 46, 351–365. [Google Scholar] [CrossRef]
- Liddle, B. Urban density and climate change: A STIRPAT analysis using city-level data. J. Transp. Geogr. 2013, 28, 22–29. [Google Scholar] [CrossRef]
- Liddle, B. What are the carbon emissions elasticities for income and population? Bridging STIRPAT and EKC via robust heterogeneous panel estimates. Glob. Environ. Change 2015, 31, 62–73. [Google Scholar] [CrossRef]
- Ang, B.W.; Choi, K.H. Decomposition of aggregate energy and gas emission intensities for industry: A refined Divisia index method. Energy J. 1997, 18, 59–73. [Google Scholar] [CrossRef]
- Ang, B.W.; Zhang, F.Q. A survey of index decomposition analysis in energy and environmental studies. Energy 2000, 25, 1149–1176. [Google Scholar] [CrossRef]
- Fujii, H.; Okamoto, S.; Kagawa, S.; Managi, S. Decomposition of toxicity emission changes on the demand and supply sides: Empirical study of the US industrial sector. Environ. Res. Lett. 2017, 12, 124008. [Google Scholar] [CrossRef]
- Gerveni, M.; Fernandes Tomon Avelino, A.; Dall’erba, S. Drivers of Water Use in the Agricultural Sector of the European Union 27. Environ. Sci. Technol. 2020, 54, 9191–9199. [Google Scholar] [CrossRef]
- Ang, B.W. LMDI decomposition approach: A guide for implementation. Energy Policy 2015, 86, 233–238. [Google Scholar] [CrossRef]
- Wang, H.; Ang, B.W.; Su, B. Assessing drivers of economy-wide energy use and emissions: IDA versus SDA. Energy Policy 2017, 107, 585–599. [Google Scholar] [CrossRef]
- Zhao, R.; Huang, X.; Zhong, T.; Liu, Y.; Chuai, X. Carbon flow of urban system and its policy implications: The case of Nanjing. Renew. Sustain. Energy Rev. 2014, 33, 589–601. [Google Scholar] [CrossRef]
- Li, J.S.; Chen, G.Q. Energy and greenhouse gas emissions review for Macao. Renew. Sustain. Energy Rev. 2013, 22, 23–32. [Google Scholar] [CrossRef]
- Wang, Y.; Ma, W.; Tu, W.; Zhao, Q.; Yu, Q. A study on carbon emissions in Shanghai 2000–2008, China. Environ. Sci. Policy 2013, 27, 151–161. [Google Scholar] [CrossRef]
- Bi, J.; Zhang, R.; Wang, H.; Liu, M.; Wu, Y. The benchmarks of carbon emissions and policy implications for China’s cities: Case of Nanjing. Energy Policy 2011, 39, 4785–4794. [Google Scholar] [CrossRef]
- Li, J.S.; Chen, G.Q.; Lai, T.M.; Ahmad, B.; Chen, Z.M.; Shao, L.; Ji, X. Embodied greenhouse gas emission by Macao. Energy Policy 2013, 59, 819–833. [Google Scholar] [CrossRef]
- Cai, B.; Lu, J.; Wang, J.; Dong, H.; Liu, X.; Chen, Y.; Chen, Z.; Cong, J.; Cui, Z.; Dai, C.; et al. A benchmark city-level carbon dioxide emission inventory for China in 2005. ApEn 2019, 233–234, 659–673. [Google Scholar] [CrossRef]
- Liang, S.; Zhang, T. Managing urban energy system: A case of Suzhou in China. Energy Policy 2011, 39, 2910–2918. [Google Scholar] [CrossRef]
- Sugar, L.; Kennedy, C.; Leman, E. Greenhouse Gas Emissions from Chinese Cities. J. Ind. Ecol. 2012, 16, 552–563. [Google Scholar] [CrossRef]
- Chen, G.Q.; Guo, S.; Shao, L.; Li, J.S.; Chen, Z.-M. Three-scale input–output modeling for urban economy: Carbon emission by Beijing 2007. Commun. Nonlinear Sci. Numer. Simul. 2013, 18, 2493–2506. [Google Scholar] [CrossRef]
- Vause, J.; Gao, L.; Shi, L.; Zhao, J. Production and consumption accounting of CO2 emissions for Xiamen, China. Energy Policy 2013, 60, 697–704. [Google Scholar] [CrossRef]
- Mi, Z.; Zhang, Y.; Guan, D.; Shan, Y.; Liu, Z.; Cong, R.; Yuan, X.-C.; Wei, Y.-M. Consumption-based emission accounting for Chinese cities. ApEn 2016, 184, 1073–1081. [Google Scholar] [CrossRef]
- Cai, B.; Cui, C.; Zhang, D.; Cao, L.; Wu, P.; Pang, L.; Zhang, J.; Dai, C. China city-level greenhouse gas emissions inventory in 2015 and uncertainty analysis. ApEn 2019, 253, 113579. [Google Scholar] [CrossRef]
- Wang, H.; Lu, X.; Deng, Y.; Sun, Y.; Nielsen, C.P.; Liu, Y.; Zhu, G.; Bu, M.; Bi, J.; McElroy, M.B. China’s CO2 peak before 2030 implied from characteristics and growth of cities. Nat. Sustain. 2019, 2, 748–754. [Google Scholar] [CrossRef]
- Shan, Y.; Guan, Y.; Hang, Y.; Zheng, H.; Li, Y.; Guan, D.; Li, J.; Zhou, Y.; Li, L.; Hubacek, K. City-level emission peak and drivers in China. Sci. Bull. 2022, 67, 1910–1920. [Google Scholar] [CrossRef] [PubMed]
- Zhang, L.; Ruan, J.; Zhang, Z.; Qin, Z.; Lei, Z.; Cai, B.; Wang, S.; Tang, L. City-level pathways to carbon peak and neutrality in China. Cell Rep. Sustain. 2024, 1, 100102. [Google Scholar] [CrossRef]
- Su, Y.; Chen, X.; Li, Y.; Liao, J.; Ye, Y.; Zhang, H.; Huang, N.; Kuang, Y. China’s 19-year city-level carbon emissions of energy consumptions, driving forces and regionalized mitigation guidelines. Renew. Sustain. Energy Rev. 2014, 35, 231–243. [Google Scholar] [CrossRef]
- Zhou, C.; Wang, S. Examining the determinants and the spatial nexus of city-level CO2 emissions in China: A dynamic spatial panel analysis of China’s cities. J. Clean. Prod. 2018, 171, 917–926. [Google Scholar] [CrossRef]
- Chen, J.; Gao, M.; Cheng, S.; Hou, W.; Song, M.; Liu, X.; Liu, Y.; Shan, Y. County-level CO2 emissions and sequestration in China during 1997–2017. Sci. Data 2020, 7, 391. [Google Scholar] [CrossRef]
- Wang, F.; Wang, C.; Lin, X.; Li, Z.; Sun, C. County-Level Spatiotemporal Dynamics and Driving Mechanisms of Carbon Emissions in the Pearl River Delta Urban Agglomeration, China. Land 2024, 13, 1829. [Google Scholar] [CrossRef]
- Gao, S.; Zhang, X.; Chen, M. Spatiotemporal dynamics and driving forces of city-level CO2 emissions in China from 2000 to 2019. J. Clean. Prod. 2022, 377, 134358. [Google Scholar] [CrossRef]
- Liu, Z.; Zhong, J.; Liu, Y.; Liang, Y.; Li, Z. Dynamic simulation of street-level carbon emissions in megacities: A case study of Wuhan City, China (2015–2030). Sustain. Cities Soc. 2024, 115, 105853. [Google Scholar] [CrossRef]
- Wang, J.; Wei, J.; Zhang, W.; Liu, Z.; Du, X.; Liu, W.; Pan, K. High-resolution temporal and spatial evolution of carbon emissions from building operations in Beijing. J. Clean. Prod. 2022, 376, 134272. [Google Scholar] [CrossRef]
- Zheng, Y.; Li, W.; Jiang, L.; Yuan, C.; Xiao, T.; Wang, R.; Cai, M.; Hong, H. Spatial modelling of street-level carbon emissions with multi-source open data: A case study of Guangzhou. Urban Clim. 2024, 55, 101974. [Google Scholar] [CrossRef]
- Shao, S.; Yang, L.; Gan, C.; Cao, J.; Geng, Y.; Guan, D. Using an extended LMDI model to explore techno-economic drivers of energy-related industrial CO2 emission changes: A case study for Shanghai (China). Renew. Sustain. Energy Rev. 2016, 55, 516–536. [Google Scholar] [CrossRef]
- Liu, Z.; Liang, S.; Geng, Y.; Xue, B.; Xi, F.; Pan, Y.; Zhang, T.; Fujita, T. Features, trajectories and driving forces for energy-related GHG emissions from Chinese mega cites: The case of Beijing, Tianjin, Shanghai and Chongqing. Energy 2012, 37, 245–254. [Google Scholar] [CrossRef]
- Wang, Z.; Yin, F.; Zhang, Y.; Zhang, X. An empirical research on the influencing factors of regional CO2 emissions: Evidence from Beijing city, China. ApEn 2012, 100, 277–284. [Google Scholar] [CrossRef]
- Wang, Y.; Zhao, H.; Li, L.; Liu, Z.; Liang, S. Carbon dioxide emission drivers for a typical metropolis using input–output structural decomposition analysis. Energy Policy 2013, 58, 312–318. [Google Scholar] [CrossRef]
- Wang, M.; Che, Y.; Yang, K.; Wang, M.; Xiong, L.; Huang, Y. A local-scale low-carbon plan based on the STIRPAT model and the scenario method: The case of Minhang District, Shanghai, China. Energy Policy 2011, 39, 6981–6990. [Google Scholar] [CrossRef]
- Wang, Z.; Liu, W. Determinants of CO2 emissions from household daily travel in Beijing, China: Individual travel characteristic perspectives. ApEn 2015, 158, 292–299. [Google Scholar] [CrossRef]
- Tan, X.; Dong, L.; Chen, D.; Gu, B.; Zeng, Y. China’s regional CO2 emissions reduction potential: A study of Chongqing city. ApEn 2016, 162, 1345–1354. [Google Scholar] [CrossRef]
- Wang, Z.; Yang, Y. Features and influencing factors of carbon emissions indicators in the perspective of residential consumption: Evidence from Beijing, China. Ecol. Indic. 2016, 61 Pt 2, 634–645. [Google Scholar] [CrossRef]
- Yang, S.; Cao, D.; Lo, K. Analyzing and optimizing the impact of economic restructuring on Shanghai’s carbon emissions using STIRPAT and NSGA-II. Sustain. Cities Soc. 2018, 40, 44–53. [Google Scholar] [CrossRef]
- Wang, H.; Wang, Y.; Wang, H.; Liu, M.; Zhang, Y.; Zhang, R.; Yang, J.; Bi, J. Mitigating greenhouse gas emissions from China’s cities: Case study of Suzhou. Energy Policy 2014, 68, 482–489. [Google Scholar] [CrossRef]
- Feng, K.; Hubacek, K.; Sun, L.; Liu, Z. Consumption-based CO2 accounting of China’s megacities: The case of Beijing, Tianjin, Shanghai and Chongqing. Ecol. Indic. 2014, 47, 26–31. [Google Scholar] [CrossRef]
- Gu, Y.; Li, C. Shanghai Transport Carbon Emission Forecasting Study Based on CEEMD-IWOA-KELM Model. Sustainability 2024, 16, 8140. [Google Scholar] [CrossRef]
- Zeng, Y.; Yuan, X.; Hou, B. Analysis of Carbon Emission Reduction at the Port of Integrated Logistics: The Port of Shanghai Case Study. Sustainability 2023, 15, 10914. [Google Scholar] [CrossRef]
- Kang, J.; Zhao, T.; Liu, N.; Zhang, X.; Xu, X.; Lin, T. A multi-sectoral decomposition analysis of city-level greenhouse gas emissions: Case study of Tianjin, China. Energy 2014, 68, 562–571. [Google Scholar] [CrossRef]
- Zheng, X.; Wang, R.; He, Q. A city-scale decomposition and decoupling analysis of carbon dioxide emissions: A case study of China. J. Clean. Prod. 2019, 238, 117824. [Google Scholar] [CrossRef]
- Ding, R.; Tian, D.; Wei, Y. Driving Factors and Decoupling Effect of Energy-Related Carbon Emissions in Beijing, 2013–2020. Sustainability 2025, 17, 3940. [Google Scholar] [CrossRef]
- Li, Y.; Dai, J.; Zhao, H. Analysis of collaborative emission reduction of air pollutants and greenhouse gases under carbon neutrality target: A case study of Beijing, China. Clean Technol. Environ. Policy 2024, 26, 3995–4008. [Google Scholar] [CrossRef]
- Chung, W.; Kam, M.S.; Ip, C.Y. A study of residential energy use in Hong Kong by decomposition analysis, 1990–2007. ApEn 2011, 88, 5180–5187. [Google Scholar] [CrossRef]
- Harris, P.G.; Chow, A.S.Y.; Symons, J. Greenhouse gas emissions from cities and regions: International implications revealed by Hong Kong. Energy Policy 2012, 44, 416–424. [Google Scholar] [CrossRef]
- Pasinetti, L.L. Causality and interdependence in econometric analysis and in economic theory. Struct. Change Econ. Dynam. 2019, 49, 357–363. [Google Scholar] [CrossRef]
- Liu, J.; Dietz, T.; Carpenter, S.R.; Alberti, M.; Folke, C.; Moran, E.; Pell, A.N.; Deadman, P.; Kratz, T.; Lubchenco, J.; et al. Complexity of coupled human and natural systems. Science 2007, 317, 1513–1516. [Google Scholar] [CrossRef]
- Taylor, P.J.; Hoyler, M.; Verbruggen, R. External Urban Relational Process: Introducing Central Flow Theory to Complement Central Place Theory. Urban Stud. 2010, 47, 2803–2818. [Google Scholar] [CrossRef]
- Wiedmann, T.; Chen, G.; Owen, A.; Lenzen, M.; Doust, M.; Barrett, J.; Steele, K. Three-scope carbon emission inventories of global cities. J. Ind. Ecol. 2021, 25, 735–750. [Google Scholar] [CrossRef]
- Cui, C.; Li, S.; Zhao, W.; Liu, B.; Shan, Y.; Guan, D. Energy-related CO2 emission accounts and datasets for 40 emerging economies in 2010–2019. Earth Syst. Sci. Data 2023, 15, 1317–1328. [Google Scholar] [CrossRef]
- Guan, D.; Liu, Z.; Geng, Y.; Lindner, S.; Hubacek, K. The gigatonne gap in China’s carbon dioxide inventories. Nat. Clim. Change 2012, 2, 672–675. [Google Scholar] [CrossRef]
- Nakicenovic, N.; Alcamo, J.; Davis, G.; Vries, B.D. Special Report on Emissions Scenarios: A Special Report of the Working Group III of the Intergovernmental Panel on Climate Change; United Nations Digital Library System: New York, NY, USA, 2000. [Google Scholar]
- Raupach, M.R.; Marland, G.; Ciais, P.; Le Quere, C.; Canadell, J.G.; Klepper, G.; Field, C.B. Global and regional drivers of accelerating CO2 emissions. Proc. Natl. Acad. Sci. USA 2007, 104, 10288–10293. [Google Scholar] [CrossRef] [PubMed]
- Davis, S.J.; Caldeira, K. Consumption-based accounting of CO2 emissions. Proc. Natl. Acad. Sci. USA 2010, 107, 5687–5692. [Google Scholar] [CrossRef]
- Lin, B.; Moubarak, M. Decomposition analysis: Change of carbon dioxide emissions in the Chinese textile industry. Renew. Sustain. Energy Rev. 2013, 26, 389–396. [Google Scholar] [CrossRef]
- González-Torres, M.; Pérez-Lombard, L.; Coronel, J.F.; Maestre, I.R. Revisiting Kaya Identity to define an Emissions Indicators Pyramid. J. Clean. Prod. 2021, 317, 128328. [Google Scholar] [CrossRef]
- Tavakoli, A. A journey among top ten emitter country, decomposition of “Kaya Identity”. Sustain. Cities Soc. 2018, 38, 254–264. [Google Scholar] [CrossRef]
- Lima, F.; Nunes, M.L.; Cunha, J.; Lucena, A.F.P. A cross-country assessment of energy-related CO2 emissions: An extended Kaya Index Decomposition Approach. Energy 2016, 115 Pt 2, 1361–1374. [Google Scholar] [CrossRef]
- Remuzgo, L.; Sarabia, J.M. International inequality in CO2 emissions: A new factorial decomposition based on Kaya factors. Environ. Sci. Policy 2015, 54, 15–24. [Google Scholar] [CrossRef]
- Mahony, T.O. Decomposition of Ireland’s carbon emissions from 1990 to 2010: An extended Kaya identity. Energy Policy 2013, 59, 573–581. [Google Scholar] [CrossRef]
Disclaimer/Publisher’s Note: The statements, opinions and data contained in all publications are solely those of the individual author(s) and contributor(s) and not of MDPI and/or the editor(s). MDPI and/or the editor(s) disclaim responsibility for any injury to people or property resulting from any ideas, methods, instructions or products referred to in the content. |
© 2025 by the authors. Licensee MDPI, Basel, Switzerland. This article is an open access article distributed under the terms and conditions of the Creative Commons Attribution (CC BY) license (https://creativecommons.org/licenses/by/4.0/).