Abstract
This study aims to elucidate the mechanisms through which digital government construction influences regional dual control of energy consumption (encompassing both the total volume and intensity of energy use), with a particular emphasis on exploring its indirect effects mediated by the synergistic advancement of technological and spiritual civilizations. Drawing on provincial panel data from China, we establish a nested framework that integrates spatial difference-in-differences models with double machine learning models to systematically dissect the transmission pathway linking digital government construction, the synergy between technological and spiritual civilizations, and the dual control of energy consumption. Our findings indicate the following: (1) Digital government construction significantly enhances the dual control of regional total energy consumption and energy intensity through policy coordination and optimized resource allocation. (2) While the progression of technological civilization plays a notable intermediary role in reducing energy intensity, its impact on total energy consumption is constrained by the “Jevons paradox”. (3) Advancements in spiritual civilization concurrently promote the alleviation of both total energy consumption and energy intensity by reshaping social consensus and behavioral norms. (4) The synergistic effects of technological and spiritual civilizations further amplify the efficacy of the dual control of energy consumption, although digital government construction exhibits a pronounced spatial polarization effect on energy intensity in neighboring regions. The theoretical contributions of this study are as follows: Firstly, it proposes the governance paradigm of digital government as a “technology–culture” collaborative hub, breaking through the binary opposition between technological determinism and institutional embeddedness. Secondly, it constructs a “feasible ability” expansion model to reveal the complementary mechanism between scientific and technological civilization (technology acquisition ability) and spiritual civilization (value selection ability). Thirdly, the policy black box is deconstructed through methodological innovation and provides a systematic path for emerging economies to solve the “efficiency–equity” dilemma of energy governance.
1. Introduction
Amid the accelerating transformation of global energy systems, emerging economies are confronting unique governance challenges: They must meet the rigid demand for energy supply to fuel economic growth, while simultaneously addressing the dual pressures of climate change and resource constraints. This tension between “development and sustainability” has become increasingly prominent amidst the interplay of institutional transitions and technological iterations. With China being a representative emerging market, their policy practices offer a crucial perspective on resolving this dilemma. The Chinese government’s new energy security strategy, encapsulated in the “Four Revolutions and One Cooperation”, marks a systemic shift in governance logic from singular supply assurance to a comprehensive approach encompassing “consumption revolution, supply revolution, technological revolution, institutional revolution, plus international cooperation”. Notably, the Chinese government has further institutionalized the objectives of total energy consumption control (i.e., setting an upper limit on the total energy consumption nationwide and across various regions) and energy consumption intensity control (i.e., establishing control targets for the amount of energy consumed per unit of GDP) in its 14th Five-Year Plan [1]. This policy shift has redirected the governance focus towards the synergistic optimization of both scale constraints and efficiency improvements. Behind this policy shift lies a profound reflection on traditional governance paradigms, where rigid administrative controls can induce market distortions and isolated breakthroughs in technological tools struggle to counteract the path dependencies embedded in social inertia [2].
However, energy governance not only is a problem of resource allocation in the region, but also has significant spatial correlation [3] and externality [4]. The differences in energy structure, technical level, and policy implementation ability between different regions allows the effectiveness of energy governance in a certain region to impact neighboring regions through mechanisms such as market flow, industrial transfer, and policy imitation. In this context, the rise of digital government provides a new path to solve this complex pattern. Relying on data integration, intelligent supervision, and public participation, a digital government helps to improve the accuracy and synergy of energy governance [5], not only optimizing the efficiency of local energy use but also driving progress in the dual control of energy in surrounding areas through a spatial spillover effect [6].
The rise of digital government construction offers a new paradigm for energy governance. Studies have shown that digital technologies can enhance regulatory precision through data integration and intelligent decision-making [7]. However, their effectiveness heavily relies on the fit with institutional environments and cultural contexts. For example, varying levels of public participation in Qatar’s smart grid project have led decision-makers to adopt more aggressive or conservative strategies [8]. Moreover, empirical research using panel data from 91 countries indicates that digital government platforms can reduce “technology idling” through data openness, thereby alleviating regional energy poverty [9]. This reveals a crucial proposition: the governance value of digital government lies not only in driving technological progress, but also in its ability to activate the synergistic effects of “technology–institution–culture”. Unfortunately, the existing research mostly separates these three relationships—the engineering school of thought focuses on the technical compression of energy consumption intensity by the Internet of Things and blockchain [10], the institutional school of thought emphasizes the collaborative design of policy tools [11], and the cultural school of thought focuses on the dissemination mechanism of environmental awareness [12]—thus failing to reveal the system function of digital government as a collaborative hub.
China’s practice provides a theoretical breakthrough in this line, the core of which lies in promoting the coordinated evolution of scientific and technological civilization and spiritual civilization through the construction of a digital government. Scientific and technological civilization is embodied in the institutional embedding of technological innovation. The cross-departmental integration capability of government data platforms significantly shortens the conversion chain from research and development to the application of clean energy technologies [13]. For example, the industrial internet platform allows for the rapid diffusion of technical solutions through standardized interfaces, prompting the reconstruction of traditional industrial processes into low-carbon ones [14]. Spiritual civilization is manifested in the remodeling of social value order. Digital government transforms energy issues into a public agenda that can be perceived by the public through open data and participatory governance tools—for example, mapping regional energy consumption data into ecological health indicators to stimulate society’s sense of environmental responsibility [15]. The synergistic effect of the two is not a nonlinear superposition but rather provides mutual structural feedback through the reshaping of the rules of digital governance. When technical standards are deeply bound to the green certification system, the marginal cost of technological upgrades to enterprises decreases, forming a market-driven low-carbon transformation momentum; when the public participates in energy policy consultation through digital platforms, the concept of energy conservation is internalized from external constraints to social consensus, and the friction cost of policy implementation is eliminated [16]. The essence of this mutual reinforcement mechanism is that digital governments expand the “capabilities” [17] of social actors, providing both the material foundation for technology empowerment (technological civilization) and the cultural soil for building value consensus (spiritual civilization). However, existing research still dichotomizes the two: The technological school of thought overemphasizes the potential of instrumental rationality in compressing energy intensity [18], while the cultural school of thought is limited to the one-way shaping of ideological patterns on behavior [19]. Neither reveals how digital governance resolves the scale constraints and efficiency paradox of dual energy control through dynamic “technology–culture” adaptation. This theoretical blind spot leads policy design into practical dilemmas of “prioritizing technology over consensus” or “emphasizing propaganda over implementation”.
Based on the aforementioned discussion, this study constructs a framework of “digital government construction, bidirectional interaction between technological and spiritual civilization, and dual control of energy”, revealing the inherent logic of how digital governments achieve the dual control of energy by adjusting the dynamic balance between technology diffusion and cultural adaptation. Compared with existing research, the innovations of this study lie in the following aspects: First, the governance effectiveness of digital governments is proposed to depend on the simultaneous optimization of “technological affordance” and “cultural adaptability”, transcending the dualistic opposition between instrumental rationality and value rationality. Second, a dual machine learning model is employed to identify the nonlinear mediation effects of technology–civilization synergy, overcoming the simplistic decomposition of complex causal chains using traditional econometric methods. Third, based on a spatial econometric analysis of Chinese provincial panel data, the heterogeneous patterns of policy spillover effects are revealed, providing empirical support for cross-domain collaborative governance. These findings not only deepen the theory of “technology–culture co-evolution” but also offer insights from the Chinese experience of emerging economies exploring localized transformation pathways. Balancing technological efficacy and social resilience in digital governance may become the key to unlocking the global energy transition.
2. Literature Review
2.1. The Relationship Between Digital Government and Regional Energy System Development
With the rapid advancement of information technology, digital government construction has emerged as a crucial driving force for enhancing the efficiency of public governance and the quality of public services. Against this backdrop, exploring the impact of digital government construction on energy development holds significant theoretical and practical implications.
In terms of achievements in digital government construction, leveraging emerging technologies such as big data and cloud computing, the government’s governance model has undergone a profound transformation from a traditional management-oriented approach to an intelligent service-oriented one [20]. This shift has not only notably boosted administrative efficiency but also enhanced the scientific rigor and precision of policy formulation [21]. Through data-driven decision-making mechanisms, government departments can more effectively identify societal needs and optimize resource allocation [22], thereby elevating the overall quality of public services. Furthermore, the widespread application of digital platforms has enhanced government transparency and information openness, providing institutional and technological safeguards for the establishment of a public trust mechanism [23].
From the perspective of its impact on energy development, the advancement of digital government offers robust support for the intelligent and green transformation of energy systems. On one hand, digital tools have brought about profound opportunities for change in the energy sector, promoting efficient coordination across all avenues of energy production, transmission, distribution, and consumption [24]. On the other hand, by formulating and implementing energy policies rooted in digital technologies, the government has facilitated the development and promotion of clean energy sources [25]. Simultaneously, relying on the Internet of Things (IoT) and sensor networks, real-time monitoring and refined management of energy consumption processes have been achieved, effectively bolstering the attainment of energy conservation and emission reduction goals [26]. Additionally, the extensive adoption of e-government systems has, to a certain extent, reduced the energy resource consumption associated with traditional office practices, offering a pathway toward a low-carbon and environmentally friendly governance model [27].
2.2. The Relationship Between Technological Civilization and Regional Energy System Development
While technological advancements have propelled global economic development and societal progress, they have also profoundly influenced the development models and pathways within the energy sector.
In terms of energy utilization efficiency, the application of new materials and advanced processes has enabled modern energy systems to enhance output while minimizing waste [28]. Regarding energy storage technologies, innovations in battery technology have made large-scale energy storage feasible, addressing the issue of intermittent supply from renewable energy sources [29]. The continuous decline in lithium-ion battery costs and the improvement in their energy density have provided a solid foundation for electric vehicles and grid energy storage [30]. Furthermore, the development of novel energy storage technologies, such as hydrogen fuel cells, offers more options for diversifying future energy systems [31].
Moreover, advancements in digital technology have exerted a far-reaching impact on energy management. Smart grids optimize power distribution through real-time data analysis, enhancing system reliability and flexibility [32]. The application of the Internet of Things (IoT) technology enables household and industrial devices to automatically adjust energy consumption based on demand, further conserving energy [33]. Furthermore, blockchain technology provides a transparent and secure platform for energy trading, facilitating the effective integration of distributed energy resources [34].
Beyond these, technological progress continues to broaden new avenues for energy access. For instance, recent breakthroughs in nuclear fusion research offer humanity an almost limitless source of clean energy [35]. Concurrently, research into bioenergy is exploring more efficient methods of extracting energy from biomass to meet escalating energy demands [36].
2.3. The Relationship Between Spiritual Civilization and Regional Energy System Development
The advancement of the public’s spiritual and cultural ethos not only propels societal progress but also profoundly influences the developmental trajectory within the energy sector. The enhancement of public awareness, shifts in consumer behavior, and strengthened policy support collectively serve as crucial social drivers for energy transition.
Firstly, growing public environmental consciousness directly stimulates the development of renewable energy. As the concept of environmental protection takes root, an increasing number of individuals are becoming attuned to the environmental impacts of energy consumption. This awareness not only propels individuals towards adopting more eco-friendly lifestyles, such as reducing the use of single-use plastics or increasing the frequency of public transport usage, but also spurs green initiatives at the community level [37]. To a certain extent, it reinforces the resolve of policymakers in adjusting the energy mix and enhancing environmental regulation.
Secondly, the elevation of cultural and civilizational standards contributes to the formation of more effective energy management mechanisms. Highly civilized societies often boast greater transparency and robust oversight mechanisms, enabling more rational allocation of energy resources [38]. Simultaneously, the widespread dissemination of education and the enhancement of technological literacy facilitate the promotion and application of energy-saving technologies, further optimizing the energy utilization structure.
Furthermore, the advancement of the public’s spiritual ethos fosters innovation and development within the energy sector. When society champions openness, collaboration, and shared responsibility, technological research and development in the energy field are more likely to garner support from diverse stakeholders, and relevant achievements are more readily shared and disseminated [39]. Additionally, the escalating public demand for corporate social responsibility prompts energy enterprises to place greater emphasis on ecological and social benefits while pursuing economic gains [40].
Finally, cultural exchanges and international cooperation within a civilized society also present new opportunities for energy development. The exchange of experiences in energy governance and technological applications among different countries and regions accelerates the dissemination of advanced technologies and management models [41]; the establishment of multilateral cooperation mechanisms, meanwhile, provides a coordinated approach to addressing global energy and climate challenges [42].
2.4. The Difference from and Innovation with the Existing Literature
In summary, previous studies have predominantly focused on singular dimensions, such as technological advancement or public awareness, while overlooking the interplay between the two. In contrast, this study looks at the interaction between technological civilization and spiritual civilization as an independent variable for the first time, exploring its specific impact on the dual control of energy (i.e., the simultaneous control of total energy consumption and intensity). By constructing a novel theoretical model, this study not only considers the direct influence of technological progress on energy utilization efficiency but also emphasizes how behavioral changes stemming from the enhancement of spiritual civilization further promote energy conservation. For instance, when public environmental awareness intensifies, individuals become more inclined to adopt energy-efficient devices and technologies, thereby indirectly supporting the achievement of dual energy control goals.
Furthermore, through a comparative analysis of data from 30 provinces in mainland China, this study validates the positive impact of the interaction between technological and spiritual civilization on dual energy control. The research indicates that in societies with higher levels of spiritual civilization, the promotion and application of new technologies proceed more smoothly, subsequently enhancing overall energy management efficiency. Specifically, the elevation of spiritual civilization not only bolsters public acceptance of new technologies but also facilitates the effective implementation of energy conservation and emission reduction measures.
Moreover, this study delves into the pivotal role of digital government construction in fostering a bidirectional interaction between technological and spiritual civilization, analyzing how this interaction indirectly influences dual energy control. For example, a digital government enhances public trust in the government by increasing transparency in policy formulation and execution. Citizens can participate in public decision-making through online platforms, expressing their views on energy policies, which not only promotes the advancement of spiritual civilization but also formulates more scientifically sound and reasonable energy management schemes. Furthermore, the digital government leverages intelligent platforms to widely disseminate environmental protection knowledge and technological information, elevating the public’s technological literacy and environmental awareness and thereby further propelling the achievement of dual energy control goals.
In conclusion, the novel analytical framework proposed in this study not only enriches the existing theoretical system but also provides new directions for future research. Through empirical studies and case analyses, this study demonstrates how the interaction between technological and spiritual civilization effectively facilitates the achievement of dual energy control goals, holding significant academic value and practical implications. This integrated perspective offers fresh insights into understanding and addressing energy issues, aiding in steering society towards a more sustainable trajectory.
3. Mechanism Analysis
3.1. Analysis of the Direct Impact Mechanism of Digital Government Construction on Regional Energy Dual Control
Digital government construction systematically reconfigures the underlying logic of energy governance, providing multidimensional support for the dual control of the total volume and intensity of regional energy consumption [43]. The core lies in breaking the limitations of information silos and policy fragmentation in traditional governance and leveraging data integration and intelligent analysis technologies to build a dynamic regulation system that links the entire region [44]. Under the traditional model, the fragmentation of energy management leads to regulatory lags and inefficient resource allocation. In contrast, digital governments aggregate real-time energy consumption data from industries, transportation, and buildings through cross-level and cross-departmental data-sharing platforms, forming a monitoring network that covers the entire production, transmission, and consumption chain [45]. This data-driven management model not only enhances the scientific nature of policy formulation but also provides dynamic threshold warnings for total control by precisely identifying high-energy-consuming nodes [46]. For example, some regions have implemented flexible quota allocations for key industries through intelligent monitoring systems, effectively curbing the marginal expansion of energy consumption, demonstrating the reinforcing effect of data integration on total constraints [47].
The synergistic effect of embedding smart technologies and institutional innovation is a critical pathway to reducing energy intensity. Digital governments optimize energy supply–demand matching mechanisms through technologies such as the Internet of Things and artificial intelligence, driving the transformation of resource allocation from extensive to refined. In the electricity sector, smart grids dynamically adjust power supply strategies based on load forecasting, reducing unnecessary losses [48]. In manufacturing, industrial internet platforms provide enterprises with energy efficiency diagnostics and process optimization solutions, prompting them to proactively phase out outdated production capacity [49]. Furthermore, policy tools such as carbon trading markets and green finance are precisely implemented through digital platforms, forming a dual drive of “technology empowerment and economic incentives” [50]. This deep integration of technology embedding and institutional design weakens the linear dependence of economic growth on energy consumption, providing structural impetus for intensity control.
The extensive participation of social actors has further expanded the operational boundaries of dual energy control. Digital governments integrate the public and enterprises into collaborative governance networks by opening data interfaces and public service platforms [51]. Government apps and smart terminals provide real-time feedback on individual energy consumption data and recommend personalized energy-saving solutions through algorithms, encouraging micro-level actors to shift from passive response to active participation [52]. At the community level, digital management tools convert energy-saving behaviors into quantifiable credit points, which are linked to public service benefits, creating a positive cycle of “conserve–benefit”. This model of “technology empowerment and institutional guidance” not only reshapes social energy use habits but also reduces macro-level energy consumption pressure through economies of scale. For example, some scholars consider encouraging residents to voluntarily reduce their electricity use during peak hours through household energy consumption smart systems driven by digital governments, indirectly alleviating the pressure on grid peak shaving and demonstrating the complementary value of social mobilization in total control [53].
In summary, the construction of digital governments has established a systematic policy guidance framework for dual energy control through three mechanisms: data integration, intelligent regulation, and social collaboration. Therefore, this study proposes the following hypotheses:
H1:
Digital government construction can assist in controlling the total regional energy consumption.
H2:
Digital government construction can assist in controlling regional energy intensity.
3.2. Analysis of the Spatial Spillover Effect Mechanism of Digital Government Construction on the Dual Control of Energy
The construction of digital governments, while strengthening local energy management and control, may exert spillover pressure on the total energy consumption of neighboring regions through mechanisms of industrial transfer and resource reallocation. When a region imposes strict constraints on energy-intensive industries through digital means, enterprises tend to relocate to neighboring regions with more lenient policies to avoid rising costs and regulatory risks. This “pollution haven” effect leads to the receiving regions taking on transferred production capacity, stimulating their industrial scale expansion and a surge in energy demand in the short term [54]. Furthermore, the interconnection of energy infrastructure between regions may exacerbate the resource siphoning effect, with developed regions leveraging their digital advantages to prioritize access to clean energy quotas, forcing less developed regions to rely on traditional energy sources to fill the gap, thereby further strengthening the negative spatial correlation of total control [55].
In the dimension of energy intensity, the spatial spillover effects of digital government construction manifest as a dual dilemma of technological competition and path dependence. Regions pioneering digital governance have reduced energy consumption per unit of GDP through technological innovation, potentially weakening the incentives for neighboring regions to upgrade independently, fostering a “free-rider” mentality [56]. Simultaneously, the uneven diffusion of technology among regions traps lagging areas in a “high-energy-consumption lock-in”: On one hand, they struggle to rapidly replicate the energy efficiency management experience of digital governments and are compelled to maintain extensive production modes [57]; on the other hand, improvements in energy efficiency in neighboring regions indirectly lower overall energy prices, stimulating local enterprises to expand their low value-added production capacity. For example, when a region optimizes its production processes through an industrial internet platform, its low-cost advantage squeezes the market share of neighboring areas, forcing the latter to increase energy inputs to maintain competitiveness, ultimately driving up the overall energy intensity of the region. This “efficiency trough” effect reveals the risk of spatial polarization under the asymmetric advancement of digital governance. Based on this, this study proposes the following hypotheses:
H3:
The spatial spillover effect of digital government construction on total regional energy consumption is significantly positive.
H4:
The spatial spillover effect of digital government construction on regional energy intensity is significantly positive.
3.3. The Mechanism Effects of Technological Civilization and Spiritual Civilization
3.3.1. The Mechanism Effect of Technological Civilization
Through the diffusion and infiltration mechanisms of technological innovation, the construction of digital governments injects momentum into the progress of scientific and technological civilization, thereby reshaping regional energy consumption patterns. Its core lies in the establishment of an open and shared data infrastructure and a collaborative innovation ecosystem, accelerating the research on and application of clean technologies. Government data platforms led by digital governments open up high-value data resources in the fields of energy and environment to research institutions and enterprises, promoting deep integration of industry, academia, and research [58]. For example, by accessing power grid operation and meteorological monitoring data, research and development into new energy technologies helps to optimize the efficiency of photovoltaic and wind power integration into the grid, reducing the cost of renewable energy application. Furthermore, digital governments promote the large-scale implementation of technologies such as smart grids and industrial internet through policy guidance and financial support, facilitating the digital and low-carbon transformation of energy-intensive industries [59]. This technological diffusion not only directly reduces the energy demand per unit of output but also weakens the dependence of economic growth on energy inputs through improvements in total factor productivity, creating a structural effect of “technology substituting for energy” [60].
The deepening of technological civilization is fundamentally reshaping the underlying logic of regional energy governance. Digital governments are utilizing the Internet of Things (IoT) and blockchain technology to construct an energy traceability system, enabling comprehensive lifecycle oversight from production to consumption. For example, real-time energy consumption data from key energy-using enterprises are integrated into government regulatory platforms, where algorithmic models dynamically assess deviations in energy efficiency and trigger early warning interventions. Additionally, digital twin technology simulates the operation of regional energy systems, providing a multi-scenario analysis to support policy formulation and avoiding efficiency losses associated with traditional “one-size-fits-all” control measures. This technology-empowered refined management approach translates the instrumental rationality of technological civilization into institutional effectiveness for controlling energy intensity, ultimately systematically achieving dual energy control goals through the synergy of technological progress and institutional innovation.
3.3.2. The Mechanism Effect of Spiritual Civilization
The development of a digital government through mechanisms of value cultivation and behavioral guidance facilitates the evolution of spiritual civilization towards an eco-friendly orientation, providing a profound social impetus for the dual control of energy consumption [61]. At its core, this endeavor leverages digital media to reconstruct public environmental awareness and ethical responsibility, embedding green principles into the cultural DNA of society. Government platforms utilize algorithmic recommendations and visual data displays to dynamically analyze the correlation between regional energy consumption and environmental quality. For instance, the real-time mapping of air quality indices to industrial energy consumption allows the public to intuitively grasp the ecological costs associated with high-energy lifestyle patterns [62]. Concurrently, a digital government integrates educational, media, and community resources to establish a multi-tiered ecological civilization education and promotion system, transforming energy-saving knowledge into accessible, context-specific interactive content. Examples include using virtual reality to simulate the impact of carbon emissions on extreme weather patterns. This cognitive intervention not only awakens individuals’ environmental consciousness but also drives families and businesses to proactively optimize their energy use structures through the internalization of social norms, forming a transmission chain of “mindset transformation, behavioral adjustment, and energy consumption reduction” [63].
The rise of spiritual civilization further catalyzes the synergistic enhancement of institutional implementation and social oversight. A digital government leveraging blockchain and open data platforms establishes a transparent traceability mechanism for energy use, integrating indicators such as enterprise energy consumption intensity and individual carbon footprints into the social credit evaluation system [64]. For instance, real-time emission data from key polluting enterprises are made accessible to the public, compelling them to avoid social reputation risks through technological upgrades. Community residents participate in the co-construction of “low-carbon communities” via government apps, converting energy-saving behaviors into tradable green credits. This “technology empowerment and social co-governance” model transforms the soft constraints of spiritual civilization into rigid behavioral norms, shifting the dual control of energy from policy enforcement to voluntary value adherence. Ultimately, the deep integration of spiritual civilization and digital governance provides sustainable cultural support and action consensus for the systemic transformation of society’s energy consumption patterns.
The construction of digital government deepens the coupling relationship between spiritual civilization and energy governance through multidimensional interactive mechanisms, further solidifying the social foundation for the dual control of energy. Leveraging data openness and the digitization of public services as vehicles, it allows for the concept of ecological civilization to infiltrate various aspects of social governance. For example, government platforms publish regional energy consumption rankings and carbon reduction progress in real time, stimulating public collective pride and a sense of competition through horizontal comparisons. Digital environmental education courses are embedded into the education system, utilizing virtual simulation technology to allow students to intuitively experience the ecological consequences of excessive energy consumption, nurturing green values from the cognitive onset [65]. Furthermore, the digital government employs algorithms to identify energy poverty issues among vulnerable groups, targeted energy-saving subsidies, and retrofitting solutions. For instance, smart meters are installed in older communities along with tiered electricity pricing policies, ensuring equitable livelihoods while guiding rational energy use. This three-dimensional intervention of “information disclosure, educational immersion, and inclusive policies” not only dissipates the elitist tendency of traditional environmental actions but also empowers ecological civilization to become a public issue accessible and perceivable by all through technology enablement. Ultimately, it fosters a cross-class, cross-sector consensus on energy conservation, constructing a resilient social network for the achievement of the dual control of energy goals.
3.3.3. The Mechanism Effect of the Coordination Between Technological Civilization and Spiritual Civilization
The construction of a digital government propels the evolution of technological and spiritual civilization from isolated progression to synergistic resonance through the dual coupling of technological empowerment and social value reconstruction. At the industrial level, the deepening of technological civilization manifests in the development of clean technologies and the proliferation of digital production models, which directly reduce the energy demand per unit of output through process innovations. At the societal level, the rise of spiritual civilization is reflected in the awakening of public environmental awareness and the diffusion of green lifestyles, which decrease overall macro-energy consumption through behavioral adjustments. Although these two forces operate through different pathways, they both ultimately aim to enhance energy efficiency and converge consumption scales. The core function of a digital government lies in bridging the divide between technological and social systems, fostering a cross-domain collaborative innovation ecosystem [66]. For instance, industrial internet platforms, while outputting energy efficiency optimization solutions, simultaneously push carbon footprint data and energy-saving knowledge to enterprise employees, transforming the use of technological tools into the internalization of ecological responsibility, thereby achieving simultaneous improvements in production efficiency and the shaping of social values.
Digital governments act as bridges, using data flow to mend the structural rift between technological innovation and social acceptance. The instrumental rationality of technological civilization requires the guidance of value rationality from spiritual civilization to avoid the “energy efficiency paradox” stemming from technological alienation. For example, the energy-saving potential of smart grids’ technological advantages diminishes significantly without public cooperation in shifting electricity usage during peak periods. A digital government transforms technical parameters into ecologically meaningful language that is perceptible to the public through visual representations of energy consumption data and personalized feedback mechanisms. An example is the “equivalent carbon emission tree” indicator in household electricity reports, which promotes a closed loop between technology application and conscious behavior. This chain reaction between “technology empowerment, cognitive upgrade, and action response” fully unleashes the efficiency dividends of technological civilization.
The coordination between the two gives rise to a multiplier effect in institutional innovation [66]. Leveraging blockchain and artificial intelligence technologies, a digital government constructs an integrated governance framework that merges “technical standards with social norms”. For instance, the adoption of clean technologies by enterprises is incorporated into the social credit evaluation system, and their research and development investments are translated into green brand premiums through government platforms, incentivizing market actors to simultaneously pursue both technological innovation and ecological reputation. Furthermore, consumer preferences for green products are fed back to the industrial sector through big data analyses, prompting enterprises to accelerate their low-carbon transitions. This bidirectional feedback mechanism deeply integrates the rigid constraints of technological civilization with the soft advocacy of spiritual civilization, forming a virtuous cycle where “industrial innovation drives social awareness, and social consensus nurtures technology diffusion”.
Ultimately, the synergistic effect of technology and spiritual civilization reconfigures the underlying logic of energy governance. A digital government integrates elements such as technology research and development, industrial upgrades, and public participation into a unified governance interface through data integration and policy tool innovation. For example, technical feasibility assessments and social acceptance simulations are embedded simultaneously in regional energy planning. This systematic governance model not only mitigates the diminishing marginal utility of single-dimension reforms but also enhances dual energy control by elevating it from a policy objective to a shared social value through multi-actor, multi-level interactions [67]. The deep integration of technical rationality and a humanistic spirit provides a scientific and sustainable Chinese solution for regions to tackle the “growth–energy consumption” paradox.
Based on the aforementioned analysis, this study proposes the following hypotheses:
H5:
Digital government construction can indirectly contribute to controlling the total regional energy consumption by facilitating the advancement of regional technological civilization.
H6:
Digital government construction can indirectly contribute to controlling the regional energy intensity by facilitating the advancement of regional technological civilization.
H7:
Digital government construction can indirectly facilitate the control of total regional energy consumption by advancing regional spiritual civilization.
H8:
Digital government construction can indirectly facilitate the control of regional energy intensity by advancing regional spiritual civilization.
H9:
Digital government construction can indirectly support the achievement of total regional energy consumption by promoting the coordination between regional technological and spiritual civilizations.
H10:
Digital government construction can indirectly support the achievement of regional energy intensity by promoting the coordination between regional technological and spiritual civilizations.
The path of the above mechanism is shown in Figure 1.
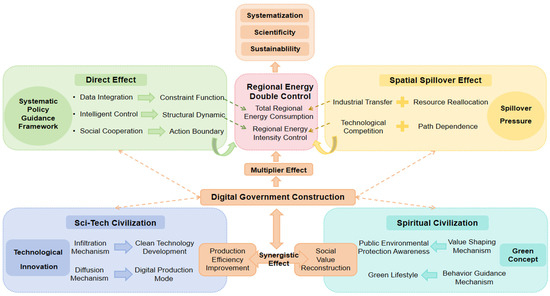
Figure 1.
Mechanism analysis.
4. Research Design, Model Construction, and Data Sources
4.1. Research Design
To test hypotheses H1–H10 regarding the mechanisms, this study employs panel data spanning from 2010 to 2022 for 30 provinces in mainland China (excluding Hong Kong, Macao, Taiwan, and Tibet). A quasi-natural experiment approach is adopted to conduct causal inference on the interaction between digital government construction and regional dual energy control. Initially, to verify the direct impact of digital government construction on regional dual energy control, as posited in hypotheses H1–H2, as well as the spatial spillover effect of digital government construction on regional dual energy control, as outlined in hypotheses H3–H4, this study constructs a spatial difference-in-differences (DID) model for effect parameter estimation. Subsequently, to validate the mechanism effects outlined in hypotheses H5–H10, which propose a pathway of “digital government construction → bidirectional interaction between spiritual and technological civilizations → dual energy control”, and to mitigate potential estimation biases that may arise from parameter estimation using traditional DID models, a dual machine learning (DML) model is employed. This DML model utilizes a stepwise regression approach to estimate the parameters of the mediation pathways associated with the policy effects.
To ensure the rationality and scientific rigor of our approach, this study employs quasi-natural experiments, spatial difference-in-differences (DID), and double machine learning (DML) models. Quasi-natural experiments leverage temporal and regional variations in policy implementation, providing a robust foundation for causal inference. The spatial DID model not only controls for time and regional fixed effects but is also particularly suited to addressing spatial dependence and spillover effects among regions, outperforming traditional methods like PSM. DML excels in handling high-dimensional data and complex nonlinear relationships, enhancing estimation accuracy and reducing model specification bias compared to conventional econometric approaches. To standardize the application of these two methodologies, this study follows the research paradigm of Chen and Wang (2024) [68] for rigorous empirical analysis.
4.2. Variable Description and Data Sources
4.2.1. Explained Variable: Dual Energy Control (InEnergy/EI)
This study uses total energy consumption (in one hundred million metric tons of standard coal) (energy) and the logarithm of energy intensity (in ten thousand metric tons of standard coal per CNY) (lnEI) as two proxy indicators for regional dual control of energy. This processing is based on the following rationale: Energy intensity, as a ratio indicator, often exhibits a skewed data distribution. Logarithmic transformation effectively compresses the data range, making it closer to a normal distribution and facilitating the interpretation of marginal effects and elasticity coefficients. In contrast, total energy consumption data are relatively concentrated and evenly distributed. Using the raw data directly provides a more intuitive reflection of the actual impact of policy changes on total energy consumption, while avoiding the additional interpretative complexity introduced by logarithmic transformation.
4.2.2. Core Explanatory Variables: Digital Government Construction Policy Processing Variables (DG)
In conducting causal inference, the establishment of policy dummy variables is one of the critical steps. Typically designed as a binary variable (0 or 1), this dummy variable serves to indicate whether a specific policy or intervention has been imposed. Specifically, for the treatment group that receives the policy impact, the variable is assigned a value of 1 during the period after policy implementation, while it remains 0 before policy implementation and for the control group that is unaffected by the policy throughout. Such a setup allows for the estimation of the true effect of the policy by comparing changes in the outcome variable between the treatment and control groups before and after policy implementation.
In this study, we construct a digital government construction policy treatment variable (DG) based on the aforementioned rationale, with the policy treatment event being the establishment of big data management institutions across provinces and municipalities in China. To accommodate the demands of digital transformation, China’s big data management institutions have undergone profound reforms aimed at constructing a more efficient and intelligent digital government. These reforms have not only optimized mechanisms for big data collection, storage, analysis, and application but also facilitated cross-departmental data sharing and collaboration, thereby enhancing the quality and efficiency of public services. By establishing dedicated big data administration bureaus and integrating related functions, the government is better equipped to address the challenges posed by massive information, promoting the openness and utilization of data resources. Such reform initiatives serve as a typical representative of China’s digital government construction policy treatment events, demonstrating the country’s efforts in modernizing its governance capacity and setting an example for digital reforms in other sectors.
The treatment group regions, treatment events, and treatment timing for the digital government construction policy treatment variables (DG) are reported in Table 1.

Table 1.
Treatment variables for digital government construction policies (DG): treatment group regions, treatment events, and treatment time.
4.2.3. Mechanism Variable I: The Development of Science and Technology Civilization (TC)
Technological civilization is the product of human society’s development reaching a certain stage. It not only embodies advancements in science and technology but also reflects how these advancements have profoundly transformed social structures, economic models, and people’s lifestyles. Theoretically speaking, technological civilization is not merely a collection of technological inventions; rather, it is a complex system encompassing the fundamental conditions for innovation, the innovation activities themselves, and the application and diffusion of technological achievements. Existing research on the evaluation of technological civilization primarily revolves around the multi-subsystem innovation ecosystem [69]. This study synthesizes various evaluation indicator systems for technological innovation ecosystems from existing research and explores regional technological civilization from the following theoretical dimensions:
Firstly, the fundamental conditions for technological innovation form the cornerstone of technological civilization. Drawing on He et al. (2024) [70], this study considers the prevalence of information technology infrastructure and societal acceptance of technological applications as specific evaluation indicators. In modern society, the widespread use of computers, the internet, and other digital tools has significantly enhanced the speed and efficiency of information processing, reduced transaction costs, and facilitated the rapid dissemination of knowledge [71]. These fundamental conditions provide the necessary material and technical support for technological innovation and serve as the prerequisite for the development of technological civilization.
Secondly, the elements of technological innovation constitute the core driving force of technological civilization. This dimension encompasses both innovation inputs and outputs [72]. In terms of inputs, sustained research and development investment, a high-caliber talent pool, and effective scientific research management mechanisms are indispensable. These inputs are transformed into new knowledge and technologies, which are then manifested through patent applications, new product development, and technology transfer. The quality and efficiency of innovation activities directly determine whether technological civilization can maintain its vitality and competitiveness [73].
Lastly, the leading force and synergy of technological industrial innovation embody the societal value of technological civilization. New technologies can only truly unleash their potential and bring about leaps in productivity and improvements in social welfare when they are widely adopted and integrated into various sectors of the economy and society [74]. The application of scientific and technological achievements is not only limited to the research and development of new products within the enterprise but also includes cross-industry technology transfer, the growth of emerging industries, and the technological transformation of traditional industries. In addition, the diffusion of scientific and technological achievements also involves exchanges and cooperation between different regions so as to promote balanced development between regions.
Based on the above analysis and existing research, this study constructs the index system as shown in Table 2 to characterize the development level of science and technology civilization in China’s provinces, and uses the entropy method to comprehensively evaluate the comprehensive index system as the development level of provincial science and technology civilization. The entropy method is a commonly used objective weight assignment method, which can better reflect the importance of each index in the rating system.
Table 2.
The comprehensive evaluation index system of China’s provincial science and technology civilization development level (TC). A positive sign represents a positive indicator.
4.2.4. Mechanism Variable II: Spiritual Civilization Development (SC)
Spiritual civilization stands as a significant hallmark of social progress, encompassing various aspects such as education, culture, healthcare, the legal system, and living environment. It reflects humanity’s pursuit and development in morality, culture, and quality of life. Theoretically, assessing the level of spiritual civilization in a region requires a comprehensive consideration of multidimensional indicators, including educational attainment, digital infrastructure development, cultural advancement, healthcare services, legal system construction, and living environment. These factors are interconnected and mutually influential, collectively constituting a holistic picture of spiritual civilization. Drawing on the work of Zhu Xi’an and Wang Huicong (2024) [75], this study evaluates the development level of regional spiritual civilization from seven aspects.
The regional educational level serves as the cornerstone of spiritual civilization development. Education is not merely a process of knowledge transmission but also a crucial pathway for cultivating civic qualities and social responsibility. Indicators such as the average years of education per capita, the proportion of individuals with higher education, the average number of higher education students per 100,000 population, and the proportion of educational expenditure in fiscal expenditure reflect the accessibility and quality of the education system [76]. The proportion of social donation funding in educational expenditures exemplifies the level of societal support and participation in education [77]. High-quality education provides intellectual support for individual growth and societal development, constituting a vital safeguard for spiritual civilization construction.
Digital carriers of spiritual civilization are an indispensable part of modern societal development. Indicators such as the number of internet broadband subscribers, the quantity of access ports, and the mobile phone penetration rate measure the development level of information technology infrastructure. These digital carriers not only facilitate rapid information dissemination and exchange but also provide people with a rich array of spiritual nourishment [78], such as online learning resources, digital libraries, and social media platforms [79]. They significantly enrich people’s cultural lives and enhance the modernization level of spiritual civilization.
The regional cultural level directly reflects the degree of local cultural prosperity and public engagement in culture. The number of museum institutions, the holding capacity and circulation of public libraries, the number of book and periodical borrowings, and the quantity of exhibitions and training sessions held are all important benchmarks for measuring cultural facilities and services. The comprehensive population coverage of radio and television programs, as well as the number of performances by artistic groups and the count of venues, demonstrate the vibrancy of cultural and artistic activities [80]. High-standard cultural facility construction and service provision can satisfy the growing spiritual and cultural needs of the populace, fostering social harmony and stability [81].
The regional medical level is a necessary condition for the healthy development of spiritual civilization. Indicators such as the number of health technical personnel and the number of hospital beds reflect the allocation of healthcare resources [82]. High-quality medical services not only safeguard the physical health of residents but also enhance the overall quality of life of society. A good medical environment is an integral part of spiritual civilization construction, embodying the concern and investment in the well-being of the people.
The regional legal framework serves as the bedrock for upholding social stability and equity. Metrics, including the ratio of cases concluded to those filed, the incidence of traffic accidents, and the number of fatalities, gauge the efficacy and enforcement rigor of the legal system. The establishment of a society governed by law guarantees fairness and justice, mitigates social tensions and conflicts, and fosters a stable external environment conducive to the advancement of spiritual civilization.
The regional living environment and rural construction embody the tangible aspects of spiritual civilization. Indicators such as the utilization rate of industrial solid waste, the harmless treatment rate of household waste, the area of urban roads, the area of park green spaces, the green coverage rate, and the number of public toilets reflect the quality of ecological environmental protection and urban development [83]. In rural areas, metrics like the prevalence of sanitary toilets, the level of agricultural mechanization, the application amounts of pesticides and fertilizers, the proportion of residents’ expenditures on education, culture, and entertainment, and the number of rural cultural centers demonstrate the effectiveness of rural spiritual civilization construction [84]. A well-developed living environment and rural infrastructure not only enhance the quality of residents’ lives but also lay a solid foundation for the long-term development of spiritual civilization.
In summary, this study constructs the indicator system presented in Table 3 to characterize the development level of spiritual civilization across China’s provinces. The comprehensive evaluation of this indicator system is also conducted using the entropy method to assess provincial spiritual civilization development levels.
Table 3.
The comprehensive evaluation index system of China’s provincial spiritual civilization development level (SC). A positive sign represents a positive indicator, while a negative sign represents a negative indicator.
4.2.5. Mechanism Variable III: The Coordination of Scientific and Technological Civilization and Spiritual Civilization (TC&SC)
The coordination between technological civilization and spiritual civilization (TC&SC) is characterized by the coupling coordination degree between the development of technological civilization and the development of spiritual civilization. The concept of TC&SC emphasizes the harmonious coexistence between technological progress and humanistic development. To quantify this coordination, the coupling coordination degree between the development of technological civilization and the development of spiritual civilization can be adopted. The coupling coordination degree is an indicator that measures the interaction and synergistic effects between two or more systems. In this context, it is used to assess how these two distinct yet closely related social subsystems, namely technological civilization and spiritual civilization, jointly contribute to the overall progress of society.
Coupling and coordination are two concepts derived from physics. Coupling and coordination can reflect the law that each system promotes the other through the interaction of elements. Referring to the existing research [85], the following formulas are used to calculate the coupling coordination degree between the development of scientific and technological civilization and spiritual civilization:
In the formula, represents the coupling coordination degree between the development of scientific and technological civilization and spiritual civilization, and is the coupling degree, which measures the mutual influence relationship between each subsystem. The greater the value, the greater the mutual influence degree of each subsystem. is the coordination degree, which is used to further examine whether the relationship between the subsystems is a promotion or a restriction relationship, and and are adjustment coefficients. Given that this study focuses on the coupling coordination degree between two systems, both coefficients are assigned a value of 0.5. Additionally, assuming equal importance between the subsystems of green finance, the weight coefficients and are all assigned 0.5.
4.2.6. Control Variables and Data Sources
This study takes the logarithm of urbanization level (lnUR), economic development level (logarithm of per capita GDP (CNY/person)) (lnPGDP), opening degree (logarithm of the ratio of total import and export of goods to GDP) (lnOpen), and industrial structure upgrading (the ratio of the added value of the tertiary industry to the added value of the secondary industry) (AIS) of 30 provinces, municipalities, and autonomous regions (excluding Tibet, Hong Kong, Macao, and Taiwan) in mainland China from 2010 to 2022 as control variables.
The data of this study are derived from the “China Statistical Yearbook”, “China High-tech Industry Statistical Yearbook”, “China Science and Technology Statistical Yearbook”, “China Energy Statistical Yearbook”, “China Rural Statistical Yearbook”, “China Rule of Law Yearbook”, “China Information Industry Yearbook”, “China Education Statistical Yearbook”, “China Culture and Related Industry Statistical Yearbook”, “China Health Statistical Yearbook”, “China Environment Statistical Yearbook”, and the statistical yearbooks of various provinces and cities. The data of the number of Chinese science and technology unicorn enterprises, the number of Chinese science and technology gazelle enterprises, and the number of Chinese science and technology eagle enterprises are derived from the “Tianyancha” Chinese enterprise information query platform.
4.2.7. Spatial Weight Matrix
The spatial weight matrix describes the dependence between geographical regions and is the medium for variables to exert spatial effects in the spatial difference-in-differences model. In view of the close relationship between the research object of this study and the economic activities between geography, this study constructs the economic spatial weight matrix as the spatial weight matrix used in the empirical analysis, and the specific form is as follows in Formula (4):
In the above formula, is the economic spatial weight matrix, is the element in , and and are the average real GDP of region and , respectively.
4.2.8. Descriptive Statistics of Variables
This study constructs descriptive statistics of variables, as shown in Table 4, covering data analysis of a total of 390 samples from 2010 to 2022. The table lists the basic statistical characteristics of each major variable in detail, including mean value, standard deviation, minimum value, and maximum value, aiming to provide a comprehensive and in-depth understanding of the research data. Specifically, the average energy consumption (lnEnergy) after natural logarithmic transformation is 9.445, ranging from a minimum of 7.215 to a maximum of 10.782; the energy intensity (EI) shows a large degree of variation, with an average value of 3.918, but the standard deviation reaches 2.406; and the range of variation during the observation period ranges from 1.031 to 13.447. In addition, the average value of the degree of digital governance (DG) is 0.274, indicating that the indicator is at a low level in most cases throughout the sample period, but there is still significant volatility (standard deviation is 0.447). These detailed statistical data not only reflect the concentration trend and dispersion degree of each variable distribution but also provide a solid foundation for subsequent empirical analysis.
Table 4.
Descriptive statistics of variables.
4.3. Model Construction
4.3.1. Construction of Spatial Difference-In-Differences Model
The spatial difference-in-differences (DID) model is a statistical methodology that integrates traditional DID techniques with spatial analysis to evaluate the effects of policies or interventions within specific geographical regions. It is particularly suited to addressing scenarios where outcome variables may exhibit mutual influences due to geographical proximity. The conventional DID approach estimates policy effects by comparing changes before and after policy implementation between affected areas (treatment group) and unaffected areas (control group). However, when geographical factors are considered, this traditional method may fail to accurately capture spatial correlations and spillover effects, whereby policies in one region may exert indirect influences on neighboring regions. The spatial DID model addresses this limitation by incorporating not only temporal differences but also a spatial dimension, thereby enabling a more precise measurement of the true impact of policies. This methodology can identify and control for spatial interactions between different regions, providing more reliable estimates of causal relationships. By doing so, researchers can gain a deeper understanding of the impacts of policies or interventions within target regions as well as surrounding areas, ensuring that evaluation results are more accurate and comprehensive.
In order to comprehensively evaluate the direct impact of digital government construction on regional dual energy control and the spatial spillover effects of policy interventions, this study employs a spatial difference-in-differences (DID) model for causal inference (Chagas et al., 2016 [86]). Models 1–3 are constructed as shown in Equations (5)–(7):
Models 1, 2, and 3 represent the spatial autoregressive difference-in-differences (SAR-DID), spatial error model difference-in-differences (SEM-DID), and spatial Durbin model difference-in-differences (SDM-DID), respectively. These models address issues of spatial correlation and spillover effects from different perspectives to provide more precise evaluations of policy effects. In the empirical analysis, this study needs to judge the applicability of the model through a series of tests.
In Equations (5)–(7), serves as the proxy indicator for dual energy control ( represents the total regional energy consumption, denotes the regional energy intensity), and represents the spatial weight matrix used for parameter estimation in the spatial difference-in-differences (DID) model. is the spatial autoregressive coefficient for the spatial lag term of the explained variables, and is the main effect coefficient of the core explanatory variable, the digital government construction policy treatment variable (). represents the set of control variables and their coefficients, is the coefficient for the spatial spillover effect of the explained variables, and is the coefficient for the spatial spillover effect of the spatial error term. , , and represent the time fixed effects, spatial fixed effects, and random error term, respectively.
4.3.2. Construction of Dual Machine Learning Model
To further explore the policy mechanism transmission pathway of “digital government construction → bidirectional interaction between spiritual and scientific–technological civilizations → dual energy control” and to mitigate potential estimation biases that may arise from parameter estimation using traditional difference-in-differences (DID) models, this study employs a dual machine learning (DML) model for further causal inference. DML is an advanced causal inference method that skillfully integrates the flexibility of machine learning with the rigor of traditional econometrics. DML aims to address endogeneity and selection bias issues commonly encountered in high-dimensional data environments, which can distort estimates of the causal effects of policies or interventions. The core idea of DML is to randomly split the sample into two parts: One part is used to train machine learning algorithms to predict the impact of covariates on the treatment and outcome variables, while the other part is used for unbiased estimation of causal effects. This process not only reduces biases due to model misspecification but also provides more robust and precise estimates of causal effects in the presence of numerous potential confounding factors. A key advantage of DML lies in its ability to handle a large number of control variables, even when these variables exhibit complex nonlinear relationships and interactions with treatment assignments and outcomes. This method leverages the powerful capabilities of machine learning to capture these complex patterns while ensuring the unbiasedness of causal estimates through cross-fitting techniques. Additionally, DML excels in handling high-dimensional data because it does not require strict parametric assumptions for all covariates, thereby avoiding the “curse of dimensionality” issue that can arise in traditional regression analysis.
Drawing upon the research by Chernozhukov et al. (2018) [87], this study constructs the following partially linear regression model based on the dual machine learning (DML) framework (benchmark regression) to verify the policy effects of digital government construction on total regional energy consumption and regional energy intensity.
In Model 4, represents a function comprising high-dimensional control variables. During parameter estimation using the dual machine learning (DML) model, no preset expression form for the control variables within the model is imposed, allowing for a closer approximation to real-world economic and social systems. Machine learning algorithms are employed to estimate the value of , denoted as .To address potential regularization biases introduced by the machine learning algorithms, an auxiliary regression, as shown in Equation (9), is also constructed.
In Equation (9), represents a function composed of high-dimensional control variables, which necessitates separate estimation using machine learning algorithms in subsequent parameter estimation steps. From Equation (9), we can obtain the estimated value of the random error term , denoted as . Subsequently, can be utilized as an instrumental variable for the core explanatory variable to estimate and obtain an unbiased estimator of . Consequently, the dual machine learning (DML) model is also referred to as an unbiased machine learning model. To investigate the mediation effects posited in hypotheses H5–H10, this study constructs a stepwise regression model based on dual machine learning (DML), following the methodology outlined by Lu and Li (2024) [88].
Models 6–8 represent the testing frameworks for three mechanistic pathways: “digital government construction → technological civilization development → regional dual energy control”, “digital government construction → spiritual civilization development → regional dual energy control”, and “digital government construction → harmonious development of technological and spiritual civilizations → regional dual energy control”, respectively. In the stepwise regression approach, is the total effect coefficient of the core explanatory variable to the explained variable , and the combination of and can be regarded as the core explanatory variable indirectly affecting the indirect effect of the explained variable by influencing the mechanism variable. is the direct effect coefficient. If the total effect and indirect effect are significant, and the direct effect is also significant, it shows that the mechanism path is partially mediated by the model. If the total effect and indirect effect are significant, but the direct effect does not exist (not significant), it shows that the mechanism path is a complete mediating effect mechanism path. In Models 5–7, , and are the proxy indicators of the development of scientific and technological civilization, the development of spiritual civilization, and the coordination of scientific and technological civilization and spiritual civilization.
5. Empirical Analysis and Causal Inference
5.1. Effect Test Based on Spatial Difference-In-Differences
5.1.1. Spatial Autocorrelation Test
Prior to conducting a spatial difference-in-differences (DID) analysis, this study underscores the importance of conducting a test for spatial autocorrelation on the dependent variable. This step is crucial for identifying the presence of spatial dependency among observations; neglecting existing spatial autocorrelation may lead to biased model estimates and inaccurate conclusions. By examining spatial autocorrelation, this study is able to ascertain whether, when accounting for regional connections based on an economic distance spatial weights matrix, it is appropriate to employ a spatial DID model for parameter estimation or to adopt causal inference methods that do not rely on spatial spillover effects.
In this study, we utilize the global Moran’s I to test for spatial autocorrelation in the dependent variable, ensuring that potential spatial dependencies are appropriately accounted for in subsequent analyses. This approach enhances the reliability and accuracy of our analytical results. Global Moran’s I is a statistical metric employed to measure spatial autocorrelation among observations within a dataset, reflecting the degree to which similar values cluster spatially. By adopting the global Moran’s I to examine the spatial autocorrelation of the dependent variable, we aim to incorporate potential spatial dependencies correctly into our analyses, thereby bolstering the credibility and precision of our findings. The value of this index typically ranges between −1 and +1, where a positive value indicates the presence of positive spatial autocorrelation, implying that similar observations tend to cluster together; a negative value suggests negative spatial autocorrelation, with observations dispersed; and a value close to 0 implies a spatially random distribution. Table 5 and Table 6 report the results based on the economic distance spatial weights matrix for the dependent variables in this study: total energy consumption (lnEnergy) and energy intensity (EI), respectively. Both tables reveal that the global Moran’s I values for regional total energy consumption and regional energy intensity were significantly positive during the period from 2010 to 2022, and the values of the global Moran’s I generally exhibited an upward trend over this time span.
Table 5.
The global Moran’s I of the explained variable I of total energy consumption (lnEnergy) and its significance.
Table 6.
The global Moran’s I of the explained variable II energy intensity (EI) and its significance.
Figure 2 and Figure 3 present the local Moran scatterplots for the dependent variables total energy consumption (lnEnergy) and energy intensity (EI) in 2010 and 2022, respectively. These figures demonstrate the presence of “high–high” clustering and “low–low” clustering characteristics in the geographical spatial distribution of regional total energy consumption and regional energy intensity. (Due to space constraints, this study only reports the local Moran scatterplot distributions for the years 2010 and 2022; however, the local Moran scatterplot distributions for other years also exhibit “high–high” and “low–low” clustering properties).
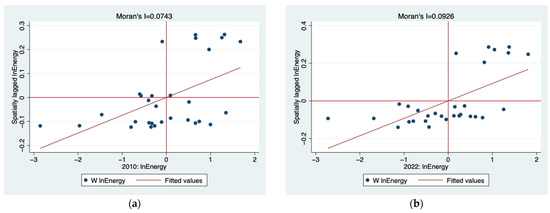
Figure 2.
The local Moran scatter plot of the explained variable I total energy consumption (lnEnergy). (a) Local Moran scatter plot from 2010; (b) Local Moran scatter plot for 2022.
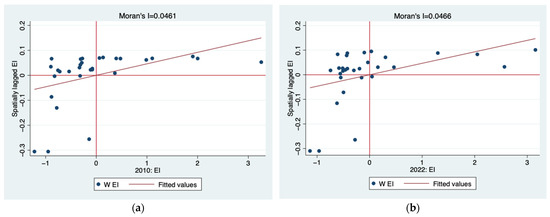
Figure 3.
The local Moran scatter plot of the explained variable II energy intensity (EI). (a) Local Moran scatter plot from 2010; (b) Local Moran scatter plot for 2022.
5.1.2. Optimization and Test of Spatial Difference-In-Differences Model
Prior to employing the spatial difference-in-differences (DID) model, it is necessary to conduct model selection through tests such as the Lagrange multiplier (LM) test, Hausman test, likelihood ratio (LR) test, and Wald test. These tests allow for the selection of the optimal model among the spatial autoregressive DID (SAR-DID), spatial error DID (SEM-DID), and spatial Durbin DID (SDM-DID) for causal inference. This process ensures that the chosen model accurately captures spatial dependence and heterogeneity, thereby providing a reliable basis for parameter estimation.
Table 7 and Table 8 report the applicability test and selection process of the spatial difference-in-differences model with the explained variables of total energy consumption (lnEnergy) and energy intensity (EI). Firstly, this study uses the robust statistics of the Lagrange multiplier method (Robust-LM) to compare the applicability of SAR-DID and SEM-DID with ordinary least squares estimation—that is, whether it is necessary to introduce a spatial lag term or spatial error term into the non-spatial econometric model. Table 7 and Table 8 show that the Robust-LM statistics for spatial lag and spatial error are significant, indicating that it is necessary to introduce spatial lag and spatial error into the non-spatial econometric model at the same time. Therefore, this study uses SDM-DID for empirical analysis. In the Hausman test for the fixed-effect model, both Table 7 and Table 8 show that the fixed-effect model is better than the random-effect model in the SDM-DID model. In the LR test for specific types of fixed effects, both Table 7 and Table 8 show that the use of space–time double fixed effects is better than one of the fixed effects of space fixed effects or time fixed effects. Therefore, this study uses the spatial Durbin difference-in-differences model (SDM-DID) based on the space–time double fixed effect as an empirical model for causal inference in this study.
Table 7.
The applicability test of the spatial difference-in-differences model with the explained variable of total energy consumption (lnEnergy).
Table 8.
Applicability test of the spatial difference-in-differences model with energy intensity (EI) as the explained variable.
After determining the model, this study proceeds with post-hoc tests to validate its suitability. The results of the Wald and likelihood ratio (LR) tests presented in Table 7 and Table 8 consistently indicate that the SDM-DID model outperforms both the spatial autoregressive DID (SAR-DID) and the spatial error DID (SEM-DID) models. These findings suggest that the SDM-DID model does not degenerate into either the SAR-DID or the SEM-DID during parameter estimation, further reinforcing the correctness of selecting the SDM-DID for parameter estimation in this study.
5.1.3. Parameter Estimation Results Based on Spatial Difference-In-Differences Model
Following the aforementioned tests, this study ultimately selects the spatial Durbin difference-in-differences (SDM-DID) model with both space–time two-way fixed effects for parameter estimation. To comprehensively and intuitively present the direct impact and spatial spillover effects of digital government construction on regional dual energy control, as posited in hypotheses H1–H4, this study decomposes the obtained parameter estimates from the spatial DID model into direct and indirect effects. In spatial econometric analysis, the direct effect refers to the influence of an explanatory variable at a specific location on the dependent variable at the same location. This effect captures the immediate impact of a change in a regional characteristic on its own outcome variable. By evaluating the direct effect, we can understand the immediate consequences of policies or interventions at their implementation sites and how these changes independently act on the local environment without considering spatial interactions. In contrast, the indirect effect embodies the influence of spatial spillovers, namely, the impact of a change in an explanatory variable at one location that propagates to other adjacent locations through the spatial weight matrix. This arises from spatial correlations due to geographical or economic proximity, where changes in one region may induce corresponding changes in neighboring regions. The indirect effect reveals cross-regional interdependence and connectivity, demonstrating the impact of regional changes as externalities on surrounding and even broader areas. This is crucial for assessing the comprehensive impact of policies and for planning, as it highlights the broader regional implications of local changes.
Table 9 presents the final results of parameter estimates for both direct and indirect effects. The spatial autoregressive coefficients for regional total energy consumption (lnEnergy) and regional energy intensity (EI) in Table 9 are −2.858 and −4.664, respectively, both of which are significant at the 1% statistical level. This indicates a negative correlation between changes in total energy consumption and energy intensity levels in other regions and the local region. The underlying cause of this phenomenon is market failure and resource misallocation. When a region enforces stringent energy control policies, it may lead to the relocation of high-energy-consuming industries or activities to neighboring regions with looser regulations or lower costs. Such industrial transfers not only increase energy consumption and intensity in the recipient regions but also result in an increase in energy consumption per unit of output due to differences in production efficiency and management standards.
Table 9.
Parameter estimation results of the spatial difference-in-differences model.
In Table 9, columns (1) and (2) present the effects of digital government construction on regional total energy consumption (lnEnergy) and regional energy intensity (EI), respectively. The direct effect coefficients of DG on lnEnergy and EI are −0.0785 and −0.602, with both passing the significance test at the 1% level. These results indicate that digital government construction can significantly contribute to the control of total energy consumption and energy intensity in the local region. This suggests that digital government initiatives, through optimizing policy implementation, enhancing regulatory effectiveness, and promoting public participation, effectively reduce energy usage and energy consumption per unit of GDP in the region. These findings support the mechanistic hypotheses H1–H2.
Simultaneously, Table 9 also reveals that the indirect effect coefficient of DG on EI is 0.678, which is significant at the 1% level. This finding indicates that although digital government construction has a significant positive policy effect on controlling energy intensity within the local region, its spatial spillover effect actually intensifies energy intensity, implying that DG development in other regions can lead to an increase in energy intensity in the focal region. This result confirms the existence of a spatial polarization effect, whereby advancements in DG in neighboring regions may attract high-energy-consuming industries or activities to relocate to the focal region, thereby elevating its energy intensity. Furthermore, improvements in energy efficiency in surrounding areas may result in lower energy costs, prompting an increase in energy consumption in the focal region. Additionally, there may be uneven policy implementation across different regions. When neighboring regions adopt advanced energy management and monitoring systems, the focal region, in an effort to maintain economic competitiveness, may be compelled to rely on more traditional, less energy-efficient production methods, thereby augmenting its own energy intensity. This parameter estimation result supports mechanistic hypothesis H4.
Table 9 indicates that the indirect effect coefficient of digital government (DG) on lnEnergy is not significant. This suggests that the mechanism proposed in hypothesis H3, which posits a spatial spillover effect of DG development on total regional energy consumption, is not supported by the data. In other words, DG development exhibits a spatial spillover effect only on regional energy intensity, but not on total energy consumption. A possible explanation for this finding is that, unlike energy intensity, which already accounts for economic development factors, changes in total energy consumption are influenced by multiple external factors, such as resource endowments, industrial restructuring, population growth, and technological advancements. These factors may obscure the spatial spillover impact of DG development on total energy consumption.
5.1.4. Parallel Trend Test
To ensure the reliability of the results, this study necessitates conducting a parallel trend test on the causal inference model. The parallel trend test in causal inference aims to ascertain that the treatment and control groups exhibit similar trends prior to the intervention. This test is crucial for confirming that any observed treatment effect is indeed attributable to the intervention, rather than to other unobserved factors. By adopting the parallel trend assumption, researchers can more confidently attribute any differences between the treatment and control groups to the treatment itself, rather than to pre-existing different trends between the two groups. In brief, the parallel trend test is a vital step in ensuring the validity of causal estimation, as it helps exclude the influence of time trends on the results, thereby enhancing the reliability of causal inference.
The parallel trend hypothesis is the premise of using the difference-in-differences model. Therefore, this study sets the parallel trend test of Formula (18) (Beck et al., 2010 [89]):
In Equation (13), is the dummy variables of n years before and after the pilot of digital government construction in region i (with t − 1 as the base period). If the coefficient θ of is not significant and the coefficient θ of is significant, it shows that there is a parallel trend between the disposal group and the control group (the time window discussed in this study is 4 years before and after the implementation of the policy), and the digital government construction can have a significant policy effect on the competitiveness of the regional innovation ecosystem. Figure 4 and Figure 5 show the coefficients of the explained variables and , respectively. The figure shows that the quasi-natural experiment in this study passes the parallel trend test.
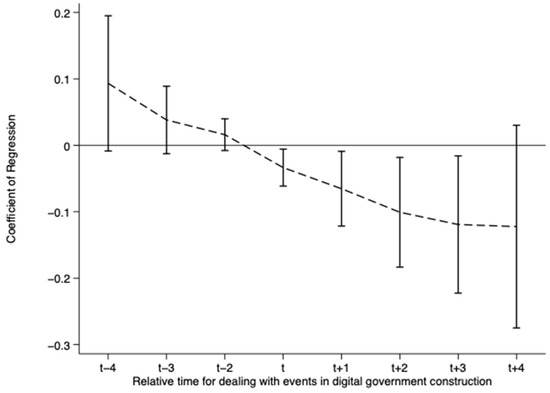
Figure 4.
Parallel trend test results of causal inference with explanatory variable lnEnergy.
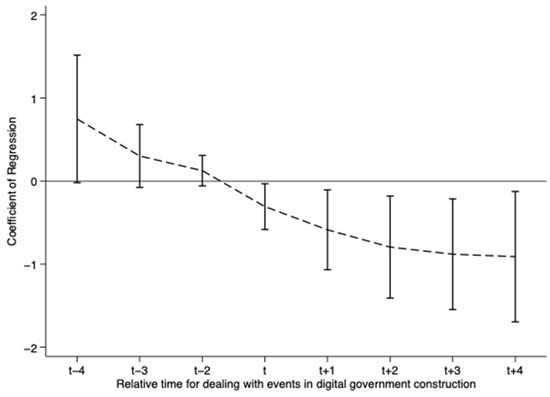
Figure 5.
Parallel trend test results of causal inference with explained variable EI.
5.2. Effect Test Based on Dual Machine Learning Model
5.2.1. Baseline Regression
Based on the dual machine learning model, this study can conduct unbiased parameter estimation on the impact mechanism of digital government construction on regional energy dual control. In the process of parameter estimation of the dual machine learning model, firstly, the machine learning algorithm used in the model is set as Lassoic, and the sample segmentation ratio of cross-validation is set to 1:4. Table 10 is the parameter estimation results of the effect of digital government construction (DG) on regional energy consumption (lnEnergy) and regional energy intensity (EI).
Table 10.
Benchmark regression based on dual machine learning model.
Column (1) of Table 10 shows that the parameter estimate of digital government construction (DG) on regional total energy consumption (lnEnergy) is –0.0590, which passes the 1% significance test. The results show that digital government can significantly help the region to achieve total energy consumption control. Column (2) of Table 10 shows that the parameter estimation result of digital government construction (DG) on regional energy intensity (EI) is −0.511, which is significant at the statistical level of 1%, indicating that digital government construction can also help the region to achieve control of energy intensity. This set of parameter estimation results again verifies mechanism hypotheses H1–H2.
5.2.2. The Mechanism Effect Test of the Development of Science and Technology Civilization
In order to verify whether the development of scientific and technological civilization will have a mechanism effect on digital government construction and regional energy dual control in mechanism hypotheses H5–H6, this study uses the stepwise regression method based on the dual machine learning model to test whether the mechanism path “digital government construction → scientific and technological civilization development → regional energy dual control” is established. Table 11 shows the results of the regression test.
Table 11.
The process test results of the mechanism effect of scientific and technological civilization between digital government construction and regional energy dual control.
In Table 11, column (2) shows that the total effect coefficient of DG on the explained variable EI is −0.511, which is significant at the statistical level of 1%. At the same time, the coefficient of DG to the mechanism variable TC is estimated to be 0.0169, and the coefficient of the mechanism variable TC to the explained variable EI is −1.427, which is significant at the statistical levels of 5% and 1%, respectively. The results show that the development of science and technology civilization plays a partial mediating effect of 3.2% between digital government construction and regional energy intensity—that is, digital government construction can indirectly control regional energy intensity by promoting the development of science and technology civilization. This shows that digital government construction helps to create a more open and transparent information environment and encourage innovation and technology exchange, which helps to accelerate the development of scientific and technological civilization. With the improvement in science and technology, new energy-saving technologies have been promoted and applied faster, improving energy efficiency and reducing energy consumption per unit output. In addition, the Z statistics of the Sobel, Aroian, and Goodman tests for the parameter estimation results of the transmission path of the policy mechanism of “digital government construction → scientific and technological civilization development → regional energy intensity” are all significant at the level of 10%, indicating that this mechanism path is significant.
In Table 11, column (1) shows that the total effect coefficient of DG on the explained variable lnEnergy is −0.0590, which passes the 1% significance test. At the same time, the coefficient of DG to the mechanism variable TC is estimated to be 0.0169, which passes the 5% significance test, while the coefficient of the mechanism variable TC to the explained variable lnEnergy is not significant. This means that although the construction of digital government can have a positive effect on the progress of scientific and technological civilization and the total control of regional energy consumption, the policy mechanism transmission path of “DG → TC → lnEnergy” is not established. The policy mechanism transmission path of “digital government construction → scientific and technological civilization development → regional energy intensity” is established, while the policy mechanism transmission path of “digital government construction → scientific and technological civilization development → total regional energy consumption” is not established. The possible reason for this phenomenon is that the development of scientific and technological civilization will lead to an energy rebound effect due to the “Jevons paradox “(Sorrell, 2009 [90]). Specifically, the “Jevons paradox” points out that technological progress, while improving energy efficiency, also reduces the marginal cost of energy use, thereby stimulating more economic activity and consumption, which may eventually lead to an increase in total energy consumption. In this case, even if digital government construction promotes the development of scientific and technological civilization and makes energy utilization more efficient, the decline in unit energy costs may lead to higher energy demand and consumption levels, which in turn offsets some or all of the energy-saving effects brought about by efficiency improvement. Therefore, although scientific and technological progress helps to reduce energy consumption per unit of output (i.e., energy intensity), the impact on total energy consumption may be limited or even negative in some cases. This explains why in this study, the development of scientific and technological civilization as a mediating variable has a significant impact on regional energy intensity but has no significant effect on the total regional energy consumption. Therefore, for mechanism path hypotheses H5–H6, the empirical conclusion can only support the control of regional energy intensity and cannot support the control of regional total energy consumption.
5.2.3. The Mechanism Effect Test of Spiritual Civilization Development
In order to verify whether the mechanism path of “digital government construction → spiritual civilization development → regional energy dual control” is established in mechanism hypotheses H7–H8, this study also uses the stepwise regression method based on the dual machine learning model to estimate the parameters. Table 12 is the estimation result.
Table 12.
The process test results of the mechanism effect of spiritual civilization between digital government construction and regional energy dual control.
In Table 12, column (1) shows that the total effect coefficient of DG on the explained variable lnEnergy is −0.0590 (p < 0.1); at the same time, the coefficient of action of DG on the mechanism variable SC is 0.0119, while the coefficient of action of the mechanism variable SC on the explained variable lnEnergy is −1.270, which is significant at the levels of 5% and 1%, respectively. “Digital government construction → spiritual civilization development → regional energy consumption mitigation” is a partial intermediary mechanism transmission path with an intermediary proportion of 25.6%. This result shows that the construction of digital government can indirectly alleviate the total regional energy consumption by significantly promoting the development of regional spiritual civilization. The construction of digital government not only directly reduces the total energy consumption but also enhances the social awareness of environmental protection and technological innovation by promoting the development of spiritual civilization, and promotes the wide application of energy-saving technologies and management measures. The progress of spiritual civilization makes the public and enterprises pay more attention to sustainable development, and take practical actions to reduce energy waste and improve resource utilization efficiency. Therefore, although the direct effect exists but are not very significant, the construction of digital government can still indirectly realize the effective control of the total regional energy consumption by improving the level of spiritual civilization. This indirect effect reveals the important role of social and cultural factors in the process of policy implementation and emphasizes the necessity of comprehensive measures to deal with complex environmental problems. In addition, the Z statistics of the Sobel, Aroian, and Goodman tests of the parameter estimation results of the policy mechanism transmission path “DG → SC → lnEnergy” are all significant at the level of 10%, indicating that this mechanism path is significant.
In Table 12, column (2) shows that the total effect coefficient of DG on the explained variable EI is −0.511 (p < 0.1); at the same time, the effect coefficient of DG on the mechanism variable SC is 0.0119, while the effect coefficient of the mechanism variable SC on the explained variable lnEnergy is −9.583, which is significant at the levels of 5% and 1% respectively. “Digital government construction → spiritual civilization development → regional energy intensity mitigation” is a partial mediation mechanism transmission path with an intermediary proportion of 22.3%. This result shows that the construction of digital government not only directly reduces the regional energy intensity but also indirectly achieves further energy intensity mitigation by promoting the development of spiritual civilization. The progress of spiritual civilization has promoted an improvement in public awareness of environmental protection and the acceleration of technological innovation, making energy-saving technologies and efficient management measures more widely used. Specifically, with the improvement in the level of spiritual civilization, society pays more attention to sustainable development, and enterprises and individuals are more inclined to adopt energy-saving and environmental protection practices, thereby improving overall energy efficiency and reducing energy consumption per unit of output. In addition, the Z statistics of the Sobel, Aroian, and Goodman tests of the parameter estimation results of the policy mechanism transmission path “DG → SC → EI” parameter estimation results all show significance at the level of 10%, indicating that this mechanism path is significant. The above empirical research results prove that the mechanism hypotheses H7–H8 are significantly established.
5.2.4. The Mechanism Effect Test of the Coordination of Scientific and Technological Civilization and Spiritual Civilization
In order to verify whether the mechanism path of “digital government construction → scientific and technological civilization and spiritual civilization coordination → regional energy dual control” in H9–H10 is established, this study takes the coupling coordination degree (TC&SC) of the development system of scientific and technological civilization and the development system of spiritual civilization as the mechanism variable, and also uses the stepwise regression method based on the dual machine learning model to estimate the parameters. Table 13 is the estimation result.
Table 13.
The process test results of the coordination of scientific and technological civilization and spiritual civilization in exerting the mechanism effect between digital government construction and regional energy dual control.
Combined with the parameter estimation results in columns (1) and (2) of Table 13, the total effect coefficients of DG on the explained variables lnEnergy and EI are −0.0590 and −0.511, respectively, which are significant at the 1% significance level. The coefficient of DG to the mechanism variable TC&SC is 0.0199, which passes the 1% significance test. The coefficients of the mechanism variable TC&SC to the explained variables lnEnergy and EI are significantly negative at the statistical levels of 5% and 1%, respectively, and the values are −0.333 and −2.323, respectively. Combined with the three groups of Sobel, Aroian, and Goodman tests, it can be concluded that “digital government construction → coordination of scientific and technological civilization and spiritual civilization → total regional energy consumption mitigation” and “digital government construction → coordination of scientific and technological civilization and spiritual civilization → regional energy intensity mitigation” are the transmission paths of partial intermediary mechanisms with intermediary proportions of 11.3% and 9.1%, respectively. It can be seen that the construction of digital government can not only strengthen the development of scientific and technological civilization and the development of spiritual civilization in the region alone, but more importantly, it also promotes the coordination and integration between the two, so as to more effectively help the region achieve the goal of dual energy control. The development of technological civilization has led to technological innovations and management optimizations, resulting in reduced energy consumption per unit of output. Meanwhile, advancements in spiritual civilization have heightened public awareness of environmental protection and willingness to adopt technologies, thereby minimizing unnecessary energy waste. When these two aspects are harmoniously coordinated, they collectively contribute to the optimization of energy consumption patterns, effectively controlling both the total amount and the intensity of regional energy consumption. Consequently, digital government construction plays a pivotal role in promoting the coordinated development of technological and spiritual civilizations. This not only enhances energy utilization efficiency but also provides robust support for achieving sustainable development goals.
6. Conclusions and Policy Recommendations
6.1. Research Conclusions
This study uses the spatial difference-in-differences model and the dual machine learning model to explore the impact of digital government construction on regional energy consumption and energy intensity. Through an empirical analysis, the research not only examines the direct effect of digital government construction but also analyzes its indirect mechanism effect through the development of scientific and technological civilization and spiritual civilization, as well as the spatial spillover effect of these factors in different regions. The research results reveal the multiple roles of digital government construction in promoting dual regional energy control and emphasize the importance of the coordinated development of scientific and technological civilization and spiritual civilization as a mechanism. The main conclusions of this study are as follows:
(1) Digital Government Construction Effectively Supports the Dual Control of Regional Energy: The estimation results based on the dual machine learning model show that when the region conducts digital government construction, the total regional energy consumption will decrease by 0.0853 units on average, and the regional energy consumption intensity will decrease by 0.744 units on average. These two results verify H1 and H2, respectively. The construction of digital government significantly promotes the control of regional energy consumption and energy intensity. By optimizing policy implementation, improving regulatory effectiveness, and promoting public participation, the energy use and energy consumption per unit of GDP in the region are effectively reduced.
(2) Spatial Polarization Effects Exist: The estimation results based on the spatial difference-in-differences model show that when other regions carry out digital government construction, it will have a positive spatial spillover effect on the energy intensity of the region—that is, it will increase the regional energy intensity of the region by 0.678 units, but it has no significant impact on the total regional energy consumption of the region. Therefore, H4 is verified but H3 is falsified. The construction of digital government may lead to an increase in energy intensity in other regions while reducing the energy intensity in the region. This phenomenon may be due to the migration of high-energy-consuming industries or activities to less regulated areas, or an increase in energy consumption in the region due to an improvement in energy efficiency in the surrounding areas.
(3) Digital Government Construction Indirectly Supports Energy Intensity Control by Influencing Technological Civilization Development: The estimation results of the mechanism effect based on the stepwise regression of dual machine learning show that scientific and technological civilization has a significant mechanism effect between digital government construction and energy intensity control—that is, the development of scientific and technological civilization plays a partial mediating role between digital government construction and regional energy intensity (the proportion of the mediating effect reaches 3.2%), which verifies hypothesis H6. However, scientific and technological civilization cannot have an effective mechanism effect on digital government construction and total energy consumption. Assuming that H5 is falsified, a possible reason is that the efficiency improvement brought about by technological progress is offset by higher energy demand (that is, there is a “Jevons paradox”).
(4) Digital Government Construction Indirectly Supports the Dual Control of Total Energy Consumption and Intensity by Influencing Spiritual Civilization Development: The results of mechanism effect estimation based on double machine learning stepwise regression show that spiritual civilization has a significant mechanism effect on digital government construction and total energy consumption control—that is, the development of spiritual civilization plays a partial mediating role between digital government construction and total energy consumption control (the mediating effect accounts for 15.0%), which verifies hypothesis H7; at the same time, the research results also show that the development of spiritual civilization plays a partial mediating role between digital government construction and regional energy intensity (the mediating effect accounts for 13.7%), which verifies hypothesis H8. Under the influence of digital government construction, the progress of spiritual civilization has significantly promoted the mitigation of the total amount and intensity of regional energy consumption. The development of spiritual civilization enhances the social awareness of environmental protection and the willingness to adopt technology, reduces unnecessary energy waste, and improves overall energy efficiency.
(5) Digital Government Construction Indirectly Supports the Dual Control of Total Energy Consumption and Intensity by Facilitating the Harmonious Development of Technological and Spiritual Civilizations: The results of mechanism effect estimation based on double machine learning stepwise regression show that the coordination of scientific and technological civilization and spiritual civilization has a significant mechanism effect on digital government construction and total energy consumption control—that is, the coordination of scientific and technological civilization and spiritual civilization plays a partial intermediary role between digital government construction and total regional energy consumption control (the proportion of intermediary effect reaches 7.2%), which verifies hypothesis H9; at the same time, the research results also show that the coordination of scientific and technological civilization and spiritual civilization plays a partial mediating role between digital government construction and regional energy intensity (the mediating effect accounts for 8.8%), which verifies hypothesis H10. The construction of digital government can significantly promote the coordination of scientific and technological civilization and spiritual civilization. With the coordinated development of scientific and technological civilization and spiritual civilization, the two work together to optimize the energy consumption model, so the total amount and intensity of regional energy consumption are more effectively controlled.
6.2. Policy Suggestions
Based on the aforementioned conclusions, this study proposes the following policy suggestions:
(1) Strengthening the Construction of Digital Government to Systematically Advance the “Dual Control” Goals for Total Energy Consumption and Intensity: Governments at all levels should expedite the development of digital government initiatives, with a primary focus on establishing intelligent energy management platforms that integrate functions for monitoring, early warning, and regulation of energy consumption. A cross-departmental data-sharing mechanism should be established to enable real-time, dynamic supervision of energy use. By leveraging artificial intelligence algorithms, energy trends can be predicted to optimize energy dispatching strategies. Simultaneously, public engagement in energy governance should be encouraged, for instance, by implementing a point-based incentive system for energy conservation through mobile applications, thereby motivating households and enterprises to proactively reduce energy waste. Additionally, dedicated funds should be allocated to supporting pilot projects for digital energy management systems. Technologies such as smart meters and online energy consumption monitoring systems should be promoted in key industries, including manufacturing, transportation, and construction, with the aim of effectively reducing both the total energy consumption and energy consumption per unit of GDP.
(2) Establishing a Regional Collaborative Governance Mechanism to Prevent the Expansion of Spatial Polarization Effects in Energy Intensity: In response to the spatial spillover effects stemming from the development of digital government initiatives, the central and provincial governments should facilitate the establishment of a cross-regional collaborative mechanism for energy governance. This is crucial to avoid issues such as the “not in my back yard” (NIMBY) phenomenon or the relocation of high-energy-consuming industries to regions with lax regulatory oversight. For instance, regional carbon emission trading markets or energy efficiency evaluation systems could be established to incorporate energy intensity across different regions into a unified assessment framework. Financial transfer payments and other incentives could be employed to encourage lagging regions to expedite their digital transformation. Meanwhile, neighboring cities should be encouraged to jointly construct energy information-sharing platforms and conduct collaborative law enforcement inspections to ensure uniformity in energy regulatory standards and prevent a rebound in energy intensity due to policy disparities.
(3) Enhancing the Role of Digital Government Functions Guided by Technological Innovation and Leveraging Technological Advancement as a Mediator in Energy Intensity Reduction: Governments should position technological innovation as a pivotal pillar in the construction of digital government, actively promoting the profound integration of digitalization and green technologies to augment the technological sophistication and effectiveness of energy governance. By consolidating policy, financial, and platform resources, governments should guide and support collaborative innovation among research institutions, universities, and enterprises, expediting the research, development, and practical application of pivotal energy-saving technologies. Simultaneously, a technology dissemination and service system tailored for enterprises and grassroots levels should be established to facilitate the widespread adoption of cutting-edge scientific and technological achievements in energy management. Building upon this foundation, it is imperative to further optimize the industrial spatial layout, fostering a development environment conducive to the incubation and application of green technologies. This will effectively harness the leading and supportive role of technological advancement in driving down energy intensity.
(4) Promoting the Deep Integration of Spiritual Civilization Construction with Digital Government to Enhance Public Awareness and Voluntary Action in Energy Conservation: To better integrate the principles of ecological civilization into the entire process of digital government governance, it is crucial to establish a comprehensive and multifaceted system for energy-saving education and publicity. This system should actively guide society as a whole towards adopting a green and low-carbon lifestyle. By leveraging digital means to innovate the formats of energy-saving and environmental protection publicity, we can enhance public participation and foster a sense of social consensus, thereby promoting a cultural atmosphere that champions thriftiness and green consumption. Simultaneously, the promotion of digital energy-saving practices across various social entities is essential. This will bolster the entire populace’s awareness of and voluntary commitment to energy conservation, ultimately contributing to a sustained reduction in both the total volume and intensity of regional energy consumption.
(5) Orchestrating the Harmonious Development of Technological and Spiritual Civilizations to Establish a “Dual-Engine-Driven” Sustainable Energy Governance Model: It is recommended that local governments coordinate and promote the integrated development of technological and spiritual civilizations as a cornerstone for enhancing the efficacy of energy governance. In parallel with advancing the construction of intelligent and digital infrastructure, emphasis should be placed on nurturing socially shared values of green and low-carbon living. This will guide the public and enterprises towards cultivating a conscious commitment to energy conservation and environmental protection. Furthermore, we advocate for the initiation of pilot projects in key regions that blend innovation, exploring new pathways that integrate technological advancements with cultural guidance. This approach aims to foster more efficient, transparent, and sustainable energy management practices. By doing so, we can achieve a synergy where technological progress and societal civilization jointly propel the high-quality development of regional energy governance.
6.3. Discussion
(1) This study systematically validated the dual control effects of digital government construction on both total energy consumption and energy intensity using a double machine learning model, transcending the limitations of traditional research that predominantly focused on a single governance dimension (such as technological efficiency or institutional embedding). In contrast to previous analyses of digital government’s role, which often approached it from the perspectives of technological tools or policy coordination, this study unveils a comprehensive mechanism through which digital government optimizes policy implementation pathways, enhances regulatory efficacy, and promotes public participation. It introduces a new paradigm of “technological–cultural synergistic governance”, providing empirical evidence for the multidimensional functions of digital government in energy governance. Furthermore, it deconstructs the internal pathway design issues within the policy black box, addressing the theoretical gap left by the traditional framework that dichotomizes technological rationality and value rationality.
(2) Based on a spatial difference-in-differences model, this study uncovers a “positive spatial spillover effect” of digital government construction on the energy intensity of neighboring regions, shedding light on the dynamic mechanisms underlying the transfer of high-energy-consuming industries and efficiency spillovers. In contrast to traditional energy governance research that primarily focuses on localized benefits, this study transcends regional research frameworks by quantifying spatial polarization effects. It offers theoretical underpinnings for cross-regional collaborative governance and provides a fresh perspective for addressing policy design challenges in the “efficiency–equity” trade-off, thereby bridging the empirical gap in studies of spatial externalities. By revealing the “pollution haven” effect and the efficiency competition trap in neighboring regions, this conclusion furnishes a theoretical framework for dynamic game analysis in cross-regional energy governance.
(3) Through mechanistic analysis, this study quantifies the partial mediating role of technological advancement in controlling energy intensity and reveals its inherent logic constrained by the “Jevons paradox”, thereby transcending the traditional framework that fractures technological rationality from value rationality. In contrast to existing studies that regard technological progress as a unidirectional driving factor (e.g., the “rebound effect” or “techno-compression effect”), this study proposes a theoretical model of “technology–demand” dual-track regulation. It offers causal inference support for unraveling the paradox between enhanced technological efficiency and the rebound in energy demand, thereby expanding the boundaries of coupled research on technological innovation and energy governance. Furthermore, it provides a theoretical basis for policy design aimed at achieving a dynamic equilibrium between technological empowerment and societal demand.
(4) This study quantifies the dual mediating role of spiritual civilization in controlling both total energy consumption and energy intensity using a double machine learning model, unveiling its microscopic mechanisms through reshaping social consensus and behavioral norms. In contrast to traditional research confined to analyses of “unidirectional behavior shaping” or “cultural adaptability”, this study introduces an “extended capabilities” model that emphasizes the complementarity between technological access capabilities and value choice capabilities. It offers theoretical innovation regarding the systemic functions of cultural factors in energy governance, filling the research gap in the synergy between social resilience and technological empowerment. Consequently, it propels the paradigm shift of energy governance theory from a single-dimensional to a systemically coupled approach.
(5) This study identifies the mediating role of the synergistic development of technological and spiritual civilizations in optimizing energy consumption patterns and proposes a governance paradigm where “digital government acts as a collaborative hub”, thereby transcending the linear relationship assumption between technological determinism and cultural adaptability. In contrast to existing research that analyzes the pathways of technology and culture in isolation, this paper constructs a theoretical framework for the dynamic adaptation of “technology–culture” interactions. It provides empirical support from the Chinese experience for emerging economies seeking to balance technological efficiency and social resilience in their energy transition pathways. This work drives a paradigm shift in energy governance theory from a singular dimensionality to a systemically coupled approach, offering a novel governance paradigm of “technology–culture co-evolution” for global energy transformation.
6.4. Future Prospects
This study analyzes the impact of digital government construction on dual regional energy control and reveals the key role of the co-evolution of scientific and technological civilization and spiritual civilization. With the advancement of digital transformation and the implementation of the “double carbon” goal, energy governance is increasingly dependent on intelligent and data-based means. However, ensuring that these technologies improve regulatory efficiency without creating social inequities or information gaps is a common challenge for policymakers and academia.
In addition, at present, the construction of a digital government mainly depends on the enthusiasm of local governments and lacks unified national standards and cross-regional coordination mechanisms. Therefore, it is necessary to further improve the top-level design and promote cooperation between the central and local governments to effectively deal with the spatial spillover effect and regional development imbalance in dual energy control. At the same time, although spiritual civilization has a significant impact on energy consumption behavior, the cultivation of public environmental awareness is a long-term process. Follow-up research should combine psychological and behavioral economics methods to explore precise strategies to enhance public participation willingness and behavior conversion rates.
From an international perspective, although China’s experience has reference significance, the development stage, institutional environment, and cultural background of different countries still need to be considered for differentiated analyses. Through a cross-country case comparison, a more universal governance framework can be refined to provide theoretical support and practical reference for global low-carbon energy transformation. In summary, the strategic value of a digital government in energy governance is becoming more and more important. Focusing on the deep integration of “technology–system–culture” will help to form a new pattern of efficient, fair, and sustainable energy governance.
Author Contributions
Conceptualization, X.Z. and K.L.; data curation, R.X. and J.T.; formal analysis, X.Z.; investigation, R.X., L.Y., Q.L. and X.Y; methodology, X.Z.; project administration, K.L.; resources, J.T., L.Y., Q.L. and X.Y.; software, X.Z.; supervision, K.L.; validation, X.Z. and K.L.; writing—original draft, X.Z. and R.X.; writing—review and editing, K.L. All authors have read and agreed to the published version of the manuscript.
Funding
This research was supported by the research project of Ningbo Urban Civilization Research Institute: Sample Study of Civilization and Good Governance in Grassroots Communities Based on Artificial intelligence Application Scenarios—a case study of Ningbo Hefeng, Mingzhu, Haichuang and other communities (CSWM202307), the 2024 Ningbo Soft Science Research Program: Research on the Resource Carrying and Utilization of Ningbo Science and Technology Celebrities—Taking the Revitalization and Development Path of Ningbo’s “Hometown of Academicians” as an Example (2024R044), the Zhejiang Soft Science Research Plan Project “Boosting the Development of Zhejiang’s Low-Altitude Economy: Current Situation Analysis, Application Scenario Exploration, and Countermeasure Research” (2025C35059), and the Excellent Graduate Student “Innovation Star” Project of the Gansu Provincial Department of Education: “Research on the Empowerment of the Innovation Ecosystem along the Yellow River Science and Technology Corridor for the Development of New Quality and New Energy in Gansu” (2025CXZX-134).
Institutional Review Board Statement
Not applicable.
Informed Consent Statement
Not applicable.
Data Availability Statement
Data are contained within the article.
Acknowledgments
The authors would like to thank the editors and anonymous reviewers for their thoughtful and constructive comments.
Conflicts of Interest
The authors declare no conflicts of interest.
References
- Stern, N.; Xie, C. China’s new growth story: Linking the 14th Five-Year Plan with the 2060 carbon neutrality pledge. J. Chin. Econ. Bus. Stud. 2023, 21, 5–25. [Google Scholar] [CrossRef]
- Bleda, M.; Del Rio, P. The market failure and the systemic failure rationales in technological innovation systems. Res. Policy 2013, 42, 1039–1052. [Google Scholar] [CrossRef]
- Xu, H.; Li, Y.; Zheng, Y.; Xu, X. Analysis of spatial associations in the energy–carbon emission efficiency of the transportation industry and its influencing factors: Evidence from China. Environ. Impact Assess. Rev. 2022, 97, 106905. [Google Scholar] [CrossRef]
- Huo, D.; Zhang, X.; Meng, S.; Wu, G.; Li, J.; Di, R. Green finance and energy efficiency: Dynamic study of the spatial externality of institutional support in a digital economy by using hidden Markov chain. Energy Econ. 2022, 116, 106431. [Google Scholar] [CrossRef]
- Shahbaz, M.; Wang, J.; Dong, K.; Zhao, J. The impact of digital economy on energy transition across the globe: The mediating role of government governance. Renew. Sustain. Energy Rev. 2022, 166, 112620. [Google Scholar] [CrossRef]
- Cheng, Y.; Zhang, Y.; Wang, J.; Jiang, J. The impact of the urban digital economy on China’s carbon intensity: Spatial spillover and mediating effect. Resour. Conserv. Recycl. 2023, 189, 106762. [Google Scholar] [CrossRef]
- Liu, J.; Siano, P.; Wu, K. Exploration of drivers for energy regulatory process reengineering in the digital era: The grounded theory approach. Energy 2025, 316, 134620. [Google Scholar] [CrossRef]
- Abdmouleh, Z.; Gastli, A.; Ben-Brahim, L. Survey about public perception regarding smart grid, energy efficiency & renewable energies applications in Qatar. Renew. Sustain. Energy Rev. 2018, 82, 168–175. [Google Scholar]
- Feng, Y.; Han, Y.; Hu, S.; Pan, Y. Alleviating energy poverty globally: Does digital government matter? Energy Econ. 2025, 143, 108272. [Google Scholar] [CrossRef]
- Nižetić, S.; Arici, M.; Shahsavar, A.; Li, D.; Doranehgard, M.H. The Role of Smart Technologies in Energy Engineering. Energy 2025, 321, 135296. [Google Scholar] [CrossRef]
- Pan, T.; Lin, B. Is the green credit policy useful for improving energy intensity? Evidence from cities in China. Financ. Innov. 2025, 11, 30. [Google Scholar] [CrossRef]
- Li, X.; Zhang, D.; Zhang, T.; Ji, Q.; Lucey, B. Awareness, energy consumption and pro-environmental choices of Chinese households. J. Clean. Prod. 2021, 279, 123734. [Google Scholar] [CrossRef]
- Destek, M.A.; Hossain, M.R.; Manga, M.; Destek, G. Can digital government reduce the resource dependency? Evidence from method of moments quantile technique. Resour. Policy 2024, 99, 105426. [Google Scholar] [CrossRef]
- Xu, N.; Luo, J.; Ye, N.; Zeng, M. Application and Development of Active Distribution Grid Technology for Integrated Energy Systems in the Context of Industrial Internet. In Proceedings of the 10th Frontier Academic Forum of Electrical Engineering (FAFEE2022), Xi’an, China, 14 August 2022; pp. 491–502. [Google Scholar]
- Xiao, H.; He, Y.; Ge, W. Living with digital government: Effects of technology anxiety on public support for policy in China. J. Chin. Political Sci. 2024, 1–26. [Google Scholar] [CrossRef]
- Amiri, A.; Ottelin, J.; Sorvari, J.; Junnila, S. Economic and technical considerations in pursuing green building certification: A case study from Iran. Sustainability 2020, 12, 719. [Google Scholar] [CrossRef]
- Sen, A. Development as Freedom; Oxford University Press: New York, NY, USA, 1999. [Google Scholar]
- Kotowicz, J.; Niesporek, K.; Baszczeńska, O. Advancements and Challenges in Direct Air Capture Technologies: Energy Intensity, Novel Methods, Economics, and Location Strategies. Energies 2025, 18, 496. [Google Scholar] [CrossRef]
- Yamane, T.; Kaneko, S. Exploring the impact of awareness on public acceptance of emerging energy technologies: An analysis of the oil palm industry. J. Clean. Prod. 2023, 414, 137593. [Google Scholar] [CrossRef]
- Gong, Y.; Yang, X. Understanding strategies for digital government transformation: A strategic action fields perspective. Int. J. Inf. Manag. 2024, 76, 102766. [Google Scholar] [CrossRef]
- Adebayo, T.S.; Ullah, S. Formulating sustainable development policies for China within the framework of socioeconomic conditions and government stability. Environ. Pollut. 2023, 328, 121673. [Google Scholar] [CrossRef]
- He, W.; Li, W.; Wang, C.; Wang, S.; Yang, Y. Does energy resource misallocation affect energy utilization efficiency? Evidence from Chinese provincial panel data. Energy 2024, 288, 129544. [Google Scholar] [CrossRef]
- Mahmood, M. Enhancing citizens’ trust and confidence in government through digital transformation. Int. J. Electron. Gov. Res. (IJEGR) 2016, 12, 99–110. [Google Scholar] [CrossRef]
- Wang, Q.; Hu, A.; Tian, Z. Digital transformation and electricity consumption: Evidence from the Broadband China pilot policy. Energy Econ. 2022, 115, 106346. [Google Scholar] [CrossRef]
- Duan, Y.; Xi, B.; Xu, X.; Xuan, S. The impact of government subsidies on green innovation performance in new energy enterprises: A digital transformation perspective. Int. Rev. Econ. Financ. 2024, 94, 103414. [Google Scholar] [CrossRef]
- Abujassar, R.S. A highly effective algorithm for mitigating and identifying congestion through continuous monitoring of IoT networks, improving energy consumption. Wirel. Netw. 2024, 30, 3161–3180. [Google Scholar] [CrossRef]
- Isingoma-Wakaisuka, J.; Ibanda, C.K.K.; Naluwooza, R.; Namaganda, C. Application of smart electronic systems, firm characteristics and efficient energy consumption–a case of public universities in Uganda. Int. J. Soc. Econ. 2020, 47, 1023–1041. [Google Scholar] [CrossRef]
- Shao, S.; Yang, Z.; Yang, L.; Zhang, X.; Geng, Y. Synergetic conservation of water and energy in China’s industrial sector: From the perspectives of output and substitution elasticities. J. Environ. Manag. 2020, 259, 110045. [Google Scholar] [CrossRef]
- Zuo, W.; Innocenti, A.; Zarrabeitia, M.; Bresser, D.; Yang, Y.; Passerini, S. Layered oxide cathodes for sodium-ion batteries: Storage mechanism, electrochemistry, and techno-economics. Acc. Chem. Res. 2023, 56, 284–296. [Google Scholar] [CrossRef]
- Schmidt, T.S.; Beuse, M.; Zhang, X.; Steffen, B.; Schneider, S.F.; Pena-Bello, A.; Bauer, C.; Parra, D. Additional emissions and cost from storing electricity in stationary battery systems. Environ. Sci. Technol. 2019, 53, 3379–3390. [Google Scholar] [CrossRef]
- Zheng, N.; Wang, Q.; Ding, X.; Zhang, H.; Duan, L.; Wang, X.; Zhou, Y.; Sun, M.; Desideri, U. Techno-economic analysis of a novel solar-based polygeneration system integrated with vanadium redox flow battery and thermal energy storage considering robust source-load response. Appl. Energy 2024, 376, 124288. [Google Scholar] [CrossRef]
- Zheng, Z.; Shafique, M.; Luo, X.; Wang, S. A systematic review towards integrative energy management of smart grids and urban energy systems. Renew. Sustain. Energy Rev. 2024, 189, 114023. [Google Scholar] [CrossRef]
- Toopshekan, A.; Ahmadi, E.; Abedian, A.; Rad, M.A.V. Techno-economic analysis, optimization, and dispatch strategy development for renewable energy systems equipped with Internet of Things technology. Energy 2024, 296, 131176. [Google Scholar] [CrossRef]
- Ahl, A.; Goto, M.; Yarime, M.; Tanaka, K.; Sagawa, D. Challenges and opportunities of blockchain energy applications: Interrelatedness among technological, economic, social, environmental, and institutional dimensions. Renew. Sustain. Energy Rev. 2022, 166, 112623. [Google Scholar] [CrossRef]
- Mohamed, M.; Zakuan, N.D.; Tengku Hassan, T.N.A.; Lock, S.S.M.; Mohd Shariff, A. Global development and readiness of nuclear fusion technology as the alternative source for clean energy supply. Sustainability 2024, 16, 4089. [Google Scholar] [CrossRef]
- Mirzaee, A.; McGarvey, R.G.; Aguilar, F.X. Feasibility of satisfying projected biopower demands in support of decarbonization interventions: A spatially-explicit cost optimization model applied to woody biomass in the eastern US. Energy Econ. 2024, 136, 107672. [Google Scholar] [CrossRef]
- Fikru, M.G.; Canfield, C. Choosing both/and: Encouraging green energy purchases in community choice aggregation. Energy Policy 2024, 185, 113949. [Google Scholar] [CrossRef]
- Cheng, L.; Samah, A.; Zhang, Y.; Jia, Z.; Li, F. Towards urban energy sustainability and resiliency through smart agriculture and effective renewable resource allocation. Sustain. Cities Soc. 2024, 107, 105420. [Google Scholar] [CrossRef]
- Song, M.; Shahzad, U.; Ractham, P.; Goyal, S. Technological innovation and greener energy technology adoption: Do socioeconomic conditions make a difference. IEEE Trans. Eng. Manag. 2023, 71, 13020–13037. [Google Scholar] [CrossRef]
- Ouyang, J.; Shen, H. The choice of energy saving modes for an energy-intensive manufacturer considering non-energy benefits. J. Clean. Prod. 2017, 141, 83–98. [Google Scholar] [CrossRef]
- Steffen, B.; Matsuo, T.; Steinemann, D.; Schmidt, T.S. Opening new markets for clean energy: The role of project developers in the global diffusion of renewable energy technologies. Bus. Politics 2018, 20, 553–587. [Google Scholar] [CrossRef]
- Faunce, T.A.; Lubitz, W.; Rutherford, A.B.; MacFarlane, D.; Moore, G.F.; Yang, P.; Nocera, D.G.; Moore, T.A.; Gregory, D.H.; Fukuzumi, S. Energy and environment policy case for a global project on artificial photosynthesis. Energy Environ. Sci. 2013, 6, 695–698. [Google Scholar] [CrossRef]
- Zhang, M.; Hou, J.; Liu, Y. Achieving development goals via digital government strategies for a sustainable digital economy that integrate natural resource governance and energy security. Resour. Policy 2025, 101, 105330. [Google Scholar] [CrossRef]
- Jiang, Z.; Yuan, C.; Xu, J. The impact of digital government on energy sustainability: Empirical evidence from prefecture-level cities in China. Technol. Forecast. Soc. Change 2024, 209, 123776. [Google Scholar] [CrossRef]
- Bie, F.; Zhou, L.; Liu, S.; Yang, T. Government digital transformation, resource curse and green total factor energy efficiency in Chinese cities. Resour. Policy 2024, 92, 105002. [Google Scholar] [CrossRef]
- Xu, J.; Yang, B.; Yuan, C. Enhancing natural resource efficiency through digital government: Evidence from the utilization of energy, water, and land resources. Resour. Policy 2024, 94, 105117. [Google Scholar] [CrossRef]
- Ahmadi, B.; Ceylan, O.; Ozdemir, A. Advanced restoration management strategies in smart grids: The role of distributed energy resources and load priorities. Comput. Electr. Eng. 2025, 123, 110196. [Google Scholar] [CrossRef]
- Biswas, P.; Rashid, A.; Al Masum, A.; Al Nasim, M.A.; Ferdous, A.A.; Gupta, K.D.; Biswas, A. An Extensive and Methodical Review of Smart Grids for Sustainable Energy Management-Addressing Challenges with AI, Renewable Energy Integration and Leading-edge Technologies. arXiv 2025, arXiv:2501.14143. [Google Scholar] [CrossRef]
- Chen, S.; Gong, F.; Zhang, M.; Yuan, J.; Liao, S.; Chen, H.; Li, D.; Tian, S.; Hu, X. Planning and scheduling for industrial demand-side management: State of the art, opportunities and challenges under integration of energy internet and industrial internet. Sustainability 2021, 13, 7753. [Google Scholar] [CrossRef]
- Luo, Q.; Wang, J. Digital finance and green technology innovation: A dual path test based on market and government. Financ. Res. Lett. 2024, 70, 106283. [Google Scholar] [CrossRef]
- Liu, K.; Ma, F. The impact of the digital economy on environmental pollution: A perspective on collaborative governance between government and Public. Front. Environ. Sci. 2024, 12, 1435714. [Google Scholar] [CrossRef]
- Zhang, L.; Zhang, X. Impact of digital government construction on the intelligent transformation of enterprises: Evidence from China. Technol. Forecast. Soc. Change 2025, 210, 123787. [Google Scholar] [CrossRef]
- Akhter, Q.; Siddique, A.; Alqahtani, S.A.; Mahmood, A.; Alam, M.; Mushtaq, Z.; Qureshi, M.F.; Aslam, W.; Pathak, P.K. Efficient energy management for household: Optimization-based integration of distributed energy resources in smart grid. IEEE Access 2023, 11, 85716–85727. [Google Scholar] [CrossRef]
- Xiang, X.; Liu, R.; Luo, W. Pollution haven or pollution halo? Testing direct and spillover effects of FDI. China Econ. Rev. 2024, 88, 102254. [Google Scholar] [CrossRef]
- Jiao, Z.; Xia, Z. Is the Digital Divide Inhibiting Urban Energy Transitions?—Evidence from China. Energies 2025, 18, 905. [Google Scholar] [CrossRef]
- Hou, J.; Shi, J.; Fan, G. Examining the role of the digital economy in carbon production efficiency under incentive-based environmental regulations: A spatial spillover perspective. Int. J. Low-Carbon Technol. 2024, 19, 690–705. [Google Scholar] [CrossRef]
- Chen, G.; Deng, Y.; Sarkar, A.; Wang, Z. An integrated assessment of different types of environment-friendly technological Progress and their spatial spillover effects in the Chinese agriculture sector. Agriculture 2022, 12, 1043. [Google Scholar] [CrossRef]
- Al Hakim, S.; Sensuse, D.I. Knowledge mapping system features for supporting researcher mobility into industries and sme from e-government perspective. J. Phys. Conf. Ser. 2019, 1196, 012028. [Google Scholar] [CrossRef]
- Zhao, S.; Teng, L.; Arkorful, V.E.; Hu, H. Impacts of digital government on regional eco-innovation: Moderating role of dual environmental regulations. Technol. Forecast. Soc. Change 2023, 196, 122842. [Google Scholar] [CrossRef]
- Watanabe, C.; Kishioka, M.; Nagamatsu, A. Effect and limit of the government role in spurring technology spillover—A case of R&D consortia by the Japanese government. Technovation 2004, 24, 403–420. [Google Scholar]
- Lee, J.; Kim, B.J.; Park, S.; Park, S.; Oh, K. Proposing a value-based digital government model: Toward broadening sustainability and public participation. Sustainability 2018, 10, 3078. [Google Scholar] [CrossRef]
- Movsessian, M.M.; Oyewo, A.S.; Aghahosseini, A.; Breyer, C. Enabling Central America’s energy transition through renewable energy, energy citizenship, and regional integration. Appl. Energy 2025, 377, 124493. [Google Scholar] [CrossRef]
- Sozinova, A.A.; Bespyatykh, A.V.; Kotlyarova, V.V.; Dzhumabaeva, G.B. Development of the E-government System to Support Climate-Responsible Entrepreneurship in the Markets of the Digital Economy. In Smart Green Innovations in Industry 4.0: New Opportunities for Climate Change Risk Management in the “Decade of Action”; Springer: Cham, Switzerland, 2023; pp. 169–175. [Google Scholar]
- Li, F.; Li, R.; Zhang, Z.; Dale, M.; Tolley, D.; Ahokangas, P. Big data analytics for flexible energy sharing: Accelerating a low-carbon future. IEEE Power Energy Mag. 2018, 16, 35–42. [Google Scholar] [CrossRef]
- Xu, W.; Shang, Y. Integrating the university English education and digital supply chains: A pathway to strengthening the green economy. Adv. Contin. Discret. Models 2025, 2025, 56. [Google Scholar] [CrossRef]
- Tan, W.; Zhang, Z.; Chu, Z.; Chen, P. Unlocking green potential: The digital government-driven revolution in corporate green innovation. Econ. Anal. Policy 2024, 83, 60–79. [Google Scholar] [CrossRef]
- Sandin, S.; Neij, L.; Mickwitz, P. Transition governance for energy efficiency-insights from a systematic review of Swedish policy evaluation practices. Energy Sustain. Soc. 2019, 9, 17. [Google Scholar] [CrossRef]
- Chen, X.; Wang, H. Do China’s ecological civilization advance demonstration zones inhibit fisheries’ carbon emission intensity? A quasi-natural experiment using double machine learning and spatial difference-in-differences. J. Environ. Manag. 2024, 370, 122682. [Google Scholar] [CrossRef]
- Wang, X. Research on Dynamic Monitoring and Early Warning for Innovation Ecosystem Resilience: Evidence from China. Systems 2025, 13, 102. [Google Scholar] [CrossRef]
- He, Z.; Wang, H.; Hu, Y.; Ma, X.; Zhao, H. Dynamic analysis and optimal control of knowledge diffusion model in regional innovation ecosystem under digitalization. Sci. Rep. 2024, 14, 13124. [Google Scholar] [CrossRef]
- Wang, Z.-Z.; Xu, S.-Q.; Guan, Y.-J. Impact of the innovation promotion strategy on digital technology diffusion in regional innovation ecosystems. Technol. Anal. Strateg. Manag. 2024, 1–17. [Google Scholar] [CrossRef]
- Hu, R.; Bao, Z.; Lin, Z.; Lv, K. The Innovative Construction of Provinces, Regional Artificial Intelligence Development, and the Resilience of Regional Innovation Ecosystems: Quasi-Natural Experiments Based on Spatial Difference-in-Differences Models and Double Machine Learning. Sustainability 2024, 16, 8251. [Google Scholar] [CrossRef]
- Bao, Z.; Lin, Z.; Jin, T.; Lv, K. Regional Breakthrough Innovation Change Strategies, Ecological Location Suitability of High-Tech Industry Innovation Ecosystems, and Green Energy. Energies 2024, 17, 3938. [Google Scholar] [CrossRef]
- Liu, H.; Li, W.; Jiang, J.; Zhang, Q. Regional innovation ecosystem and local firms’ outward foreign direct investment: An empirical study based on symbiosis perspective. Technol. Anal. Strateg. Manag. 2024, 1–16. [Google Scholar] [CrossRef]
- Zhu, X.; Wang, H. Measurement and Influencing Factors Analysis of the Coordination Development Level of Material Civilization and Spiritual Civilization. Stat. Decis. 2024, 40. [Google Scholar]
- Liang, Q.; Yin, F. Measurement and Evaluation of the Modernization Development Level of Higher Education in China: Based on Panel Data Analysis of 31 Provinces from 2012 to 2022. Sustainability 2024, 16, 7250. [Google Scholar] [CrossRef]
- Wang, Q.; Sun, Z. Geographic location, development of higher education and donations to Chinese non-public foundations. J. Chin. Gov. 2023, 8, 373–398. [Google Scholar] [CrossRef]
- Fei, Z.; Meng, S. Innovative Communication Strategies for Traditional National Sports Culture in the Era of Digital Transformation. Rev. Multidiscip. Cienc. Deporte 2025, 25, 249–264. [Google Scholar]
- Zhao, C.; Zhang, L. Information Management Practices in Chinese Academic Libraries: A Qualitative Study of Digital Transformation and User Engagement. Prof. Inf. 2024, 33, e330313. [Google Scholar]
- Pan, H.; Mi, H.; Chen, Y.; Chen, Z.; Zhou, W. Measurement and Evaluation of the Development Level of Health and Wellness Tourism from the Perspective of High-Quality Development. Sustainability 2024, 16, 8082. [Google Scholar] [CrossRef]
- Goudsmit, I.; Nel, D.; Lin, S. Evaluating the quality of life in Hong Kong’s new towns in relation to accessibility and the distribution of community and cultural facilities: A case study of Tung Chung. J. Urban Manag. 2023, 12, 295–309. [Google Scholar] [CrossRef]
- Xu, X.; Yasmeen, R.; Shah, W.U.H. Efficiency evaluation, regional technological heterogeneity and determinant of total factor productivity change in China’s healthcare system. Sci. Rep. 2024, 14, 19606. [Google Scholar] [CrossRef]
- Wang, Y.; Wang, L. New-type urbanization and rural revitalization: A study on the coupled development of the Yangtze River Economic Belt, China. PLoS ONE 2025, 20, e0314724. [Google Scholar] [CrossRef]
- Xu, Z.; Yang, J. Impact of digital finance on rural industry revitalization. Int. Rev. Econ. Financ. 2025, 97, 103820. [Google Scholar] [CrossRef]
- Zhou, X.; Hou, J.; Song, Q.; Wang, Y. Exploring the Relationship Between Population Changes and Logistics Development: An Analysis Based on the Spatiotemporal Evolution Characteristics of Population and Logistics Coupling Coordination. Sustainability 2024, 17, 93. [Google Scholar] [CrossRef]
- Chagas, A.L.; Azzoni, C.R.; Almeida, A.N. A spatial difference-in-differences analysis of the impact of sugarcane production on respiratory diseases. Reg. Sci. Urban Econ. 2016, 59, 24–36. [Google Scholar] [CrossRef]
- Chernozhukov, V.; Chetverikov, D.; Demirer, M.; Duflo, E.; Hansen, C.; Newey, W.; Robins, J. Double/debiased machine learning for treatment and structural parameters. Econom. J. 2018, 21, C1–C68. [Google Scholar] [CrossRef]
- Lu, T.; Li, H. Can China’s Regional Industrial Chain Innovation and Reform Policy Make the Impossible Triangle of Energy Attainable? A Causal Inference Study on the Effect of Improving Industrial Chain Resilience. Energies 2024, 17, 2301. [Google Scholar] [CrossRef]
- Beck, T.; Levine, R.; Levkov, A. Big bad banks? The winners and losers from bank deregulation in the United States. J. Financ. 2010, 65, 1637–1667. [Google Scholar] [CrossRef]
- Sorrell, S. Jevons’ Paradox revisited: The evidence for backfire from improved energy efficiency. Energy Policy 2009, 37, 1456–1469. [Google Scholar] [CrossRef]
Disclaimer/Publisher’s Note: The statements, opinions and data contained in all publications are solely those of the individual author(s) and contributor(s) and not of MDPI and/or the editor(s). MDPI and/or the editor(s) disclaim responsibility for any injury to people or property resulting from any ideas, methods, instructions or products referred to in the content. |
© 2025 by the authors. Licensee MDPI, Basel, Switzerland. This article is an open access article distributed under the terms and conditions of the Creative Commons Attribution (CC BY) license (https://creativecommons.org/licenses/by/4.0/).