Abstract
Ensuring a sustainable and healthy human environment in university dormitories is essential for students’ learning, living, and overall health and well-being. To address this need, we carried out a series of systematic field measurements of the noise levels at 30 dormitories in three representative major urban universities in a major provincial capital city in China and designed and implemented a comprehensive questionnaire and surveyed 1005 students about their perceptions of their acoustic environment. We proposed and applied a sustainability–health-oriented, multidimensional assessment framework to assess the acoustic environment of the dormitories and student responses to natural sound, technological sounds, and human-made sounds. Using the Structural Equation Modeling (SEM) approach combined with the field measurements and student surveys, we identified three categories and six factors on student health and well-being for assessing the acoustic environment of university dormitories. The field data indicated that noise levels at most of the measurement points exceeded the recommended or regulatory thresholds. Higher noise impacts were observed in early mornings and evenings, primarily due to traffic noise and indoor activities. Natural sounds (e.g., wind, birdsong, water flow) were highly valued by students for their positive effect on the students’ pleasantness and satisfaction. Conversely, human and technological sounds (traffic noise, construction noise, and indoor noise from student activities) were deemed highly disturbing. Gender differences were evident in the assessment of the acoustic environment, with male students generally reporting higher levels of the pleasantness and preference for natural sounds compared to female students. Educational backgrounds showed no significant influence on sound perceptions. The findings highlight the need for providing actionable guidelines for dormitory ecological design, such as integrating vertical greening in dormitory design, water features, and biodiversity planting to introduce natural soundscapes, in parallel with developing campus activity standards and lifestyle during noise-sensitive periods. The multidimensional assessment framework will drive a sustainable human–ecology–sound symbiosis in university dormitories, and the category and factor scales to be employed and actions to improve the level of student health and well-being, thus, providing a reference for both research and practice for sustainable cities and communities.
1. Introduction
Typical university campuses serve not only as important venues for education, but also for students’ day-to-day living as well as social and cultural activities [1]. Typically, the vast majority of students in Chinese universities live in campus dormitories. As such, a healthy campus living environment is critical to the quality of life and learning and the physical and mental health of the students [2].
Numerous studies have indicated that the quality of the indoor and outdoor acoustic environment directly affects college students’ physiological and psychological health and learning efficiency [3,4]. Studies have shown that noise pollution can have a profound impact on students’ well-being [5], sleep [4], academic performance, and mental health [6,7]. A study revealed that 68.89% of college students experienced sleep deprivation, and indoor noise was the most blamed environmental factor among other disruptors [8].
Noise is pervasive in everyday life and can cause both auditory and non-auditory health effects. Chronic noise exposure has been associated with sleep disturbances, increased stress levels, and impaired cognitive function [9]. Noise-induced hearing loss remains highly prevalent in occupational settings and has been associated with increasing noise exposure, e.g., through on-campus construction and even personal music playing [9]. Munzel et al. showed that chronic noise exposure can lead to cardiovascular problems, including hypertension and increased risk of stroke [10]. Noise has been frequently blamed for interfering with students’ resting [11]. Students living in dormitories near major roads or construction sites are more likely to experience sleep disturbances, fatigue, and decreased concentration [12]. Additionally, Goines and Hagler found that even moderate levels of external noise can increase stress levels and negatively impact cognitive performance [13].
In recent years, there has been an increasing focus on interior noise in student dormitories. Smith et al. (2019) [14] argued that noise generated by students themselves, particularly from electronic devices and social activities, was a significant source of disturbance in university dormitories, which can be particularly disruptive during sleep and exam periods.
Based on literature reports, the major noise sources on college campuses include technological sounds (e.g., traffic [12,13,15,16], construction [17,18]), human sounds (e.g., noise generated by students themselves [11,14]), and/or natural sounds (e.g., birds, insects, and waterfall). Interestingly, some specific sounds, such as natural sounds and some light music, were perceived as pleasant and relaxing [19]. Moreover, some claimed that introducing more natural sounds might reduce disturbance from traffic and construction noises [20].
To mitigate public exposure, many organizations have proposed or updated public health recommendations or guidelines on exposure to environmental noises. The World Health Organization (WHO) published noise guidelines in 1999 and night noise guidelines for Europe in 2009. In 2018, WHO updated the environmental noise guidelines, which emphasized human health and well-being. Table 1 presents day and night noise exposure thresholds proposed by WHO. In the meanwhile, China also issued a series of noise prevention and control standards. For instance, the Environmental Quality Standard for Noise (GB3096, EQSN) regulates that noise levels in sensitive areas like schools should not exceed a daytime LAeq of 55 dB(A) and a nighttime limit of 45 dB(A) (Table 1). Additionally, the Chinese General Code for Building Environment (GB55016, GCBE) sets the indoor noise limit for university buildings to below 40 dB(A) during the daytime and 30 dB at night (Table 1).

Table 1.
Recommended noise thresholds by WHO [21] and in China (LAeq: the equivalent sound pressure level).
Unfortunately, many university campuses often fail to comply with these limits, and the internal background noise often exceeds the threshold. Studies have found that noise pollution in most university campuses is severe [22,23,24,25,26], especially in university dormitories, which students spend most of their time on learning, household activities, communication, and physical and mental relaxation [27]. Nafez et al. conducted a descriptive-analytic study for college dorms in Iran and found that all of the assessed dormitories had a noise level higher than the Iranian standards and 46% of dormitories had a noise level higher than the USA standards, resulting in reduced students’ attention and learning effectiveness [24]. Wei et al. [28] studied the acoustic environment of dormitories of Northwest Polytechnical University in China, and found that the noise level in most of the study areas exceeded the EQSN limits. Nayan et al. [29] found that the noise levels at Malaysian universities typically did not exceed standards due to restrictions on vehicle use on campus. De Souza et al. [30] found that 87% of the measurement points outdoors and indoors on a Brazilian campus exceeded local standard limits, with peak values being 12 dB(A) higher.
However, there is a lack of information on the relationships among different noises and impacts of multiple noise sources on urban university dormitories. Past studies have been predominantly focused on single factors. For instance, Wu et al. [31] identified a relationship between environmental noise in university dormitories and college students’ behavioral and psychological health, and proposed an annoyance threshold at 61.7 dB(A). Similarly, Yang and Moon [32] compared factors like thermal and wind environments, and found that the acoustic environment was the most significant source of annoyance in the indoor acoustic environment. Wen et al. [33] found that traffic noise was positively correlated with the annoyance levels of teenagers.
Moreover, social factors like gender and educational background may influence how individuals perceive sound environments. Chen et al. [34] observed that women tend to have more complex evaluation mechanisms and diverse understandings of healthy interior acoustic environments compared to men in residential buildings. Studies revealed that women felt more annoyance and fatigue at a noise level of 55 dB, while men may bear with a level up to 75 dB [35]. Cheng and Kang also claimed that gender difference significantly affects sound preferences [36]. Yet, it remains unclear how different student populations respond to different sound sources on college campuses.
In addition, there is a pressing need to explore innovative solutions to mitigate noise pollution in the dormitory settings, particularly in rapidly urbanizing countries like China.
The overall goal of this study was to measure and analyze the acoustic environments of student dormitories in three prototype universities to identify impacts of multiple noise sources on the acoustic quality of the dormitories and on the different population groups. The specific objectives were to (1) systematically measure the indoor and outdoor noise levels and acoustic quality through objective measurements of key acoustic parameters and questionnaire-based survey of the occupants, (2) systematically analyze the field investigation results using the Structural Equation Modeling (SEM) approach and a multi-factor categorization assessment approach to identify main noise sources and assess their impacts, and (3) investigate how different genders and educational backgrounds impact students’ perceptions of the dormitory sound environment.
2. Methods
2.1. Characteristics of the Study Site
The study was conducted in Taiyuan City, the capital of Shanxi Province and a well-developed major city in northern China (Figure 1a–d). It has a population of approximately 5.39 million and occupies an area of 400 square kilometers. Taiyuan is also characterized as a major energy source, heavy industry, and chemical engineering base in the country.
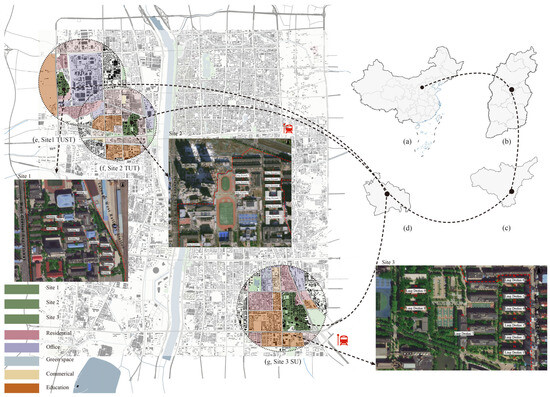
Figure 1.
Map of Taiyuan City (China) with the locations of three selected university campuses and sampling sites (maps from Google Earth). (a) Map of China, (b) map of Shanxi Province, (c) map of Taiyuan City, (d) built-up area of Taiyuan City, (e) sampling site 1, TUST, (f) sampling site 2, TUT, and (g) sampling site 3, SU. Note: P1–P4 were chosen as the four locations during outdoor measurements.
Three major university campuses were selected: Taiyuan University of Science and Technology (TUST), Taiyuan University of Technology (TUT), and Shanxi University (SU). Figure 1 gives the locations and aerial photos of the campuses. TUST (Figure 1e) is bordered by the West Central Ring Expressway to the west, Taiyuan West Railway Station to the east, Shangzhuang Street to the north, and the Heavy Machinery Community to the south. The campus houses 11 student dormitories, all situated in the northern and eastern areas of the campus. TUT (Figure 1f) is located near Qianfeng South Road to the west, Wenxinyuan Community to the east, Yumen River Coastal Auxiliary Road to the north, and Yingze West Avenue to the south. Of the 10 dormitories on campus, 9 are concentrated in the northern region, and 1 is located in the western campus area. SU (Figure 1g) is surrounded by Wucheng Road on the west, Xuxi Street on the east, Xuefu Street on the north, and Nanzhonghuan Street on the south. Nine student dormitories are primarily positioned in the southeastern section of the campus. Consequently, a total of 30 university student dormitories were included in the field measurements: 9 in TUST, 10 in TUT, and 11 in SU.
2.2. Field Measurements
Field noise measurements were carried out by combining fixed-point measurements with questionnaire survey. Thoroughly designed questionnaires were distributed immediately after the measurements. The questionnaire survey was conducted via the sampling survey method, which combines random sampling. Each dormitory received at least 30 questionnaires.
Seven measuring points were established for each dormitory. Points P1, P2, P3, and P4 were positioned 3.5 m away from outdoor walls, and P5, P6, and P7 were positioned 1.0 m from indoor walls and windows (Figure 2), where points A′, B′, and C′ were chosen as the three locations during indoor measurements. Both indoor and outdoor measurements were conducted at a height of 1.2 m above the floor/ground. A tripod was employed to ensure the sound level meters are maintained at proper height and stability. The instruments used were the HS6228 multi-function noise analyzers over a frequency range of 10 Hz to 20 kHz, and an NTI XL2 sound level meter (to collect 1/3-octave band data) over a frequency range of 7 Hz to 20 kHz. All were operated in the fast mode using an A-weighting filter.
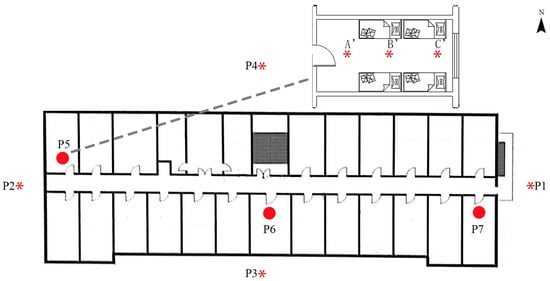
Figure 2.
Diagram of a typical outdoor and indoor dormitory measurements configuration. Note: the red circles indicate the selected test rooms, * and P1–P7 represent the locations of indoor and outdoor measurement points for each building, respectively.
Three measurement campaigns were conducted in 2023 and 2025. The first one was carried out from June 10 to July 19 in 2023 (summer season), the second one from 20 November to 5 December (winter season), and the third one from 7 to 9 July in 2025. The daytime measurement period was from 13:00 to 18:00, and the nighttime period from 22:00 to 6:00 AM the next day. The sound level monitoring was performed 3 times during the day and 3 times at night, and each measurement lasted for 5 min. Finally, the mean values of LAeq were calculated based on the measurements, and the main noise resources recorded accordingly. Weather conditions during the measurements were generally favorable, featuring no precipitation, wind speeds of less than 5 m/s, and occasionally cloudy skies. The doors and windows were closed during the indoor measurements.
The field locations were also used for the subsequent subjective questionnaire survey.
2.3. Questionnaire Survey
To ensure a comprehensive and representative survey of the environmental and sociodemographic characteristics of university dormitories in major Chinese cities, we thoroughly designed a set of questionnaires to account for variations in urban districts, sampling points, campus sizes, student populations, age, gender, educational background, and main noise sources.
We developed a two-part questionnaire design approach for collecting information on the respondents. The first part included the demographic information of all respondents, i.e., personal details, education level, and professions, including age and gender.
The second part aimed to identify the dormitory students’ assessment of the outdoor and indoor acoustic environment. The questionnaire was designed based on a thorough review of current literature [36,37,38,39,40], expert surveys, and multiple interviews with students in Taiyuan University of Technology. Initially, more than 25 items were listed to address the impact of the acoustic environments on the students’ psychological and physiological health and well-being. Then, a set of questionnaire survey forms was distributed to the invited experts in acoustics and environmental impact assessment fields. The data collated were further discussed with a focus group including both experienced experts and graduate students from Taiyuan University of Technology. As a result, the questionnaire was further revised and finalized with 18 core items, including levels of satisfaction, pleasantness (reflecting a continuum from annoyance to comfort [37,38,39]), sound preference, main noise sources, and the period of noise impact. Supplementary Material Table S1 provides a sample of the questionnaire.
To further validate, a pilot test was carried out in the dormitories at TUST, a sample of 411 students, which resulted in a Cronbach’s Alpha coefficient of 0.75. Moreover, an exploratory factor analysis (EFA) was performed, yielding a Kaiser–Meyer–Olkin (KMO) value of 0.823 and a statistically significant Bartlett’s Test of Sphericity (p < 0.001), confirming the structural validation of the questionnaire.
Based on these pre-testing results, each student survey was administered 5–10 min after a field measurement. Thus, a total of 1056 valid questionnaires were issued to the students of 30 university student dormitories, and a total of 1005 valid questionnaires were collected from the three sites (411 from TUST, 313 from TUT, and 281 from SU), of which 631 or 62.8% were undergraduate students and 374 or 37.2% were graduate students. The age distribution was 17–28 years old, with 95% being in the age range of 18–24 years old. Male students accounted for 66.9%, and females 33.1%. The results obtained were presented in both relative percentages (%) and absolute frequencies (n) (Table 2).
Table 2.
Demographic information of all responding students.
Considering that the main noise sources were traffic noise, construction noise, and community noise, and that students preferred natural and general human sounds over traffic and construction noise [36,40], we followed the acoustic environment evaluation systems developed by Wu et al. [31], Chen et al. [34], and Gozalo et al. [41] to classify the sound sources into three categories: natural sounds, human sounds, and all kinds of technological sounds. Based on this classification, we selected 18 main evaluation factors (Table 3).
Table 3.
Selecting the main evaluation factors.
The five-point Likert scales were used to structure the measurement indices in the questionnaires. For instance, regarding acoustic annoyance of different noise sources, five possible responses were listed, including “annoying”, “less annoying”, “neutral”, “slightly annoying”, and “not annoying”, which were represented by a score value of 1, 2, 3, 4, and 5, respectively. Finally, the average score of the acoustic evaluation of each question was calculated (Supplementary Material Table S1).
2.4. Data Analysis
Structural Equation Modeling (SEM) was performed to interpret the data. SEM integrates multivariate techniques and includes two key methods: exploratory factor analysis (EFA) and confirmatory factor analysis (CFA) [42,43]. EFA is a statistical method used to identify underlying factors (latent variables) that explain the relationships between a set of observed variables, helping to evaluate the validity of data by revealing whether the measured variables are accurately capturing the intended underlying constructs, while CFA tests hypotheses regarding relationships between observed variables and their underlying latent constructs (unobservable variables) by examining how well a set of observed data fits a pre-defined theoretical model of these relationships [34]. SEM offers a powerful, statistically rigorous way to model and explore the complex relationships between various environmental noise factors and students’ perceptions, health and well-being. Specifically, SEM offers the following capabilities for this study: (1) SEM supports the needed multidimensional modeling effectively; (2) Some of the critical variables in the study (e.g., comfort, annoyance, sound preference) are latent, which cannot be directly observed but are inferred from measured variables (e.g., questionnaire responses), and SEM is well-suited for handling such latent constructs; (3) SEM includes exploratory and confirmatory factor analysis to validate whether the observed data align with the hypothesized structure of latent variables; and (4) the SEM model well fits the measured data.
3. Results and Discussion
3.1. Outdoor and Indoor Noise Exposure Measurements
Figure 3 shows the LAeq values measured across three campuses during daytime (LAeq, day) and night (LAeq, night). In TUST, the highest LAeq, day levels were observed at P2 and P4, due to their exposure to the Taiyuan West Railway Station. For example, for Building 6, the maximum LAeq, day reached 63.6 dB(A) at P2, compared with the average value of 56.4 dB(A) [SD: 4.045 dB(A), range: 47.8–63.6 dB(A)] for buildings exposed to the university gate and playground. While the noise pollution was extremely severe near gates, playgrounds, and railway stations, the noise levels near the food street also appeared high [reached 60 dB(A)] and were generated by human-made, or social activities. The LAeq, night values ranged from 44.2 to 59.7 dB(A) at P1–P4, with an average of 53.5 dB(A) (SD: 3.379). Most measured noise levels exceeded both the WHO-recommended thresholds [daytime: 53 dB(A), nighttime: 35 dB(A)] and the EQSN limits [daytime: 55 dB(A), nighttime: 45 dB(A)].
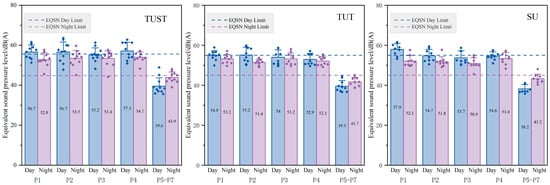
Figure 3.
Noise levels measured at the student dormitories in TUST, TUT, and SU during daytime and nighttime. Note, Colored diamond markers represent measured values at each individual measurement point during the daytime (blue) and nighttime (purple) periods.
At TUT, outdoor LAeq, day levels ranged from 49.6 to 59.9 dB(A) [mean: 54.3 dB(A), SD: 3.347], with the highest levels occurring near Qianfeng South Road [e.g., 59.9 dB(A) at Building 10]. Notably, Buildings 7 to 9 exhibited severe noise pollution with an average LAeq, day of 57.1 dB(A) [SD: 1.610], likely because of sports and community activities. LAeq, night values varied between 49.1 and 58.1 dB(A) (mean: 52.5 dB(A), SD: 2.341), again reflecting the impact of traffic noise.
At SU, outdoor LAeq, day values ranged from 50.1 to 61.6 dB(A), averaging 55.3 dB(A) (SD: 3.241), while nighttime values averaged 52.1 dB(A) [SD: 2.745 dB(A), range: 45.6–57.7 dB(A)]. Notably, P1 sites adjacent to Xuxi Street exhibited consistently high daytime levels, with a mean 59.6 dB(A), driven by heavy vehicular traffic. Recreational activities (e.g., basketball and table tennis) also contributed to elevated noise levels at specific dormitories, such as Buildings 8 and 9 [58.7 and 59.4 dB(A), respectively].
The one-way ANOVA analysis results showed no statistically significant differences among the three indoor measurement points (P5, P6, and P7) at SU (F = 0.121, p = 0.887), TUST (F = 0.021, p = 0.980), or TUT (F = 0.061, p = 0.553). Indoor measurements revealed lower noise exposure across all campuses. At TUST, LAeq, day levels ranged from 35.6 to 48.9 dB(A) (mean: 39.6 dB(A), SD: 4.135), while nighttime levels averaged 43.9 dB(A) (range: 39.0–48.1 dB(A), SD: 2.695). Similar patterns were found at TUT and SU, where daytime averages were 39.6 dB(A) and 38.2 dB(A), respectively, and nighttime values were slightly higher, averaging 39.5 dB(A) and 43.2 dB(A). The maximum difference in nighttime indoor noise levels between campuses was only 2.2 dB(A), indicating minimal inter-campus variation.
Figure 4, Figure 5 and Figure 6 show the frequency spectra in the 1/3-octave band mode at the three universities. Frequency for natural sounds showed a moderate profile, mostly under 5k Hz. This aligns with their relatively non-intrusive and pleasant auditory perception, as reported in subjective survey results. Frequency for conversation and footsteps ranged from 250 Hz to 1.6k Hz, representing persistent low-level background noises. Car horn or engine noises were most prominent in the low to mid-frequency range (160 Hz to 2.5k Hz), with a pronounced peak near 2.5k Hz. This observation is in line with increased annoyance from the students. Electrical appliances produce broad spectral energy, with peaks between 1.6 kHz and 10 kHz, reflecting strong high-frequency components. Thus, the results may inform and facilitate effective noise control in student living areas by identifying specific frequency ranges and applying targeted measures such as selective insulation, acoustic materials, or spatial adjustments.
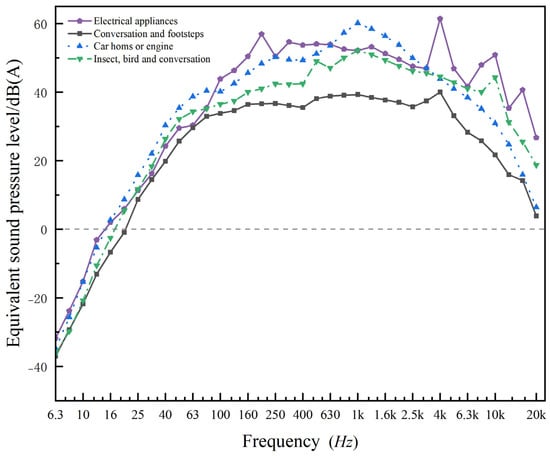
Figure 4.
The results of frequency spectrum measurements in 1/3-octave band mode, at TSUT.
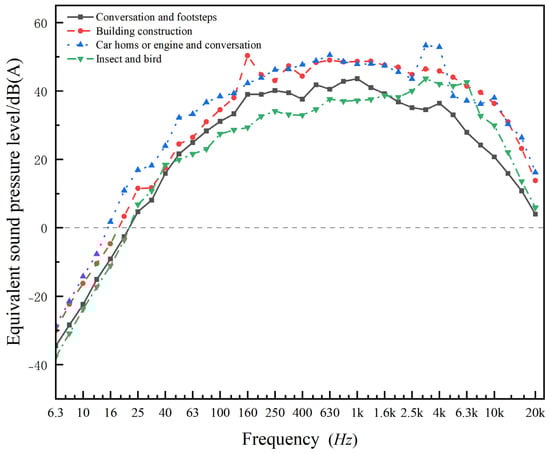
Figure 5.
The results of frequency spectrum measurements in 1/3-octave band mode, at TUT.
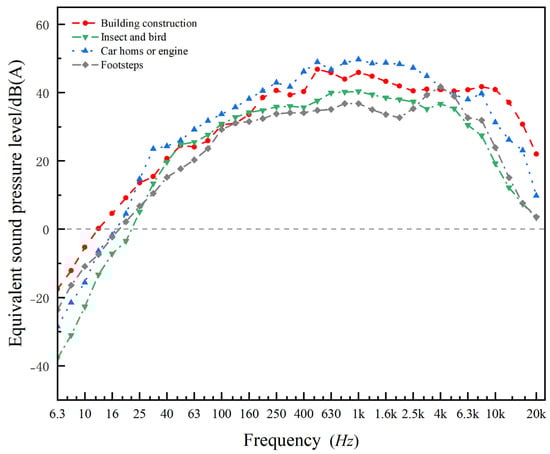
Figure 6.
The results of frequency spectrum measurements in 1/3-octave band mode, at SU.
More so, nighttime indoor noise was largely driven by student-related activities, such as the use of electrical appliances (e.g., computers, hair dryers, fans) and water usage (e.g., washing and plumbing noise), consistent with previous studies [44]. Hence, both outdoor and indoor measurements frequently exceeded recommended thresholds, particularly during peak hours, highlighting potential risks to students’ health and well-being.
Obviously, the measured sound levels in our study often exceeded the recommended or regulated thresholds, particularly during peak activity hours, which poses potential risks to students’ well-being and health. Similar frequent incompliance issues were also reported by others in university settings [24,30], emphasizing the need for effective noise mitigation measures. For instance, universities may consider incorporating more natural elements and sound-absorbing materials into campus planning and dormitory design.
3.2. University Students’ Feedback on Impacts of Various Noise Sources
To further evaluate whether the measured noise levels posed a risk of perceptual annoyance, a one-sample t-test was conducted to compare the mean LAeq against the annoyance threshold of 61.7 dB(A) (Wu et al., 2013) [31]. The results showed that the average LAeq values of three campuses were significantly lower than the threshold, t (107) = −18.173, p < 0.001. The mean difference was −6.32 dB(A), with a 95% confidence interval of [−7.01, 5.63]. Hence, the sampled dormitory environments did not reach the level of noise exposure generally associated with widespread annoyance.
Following the on-site measurements, student surveys were carried out. The survey results indicate that the most disturbing noise sources followed the sequence of Traffic noise (27.1%, n = 272) > Noise by students in their dorms (26.9%, n = 270) > Community noise (25.5%, n = 256) > Construction noise (20.6%, n = 207). Traffic noise included driving noise, horns, sirens and alarms, noise produced by students included personal electronic devices, computers, hair dryers, electric fans, washing machines, and water pipes, and community noise was associated with social activities, commercial events, and sports activities. The disruptive effects of the three types of noise appeared comparable in terms of the affected population percentiles, while that of construction noise was modestly lower.
Previous studies identified indoor noise as the leading source of disturbance in student dorms [31], our results indicate that traffic emerged as the most disturbing noise for the students. This discrepancy could be attributed to increased traffic, as the number of car sales has surged in recent decades in major Chinese cities. Moreover, all three universities were located near major roads or expressways, which are confronted with much noisier traffic than many of the new campuses built in the far-flung suburbs in China. As for construction noise, its lower impact score might be due to the absence of active construction near the student dormitories during the survey period. Long-term data is needed to verify this assumption as construction activities can vary widely seasonally and from case to case.
3.3. Analysis of the Periods Affected by Noise on University Students
Figure 7 shows that 06:00–09:00 is the period when noise disturbed the students most, accounting for 21.0%, followed by 18:00–22:00, accounting for 17.6%. In terms of noise sources, the early morning noise was primarily from the traffic as well as indoor activities (cleaning, music, talking, and footsteps), and the evening noise was predominantly due to more intensive indoor student activities, i.e., washing, using computers, electrical appliances, talking, and footsteps. The population percentiles during 9:00 through 18:00 were comparable.
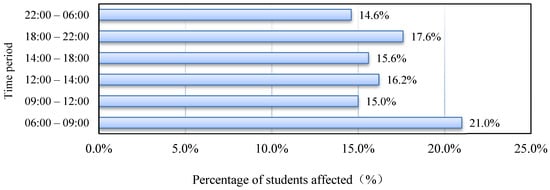
Figure 7.
Student survey results on the periods when noise affects them.
3.4. Survey on Perceptions of Different Sound Sources
University students’ perceptions and responses to different environmental sounds vary widely. As shown in Figure 8, the survey results indicate that the university students felt neutral or less annoyed with natural sounds, such as the chirping of insects and birds (average scores 3.17), flowing water (3.07), and wind (3.02), which is consistent with the literature reports. Meanwhile, the average scores of footsteps, conversations, and sports were 2.96, 2.96, and 2.91, respectively, suggesting a neutral or less annoying effect. In contrast, the electrical appliance noise (2.40), construction noise (2.36), and horns or engine sounds (2.31) were perceived as more annoying noise sources by the university students.
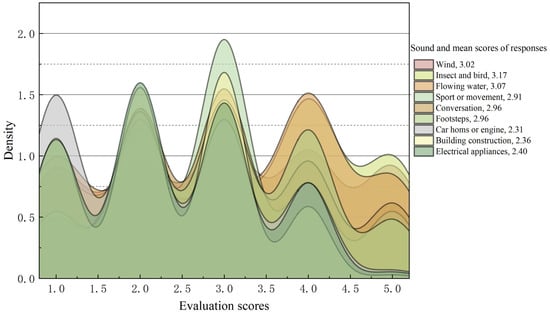
Figure 8.
Density-histogram of university students’ perceptions of various sounds.
Our findings are consistent with previous studies that emphasize the significance of natural sounds in enhancing well-being and comfort [9,45,46]. The strong preference for natural sounds observed in our study aligns with the findings of Houle and Barnett [19], who reported that natural sounds positively contribute to psychological relaxation and stress reduction. Moreover, the dissatisfaction with technological sounds echoes the conclusions by Beutel et al. [47] and Goines and Hagler [13], who found that such sound sources were associated with negative health impacts, including sleep disturbances and increased stress.
4. Data Analysis and Modelling
4.1. Reliability and Validity
The questionnaire’s reliability was found to be 0.747 per the Cronbach’s Alpha approach, indicating an acceptable range of questionnaire consistency. The Bartlett’s test of sphericity and the Kaiser–Meyer–Olkin (KMO) measure were performed to validate the data for factor analysis. The test results (p = 0.000, KMO = 0.757) confirmed the feasibility of conducting the SEM analysis, as shown in Table 4.
Table 4.
KMO and Bartlett tests.
4.2. SEM-Based Analysis of the Noise Data
4.2.1. Factor Extraction
EFA was performed based on the questionnaire survey data to extract the common factors based on the survey results. As shown in Table 5, six common factors were extracted from 18 perceptual indicators that were originally categorized under three major conceptual dimensions: satisfaction (e.g., sleep quality, learning quality, and acoustic environment satisfaction), pleasantness (reflecting a continuum from annoyance to comfort regarding different noise sources), and sound perception (including perceptions to natural, human sounds, and all kinds of technological sounds). These six extracted factors were annoyance, comfort, satisfaction, natural sound preference, human sound perception, and technological sound perception, and, corresponding to the variance contribution rates, were 20.852%, 15.822%, 14.529%, 11.578%, 10.791%, and 7.478%, respectively, with a cumulative variance contribution rate of 81.050%. These factors reflect the latent constructs underlying students’ multidimensional evaluation of the acoustic environment in university dormitories.
Table 5.
Extract the common factors to explain the associations among the 18 factors.
4.2.2. Rotated Component Matrix
The loading matrix was obtained by orthogonal rotation using the maximum variance method. Table 6 gives the factor division and factor loading. The following six common factors were extracted: (1) perception for natural sounds; (2) positive pleasantness, characterized by favorable affective responses such as feeling comfortable, invited, or appealed; (3) perception for human sounds; (4) negative pleasantness, described as annoying, uncomfortable; and (6) overall satisfaction with their acoustic environment of the dormitories.
Table 6.
Factor loadings of observed variables on the extracted components after rotation.
The loadings for natural sounds such as wind, insects and birds, and water were notably high at 0.934, 0.940, and 0.931, respectively, highlighting a strong preference for these sounds. The loadings of the three positive pleasantness factors related to technological sounds, such as traffic sounds, construction sounds, and human sounds, ranged from 0.892 to 0.901. The loadings for movement-related sounds, such as footsteps and conversation, were also high at 0.917, 0.911, and 0.897, respectively, indicating a relatively strong attentiveness or sensitivity to these types of sounds in the university dormitory environment.
The loadings for the negative pleasantness factors ranged from 0.841 to 0.884, and the loadings for specific noise sources like engines, horns, and construction activities were 0.902, 0.856, and 0.870, respectively, indicating these factors were the main contributors to the negative pleasantness. Satisfaction with different aspects of indoor quality, such as sleep quality, learning conditions, and the overall sound environment, had loadings of 0.807, 0.846, and 0.847, suggesting a strong association with individuals’ perceived satisfaction and well-being in their dormitory environment.
Overall, the preference for natural sounds, particularly the sounds of insects and birds (loading: 0.940), emerged as the most influential factor affecting students’ perceptions of the acoustic environment of the dormitories. On the other hand, satisfaction with indoor sleep quality had the lowest loading (0.807), suggesting that while natural sounds are highly valued, indoor conditions also play a significant role in overall satisfaction.
4.2.3. Common Factor Variance
The common factor variance represents the degree to which the extracted principal components can explain the information in each variable. Table 7 shows the importance of each factor, ranked from high to low: natural sound preference (mean: 0.884), positive pleasantness (0.851), general human sound perception (0.833), negative pleasantness (0.807), traffic and construction noise perception (0.781), and satisfaction (0.707). This ranking indicates that natural sound preference is the most significant factor affecting college students’ evaluation of their apartment acoustic environment.
Table 7.
Common factor variance.
4.2.4. SEM Analysis
CFA was conducted using AMOS to evaluate the models and verify the overall measurement model structure. The results (Figure 9) showed significant correlations between latent variables, with correlation coefficients ranging from −0.037 to 0.489, and factor loadings between 0.698 and 0.925, indicating that the model is reasonable.
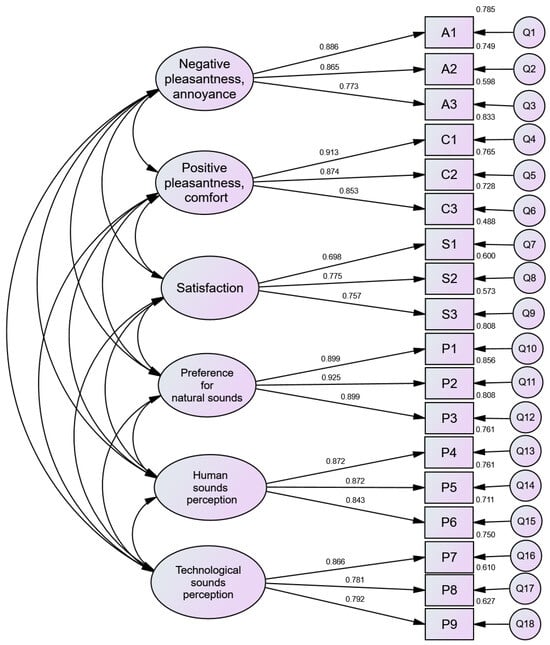
Figure 9.
Results of the confirmatory factor analysis (CFA) from the Structural Equation Modeling (SEM) measurement model. Note: Q1–Q18 correspond to the 18 questionnaire items listed in Supplementary Material Table S1.
To evaluate the model fitting, several metrics were used, including the goodness-of-fit index (GFI), adjusted goodness-of-fit index (AGFI), chi-square/degree of freedom (χ2/df), comparative fit index (CFI), normed fit index (NFI), and root mean square error of approximation (RMSEA). It can be seen in Table 8, the χ2/df was calculated to be 3.340, which is within the ideal range (<5). The RMSEA value was 0.048, which is also acceptable (<0.08). Furthermore, the GFI (0.958), AGFI (0.941), CFI (0.974), and NFI (0.963) were all above 0.9, indicating an excellent model fit.
Table 8.
Goodness-of-fit indices of the CFA model.
The reliability and convergent validity of each latent variable in the revised model were further assessed. The component reliability (CR) and average variance extracted (AVE) were calculated using both standardized and unstandardized factor loadings. CR indicates the internal consistency of the latent variable indicators, with higher values representing stronger internal consistency. AVE measures how much of the variance in each latent variable is explained by its indicators, reflecting convergent validity. Ideally, AVE should be greater than 0.5, with values between 0.36 and 0.5 being acceptable [34,48]. Table 9 shows that all CR values for the latent variables were above 0.7, and all AVE values above 0.5, indicating good reliability and convergent validity for each latent variable.
Table 9.
Average variance extracted and combinatorial reliability of the CFA model.
4.3. Analysis of Correlation Coefficients
4.3.1. Mean Value Analysis
Analysis of the mean values of the variables provides insight into the central tendencies of the sample, reflecting college students’ attitudes towards different aspects of the acoustic environment. Figure 10 presents a radar chart of the mean values of the six main factors. The highest mean value is for the positive pleasantness, comfort (3.44, SD: 1.110), followed by negative pleasantness, annoyance (3.36, SD: 1.003), satisfaction (3.09, SD: 0.913), perception to natural sounds (3.09, SD: 1.300), perception to human sound (2.94, SD: 1.043), and perception to technological sounds (2.36, SD: 0.914). Table 10 further shows that the mean values reflect varying levels of the factors, with positive pleasantness being rated the highest and preference for technological sounds being the lowest.
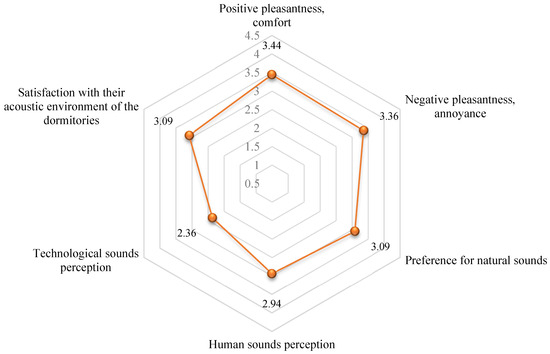
Figure 10.
Radar chart of the mean values of six key factors: positive pleasantness (comfort), negative pleasantness (annoyance), satisfaction with acoustic environment, preference of natural sounds, perception of human sounds, and perception of technological sounds.
Table 10.
Quantitative evaluation criteria [49].
4.3.2. Correlation Analysis
The correlation analysis was conducted to explore the relationships between variables. The results (Table 11) indicate that gender is significantly negatively correlated with positive pleasantness (annoyance, −0.271 **, p < 0.001), positive pleasantness (comfort, correlation coefficient −0.226 **), and preference for natural sounds (−0.1 **) at the 0.01 level. Gender is also significantly positively correlated with a preference for human sounds (0.08 *, p < 0.05) at the 0.05 level. Negative pleasantness is positively correlated with positive pleasantness (0.338 **), satisfaction (0.112 **), and preference for natural sounds (0.103 **). Positive pleasantness is positively correlated with satisfaction (0.085 **), and satisfaction is positively correlated with a preference for natural sounds (0.077 *) and human sounds (0.102 **). Additionally, a preference for natural sounds is positively correlated with technological sounds (0.084 **), and human sound perception is positively correlated with technological sound perception (0.089 **). Outdoor noise levels showed significant positive correlations with annoyance (0.156 *) and technological sound perception (0.111 *), indicating that higher noise exposure is associated with increased negative pleasantness and annoyance with technological sound.
Table 11.
Spearman’s correlation analysis. Note: ** Indicates significant correlation at the 0.01 level (two-tailed) and * at the 0.05 level (two-tailed).
4.3.3. Effect of Gender and Educational Background
The impact of social factors, such as gender and educational background, on the acoustic environment assessment of university dormitories was analyzed using the Mann–Whitney U test (Table 12 and Table 13). The results show significant differences between male and female students, in terms of two aspects of pleasantness, perception of natural sounds, and with male students generally having higher medians in these categories. Men generally reported higher levels of negative pleasantness (median: 3.67 vs. 3.33 for women), positive pleasantness (median: 3.83 vs. 2.67), and perception of natural sounds (median: 3.33 vs. 3.00). Moreover, men had a higher median perception of human sounds (3.00 vs. 2.67). No significant differences were found between genders in terms of satisfaction and perception for technological sounds. The differences in perceptions between male and female students were also in line with earlier studies. For example, Chen and Li et al. [34,45] highlighted that gender differences play a role in shaping acoustic preferences, with women being more sensitive to noise levels and showing a greater likelihood of being disturbed. Our work, however, added new data from Chinese university dormitories, which affect the living quality for tens of millions of college students.
Table 12.
Effects of gender on noise assessment.
Table 13.
The influence of educational background on the noise evaluation.
For students with different educational backgrounds, the Mann–Whitney U test indicated a significant difference in preference for natural sounds (p < 0.05), with both undergraduates and graduate students having a median of 3.33. No significant differences were found in two aspects of pleasantness, satisfaction, and perception of sounds. Additionally, the findings on the impact of educational background on natural sound preferences suggest that factors such as academic workload and stress levels may influence how students perceive and respond to different acoustic environments, which agrees with a prior report [35].
5. Concluding Remarks
We carried out a comprehensive and systematic study on the acoustic environment in student dormitories of three prototype major urban universities, including field measurements of the noise levels at 30 dormitories and questionnaire-based surveys of 1005 students of different genders and education levels. The results were analyzed using a sustainability-oriented comprehensive assessment model. The major findings are summarized as follows:
- (1)
- The noise levels at most of the measurement points (both indoors and outdoors) of the student dormitories well exceeded recommended or regulatory thresholds, indicating serious noise pollution, which can potentially impede student health and well-being, psychological health, and learning. Higher noise impacts were observed in early mornings and evenings, primarily due to traffic noise and indoor activities.
- (2)
- The students’ perceptions of various sound sources varied remarkably. Natural sounds were highly valued by students for their positive effect on the students’ pleasantness and satisfaction. Conversely, traffic noise, indoor noise from student activities, and technological noise were found to be the primary sources of disturbance. The results emphasized the psychological and physiological impacts of the dormitory soundscape on student health and well-being. This suggests a need for taking effective measures to control the noises, such as improved building design, introducing natural sounds, and the integration of noise-reducing features and noise-sensitive schedule management measures, to create a healthier and sustainable acoustic environment for the students.
- (3)
- A three-category and six-factor categorization approach was established and applied to assess the acoustic effects and student perceptions of noises in the student dormitories, and the variance contribution rates were determined. The student survey data revealed that natural sounds, such as insects and birds (preference level: 3.17) and flowing water (3.07), were the most significant factors influencing students’ perceptions of their dormitory acoustic environment. This also suggests a need for introducing more natural sounds and promoting the ecological building design and planning for university dormitories.
- (4)
- Gender differences were evident in the assessment of the acoustic environment, with male students generally reporting higher levels of negative pleasantness, positive pleasantness, and preference for natural sounds compared to female students. This finding is consistent with previous studies and indicates that gender may influence how students experience and respond to their acoustic environment. Educational background showed no significant influence on sound preferences, with both undergraduates and graduate students having a median of 3.33, and no significant differences were found in two aspects of pleasantness (positive and negative), satisfaction, preference for nature, human, and technological sounds. These results highlight the importance of considering demographic factors when designing dormitory environments that support students’ comfort and well-being.
- (5)
- Based on the findings, the following strategies are recommended: (i) Incorporating vertical greening through plant-covered walls or climbing vegetation to reduce noise and attract more natural sounds; (ii) Installing water features such as fountains, artificial streams, or small ponds to mask disruptive traffic and human-made noise; (iii) Planting native trees, shrubs, and flowering species to promote biodiversity; (iv) Preserving green buffers near dormitory areas to enhance visual and thermal comfort; and (v) optimizing the campus landscapes using enclosed vegetation paths and low barriers that channel natural sounds into living zones.
The findings highlight the need for providing actionable guidelines for dormitory ecological design, such as integrating vertical greening in dormitory design, water features, and biodiversity planting to introduce natural soundscapes, in parallel with developing campus activity standards and lifestyle during noise-sensitive periods. In addition, the built environment design (e.g., materials, layout) of student dormitories can be critical. For instance, sound absorbing materials, insulated façades, and double-glazed windows can help reduce traffic, human, and structural noises. Optimizing spatial layout away from busy roads, orienting windows toward quieter areas, and incorporating green buffers can minimize noise exposure.
Furthermore, we demonstrated how campus acoustic environments intersect with human, sound perception, and social-ecological system. It is also about creating inclusive, livable spaces that support well-being. Integrating natural soundscapes into ecological dormitory design can cultivate restorative environments that reduce noise-related stress, support mental health, and promote a stronger sense of well-being and sustainability level of university dormitories, which can be thought of as integrating natural harmony with the lived settlement of campus life, aimed to fulfill more livable, sustainable cities and community spaces.
The findings have important implications for sustainable development in infrastructure and urban planning in terms of balancing acoustic environmental impacts and student health and well-being on major university campuses. This work provides actionable insights, which not only align with the United Nations Sustainable Development Goals (SDG 3: Good Health and Well-Being, SDG 4: Quality Education, and SDG 11: Sustainable Cities and Communities), also serve as a guideline for policy and decision makers. The sustainability-oriented assessment approach emphasizes acoustic environmental impacts, and the acoustic environment framework may facilitate our understanding of human–ecological–sound interactions to promote a harmonious and healthy living environment in educational settings.
Further research should explore innovative strategies and more empirical data for integrating natural elements into dormitory design and examine their effectiveness in reducing noise pollution and enhancing students’ academic performance and quality of life. While this study provides insights into the relationship between the acoustic environment of university dormitories and students’ health and well-being from a sustainability perspective, the robustness of the findings across different semesters, seasons, and cultural contexts remains uncertain. In addition, this work did not specify potential longitudinal effects or how noise may vary during exams or holidays. Additional data across diverse academic calendars, climatic conditions, and cultural settings are needed to validate the models and support the development of a sustainable and symbiosis campus environment.
Supplementary Materials
The following supporting information can be downloaded at: https://www.mdpi.com/article/10.3390/su17156845/s1, Table S1: Questionnaire on the acoustic environment of university dormitories.
Author Contributions
Conceptualization, X.W.; Methodology, K.Z.; Software, S.Z.; Formal analysis, S.Z., K.Z. and J.W.; Investigation, S.Z., K.Z. and J.W.; Data curation, K.Z.; Writing—review & editing, X.W. and D.Z.; Supervision, D.Z.; Project administration, X.W.; Funding acquisition, X.W. and D.Z. All authors have read and agreed to the published version of the manuscript.
Funding
We gratefully acknowledge the financial supports by the Shanxi Provincial Basic Research Program (Free Exploration Category) [Grant 20210302124119], the 2025 Decision-Making Consultation Project of the Shanxi Provincial Government [Grant ZB3801], Research Project on Rural Revitalization Strategy, Shanxi Province [Grant 202321-07], 2023 Graduate Research Innovation Project, Shanxi Province [Grant 2023KY299], and startup funds from San Diego State University. We also thank the survey respondents for addressing the questionnaire.
Institutional Review Board Statement
The study was conducted in accordance with the Declaration of Helsinki, and approved by the Ethics Review Committee of Taiyuan University of Technology (protocol code TYUT 2025050701 on 30 April 2025).
Informed Consent Statement
Informed consent was obtained from all subjects involved in the study.
Data Availability Statement
No data associated with this study has been deposited into a publicly available repository. Additional data will be available upon request.
Conflicts of Interest
The authors declare that they have no known competing financial interests or personal relationships that could have appeared to influence the work reported in this paper.
References
- Hoque, A.; Clarke, A.; Sultana, T. Environmental sustainability practices in South Asian university campuses: An exploratory study on Bangladeshi universities. Environ. Dev. Sustain. 2017, 19, 2163–2180. [Google Scholar] [CrossRef]
- Ding, Y.; Lee, C.; Chen, X.; Song, Y.; Newma, G.; Lee, R.; Lee, S.; Li, D.; Sohn, W. Exploring the association between campus environment of higher education and student health: A systematic review of findings and measures. Urban For. Urban Gree. 2024, 91, 128168. [Google Scholar] [CrossRef]
- Ning, Y.; Chen, J. Improving Residential Satisfaction of University Dormitories through Post-Occupancy Evaluation in China: A Socio-Technical System Approach. Sustainability 2016, 8, 1050. [Google Scholar] [CrossRef]
- Zhang, N.; Cao, B.; Zhu, Y. Indoor environment and sleep quality: A research based on online survey and field study. Build. Environ. 2018, 137, 198–207. [Google Scholar] [CrossRef]
- Makaremi, N.; Yildirim, S.; Morgan, G.T.; Touchie, M.F.; Jakubiec, J.A.; Robinson, J.B. Impact of classroom environment on student wellbeing in higher education: Review and future directions. Build. Environ. 2024, 265, 111958. [Google Scholar] [CrossRef]
- Zhang, D.; Mui, K.; Wong, L. Interaction Effects between Mood State and Background Sound Level on Students’ Sound Perceptions and Concentration Levels in Study Spaces. Buildings 2024, 14, 1419. [Google Scholar] [CrossRef]
- Liu, C.; Zang, Q.; Li, J.; Pan, X.; Dai, H.; Gao, W. The effect of the acoustic environment of learning spaces on students’ learning efficiency: A review. J. Build. Eng. 2023, 79, 107911. [Google Scholar] [CrossRef]
- Meng, Q.; Zhang, J.; Kang, J.; Wu, Y. Effects of sound environment on the sleep of college students in China. Sci. Total Environ. 2020, 705, 135794. [Google Scholar] [CrossRef]
- Basner, M.; Babisch, W.; Davis, A.; Brink, M.; Clark, C.; Janssen, S.; Stansfeld, S. Auditory and non-auditory effects of noise on health. Lancet 2014, 383, 1325–1332. [Google Scholar] [CrossRef]
- Münzel, T.; Schmidt, F.P.; Steven, S.; Herzog, J.; Daiber, A.; Sørensen, M. Environmental Noise and the Cardiovascular System. J. Am. Coll. Cardiol. 2018, 71, 688–697. [Google Scholar] [CrossRef]
- Miao, D.; Cao, X.; Zuo, W. Associations of Indoor Environmental Quality Parameters with Students’ Perceptions in Undergraduate Dormitories: A Field Study in Beijing during a Transition Season. Int. J. Environ. Res. Public Health 2022, 19, 16997. [Google Scholar] [CrossRef]
- Babisch, W.; Wolf, K.; Petz, M.; Heinrich, J.; Cyrys, J.; Peters, A. Associations between Traffic Noise, Particulate Air Pollution, Hypertension, and Isolated Systolic Hypertension in Adults: The KORA Study. Environ. Health Persp. 2014, 122, 492–498. [Google Scholar] [CrossRef]
- Goines, L.; Hagler, L. Noise pollution: A modern plague. South. Med. J. 2007, 100, 287–294. [Google Scholar] [CrossRef] [PubMed]
- Smith, K.H.; Neilsen, T.B.; Grimshaw, J. University student musician noise -dosage study measuring both ensemble and full-day noise exposure. J. Acoust. Soc. Am. 2019, 145, EL494–EL500. [Google Scholar] [CrossRef] [PubMed]
- Smith, M.G.; Ogren, M.; Morsing, J.A.; Waye, K.P. Effects of ground-borne noise from railway tunnels on sleep: A polysomnographic study. Build. Environ. 2019, 149, 288–296. [Google Scholar] [CrossRef]
- Zhou, J.; Gou, X.; Zhao, J.; Li, P. Traffic Noise Evaluation of 14 Building in Hebei University of Engineering. In Proceedings of the 2009 International Conference on Future Biomedical Information Engineering (Fbie 2009), Sanya, China, 13–14 December 2009; pp. 137–139. [Google Scholar]
- Lee, P.J.; Jeon, J.Y. Relating traffic, construction, and ventilation noise to cognitive performances and subjective perceptions. J. Acoust. Soc. Am. 2013, 134, 2765–2772. [Google Scholar] [CrossRef]
- Wang, Q.Y.; Zhang, Y.L. Pollutions and Managements on the Campus Noises of Altitude Academy—An example of Hanshan Normal University. In Proceedings of the 2011 Aasri Conference on Artificial Intelligence and Industry Application (Aasri-Aiia 2011), Male, Maldives, 23–24 May 2011; Volume 4, pp. 374–377. [Google Scholar]
- Houle, M.E.; Barnett, G.M. Students’ Conceptions of Sound Waves Resulting from the Enactment of a New Technology-Enhanced Inquiry-Based Curriculum on Urban Bird Communication. J. Sci. Educ. Technol. 2008, 17, 242–251. [Google Scholar] [CrossRef]
- Ma, K.W.; Mak, C.M.; Wong, H.M. Effects of environmental sound quality on soundscape preference in a public urban space. Appl. Acoust. 2021, 171, 107570. [Google Scholar] [CrossRef]
- Clark, C.; Paunovic, K. WHO Environmental Noise Guidelines for the European Region: A Systematic Review on Environmental Noise and Quality of Life, Wellbeing and Mental Health. Int. J. Environ. Res. Public Health 2018, 15, 2400. [Google Scholar] [CrossRef]
- Dvorak, F.; Lachnit, F. The noise measurement at the university campus entrance. Trends Agric. Eng. 2013, 2013, 147–150. [Google Scholar]
- Mulyono, T.; Rochadi, D.; Widiasanti, I. Noise mapping in campus a Rawamangun-Jakarta State University environment and its effect on academic atmosphere. In Proceedings of the 5th Annual Applied Science and Engineering Conference (AASEC 2020), Online, 21–22 April 2020; p. 1098. [Google Scholar]
- Nafez, A.H.; Lofti, S.; Rostami, R.; Saeedi, R.; Lotfi, S. Assessment the Noise Level in Libraries and Dormitories of Kermanshah University of Medical Sciences in 2016 (Kermanshah, Iran). Fresen. Environ. Bull. 2017, 26, 4890–4893. [Google Scholar]
- Ozer, S.; Zengin, M.; Yilmaz, H. Determination of the Noise Pollution on University (Education) Campuses: A Case study of Ataturk University. Ekoloji 2014, 23, 49–54. [Google Scholar] [CrossRef]
- Wang, Q.Y. Research on the Campus Environment’s Pollution in Universities. In Proceedings of the 2011 International Conference on Environmental Systems Science and Engineering (ICESSE 2011), Macau, China, 8–10 June 2011; Volume 1, pp. 515–520. [Google Scholar]
- Azhdari, S.S.; Yunesian, M.; Hassanvand, M.S.; Nodehi, R.N.; Darvishali, S.; Faridi, S.; Shamsipour, M. Associations of combined short-term exposures to ambient PM 2.5 air pollution and noise annoyance on mental health disorders: A panel study of healthy college students in Tehran. Air Qual. Atmos. Health 2022, 15, 1497–1505. [Google Scholar] [CrossRef]
- Shi, W.; Sun, D.; Zhang, X.; Li, W.; Longxiang, S. Study on green acoustic environment of university student apartment. Xi’an Univ. Archit. Technol. 2011, 39, 2962–2965. [Google Scholar]
- Nayan, N.; Hashim, M.; Saleh, Y.; Mahat, H.; Sumunar, D.R.S. Spatial Investigation on Noise Level at Sultan Idris Education University Campus, Malaysia. IOP Conf. Ser. Earth Environ. Sci. 2021, 767, 12036. [Google Scholar] [CrossRef]
- de Souza, T.B.; Alberto, K.C.; Barbosa, S.A. Evaluation of noise pollution related to human perception in a university campus in Brazil. Appl. Acoust. 2020, 157, 107023. [Google Scholar] [CrossRef]
- Wu, C.; Wu, X.; Lu, W. The research of Environmental Noise of College Student Apartments and the Annoying Threshold: An Investigation in Shenzhen University. Master’s Thesis, Shenzhen University, Shenzhen, China.
- Yang, W.; Moon, H.J. Combined effects of acoustic, thermal, and illumination conditions on the comfort of discrete senses and overall indoor environment. Build. Environ. 2019, 148, 623–633. [Google Scholar] [CrossRef]
- Wen, X.; Lu, G.; Lv, K.; Jin, M.; Shi, X.; Lu, F.; Zhao, D. Impacts of traffic noise on roadside secondary schools in a prototype large Chinese city. Appl. Acoust. 2019, 151, 153–163. [Google Scholar] [CrossRef]
- Chen, K.; Kang, J.; Ma, H. Evaluation of healthy indoor acoustic environments in residential buildings by the occupants: A mixed-method approach. Build. Environ. 2023, 246, 110950. [Google Scholar] [CrossRef]
- Abbasi, A.M.; Darvishi, E.; Sayehmiri, K. Exploring gender differences in acoustic-thermal comfort and performance in a simulated working environment. Build. Environ. 2024, 265, 111995. [Google Scholar] [CrossRef]
- Cheng, Y.; Kang, J. Study on Soundscape Evaluation and Its Influencing Factors in high-rise Residential Areas. Build. Sci. 2020, 36, 152–158. [Google Scholar]
- Axelsson, O.; Nilsson, M.E.; Berglund, B. A principal components model of soundscape perception. J. Acoust. Soc. Am. 2010, 128, 2836–2846. [Google Scholar] [CrossRef] [PubMed]
- Torresin, S.; Albatici, R.; Aletta, F.; Babich, F.; Oberman, T.; Siboni, S.; Kang, J. Indoor soundscape assessment: A principal components model of acoustic perception in residential buildings. Build. Environ. 2020, 182, 16. [Google Scholar] [CrossRef]
- West, B.; Deuchars, A.; Ali-MacLachlan, I. Office soundscape assessment: A model of acoustic environment perception in open-plan officesa). J. Acoust. Soc. Am. 2024, 156, 2949–2959. [Google Scholar] [CrossRef] [PubMed]
- Li, R.; Ou, D. Survey and Study on the Soundscape of University Campus. Build. Sci. 2017, 33, 59–67. [Google Scholar]
- Gozalo, G.R.; Morillas, J.M.B.; Gonzalez, D.M.; Moraga, P.A. Relationships among satisfaction, noise perception, and use of urban green spaces. Sci. Total Environ. 2018, 624, 438–450. [Google Scholar] [CrossRef]
- Liu, J.; Yang, L.; Xiong, Y.; Yang, Y. Effects of soundscape perception on visiting experience in a renovated historical block. Build. Environ. 2019, 165, 106375. [Google Scholar] [CrossRef]
- Torresin, S.; Albatici, R.; Aletta, F.; Babich, F.; Oberman, T.; Stawinoga, A.E.; Kang, J. Indoor soundscapes at home during the COVID-19 lockdown in London—Part II: A structural equation model for comfort, content, and well-being. Appl. Acoust. 2022, 183, 108305. [Google Scholar] [CrossRef]
- Sala, E.; Rantala, L. Acoustics and activity noise in school classrooms in Finland. Appl. Acoust. 2016, 114, 252–259. [Google Scholar] [CrossRef]
- Li, Y.; Cai, J.; Dong, Q.; Wu, L.; Chen, Q. Psychophysiological Responses of Young People to Soundscapes in Actual Rural and City Environments. J. Audio Eng. Soc. 2020, 68, 910–925. [Google Scholar] [CrossRef]
- Zhang, J.; Liu, C.; Luther, M.; Chil, B.; Zhao, J.; Liu, C. Students’ sound environment perceptions in informal learning spaces: A case study on a university campus in Australia. Eng. Constr. Arch. Manag. 2023, 32, 109–130. [Google Scholar] [CrossRef]
- Beutel, M.E.; Braehler, E.; Wiltink, J.; Kerahrodi, J.G.; Burghardt, J.; Michal, M.; Schulz, A.; Wild, P.S.; Muenzel, T.; Schmidtmann, I.; et al. New onset of depression in aging women and men: Contributions of social, psychological, behavioral, and somatic predictors in the community. Psychol. Med. 2019, 49, 1148–1155. [Google Scholar] [CrossRef]
- Gonzales, L.L.; Matos, L.; van den Broeck, A.; Burga, A. Evidence of validity and reliability of the controlling motivational style questionnaire in the work context. Heliyon 2024, 10, e25478. [Google Scholar] [CrossRef]
- Ning, Q.; Tong, H. Case study: Analysis and planning of campus acoustic environment under traffic noise: A case analysis of Shandong University in China. Noise Control Eng. J. 2020, 68, 378–388. [Google Scholar] [CrossRef]
Disclaimer/Publisher’s Note: The statements, opinions and data contained in all publications are solely those of the individual author(s) and contributor(s) and not of MDPI and/or the editor(s). MDPI and/or the editor(s) disclaim responsibility for any injury to people or property resulting from any ideas, methods, instructions or products referred to in the content. |
© 2025 by the authors. Licensee MDPI, Basel, Switzerland. This article is an open access article distributed under the terms and conditions of the Creative Commons Attribution (CC BY) license (https://creativecommons.org/licenses/by/4.0/).