
Internal Mechanism and Empirical Analysis of Digital Economy’s Impact on Agricultural New Quality Productive Forces: Evidence from China
Abstract
1. Introduction
2. Literature Review
3. Theoretical Analysis
3.1. The Direct Impact of the DE on ANQPFs
3.2. The Indirect Effects of the DE on ANQPFs
3.3. The Nonlinear Relationship Between the DE and ANQPFs
3.4. The Spatial Spillover Effects of the DE on ANQPFs
4. Research Design
4.1. Data Sources
4.2. Variable Description
4.3. Model Construction
5. Analysis of Empirical Results
5.1. Benchmark Regression
5.2. Robustness Test and Endogenous Treatment
5.3. Heterogeneity Analysis
5.4. Mechanical Analysis
5.5. Further Analysis
6. Conclusions and Recommendations
Author Contributions
Funding
Institutional Review Board Statement
Informed Consent Statement
Data Availability Statement
Conflicts of Interest
References
- Luo, B. On the new quality productivity forces in agriculture. Reform 2024, 19–30. Available online: https://kns.cnki.net/kcms2/article/abstract?v=C4JADW50D8unkpiDKtfnr3gQYetrz5-DIShcguGCqR3Q3Xv4swInHw0d09e1q600GCaNpadZfy2PsztbA4Tg1h4JOJgdQl4pe1BqvaARY8XiwkFnOq6u1HerByfYz1r7B2HPaONaw-6V3D5Ext4RKxmA1nzQGIyFX_tvWfkW8aoifp8aCV-7PLBEBH7KQIQkYfJYeF9cPNw=&uniplatform=NZKPT&language=CHS (accessed on 23 July 2025).
- Yang, Y. The value connotation and basic ideas of developing new quality agricultural productivity. Issues Agric. Econ. 2024, 27–35. [Google Scholar] [CrossRef]
- Phillips, P.W.B.; Relf-Eckstein, J.-A.; Jobe, G.; Wixted, B. Configuring the new digital landscape in western canadian agriculture. NJAS-Wagening. J. Life Sci. 2019, 90–91, 100295. [Google Scholar] [CrossRef]
- Mazwane, S.; Makhura, M.N.; Senyolo, M.P. Important policy parameters for the development of inclusive digital agriculture: Implications for the redistributive land reform program in south africa. Agriculture 2022, 12, 2129. [Google Scholar] [CrossRef]
- Finger, R. Digital innovations for sustainable and resilient agricultural systems. Eur. Rev. Agric. Econ. 2023, 50, 1277–1309. [Google Scholar] [CrossRef]
- Runck, B.C.; Joglekar, A.; Silverstein, K.A.T.; Chan-Kang, C.; Pardey, P.G.; Wilgenbusch, J.C. Digital agriculture platforms: Driving data-enabled agricultural innovation in a world fraught with privacy and security concerns. Agron. J. 2022, 114, 2635–2643. [Google Scholar] [CrossRef]
- Yang, J.; Tan, F.L. Exploring the progress of global digital economy research: A bibliometric study via r-tool. Environ. Dev. Sustain. 2025, 27, 5447–5477. [Google Scholar] [CrossRef]
- Ding, Z. A theoretical framework for the mechanism of digital economy driving high-quality economic development. Mod. Econ. Res. 2020, 85–92. [Google Scholar] [CrossRef]
- Cai, X.; Pang, Z. Study on the mechanism and effect of digitaleconomy on rural resilience. Reform Econ. Syst. 2024, 61–68. Available online: https://kns.cnki.net/kcms2/article/abstract?v=C4JADW50D8ssGuX_LNWxYYJPATXNQ2ZyuTteKnuStgKp1EKjuHfDqB7rSYdpI67pcP0wekf79LvQ0R6vDAHOmXCbHQNH1nBCRJ9rv00LXuPe47QehBYo9E9rq9HZ0s3IzzidJ7-4BUr3CmGJO8uISA8H3LRIulhnxCtoOTpOTxD763-N1-vLxfbNwvNh5zDybtD6JWhYPnA=&uniplatform=NZKPT&language=CHS (accessed on 23 July 2025).
- Wu, Y.; Wang, T. Research on the statistical definition and industrial classification of digital economy. Stat. Res. 2021, 38, 18–29. [Google Scholar]
- Rehman, N.U.; Nunziante, G. The effect of the digital economy on total factor productivity in european regions. Telecommun. Policy 2023, 47, 102650. [Google Scholar] [CrossRef]
- Zhao, J.; Yang, D. On speeding up innovation and development of digital economy in china. J. Beijing Univ. Technol. (Soc. Sci. Ed.) 2019, 19, 71–79. [Google Scholar]
- Hwang, Y.K.; Venter, A. The impact of the digital economy and institutional quality in promoting low-carbon energy transition. Renew. Energy 2025, 238, 121884. [Google Scholar] [CrossRef]
- Qi, X.; Chen, J.; Liu, H. Implementing the new development philosophy to promote urban—rural integration: Logic and path. Comp. Econ. Soc. Syst. 2023, 14–23. Available online: https://kns.cnki.net/kcms2/article/abstract?v=C4JADW50D8sOIR0GhFdbMLhEVJtTKWYuR-OiNlUBrWXIwHGOYTIXOkN02TMJ9-LVdiFMeIlcKFZv-COgsf3KlFvELgOQzuTf-tScyYdboUTn7KcFZsissP9Vs2WfppLTunI1xXZu8MEHfh4Qk6qG5tvzaJisZn1YcfxDu75hORuYCnwio55LTKkWKFoxrUtRJm8A2p85u48=&uniplatform=NZKPT&language=CHS (accessed on 23 July 2025).
- Liu, X.; Xu, W.; Wen, X. The intrinsic logic, realistic challenges and optimization pathways of digital economy empowering rural industrial modernization. China Bus. Mark. 2025, 39, 14–24. [Google Scholar]
- Li, Y.; Ke, J. Three—level digital divide: Income growth and income distribution effects of the rural digital economy. J. Agrotech. Econ. 2021, 119–132. [Google Scholar] [CrossRef]
- Huang, J. New quality productive forces in agriculture: Connotation and denotation, potential and challenges, and developmentideas. China Rural. Surv. 2024, 19–34. [Google Scholar] [CrossRef]
- Song, Z.; Leng, M.; Zhou, B.; Gao, X. New quality agricultural productive forces in china: Evaluation system construction, dynamic evolution and policy implications. J. Agro-For. Econ. Manag. 2024, 23, 425–434. [Google Scholar]
- Jiang, C. The agricultural new quality productive forces: Connotations, development priorities, constraints and policy recommendations for the development. J. Nanjing Agric. Univ. (Soc. Sci. Ed.) 2024, 24, 1–17. [Google Scholar]
- Gao, Y.; Ma, J. New quality agricultural productivity: A political economy perspective. Issues Agric. Econ. 2024, 81–94. [Google Scholar] [CrossRef]
- Kong, X.; Xie, D. The theoretical connotation, main characteristics and development path of the new quality agricultural productive forces. J. China Agric. Univ. (Soc. Sci.) 2024, 41, 29–40. [Google Scholar]
- Gao, Q.; Cheng, C. New quality agricultural productive forces and new-type production relations:Logical thinking and reform paths. J. China Agric. Univ. (Soc. Sci.) 2024, 41, 41–54. [Google Scholar]
- Wang, J.; Zhu, J.; Luo, X. Research on the measurement of china’s digital economy development and the characteristics. J. Quant. Technol. Econ. 2021, 38, 26–42. [Google Scholar]
- Lin, Q.; Li, J.; Mao, S. Theoretical logic, chinese practice, and key focus areas in the formation of new quality productive forces in agriculture. J. Northwest A&F Univ. (Soc. Sci. Ed.) 2024, 24, 1–10. [Google Scholar]
- Wang, K.; Liu, H. The development of agricultural new quality productivity forces and the guarantee of food security in major countries: “On what to grow”,“how to grow” and “who will grow”. Reform 2024, 70–82. Available online: https://link.cnki.net/urlid/50.1012.F.20240619.1311.002 (accessed on 23 July 2025).
- Su, Y. The logical starting point, interpretation of the connotation, and key focus areas for developing new quality productive forces in agriculture. Rural. Econ. 2024, 1–14. Available online: https://kns.cnki.net/kcms2/article/abstract?v=C4JADW50D8vywkxJ2TIZbUemHR9S1Cl5ZvT30uA7GyFRvgDodYWKV8i3TvxDMUPhs1xf88uebsg50jZZDn12K-wZ0v8cqdpS2bpvTpkJKhOhRKFRwsrriP3nfX26XtNNJ-GyXfQa-Vk-r05rhYI35e-D58ZTxfBnN-yYPD91nGVwS6Vg8OT-WhLlNBbPtkgdNRYY4_06Ciw=&uniplatform=NZKPT&language=CHS (accessed on 23 July 2025).
- Wang, C.; Wen, Q.; Wang, J. Agricultural new quality productivity: Level measurement, regional differences and spatiotemporal evolution. Stat. Decis. 2025, 41, 11–17. [Google Scholar]
- Yang, D.; Wang, Q.; Zhou, J.; Liu, Z. New-quality agricultural productivity and farmers’ income growth: A discussion on the asymmetric impact of digital literacy. Contemp. Econ. Res. 2025, 102–116. Available online: https://kns.cnki.net/kcms2/article/abstract?v=oWJgMrFo8ufWnxKsRXDlrz-N7BYsrFVL8hLa9gM-fmBpVKtYqpSXJpJHJoz0JD5gtMAJV9D2YemRneF4IliS9M597-M53K2xIrpUl7-j-PKcDsjfQZ-vH42dgdc0jIyP4yRpRsNhF5s0PUrAVRw5b5ccqKZs0xdiW62bCkW4_uBTEyjVj3-Fs8FDevGzcB02&uniplatform=NZKPT&language=CHS (accessed on 23 July 2025).
- Li, X.; Jin, Y.; Chen, L. The mechanism and policy recommendations for the impact of new agricultural productivity on the income gap between urban and rural areas. Jiangxi Soc. Sci. 2025, 45, 69–84. [Google Scholar]
- Wang, H.; Wang, K. The mechanism and challenges in data elementsdriving the development of new quality productive forcesand the countermeasures for that. China Bus. Mark. 2025, 39, 3–13. [Google Scholar]
- Fu, D.; Wang, H.; Guo, J. How can the market-oriented allocation of data elementsimprove new quality productive forces of enterprises?Based on the transmission mechanism of empoweringurban digital economy development. J. Chongqing Technol. Bus. Univ. (West Forum) 2025, 35, 22–35. [Google Scholar]
- Liu, M.; Yang, G. The realistic logic of digital economy cultivating new quality productive forces: Based on the perspective of data value extension. Contemp. Econ. Manag. 2025, 47, 8–16. [Google Scholar]
- Luo, G.; Song, X. Research on the institutional configuration of digital ecology enabled cultivation for the new quality productive forces in agriculture—Based on nca and dynamic qca analysis. China Bus. Mark. 2025, 39, 115–126. [Google Scholar]
- Yu, J.; Meng, Q.; Zhang, Y.; Zhang, X.; Chen, F. Digital innovation:Exploration and enlightenment of the new perspective of innovation research. Stud. Sci. Sci. 2017, 35, 1103–1111. [Google Scholar]
- Ren, B.; Wang, Z. The logic and path of digital new quality productivity promoting high quality economic development. J. Xiangtan Univ. (Philos. Soc. Sci.) 2023, 47, 23–30. [Google Scholar]
- Yao, S.; Wang, J. The theoretical logic and implementation path of digital economy promoting the development of new quality productive forces. J. Yantai Univ. (Philos. Soc. Sci. Ed.) 2024, 37, 1–12. [Google Scholar]
- Li, S.; Xue, F.; Jiang, J. Effect of agricultural digitization on new productive forces of food in china. J. Agro-For. Econ. Manag. 2024, 23, 435–445. [Google Scholar]
- Akberdina, V.; Lavrikova, Y.; Vlasov, M. Environmental financing: Does digital economy matter? Front. Environ. Sci. 2024, 11, 1268286. [Google Scholar] [CrossRef]
- Cagno, E.; Morioka, S.N.; Neri, A.; de Souza, E.L. Understanding how circular economy practices and digital technologies are adopted and interrelated: A broad empirical study in the manufacturing sector. Resour. Conserv. Recycl. 2025, 216, 108172. [Google Scholar] [CrossRef]
- Sun, P.S.; Nisar, U.; Qiao, Z.Y.; Ahmad, S.; Kathuria, K.; Al Bahir, A.; Ahmad, M. Digital economy, technology, and urban carbon emissions nexus: An investigation using the threshold effects and mediation effects tests. Front. Environ. Sci. 2024, 12, 1454256. [Google Scholar] [CrossRef]
- Ma, Y.; Zhou, Y. Empirical research on digital technology promoting the formation of new quality productive forces in agriculture. East China Econ. Manag. 2024, 38, 1–8. [Google Scholar]
- Horvey, S.S.; Odei-Mensah, J.; Moloi, T.; Bokpin, G.A. Digital economy, financial development and energy transition in africa: Exploring for synergies and nonlinearities. Appl. Energy 2024, 376, 124297. [Google Scholar] [CrossRef]
- Pilatin, A.; Radulescu, M.; Alofaysan, H.; Barut, A.; Huseynova, R. Smart solutions for sustainable access and technological equity: The effect of energy transition, artificial intelligence, and digital economy on energy poverty. Geol. J. 2025, 12. [Google Scholar] [CrossRef]
- Chi, M.; Shi, Y. The influence mechanism and countermeasures of digital economy to promote the optimization and upgrading of industrial structure. Econ. Rev. J. 2022, 122–128. [Google Scholar] [CrossRef]
- Chen, J.; Cui, W.; Fang, J. New quality productive forces in agriculture and rural industrial integration: Mechanisms and empirical tests. Financ. Econ. 2024, 50–61. [Google Scholar] [CrossRef]
- Zhou, W.; Xu, L. On new quality productivity: Connotative characteristics and important focus. Reform 2023, 1–13. Available online: https://kns.cnki.net/kcms2/article/abstract?v=GkDm8A2i92VXWHWPOBeihz_Uc8o0bn1sV0V2O1_QgHnHxuT_PM2RC5BoNUOFJrnQnw5PPXRQACEAmjyocRuq3cwuG0hoci64i8ZnHHUunnAVysqdurXK4D6e_05WXfGuxdXUG6IFdhK6iicpMVRKUoxOPX_zWaymRJFW1V9EderflJ0UPhRr-qdTVvavZOZixoZwY90sru4=&uniplatform=NZKPT&language=CHS (accessed on 23 July 2025).
- Zhang, J.; Xu, Z.; Ding, S. The logical mechanism, strategic value, and practical path of the interaction between new qualitative productivity and deep integration of data and reality. J. Beijing Univ. Technol. (Soc. Sci. Ed.) 2024, 24, 114–124. [Google Scholar]
- Zhang, X. Internal logic and realization of accelerating the generation of new quality productivity through digital economy. J. Southwest Univ. (Soc. Sci. Ed.) 2024, 50, 1–14. [Google Scholar]
- Wei, C. The basic meaning, historical evolution, and practical pathways of new quality productive forces. Theory Reform 2023, 25–38. [Google Scholar] [CrossRef]
- Li, M. An exploration of development pathways for new-quality agricultural productivity based on china’s modernization. Agric. Econ. 2025, 14–16. [Google Scholar] [CrossRef]
- Xia, X.; Chen, Z.; Zhang, H.; Zhao, M. Agricultural high-quality development: Digital empowerment and implementation path. Chin. Rural. Econ. 2019, 2–15. Available online: https://kns.cnki.net/kcms2/article/abstract?v=GkDm8A2i92UM0OkhANQp7MI5EIQoOF6fVVdvMU57f97TWmENpSR6k5DJ00wAI3CndZC8Gz9OsPwTZEtspny8iRSoAhUdmijrGN2AR6PO6Y3BE1TvLX4PbysEpS6cryzjbhTmidl8ys45T7BdxBwHxONcEMkhWbuSjtknucurjt8piyXUO9_yvcUwcPFYDfl-ZqSCW-hJdrc=&uniplatform=NZKPT&language=CHS (accessed on 23 July 2025).
- Rosário, A.T.; Dias, J.C. The new digital economy and sustainability: Challenges and opportunities. Sustainability 2023, 15, 10902. [Google Scholar] [CrossRef]
- Dong, K.; Liu, Y.; Wang, J.; Dong, X. Is the digital economy an effective tool for decreasing energy vulnerability? A global case. Ecol. Econ. 2024, 216, 108028. [Google Scholar] [CrossRef]
- Ma, J. Agricultural new-quality productivity, digital transformation and common prosperity of farmers and rural areas. Stat. Decis. 2024, 40, 12–18. [Google Scholar]
- Jiang, H.; Elahi, E.; Gao, M.; Huang, Y.; Liu, X. Digital economy to encourage sustainable consumption and reduce carbon emissions. J. Clean Prod. 2024, 443, 140867. [Google Scholar] [CrossRef]
- Han, X.; Liu, C.; Liu, H. The theoretical logic and practical path of the digitalization of the whole agricultural chain to promote the transformation of rural industries. Reform 2023, 121–132. Available online: https://link.cnki.net/urlid/50.1012.F.20230321.1309.002 (accessed on 23 July 2025).
- Zhao, C. Current situations and prospects of smart agriculture. J. South China Agric. Univ. 2021, 42, 1–7. [Google Scholar]
- Wang, Z.; Song, Q.; Yang, G. The impacts of agricultural total factor productivity on the non-agricultural transfer of rural labor force: Local effects and neighborhood effects. Res. Agric. Mod. 2023, 44, 1036–1046. [Google Scholar]
- Arogundade, S.; Hassan, A.S. Digital economy and environmental quality of african countries: Evidence from spatial durbin model. Environ. Dev. Sustain. 2025, 28. [Google Scholar] [CrossRef]
- Qiao, J.; Tai, D.; Qiu, Y. Research on the mechanism and effect of agricultural new quality productive forces empowering agricultural carbon emission reduction. Contemp. Econ. Manag. 2024, 46, 42–55. [Google Scholar]
- Li, W.; Cui, W.; Yi, P. Digital economy evaluation, regional differences and spatio-temporal evolution: Case study of yangtze river economic belt in china. Sust. Cities Soc. 2024, 113, 105685. [Google Scholar] [CrossRef]
- Zhou, Q.; Li, X. Digital economy and urban-rural integration: Intrinsic mechanisms and empirical analysis. Stat. Decis. 2024, 40, 104–109. [Google Scholar]
- Peng, S.; Yu, Y.; Zhao, Q. The mechanism and spatial effect of digital economy on the integration of urban and rural areas:An empirical analysis based on spatial durbin model. World Reg. Stud. 2024, 33, 99–115. [Google Scholar]
- Mei, B.; Khan, A.A.; Khan, S.U.; Ali, M.A.; Luo, J.C. Complementarity or substitution: A study of the impacts of internet finance and rural financial development on agricultural economic growth. Agriculture 2022, 12, 1786. [Google Scholar] [CrossRef]
- Wang, Y. Digital financial capability and entrepreneurship in china: A digital economy perspective. Sustainability 2024, 16, 6885. [Google Scholar] [CrossRef]
- Xiong, M.; Fan, J.; Li, W.; Xian, B.T.S. Can china’s digital inclusive finance help rural revitalization? A perspective based on rural economic development and income disparity. Front. Environ. Sci. 2022, 10, 985620. [Google Scholar] [CrossRef]
- Sun, Q.; Zhou, B. Fiscal decentralization, rural financial services, and urban-rural integration levels: A perspective from urbanization and rural revitalization. Rural. Econ. 2021, 93–100. Available online: https://kns.cnki.net/kcms2/article/abstract?v=GkDm8A2i92XFgFQwZu8qmazVs16PzUELyh4CiqY9UqlY46azHQ87agwd6GBqSH_W8ywXB4b5dig_zNjSrGizC7E71iYG1ft9ClTjocBWNGCG1yW7mn09o3ZH-boTvpc77g1mQg8AezhhzeiWDk_8o3VilQcJMc_vGWBC3IOQJjUWuxLrz7baEUjLxviEgzdVzuxsSMea9cM=&uniplatform=NZKPT&language=CHS (accessed on 23 July 2025).
- Wu, W.; Shang, R. New quality productive forces of digital agriculture, innovative factor allocation and industrial chain resilience. Inq. Into Econ. Issues 2025, 23–36. Available online: https://kns.cnki.net/kcms2/article/abstract?v=GkDm8A2i92VJ6UnbCNyLO2gwrKS1safzwe98_XQSB0GKlMGSAHSqfr6Py-j26NsK8vHZzDbrYlKVH1cRjbn-8gxBOfXetfrhWu4uVfsWuL5VBbTQTvez_iHsKZmEEKRSV9AXL7rH4C1ndBiTD6Bp7v0GgXzXN8KoVZPY-NVMX_U2evTsNJ-GSUQhrLfwtzRZET-9f5z4yO8=&uniplatform=NZKPT&language=CHS (accessed on 23 July 2025).
- Shahbaz, M.; Wang, J.; Dong, K.; Zhao, J. The impact of digital economy on energy transition across the globe: The mediating role of government governance. Renew. Sust. Energ. Rev. 2022, 166, 112620. [Google Scholar] [CrossRef]


| Indicator Category | Definition and Description | Expected Sign | Information Entropy Value | Information Utility Value | Weights |
|---|---|---|---|---|---|
| Agricultural workforce | Average years of education of rural labor force | + | 0.991 | 0.009 | 0.009 |
| Number of agricultural technology training graduates/Rural population | + | 0.854 | 0.146 | 0.143 | |
| Primary industry output/Primary industry employment | + | 0.967 | 0.033 | 0.033 | |
| Per capita disposable income of rural residents | + | 0.966 | 0.034 | 0.034 | |
| Total number of migrant workers/Rural labor force | − | 0.999 | 0.001 | 0.002 | |
| Agricultural labor objects | Forest coverage ratio | + | 0.962 | 0.038 | 0.037 |
| Environmental protection fiscal expenditure/Government public fiscal expenditure | + | 0.983 | 0.017 | 0.016 | |
| Agricultural ammonia nitrogen emissions/Primary industry output | − | 0.997 | 0.003 | 0.003 | |
| Number of green agricultural cooperatives/Number of people employed in the primary industry | + | 0.869 | 0.131 | 0.129 | |
| Number of national key leading enterprises in agricultural specialization | + | 0.969 | 0.031 | 0.030 | |
| Agriculture, forestry, animal husbandry, and fishery services output value | + | 0.925 | 0.075 | 0.074 | |
| Agricultural means of production | Rural road mileage/Rural population | + | 0.947 | 0.053 | 0.052 |
| Per capita electricity consumption in rural areas | + | 0.826 | 0.174 | 0.171 | |
| Number of rural broadband access users/Number of rural households | + | 0.960 | 0.040 | 0.040 | |
| Rural Digital Financial Inclusion Index | + | 0.986 | 0.014 | 0.013 | |
| Comprehensive mechanization rate of grain cultivation | + | 0.983 | 0.017 | 0.017 | |
| Number of agricultural technology patents | + | 0.938 | 0.062 | 0.061 | |
| Number of agricultural science and technology professionals | + | 0.936 | 0.064 | 0.063 | |
| Agricultural R&D expenditure | + | 0.926 | 0.074 | 0.073 |
| Province | 2014 | 2015 | 2016 | 2017 | 2018 | 2019 | 2020 | 2021 | 2022 | 2023 |
|---|---|---|---|---|---|---|---|---|---|---|
| Beijing | 0.165 | 0.175 | 0.182 | 0.191 | 0.196 | 0.189 | 0.195 | 0.205 | 0.193 | 0.190 |
| Tianjin | 0.094 | 0.105 | 0.108 | 0.110 | 0.111 | 0.131 | 0.126 | 0.134 | 0.131 | 0.127 |
| Hebei | 0.160 | 0.173 | 0.181 | 0.194 | 0.198 | 0.211 | 0.226 | 0.231 | 0.232 | 0.243 |
| Shanxi | 0.102 | 0.104 | 0.109 | 0.117 | 0.116 | 0.121 | 0.131 | 0.138 | 0.141 | 0.143 |
| Inner Mongolia | 0.097 | 0.103 | 0.106 | 0.108 | 0.114 | 0.119 | 0.129 | 0.140 | 0.147 | 0.155 |
| Liaoning | 0.165 | 0.169 | 0.165 | 0.170 | 0.158 | 0.155 | 0.160 | 0.175 | 0.174 | 0.173 |
| Jilin | 0.106 | 0.113 | 0.116 | 0.112 | 0.114 | 0.127 | 0.136 | 0.142 | 0.146 | 0.149 |
| Heilongjiang | 0.138 | 0.155 | 0.157 | 0.168 | 0.168 | 0.178 | 0.181 | 0.190 | 0.188 | 0.196 |
| Shanghai | 0.253 | 0.254 | 0.309 | 0.330 | 0.341 | 0.365 | 0.217 | 0.229 | 0.251 | 0.273 |
| Jiangsu | 0.373 | 0.400 | 0.407 | 0.417 | 0.418 | 0.442 | 0.421 | 0.436 | 0.431 | 0.426 |
| Zhejiang | 0.225 | 0.251 | 0.265 | 0.284 | 0.334 | 0.362 | 0.368 | 0.383 | 0.396 | 0.409 |
| Anhui | 0.118 | 0.146 | 0.159 | 0.173 | 0.186 | 0.184 | 0.204 | 0.225 | 0.222 | 0.236 |
| Fujian | 0.159 | 0.181 | 0.196 | 0.207 | 0.230 | 0.246 | 0.247 | 0.260 | 0.260 | 0.270 |
| Jiangxi | 0.096 | 0.112 | 0.130 | 0.140 | 0.155 | 0.167 | 0.182 | 0.195 | 0.204 | 0.213 |
| Shandong | 0.244 | 0.277 | 0.281 | 0.288 | 0.285 | 0.280 | 0.307 | 0.347 | 0.373 | 0.398 |
| Henan | 0.189 | 0.199 | 0.206 | 0.218 | 0.218 | 0.225 | 0.240 | 0.260 | 0.262 | 0.286 |
| Hubei | 0.139 | 0.157 | 0.170 | 0.184 | 0.210 | 0.228 | 0.247 | 0.271 | 0.291 | 0.312 |
| Hunan | 0.132 | 0.141 | 0.157 | 0.172 | 0.185 | 0.208 | 0.236 | 0.254 | 0.271 | 0.291 |
| Guangdong | 0.222 | 0.243 | 0.255 | 0.288 | 0.307 | 0.328 | 0.346 | 0.372 | 0.360 | 0.380 |
| Guangxi | 0.102 | 0.123 | 0.130 | 0.147 | 0.151 | 0.153 | 0.160 | 0.177 | 0.183 | 0.195 |
| Hainan | 0.080 | 0.093 | 0.104 | 0.111 | 0.121 | 0.130 | 0.139 | 0.156 | 0.170 | 0.186 |
| Chongqing | 0.104 | 0.119 | 0.130 | 0.141 | 0.139 | 0.138 | 0.145 | 0.157 | 0.170 | 0.183 |
| Sichuan | 0.158 | 0.182 | 0.196 | 0.214 | 0.215 | 0.204 | 0.239 | 0.256 | 0.270 | 0.284 |
| Guizhou | 0.109 | 0.109 | 0.129 | 0.141 | 0.141 | 0.145 | 0.148 | 0.156 | 0.150 | 0.150 |
| Yunnan | 0.206 | 0.222 | 0.230 | 0.239 | 0.249 | 0.249 | 0.249 | 0.255 | 0.255 | 0.255 |
| Shaanxi | 0.125 | 0.139 | 0.150 | 0.151 | 0.155 | 0.168 | 0.177 | 0.183 | 0.195 | 0.206 |
| Gansu | 0.061 | 0.071 | 0.074 | 0.084 | 0.092 | 0.104 | 0.111 | 0.123 | 0.126 | 0.137 |
| Qinghai | 0.071 | 0.085 | 0.093 | 0.115 | 0.124 | 0.134 | 0.145 | 0.152 | 0.167 | 0.182 |
| Ningxia | 0.055 | 0.067 | 0.073 | 0.081 | 0.093 | 0.099 | 0.111 | 0.121 | 0.124 | 0.127 |
| Xinjiang | 0.127 | 0.140 | 0.151 | 0.159 | 0.171 | 0.162 | 0.161 | 0.189 | 0.205 | 0.221 |
| Indicator Category | Definition and Description | Expected Sign | Information Entropy Value | Information Utility Value | Weights |
|---|---|---|---|---|---|
| Digital infrastructure | Long-distance optical cable line length | + | 0.895 | 0.105 | 0.144 |
| Number of mobile phone base stations per permanent resident | + | 0.970 | 0.030 | 0.041 | |
| Total number of broadband ports | + | 0.954 | 0.046 | 0.063 | |
| Digital network development | Total telecommunications revenue | + | 0.906 | 0.094 | 0.128 |
| Total mobile Internet access traffic | + | 0.880 | 0.120 | 0.164 | |
| Number of broadband Internet users | + | 0.947 | 0.053 | 0.072 | |
| The ratio of mobile phone usage to the permanent resident population | + | 0.978 | 0.022 | 0.031 | |
| Digital transaction development | Number of websites owned by every 100 enterprises | + | 0.987 | 0.013 | 0.018 |
| Number of enterprises engaged in e-commerce transactions | + | 0.911 | 0.089 | 0.122 | |
| E-commerce sales | + | 0.877 | 0.123 | 0.168 | |
| Number of computers used per 100 employees | + | 0.964 | 0.036 | 0.049 |
| Province | 2014 | 2015 | 2016 | 2017 | 2018 | 2019 | 2020 | 2021 | 2022 | 2023 |
|---|---|---|---|---|---|---|---|---|---|---|
| Beijing | 0.168 | 0.187 | 0.201 | 0.217 | 0.254 | 0.298 | 0.325 | 0.361 | 0.392 | 0.424 |
| Tianjin | 0.063 | 0.074 | 0.082 | 0.087 | 0.101 | 0.131 | 0.150 | 0.162 | 0.177 | 0.192 |
| Hebei | 0.068 | 0.084 | 0.106 | 0.123 | 0.153 | 0.185 | 0.215 | 0.241 | 0.261 | 0.281 |
| Shanxi | 0.047 | 0.057 | 0.065 | 0.075 | 0.095 | 0.112 | 0.131 | 0.152 | 0.172 | 0.191 |
| Inner Mongolia | 0.040 | 0.048 | 0.059 | 0.070 | 0.086 | 0.102 | 0.115 | 0.128 | 0.140 | 0.153 |
| Liaoning | 0.067 | 0.085 | 0.096 | 0.109 | 0.128 | 0.149 | 0.164 | 0.181 | 0.197 | 0.213 |
| Jilin | 0.039 | 0.044 | 0.054 | 0.064 | 0.078 | 0.089 | 0.103 | 0.112 | 0.120 | 0.128 |
| Heilongjiang | 0.040 | 0.046 | 0.056 | 0.068 | 0.082 | 0.097 | 0.112 | 0.119 | 0.129 | 0.139 |
| Shanghai | 0.203 | 0.228 | 0.251 | 0.264 | 0.293 | 0.340 | 0.370 | 0.407 | 0.459 | 0.512 |
| Jiangsu | 0.167 | 0.206 | 0.218 | 0.240 | 0.294 | 0.347 | 0.397 | 0.444 | 0.511 | 0.579 |
| Zhejiang | 0.164 | 0.205 | 0.224 | 0.240 | 0.282 | 0.339 | 0.373 | 0.420 | 0.468 | 0.517 |
| Anhui | 0.065 | 0.091 | 0.105 | 0.121 | 0.155 | 0.192 | 0.214 | 0.243 | 0.269 | 0.295 |
| Fujian | 0.085 | 0.101 | 0.112 | 0.125 | 0.149 | 0.176 | 0.194 | 0.218 | 0.242 | 0.266 |
| Jiangxi | 0.040 | 0.060 | 0.066 | 0.083 | 0.106 | 0.133 | 0.153 | 0.177 | 0.196 | 0.214 |
| Shandong | 0.111 | 0.140 | 0.181 | 0.209 | 0.271 | 0.289 | 0.324 | 0.388 | 0.460 | 0.533 |
| Henan | 0.071 | 0.097 | 0.119 | 0.135 | 0.177 | 0.206 | 0.241 | 0.289 | 0.333 | 0.377 |
| Hubei | 0.066 | 0.085 | 0.100 | 0.111 | 0.135 | 0.163 | 0.187 | 0.216 | 0.242 | 0.268 |
| Hunan | 0.059 | 0.073 | 0.087 | 0.101 | 0.134 | 0.166 | 0.200 | 0.232 | 0.263 | 0.294 |
| Guangdong | 0.201 | 0.242 | 0.271 | 0.315 | 0.406 | 0.486 | 0.537 | 0.630 | 0.723 | 0.817 |
| Guangxi | 0.040 | 0.043 | 0.054 | 0.066 | 0.098 | 0.131 | 0.161 | 0.188 | 0.215 | 0.243 |
| Hainan | 0.055 | 0.061 | 0.069 | 0.076 | 0.081 | 0.094 | 0.098 | 0.107 | 0.116 | 0.125 |
| Chongqing | 0.054 | 0.068 | 0.084 | 0.099 | 0.124 | 0.148 | 0.166 | 0.188 | 0.227 | 0.265 |
| Sichuan | 0.071 | 0.099 | 0.122 | 0.142 | 0.183 | 0.223 | 0.263 | 0.309 | 0.348 | 0.386 |
| Guizhou | 0.038 | 0.048 | 0.063 | 0.076 | 0.101 | 0.129 | 0.148 | 0.170 | 0.199 | 0.229 |
| Yunnan | 0.049 | 0.063 | 0.070 | 0.083 | 0.107 | 0.138 | 0.166 | 0.191 | 0.211 | 0.232 |
| Shaanxi | 0.057 | 0.069 | 0.084 | 0.098 | 0.124 | 0.147 | 0.169 | 0.192 | 0.212 | 0.232 |
| Gansu | 0.028 | 0.038 | 0.048 | 0.060 | 0.075 | 0.090 | 0.104 | 0.120 | 0.131 | 0.142 |
| Qinghai | 0.033 | 0.041 | 0.046 | 0.051 | 0.061 | 0.071 | 0.079 | 0.088 | 0.092 | 0.097 |
| Ningxia | 0.034 | 0.039 | 0.047 | 0.054 | 0.064 | 0.068 | 0.076 | 0.084 | 0.090 | 0.096 |
| Xinjiang | 0.035 | 0.043 | 0.052 | 0.057 | 0.075 | 0.092 | 0.110 | 0.133 | 0.148 | 0.163 |
| Variables | Obs | Mean | Std. Dev. | Min | Max |
|---|---|---|---|---|---|
| ANQPF | 300 | 0.192 | 0.082 | 0.055 | 0.442 |
| DE | 300 | 0.170 | 0.125 | 0.028 | 0.817 |
| RFD | 300 | 1.866 | 0.530 | 0.689 | 3.823 |
| ED | 300 | 0.672 | 0.329 | 0.251 | 1.931 |
| HC | 300 | 0.225 | 0.059 | 0.092 | 0.447 |
| GI | 300 | 0.250 | 0.101 | 0.107 | 0.643 |
| EO | 300 | 0.251 | 0.250 | 0.008 | 1.216 |
| Variables | ANQPF | ||||
|---|---|---|---|---|---|
| (1) | (2) | (3) | (4) | (5) | |
| DE | 0.321 *** (20.020) | 0.248 *** (8.120) | 0.193 *** (6.240) | 0.185 *** (5.970) | 0.188 *** (6.020) |
| ED | 0.044 ** (2.760) | 0.018 (1.130) | 0.025 * (1.550) | 0.028 * (1.680) | |
| HC | 0.321 *** (5.340) | 0.330 ** (5.490) | 0.310 *** (4.840) | ||
| GI | 0.093 * (1.920) | 0.091 * (1.880) | |||
| EO | 0.023 (0.880) | ||||
| Time fixed effects | Yes | Yes | Yes | Yes | Yes |
| Province fixed effects | Yes | Yes | Yes | Yes | Yes |
| N | 300 | 300 | 300 | 300 | 300 |
| R2 | 0.599 | 0.610 | 0.647 | 0.652 | 0.653 |
| Variables | (1) | (2) | (3) | (4) | (5) | |||||
|---|---|---|---|---|---|---|---|---|---|---|
| Coef. | S.E. | Coef. | S.E. | Coef. | S.E. | Coef. | S.E. | Coef. | S.E. | |
| DE | 0.032 *** | 0.010 | 0.216 *** | 0.036 | 0.157 *** | 0.036 | 0.351 *** | 0.070 | 0.165 *** | 0.026 |
| Control variable | Yes | Yes | Yes | Yes | Yes | |||||
| N | 300 | 300 | 210 | 120 | 300 | |||||
| R2 | 0.621 | 0.653 | 0.682 | 0.848 | 0.794 | |||||
| Variables | Eastern | Central | Western | Northeastern |
|---|---|---|---|---|
| DE | 0.187 ** (3.570) | 0.337 *** (3.760) | 0.136 *** (2.760) | −0.329 (−1.55) |
| Control variable | Control | Control | Control | Control |
| Time fixed effects | Yes | Yes | Yes | Yes |
| Province fixed effects | Yes | Yes | Yes | Yes |
| N | 100 | 60 | 110 | 30 |
| R2 | 0.618 | 0.920 | 0.879 | 0.829 |
| Variables | (1) | (2) |
|---|---|---|
| RFD | ANQPF | |
| DE | 1.578 *** (7.88) | 0.110 *** (3.35) |
| RFD | 0.049 *** (5.42) | |
| Control variable | Control | Control |
| Fixed effects | Yes | Yes |
| N | 300 | 300 |
| R2 | 0.856 | 0.688 |
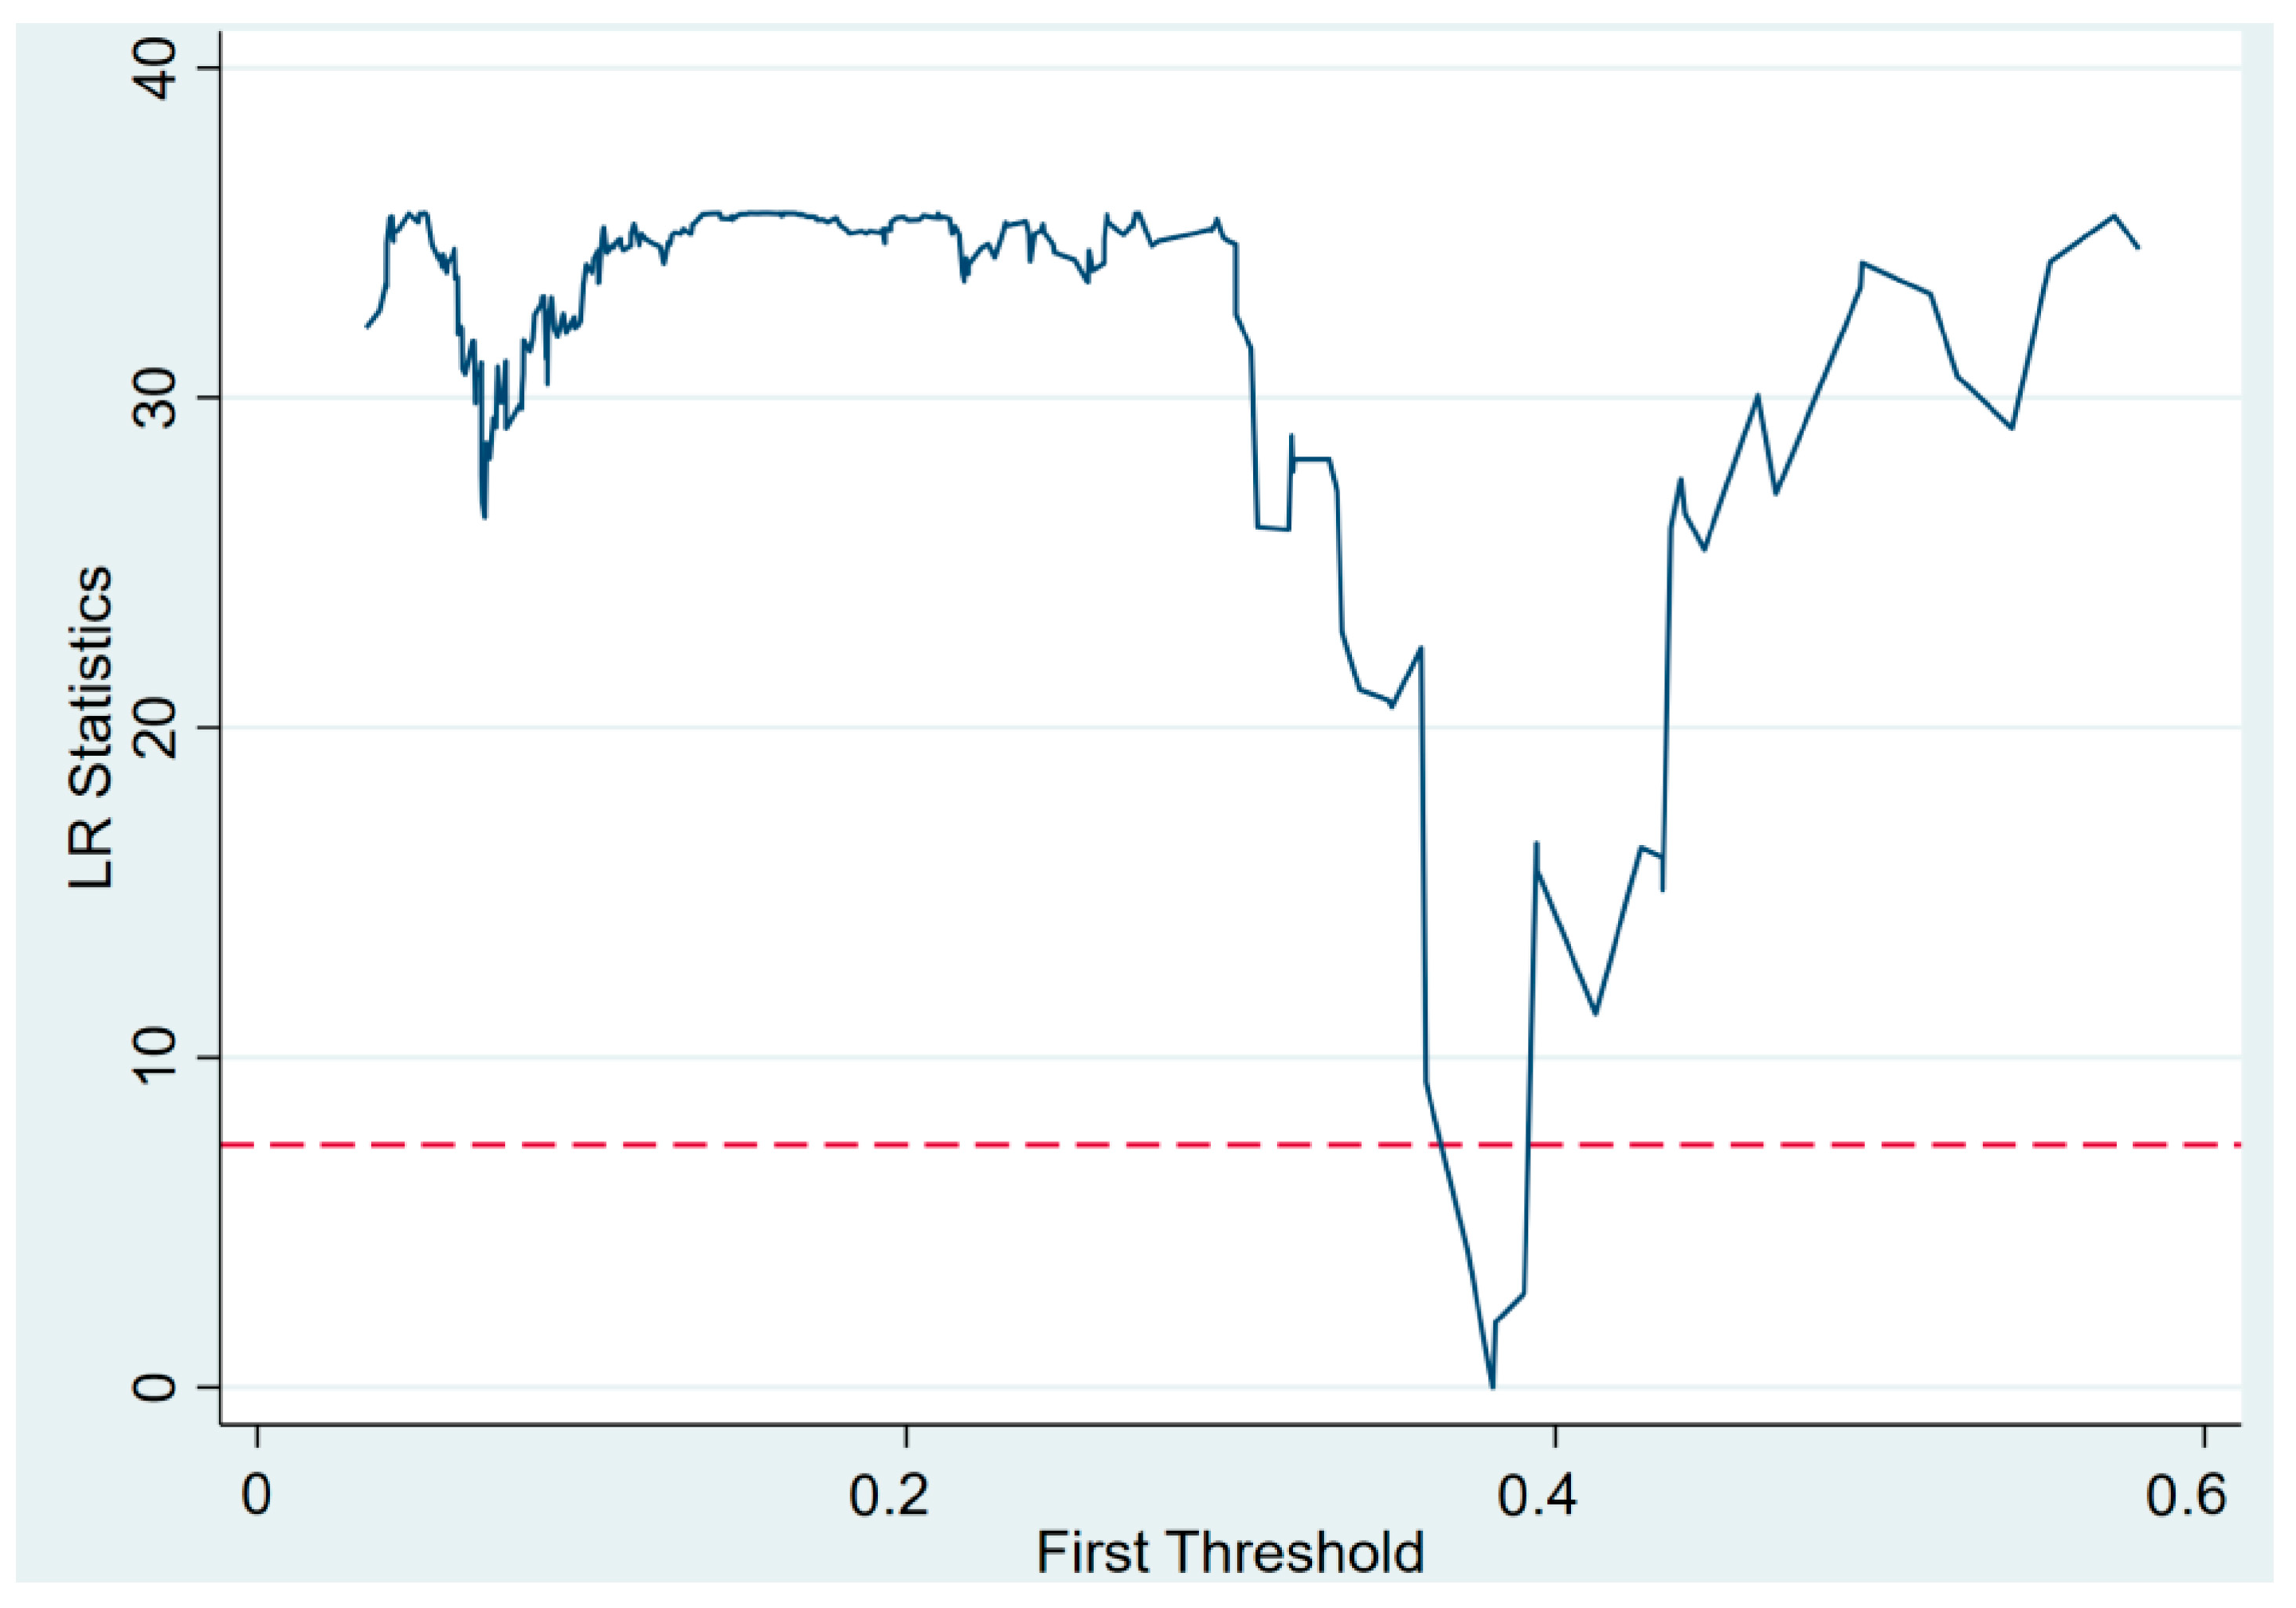
| Variable | Threshold Type | Threshold Value | F Value | p Value |
|---|---|---|---|---|
| DE | Single threshold | 0.381 | 32.960 | 0.040 |
| Variables | ANQPF | |
|---|---|---|
| Threshold value | DE ≤ 0.381 | 0.372 *** |
| DE > 0.381 | 0.270 *** | |
| Control variable | Control | |
| Time fixed effects | Yes | |
| Province fixed effects | Yes | |
| N | 300 | |
| R2 | 0.689 | |
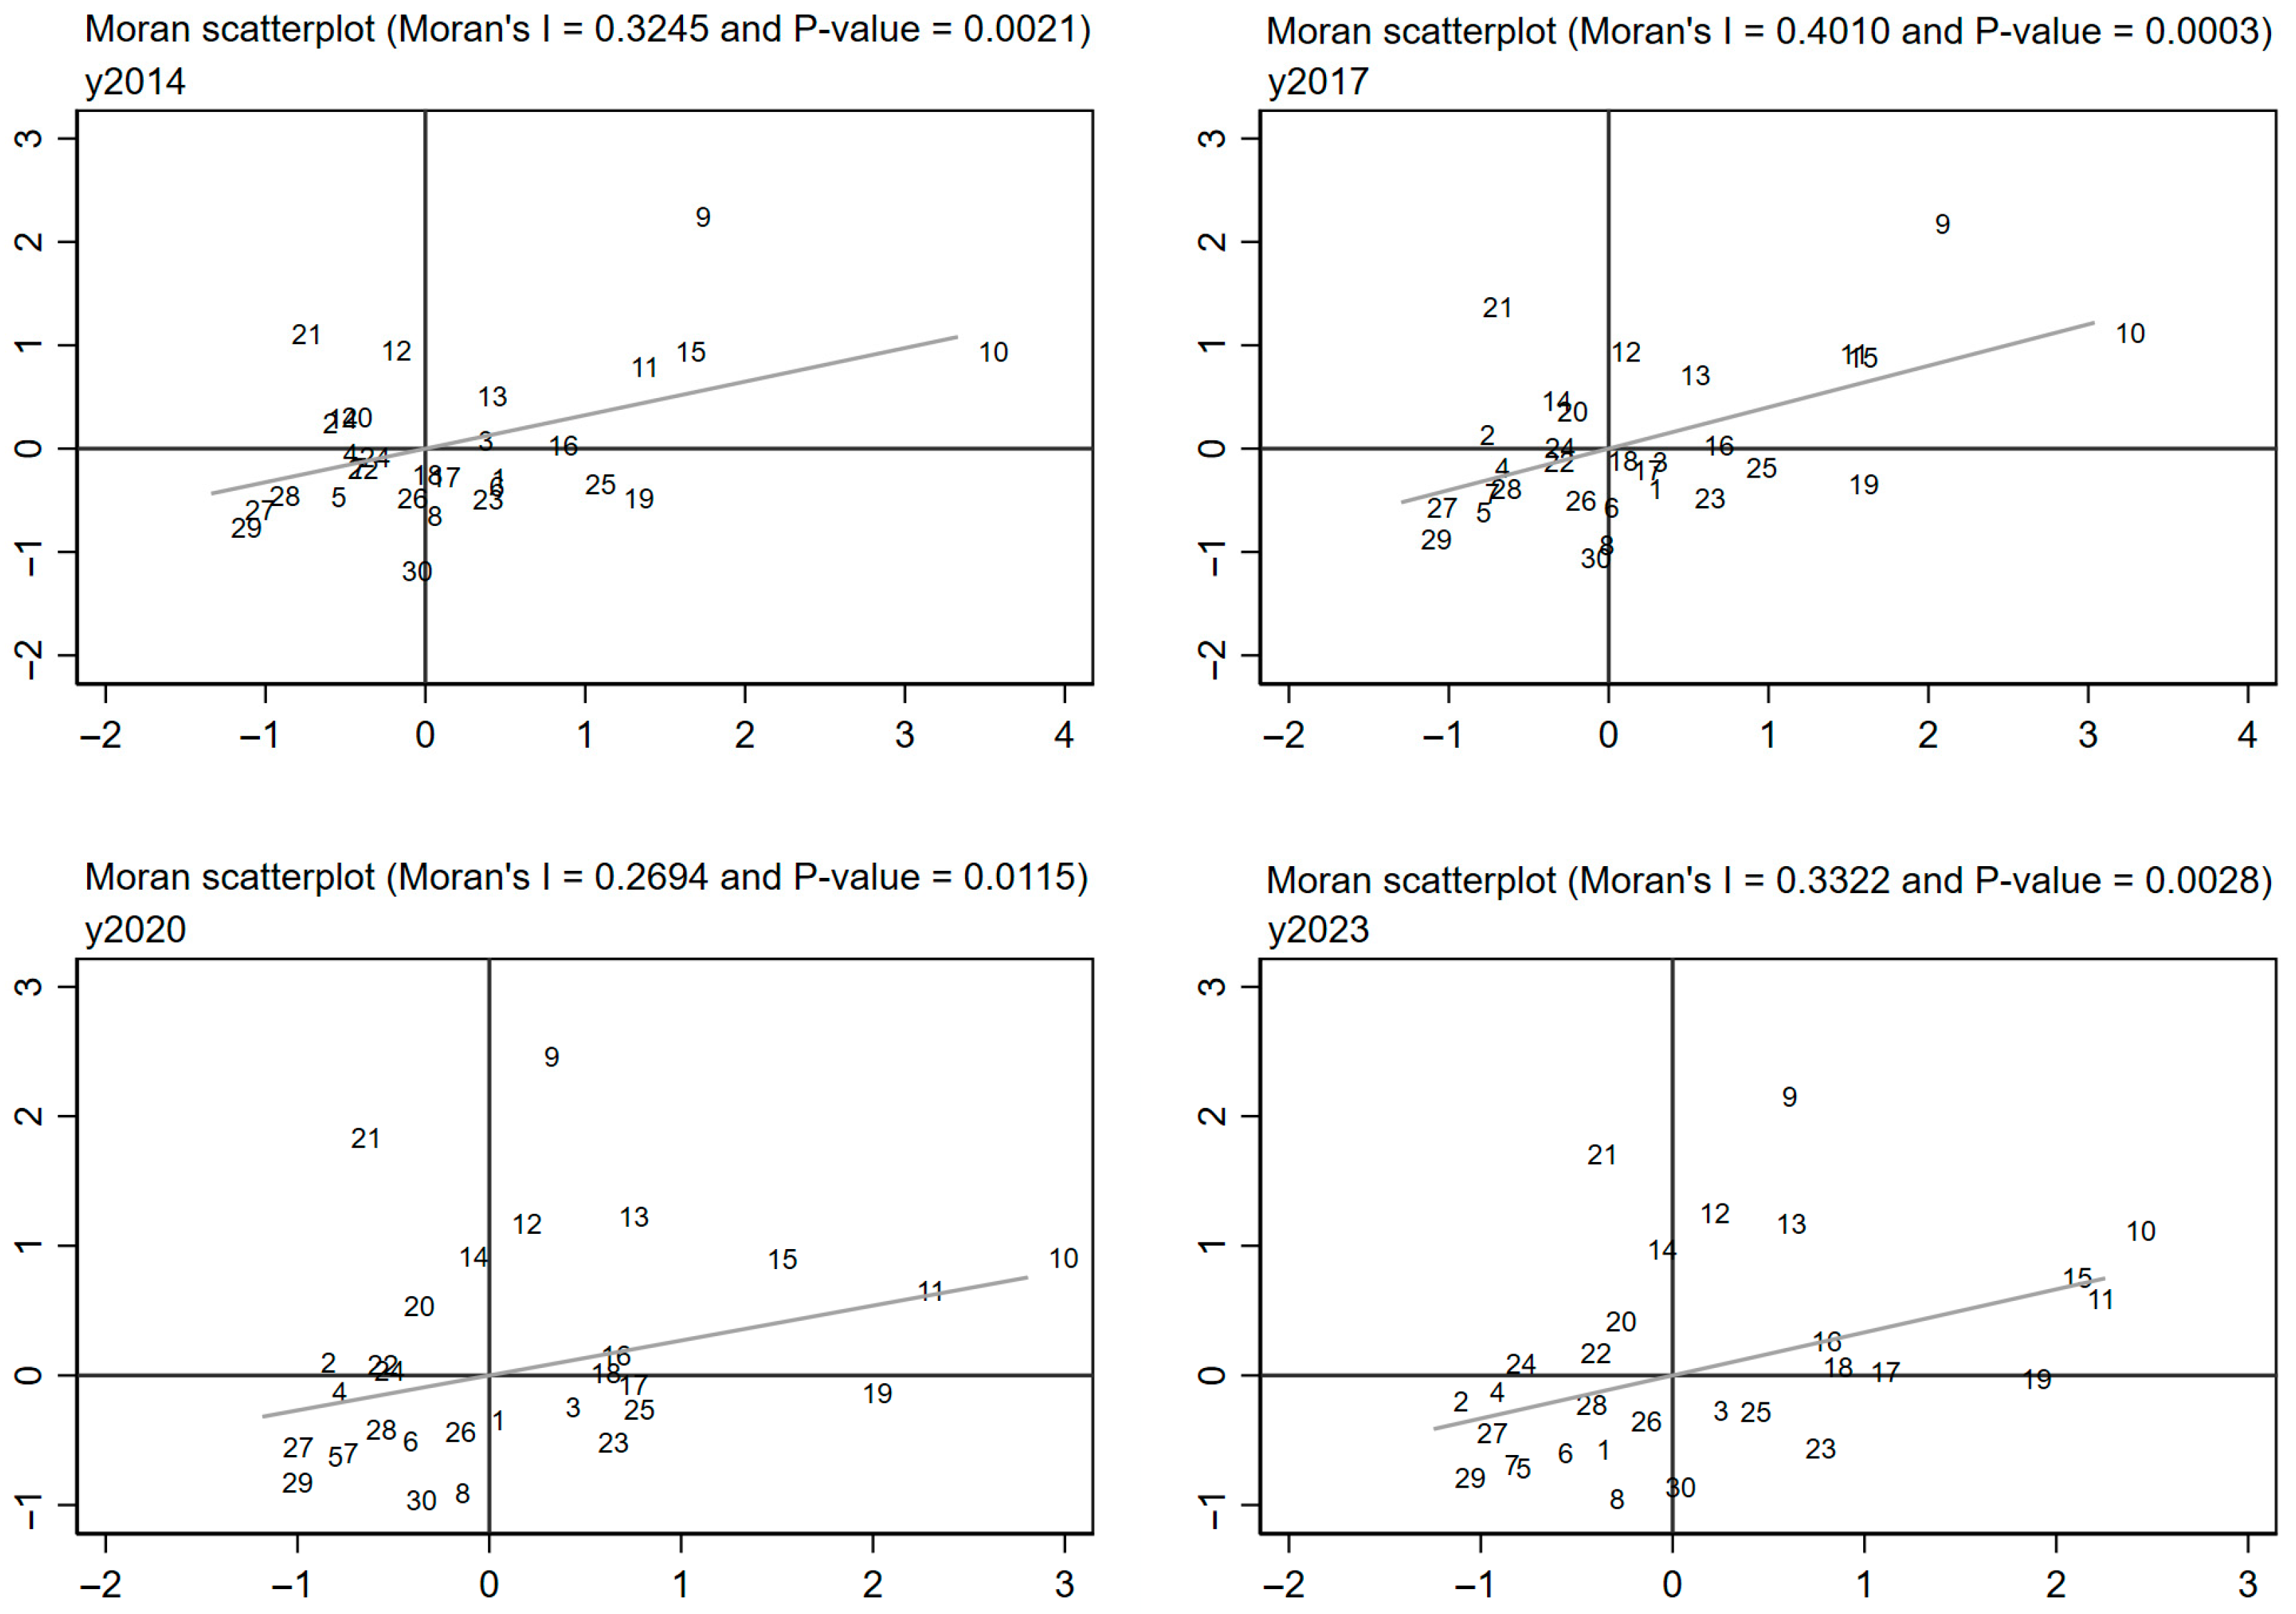
| Year | ANQPF | |
|---|---|---|
| Moran’s I | Z Value | |
| 2014 | 0.325 *** | 3.078 |
| 2015 | 0.338 *** | 3.192 |
| 2016 | 0.405 *** | 3.720 |
| 2017 | 0.401 *** | 3.656 |
| 2018 | 0.435 *** | 3.896 |
| 2019 | 0.455 *** | 4.090 |
| 2020 | 0.269 *** | 2.528 |
| 2021 | 0.285 *** | 2.638 |
| 2022 | 0.314 *** | 2.868 |
| 2023 | 0.332 *** | 2.990 |
| Type of Test | Test Statistical Values | p Value |
|---|---|---|
| LM-Error | 5.360 | 0.021 |
| Robust LM-Error | 0.567 | 0.451 |
| LM-Lag | 10.523 | 0.001 |
| Robust LM-Lag | 5.730 | 0.017 |
| LR-ind | 23.570 | 0.023 |
| LR-time | 569.400 | 0.000 |
| Wald-sem | 51.410 | 0.000 |
| Wald-sar | 67.090 | 0.000 |
| Variables | LR-Direct (3) | LR-Indirect (4) | LR-Total (5) |
|---|---|---|---|
| DE | 0.123 *** (4.160) | −0.060 *** (−1.230) | 0.063 (1.000) |
| Control variable | Control | Control | Control |
| Province fixed effects | Yes | Yes | Yes |
| Time fixed effects | Yes | Yes | Yes |
| N | 300 | 300 | 300 |
| R2 | 0.691 | ||
Disclaimer/Publisher’s Note: The statements, opinions and data contained in all publications are solely those of the individual author(s) and contributor(s) and not of MDPI and/or the editor(s). MDPI and/or the editor(s) disclaim responsibility for any injury to people or property resulting from any ideas, methods, instructions or products referred to in the content. |
© 2025 by the authors. Licensee MDPI, Basel, Switzerland. This article is an open access article distributed under the terms and conditions of the Creative Commons Attribution (CC BY) license (https://creativecommons.org/licenses/by/4.0/).
Share and Cite
Xu, Y.; Zhang, Y.; Wang, S.; Zhao, M.; Li, G.; Kang, Y.; Zhao, C. Internal Mechanism and Empirical Analysis of Digital Economy’s Impact on Agricultural New Quality Productive Forces: Evidence from China. Sustainability 2025, 17, 6844. https://doi.org/10.3390/su17156844
Xu Y, Zhang Y, Wang S, Zhao M, Li G, Kang Y, Zhao C. Internal Mechanism and Empirical Analysis of Digital Economy’s Impact on Agricultural New Quality Productive Forces: Evidence from China. Sustainability. 2025; 17(15):6844. https://doi.org/10.3390/su17156844
Chicago/Turabian StyleXu, Yongsheng, Ying Zhang, Siqing Wang, Mingzheng Zhao, Guifang Li, Yu Kang, and Cuiping Zhao. 2025. "Internal Mechanism and Empirical Analysis of Digital Economy’s Impact on Agricultural New Quality Productive Forces: Evidence from China" Sustainability 17, no. 15: 6844. https://doi.org/10.3390/su17156844
APA StyleXu, Y., Zhang, Y., Wang, S., Zhao, M., Li, G., Kang, Y., & Zhao, C. (2025). Internal Mechanism and Empirical Analysis of Digital Economy’s Impact on Agricultural New Quality Productive Forces: Evidence from China. Sustainability, 17(15), 6844. https://doi.org/10.3390/su17156844