
Sediment Flushing Operation Mode During Sediment Peak Processes Aiming Towards the Sustainability of Three Gorges Reservoir


Abstract
1. Introduction
2. Materials and Methods
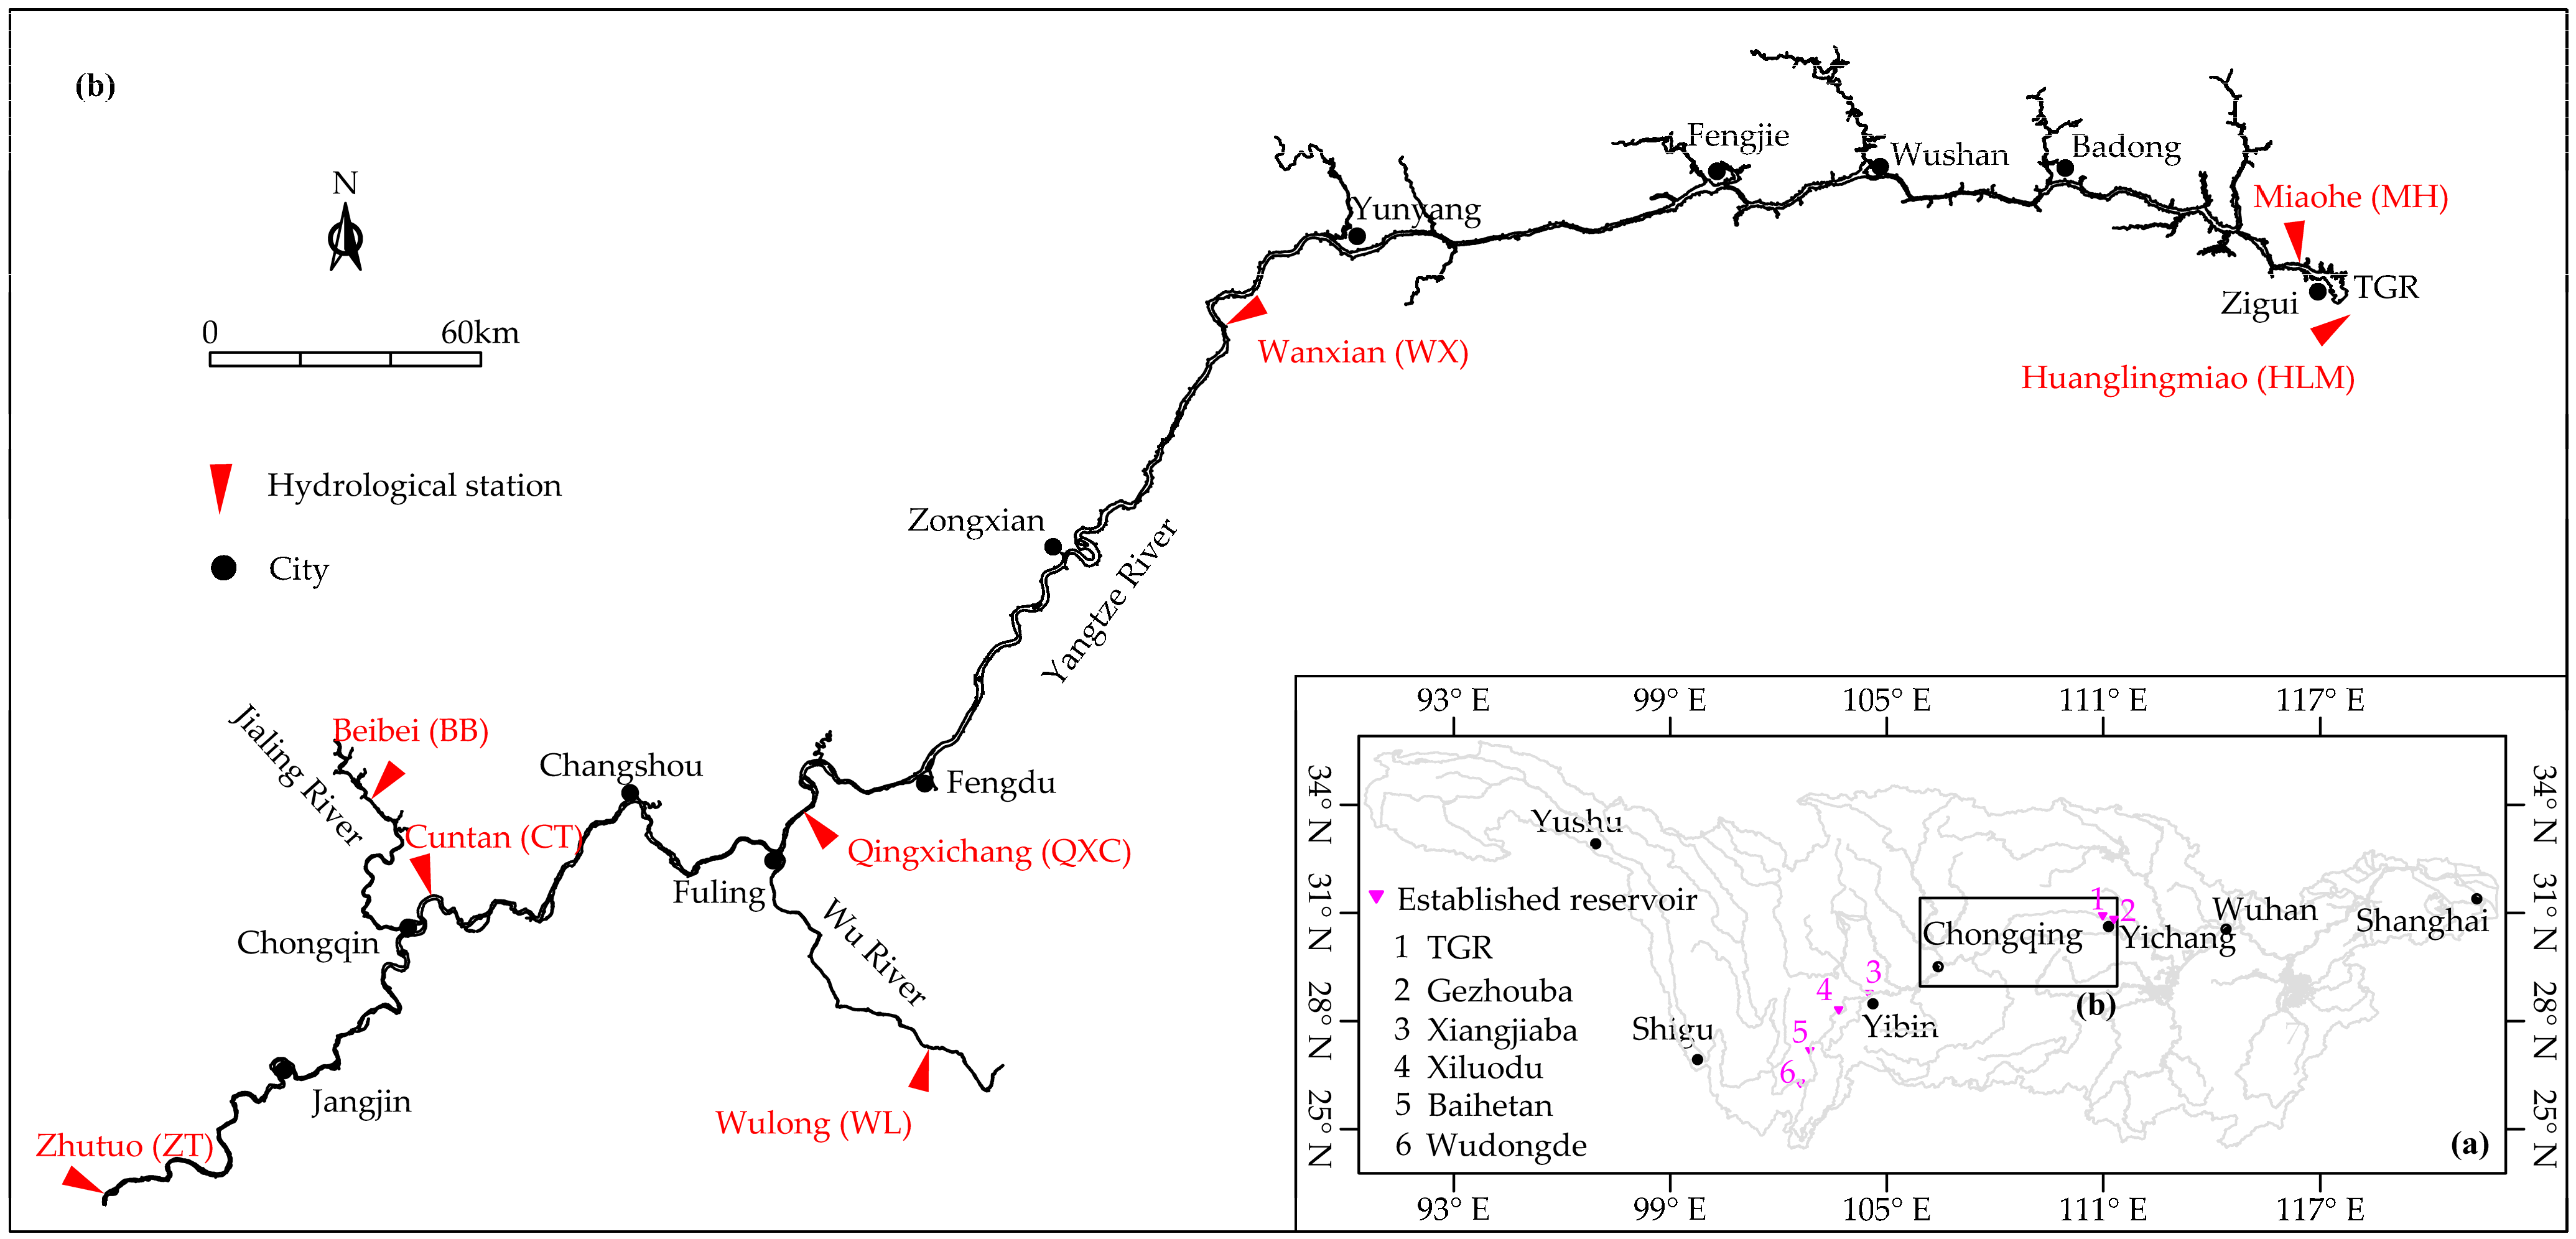
2.1. The Study Area
2.2. Data
2.3. Methods
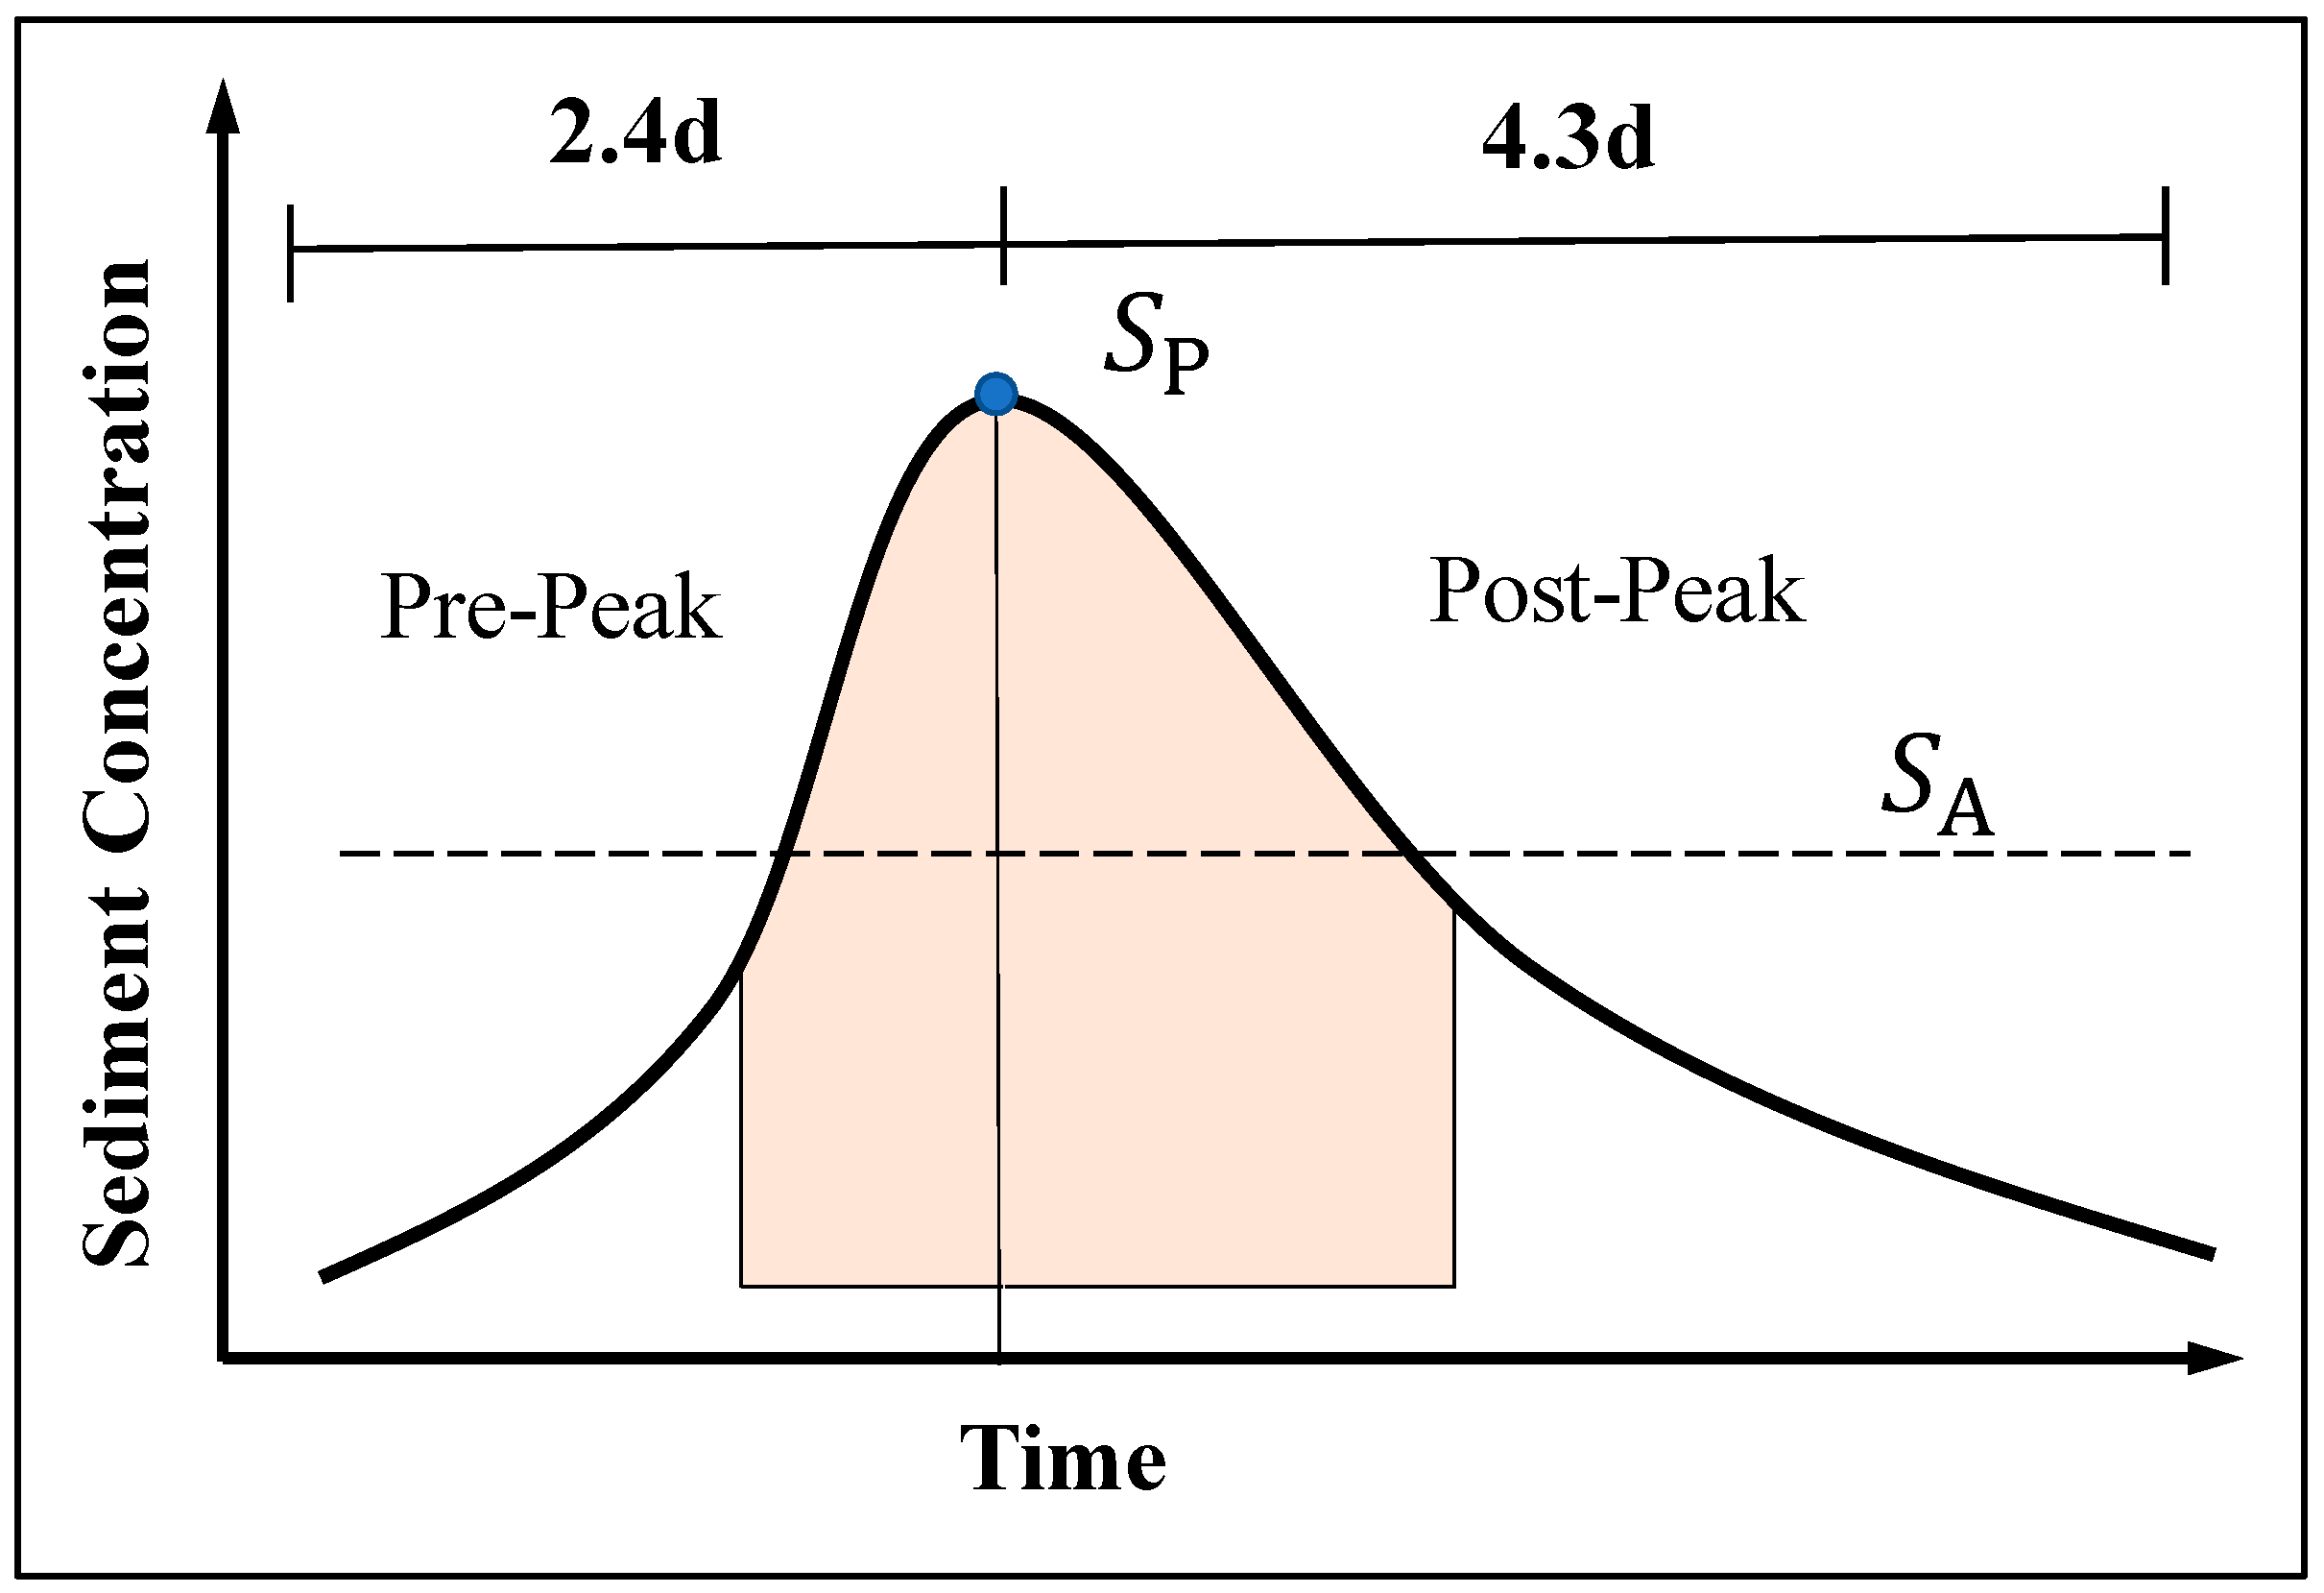
2.3.1. Definition of Sand Peak Characteristics
2.3.2. The Numerical Model for Sand Peak Scheduling
- The bedload sediment transport rate
- The impact of sediment flocculation
- Model validation
3. Results
3.1. Propagation Characteristics of the Sand Peak in TGR
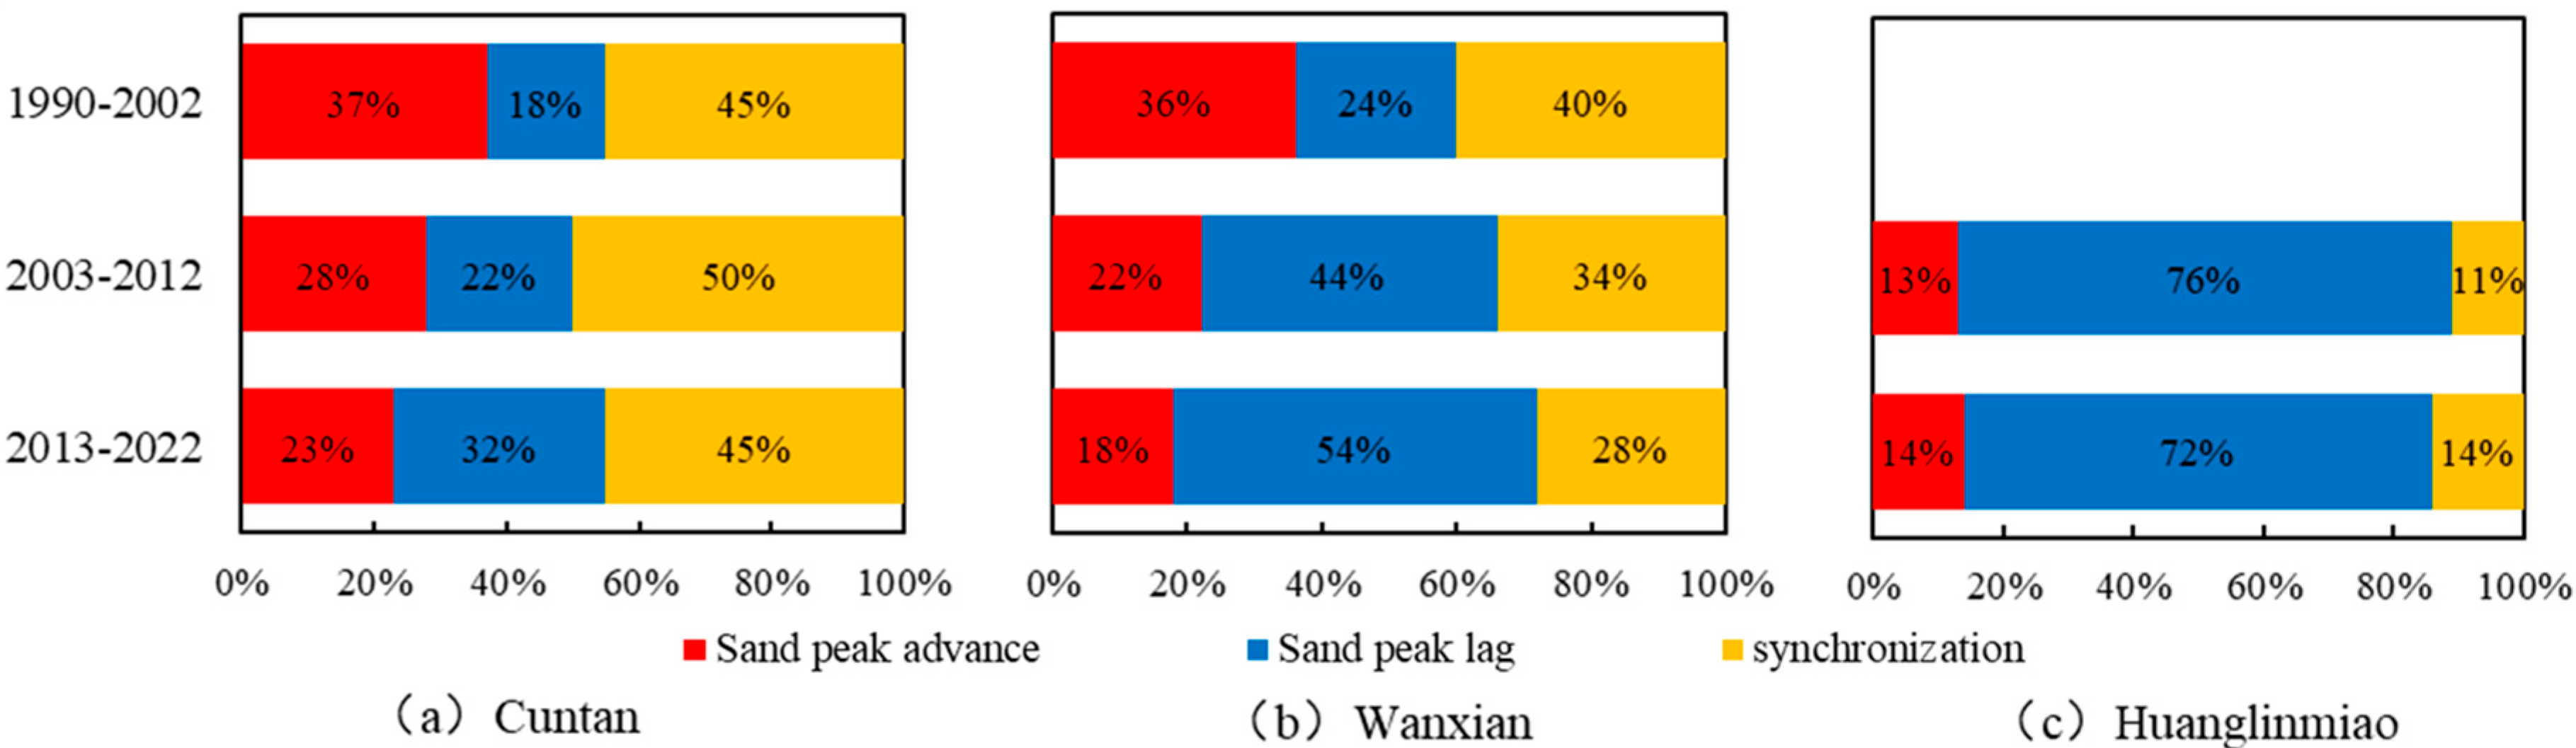
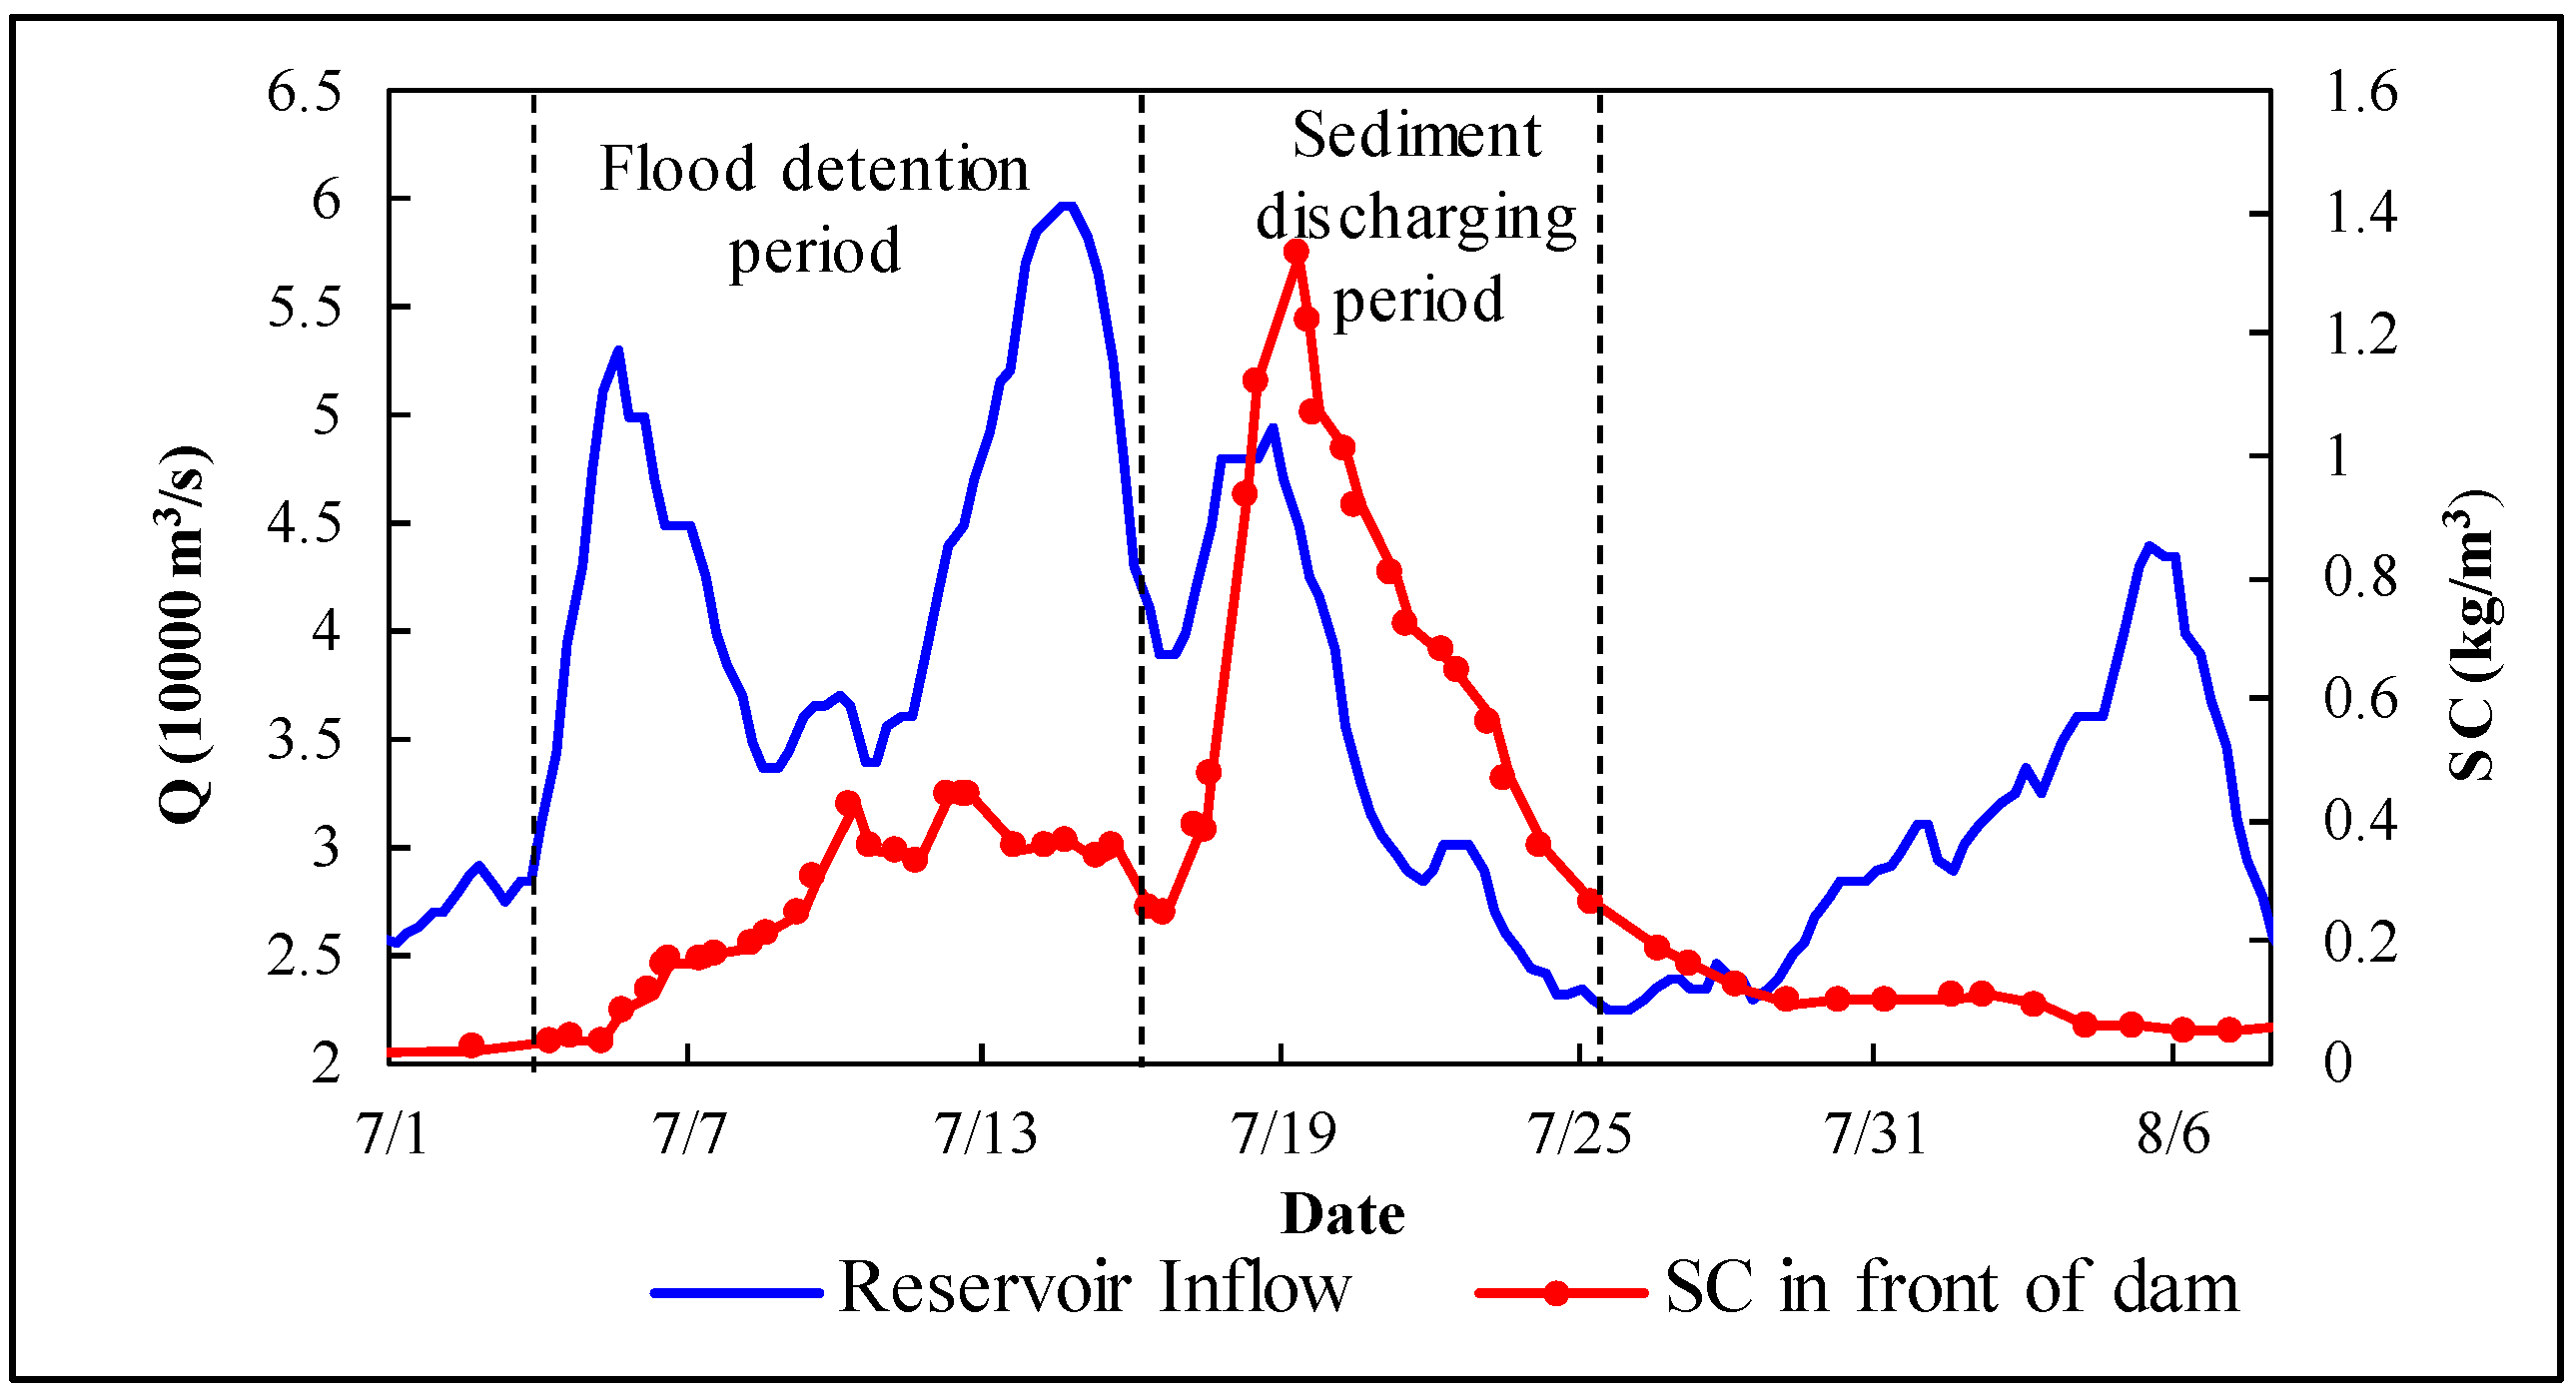
3.1.1. Asynchronous Propagation Characteristics of the Flood Peak and the Sand Peak
3.1.2. Peak-Type Characteristics of the Sand Peak in the Reservoir
3.1.3. Attenuation and Flattening Evolution of the Sand Peak Process in the Reservoir
3.2. Ideas and Methods for Sand Peak Process Dispatching
3.2.1. The Division of the Sand Peak Process Dispatching Stages
- (1)
- During significant upstream flood and sand peaks, inflows are stored to raise the reservoir to a target water level.
- (2)
- Outflows are regulated to maintain an inlet–outlet balance, enabling the sand peak to migrate toward the dam front (near Badong).
- (3)
- Based on the sediment prediction results, once the sand peak reaches the dam front, the reservoir’s discharge should be moderately increased to exceed the inflow, maximizing sediment release. In essence, high sediment concentrations should be discharged as much as possible during their peak presence at the dam.
3.2.2. An Example of Sand Peak Process Scheduling Phase Division
- The Year 2013
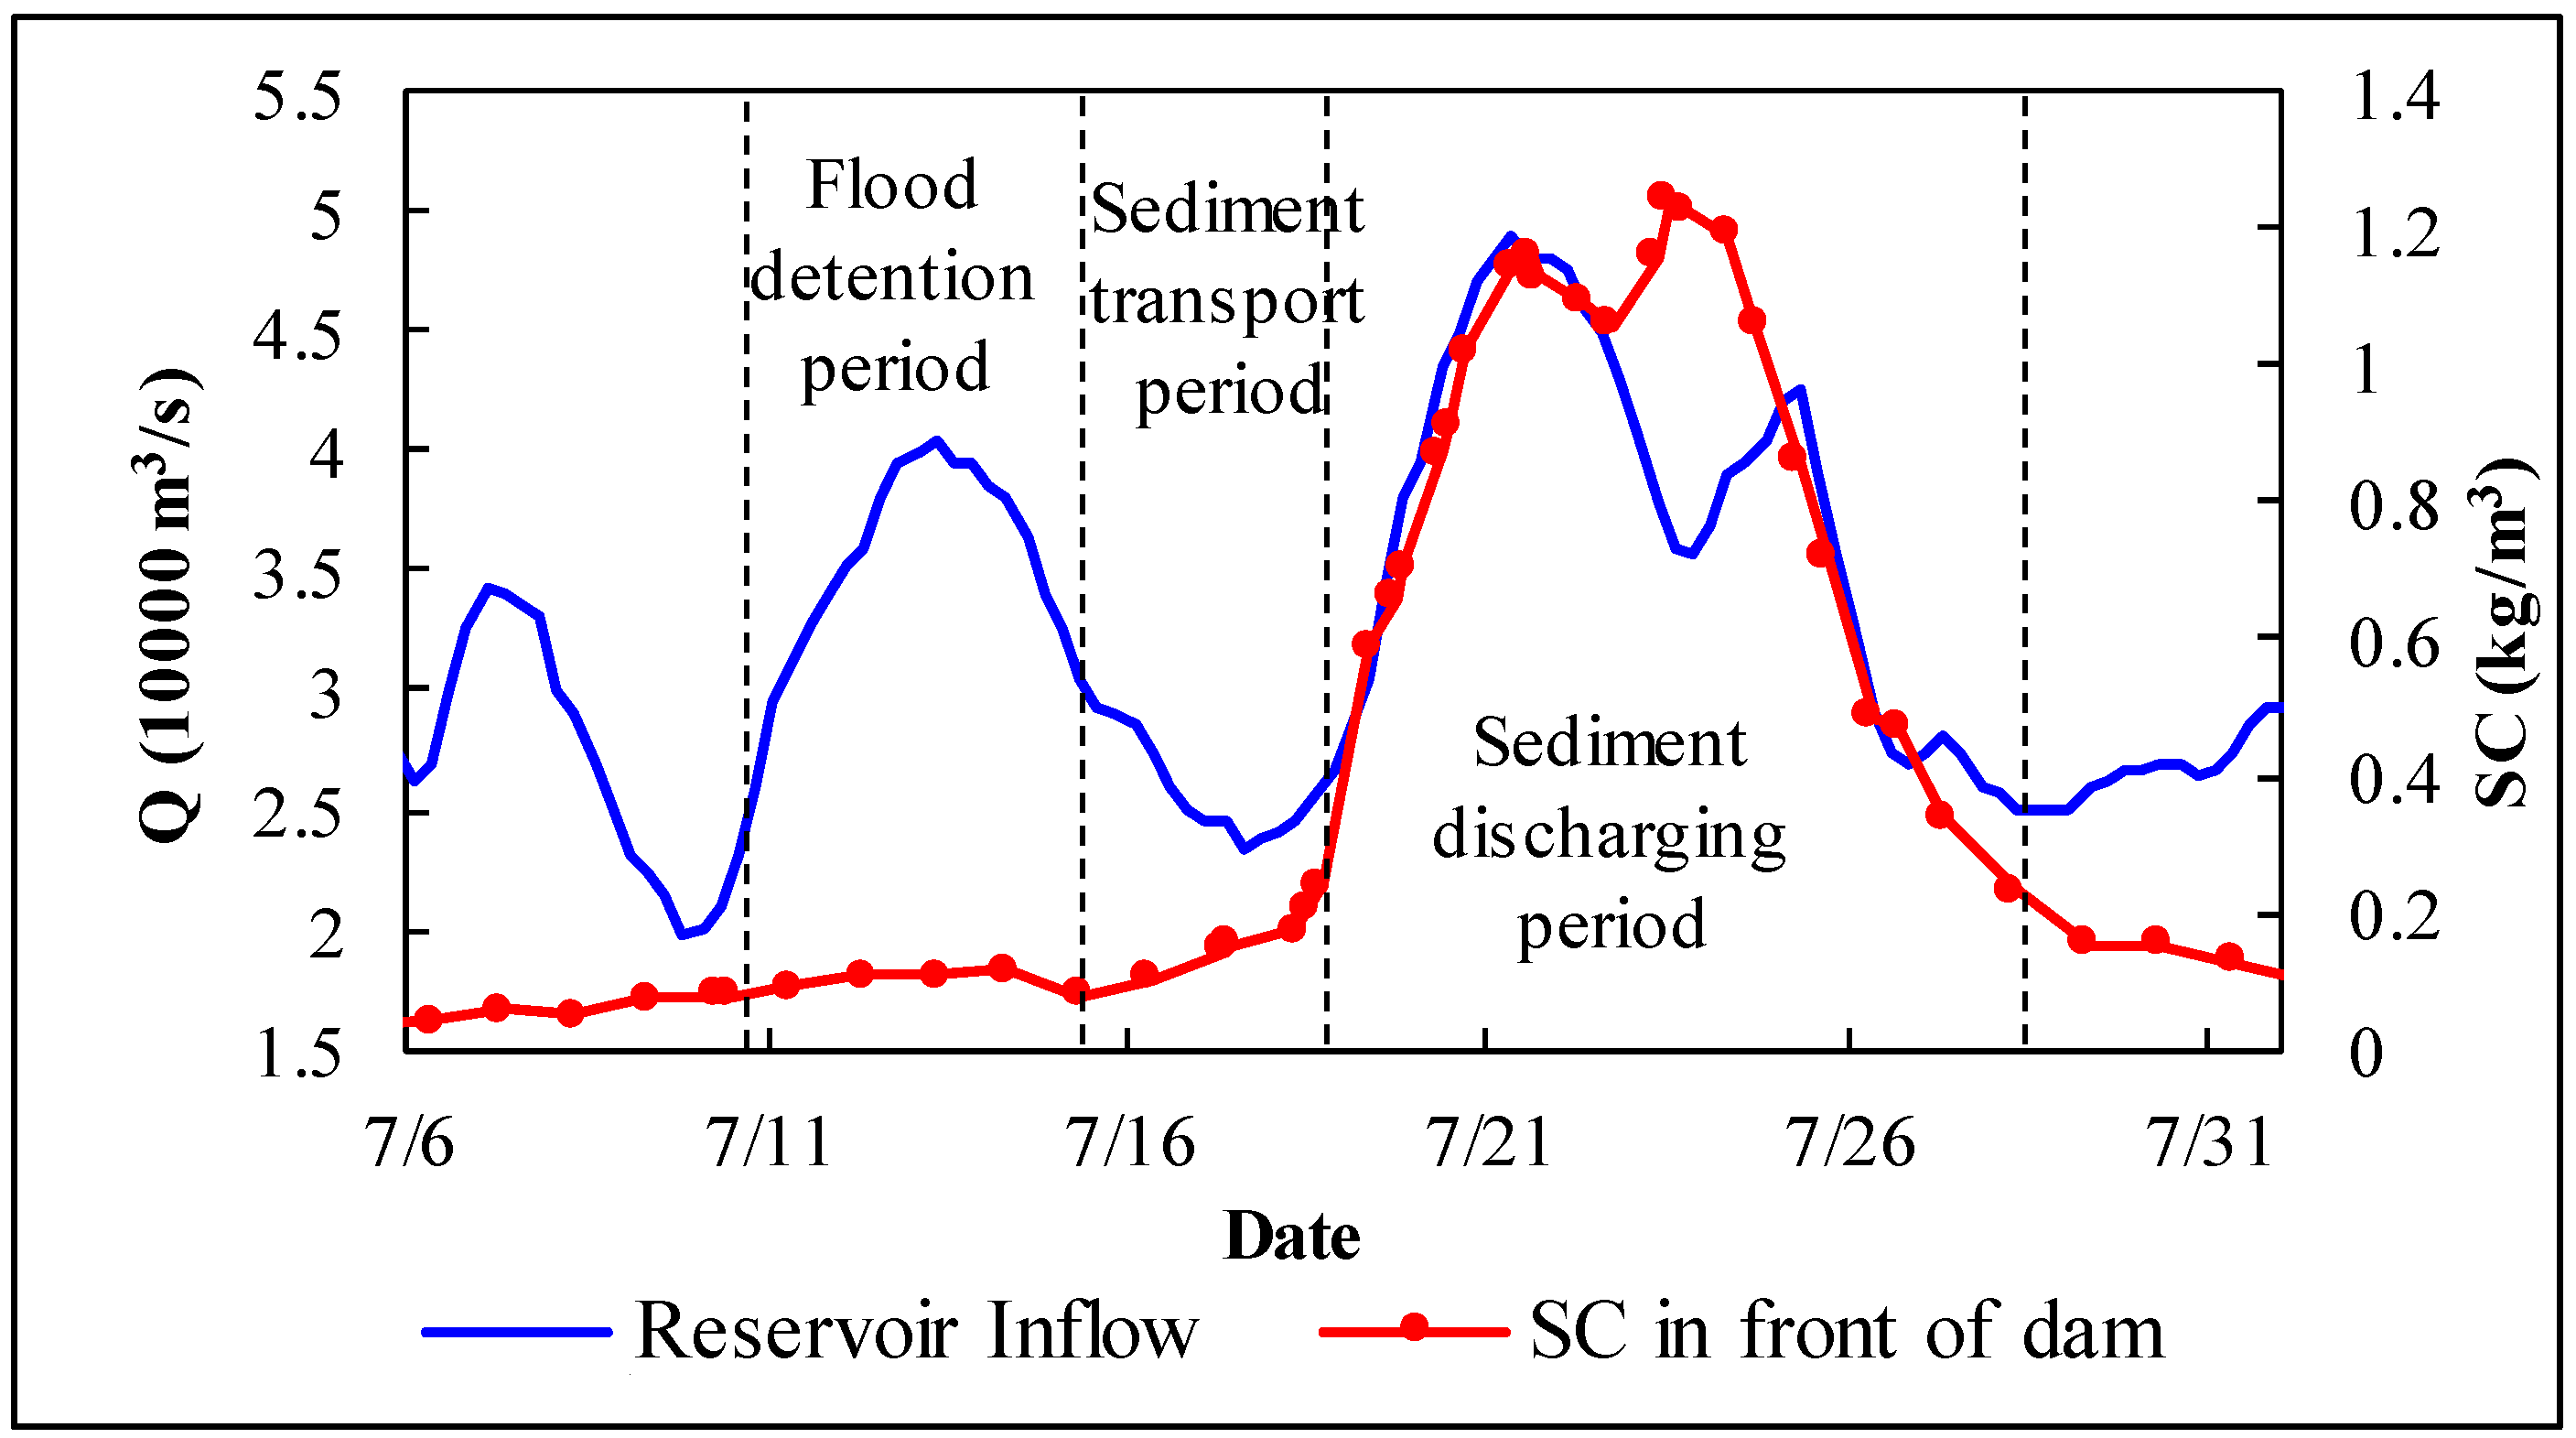
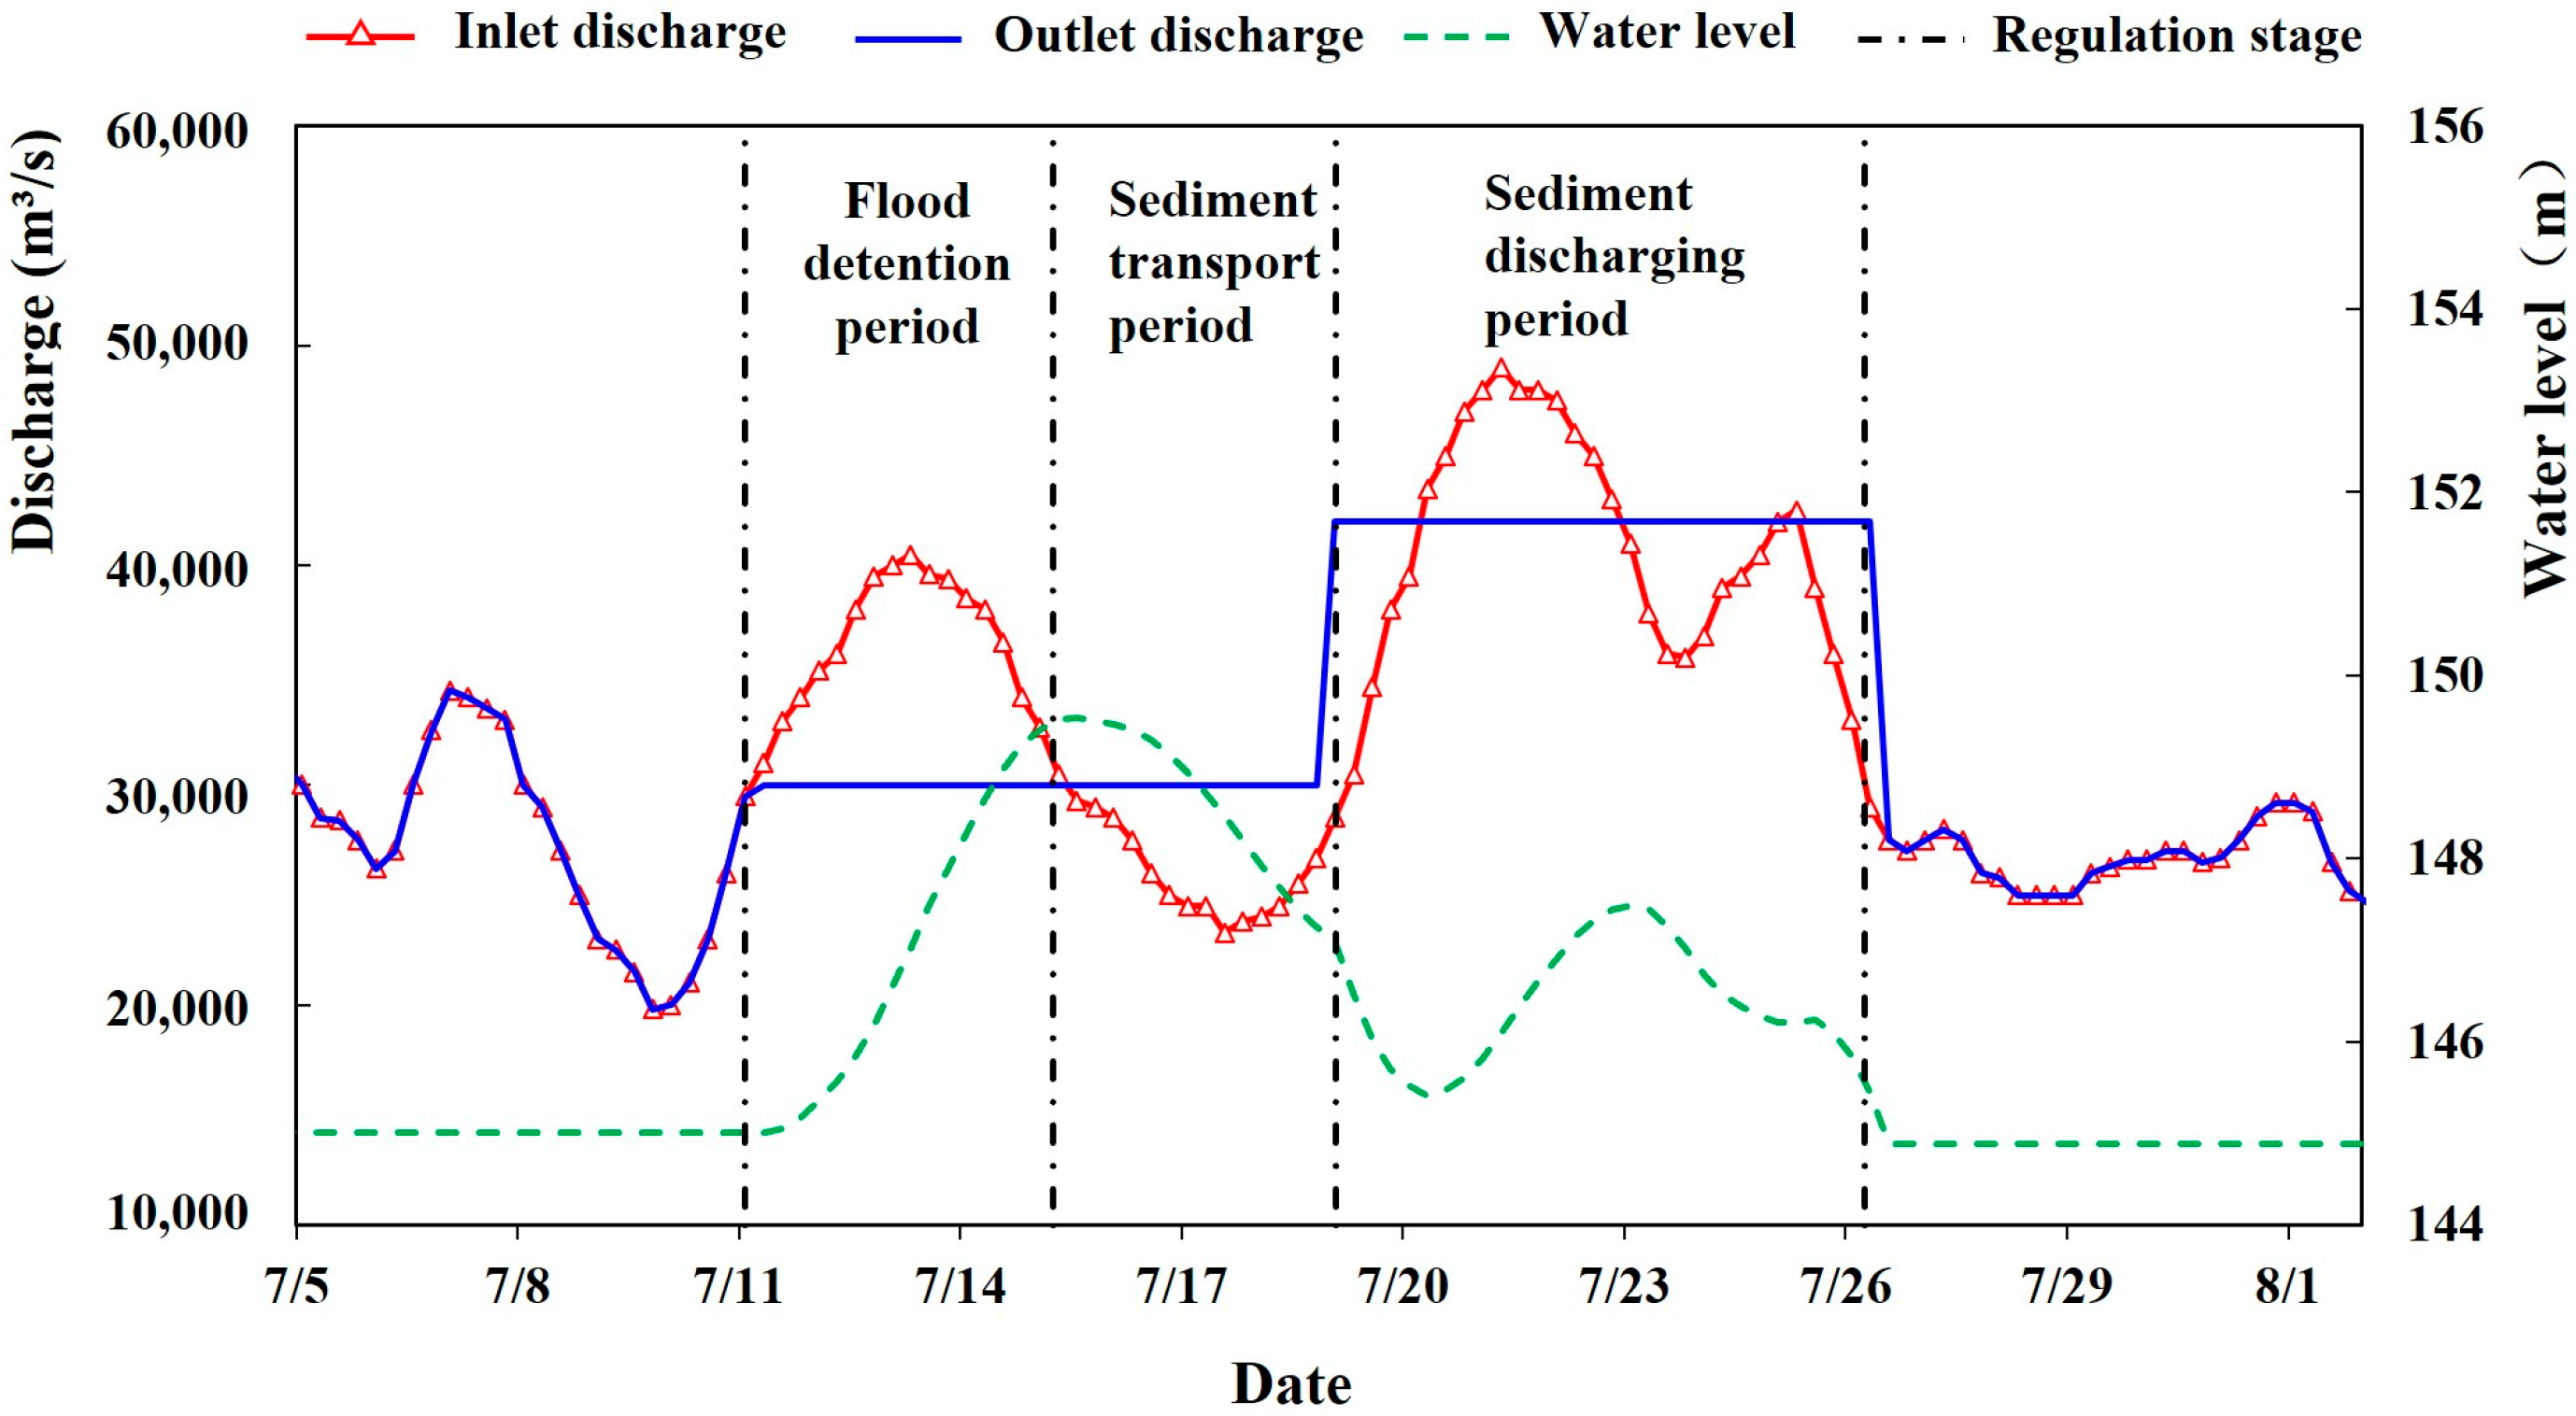
- The Year 2018
- (1)
- The flood detention period: 4 July, 08:00 to 16 July, 08:00;
- (2)
- The sediment discharge period: 16 July, 08:00 to 26 July, 08:00.
3.3. The Influence of Different Scheduling Methods on Reservoir Erosion and Deposition During the Sand Peak Process
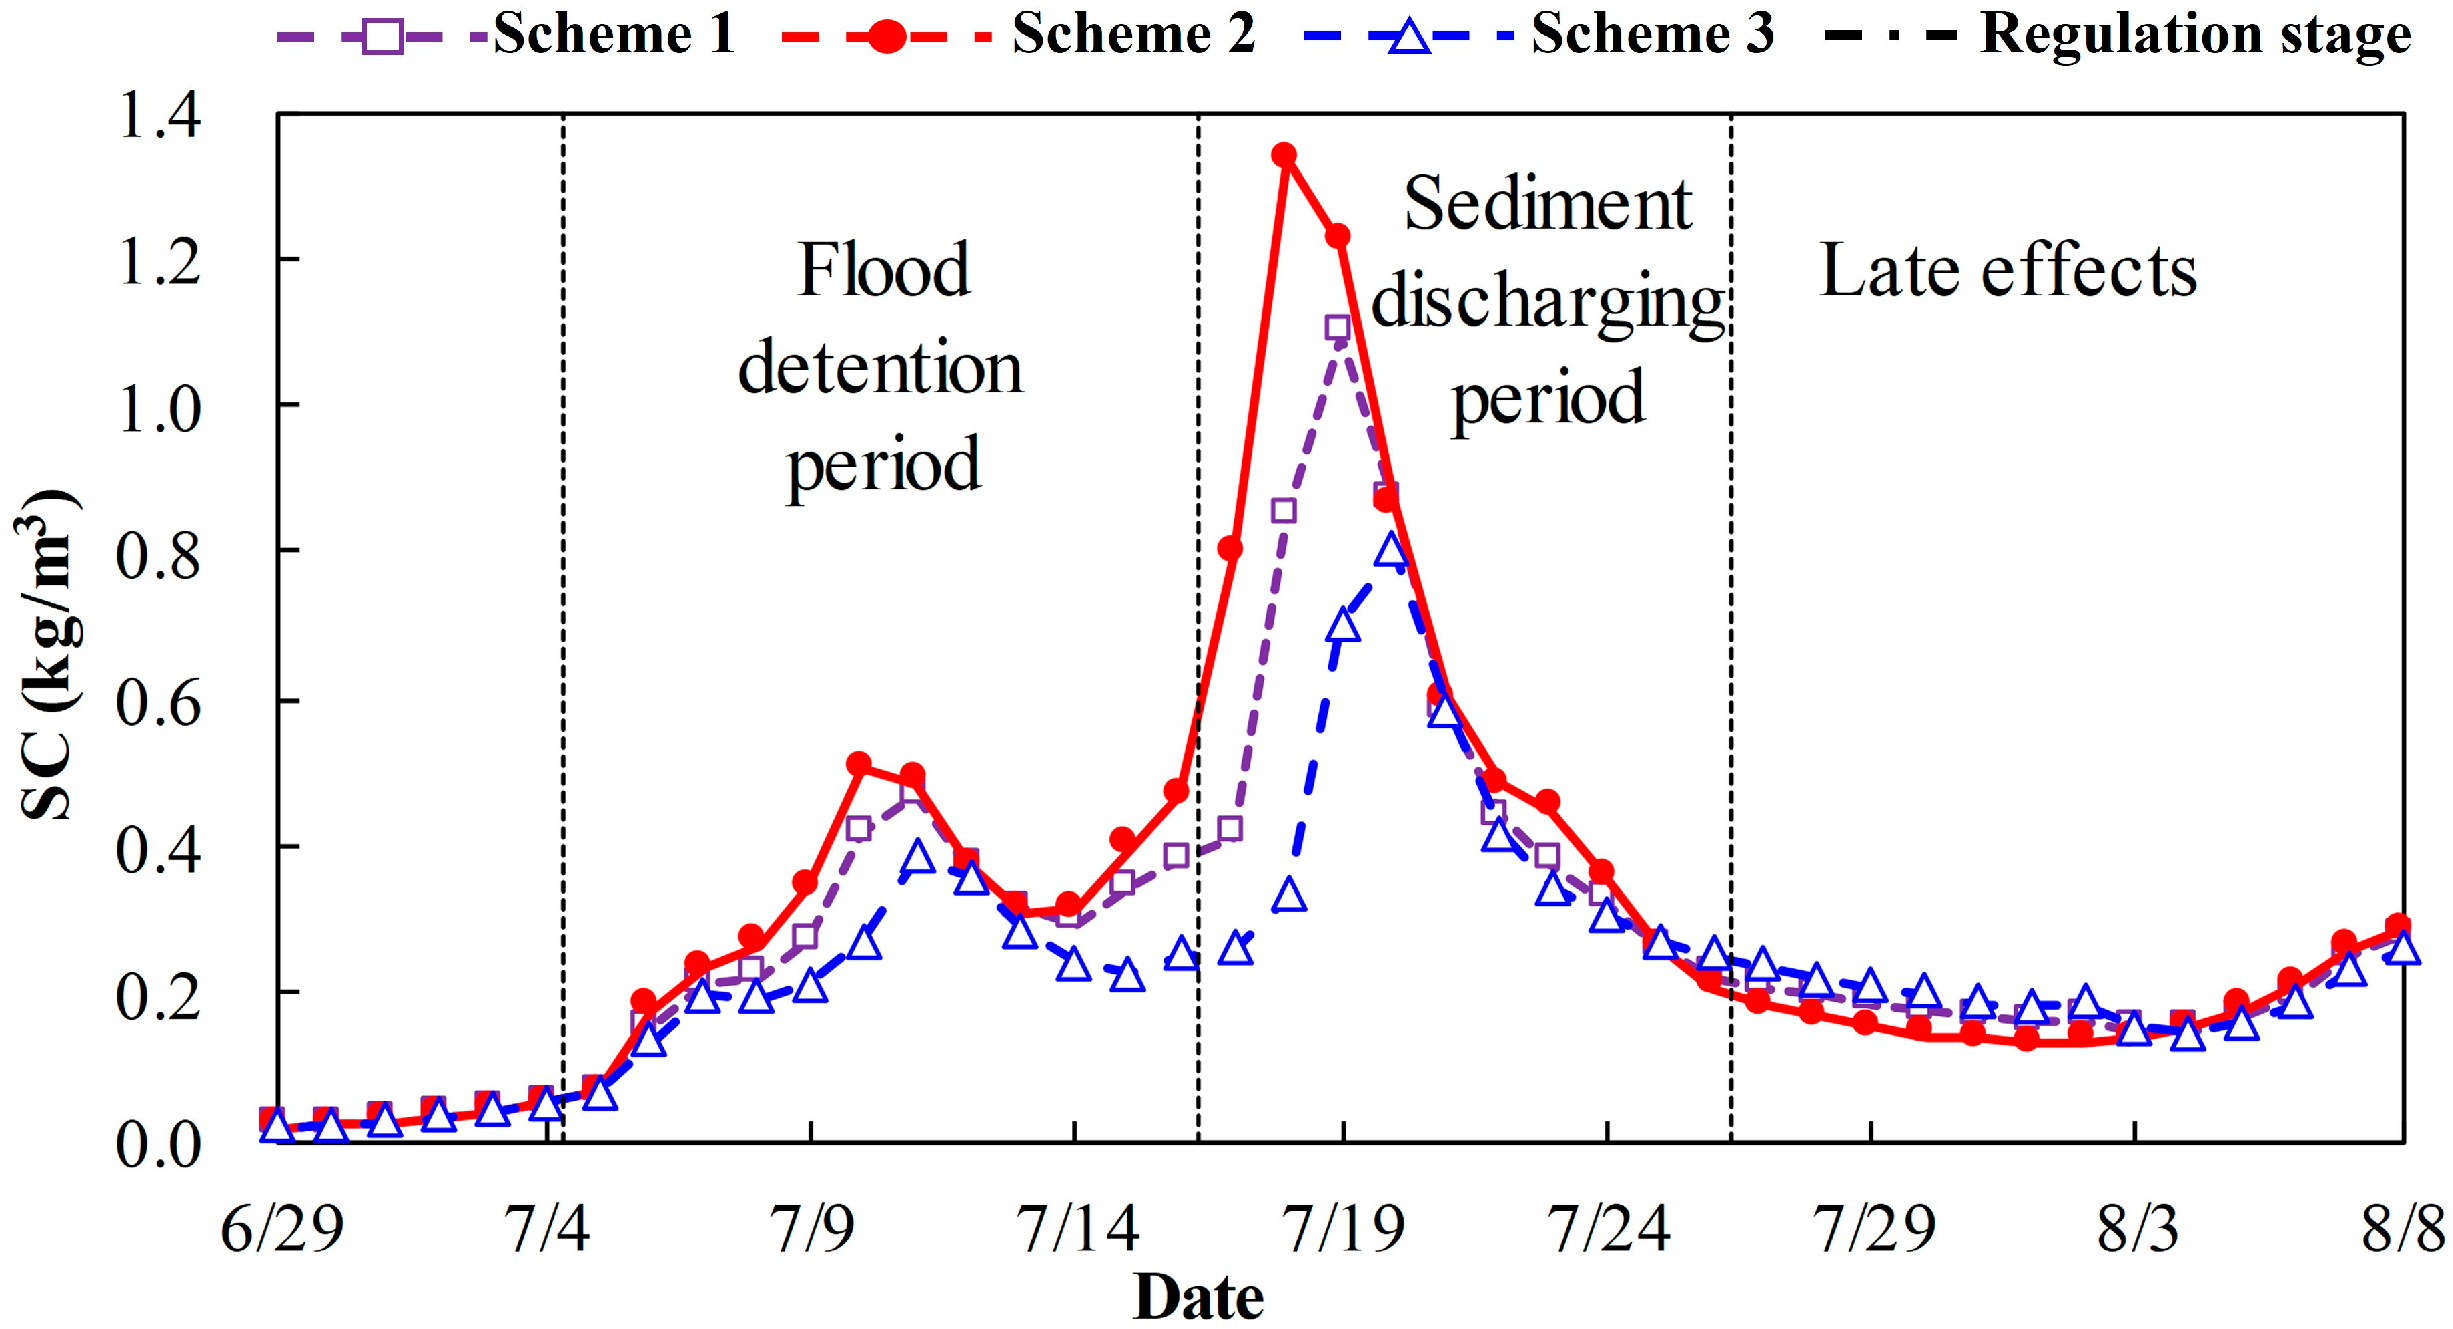
3.3.1. The Scheduling Calculation Scheme
- (1)
- Scheduling in 2013
- (2)
- Scheduling in 2018
3.3.2. Analysis of the Calculation Results
4. Discussion
4.1. Factors Influencing Sand Peak Process Dispatching
4.1.1. Sediment Load Conditions
4.1.2. Sand Conditions
4.1.3. Discharge Conditions
4.1.4. The Water Level Conditions in Front of the Dam
4.2. The Dispatching Strategy for the Sand Peak Process in the TGR
- (1)
- Triggering Conditions Based on Real-Time Monitoring:When real-time monitoring indicates that the SC of the sand peak at the CT station reaches or exceeds 0.5 kg/m3, sediment forecasting should be initiated to guide reservoir discharge operations during the sand peak event.
- (2)
- Forecasting Thresholds for Initiating Dispatching:Based on forecast data, the discharge from the CT station should meet the minimum thresholds indicated in Table 4, with conditions including a sand peak SC of 2.0 kg/m3, an average SC of no less than 1.4 kg/m3, a duration exceeding 7 days, and an incoming sediment load of no less than 30 million tons.For the HLM station, the sand peak should reach 0.5 kg/m3, the average SC should be no less than 0.3 kg/m3, and sediment-rich discharge should last over 11 days with a total sediment transport of at least 10 million tons.
- (3)
- Scheduling the Dispatch Process:Once the decision to begin sand peak dispatching is made, the process is divided into three phases: flood detention, sediment transport, and sediment discharge.
- During the flood detention period, floodwaters are stored in compliance with flood control guidelines, leading to a gradual rise in the reservoir’s water level.
- During the sediment transport period, sediment movement through the reservoir is prioritized, with the minimum discharge required adjusted based on the corresponding reservoir water level, as shown in Table 4.
- During the sediment discharge period, the primary objective is to increase the outflow to flush high-SC water from the dam front. This intensified discharge should begin two days before the sand peak reaches the dam and must not fall below 35,000 m3/s. The elevated discharge should be sustained for at least three days following the sand peak’s exit from the reservoir. Completion of the dispatch process should be determined based on the sediment concentration and reservoir water level conditions.
- (4)
- The Reservoir Level and the Outlet Utilization Strategy:During the discharge phase of the sand peak process, the reservoir’s water level should be kept as low as possible. Emphasis should be placed on increasing the discharge flow during the flood detention and sediment transport phases to reduce sediment attenuation within the reservoir. In the sediment discharge phase, when the SC at the dam front remains high, sediment flushing should prioritize the use of sediment outlets. If additional discharge is required, drift holes and deep flood outlets may be employed to preferentially release turbid bottom water, which enhances the sediment transport efficiency and optimizes the sediment distribution near the dam front.
5. Conclusions
- (1)
- The sand peak discharge scheduling for the TGR is divided into three stages: the flood detention period, the sediment transport period, and the sediment discharge period. The flood detention period mainly involves flood peak reduction and storage when the flood peak and the sand peak enter the reservoir. The sediment transport period mainly maintains smooth propagation of the sand peak to the river section in front of the dam, whereas the sediment discharge period increases the discharge when the sand peak is about to reach the dam for greater sand discharge.
- (2)
- Starting conditions and control indicators for sand load scheduling during the sand peak process are proposed. The goal of sand load scheduling during the sand peak process of the TGR is to discharge sand for 11 days, and the sand load is no less than 10 million tons. The average sediment content is 0.3 kg/m3, and the average daily maximum value of the sand peak is 0.9 kg/m3. If the lower limit is considered, the daily maximum value of the sand peak is 0.5 kg/m3. In the time period from 2 d before the sand peak reaches the dam to 3 d after the sand peak (a total of 5 d), the water discharge should not be less than 35,000 m3/s.
- (3)
- The dispatching methods in the TGR during the three periods of sand peak discharge are presented. During the flood detention period, the reservoir’s water level rises as the reservoir is intercepted and stored. During the sediment transport period, when the average water level in front of the dam changes within the 145–165 m range, the corresponding minimum inflow is 25,000–45,000 m3/s. During the sediment discharge period, the intensified discharge should begin 2 d before the sand peak reaches the dam and must not fall below 35,000 m3/s. The elevated discharge should be sustained for at least 2 d following the exit of the sand peak from the reservoir.
- (4)
- The sand peak discharge scheduling method proposed in this study provides a reference for applications in actual project scheduling, which can provide an important scientific basis for the sustainable utilization of the TGR and other similar reservoirs.
Author Contributions
Funding
Institutional Review Board Statement
Informed Consent Statement
Data Availability Statement
Acknowledgments
Conflicts of Interest
References
- Hu, C.H.; Fang, C.M.; Guan, J.C. Monitoring and evaluation of effective storage capacity of the Three Gorges Reservoir and strategic suggestions for its long-term maintenance. China Water Resour. 2024, 22, 17–25. [Google Scholar]
- Zheng, S.R. Risk analysis of implementing middle- small flood dispatch by Three Gorges Project and countermeasures. Yangtze River 2015, 46, 7–12. [Google Scholar]
- Hu, C.H.; Fang, C.M.; Shi, H.L. Recent progress in sediment research of the Three Gorges Project. China Water Resour. 2023, 19, 10–16. [Google Scholar]
- Zhang, X.; Wen, A. Current changes of sediment yields in the upper Yangtze River and its two biggest tributaries, China. Glob. Planet. Change 2004, 41, 221–227. [Google Scholar] [CrossRef]
- Yang, H.F.; Yang, S.L.; Xu, K.H.; Milliman, J.D.; Wang, H.; Yang, Z.; Chen, Z.; Zhang, C.Y. Human impacts on sediment in the Yangtze River: A review and new perspectives. Glob. Planet. Change 2018, 162, 8–17. [Google Scholar] [CrossRef]
- Petkovšek, G.; Roca, M.; Kitamura, Y. Sediment flushing from reservoirs: A review. Dams Reserv. 2020, 30, 12–21. [Google Scholar] [CrossRef]
- Hu, C. Development and practice of the operation mode of“Storing Clear Water and Discharging Muddy Flow”in sediment-laden rivers in China. J. Hydraul. Eng. 2016, 47, 283–291. [Google Scholar]
- Wang, Z.Y.; Hu, C.H. Strategies for managing reservoir sedimentation. Int. J. Sediment Res. 2009, 24, 369–384. [Google Scholar] [CrossRef]
- Zhang, S.G.; Zhou, M. Operation and regulation of Three Gorges Reservoir. Strateg. Study CAE 2011, 13, 61–65. [Google Scholar]
- Jiang, E.; Dong, Q.; Zhang, Q.; Guo, X. Study on Characteristics of Sediment Peak Delay in Flood Season of the Lower Yellow River. Yellow River 2006, 28, 19–20, 39. [Google Scholar]
- Lloyd, C.E.M.; Freer, J.E.; Johnes, P.J.; Collins, A.L. Using hysteresis analysis of high-resolution water quality monitoring data, including uncertainty, to infer controls on nutrient and sediment transfer in catchments. Sci. Total Environ. 2016, 543, 388–404. [Google Scholar] [CrossRef] [PubMed]
- Eder, A.; Strauss, P.; Krueger, T.; Quinton, J.N. Comparative calculation of suspended sediment loads with respect to hysteresis effects (in the Petzenkirchen catchment, Austria). J. Hydrol. 2010, 389, 168–176. [Google Scholar] [CrossRef]
- Liu, S.; Zhang, X.; Xu, Q.; Zhang, O.; Huang, J. Estimation of sediment amount from ungauged area and analysis of sediment delivery ratio of Three Gorges Reservoir. J. Lake Sci. 2019, 31, 28–38. [Google Scholar] [CrossRef]
- Dai, S.B.; Lu, X.X. Sediment load change in the Yangtze River (Changjiang): A review. Geomorphology 2014, 215, 60–73. [Google Scholar] [CrossRef]
- Yan, H.; Zhang, X.; Xu, Q. Variation of runoff and sediment inflows to the Three Gorges Reservoir: Impact of upstream cascade reservoirs. J. Hydrol. 2021, 603, 126875. [Google Scholar] [CrossRef]
- Zhang, X.; Mu, D.; Chen, X. Impact on sediment deposition in the backwater of the Three Gorges Reservoir Area ue to changes of the upstream sediment runoff. Port Waterw. Eng. 2009, 8, 94–97. [Google Scholar]
- Guo, C.; Jin, Z.; Liang, D.; Nones, M.; Zhou, Y. Spatiotemporal evolution and influencing factors of flood control storage sedimentation in the Three Gorges Reservoir, Changjiang River, China. CATENA 2024, 243, 108214. [Google Scholar] [CrossRef]
- Yang, C.; Deng, J.; Qi, Y.; Wang, Y.; Lin, J. Study on Long-term Impact of Small and Medium-sized Floods Regulation on Sedimentation of the Three Gorges Reservoir. Water Resour. Power 2020, 38, 34–37. [Google Scholar]
- Williams, G.P. Sediment concentration versus water discharge during single hydrologic events in rivers. J. Hydrol. 1989, 111, 89–106. [Google Scholar] [CrossRef]
- Ramfos, A.; Sarris, I.; Lämmle, L.; Christodoulopoulos, D.; Alexandridis, M.; Michalopoulou, M.; Depountis, N.; Faulwetter, S.; Avrantinis, N.; Tsiotsis, E.; et al. Seasonal Water Column Stratification and Manganese and Iron Distribution in a Water Reservoir: The Case of Pinios Dam (Western Greece). Water 2025, 17, 1723. [Google Scholar] [CrossRef]
- Zhang, B.; Wu, B.; Zhang, R. Three-dimensional numerical of the asynchronous movement characteristics of flood and sediment peaks in the Three Gorges Reservoir. Adv. Water Sci. 2021, 32, 408–417. [Google Scholar]
- Zhang, W.; Chen, Y.; Li, S.; Xue, J.; Li, X. Analysis of the characteristics and causes of the asynchronous propagation of flood and sediment peaks in the Yichang—Jianli reach of the Middle Yangtze River. Adv. Water Sci. 2024, 35, 938–946. [Google Scholar]
- Singh, A.K.; Chavan, S.R. An approach to regional flood frequency analysis for general peak discharge distribution datasets. J. Hydrol. 2025, 650, 132493. [Google Scholar] [CrossRef]
- Noori, R.; Mirchi, A.; Hooshyaripor, F.; Bhattarai, R.; Torabi Haghighi, A.; Kløve, B. Reliability of functional forms for calculation of longitudinal dispersion coefficient in rivers. Sci. Total Environ. 2021, 791, 148394. [Google Scholar] [CrossRef] [PubMed]
- El Kadi Abderrezzak, K.; Ata, R.; Zaoui, F. One-dimensional numerical modelling of solute transport in streams: The role of longitudinal dispersion coefficient. J. Hydrol. 2015, 527, 978–989. [Google Scholar] [CrossRef]
- Toprak, Z.F.; Şen, Z.; Savci, M.E. Comment on “Longitudinal dispersion coefficients in natural channels”. Water Res. 2004, 38, 3139–3143. [Google Scholar] [CrossRef] [PubMed]
- Ge, H.; Zhu, L.; Mao, B. Numerical simulation of non-uniform suspended sediment flowing into the Yangtze River Estuary, China based on a river network model. Front. Mar. Sci. 2024, 11, 1428345. [Google Scholar] [CrossRef]
- Jin, Z.; Lu, J.; Yao, S. Verification on formulas of bed-load sediment transport rate at the upstream of Yangtze River. J. Hydraul. Eng. 2009, 40, 1299–1306. [Google Scholar]
- Tu, Q.; Yang, L. Sediment Design Manual; China Water & Power Press: Beijing, China, 2006. [Google Scholar]
- Zhou, Z.-Q.; Xie, S.-P.; Zhang, R. Historic Yangtze flooding of 2020 tied to extreme Indian Ocean conditions. Proc. Natl. Acad. Sci. USA 2021, 118, e2022255118. [Google Scholar] [CrossRef] [PubMed]
- Lu, X.; Higgitt, D.L. Sediment yield variability in the Upper Yangtze, China. Earth Surf. Process. Landf. 1999, 24, 1077–1093. [Google Scholar] [CrossRef]


| Year | Time of Sand Peak Entering the Reservoir | Amount of Sand Entering Reservoir/104 t | Time of Sand Peak Emerging from Reservoir | Time | Amount of Sand Emerging Reservoir/104 t | Water Level Before Dam/m |
|---|---|---|---|---|---|---|
| 2012 | 14 July to 29 July | 5530 | 45,100 | 20 July to 12 August | 1967 | 158.77 |
| 2013 | 11 July to 18 July | 5740 | 32,000 | 19 July to 26 July | 1760 | 150.00 |
| 2018 | 11 July to 17 July | 7440 | 51,400 | 15 July to 25 July | 2144 | 152.94 |
| 2020 | 13 August to 24 August | 12,650 | 52,200 | 17 August to 24 September | 3390 | 160.81 |
| Name | Data Type | Time Series | River (Lake) | Source |
|---|---|---|---|---|
| Zhutuo | Q, SC, Z | 1900~2022 | Yangtze Rive | Bureau of Hydrology, Changjiang Water Resources Commission |
| Beibei | Jiangling River | |||
| Wulong | Wu River | |||
| Cuntan | Yangtze Rive | |||
| Qingxichang | ||||
| Wanxian | ||||
| Huanglingmiao | 2002~2022 |
| Year | CT Station | HLM Station |
|---|---|---|
| 2012 | 22 July to 27 July | 25 July to 5 August |
| 2013 | 10 July to 18 July | 17 July to 30 July |
| 2018 | 10 July to 21 July | 16 July to 27 July |
| 2020 | 12 August to 29 August | 17 August to 16 September |
| Number | Year | Time |
|---|---|---|
| 1 | 2003 | 30 August to 6 September |
| 2 | 2005 | 18 July to 26 July |
| 3 | 2005 | 9 August to 22 August |
| 4 | 2007 | 25 August to 2 August |
| 5 | 2008 | 6 August to 18 August |
| 6 | 2009 | 30 July to 10 August |
| 7 | 2009 | 15 August to 23 August |
| 8 | 2010 | 17 July to 24 July |
| 9 | 2010 | 20 August to 28 August |
| 10 | 2012 | 26 June to 6 July |
| 11 | 2012 | 22 July to 28 July |
| 12 | 2013 | 10 July to 18 July |
| 13 | 2018 | 10 July to 19 July |
| Scheme | Discharge (m3/s) | The Highest Water Level After the First Flood Peak (m) | The Highest Water Level After the Second Flood Peak (m) | ||
|---|---|---|---|---|---|
| Flood Detention Period | Sediment Transport Period | Sediment Discharge Period | |||
| 1 | 30,000 | 30,000 | 37,500 | 149.51 | 150.38 |
| 2 | 24,000 | 37,500 | 37,500 | 153.04 | 150.55 |
| 3 | 24,000 | 24,000 | 42,000 | 154.20 | 153.76 |
| Scheme | Flood Detention Period (×104 t) | Sediment Transport Period (×104 t) | Sediment Discharge Period (×104 t) | Total Sediment Load (×104 t) | Sand Peak (kg/m3) | Sand Load Ratio (%) |
|---|---|---|---|---|---|---|
| 1 | 260 | 532 | 1994 | 3317 | 0.88 | 49 |
| 2 | 223 | 518 | 1969 | 3245 | 0.85 | 48 |
| 3 | 223 | 284 | 1947 | 3018 | 0.78 | 45 |
| Scheme | Discharge Flow (m3/s) | Maximum Water Level (m) | |
|---|---|---|---|
| Flood Detention Period | Sediment Discharge Period | ||
| 1 | 39,500 | 39,500 | 156.95 |
| 2 | 50,000 | 35,000 | 153.26 |
| 3 | 34,000 | 47,000 | 162.51 |
| Scheme | Flood Detention Period (104 t) | Sediment Discharge Period (104 t) | Late Effects (104 t) | Total Sediment Load (104 t) | Sand Peak in Front of the Dam (kg/m3) | Sediment Discharge Ratio |
|---|---|---|---|---|---|---|
| 1 | 1243 | 1953 | 597 | 3792 | 1.09 | 35% |
| 2 | 1460 | 2228 | 559 | 4247 | 1.33 | 39% |
| 3 | 897 | 1714 | 623 | 3234 | 0.85 | 30% |
| Index | CT Station | HLM Station | Sediment Discharge Ratio | ||||||||
|---|---|---|---|---|---|---|---|---|---|---|---|
| Peak Time | Sand Peak (kg/m3) | Time Duration (d) | Sediment Load (104 t) | Average Flow (m3/s) | Peak Time | Sand Peak (kg/m3) | Time Duration (d) | Sediment Load (104 t) | Average Flow (m3/s) | ||
| 1 | 28 July 2007 | 4.72 | 8 | 4034 | 27,467 | 3 August 2007 | 1.4 | 10 | 2370 | 38,336 | 59% |
| 2 | 10 August 2008 | 3.89 | 12 | 4353 | 25,785 | 17 August 2008 | 0.58 | 14 | 1427 | 31,493 | 33% |
| 3 | 3 August 2009 | 2.17 | 12 | 4558 | 33,538 | 9 August 2009 | 0.787 | 13 | 1759 | 33,779 | 39% |
| 4 | 18 August 2009 | 1.17 | 8 | 1612 | 26,611 | 26 August 2009 | 0.315 | 9 | 478 | 27,740 | 30% |
| 5 | 19 July 2010 | 2.53 | 7 | 4238 | 40,288 | 23 July 2010 | 0.475 | 8 | 1072 | 38,444 | 25% |
| 6 | 22 August 2010 | 2.19 | 8 | 3569 | 32,022 | 31 August 2010 | 0.222 | 14 | 440 | 26,193 | 12% |
| 7 | 24 July 2012 | 2.60 | 8 | 3656 | 46,717 | 28 July 2012 | 0.414 | 11 | 1333 | 41,067 | 36% |
| 8 | 13 July 2013 | 6.42 | 8 | 5828 | 28,778 | 21 July 2013 | 1.19 | 10 | 2340 | 32,569 | 40% |
| 9 | 13 July 2018 | 6.69 | 11 | 7360 | 41,117 | 19 July 2018 | 1.21 | 12 | 2167 | 34,592 | 29% |
| 10 | 14 August 2020 | 4.86 | 5 | 3940 | 43,040 | 20 August 2020 | 0.689 | 6 | 1022 | 46,950 | 26% |
| 11 | 20 August 2020 | 3.95 | 12 | 8685 | 44,276 | 26 August 2020 | 0.936 | 12 | 2378 | 34,800 | 27% |
| Index | Mean Water Level in Front of the Dam (m) | Minimum Inlet Flow Value (m3/s) |
|---|---|---|
| 1 | 145 | 25,000 |
| 2 | 150 | 30,000 |
| 3 | 155 | 35,000 |
| 4 | 160 | 40,000 |
| 5 | 165 | 45,000 |
Disclaimer/Publisher’s Note: The statements, opinions and data contained in all publications are solely those of the individual author(s) and contributor(s) and not of MDPI and/or the editor(s). MDPI and/or the editor(s) disclaim responsibility for any injury to people or property resulting from any ideas, methods, instructions or products referred to in the content. |
© 2025 by the authors. Licensee MDPI, Basel, Switzerland. This article is an open access article distributed under the terms and conditions of the Creative Commons Attribution (CC BY) license (https://creativecommons.org/licenses/by/4.0/).
Share and Cite
Dong, B.; Zhu, L.; Ren, S.; Yuan, J.; Lv, C. Sediment Flushing Operation Mode During Sediment Peak Processes Aiming Towards the Sustainability of Three Gorges Reservoir. Sustainability 2025, 17, 6836. https://doi.org/10.3390/su17156836
Dong B, Zhu L, Ren S, Yuan J, Lv C. Sediment Flushing Operation Mode During Sediment Peak Processes Aiming Towards the Sustainability of Three Gorges Reservoir. Sustainability. 2025; 17(15):6836. https://doi.org/10.3390/su17156836
Chicago/Turabian StyleDong, Bingjiang, Lingling Zhu, Shi Ren, Jing Yuan, and Chaonan Lv. 2025. "Sediment Flushing Operation Mode During Sediment Peak Processes Aiming Towards the Sustainability of Three Gorges Reservoir" Sustainability 17, no. 15: 6836. https://doi.org/10.3390/su17156836
APA StyleDong, B., Zhu, L., Ren, S., Yuan, J., & Lv, C. (2025). Sediment Flushing Operation Mode During Sediment Peak Processes Aiming Towards the Sustainability of Three Gorges Reservoir. Sustainability, 17(15), 6836. https://doi.org/10.3390/su17156836