1. Introduction
Consumers are confronted every day with terms such as ‘sustainability’, ‘green products’, ‘environmentally friendly’ and many others. Currently, there are several definitions of sustainability but the most widely used are the Brundtland definition, which states that sustainable development is development that meets the needs of the present without compromising the ability of future generations to meet their own needs [
1], and the University of California, Los Angeles (UCLA) Sustainability Committee definition, which defines sustainability as the integration of environmental health, social equity, and economic vitality in order to create thriving, healthy, diverse, and resilient communities for this generation and generations to come. The practice of sustainability recognises how these issues are interconnected and requires a systematic approach and an acknowledgement of complexity [
2].
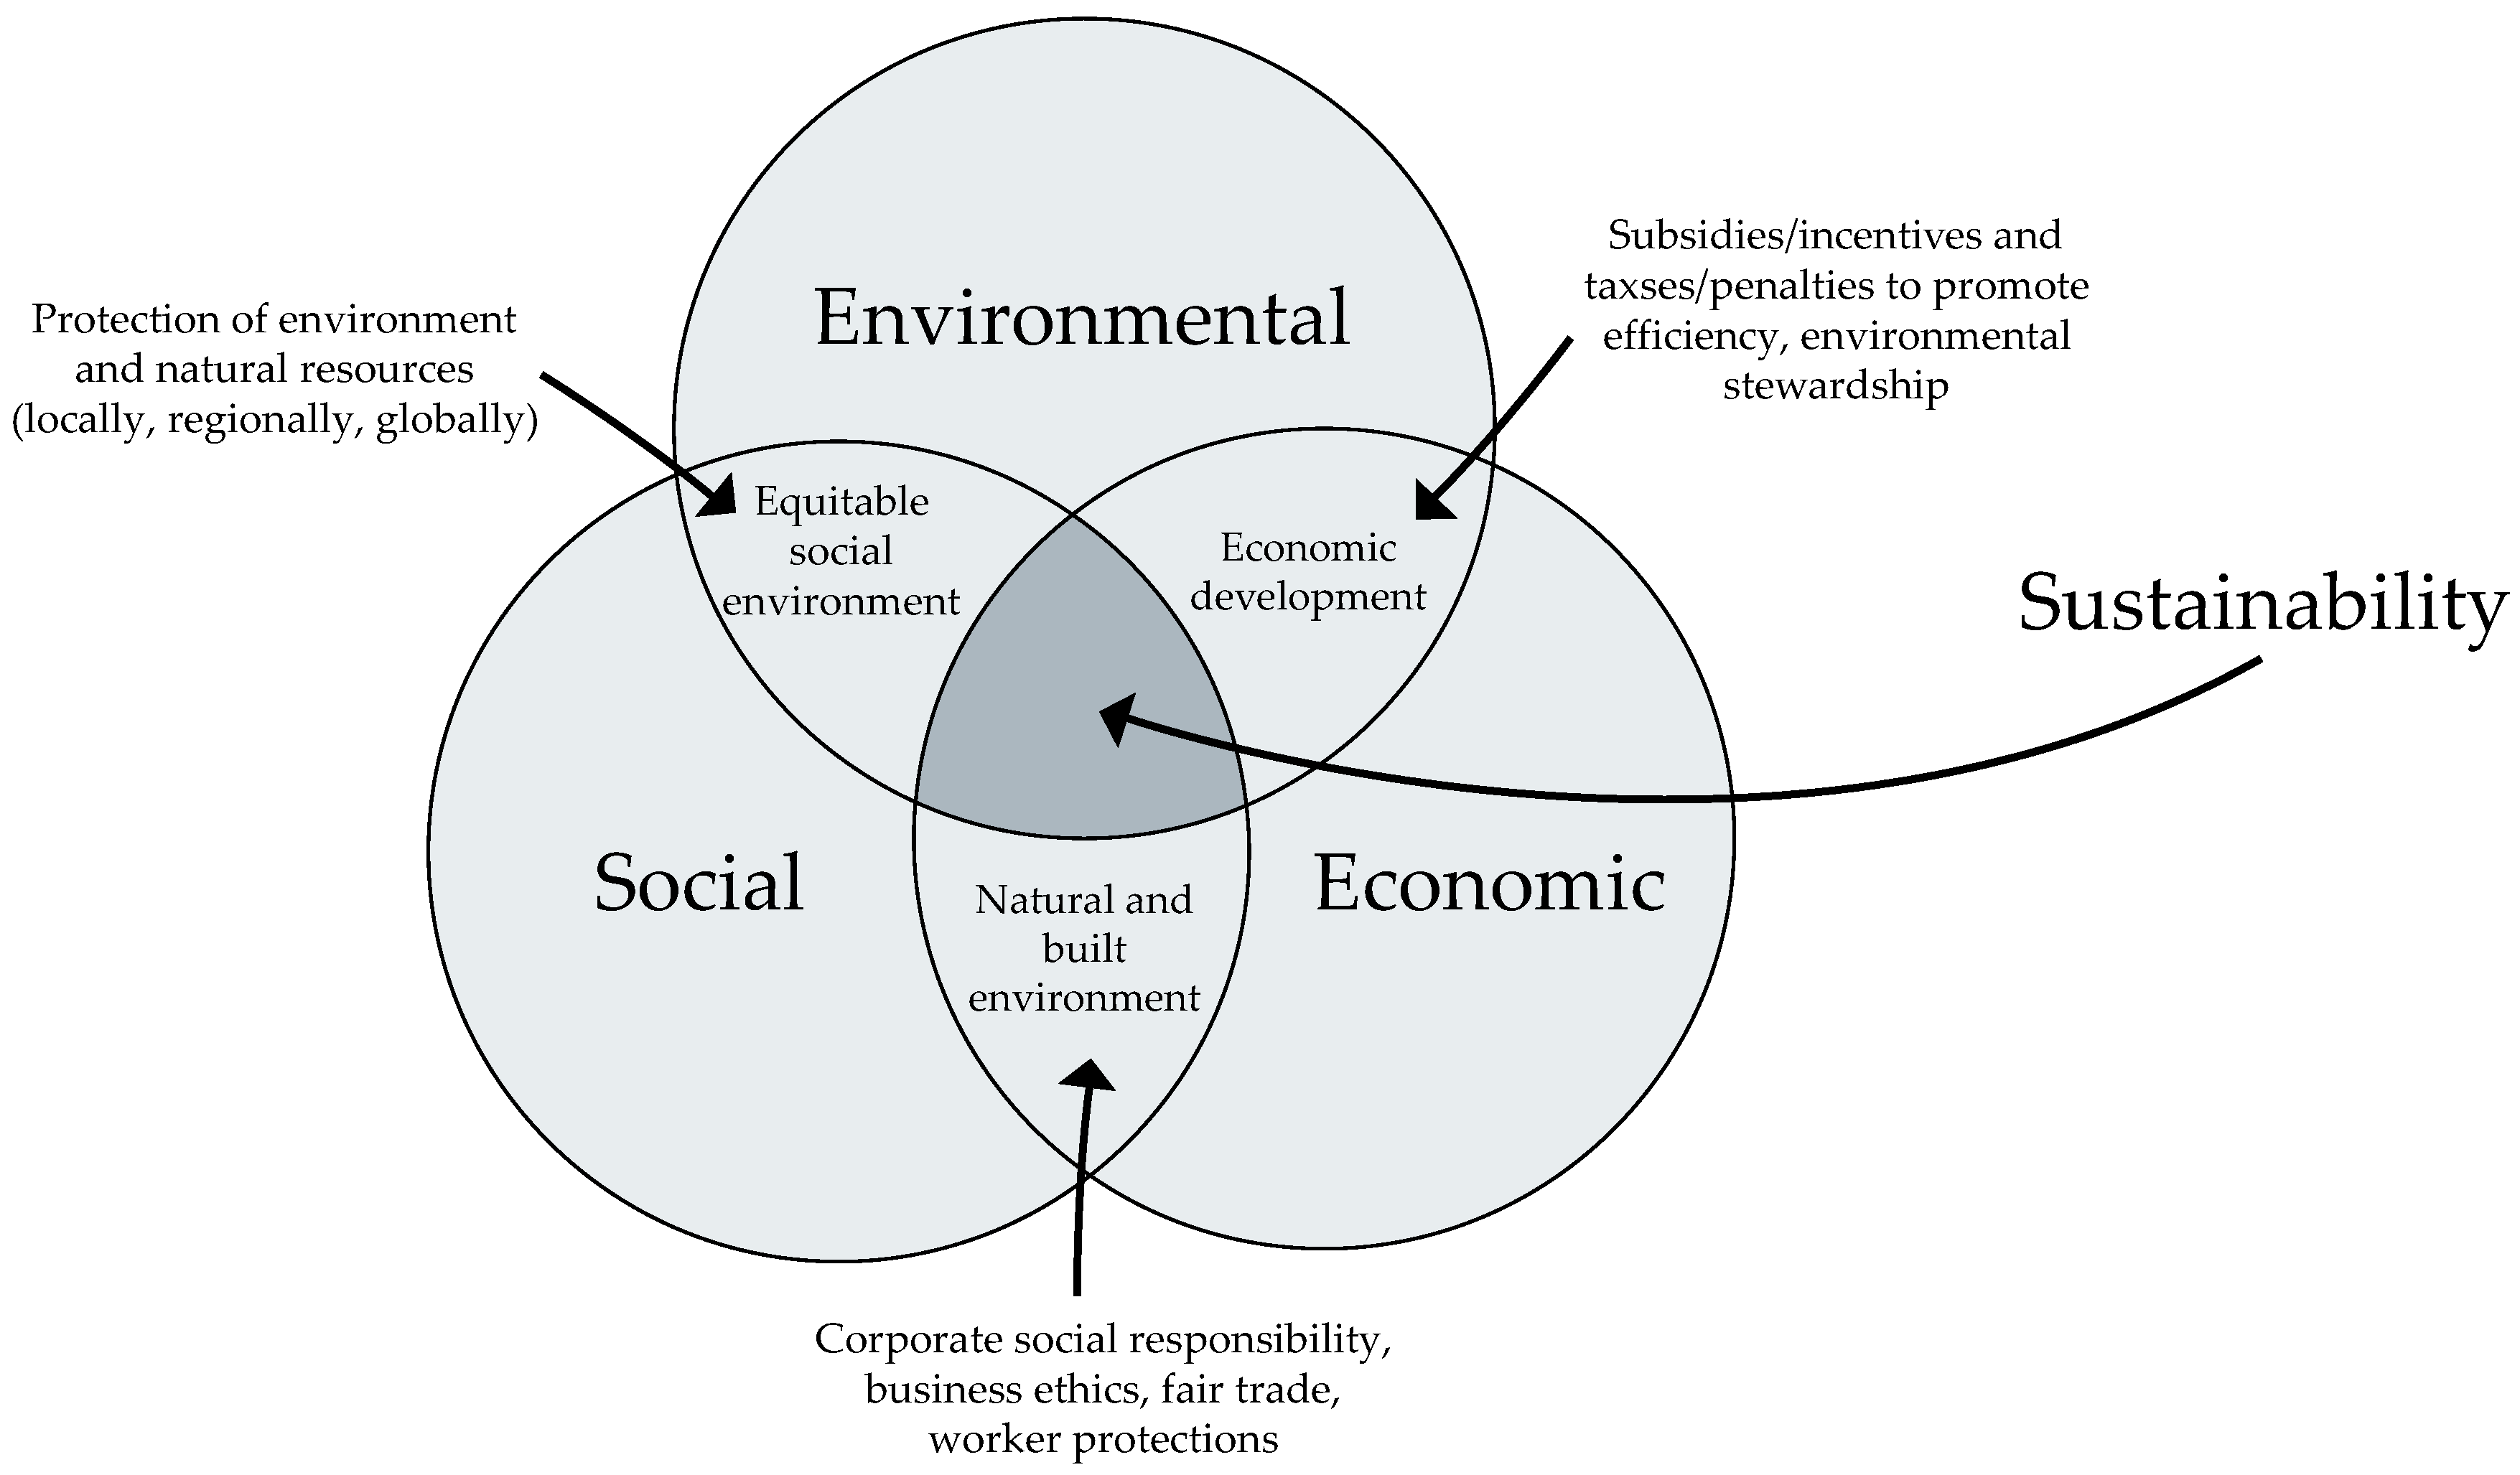
Sustainability not only refers to the environment, but also to society and economy. Although environmental challenges are often at the forefront of today’s discussions they cannot be considered separately, as they are closely linked to economic and social challenges. The three dimensions of sustainability must accordingly be understood as a system, whereby interrelationships must be considered to make efficient decisions (
Figure 1) [
3].
As presented in
Figure 1 the environmental dimension of sustainable development focuses on enhancing environmental productivity to meet human needs without causing harm. It aims to improve the resilience of ecosystems and shorten their regeneration periods. In the social dimension, attention is given to the fair allocation of roles and resources to stakeholders to promote integrity and stability. Finally, the economic dimension emphasises investing in resources to enhance productivity, determining the quantity of resources necessary to ensure the companies’ survival, and managing these resources efficiently to support long-term sustainability [
3].
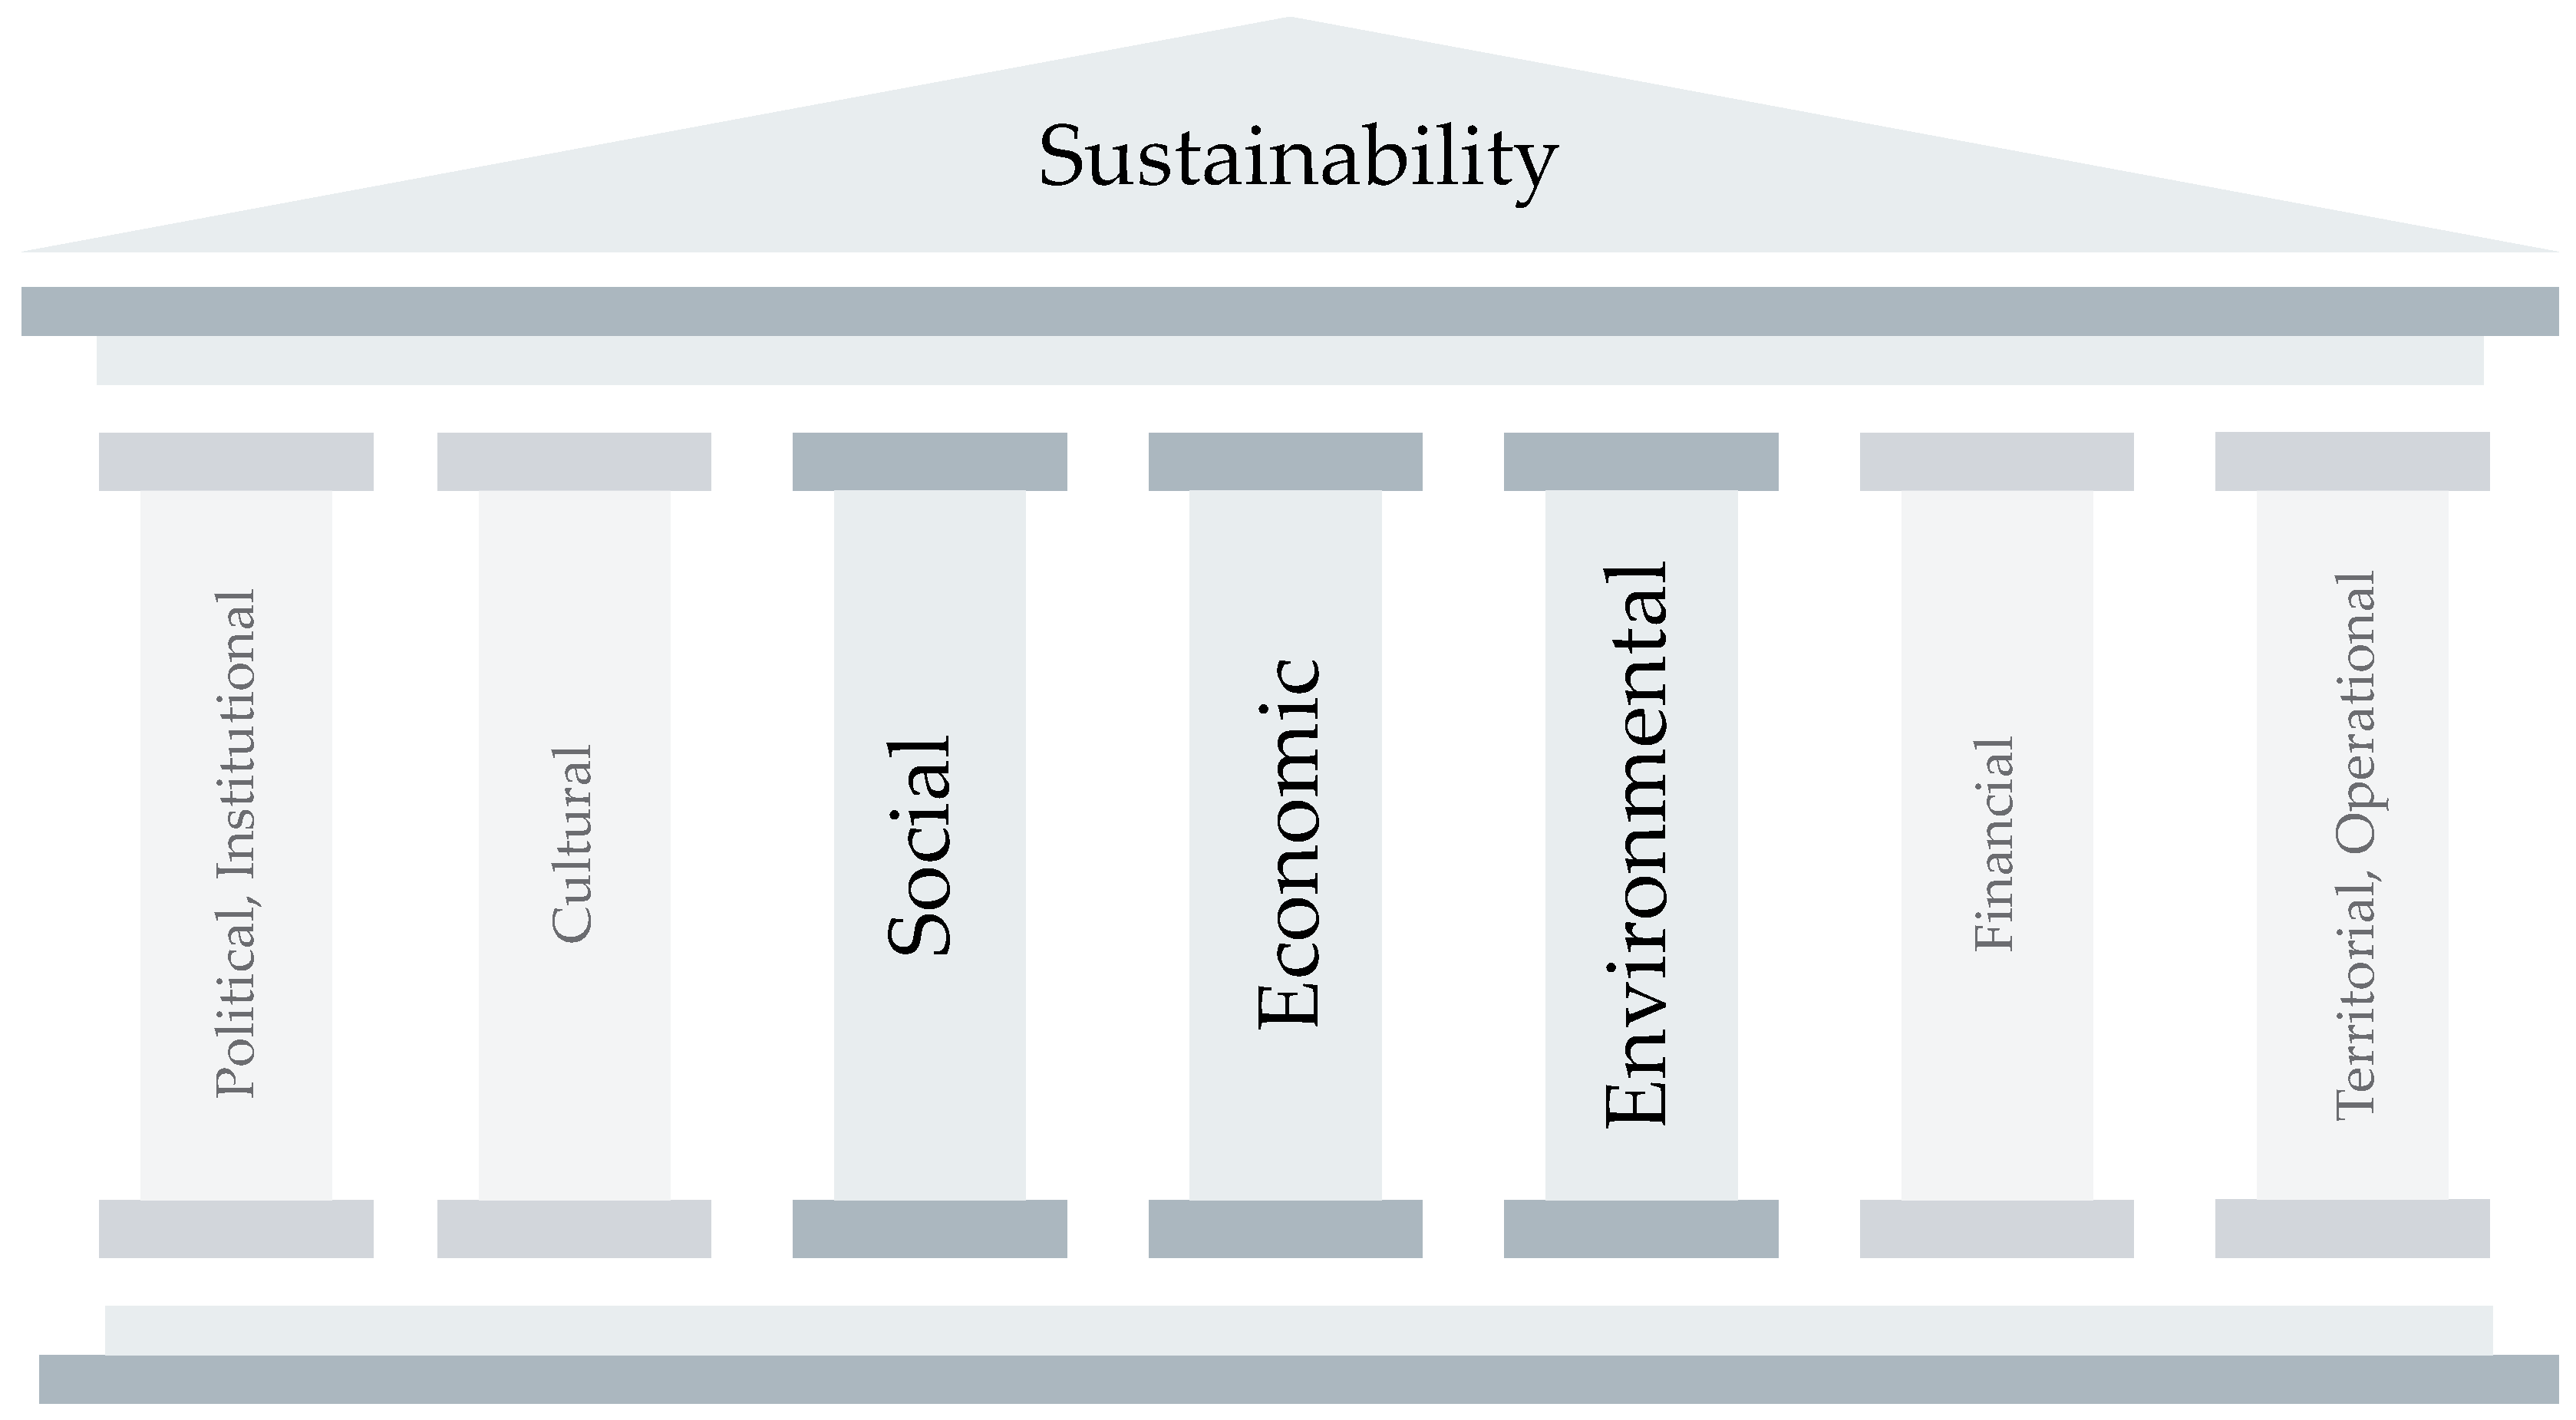
Different organisations, associations and companies define sustainability differently. It could be divided into three pillars: (a) environmental; (b) social, and (c) governance, as set in ESG standards [
5]. Sumatec Oil & Gas, a gas company, categorises sustainability development goals into four pillars: (a) government; (b) economic; (c) social; and (d) environmental [
6]. Lythouse [
7] also adapts a four-pillar approach, focusing on the following aspects: (a) environmental; (b) economic; (c) social; and (d) cultural. Hauschild et al. [
8] define sustainability as: (a) measures of welfare; (b) inter-generational equity; (c) intra-generational equity; and (d) interspecies equity [
8]. For the energy sector Zen et al. [
9] propose five pillars of sustainability: (a) economic; (b) social; (c) territorial; (d) political; and (e) environmental. Dangone Cement, Sub-Saharan Africa’s leading cement company, supports a seven pillars model: (a) financial; (b) institutional; (c) economic; (d) operational; (e) cultural; (f) environmental; and (g) social [
10]. Despite the various models, the most used framework is the three-pillar model (environmental, social, economic), shown in
Figure 1 and
Figure 2. Although many different sustainability pillars could be considered, this study only focuses on the environmental dimension.
Shopping today can be a challenge. There are so many products on the market that it is almost impossible to distinguish among them. To stand out, many brands now promote themselves as green or stress their environmental credentials via ecolabelling [
11]. According to the Ecolabel Index [
12], the global directory of eco-labels, currently 456 different eco-labels in 199 countries were detected, which are used across 25 different industry sectors [
12]. Currently the most commonly used eco-labels are: (a) the EU Ecolabel, for products and services meeting high environmental standards through their life cycle [
11]; (b) Energy star, for energy-efficient appliances and buildings [
13]; (c) Fairtrade, denoting fair wages and sustainable practices for farmers and workers in developing countries [
14]; (d) United States department of agriculture (USDA) Organic, indicating products grown without synthetic pesticides (GMO) or chemical fertilisers [
15]; and (e) Blue angel, for environmental friendly products [
16]. It is difficult for consumers to make a proper decision about which eco-labels to trust, and, in addition to the reliable ones listed above, there are plenty of unreliable eco-labels. Consumers can be misled by the companies trying to give a false impression of their environmental impacts or benefits, which is known as greenwashing [
17]. For example, claims regarding the environmental benefits of biodegradable products are often the subject of greenwashing. Biodegradable plastics do not degrade unless they are in ideal environmental conditions [
18]. By misleading the public to believe that a company or other entity is undertaking more to protect the environment, greenwashing promotes false solutions to the climate-change issues that distract and delay concrete and credible action [
19].
Claiming that something is ‘green’ and ‘sustainable’ has become a competitive factor, as the demand for green products is higher than the demand for standard products. Directive 2024/825 [
17] on empowering consumers for the green transition amends Directive 2005/29/EC [
20] by setting out a number of specific recommendations on environmental claims and it proposes the prohibition of generic environmental claims which are not based on recognised excellent environmental performance. Examples of such generic environmental claims are ‘eco-friendly’, ‘eco’, ‘green’, ‘nature’s friend’, ‘ecological’ and ‘environmentally correct’ [
17].
The European Commission carried out two inventories of environmental claims: one in 2014 and another one in 2020. The studies looked at a sample of 150 environmental claims for a wide range of products against the principles of the Unfair Commercial Practices Directive (UCPD): clarity, unambiguity, accuracy, and verifiability. The study from 2020 found that a considerable share of environmental claims (53.3%) provides vague, misleading, or unfounded information about products’ environmental characteristics across the EU and across a wide range of product categories. The environmental claims inventory study from 2020 also analysed the substantiation of such claims, looking at their clarity, accuracy, and the extent to which they are substantiated with evidence that can be verified. The analysis found that 40% of claims were unsubstantiated. These results have also been confirmed by the Consumer Protection Cooperation authorities in research carried out in November 2020. Out of the 344 sustainability claims assessed, authorities considered that in over half of the cases (57.5%), companies did not provide sufficient elements allowing for judgement of the claim’s accuracy. In many cases, authorities had difficulties identifying whether the claim covered the whole product or only one of its components (50%), whether it referred to the company itself or only certain products (36%), and which stage of the product’s lifecycle it covered (75%) [
21].
To be in accordance with the Green Claim Directive (currently in a proposal phase) [
21] all statements will need to be proven by assessing the environmental impacts of products, technologies, or companies. Currently, there are various methods to measure environmental impact focusing on different aspects of environmental degradation or sustainability. Examples of such single-issue methods are: (a) carbon footprint analysis, which quantifies the total greenhouse gases (GHG) emitted directly and indirectly [
22]; (b) water footprint, which assesses the volume of freshwater used directly and indirectly [
23]; and (c) Environmental Risk Assessment (ERA), which analyses potential ecological and health risk from activities, chemicals, or policies [
24]. The only method that provides a comprehensive assessment of environmental impact is life cycle assessment (LCA), which covers a wider range of environmental indicators. Depending on the life cycle impact assessment (LCIA) method used, the number of environmental indicators can range from 1 to 25 or more.
LCA is broadly used in, e.g., research and development, strategic planning, the comparison of product and services, ‘green’ marketing, and hot-spot analysis [
25]. It enables the evaluation of the environmental impact of products or services from raw materials extraction through production, use, and disposal. LCA is the most comprehensive, internationally standardised methodology and allows environmental impact to be assessed from multiple perspectives. LCA becomes a key to: (a) regulations such as eco-design and the digital passport; (b) effective communication of product sustainability performances; (c) corporate sustainability disclosures, and (d) development of effective product-based sustainability strategies [
26].
In recent years, some research has been carried out regarding the relevance of LCA in different countries and industries [
27,
28,
29]. Subal et al. [
27] have investigated the relevance of LCA to decision-making in companies and public authorities in Switzerland, where half of the surveyed organizations use LCA frequently in decision-making, while the other half of the surveyed organisations implement LCA in a few decision situations [
27]. Basañez et al. [
28] have explored usage of LCA by companies in the Basque region, finding that half of the companies included in the study acknowledge that they have conducted just one or two LCA studies [
28]. A study by Almeida et al. [
29] has analysed the reduction of environmental impact due to the use of LCA in Brazil. The study showed that 38.4% of the surveyed companies use life cycle thinking in their actions and 20.5% effectively use LCA in their management [
29]. It seems that in Slovenia requests for the LCA studies comes from export-oriented enterprises as the request of foreign buyers [
30].
The most common reason for poor LCA implementation in large companies is the low priority of environmental aspects. Companies rather preferred certifications related to forestry, food, social responsibility, and agricultural certificates [
29]. Other reasons for not considering LCA results are the complexity of LCA, where it is difficult to obtain data on the impact of the entire product life cycle and applying the results to the environmental improvement of products [
29], and the high costs of carrying out the LCA analysis [
27].
Scientific studies showed that companies disclose different information regarding the environmental impacts of their products, where the most disclosed data deal with climate change [
31]. A Finnish Environment Institute survey of 20 multinational companies from chemical, electronics, automotive, and paper production sectors showed that most of the companies report on impacts related to climate change, acidification, eutrophication, and energy consumption, while only one company reports impacts on biodiversity [
32]. Similar results are also reported for the Basque region [
28].
Agriculture is a sector in which conducting an LCA assessment is a challenge since agriculture is very intensive in terms of land use, and its production heavily relies on natural resources (e.g., soil, water availability, weather, pests) [
33]. Other challenges are (a) data availability and quality and requesting in-depth research to understand underlaying processes on the farm [
34]; (b) different yields and livestock productivity, which are highly dependent on the agricultural systems and the influence of weather conditions [
33]; (c) the complexity of food-supply chains, where food processing, transportation and retail stages can complicate LCAs [
35]; and (d) the impact of indirect emissions. Agriculture often involves direct or indirect land-use change (e.g., deforestation for cropland), which can have significant but hard-to-quantify effects on carbon emissions, biodiversity, and water cycles. The indirect effects of changing land use are especially difficult to capture in an LCA [
36]. LCA studies on food pose a particular challenge because the databases on agricultural production, which is responsible for 50% to 80% of the environmental impacts associated with food products [
37], are often inadequate [
38]. When assessing food, it is common to define the system boundaries from ‘field to fork’ rather than taking the standardised ‘cradle to grave’ approach.
The major problem in agriculture is the proper definition of a functional unit, which reflects a product’s function. In agriculture, a functional unit can be defined as (a) a certain mass of product (mostly expressed as 1 kg or 100 g); (b) the hectare yield in crop production; and (c) food quantity per unit of energy or nutrition value [
33]. From the consumer’s perspective, the primary function of food products is to provide sufficient energy and nutrients to the human body, leading to the functional unit defined as food quantity per unit of energy or nutrition value (mostly expressed as kcal or kJ) [
8].
The usage of the appropriate functional unit is critical as it influences the LCA results. Heller et al. [
39] highlighted the challenges in selecting the proper functional unit for food systems at the diet level and discussed the fact that both the environmental impact assessment as well as the nutrition assessment should be conducted together. Nguyen et al. [
40] compared functional unit per kilogram of beef and per protein unit’ meanwhile Cerutti et al. [
41] discussed the diversity of functional units used in the fruit production system, from per kilogram of fruit to per orchard area. Hauschild et al. [
8] highlighted that it is often relevant to express the LCA results by different functional units within the same study to give a fair picture of the compared food products, especially in the case of highly contrasted intensification levels [
8].
This paper aims to address the gap of defining the proper functional unit by focusing on environmental impacts caused by the production of different food items. The paper specifically examines how the choice of functional unit influences LCA outcomes in agriculture, with a special focus on the human health endpoint impact category. The disclosure of results pertaining to damage to human health is important since these results are often easily comprehensible to consumers [
42]. The disclosure of such results is frequently overlooked and they are not presented in environmental reports, while methods for life cycle impact assessment which do not consider damage to human health are used more often.
2. Methods
The environmental performance of food products was assessed by the LCA method, with a special focus on damage to human health. The LCAs were performed in accordance with the international standards ISO 14040 [
43] and ISO 14044 [
44].
The goal and scope definition of the LCA is as follows. This study emphasises the importance of proper selection of functional unit when conducting environmental assessments in the agricultural sector. The analysis focused on the production of different types of vegetables, fruit, and ready meals, within system boundaries from ‘field to fork’. Processes such as farmland cultivation, plant growth, and processing of these plants into finished products were considered. Three types of vegetables, four types of fruit, and four types of ready meals were included in this assessment. Two different functional units were used in the LCA modelling: (a) based on product mass (100 g of food product) and (b) based on product energy value (mass of the food product that corresponds to 2000 kcal (equal to 8368 kJ of food product).
For the life cycle inventory analysis (LCI), the data collection was based on available datasets from the Agribalyse 3.0 database [
37]. For vegetables and fruit, only datasets that encompass the cultivation and harvesting stages were considered. In contrast, the datasets for ready meals include comprehensive processing steps in which the ingredients are converted into end products. Although Agribalyse is a robust dataset, it is primarily based on French inventory data, which may limit the generalisability of the results to other countries or contexts. Food production has geographically determined specifics, related to agricultural practices, climatic conditions, variety of energy-mixes included into food-production processes, and many other factors, and therefore the assessment of the environmental impacts of food products should be performed for each specific case separately. Energy values for different types of food, also known as caloric values, were taken from the FoodData Central [
45], an U.S. Department of Agriculture, Agriculture Research Service database [
46], or from the Nutritionix database [
47], developed by Syndigo, Chicago, IL, USA, a company that develops platforms to manage business data for retailers and brands [
47]. For the purposes of this study, we assumed a standardised daily person’s calorie requirement to be 2000 kcal (equal to 8368 kJ) [
48].
During the life cycle impact assessment (LCIA) phase, the analysis was carried out using SimaPro Analyst 9.0.5.2 software, developed by Pré Sustainability, Amersfoort, The Netherlands, where the global impact assessment method IMPACT World+ endpoint V1.03 was employed as it considers only two damage categories. This method comprises 17 impact categories, such as climate change, photochemical oxidant formation, ionizing radiation, ozone layer depletion, human toxicity cancer, human toxicity non-cancer, particulate matter formation, water availability, marine acidification, freshwater ecotoxicity, freshwater acidification, terrestrial acidification, freshwater eutrophication, marine eutrophication, land transformation, land occupation, thermally polluted water, and 2 damage categories of human health and ecosystem quality. Total environmental damage consists of damage to human health and damage to ecosystem quality where the human health damage category has assigned a weighting factor of 80%, while the ecosystem quality damage category has been weighted at 20%. The choice of weighting reflects the prioritisation of human health impacts in this method [
49].
For the life cycle assessment result interpretation, LCA results were collected and analysed for groups of comparable products on the basis of the same product weight and energy values, respectively. Additionally, the food products were analysed regarding the farming system used for their production.
3. Results and Discussion
The study examined the environmental impact of 11 different types of food products, comprising three types of vegetables, four types of fruit, and four examples of ready meals (
Table 1). The selection of food products was based on the availability of data in the Agribalyse 3.0 database [
37]. This database is currently the most accurate and comprehensive database for performing LCA studies in the agriculture and food processing sector.
The Agribalyse 3.0 database [
37] is primarily focussed on French agricultural production. Beside that some datasets for the major food producers at the global level, such as Netherlands, Spain, India, China, Brazil, and others, can also be found. The database contains more than 2500 datasets on food products [
37]. To ensure a consistent assessment of the environmental impact of each food type, the same database was used, although other databases, such as Ecoinvent, also exist. The Ecoinvent database, version 3.11, is currently the most comprehensive life-cycle inventory database, consisting of more than 25,000 datasets [
50]. Based on preliminary calculations the Agribalyse 3.0 database was selected for this study because it includes more in-depth data related to the agriculture sector than the Ecoinvent 3.11 database.
Datasets for fruit and vegetables included all agriculture related operations till the fruit or vegetables are harvested on the farm in France. Datasets for ready meals included the production of the ingredients and their processing into the end product, including the heating, mixing, and cooling processes in the production facilities. Transport to supermarkets and consumers and data on secondary and tertiary packaging were not included. Additionally, no preparation of food for consumption by an individual, such as cooking at home, was considered. The life cycle of considered ready meals ended at the producer’s gate.
For each food product evaluated, the energy values were found. The calculation of a person’s daily calorie requirement depends on several factors, including gender, height, weight, and level of daily physical activity. For the purposes of this study, we assumed a standardised daily requirement of 2000 kcal, regardless of gender [
48].
The mass per specific food i (
mi,daily) in kilograms was calculated by dividing the daily requirements of energy values (
caldaily) by the energy values of specific food i per 100 g of this food i (
cali/100g), as represented in Equation (1). In the study it is estimated that daily requirements of energy values are obtained solely from one food product.
In the literature many different energy values for apples (5), grapes (2), lettuce (5), and eggs (7) are available. In these cases, an average energy value within each food products was calculated. Although the FoodData Central [
45] provides two sets of energy values for food products, just one with the Atwater General Factors was considered in this study.
Table 1 summarises the energy values for different types of vegetables, fruit, and ready meals in kilocalories (kcal) and in kilojoules (kJ). The energy values were converted from kcal to kJ using a conversion factor of 0.239 kcal/kJ [
51].
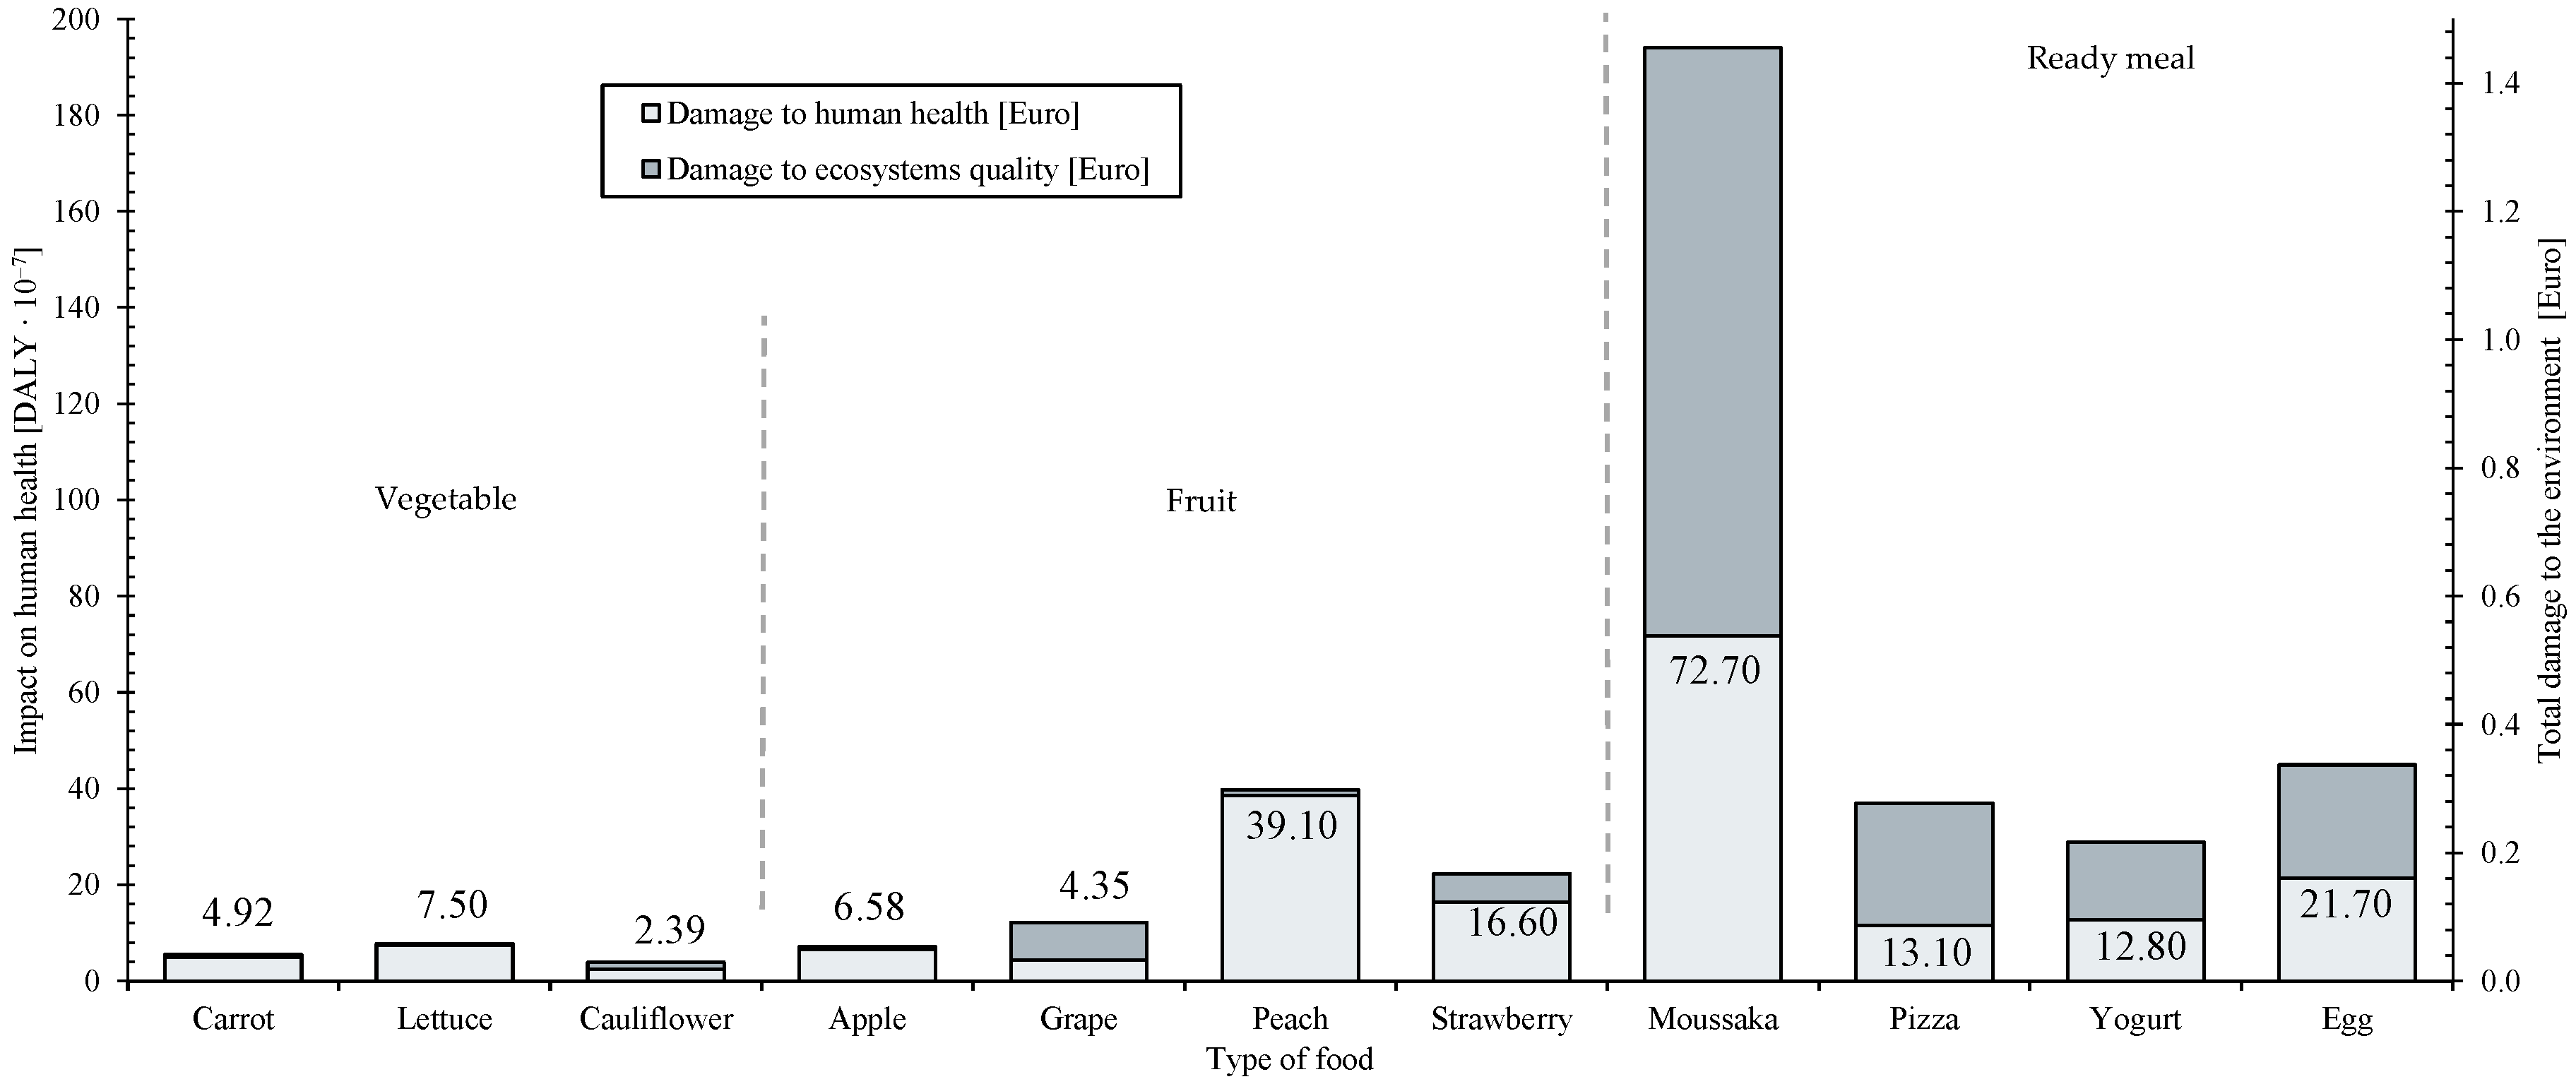
The first functional unit considered was based on the product mass, namely the production of 100 g of the respective food. The results in
Figure 3 show that moussaka production caused the greatest total damage to the environment, followed by peach production, while cauliflower made the smallest contribution. Moussaka consists of at least five different vegetables and two dairy products. Compared to the production of a single vegetable or dairy product, moussaka was expected to have a greater damage to human health as the production of all these meat, vegetables, and dairy products, such as minced meat and eggplant, were considered. Even though the proportion of vegetables in the dish may be lower, the total contribution to human health and total damage to the environment are higher due to the additional processes involved in the preparation and processing of moussaka (e.g., industrial cooking). In the case of pizza, the contribution to human health is lower, and processes such as baking or storing the pizza are not included.
When comparing the total environmental impact, including the damage to the quality of the ecosystem and human health, ready meals have a higher environmental impact than the production of individual fruit or vegetables. For ready meals, the damage to ecosystem quality is greater than the damage to human health, when the IMPACT World+ LCIA method was used, although the weighting factors for human health impact 80% of the total score and just 20% for the ecosystem quality. However, the damage to ecosystem quality for ready meals is significantly higher compared to human health damage, while for fruit and vegetable particular contribution, it is the opposite, meaning that the damage to human health is more significant than the damage to ecosystem quality.
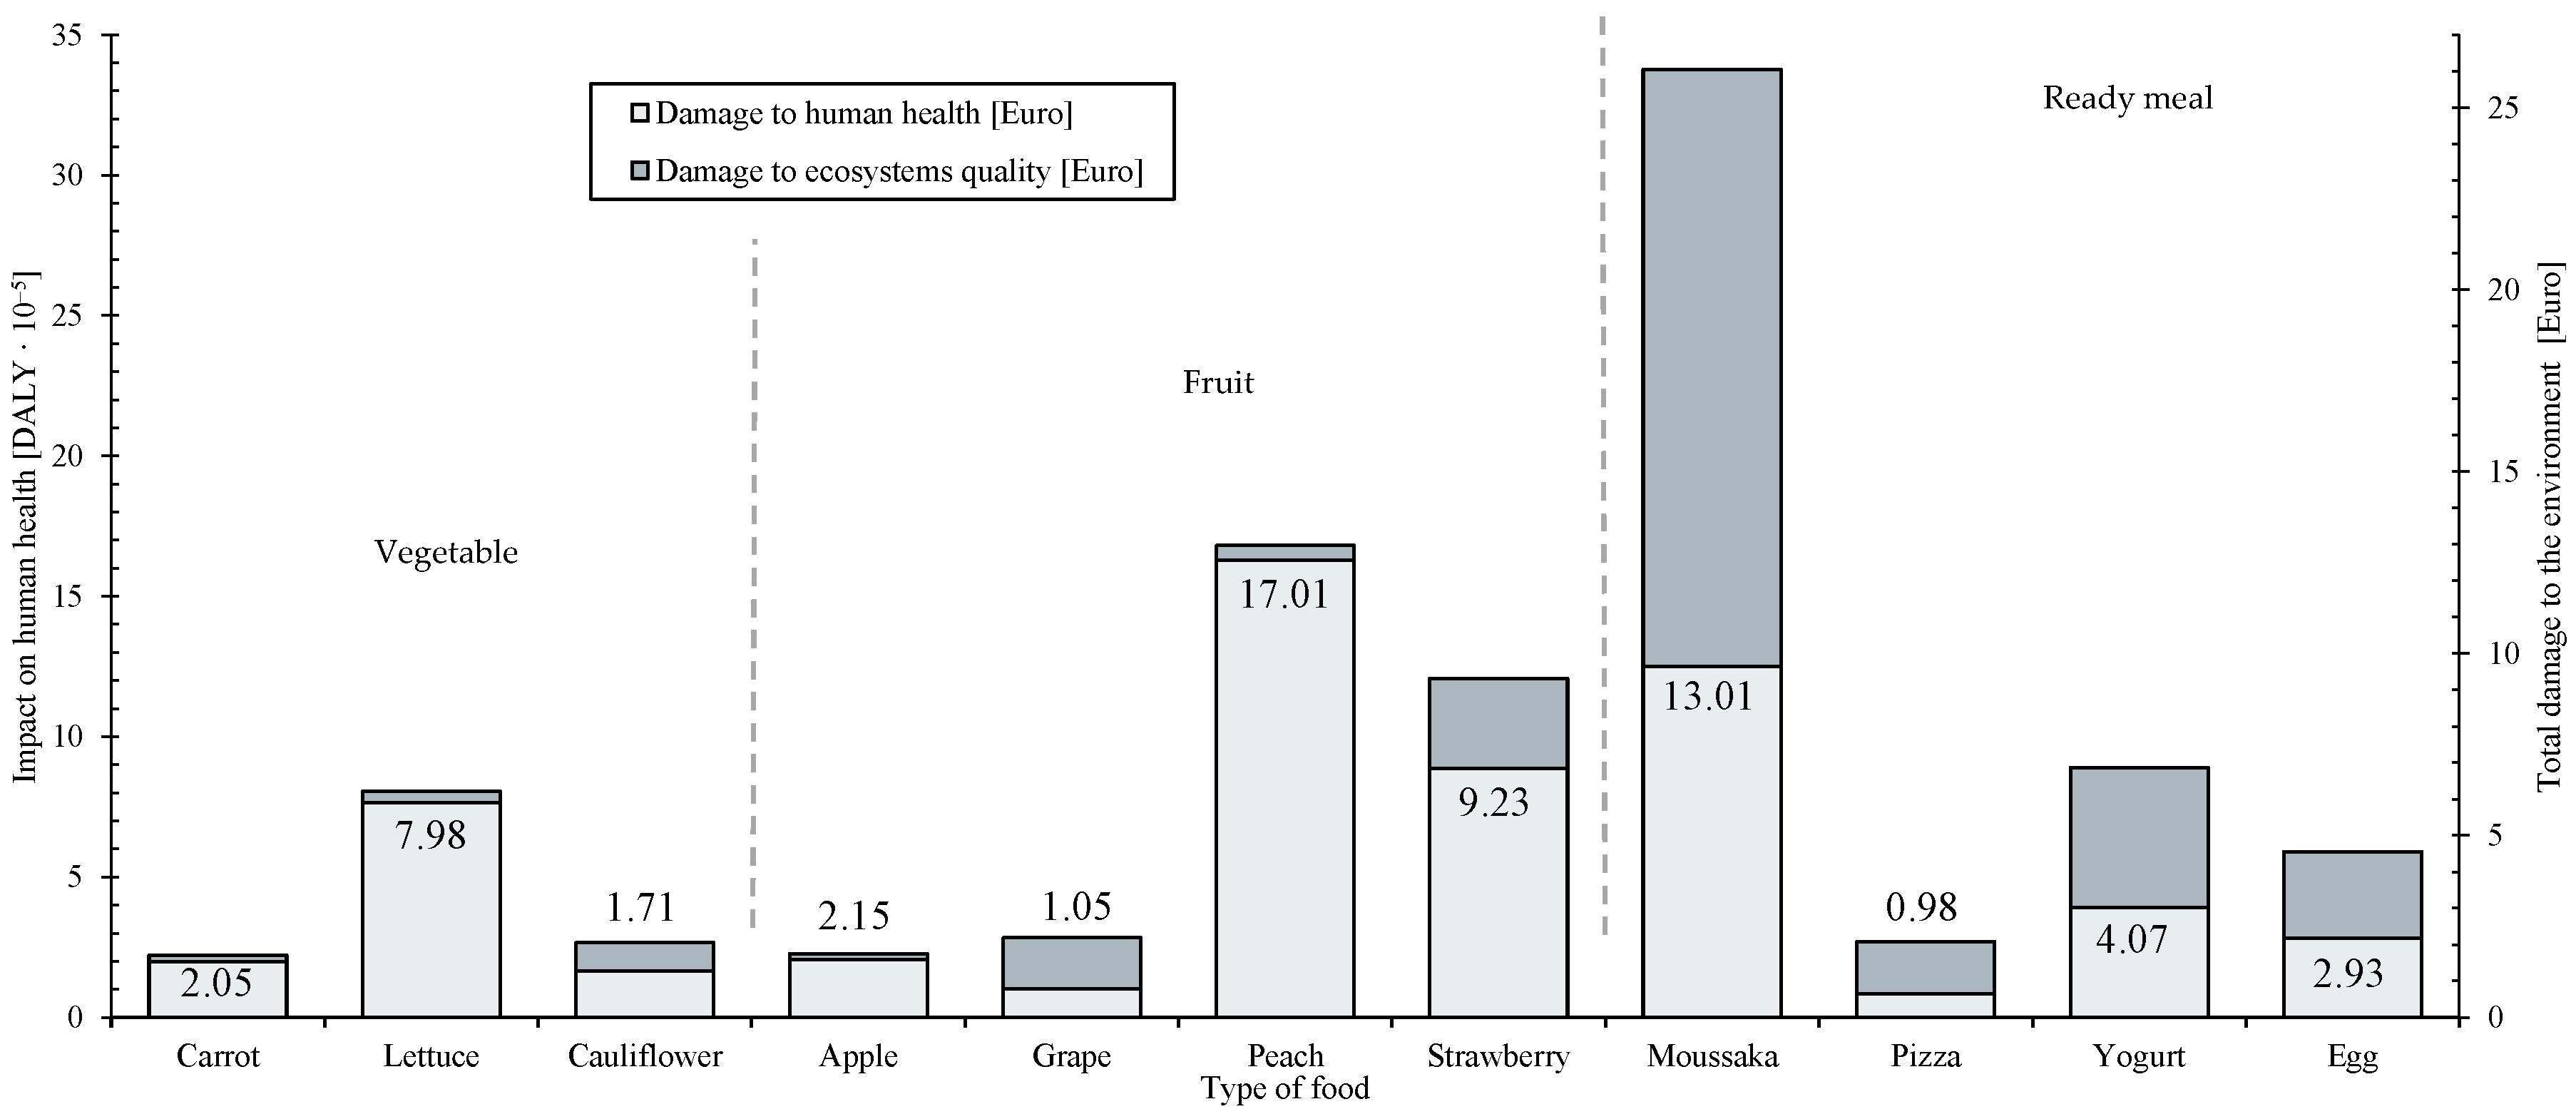
The usage of a mass-based functional unit is not the most practical as it does not consider other aspects like energy value, protein content, or sugar content of food products, and therefore an alternative functional unit was used as well. This alternative approach is based on daily energy intake values mostly related to 2000 kcal, which corresponds to 8368 kJ. In the study we used a simplification regarding the consumer’s daily energy intake. We estimated that no special division per meals was necessary, and the consumer’s daily energy intake was fulfilled with one food product only, although it is known that people do not eat the same food product all day long. This simplification does not affect the validity of the results. From this point of view, 10.64 kg of lettuce was compared with 0.75 kg of pizza, as these quantities of food products have the same energy value.
Figure 4 shows the impact on human health per daily calorie intake, per specific food product.
When comparing only the impact on human health for different types of food products, peach production makes the largest contribution, while pizza production makes the smallest contribution (
Figure 4). The lower contribution of pizza is due to its high energy value, which means that a relatively small amount of pizza slices must be consumed to fulfil the daily energy needs. If the comparison is based on the total damage to the environment, production of moussaka represents the largest environmental burden. The higher total environmental impact of producing moussaka is related to meat production, eggplant production, and the industrial cooking process. The results of
Figure 3 and
Figure 4 cannot be directly compared, as different masses were considered when applying mass-based and energy-value-based functional units. In the case of the mass-based functional unit, all results were calculated per 100 g of food produced. In contrast, the energy-value-based functional unit accounts for the mass required to achieve a daily intake of 2000 kcal, ranging from 0.75 kg for pizza to 10.64 kg for lettuce. On average, the mass considered in the energy-based assessments is about 40 times higher than that used in the mass-based assessments.
There are currently two main agricultural farming systems: conventional and organic. Food produced organically follows EU Regulation 2018/848 [
52] regarding organic production and labelling of organic products. Organically produced food is defined as food where (a) live organisms and mechanical production methods are used; (b) agricultural practices comply with the principle of the sustainable exploitation of aquatic resources; (c) the use of GMOs and products produced by GMOs are excluded; (d) ionising radiation is forbidden; and (e) the use of fertilisers, herbicides, and pesticides is limited [
52]. Any other farming system in which the above restrictions are allowed produces conventional food. For determination of whether organic farming is less harmful to human health compared to conventional systems, egg production was analysed as an example. In environmental assessment for egg production, the Agribalyse 3.0 datasets were used. Organic egg production refers to farms in France, while conventional egg production covers the average data of free-range and indoor farms, both with and without cages in France. The assessment was carried out using both mass-based and energy-value-based functional units. In the mass-based comparison, 100 g of conventionally produced eggs were compared with 100 g of organically produced eggs.
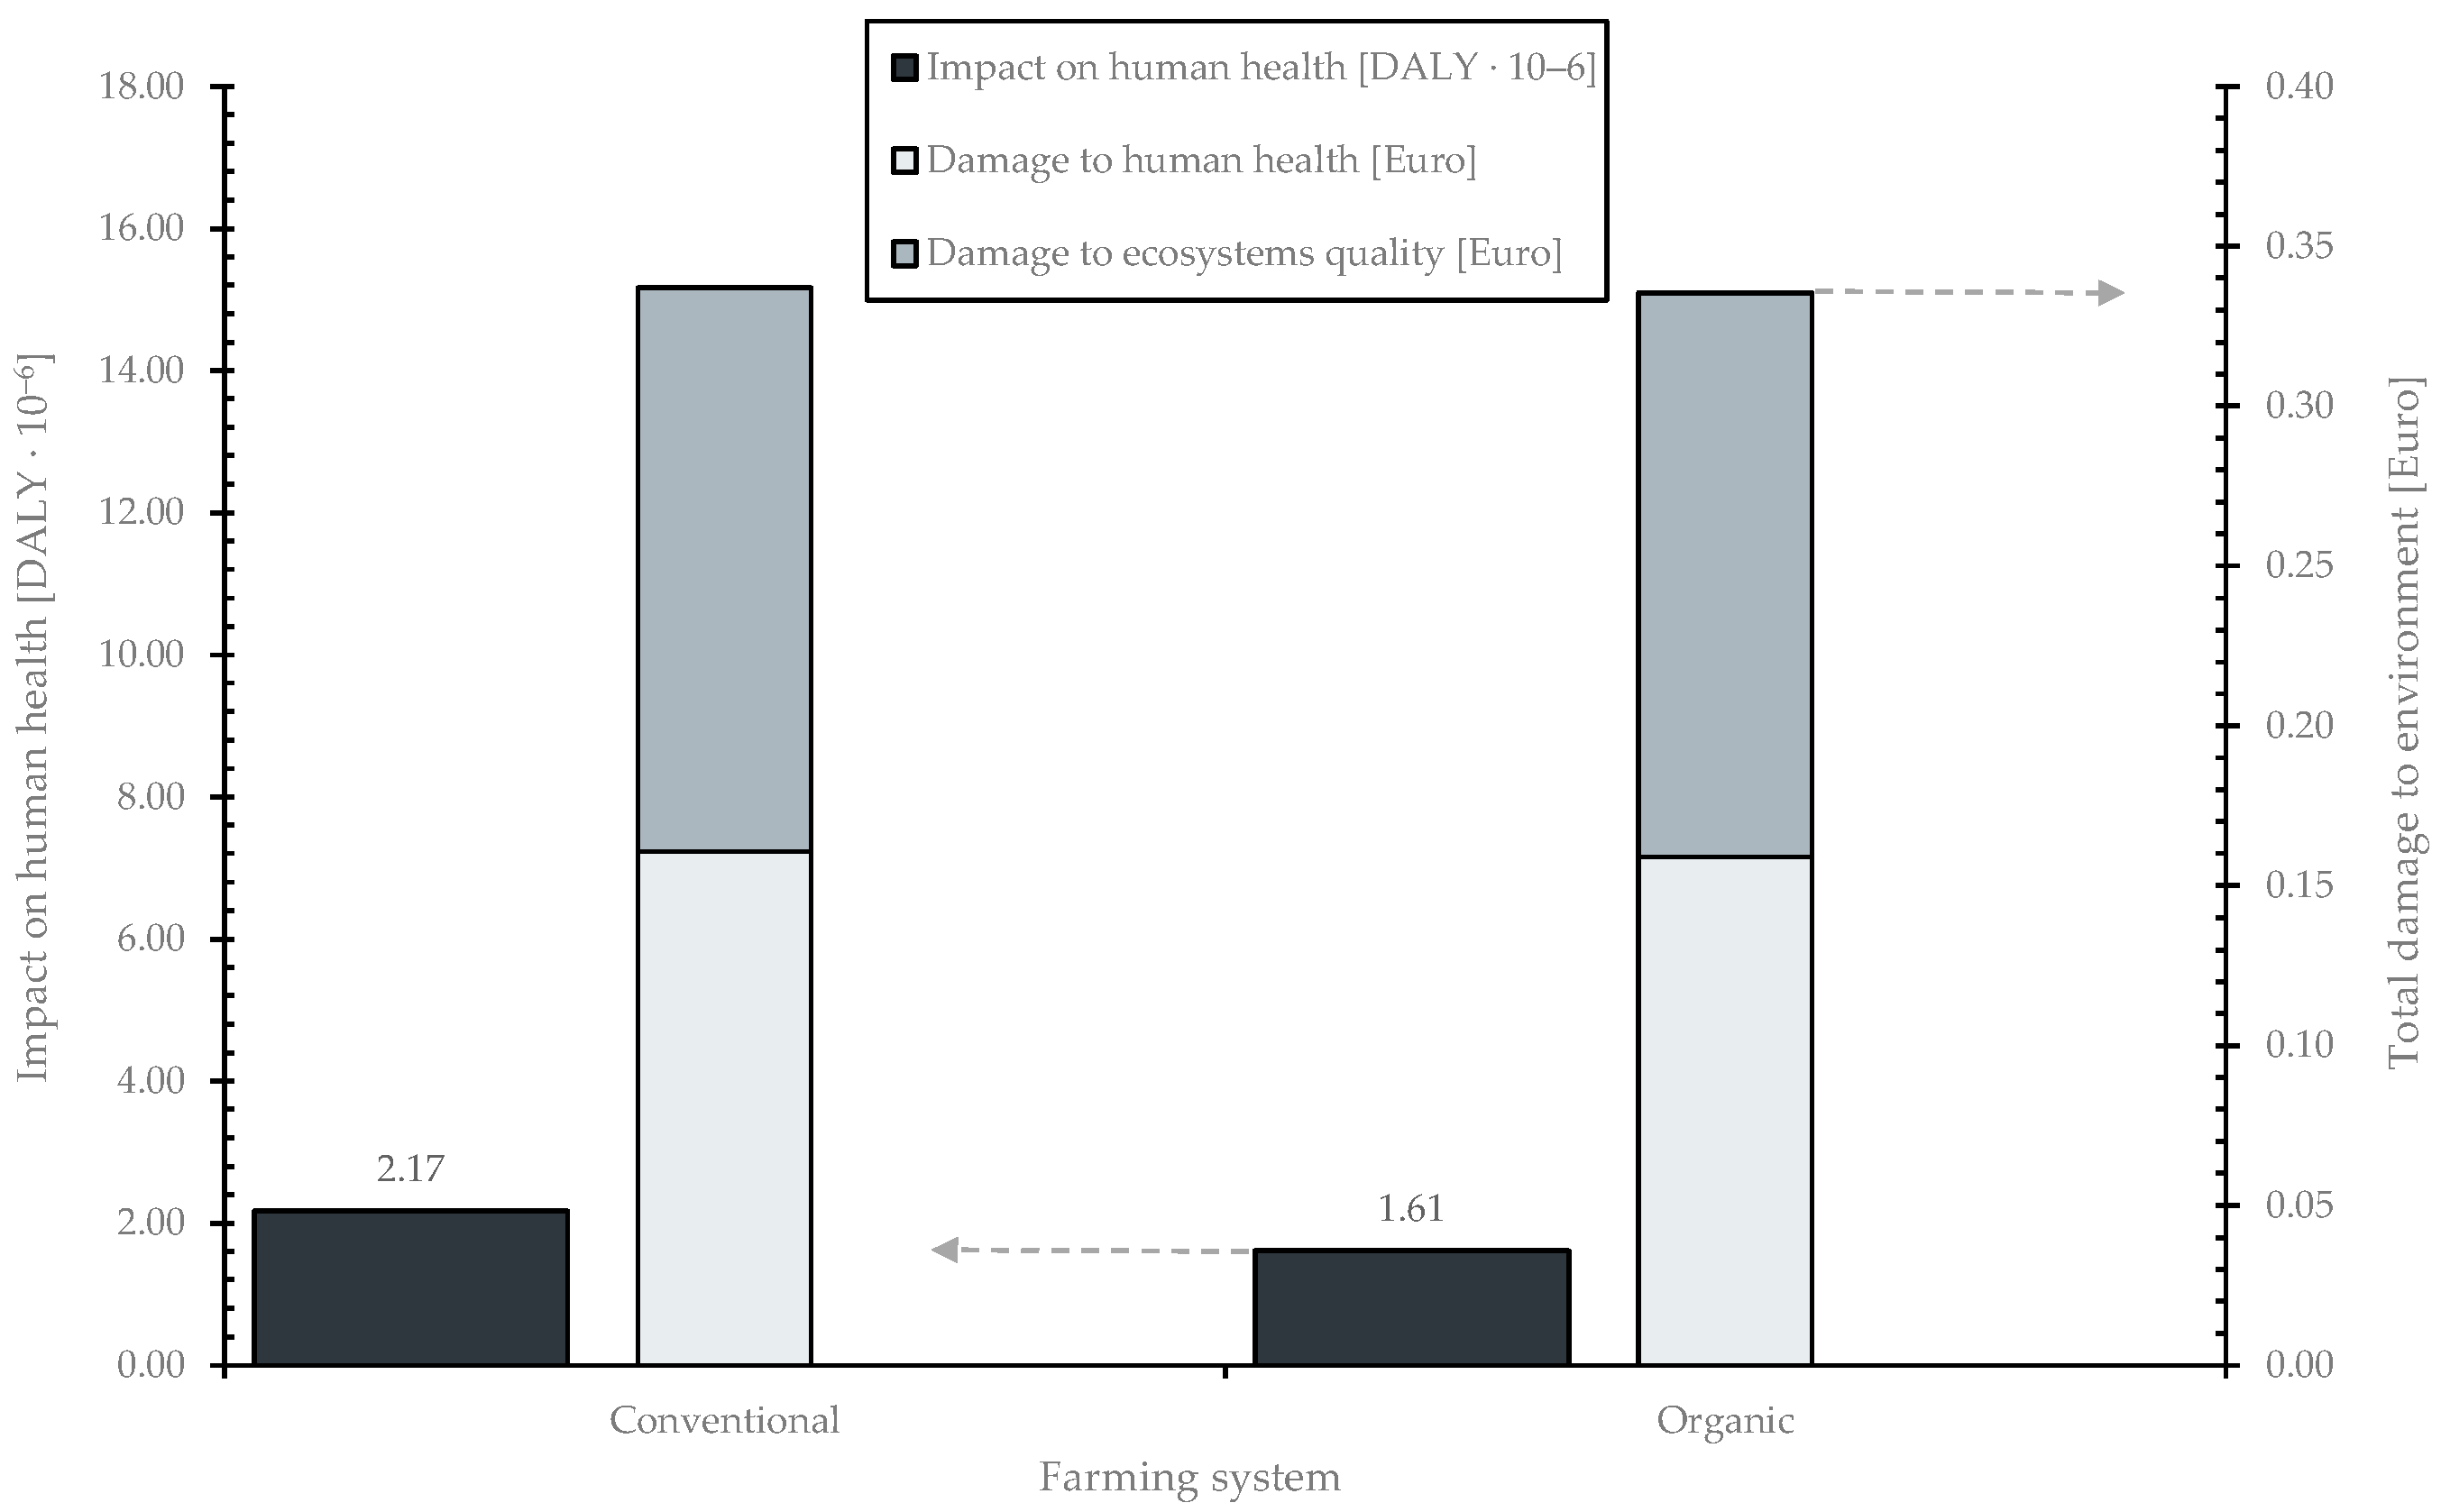
Figure 5 shows the results when a mass-based functional unit is being used. Organic production is less harmful while considering only its impact on human health. Pelaracci et al. [
53] also compared environmental impacts related to conventional and organic egg production and concluded that in Italy organically produced eggs are slightly less environmentally sustainable than the conventional ones. The results are highly dependent on the type of conventional farming system used in the assessment, and therefore results from this study differ from the results described in Pelaracci et al. [
53].
Additionally,
Figure 5 shows the data on the total damage to the environment on the secondary axis, broken down by damage to human health and the damage to ecosystems quality. The impacts on human health are significantly higher, and the weighted results are presented, with the weight for human health impacts being approximately five times higher than those for ecosystems quality. It is important to have in mind that the results for impact on human health are expressed in DALYs and that total impact is further weighted and expressed in monetary values as damage to human health. While the characterised results differ from weighted results regarding damage to human health, it is not possible to conclude which farming system is better for the environment.
To calculate the energy values of eggs, different energy values were determined for organic and conventional eggs. The data were averaged per 100 g of eggs and showed that organically produced eggs have an energy value of 107 kcal (equal to 448 kJ), while conventionally produced eggs have a value of 148 kcal (equal to 620 kJ).
Table 2 shows that both farming systems have a similar impact on human health. On closer inspection, however, organic production has slightly higher values for the impact on human health and environmental damages than conventional production, as more eggs are needed to cover the same energy needs. The results regarding damage caused to the environment in egg production for different farming system are presented in
Table 2 to better demonstrate the differences in values. When comparing the total damage to the environment based on daily energy values, the organically produced eggs cause 1.72 Euro more of an environmental burden than the conventionally produced ones.
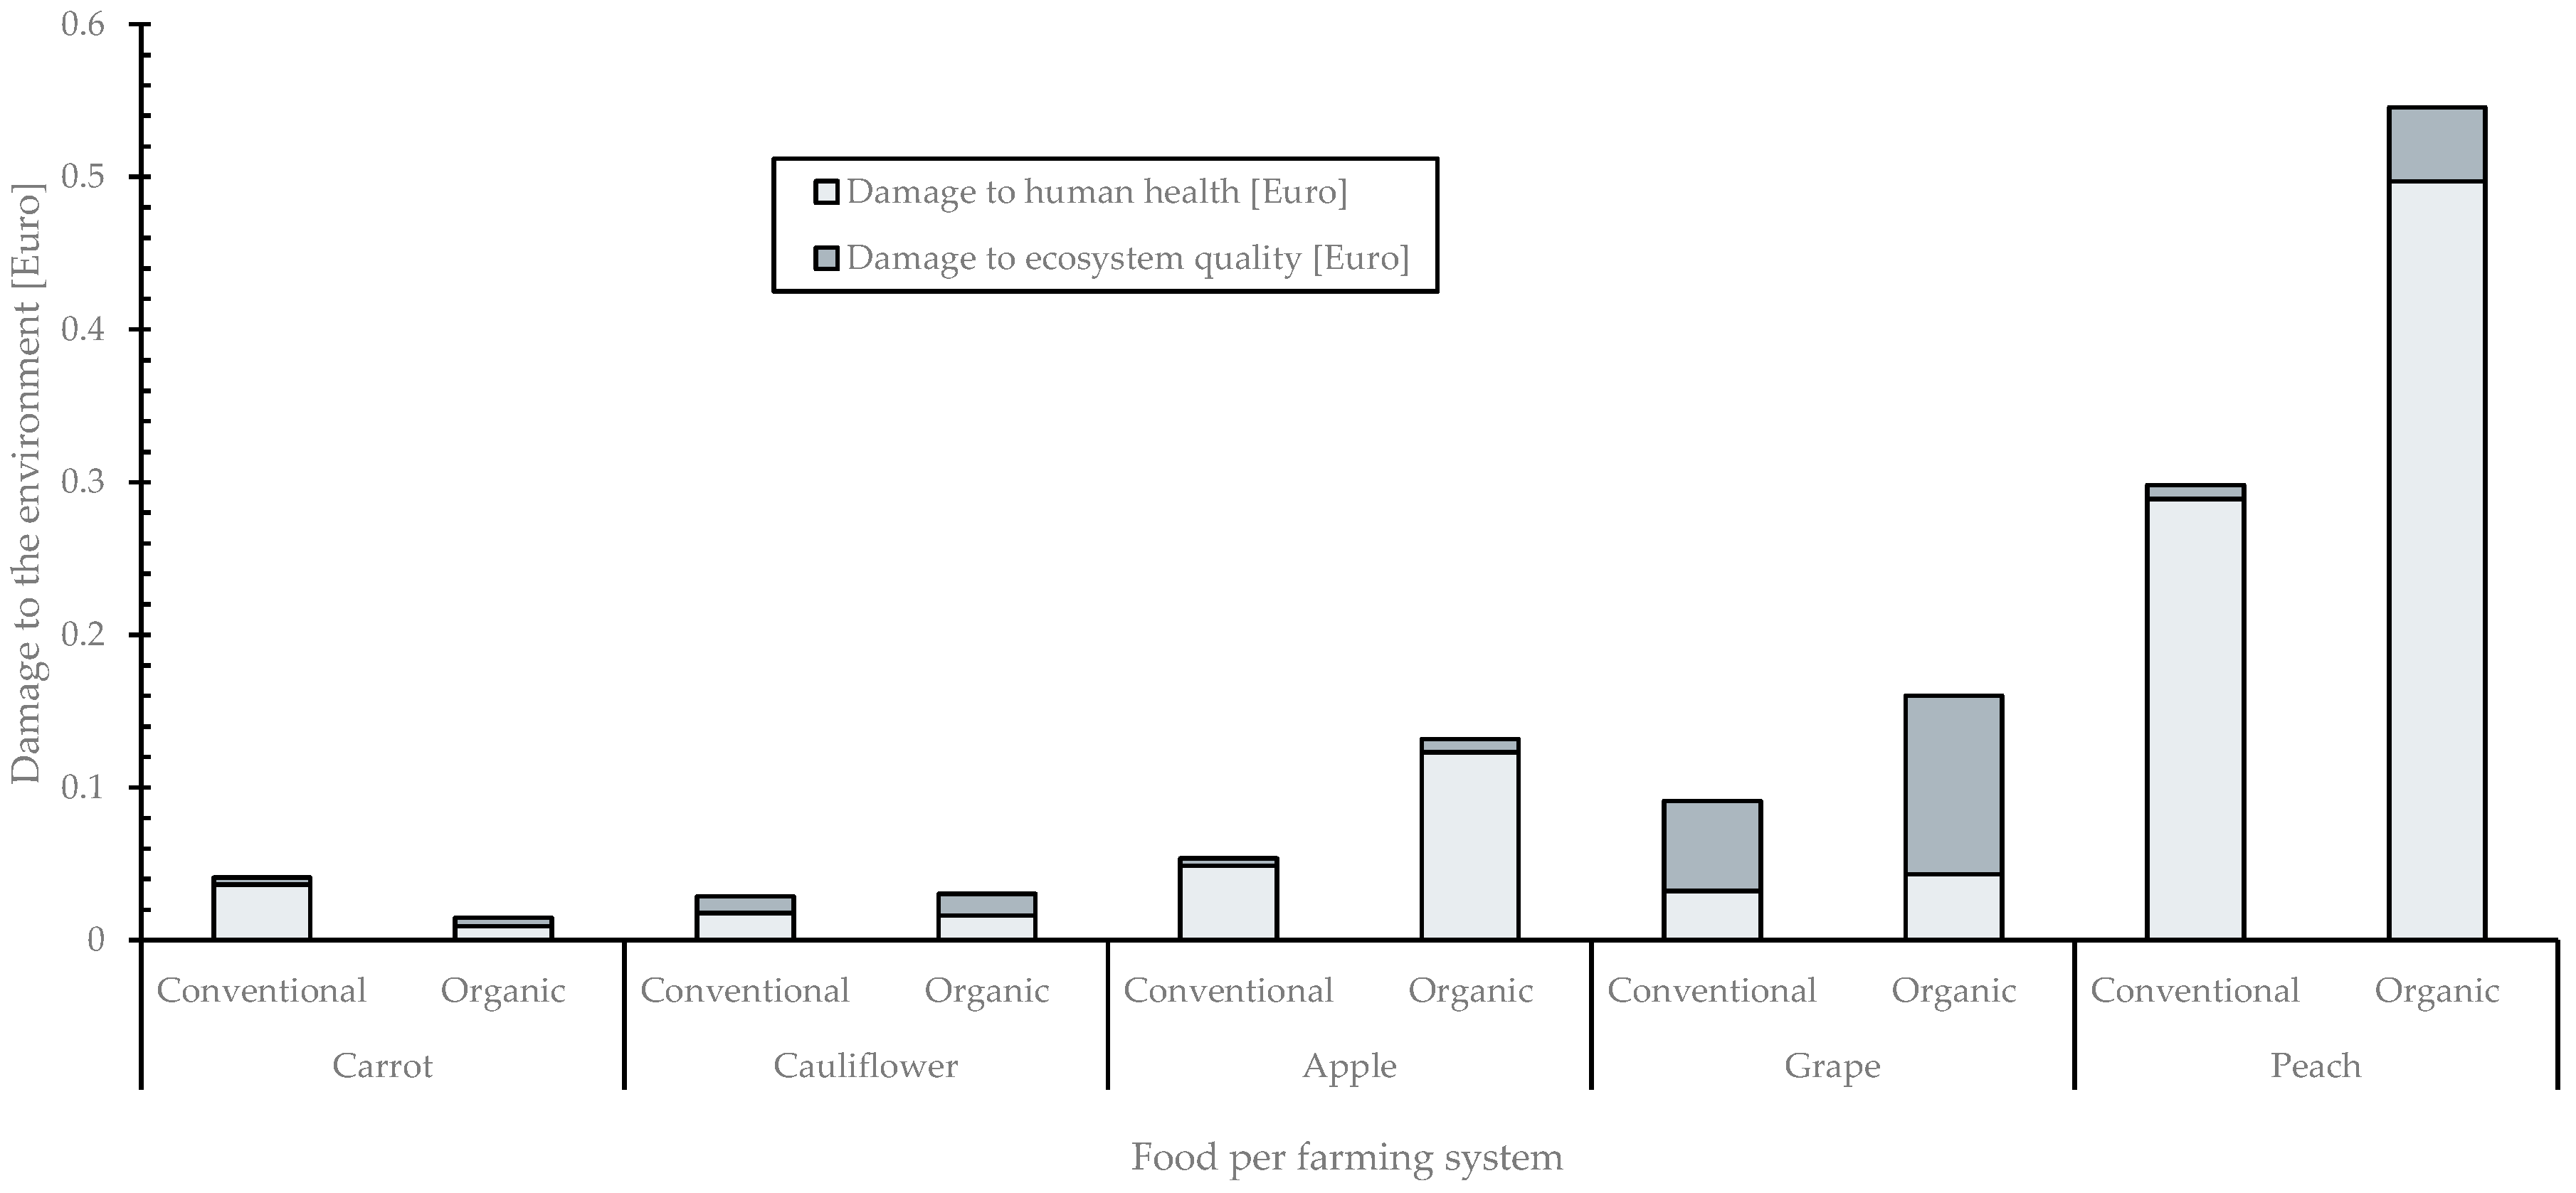
A comparison of farming systems was also made between conventional and organic cultivation of carrots, apples, grapes, and peaches to determine whether a consistent pattern emerges as to which farming system is less harmful to human health Using a mass-based functional unit of 100 g of the reference food, apples, grapes, and peaches showed higher impacts from organic production, while carrot and cauliflower showed higher impacts from conventional production (
Figure 6). Consequently, there was no clear pattern that recognised that one farming system was consistently less harmful to human health, while assessing carrot, apples, grapes, and peaches production. Additionally, a comparison of the total damage to the environment by the different farming systems revealed that three out of five foods have a higher environmental impact when grown organically. For one product, the impact is similar regardless the farming system, while another product has a higher impact on conventional farming compared to the organic farming system.
When using an energy-based functional unit, different energy values must be used for organically and conventionally produced food. The energy values for all organically and conventionally produced foods were obtained from the ‘Eat this much’ app [
54], which creates personalised meal plans. Both values were obtained from the same application to ensure more consistent data. In this assessment cauliflower was excluded while no data for farming system specific energy values were found.
Table 3 summarises the energy values per 100 g of food, categorised by the production farming system.
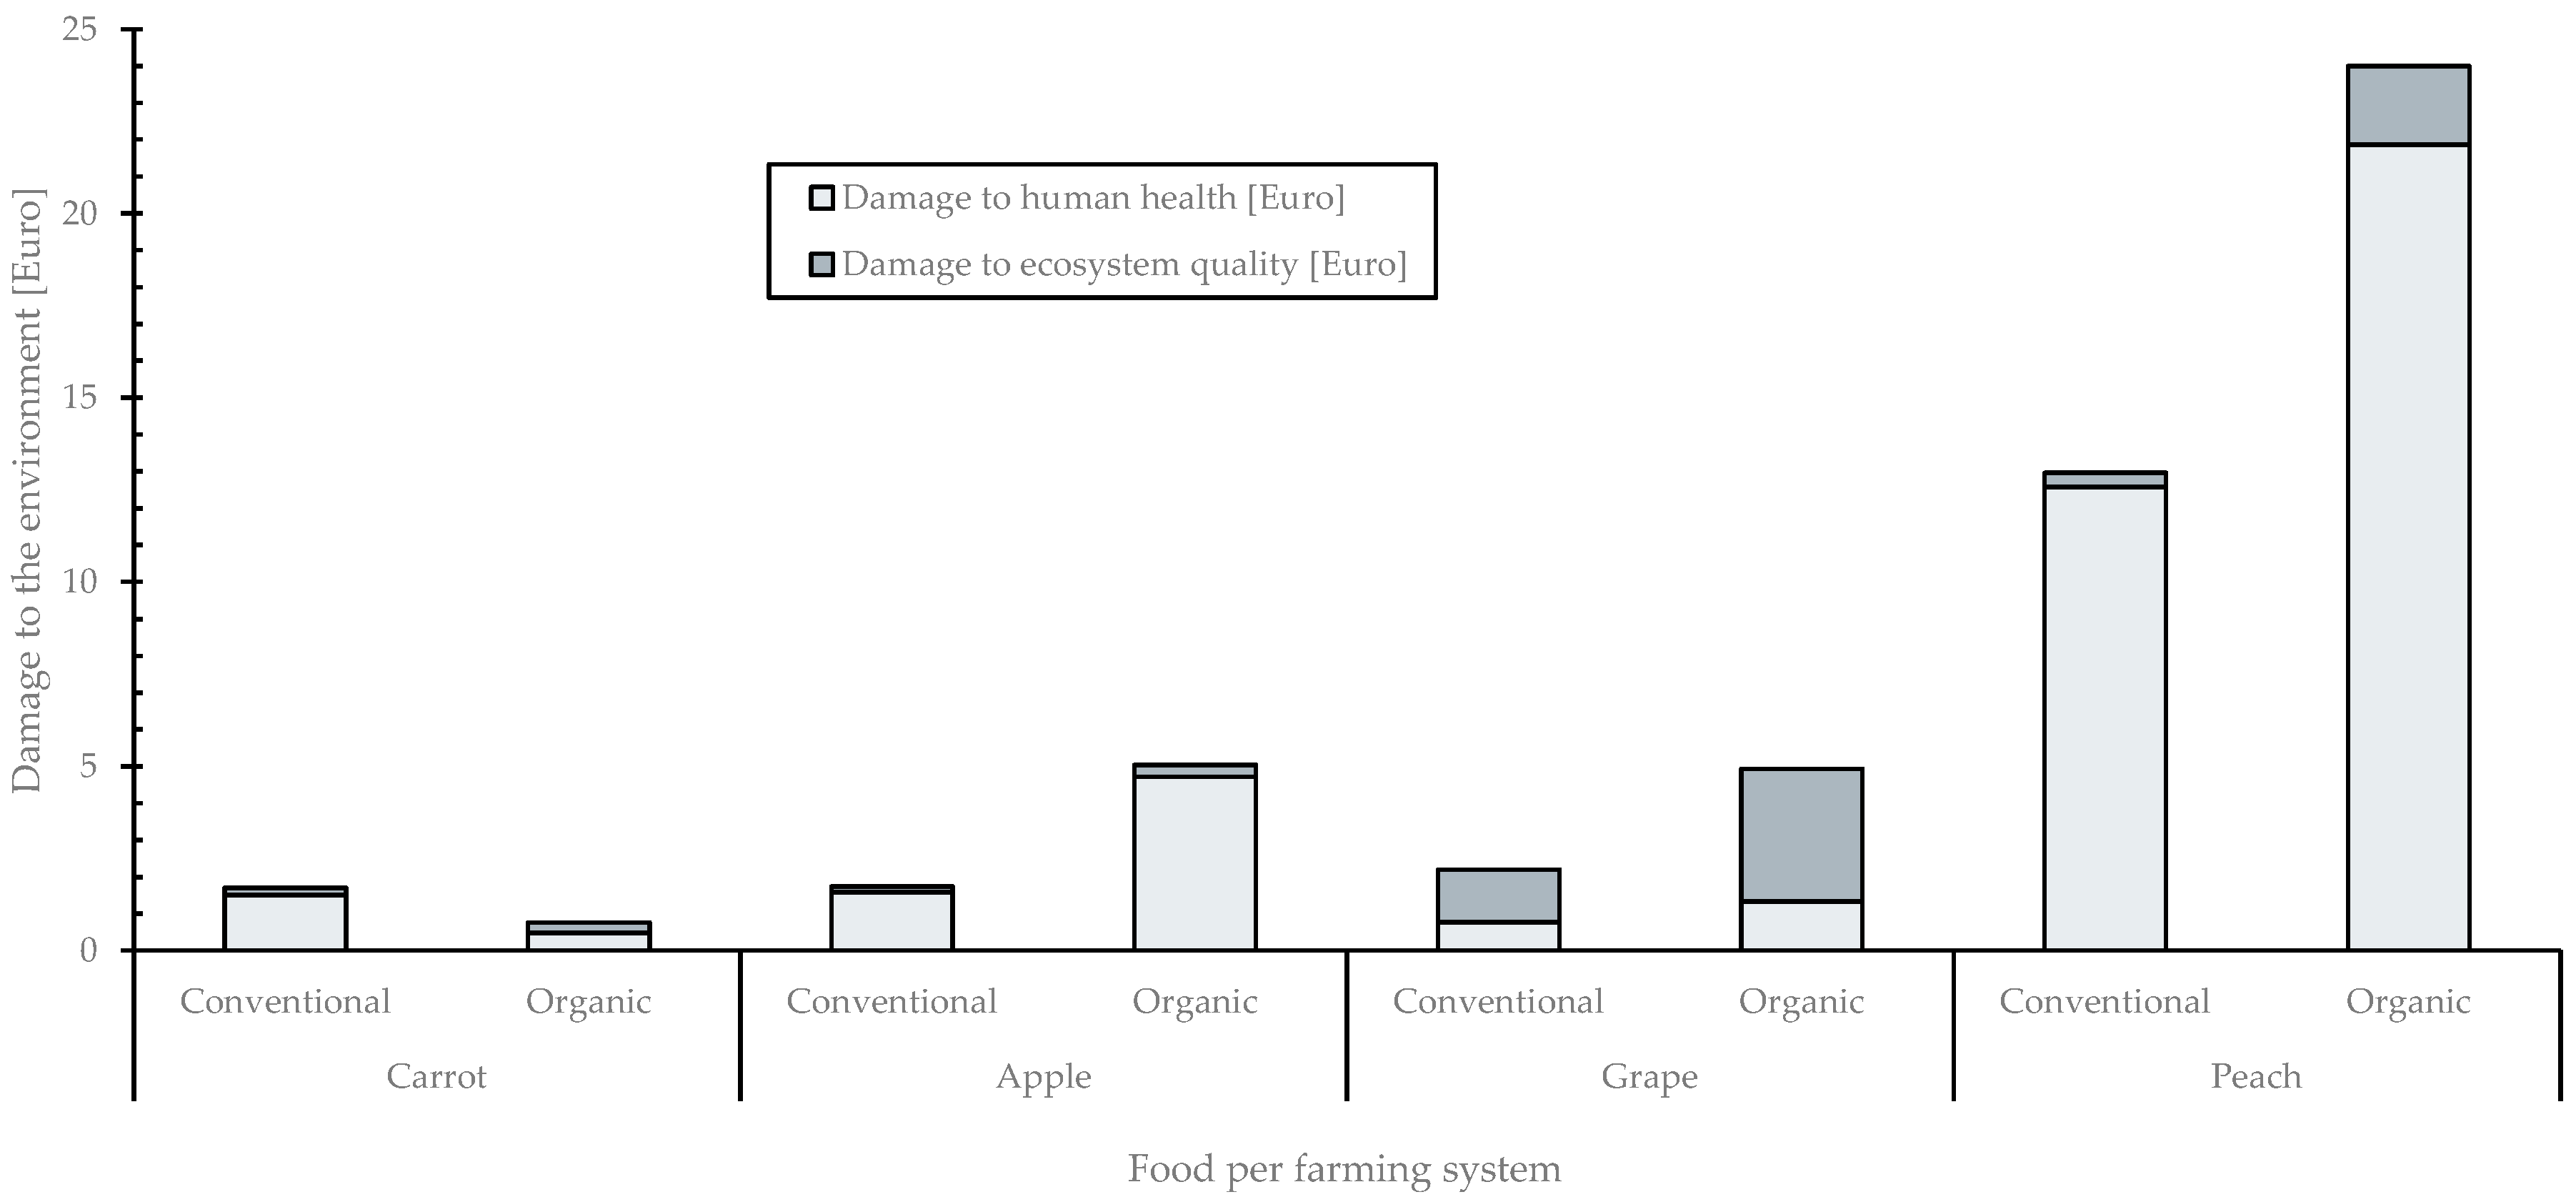
Figure 7 shows the results of comparison between conventionally and organically produced food using an energy value-based functional unit. In three out of four cases, organically produced food causes more environmental harm when comparing total environmental damage. Only in the case of carrot is the total environmental damage for conventional production higher than organic production. When comparing only the damage to human health, the damage of organically produced food is approximately 1.7 times higher than the damage for conventionally produced food in the case of grape and peach production and approximately three times higher in case of apples. Only for carrot is the damage to human health for conventionally produced carrots higher than for the organically produced ones.
To better understand the origin of these differences, it is important to examine characterised values of midpoint indicators, as they encompass a broader range of impacts rather than just one or two aggregated outcomes.
Table 4 illustrates the impacts of different characterised values of midpoint indicators for the functional unit based on mass (100 g of food product), with water availability (WA) making the largest contribution, followed by climate change (CC) and non-cancer human toxicity (HT NoC). The lowest impacts are observed for ozone layer depletion (OLD) and photochemical oxidant formation (POF). In addition, conventionally produced carrot has a higher impact on ionising radiation (IR) than that which is organically produced, while in the assessment of other types of food, ionising radiation is higher in organic production than for conventional production. This could contribute to the higher impact on human health for conventionally produced carrots compared to organically produced ones. In grape production, a similar anomaly is observed in human toxicity (non-cancer impacts), where conventionally produced grapes have a higher impact than organically produced grapes—contrary to the trend for other food. This could explain why organic and conventional grape production have the same total impact on human health.
Table 4 presents the differences between organic and conventional food production considering eight different midpoint indicators. The results in
Table 4 are expressed in DALYs, for better expression of partial contribution to total environmental impacts, where the values can be summed to the total score. The largest differences are found in the human toxicity (non-cancer) category, with differences exceeding more than 100% in three of the four food farming systems. In addition, apple production shows the greatest differences in environmental impact with specific midpoint indicators when comparing conventional and organic production. It is worth mentioning that midpoint results in LCA can be expressed in different units. Most commonly, the midpoint results are expressed in terms of an equivalent mass to reference substance (kg CO
2 eq for climate change), where the partial results present non-additive values. Based on
Table 4, we can conclude that organically produced food is not less environmental impactful than conventional one. With the results in
Table 4 we can supplement previous results (given by
Figure 6 and
Figure 7) and recognise the real reasons for the different impacts on human health in the production of organic and conventional food.
The results of the comparison between conventional and organic production do not allow a definitive statement to be made as to which food product is less harmful to human health. Results vary depending on the functional unit used for the calculations, accuracy of used datasets, and the LCIA method. This underlines the importance of the functional unit and of transparency in the disclosure of LCA results, including disclosure of data sources, impact methods, and functional units. Such transparency allows consumers to draw their own conclusions based on available information. Furthermore, these results cannot be generalised to all organically produced food products, as various factors influence their impacts on human health.
Over the last ten years, the European Commission has developed a new method for assessing environmental impact, the so-called Environmental Footprint (EF), which will be used for product environmental footprint (PEF) reporting and organisational environmental footprint (OEF) analyses. The main objective of this method is to enable more structured and regulated reporting, to ensure comparability between assessments, and to achieve harmonised reporting on key environmental indicators. Compared to environmental product declaration (EPD), the PEF method expands the number of midpoint indicators (from eight to sixteen) that must be reported. When the previous LCA studies were performed, the product environmental footprint category rules (PEFCR) were developed, outlining the most influential environmental impact categories. Following PEFCR the reporting encompasses only environmental indicators that contribute at least 80% of the total environmental score, which additionally reduces the number of different indicators that need to be reported. PEFCRs have been developed for various product types. In the food industry, there are currently five PEFCRs for beer [
55], dairy products [
56], packaged water [
57], dry pasta [
58], and wine [
59].
Table 5 summarises the key midpoint indicators that must be included in the LCA assessments for specific food product categories.
Under the PEFCRs summarised in
Table 5, results regarding climate change and fossil resource use need to be disclosed for all products assigned to these PEFCRs. In addition, six impact categories (ozone depletion, human toxicity cancer, human toxicity non-cancer, ionising radiation, photochemical ozone formation, and eutrophication marine) do not have to be calculated for any of these five food categories.
Contrary to the belief that environmental impact assessments should consider harm to human health, the EU methodology PEF does not include any disclosure of aggregated impacts on human health or ecosystems. This lack of transparency means that consumers remain uninformed about the potential health risks posed by a product’s growth or industrial activities. Without knowing how these factors affect their wellbeing or the environment, consumers cannot make information-based sustainable choices. This undermines the ability to support truly sustainable and health-conscious products. LCIA methods such as ReCiPe 2016, IMPACT World+, LC-IMPACT, EPS2015, and Environmental prices should be used to tackle the damage to human health [
42].
The realisation of LCA analyses is complex, both in terms of data acquisition and the interpretation of results. Despite this complexity, the relevance of its results is only limited to one pillar of sustainability (environmental pillar), although the method is developing to cover the remaining aspects of sustainability in the future. Additionally, Directive 2022/2464 regarding corporate sustainability reporting [
60] requires that all large companies will have to report on sustainability from 1 January 2025, followed by small- and medium-sized companies in 2026. In 2025, European Parliament postponed the application dates for sustainability reporting requirements. Member states will have extra year (until 26 July 2027) to transpose the rules into national legislation. The one-year extension will also apply to the companies with over 5000 employees and net turnover higher than 1.5 Euro billion. These companies will only have to apply the rules from 2028 [
61]. Postponing the application dates will give companies and consumers more time to adopt these rules regarding sustainable reporting. Finally, it has to be pointed out that without LCA studies performed it is almost impossible to prepare a credible corporate sustainability report.


