Abstract
This study was conducted using Geographic Information Systems (GISs), Remote Sensing (RS) techniques, and the SLEUTH model based on Cellular Automata (CA) to analyze the spatial and temporal dynamics of urban growth in Sanliurfa Province and to create future projections. The model in question simulates urban sprawl by using Slope, Land Use/Land Cover (LULC), Excluded Areas, urban areas, transportation, and hill shade layers as inputs. In addition, disaster risk areas and public policies that will affect the urbanization of the city were used as input layers. In the study, the spatial pattern of urbanization in Sanliurfa was determined by using Landsat satellite images of six different periods covering the years 1985–2025. The Analytical Hierarchy Process (AHP) method was applied within the scope of Multi-Criteria Decision Analysis (MCDA). Weighting was made for each parameter. Spatial analysis was performed by combining these values with data in raster format. The results show that the SLEUTH model successfully reflects past growth trends when calibrated at different spatial resolutions and can provide reliable predictions for the future. Thus, the proposed model can be used as an effective decision support tool in the evaluation of alternative urbanization scenarios in urban planning. The findings contribute to the sustainability of land management policies.
1. Introduction
Urban areas have increasingly become central to human habitation, accommodating more than half of the global population and serving as focal points of social, economic, and environmental interactions [1]. The intricate structure of cities stems from the interplay of numerous agents and variables that evolve dynamically over time and space [2]. Despite originating from localized behaviors and decisions, cities often display emergent macro-scale patterns such as peak-hour traffic congestion or spatial segregation of socioeconomic groups [3]. These systems, characterized by non-linearity and high dimensionality, exhibit complex properties, including fractal geometry and self-similarity across scales [4], posing significant challenges for comprehensive modeling and analysis.
Urbanization processes manifested through the outward expansion of both cities and rural settlements exert increasing pressure on natural and semi-natural landscapes [5]. This transformation underscores the necessity of effective urban management practices. However, the multifaceted nature of urban growth drivers and their outcomes, which span across diverse spatial and temporal dimensions, complicates their interpretation and integration within planning frameworks [6]. Accordingly, understanding spatial growth patterns and trajectories constitutes a fundamental prerequisite for sustainable land use and land use/cover (LULC) management.
The endeavor to simulate and forecast urban expansion dates to the mid-20th century, experiencing a resurgence in the 1990s due to advancements in geospatial data availability and Geographic Information Systems (GISs) [7]. Over the past two centuries, population growth and industrialization have accelerated changes in LULC, a trend that is projected to intensify. Urban expansion is defined by the proliferation and densification of human settlements. This process is primarily driven by aspirations for improved living standards, employment opportunities, and access to services and infrastructure [8]. Sustainable planning approaches are presented using the GIS-based AHP framework to assess land suitability for balancing urban development with agricultural and environmental values [9].
Monitoring urban growth is indispensable for achieving sustainable development objectives, mitigating environmental degradation, and ensuring optimal use of finite natural resources. Among various modeling approaches, Cellular Automata (CA) have emerged as an effective framework due to their capacity to represent spatially explicit and temporally dynamic processes through relatively simple rule-based systems [3].
Urban simulation models are instrumental in evaluating the relationships between spatial configuration, land use dynamics, and associated socioeconomic activities. These models have evolved from static representations of aggregate land use change to dynamic systems that incorporate behavioral complexity and spatial heterogeneity [3]. With the integration of Remote Sensing (RS) technologies and GIS, urban modeling has gained new analytical dimensions, offering decision-makers tools for real-time monitoring and predictive analysis [10].
GIS-based approaches utilize a diversity of spatial data sources, ranging from high-resolution satellite imagery to socioeconomic databases, and facilitate comprehensive assessments of urban evolution [11]. However, to adequately capture the non-linear and context-specific trajectories of urbanization, robust models capable of incorporating local characteristics and feedback mechanisms are essential.
CA models, originally formulated within theoretical and computational disciplines, offer a spatially explicit modeling environment particularly suited for simulating geographic phenomena such as LULC transitions [12]. Their capacity to represent complex spatial interactions using a discrete and localized framework has led to their widespread application in urban growth modeling [13]. RS data, with its historical depth and ease of classification, complements CA models by providing reliable inputs for both calibration and validation.
The coupling of GIS and RS with CA methodologies enables the generation of spatially realistic urban growth scenarios. This integration is especially relevant for rapidly developing regions, where urban expansion significantly drives land transformation. By leveraging long-term data and change detection techniques, such models provide valuable insights into the drivers and consequences of urban growth, supporting evidence-based policy formulation [14].
One of the most extensively applied CA-based urban simulation tools is the SLEUTH model, developed in the early 1990s by Keith Clarke at the University of California, Santa Barbara [15]. The acronym SLEUTH is derived from the names of the six input layers used in the model: slope, land cover, exclusion, urbanization, transportation, and hillshade. SLEUTH has been widely utilized to simulate urban growth and LULC dynamics [16,17]. Its flexibility, open-source availability, and compatibility with spatial datasets have contributed to its global adoption in diverse urban contexts [18].
Initially applied to the San Francisco Bay Area, the model has since been employed in urban studies across more than a hundred cities worldwide. It enables scenario-based simulations, facilitating the evaluation of future urban expansion under varying policy and environmental conditions. In addition to its applications in the United States, SLEUTH has been implemented in case studies across Europe [19], China [20], and Türkiye [21,22], demonstrating its adaptability to diverse geographic and socioeconomic settings.
SLEUTH’s analytical strength lies in its ability to model urban dynamics across multiple spatial and temporal scales, offering decision support for infrastructure planning, environmental management, and sustainable land development [15,23]. Furthermore, the model’s calibration process, integration of spatial metrics, and use of longitudinal datasets enhance its predictive performance and relevance for policymaking [6,24,25]. SLEUTH has emerged as a cornerstone in the modeling of urban expansion, contributing significantly to the scientific understanding and governance of urban systems.
In studies on the SLEUTH model, performance and parameter sensitivity have been evaluated in detail in different geographical contexts. For example, while LULC change in Atlanta was analyzed using temporal satellite images [26], the ecological effects of future urban sprawl in the Chesapeake Bay Basin were modeled with scenarios [25,27]. In applications conducted in Türkiye, the model’s accuracy rates and scenario generation capacity were found to be high; it was stated that the SLEUTH model was sensitive to different development trends and was an effective tool in planning decisions, especially in rapidly urbanizing regions such as Adana and Antalya [21,22]. In addition, accurate modeling of past growth dynamics enables more reliable predictions to be made about the future [6]. In this context, the SLEUTH model stands out as an effective decision support tool in understanding the spatial patterns of urban sprawl and in creating alternative future scenarios in planning processes. Martellozzo et al. [28] examine urban sprawl, which contributes to the loss of natural and agricultural lands, by integrating multi-criteria analysis with CA modeling to simulate high-resolution, country-scale land use/land cover change scenarios. In doing so, it offers a comprehensive and scalable analytical framework that supports policymakers in formulating sustainable land use strategies. Furthermore, to more accurately represent the morphological characteristics of urban sprawl, the study proposes an alternative approach to the SLEUTH model by replacing commonly used default parameters with a parameter prioritization process based on the AHP. The model outputs are then evaluated through spatial analyses to characterize the relationship between urban growth patterns and the transportation network [29].
The use of computer-based urban system simulation models to predict and evaluate LULC change has become increasingly common recently. These models simulate the interaction between humans and the environment in space and time to predict LULC change. Over the last decade, LULC change models have played an important role. They have helped us to understand the causes, mechanisms, and consequences of LULC dynamics. These models have provided an opportunity to explore and evaluate LULC policies and have helped visualize alternative futures. The success of these LULC models is contingent on two things: high-resolution satellite imagery, which is more precise and accurate, and greater computing power [30].
Of the various models employed in the study of LULC change, CA models arguably have the greatest impact. These ‘flexible’ CAs divide the landscape into cells, and transition rules determine their behavior. These rules capture the uncertainties of the real-world system and simulate the pattern and process of urban growth [3]. These models offer a spatial and dynamic approach, enabling planners to visualize and analyze the potential consequences of current decisions and policies before acting. Over the last 15 years, people have successfully applied SLEUTH, one of the CA models, worldwide to simulate LULC change.
The modeling of future urban morphology is not the only thing that is performed; spatial growth trajectories are also constructed by relating historical urban extent to transport and topographic data, as well as statistics. SLEUTH is characterized as an approach to the theoretical study of urban processes. Previous applications have revealed that calibrating SLEUTH faces multiple complexities [31,32].
As initial models focused solely on urban growth modeling, ref. [19] turned to Lisbon and Porto in Portugal to develop a refined SLEUTH calibration. Studies in cities across North America and Europe have demonstrated that SLEUTH is a universally portable model with broad applicability. Furthermore, improving spatial resolution can make the model more sensitive to local conditions. It has also provided a more solid foundation for other research by improving the understanding of the calibration process [18].
The primary objective of this study is to examine the urbanization process of Sanliurfa, a city located in Southeast Türkiye, from a historical perspective that spans from the past to the present. Another objective is to develop a CA approach that will enable the integration of multi-layered data and facilitate the modeling of the city’s future spatial development. In this direction, the CA-based SLEUTH urban growth model was implemented. However, the basic originality elements that distinguish this study from its counterparts in the literature emerge in the method followed in the construction of the model and the data layers used. First, the decision mechanism of the classical SLEUTH model was integrated with the AHP method in the GIS environment in this study. AHP provided a systematic structure to the multi-criteria decision-making process, making it possible to determine the weights for the parameters of the model in a more objective and analytical way. In this respect, a more dynamic and local conditions-sensitive modeling approach was developed in the study compared to the classical SLEUTH model.
Secondly, the data layers included in the SLEUTH model are not limited to only six basic inputs. Disaster risk areas and public planning layers that can directly affect the spatial development of the city are also integrated into the model. The fact that there are no studies in the literature that consider such layers together with the SLEUTH model constitutes an important original value of this research and shows the potential of the model to include disaster sensitivity and public governance dynamics in decision-making processes.
2. Materials and Methods
2.1. Study Area
Sanliurfa is located in the Southeastern Anatolia Region of Türkiye. Sanliurfa, located in the Central Euphrates Section of the Southeastern Anatolia Region, is surrounded by Mardin in the east, Diyarbakir in the northeast, Adıyaman in the northwest, Gaziantep in the west, and the Turkey–Syria political border in the south (Figure 1). The Diyarbakir Road, which connects to the Adana highway in the north, connects Syria in the south, Gaziantep in the west, and Mardin in the east. It is extremely important in terms of being located on important transportation routes in the region. The high hills in the north of the province generally decrease towards the south. Large plains are in the south of Sanliurfa. While the elevation in the northern parts is around 800 m, it approaches 2000 m around Karacadağ in the northeast. It drops below 400 m in the plain area in the south. Elevation values increase from south to north and from west to east.
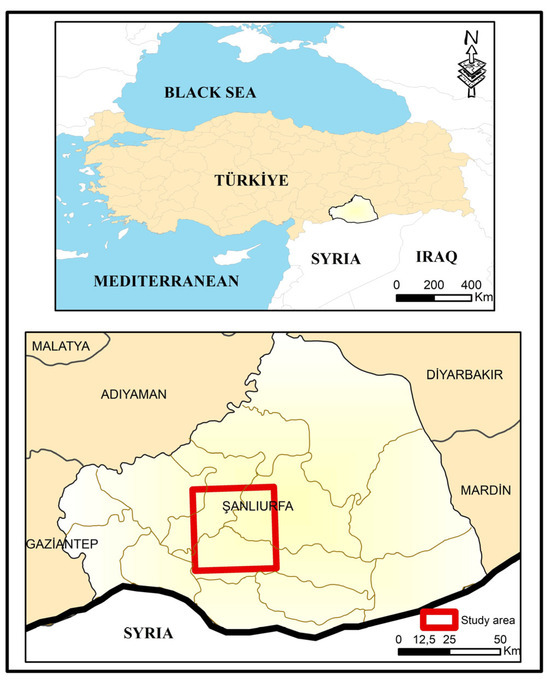
Figure 1.
Location map of the research area.
2.2. Workflow of the Study
Areas with a high risk of disaster were identified through an assessment of suitability for settlement, with the help of geological maps, fault lines, and the hydrographic network (rivers). In addition to these layers, zoning plans submitted by local governments were examined. Spatial documents related to public policies were also examined. Areas with potential risk and areas closed to settlement were identified. These areas were then digitized in vector format. These layers were used in the suitability analysis.
The SLEUTH model predicts future urban development trends by analyzing land use and urban sprawl data from past periods. The calibration of the model parameters was ensured with observational data from previous years, and simulation outputs were produced in raster format. The modeling process made it possible to identify spatio-temporal urban sprawl patterns and integrate these patterns into spatial suitability analysis.
AHP was used as a multi-criteria decision-making approach in the study. The assessment of suitability for settlement was carried out in the following stages:
- ❖
- Creation of Buffer Zones: Buffer zones were created in a GIS environment to determine the impact zones around critical criteria (transport, water resources, risky areas, etc.).
- ❖
- Reclassification: The obtained raster data were reclassified using certain threshold values according to their degree of suitability.
- ❖
- Comparison Matrix Creation: Pairwise comparisons between criteria were performed, and decision matrices were organized.
- ❖
- Determination of Weights: Eigenvectors were obtained from the decision matrices, and relative weights for each criterion were calculated.
- ❖
- Consistency Analysis: The consistency of the decision matrices was tested by calculating the Consistency Index (CI) and Consistency Ratio (CR). If the CR value is less than 0.10, the matrices are considered consistent.
The urbanization simulation outputs obtained with the SLEUTH model and the criteria weights determined by AHP were overlaid with integration in the GIS environment. Each raster cell was assigned a total suitability score calculated with the relevant criteria weights. As a result of this process, a spatial suitability map classified according to the suitability levels for urban development was produced. The suitability map was categorized as low, medium, and high suitability levels and made interpretable. The workflow diagram of the study is given in Figure 2.
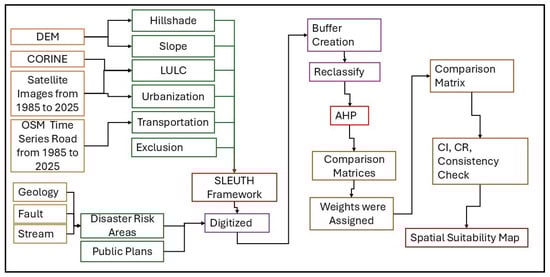
Figure 2.
Workflow diagram of the study.
2.3. Input Data
In this study, various spatial and temporal datasets were used for urban development prediction and settlement suitability analysis. Digital Elevation Model (DEM), CORINE land cover data, satellite imagery covering the period 1985–2025, and OpenStreetMap (OSM) time series road data constituted the main raster and vector data sources. The following thematic layers were derived from these data sets:
Hill shade and Slope: Using DEM data, topographic characteristics of the terrain were obtained.
Land Use and Cover (LULC): This was obtained by a classification process from CORINE and satellite images.
Urbanization: Urban sprawl areas were defined from satellite time series.
Transport Network (Transportation): Road networks and transport infrastructure were extracted from OSM data.
Excluded: Natural thresholds, protected areas, and no-building zones are collected in this layer. These layers constitute the input data required for the cellular automata-based SLEUTH model.
The data related to the city of Sanliurfa were organized, and the change in urban development was determined using raster and vector-based data. Accordingly, the first Landsat MSS, TM, ETM, and OLI/TIRS satellite images of the city of Sanliurfa for the years 1985, 1990, and 2000 were transferred to the ArcGIS 10.8 program, and the current area of the city of Sanliurfa for different years was determined. The city borders of the years 2010, 2020, and 2025 were drawn using the time shifter tool in Google Earth Pro Software. The data and data sources used in this study are given in Table 1. Our selection was based on several considerations. First, Landsat imagery provides consistent temporal coverage and free access to historical data necessary for model calibration across multiple time points (1985, 1990, 2000, 2010, and 2020). Second, the 30 m resolution was sufficient for capturing generalized urban growth trends at the regional scale of our study area, in alignment with the policy-relevant spatial scale for land use planning and scenario assessment. Moreover, the satellite imagery was primarily used for updating land use/land cover information and delineating urban extents rather than for parcel-level urban morphology analysis. Given the regional planning focus of the study, where strategic land use decisions are made at the municipal or sub-regional level, the resolution employed aligns with the spatial granularity typically used in policy-oriented models.

Table 1.
Data used and data sources.
SLEUTH is a model that simulates urban growth and surrounding LULC changes. A set of initial conditions and a growth cycle are developed for the simulation. Once these conditions are determined, a growth cycle, which is the basic unit of the SLEUTH model, is created [33]. The model requires at least four urban layers of different periods, two separate transportation layers, and LULC, as well as a slope layer, a hill shade layer, and an excluded layer. In addition, disaster risk areas and public planning layers that will affect the development direction of the city were used as input layers in this study. All input layers were converted to raster format by assigning AHP values at the same urban coverage, resolution, and geographic coordinates. The data used in this study are shown in Figure 3.
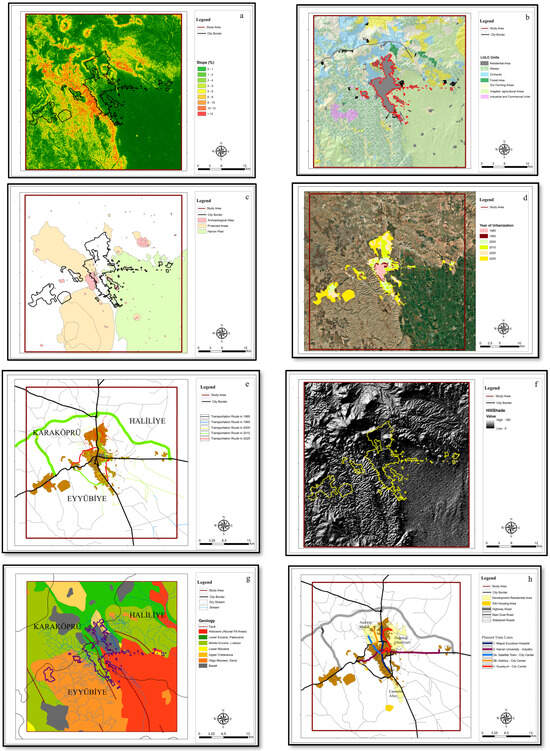
Figure 3.
Maps of the input data used in the study (a) Slope. (b) LULC. (c) Excluded. (d) Urbanization. (e) Transportation. (f) Hill shade. (g) Disaster risk areas. (h) Public plans.
Slope data is obtained from the Digital Elevation Model (DEM). Pixel values are used as percentages. The critical slope determines the last point beyond which urban growth cannot progress due to the slope. In grayscale LULC images, each pixel value represents an LULC class. For example, in the case of using CORINE Level 1, LULC classes represent red, green, and blue bands (RGB) in the image, and the LULC class shows the LULC type associated with the RGB value. Pixel values take values between 0 and 255. LULC amounts in the study area are given in Table 2. According to the table, the highest LULC amounts are irrigated agricultural areas, steppe, and dry agricultural areas.
Table 2.
LULC distributions of the study area (hectares).
The existing LULC data is classified between 1 and 5 in terms of suitability for settlement, where 1 represents the most suitable areas, and 5 indicates areas unsuitable for settlement. The classification was made based on the functional characteristics of each land use type, their proximity to essential infrastructure, and potential environmental constraints that may affect residential development. According to Table 3, the LULC data was divided into five distinct groups, and an AHP comparison matrix was constructed accordingly. Class 1 includes areas that are in the immediate vicinity of current settlements, transportation routes, official institutions, healthcare facilities, dry farming zones, and existing construction sites. These areas were considered highly suitable due to their accessibility, infrastructure availability, and integration into the urban fabric. Class 2 comprises areas surrounding airports, sports and entertainment zones, and industrial and commercial units. While these locations offer proximity to economic and social facilities, they may involve moderate levels of noise or traffic, slightly reducing their settlement suitability. Class 3 includes steppe areas, which are open and generally available for development but lack immediate infrastructural support. Class 4 refers to the surroundings of orchards, which may be constrained by agricultural protection policies or water resource considerations, thus limiting their conversion into residential zones. Class 5 encompasses areas around mining sites, dumping grounds, urban green spaces, irrigated cultivated lands, forest areas, and wastewater treatment plants. These zones present significant environmental, legal, or health-related constraints that render them unsuitable for residential settlement.
Table 3.
LULC data settlement suitability classes.
The Excluded Areas layer defines areas that are suitable and unsuitable for urban growth. The Excluded Areas are not suitable for urban development due to environmental, legal, or physical constraints and are therefore excluded from future urban expansion scenarios in the SLEUTH model. In the layers, each pixel value is given specific weight values between 0 and 100 for the types of LULC, according to the level of protection and depending on the scenario created. As the value approaches 100, it indicates areas that will be excluded from urbanization, and as it approaches 0, it indicates areas with a high probability of urbanization. In the SLEUTH Model, each scenario is evaluated according to the extraction layers prepared for it [34].
The Excluded Areas layer for the interpretation of the planning hypothesis in the SLEUTH Model layer needs to be created. This layer defines the areas where urban development is not possible. The areas that need to be protected from urbanization or the areas that are unsuitable for urbanization are shown with the extraction layer map for each scenario for the research area. The general approach in the application should be to define factors that either support urban growth (such as proximity to roads) or reject urban growth (restrictions in protected areas). Included in this study layer are Harran Plain, Balıklıgöl protection basin, wildlife protection areas, and archaeological sites. The most important of these sites is Göbeklitepe Archaeological Site, located 18 km northeast of Sanliurfa city center. The Harran Plain is one of the most important agricultural production areas of Türkiye. Therefore, the most striking situation in terms of LULC in the plain is the clear determination of the change in groundwater in the transition from dry farming to irrigated farming in terms of providing irrigation water.
In the urbanization model, the city size in the starting year is used. This layer is one of the basic layers used in determining urban growth with the SLEUTH Model. In the model, to understand the spatial characteristics of the data correctly, for the calibration phase where each data point is calibrated at three different spatial resolutions, the city layer belonging to the earliest year is used as the core layer, and the layers belonging to the following years (control years) are used to obtain the most appropriate statistical values reflecting the spatial characteristics of the city. Therefore, at least four city layers are needed in the calibration phase [34]. The definition of the size of urban areas depends on the implementer who prepares the dataset. The model is basically classified in two ways as urban/non-urban [34]. In Table 4, the urban LULC rates of Sanliurfa city by year are given.
Table 4.
Urbanization LULC rates of Sanliurfa city by year.
To start the model, the city size in the starting year is used. This layer is one of the basic layers used in determining urban growth with the SLEUTH Model. In the model, to correctly understand the spatial characteristics of the data, for the calibration stage where each data is calibrated at three different spatial resolutions, the city layer of the earliest year is used as the core layer, and the layers of the following years (control years) are used to obtain the most appropriate statistical values reflecting the spatial characteristics of the city. Therefore, at least four city layers are required in the calibration stage [34].
For transportation, the road-dependent growth dynamics in the model draw attention to the regions with high accessibility, simulating the urban development trend. To determine the effect of accessibility on urban development in the calibration, road layers that change with urban development over time are preferred. The model starts with the road layer of the earliest date.
The road-dependent growth dynamics in the model simulate the urban development trend by drawing attention to areas with high accessibility. To determine the effect of accessibility on urban development in the calibration, road layers that change with urban development over time are preferred. The model starts with the road layer of the earliest date. With the growth cycle or the passage of time, road layers of later dates are obtained. The new layer is included in the process and read, and development begins from here [34].
Transportation infrastructure is vital to the economic growth and prosperity of cities, especially in developing regions of the world. Transportation investment accounts for 40 percent of public sector expenditures [35,36]. Adequate transportation infrastructure is especially important in the world’s megacities, where annual motorization rates of 10 to 15 percent are not uncommon [36]. But the road capacity of megacities has failed to keep pace with the massive increases in traffic, and worsening traffic congestion threatens economic productivity and the overall quality of urban life.
A hill shade layer can be used to provide spatial content for urban growth data. The image is generally created using a DEM [34]. This layer defines areas where urbanization is not possible.
The disaster risk layer has been examined in terms of natural disasters such as earthquake, flood and overflow, rock, and avalanche in Sanliurfa. Natural disaster risk zones within the study area were identified based on official hazard maps and geospatial datasets provided by national authorities, including flood-prone areas and active seismic fault zones. First, the risks that natural disasters may cause have been presented with the help of maps. When the types of natural disasters in Sanliurfa are examined, earthquakes, floods, and overflow events come to the fore. The disaster risk layer has been created by considering flood, overflow, and earthquake risks. Although Sanliurfa is not located in a first-degree earthquake zone, it has neighboring provinces close to the first-degree earthquake zone, causing earthquakes experienced in these provinces to be felt in Sanliurfa as well.
2.4. AHP Method
Since each criterion used in this study has different units, these criteria need to be converted to a common unit to create the risk map. For this common unit, the AHP method was preferred in this study because it weights and classifies each criterion with different units. The AHP approach generally consists of 6 stages [37].
AHP was employed to prioritize decision criteria related to urban planning. The process began with the construction of a hierarchical model comprising the main goal, criteria, and sub-criteria. Pairwise comparisons among criteria were conducted using Saaty’s 1–9 scale, reflecting the relative importance of each element. With expert judgments, the aggregated pairwise comparison matrix was normalized, and the relative weights of each criterion were computed as the principal eigenvector of the matrix. To assess the internal consistency of the judgments, the Consistency Index (CI) and Consistency Ratio (CR) were calculated. A CR value below the threshold of 0.10 was considered acceptable, indicating a reasonable level of consistency in the comparisons. All computed CR values met this criterion, confirming the reliability of the expert input. In cases where CR exceeded acceptable limits, the respective matrices were reviewed and adjusted in consultation with the expert panel. This procedure ensured that the derived weights were both mathematically valid and representative of expert consensus, thereby strengthening the decision-making framework used in the study.
- Setting a goal;
- Selection of parameters or criteria;
- Evaluation of the relative scale weights of the selected criteria;
- Using pairwise comparison to create comparison matrices to calculate the geometric mean;
- Calculating the Consistency Ratio;
- Applying the resulting weights to the selected criteria.
The weight ratings on the comparison scale range from 1 to 9 for the AHP. The weights were assigned based on expert opinion and the literature reviewed in this study (Table 5).
Table 5.
Relative importance scale of criteria given by Saaty [37].
The second stage of AHP is the pairwise comparison matrix. After determining the main and sub-criteria, the relative importance of each criterion is calculated [38]. The relative importance of the criteria can only be found by comparing two criteria with each other [39]. If the consistency rate obtained is less than 10%, it shows that the designed matrix is consistent. If this rate is greater than 10%, the relationship between the parameters should be checked; if there are errors, it should be redesigned, and the rate should be reduced below 10%.
- (1)
- Checking the Consistency Ratio
In Equation (1), λmax represents the eigenvalue of matrix M and is calculated using Equation (2).
Equation (2) specifies a weighted vector W. The Random Index (RI) value can be obtained from the standard table given by Saaty [37]). A value of ≤0.10 is acceptable for the Consistency Ratio (CR) (Saaty [37]).
After preparing the AHP comparison matrix, the Consistency Index (CI), Consistency Ratio (CR), and Consistency Check (CC) are calculated. If the CR value is less than 0.10 (10%), it is understood that the comparison matrix is consistent. CC shows whether the general consistency is within acceptable limits. The CI, CR, and CC values of the input data used in this model are given below (Table 6). It is seen that the CR value is less than 0.10 in this model; therefore, it is understood that the prepared comparison matrices are consistent. In basic criteria such as slope, excluded, urbanization, and transportation, CI values vary between 0.003 and 0.091, and CR values vary between 0.003 and 0.060. For hill shade, CI = 0.067 and CR = 0.075; for disaster risk areas, CI = 0.055 and CR = 0.096; for LULC, CI = 0.052 and CR = 0.047. The CR values of all criteria remain below the 10% threshold value; thus, it is concluded that the consistency of the pairwise comparison matrices is ensured, and the reliability of the model is maintained. The CI, CR, and CC values of the comparison matrices prepared for each criterion of the SLEUTH model are given in Table 6.
Table 6.
CI, CR, and Consistency Check matrices prepared for each criterion of SLEUTH model check values.
It shows the binary comparison matrix obtained with the AHP approach. In the matrix, 7 parameters, primarily urbanization, LULC, transportation, excluded, public plans that will affect the development direction of the city, and disaster risk areas, are weighted equally so that they have equal importance levels (1). On the other hand, the slope criterion is considered 1/5 less important than the seven criteria in question, and the hill shade criterion is considered 1/7 less important. These values are prepared based on expert opinions, and the settlement suitability levels of each parameter are graded. The comparison matrix of the model is given in Table 7.
Table 7.
Comparison matrix of SLEUTH model.
The AHP weight values calculated based on the pairwise comparison matrix in Table 7 and their percentage equivalents are given in Table 8. A weight of 0.156 (15.6 percent) was calculated for each of the criteria of urbanization, LULC, transportation, excluded, public planning that will affect the direction of the urbanization, and areas with disaster risk, thus emphasizing that these 6 parameters are equally determinant. The weight of the slope criterion was determined as 0.045 (4.5 percent), and the weight of the hill shade criterion was determined as 0.020 (2.0 percent). These results clearly show that slope and hill shade have lower priority compared to other criteria in geographical modeling.
Table 8.
AHP weight value of SLEUTH model.
After the comparison matrix of the model is prepared, the CI, CR, and CC values are calculated in the main parameters as calculated in the sub-parameters. In this model, the input data map used in the entire criterion is calculated as CI = 0.047, CR = 0.033, and CC = 3%. In this model, the CR value is seen to be less than 0.10; therefore, it is understood that the prepared comparison matrices are consistent. Each criterion and sub-criterion was weighted by taking the relative importance scale of the criteria developed by Saaty [37] as reference. The map of each criterion was converted to raster data format. After the coordinate system was converted to WGS84 UTM 37 zone, each pixel was prepared with a resolution of 25 × 25 m. The next step is to perform a weighted analysis using the Weighted Overlay tool. Weighted Overlay is a method of overlaying several raster datasets using a common measurement scale and weighting each according to its importance. These values are assigned to the layer converted into vector data format, and then the data is converted to raster format.
3. Results and Discussion
The criteria used in spatial decision-making processes within the scope of the SLEUTH model were evaluated with the AHP method, and comparison matrices were created for each criterion accordingly. The comparison matrix for the slope layer shows that low slope values (especially with AHP weights of 0.255 for the 0–1% range and 0.201 for the 1–2% range) are considered more suitable for settlement. This tendency reveals that flat or gently sloping areas are prioritized in planning due to their lower construction costs and lower risk against natural disasters. On the other hand, the hill shade layer supports a similar result; areas with a value of 0–30 were determined as the most preferred group, with an AHP value of 0.424. It is understood that topographic flatness is a dominant criterion in urbanization decisions.
LULC and exclusion criteria were also analyzed in detail in terms of suitability for settlement. The current LULC data was classified between 1 and 5 in terms of suitability for settlement; 1 represents the most suitable area for settlement, and 5 represents areas not suitable for settlement. Accordingly, LULC data was divided into five separate groups, and an AHP comparison matrix was created. Current LULC classifications show that transportation routes, current settlement surroundings, and public service areas in group 1 are accepted as the most suitable areas, with an AHP value of 0.399. On the other hand, forest areas, irrigated agricultural lands, and the surroundings of wastewater treatment plants, evaluated as group 5, were not found suitable for settlement, with an AHP weight of only 0.062. The excluded layer focuses on areas that need to be excluded and particularly evaluates archaeological sites and conservation areas with low weights; it presents a clear planning policy that cultural and natural heritage should be protected. Areas with high agricultural potential, such as the Harran Plain, were also evaluated among the regions to be excluded, demonstrating an approach compatible with sustainable LULC principles.
Other important criteria determining the direction of urbanization are urbanization, transportation, disaster risk, and public planning. Areas located 2 km away from the existing urbanization have the highest suitability degree, with an AHP value of 0.235; this situation shows that areas close to the city center are more open to development. Similarly, the transportation criterion was evaluated, and it was determined that areas 500 m away from highways were the most preferred areas, with an AHP value of 0.378. The fact that the geological units in the lowest risk group have a very high AHP value of 0.724 shows that a security-oriented approach is adopted in planning. The fact that the planned housing areas and planned tram lines in the public planning layer that will affect the development direction of the city have an AHP weight of 0.321 each reveals that public investments are effective in determining the direction of urbanization. When all these data are brought together, it is concluded that the SLEUTH model offers a comprehensive spatial planning tool supported by multi-criteria decision analysis. All input data were converted to vector data in the GIS environment, and the data were classified. In the next stage, the AHP comparison matrix was created, and the AHP weight value was determined. The determined values were processed in vector data form, and the spatial distribution maps of the AHP weight value of each data were created in raster format. The spatial distribution maps of the AHP weight value of the input data are given in Figure 4. The comparison matrices of the input data and the AHP weight value Supplementary Materials are given.
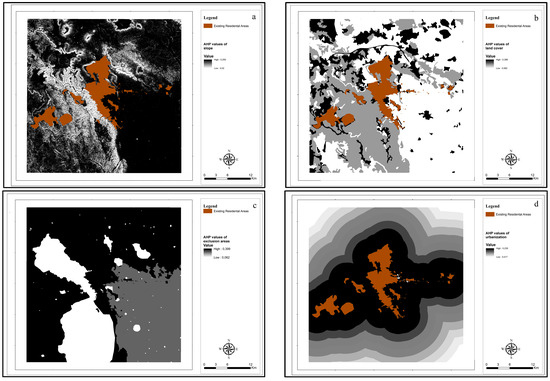
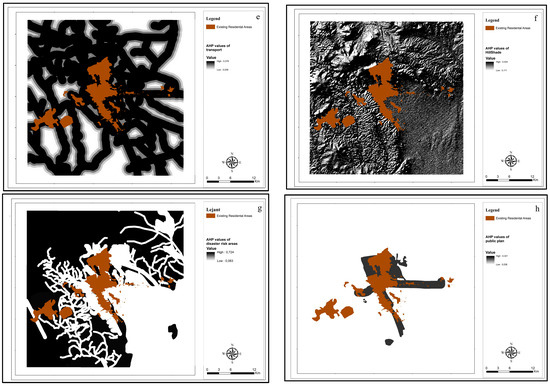
Figure 4.
Input layer AHP weight value spatial distribution maps. (a) Slope. (b) LULC. (c) Excluded. (d) Urbanization. (e) Transportation. (f) Hill shade. (g) Disaster risk areas. (h) Public plans.
The result map was created using the Weighted Overlay tool, which reclassified all input parameters between 1 and 9 (Figure 5). The spatial suitability map obtained in the study revealed the geographical distribution of the settlement suitability values defined by the SLEUTH model in the range of 1–9. In the areas around the existing urban core, the values correspond to the range of 7–9, representing the highest suitability level. This high suitability zone overlaps with the main transportation corridors of the city, especially in the east–west direction, confirming that the positive effect of infrastructure networks on settlement directs spatial expansion. Medium suitability zones (5–6) are concentrated in areas relatively far from the city center, where the topographic slope is moderate, and offer potential in gradual growth strategies despite infrastructure deficiencies. In contrast, low suitability areas in the range of 2–4 are concentrated in high-slope, forest areas, agricultural lands, and steppe ecosystems in the northeast and southeast directions; it has also been determined that protected areas are unsuitable for settlement.
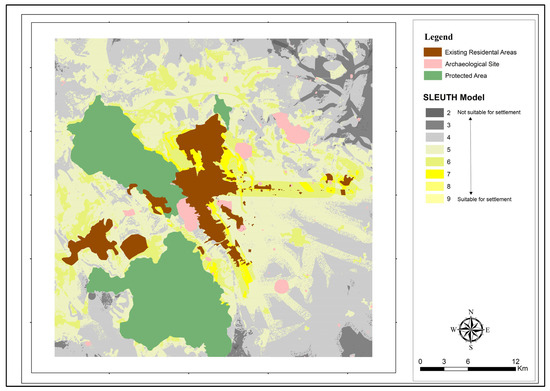
Figure 5.
Spatial suitability map of the SLEUTH model created according to AHP analysis.
4. Conclusions
According to 2023 data, a total of 1,069,844 people reside in the city center of Sanliurfa; 79.30% of this population lives in urban settlement areas and 20.70% in rural neighborhoods. The total size of existing settlement areas is calculated as 10,180.77 ha, and this value indicates an average population density of 105 people per hectare. Population projections for 2050 predict that the urban population will reach 1,722,548 people. Within the framework of this projection, considering the average land requirement per capita, the need for additional settlement area is calculated to cover 652,704 people by 2050, and it is concluded that a total of 6216.22 ha of new settlement area will be needed. As a result of the model applied in the study, it was determined that a total of 18,233.85 ha of area is suitable for settlement in classes 6, 7, 8, and 9 (Table 9). Therefore, it is understood that the land in question, which is determined by the model and deemed suitable for settlement, will meet the amount of additional land that Sanliurfa will need until 2050.
Table 9.
The amount of planned settlement area in the SLEUTH model.
The SLEUTH-based suitability analysis model provides an important tool for decision-makers in determining urban expansion corridors, potential growth areas, and sensitive ecosystems that need to be protected in the study area. The spatial distribution of settlement suitability values will guide the geographical prioritization of planned growth strategies and sustainable urban policy development.
The spatial pattern resulting from the SLEUTH model is the infrastructure pull on urban growth, while emphasizing the importance of planning medium suitability zones as priority expansion areas to minimize LULC conflicts. Findings regarding low suitability zones indicate the necessity of strict protection measures around protected areas and water basins that are ecologically and touristically sensitive. In this context, green belt applications and implementation of eco-policies from the perspective of sustainable urban growth stand out as a critical strategy for both the protection of natural resources and the control of planned urbanization.
Limitations of the model include the currentness of the DEM, LULC, and road network data used, and uncertainties in SLEUTH calibration. In future studies, it is recommended to integrate dynamic climate data, population projections, and socioeconomic indicators into the model to increase predictive power and to establish direct connections with spatial decision support systems. In this way, SLEUTH-based settlement suitability analyses can be used as a more holistic and flexible tool in urban planning and ecological protection processes.
Although this study utilizes the AHP as a decision-support tool for evaluating urban growth drivers, it is important to recognize the broader methodological landscape within which such models operate. Compared to dynamic simulation models such as SLEUTH, CLUE-S (Conversion of Land Use and its Effects), or data-driven approaches like Artificial Neural Networks (ANNs) and Random Forests, AHP does not simulate temporal urban expansion or spatial allocation of land use change.
However, the primary advantage of AHP lies in its ability to integrate both quantitative data and qualitative expert judgment into a structured hierarchical decision-making framework. This makes it particularly suitable for contexts where empirical data may be limited or where stakeholder participation and multi-criteria evaluation are essential. Moreover, AHP provides transparency in the weighting of criteria and enables consistency testing through CI and CR values, ensuring methodological rigor. The method’s reliance on expert input can introduce subjectivity, and its static nature limits its applicability for forecasting purposes. For future research, a hybrid modeling framework that integrates AHP with spatial simulation techniques could address these limitations and enhance the model’s explanatory and predictive capabilities.
Supplementary Materials
The following supporting information can be downloaded at: https://www.mdpi.com/article/10.3390/su17156833/s1.
Author Contributions
Conceptualization, S.N.G.; Methodology, S.N.G., and A.İ.K.; Software, S.N.G., and A.İ.K.; Validation, A.İ.K.; Formal analysis, S.N.G.; Resources, F.B.E.; Data curation, F.B.E.; Writing—original draft, S.N.G., and A.İ.K.; Writing—review & editing, F.B.E.; Visualization, A.İ.K., and F.B.E.; Supervision, F.B.E. All authors have read and agreed to the published version of the manuscript.
Funding
This research received no external funding.
Institutional Review Board Statement
Not applicable.
Informed Consent Statement
Not applicable.
Data Availability Statement
The raw data supporting the conclusions of this article will be made available by the authors on request.
Acknowledgments
This study is based on data and analyses presented in the doctoral dissertation of Songül NARYAPRAĞI, submitted to Harran University in partial fulfillment of the requirements for the degree of Doctor of Philosophy.
Conflicts of Interest
The authors state that there are no conflicts of interest.
Abbreviations
The following abbreviations are used in this manuscript:
| CA | Cellular Automata |
| GIS | Geographic Information System |
| MCDA | Directory of open access journals |
| AHP | Analytical Hierarchy Process |
| RS | Remote Sensing |
| LULC | Land Use/Land Cover |
| DEM | Digital Elevation Model |
References
- Raimbault, J.; Pumain, D. Spatial Dynamics of Complex Urban Systems Within an Evolutionary Theory Frame. In Handbook on Entropy, Complexity and Spatial Dynamics: A Rebirth of Theory? Chapter 11; Edward Elgar Publishing: Cheltenham, UK, 2021; p. 175. [Google Scholar] [CrossRef]
- Barthelemy, M. Modeling cities. Comptes Rendus. Physique 2019, 20, 293–307. [Google Scholar] [CrossRef]
- Batty, M. Cities and Complexity: Understanding Cities with Cellular Automata, Agentbased Models, and Fractals; MIT Press: Cambridge, MA, USA, 2007. [Google Scholar]
- Batty, M.; Longley, P.; Fotheringham, S. Urban growth and form: Scaling, fractal geometry, and diffusion-limited aggregation. Environ. Plan. A 1989, 21, 1447–1472. [Google Scholar] [CrossRef]
- Bozkurt, S.G.; Basaraner, M. Spatio-temporal investigation of urbanization and its impact on habitat fragmentation in natural ecosystems of Istanbul using Shannon’s entropy and landscape metrics in GIS. Environ. Dev. Sustain. 2024, 26, 26879–26907. [Google Scholar] [CrossRef]
- Goldstein, N.C.; Candau, J.T.; Clarke, K.C. Approaches to simulating the “March of Bricks and Mortar”. Comput. Environ. Urban Syst. 2004, 28, 125–147. [Google Scholar] [CrossRef]
- Tomlinson, R. The Canada Geographic Information System. In The History of Geographic Information Systems: Perspectives from the Pioneers; Prentice Hall: Saddle River, NJ, USA, 1998; pp. 21–32. [Google Scholar]
- Masucci, A.P.; Stanilov, K.; Batty, M. Limited urban growth: London’s street network dynamics since the 18th century. PLoS ONE 2013, 8, e69469. [Google Scholar] [CrossRef]
- Okacha, A.; Salhi, A.; Abdelrahman, K.; Fattasse, H.; Lahrichi, K.; Bakhouya, K.; Mondal, B.K. Balancing Environmental and Human Needs: Geographic Information System-Based Analytical Hierarchy Process Land Suitability Planning for Emerging Urban Areas in Bni Bouayach Amid Urban Transformation. Sustainability 2024, 16, 6497. [Google Scholar] [CrossRef]
- Patel, J.; Sharma, N.; Mohan, S. Introduction to Remote Sensing and GIS. In Smart Buildings and Cities with Remote Sensing and GIS; Chapman and Hall/CRC: Boca Raton, FL, USA, 2025; pp. 3–34. [Google Scholar]
- Irfan, M. Exploring the Role of GIS in Understanding Urban Spatial Density and City-Region Formation. Geogr. Inf. Syst. 2024. [Google Scholar] [CrossRef]
- White, R.; Engelen, G. Cellular automata and fractal urban form: A cellular modelling approach to the evolution of urban land-use patterns. Environ. Plan. A 1993, 25, 1175–1199. [Google Scholar] [CrossRef]
- Weng, Q. Modeling urban growth effects on surface runoff with the integration of remote sensing and GIS. Environ. Manag. 2001, 28, 737–748. [Google Scholar] [CrossRef]
- Zhang, Q.; Ban, Y.; Liu, J.; Hu, Y. Simulation and analysis of urban growth scenarios for the Greater Shanghai Area, China. Comput. Environ. Urban Syst. 2011, 35, 126–139. [Google Scholar] [CrossRef]
- Clarke, K.C.; Gaydos, L.J. Loose-coupling a cellular automaton model and GIS: Long-term urban growth prediction for San Francisco and Washington/Baltimore. Int. J. Geogr. Inf. Sci. 1998, 12, 699–714. [Google Scholar] [CrossRef]
- Clarke, K.C. Improving SLEUTH Calibration with a Genetic Algorithm. In International Workshop on Geomatic Approaches for Modelling Land Change Scenarios; SciTePress: Setúbal, Portugal, 2017; Volume 2, pp. 319–326. [Google Scholar]
- Chaudhuri, G.; Clarke, K. The SLEUTH land use change model: A review. Environ. Resour. Res. 2013, 1, 88–105. [Google Scholar]
- Jantz, C.A.; Goetz, S.J.; Donato, D.; Claggett, P. Designing and implementing a regional urban modeling system using the SLEUTH cellular urban model. Comput. Environ. Urban Syst. 2010, 34, 1–16. [Google Scholar] [CrossRef]
- Silva, E.A.; Clarke, K.C. Calibration of the SLEUTH urban growth model for Lisbon and Porto, Portugal. Comput. Environ. Urban Syst. 2002, 26, 525–552. [Google Scholar] [CrossRef]
- Xiaoqing, W.U.; Yuanman, H.U.; Hongshi, H.E.; Fengming, X.I.; Rencang, B.U. Study on forecast scenarios for simulation of future urban growth in Shenyang City based on SLEUTH model. Geo-Spat. Inf. Sci. 2010, 13, 32–39. [Google Scholar]
- Şevik, Ö. Application of SLEUTH Model in Antalya. Master’s Thesis, Middle East Technical University, Ankara, Turkey, 2006. [Google Scholar]
- Tanrıöver, A.A. Modelling the Urban Growth of Adana Using Remote Sensing and Geographical Information Systems. Ph.D. Thesis, Çukurova University, Institute of Science, Department of Landscape Architecture, Adana, Turkey, 2011. [Google Scholar]
- Herold, M.; Goldstein, N.C.; Clarke, K.C. The spatiotemporal form of urban growth: Measurement, analysis and modeling. Remote Sens. Environ. 2003, 86, 286–302. [Google Scholar] [CrossRef]
- Solecki, W.D.; Oliveri, C. Downscaling climate change scenarios in an urban land use change model. J. Environ. Manag. 2004, 72, 105–115. [Google Scholar] [CrossRef]
- Jantz, C.A.; Goetz, S.J.; Shelley, M.K. Using the SLEUTH urban growth model to simulate the impacts of future policy scenarios on urban land use in the Baltimore-Washington metropolitan area. Environ. Plan. B Plan. Des. 2004, 31, 251–271. [Google Scholar] [CrossRef]
- Yang, X.; Lo, C.P. Using a time series of satellite imagery to detect land use and land cover changes in the Atlanta, Georgia metropolitan area. Int. J. Remote Sens. 2002, 23, 1775–1798. [Google Scholar] [CrossRef]
- Claggett, P.R.; Jantz, C.A.; Goetz, S.J.; Bisland, C. Assessing development pressure in the Chesapeake Bay watershed: An evaluation of two land-use change models. Environ. Monit. Assess. 2004, 94, 129–146. [Google Scholar] [CrossRef]
- Martellozzo, F.; Amato, F.; Murgante, B.; Clarke, K.C. Modelling the impact of urban growth on agriculture and natural land in Italy to 2030. Appl. Geogr. 2018, 91, 156–167. [Google Scholar] [CrossRef]
- Liu, F.; Sun, W.L. A Bottom-Up Quantitative Mechanism for Updating the Self-Modification Parameters in the Sleuth Model. ISPRS Ann. Photogramm. Remote Sens. Spat. Inf. Sci. 2020, 3, 309–316. [Google Scholar] [CrossRef]
- Jahanishakib, F.; Mirkarimi, S.H.; Salmanmahiny, A.; Poodat, F. Land use change modeling through scenario-based cellular automata Markov: Improving spatial forecasting. Environ. Monit. Assess. 2018, 190, 332. [Google Scholar] [CrossRef]
- Clarke, K.C.; Hoppen, S.; Gaydos, L. Methods and Techniques for Rigorous Calibration of a Cellular Automaton Model of Urban Growth. In Proceedings of the Third International Conference/Workshop on Integrating GIS and Environmental Modelling, Santa Barbara, CA, USA, 21–26 January 1996; pp. 21–25. Available online: https://pubs.usgs.gov/publication/70202456 (accessed on 1 April 2025).
- Clarke, K.C.; Hoppen, S.; Gaydos, L. A self-modifying cellular automaton model of historical urbanization in the San Francisco Bay area. Environ. Plan. B Plan. Des. 1997, 24, 247–261. [Google Scholar] [CrossRef]
- Dietzel, C.; Clarke, K.C. Toward optimal calibration of the SLEUTH land use change model. Trans. GIS 2007, 11, 29–45. [Google Scholar] [CrossRef]
- Gigalopolis. Urban and Land Cover Modeling. 2009. Available online: www.ncgia.Ucsb.edu/projects/gig/ (accessed on 15 April 2025).
- Button, K. The road maintenance initiative; Building capacity for policy reform--volume 1. Report on the policy seminars: Steve Carapetis, Hernan Levy and Terje Wolden World Bank, Washington DC, 1991, pp xiv+ 81. Util. Policy 1993, 3, 88–89. Available online: https://econpapers.repec.org/article/eeejuipol/v_3a3_3ay_3a1993_3ai_3a1_3ap_3a88-89.htm (accessed on 20 April 2025). [CrossRef]
- Behrens, R.B.; Kane, L.A. Road capacity change and its impact on traffic in congested networks: Evidence and implications. Dev. South. Afr. 2004, 221, 587–602. [Google Scholar] [CrossRef]
- Saaty, T.L. A scaling method for priorities in hierarchical structures. J. Math. Psychol. 1977, 15, 234–281. [Google Scholar] [CrossRef]
- Chandran, B.; Golden, B.; Wasil, E. Linear programming models for estimating weights in the analytic hierarchy process. Comput. Oper. Res. 2005, 32, 2235–2254. [Google Scholar] [CrossRef]
- Sharma, M.J.; Moon, I.; Bae, H. Analytic hierarchy process to assess and optimize distribution network. Appl. Math. Comput. 2008, 202, 256–265. [Google Scholar] [CrossRef]
Disclaimer/Publisher’s Note: The statements, opinions and data contained in all publications are solely those of the individual author(s) and contributor(s) and not of MDPI and/or the editor(s). MDPI and/or the editor(s) disclaim responsibility for any injury to people or property resulting from any ideas, methods, instructions or products referred to in the content. |
© 2025 by the authors. Licensee MDPI, Basel, Switzerland. This article is an open access article distributed under the terms and conditions of the Creative Commons Attribution (CC BY) license (https://creativecommons.org/licenses/by/4.0/).