Article

The Impact of Preferential Policy on Corporate Green Innovation: A Resource Dependence Perspective

1
School of Economics, Nankai University, Tianjin 300071, China
2
Business School, Nankai University, Tianjin 300071, China
*
Author to whom correspondence should be addressed.
Sustainability 2025, 17(15), 6834; https://doi.org/10.3390/su17156834
Submission received: 29 May 2025 / Revised: 18 July 2025 / Accepted: 19 July 2025 / Published: 28 July 2025

Abstract

Government support has long been viewed as a key driver of sustainable transformation and green technological progress. However, the underlying mechanisms (“how”) through which preferential policies influence green innovation, as well as the contextual conditions (“when”) that shape their effectiveness, remain insufficiently understood. Drawing on resource dependence theory, this study develops a dual-mediation framework to investigate how preferential tax policies promote both the quantity and quality of green innovation—by enhancing R&D investment as an internal mechanism and alleviating financing constraints as an external mechanism. These effects are especially salient among non-state-owned enterprises, firms in resource-constrained industries, and those situated in environmentally challenged regions—contexts that entail higher dependence on external support for sustainable development. Leveraging China’s 2017 R&D tax reduction policy as a quasi-natural experiment, this study uses a sample of high-tech small- and medium-sized enterprises (SMEs) to test the hypotheses. The findings provide robust evidence on how preferential policies contribute to corporate sustainability through green innovation and identify the conditions under which policy tools are most effective. This research offers important implications for designing targeted, sustainability-oriented innovation policies that support SMEs in transitioning toward more sustainable practices.

1. Introduction

Against the backdrop of intensifying global climate change and escalating calls for sustainable development, green transformation has become a strategically urgent priority on the global modernization agenda. Prior studies systematically explore the antecedent influencing factors of green innovation mainly from three aspects: the individual, firm, and institutional levels. At the individual level, the experiences and backgrounds of management teams (Sang et al., 2024) [1] directly shape the green innovation path of enterprises. At the firm level, internal capabilities such as R&D funding (Xu et al., 2020) [2] and technological reserves serve as the key foundation for innovation, providing necessary resources and technical support for innovation activities. At the institutional level, government policies constitute an important component of the institutional environment, with government subsidies and environmental regulations being the two core dimensions. Government subsidies, in the forms of financial allocations, preferential policies, and other forms, on one hand, directly relieve the R&D funding constraints of enterprises (Sun et al., 2022) [3] and, on the other hand, convey signals of support to reduce external financing costs, motivating enterprises to increase their investment in green technologies (Shi and Zhou, 2024) [4]. Meanwhile, environmental regulations also act on the innovation willingness and capabilities of enterprises. Peng et al. (2021) [5] found that environmental regulations promote innovation behavior by enhancing enterprises’ willingness to engage in green innovation.
Governmental preferential policies, such as preferential policies, have become a key instrument for countries to incentivize enterprises’ green innovation. From the perspective of international policy practices, varied preferential policies have taken shape: In 2008, France, in 2010, Australia, and in 2015, Ireland, respectively, transformed their original hybrid R&D tax reductions into simpler volume-based schemes, providing tax credits or allowances for all R&D expenditures. The United States has long adopted an incremental policy, granting preferential treatment only to R&D expenditures exceeding a historical baseline. South Korea, Portugal, and Spain employ “volume + incremental” hybrid tax credits, while the Czech Republic, Slovakia, and Turkey implement hybrid tax allowances. In recent years, most countries have been committed to enhancing the accessibility, simplicity, and generosity of R&D tax reductions, with the choice of policy models being closely linked to the objectives of “increasing the overall scale of R&D” or “encouraging high growth of R&D” [6]. This aligns with China’s 2017 reform of increasing the tax deduction ratio for R&D expenditures in technology-based SMEs, jointly building a policy ecosystem that incentivizes green innovation.
In academic discourse, the impact of preferential policies on green innovation has continued to garner extensive attention. Existing research has primarily focused on the “what question—that is, the effects these preferential policies have on green innovation. However, the findings remain mixed, and scholars have yet to reach a consensus on the overall impact of such policies. On one hand, some scholars argue that preferential policies help internalize the positive externalities of green product innovation, enhance returns, lower risk, and encourage green R&D through leverage mechanisms (Bai et al., 2019; Guo et al., 2018; Dangelico, 2016) [7,8,9]. Others, however, caution that firms may engage in strategic behavior—such as inflating R&D inputs or reallocating funds toward non-innovative purposes—to meet eligibility criteria without substantially enhancing their green technological capabilities (He et al., 2020; Yang et al., 2017) [10,11]. These inconsistent findings underscore the complex and multifaceted mechanisms through which such policies operate, as well as the importance of internal and external contingencies in shaping their effectiveness. Consequently, 
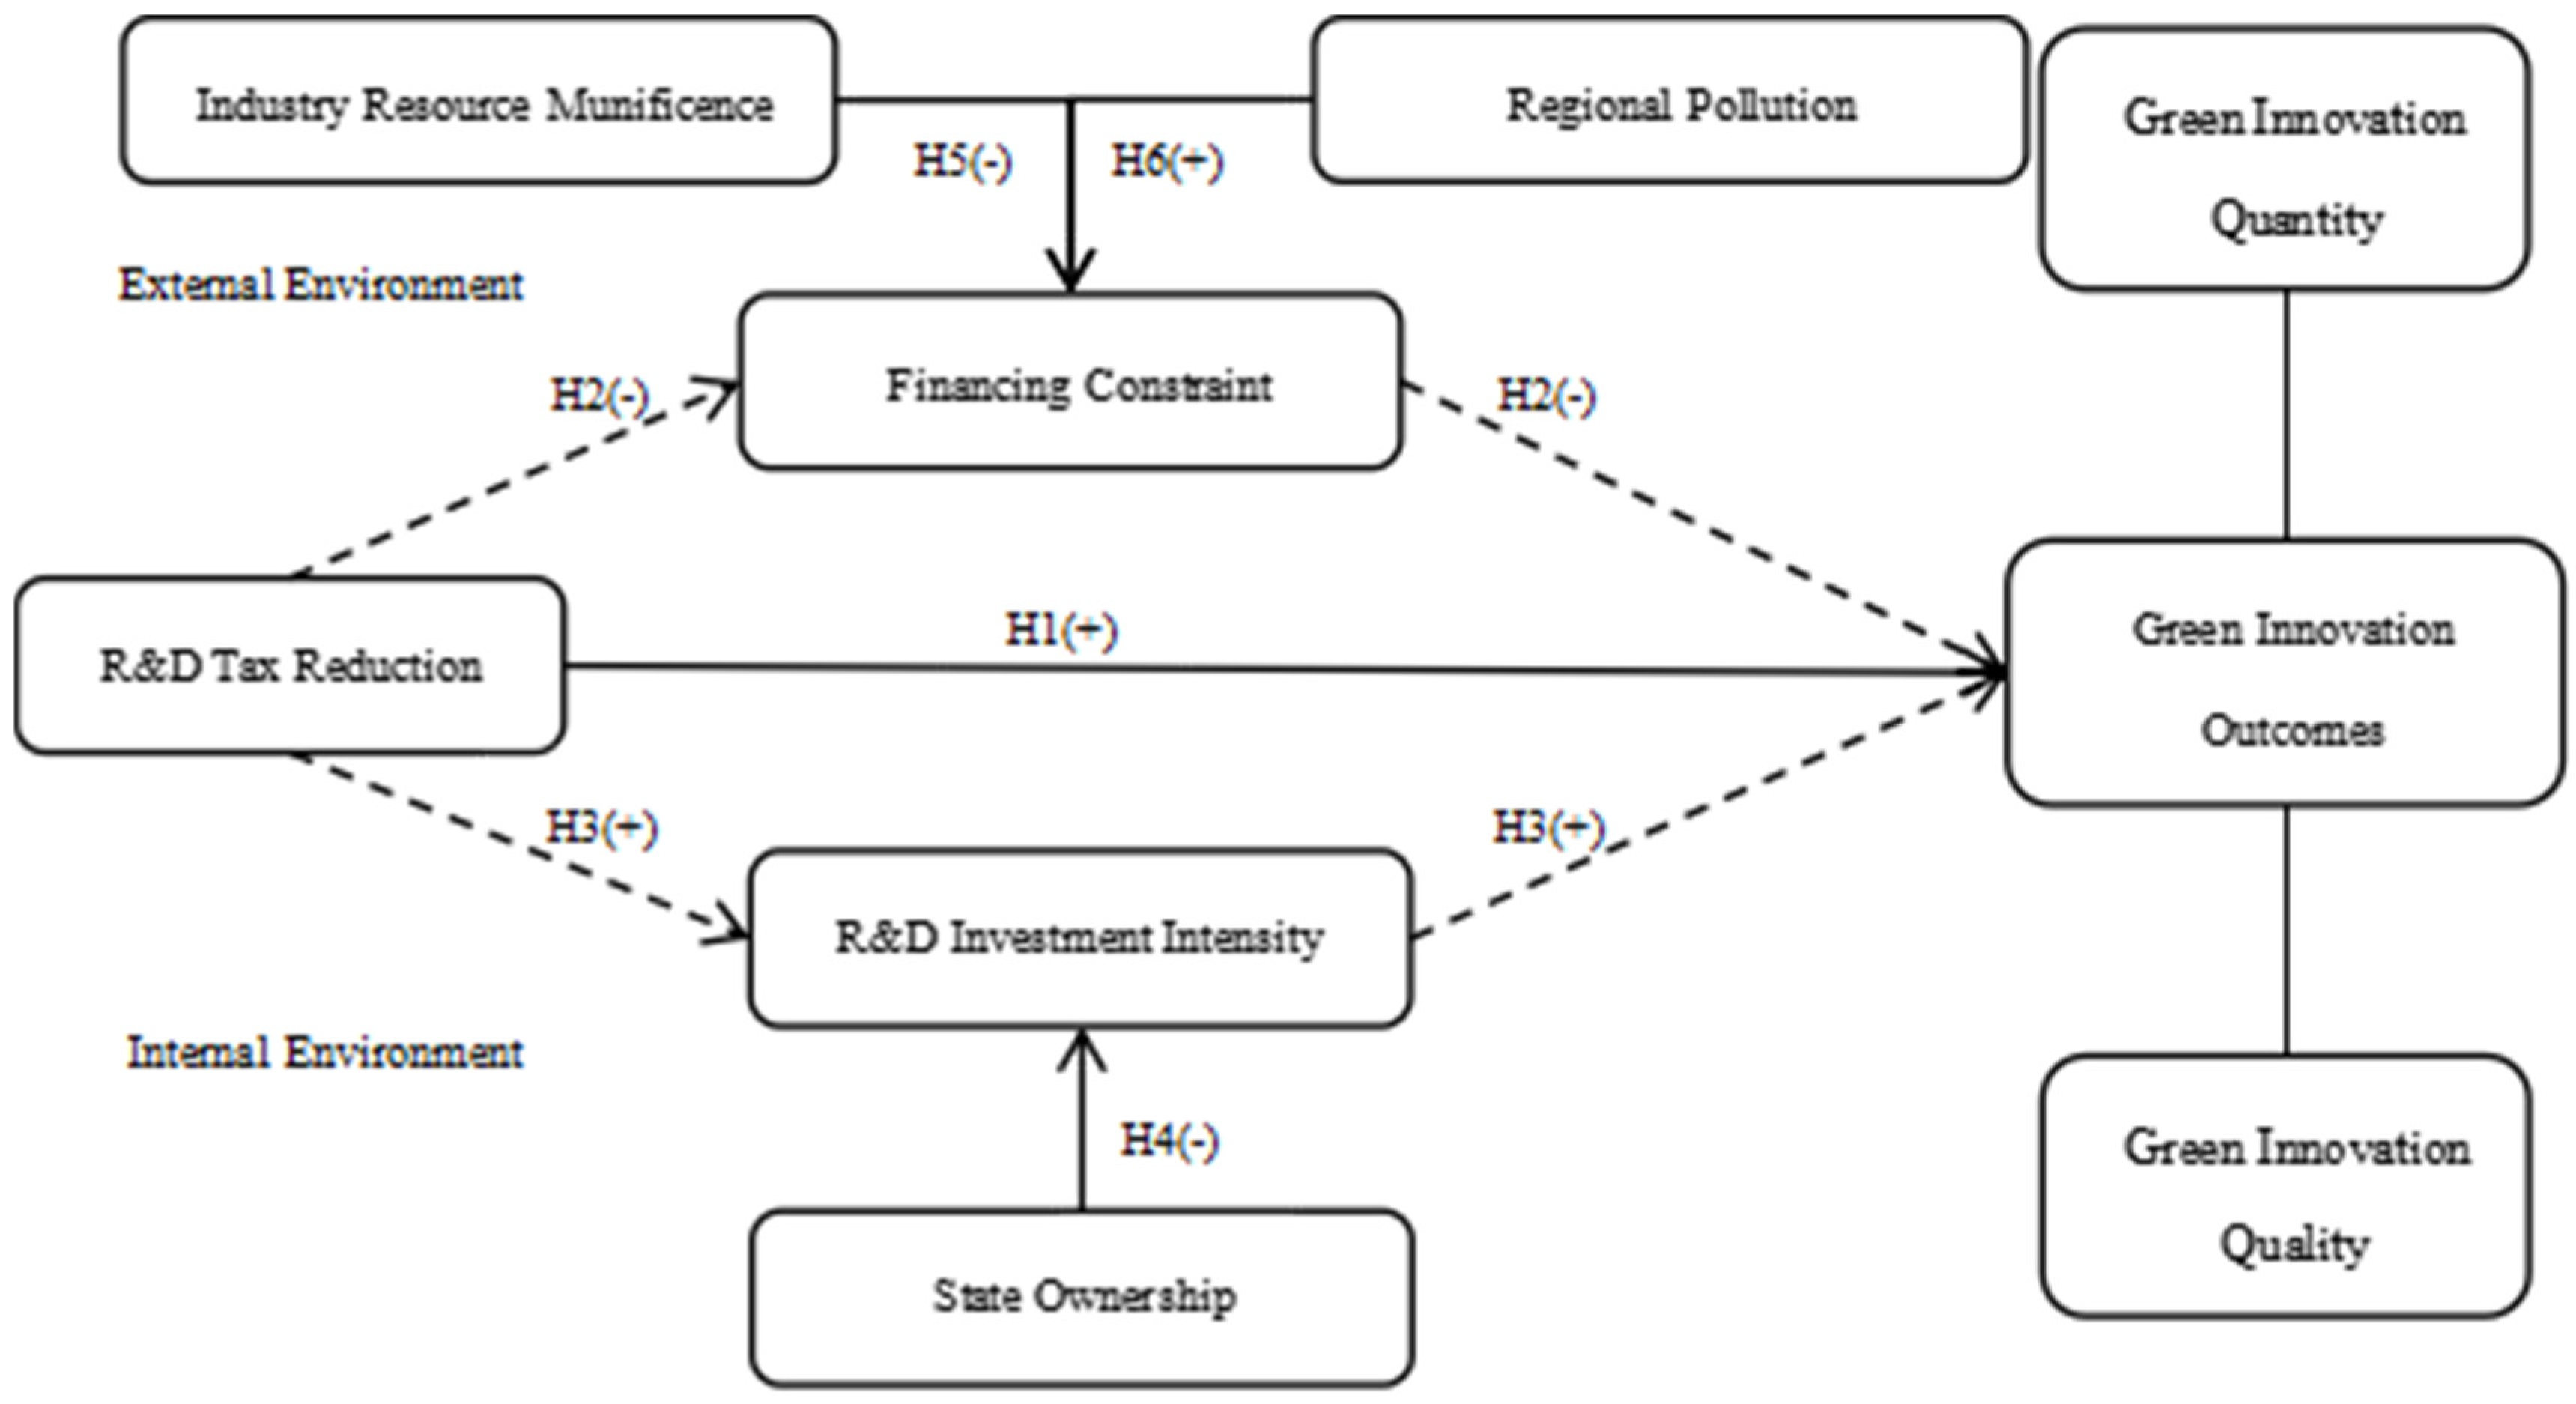
a more pressing and nuanced question concerns how preferential policies function and when preferential policies prove most effective. Moreover, prior research has predominantly focused on large firms, often neglecting the critical role of SMEs. Given that SMEs represent the majority of firms and their green transformation is essential to the success of nationwide sustainability efforts, this oversight presents a significant gap in the literature (citations). In response to these gaps, this study employs a resource dependence framework—encompassing both internal and external mechanisms—to examine how R&D tax reductions influence green innovation outcomes among SMEs, thereby addressing the “how” question. Furthermore, we incorporate multi-level analyses to explore the contingency factors that moderate these dependence relationships, shedding light on the “when” question by identifying the conditions under which policy interventions are more or less effective.
This study leverages China’s 2017 policy reform, which raised the tax-deductible proportion of R&D expenditures for technology-based SMEs, as a quasi-natural experiment to empirically examine the proposed theoretical framework. Due to their limited operational scale, relatively weak capacity for risk management, and pronounced information asymmetries, SMEs tend to rely heavily on preferential government policies (Dong and Men, 2014) [12]. Guided by resource dependence theory (Pfeffer and Salancik, 1979) [13], we argue that such reliance on governmental resources grants the state a considerable degree of regulatory influence over firms’ strategic behavior. In this context, preferential policies, particularly R&D tax reductions, perform a dual role. Internally, they reduce firms’ actual tax burdens and enhance financial liquidity, thereby strengthening firms’ capacity for innovation. Externally, these policies signal improved creditworthiness to external stakeholders, contributing to the alleviation of financing constraints. Furthermore, we contend that the effectiveness of preferential policies is shaped by a range of contextual contingencies that alter the nature of resource dependence. Specifically, firms operating in resource-constrained industries, those with non-state ownership, and those located in environmentally degraded regions are more reliant on preferential policies and related government support. This heightened dependence increases the responsiveness of such firms to preferential policies, thereby amplifying the intended incentive effects. We select SMEs listed on the Small- and Medium-sized Enterprise Board, the Growth Enterprise Market, and the National Equities Exchange and Quotations (commonly known as the New Third Board) from 2013 to 2020 as the sample for empirical analysis. The regression results consistently support our theoretical hypotheses, confirming the robustness and explanatory power. To further ensure the validity of our findings, we conduct a series of robustness checks, including alternative model specifications, placebo tests, and propensity score matching, all of which continue to provide statistically significant support for our core hypotheses.
This study makes several important contributions. First, it integrates the resource dependence perspective and develops a dual-mediation framework through which R&D tax reductions influence green innovation, specifically, by lowering marginal R&D costs and alleviating financing constraints, thereby addressing the “how” question in the existing literature. Second, this study extends this framework by examining multi-level contingency factors that moderate these dependence relationships, offering a coherent and comprehensive explanation of “when” preferential policies are most effective. Third, by focusing on SMEs, this research addresses the prevailing large-firm bias in prior studies and enhances the generalizability of policy evaluations across different firm sizes. In doing so, this study also offers practical insights for policymakers and SMEs seeking to advance green transformation efforts.

2. Theory and Hypotheses Development

2.1. R&D Tax Reduction Impacts on the Quantity and Quality of Corporate Green Innovation

Previous studies have predominantly treated innovation outcomes as a monolithic construct, failing to fully capture their multidimensional nature or categorical distinctions, thereby limiting a nuanced understanding of their heterogeneous effects. In this study, we divide innovation outcomes into two dimensions: quantity and quality. Our empirical analysis demonstrates that both dimensions exhibit positive impacts on corporate green innovation. Furthermore, we disentangle the underlying mechanisms into internal and external pathways, thereby offering a dual-dimensional framework to explain how preferential policies stimulate green innovation.
According to RDT, firms do not operate independently but are highly dependent on access to key resources from their external environment (Pfeffer and Salancik, 1978) [13]. This theory emphasizes that organizations need to obtain resources from the external environment in order to maintain their survival and sustainable development, especially when resources are scarce or unstable, and the dependence on external policies, finance, and technology is particularly prominent. Against the backdrop of accelerating global green transformation, SMEs often encounter a structural “resource hunger” dilemma when attempting to scale up green innovation activities (Colclough et al., 2019) [14]. In green innovation research, the “quantity–quality trade-off” theory (Liu, 2014) [15] suggests that firms often face a trade-off between innovation quantity and quality during the innovation process. And governments often use preferential policies such as R&D tax reductions to promote green innovation among enterprises (Dangelico, 2016; Song et al., 2020) [9,16].
In the quantitative dimension, the green innovation process usually requires a large amount of upfront investment (Wang, Xinhong and Guo, Danping, 2024) [17], including the research and development of green processes, the acquisition of energy-saving and sustainable equipment, and the introduction and cultivation of professional and technical talents. Given the significant positive externality of green innovation (Yuan et al., 2019) [18], SMEs are in dire need of external incentives to support them in the absence of sufficient endogenous resources. R&D tax reductions, as an external resource supply tool, can alleviate the resource constraints by reducing the R&D costs of enterprises and increasing the level of disposable funds, enabling them to simultaneously carry out multiple green R&D projects, expand the size of their innovation teams, or purchase standardized environmental protection equipment, which can increase in the short term the green innovation’s measurable statistical output.
In the quality dimension, green quality innovation requires enterprises to develop and apply new technologies, processes, and methods that can enhance the environmental performance and quality of products or services. SMEs are relatively small in scale, with insufficient financial reserves and weak technological strength (Dong and Men, 2014; Tamazian and Rao, 2010) [12,19], and are inherently deficient in green quality innovation. From the perspective of financial support, preferential policies can directly increase the disposable capital of enterprises (Wu Fei and Lai, 2022) [20]. Enterprises can use the saved funds to purchase advanced green R&D equipment, attract high-end green technology talents, and carry out green technology R&D projects. In addition, green quality innovation is characterized by high costs, high risks, long cycles, and uncertainty (Oduro et al., 2022; Xiang et al., 2022) [21,22], which makes enterprises apprehensive when investing in innovation. Preferential policies can reduce the cost of innovation, increase the expected benefits of innovation (Song et al., 2020) [16], and enhance the incentives for enterprises to engage in green quality innovation.
In this study, green quantity innovation is defined as the number of green patents generated by a firm within a certain period, reflecting the breadth and activity of innovation related to green technologies. Green quality innovation is defined as the proportion of green invention patents to total green patents, indicating a firm’s technological breakthroughs and level of sophistication in sustainable development. Based on these analyses, this study puts forward the following hypotheses.
Hypothesis 1a (H1a): 
R&D tax reductions can promote the quantity of green innovation in SMEs.
Hypothesis 1b (H1b): 
R&D tax reductions can promote the quality of green innovation in SMEs.

2.2. A Dual-Mediation Framework

We now analyze the mediating mechanisms from RDT both internally and externally. During the green transition, government support serves as a critical institutional resource for firms navigating systemic challenges. The government promotes corporate green innovation through preferential policies by stimulating internal R&D investment and alleviating external financing constraints. This dual-channel mechanism—reducing internal costs and mobilizing external capital—collaboratively works to enhance both the quantity and quality of firms’ green innovation.
Internally, preferential policies lower the marginal costs of innovation, enabling firms to reallocate internal financial resources toward green sustainable technology development and expand their R&D investment intensity. Empirical studies have demonstrated that R&D tax reductions significantly enhance corporate R&D investment (Aghion et al., 1990; Buyse et al., 2020) [23,24]. For instance, Bloom et al. (2002) [25] examined the impact of R&D tax reductions across nine OECD countries over 19 years and found that such policies substantially increase firms’ R&D expenditures. Similarly, Hall et al. (2000) [26] analyzed the effects of R&D tax reductions in OECD countries and concluded that every USD 1 in R&D tax reductions stimulates USD 1 in additional R&D spending. SMEs generally face difficulties such as a shortage of capital and narrow financing channels in the process of development, and their limited capital often needs to make difficult trade-offs between production and operation, market expansion, and innovation. While the tax relief brought by the preferential policy of adding deduction for R&D expenses can directly increase the disposable cash flow of enterprises, alleviate the inhibitory effect of financial constraints on R&D activities (Hall, 1993; Duguet, 2004) [27,28], and support them to carry out multiple green R&D projects or purchase standardized and sustainable equipment simultaneously, which thereby rapidly boosting the number of green patents (Wang and Guo, 2024) [17]. Increased R&D intensity not only directly enhances technological reserves (Lin and Monga, 2010) [29] but also pushes firms to invest resources in high-barrier green technologies (Zhang and Wang, 2017) [30], such as developing new processes with better environmental performance. This sustainable investment helps to increase the proportion of green invention patents and form high-quality innovations with substantial breakthroughs. It effectively improves the quality of its own green innovation. Based on the above analyses, we draw the following hypotheses.
Hypothesis 2a (H2a): 
R&D tax reductions can increase R&D investment intensity in SMEs.
Hypothesis 2b (H2b): 
R&D tax reductions promote SMEs’ green innovation by enhancing their R&D investment intensity.
Externally, preferential policies enhance investors’ enthusiasm, thereby attracting external financing and reducing capital constraints, which is beneficial for the green innovation of enterprises. The literature on financing constraints suggests that the cost of raising external funds is higher than the cost of using internal funds in the presence of information asymmetry and that this difference in the cost of internal and external financing of the firm due to transaction costs and asymmetry between information and the internal present constrains the firm’s financing activities to a certain extent (Fazzari et al., 1988; Kaplan and Zingales, 1997) [31,32]. Severe information asymmetry between firms and the market may lead to credit rationing, forcing firms to forgo potentially profitable innovation projects. Since innovative projects are generally riskier and more capital-intensive than routine operations, they are particularly vulnerable to financing constraints (Fazzari and Athey, 1987) [33]. Harhoff and Körting (1998) [34] found that financing constraints have an impact on firms’ innovations and that this impact is particularly significant in SMEs. Information asymmetry is prevalent in financial markets, and formal financial institutions will ration credit to loan applicants for prudential and safety reasons. Compared with large enterprises or platform companies, SMEs have more serious information asymmetry problems and will be subject to credit rationing in terms of price and quantity (Stiglitz and Weiss, 1981) [35]. Previous research has shown that alleviating financing constraints can promote cleaner production and sustainable innovation (Xu and Kim, 2022) [36]. On the one hand, according to the signaling theory, the preferential policy of enterprises enjoying additional deduction for R&D expenses can send a positive signal to the outside world, which in turn, has an impact on the innovation ability of enterprises (Xiao Chunming et al., 2024) [37], enabling SMEs to expand the scale of green patent layout, especially in the short term, accelerating standardized technological outputs, and increasing the number of innovations; on the other hand, R&D tax reductions can help to reduce the tax burden of enterprises and stimulate capital investment by reducing the tax burden of enterprises, promoting capital investment and reducing costs, which helps to alleviate financing constraints, improve the financing situation of enterprises (Song et al. 2020, Dimos and Pugh, 2016) [16,38], allocate more resources to the activities of enhancing the complexity of patented technologies, and improve the quality of green innovation of enterprises. Therefore, this study puts forward the following hypotheses.
Hypothesis 3a (H3a): 
R&D tax reductions can alleviate financing constraints for SMEs.
Hypothesis 3b (H3b): 
R&D tax reductions can promote SMEs’ green innovation by mitigating their financing constraints.

2.3. Multi-Level Contextual Moderators

2.3.1. Firm-Level State Ownership

We now examine potential moderators that affect the aforementioned resource dependence relationships. At the micro level, we focus on firm ownership structure. Due to differences in internal capacity and external policy sensitivity, the green innovation responses of technology-based SMEs to R&D tax reductions exhibit substantial heterogeneity. Accordingly, tax reduction-driven green innovation shows significant divergence in both quantity and quality across different firms and regions. Specifically, non-state-owned enterprises (non-SOEs) demonstrate greater expansion in green innovation output and higher quality improvements under preferential policy incentives.
In the implementation of R&D tax reduction, the policy effect is more significant in non-SOEs. Based on RDT, the survival and development of enterprises highly depend on external resources, and the availability and degree of dependence on external resources can significantly moderate the impact of policies on corporate behavior. State-owned enterprises (SOEs), by virtue of their close ties with the government and institutional advantages, have diversified financing channels, relatively soft budget constraints, and weak internal constraints (Zhang et al., 2022) [39]. This enables SOEs to break through budget limits to a certain extent, resulting in a low degree of dependence on the external resource supplementation brought by R&D tax reductions. Consequently, it weakens the marginal utility of tax reduction policies on their innovative behaviors. In contrast, non-SOEs, due to the lack of direct government connections, limited resource acquisition capabilities, and insufficient risk tolerance, face enormous uncertainties and stringent cost constraints in the process of green innovation. Such resource dilemmas significantly strengthen non-SOEs’ dependence on external policy resources. When R&D tax reduction policies alleviate their financing bottlenecks through external resource injection, non-SOEs demonstrate more remarkable marginal improvements in both resource acquisition and capability enhancement. This enables tax reduction policies to exert a stronger main effect in non-SOEs, i.e., the promotion effect on green innovation output and quality improvement is more prominent. Therefore, we propose Hypothesis 4.
Hypothesis 4 (H4): 
R&D tax reductions exert a stronger positive impact on both the quantity and quality of green innovation in non-state-owned SMEs compared to their state-owned counterparts.

2.3.2. Industry-Level Resource Constraints

In the implementation of R&D tax reduction, the policy effect is more significant in industries with severe resource constraints. Based on RDT, industries with strong resource constraints tend to face more severe resource constraints and financial sustainability pressures (Zhang et al., 2018) [40]. This structural resource scarcity severely restricts their capacity for innovative investment, leading such industries to develop a strong dependence on R&D tax reduction policies that can supplement external resources. In this context, R&D tax reduction policies inject cash flow directly into enterprises by reducing the marginal cost of R&D, significantly alleviating corporate financial pressures. The timely supplementation of external resources notably enhances the feasibility of green innovation investment for enterprises (Fresard, 2010) [41]. Conversely, the lower the industry constraint level, the more redundant resources an industry can deploy, and the fewer external restrictions it faces. Therefore, in industries with severe resource constraints, R&D tax reduction policies exhibit a more prominent main effect in promoting green innovation. Based on these arguments, we draw Hypothesis 5.
Hypothesis 5 (H5): 
The higher the level of industry resource munificence, the weaker the positive impact of R&D tax reductions on both the quantity and quality of SMEs’ green innovation.

2.3.3. Macro-Regional Pollution Levels

In the implementation of R&D tax reductions, the preferential policy effects are more significant in regions with higher pollution levels. Based on RDT, high-pollution-emission regions typically face stricter environmental governance pressures and public health costs (Wang et al., 2023) [42], requiring more funding for pollution control tasks such as ecological restoration and environmental monitoring. However, local resources are often insufficient to meet these needs due to long-term pollution-induced depletion, leading to a significant increase in dependence on external resources such as capital and technology. Meanwhile, regional environmental governance objectives force policy resources to tilt toward pollution reduction, further enhancing the targeted transmission of R&D tax reductions (Lin and Zhang, 2023) [43], which enables them to more accurately influence enterprises’ green innovation processes. In contrast, low-pollution regions face weaker external resource constraints, and enterprises have insufficient urgency to carry out green innovation. The driving effect of R&D tax reduction policies on corporate innovative behaviors is limited, and enterprises’ dependence on policies is relatively low. Therefore, differences in the degree of external resource dependence significantly moderate the promoting effect of R&D tax reduction policies on corporate green innovation, making the main effect of policies in promoting green innovation more prominent in high-pollution regions.
Hypothesis 6 (H6): 
The higher the pollution level in the region where SMEs are located, the stronger the positive impact of R&D tax reductions on both the quantity and quality of their green innovation (See Figure 1).

3. Method

3.1. Sample Selection and Data Sources

In 2017 [44], China issued a notice on raising the proportion of pre-tax deductions for research and development expenses of small- and medium-sized technology-based enterprises, officially implementing preferential policies to increase the proportion of pre-tax deductions for research and development expenses of small- and medium-sized technology-based enterprises. Taking this preferential policy as a typical case, we selected small- and medium-sized enterprises listed on the New Third Board during 2013–2020 as research samples. The rationale for this sample selection is as follows. First, the 2017 preferential policy [44] jointly released by the Ministry of Finance, the State Taxation Administration, and the Ministry of Science and Technology raised the pre-tax deduction for R&D expenses of small- and medium-sized technology enterprises that did not form intangible assets from 50% to 75% and increased the amortization ratio for those forming intangible assets from 150% to 175%. This preferential policy was implemented from 2017 to 2019. To comprehensively assess the effectiveness of this preferential policy, we set 2013–2016 as the baseline period (pre-policy), 2017–2019 as the preferential policy implementation period, and 2020–2023 as the post-policy period, thereby enabling a comprehensive analysis of the policy’s dynamic impact. Second, we select firms listed on the New Third Board as research subjects because these enterprises are more likely to meet the criteria for being identified as technology-based SMEs. According to detailed regulations issued subsequently by the Ministry of Science and Technology, the Ministry of Finance, and the State Taxation Administration, technology-based SMEs typically meet conditions such as having no more than 500 employees and annual revenue or total assets not exceeding RMB 200 million. Moreover, data from the Wind database shows that the average R&D expenditure ratio of firms listed on these boards exceeds 4%, significantly higher than firms on the Main Board, making them more suitable for evaluating the effects of the R&D incentive policy [45]. To measure green innovation, we utilized patent data from the China National Research Data Service (CNRDS). After excluding special treatment enterprises (ST), financial institutions, and observations with missing key variables, the final balanced panel dataset contained 7048 enterprise-year observations. To control for outlier interference, continuous variables were Winsorized at the 1st and 99th percentiles.

3.2. Variable Definition

3.2.1. Independent Variables

First, we define a policy time dummy variable (time) to distinguish the pre- and post-policy periods: time = 0 for years prior to the policy implementation (i.e., before 2017), and time = 1 for years following the policy implementation (i.e., 2017 and beyond). Based on this, we further construct a treatment group dummy variable (treat). Using the full sample of SMEs listed on the New Third Board from 2013 to 2020, we identify firms that meet the official criteria for being classified as technology-based SMEs in accordance with government regulations [46]. These qualified firms are assigned GP = 1.

3.2.2. Dependent Variable

In this study, we use greenrd as the dependent variable, which measures the level of green innovation development within a firm within a given period [47]. Greenrd serves as the most direct representation of a corporate green innovation outcome, including green invention patents, green utility model patents, and design patents. Invention patents typically indicate more substantial technological breakthroughs, whereas utility model patents usually involve new technical solutions relating to product shape, structure, or combination and are generally regarded as lower levels of technological complexity and innovation. We measure a firm’s green innovation capability by the number of green patents it holds. Furthermore, we categorize green innovation into two types based on the nature of the patents: substantive innovation and strategic innovation. Invention patents are considered high-quality substantive innovation, while utility model patents and design patents are classified as low-quality strategic innovation and, therefore, generate greenrdq as dependent variables. (See Table 1).

3.2.3. Control Variables

Based on the characteristics of the research sample, we include the following control variables in the analysis: Tobin’s Q (TQ), market power (Mkp), operating cash flow as a proportion of total assets (CASH), capital intensity (CI), leverage ratio (LEV), fixed assets as a proportion of total assets (FOA), return on equity (ROE), board size (BS), and CEO duality (Mix). (Table 2).

3.3. Design of Empirical Model

3.3.1. Green R&D Tax Reductions and Firm Innovation

Based on the above procedures, we construct a Difference-in-Differences (DID) model:
g r e e n r d = β 0 + β 1 × t r e a t + β 2 × t i m e + β 3 × t r e a t × t i m e + γ × C O N s + μ + λ + ε
At this juncture, drawing extensively from the existing literature, we hypothesize that the R&D tax reductions will have a beneficial impact on green innovation among SMEs. As detailed earlier, the variables “treat” and “time” represent the treatment group indicator and the time dummy variable, respectively. To empirically assess the policy’s effect, we employ the DID methodology. This involves two stages of differencing: firstly, between the treatment and control groups and, secondly, between the pre- and post-policy implementation periods. The DID estimator thus obtained isolates the policy-induced change in outcomes for the treatment group, providing a rigorous and accurate evaluation of the policy’s impact on green innovation among SMEs.

3.3.2. Mediation Effect Analysis

According to the theoretical analysis, adjustments to R&D tax reductions can reshape corporate financing environments and alleviate financial constraints, thereby influencing their investment decisions in green innovation. At the same time, financing constraints may hinder firms’ innovation capabilities by limiting their ability to engage in R&D and innovation activities. R&D tax reductions, by incentivizing investment and reducing costs, have the potential to improve corporate financing conditions, enhance innovation capabilities, and promote the implementation of green innovations. Therefore, we construct the following mediation effect analysis model:
g r e e n r d = β 0 + β 1 × t r e a t + β 2 × t i m e + β 3 × t r e a t × t i m e + β 4 × K Z + γ × C O N s + μ + λ + ε
K Z = β 0 + β 1 × t r e a t + β 2 × t i m e + β 3 × t r e a t × t i m e + γ × C O N s + μ + λ + ε
If β 4 in Equation (2) and β3 in Equation (3) are statistically significant, there is a mediation effect as proposed in the theoretical analysis; at the same time, the β3 in the R&D Equation determines whether the financing constraint (KZ) functions as a full or partial mediator.
According to theoretical analysis, adjustments in R&D tax reductions can alter the intensity of corporate R&D investment, that is, the proportion of R&D expenses, thereby impacting green innovation. Policies such as the super deduction for R&D expenses and R&D tax exemptions for high-tech enterprises directly reduce the cost of innovation. Based on the theory of cost internalization, when the government bears part of the R&D costs, the marginal R&D benefits for companies increase, thus enhancing their willingness to invest in R&D.
g r e e n r d = β 0 + β 1 × t r e a t + β 2 × t i m e + β 3 × t r e a t × t i m e + β 4 l r d r a t i o + γ × C O N s + μ + λ + ε
l r d r a t i o = β 0 + β 1 × t r e a t + β 2 × t i m e + β 3 × t r e a t × t i m e + γ × C O N s + μ + λ + ε
If both β4 in Equation (4) and β3 in Equation (5) are statistically significant, it indicates the existence of a mediation effect as proposed in the theoretical analysis. Furthermore, the significance of β3 in the RD Equation determines whether R&D investment intensity serves as a full mediator or a partial mediator in the relationship.

4. Results

4.1. Baseline Results

Table 3 presents the results of our baseline regressions. Column (1) reports results without controlling for covariates, while Column (2) includes all control variables. The results show that the DID interaction term is significant in both cases, indicating that R&D tax reductions for small- and medium-sized enterprises significantly promote green innovation at a 0.1% confidence level. Column (3) shows the results of analyzing with the Diff command, and it can be seen that its coefficient is similar to the original method, leading to a robust conclusion that H1 is true.
Columns (4) to (6) show the research models with the quality of green innovation as the dependent variable, and their analysis results are basically consistent with those with the quantity of green innovation as the dependent variable.

4.2. Analysis of Mediating Effects

According to the analysis of the mediation effect in the model based on the original hypothesis, we first estimate the direct effect of policy implementation and its impact on corporate green innovation through reducing financing constraints and promoting increased R&D investment. The results show that tax reductions have reduced corporate financing constraints and increased R&D investment intensity. Both effects have a significant positive impact on the corporate green innovation index, further supporting H2 and H3. The results are shown in Table 4.
Among them, Columns (1) and (2) indicate that the R&D tax policy coefficient (did) for the KZ is −0.448 **, suggesting that the policy effectively reduces corporate financing constraints, which aligns with theoretical expectations. However, it is important to note that the KZ index is an inverse indicator; a decrease in its value indicates a reduction in financing constraints. The financing constraint coefficient is −0.010 * (p < 0.1), indicating that the higher the degree of financing constraints, the lower the level of green innovation. This result is consistent with the expectations of financing constraint theory, but the effect size is relatively small.
The third to sixth columns conducted triangular verification using the WW index and SA index, respectively, indicating the robustness of this mediating variable result and eliminating model issues caused by multicollinearity.
Columns (7) and (8) show that the regression coefficient of R&D tax reductions on R&D intensity is 0.485 (1%), indicating that R&D tax reductions significantly increase the R&D intensity of enterprises, meeting the second requirement for the mediation effect test. When both policy and R&D intensity are included, the coefficient of R&D intensity is 0.658 (1%), suggesting a significant positive impact on green innovation. The coefficient of R&D tax reductions decreases from 0.846 to 0.526 but remains significant (1%).
Subsequently, a mediation effect analysis was conducted using green innovation quality as the dependent variable. The results showed that the coefficient of R&D tax reduction on the KZ index was −0.448 **, indicating that policy implementation significantly alleviated corporate financing constraints. The coefficient of financing constraints on green innovation quality was −0.010 (10%), suggesting that higher financing constraints correspond to lower green innovation quality. From the perspective of R&D investment, the coefficient of R&D tax reduction on R&D intensity (lrdratio) was 0.485 (1%), while the coefficient of R&D intensity on green innovation quality was 0.658 (1%). This further validates the original hypothesis (Table 5 and Table 6).
The regression results presented in Columns (1) and (2) demonstrate the effects after incorporating mediating variables into the baseline model, with Column (1) analyzing green R&D investment intensity (greenrd) and Column (2) examining green patent quality (greenrdq) as dependent variables. The key independent variable, GP (R&D tax reductions), maintains strongly positive and statistically significant coefficients, confirming that government support consistently promotes both the quantity and quality of corporate green innovation. Notably, the financial constraint variable KZ shows significantly negative coefficients, suggesting that firms facing financing difficulties tend to reduce green innovation activities, with this inhibitory effect being more pronounced for patent quality than investment intensity.
The analysis reveals particularly interesting findings regarding the centered variables (prefixed with c_). The centered financial constraint measure c_KZ exhibits negative coefficients, indicating that firms deviating from average financial constraints show reduced green innovation, possibly due to either excessive financial slack or severe constraints. Conversely, the centered R&D ratio c_lrdratio demonstrates positive effects (0.164 and 0.347 ***), suggesting that firms maintaining R&D investment above industry level are more likely to achieve both higher green innovation input and output quality. The substantially larger coefficient for c_lrdratio in Column (2) implies that sustained R&D investment contributes more significantly to innovation quality than quantity.
The models show good explanatory power with adjusted R-squared values of 0.342 and 0.435, respectively, and maintain consistency through the inclusion of both year and firm fixed effects. The results underscore the importance of considering both direct policy effects and mediating financial factors when analyzing corporate green innovation behavior, while the differential impacts on innovation quantity versus quality provide nuanced insights for policymaking. The centering approach helps isolate the pure marginal effects of financial constraints and R&D intensity by removing baseline differences, thereby offering more precise estimation of these variables’ influence on green innovation outcomes.
The results of the Variance Inflation Factor tests presented in Table 7 demonstrate that the mediating variables in our regression model exhibit acceptable levels of multicollinearity, with all VIF values falling within a reasonable range between 2.03 and 3.27. These values are substantially below the commonly recommended threshold of 5, indicating no severe multicollinearity concerns that would compromise the stability or interpretability of our regression estimates. The reciprocal VIF values, ranging from 0.306 to 0.493 with a mean of 0.439, further confirm this conclusion, as none approach the problematic threshold of 0.5. While the “did” variable shows a moderately higher VIF of 3.27 compared to other predictors, this level remains within acceptable bounds and does not necessitate variable removal. The majority of variables cluster in the 2.0–2.5 VIF range, suggesting well-balanced independence among predictors. It is worth noting that certain variables like KZ and lrdratio appear multiple times with slightly different values, likely reflecting alternative model specifications. The overall pattern of results supports the appropriateness of our model specification and provides confidence in proceeding with the planned mediation analysis without requiring multicollinearity corrections. These findings suggest that the regression coefficients can be interpreted meaningfully, though researchers may wish to monitor variables with VIFs above 2.5 in sensitivity analyses as a precautionary measure. The absence of extreme VIF values reinforces the robustness of our analytical approach and the reliability of subsequent statistical inferences drawn from this model.

4.3. Heterogeneity Analysis—Moderating Effects

Table 8 and Table 9 present the results of heterogeneity analysis on the quantity and quality of green innovation, categorized by whether they are state-owned enterprises, whether they belong to heavily polluting industries, and different levels of urban innovation. In terms of equity nature, state-owned enterprises do not significantly benefit from R&D tax reductions, possibly because their nature inherently emphasizes environmental protection and green innovation, thus excluding the significant improvement in green innovation driven by R&D tax reductions. Moreover, state-owned enterprises may already possess a high level of environmental awareness and green innovation capabilities, so the effect of tax reductions on enhancing their green innovation is not significant. In contrast, non-state-owned enterprises are more likely to be guided by tax reductions to engage in substantial green innovation. From the perspective of ROA of industries, only low ROA enterprises show significant results. Regarding PM pollution levels, enterprises in cities with lower PM pollution levels have stronger policy promotion effects.
The regression results presented in the table demonstrate the robustness of our research model examining the impact of R&D tax reductions on corporate green innovation, particularly through heterogeneity analysis using key grouping variables. Three critical moderating variables were selected for subgroup analysis: non-state-owned enterprises (non-SOE), firms with low return on assets (lowROA), and enterprises with high PM2.5 emissions (PM). The consistent statistical significance (at the 1% level) of these variables across all model specifications confirms their robust moderating effects. Notably, the coefficients for non-SOE remain positive and highly significant, suggesting that GP particularly effectively stimulates green innovation in private enterprises compared to their state-owned counterparts. Similarly, the lowROA variable shows remarkably stable coefficients, indicating that financially constrained firms respond more strongly to environmental R&D tax reductions. The PM variable exhibits an interesting pattern, with its impact magnitude increasing substantially in the greenrdq models (from 0.043 to 0.665 *), implying that high-pollution firms demonstrate particularly pronounced responses in quality-oriented green innovation. The inclusion of year and firm fixed effects (Year Y; Id Y) across all specifications, along with consistently large sample sizes (N = 7048) and satisfactory adjusted R-squared values (ranging from 0.056 to 0.253), further reinforces the model’s reliability. These findings collectively validate that our core conclusions about the heterogeneous effects of GP on green innovation hold across different firm characteristics and innovation quality measures (See Table 10).

4.4. Robustness Test

4.4.1. Parallel Trend Test

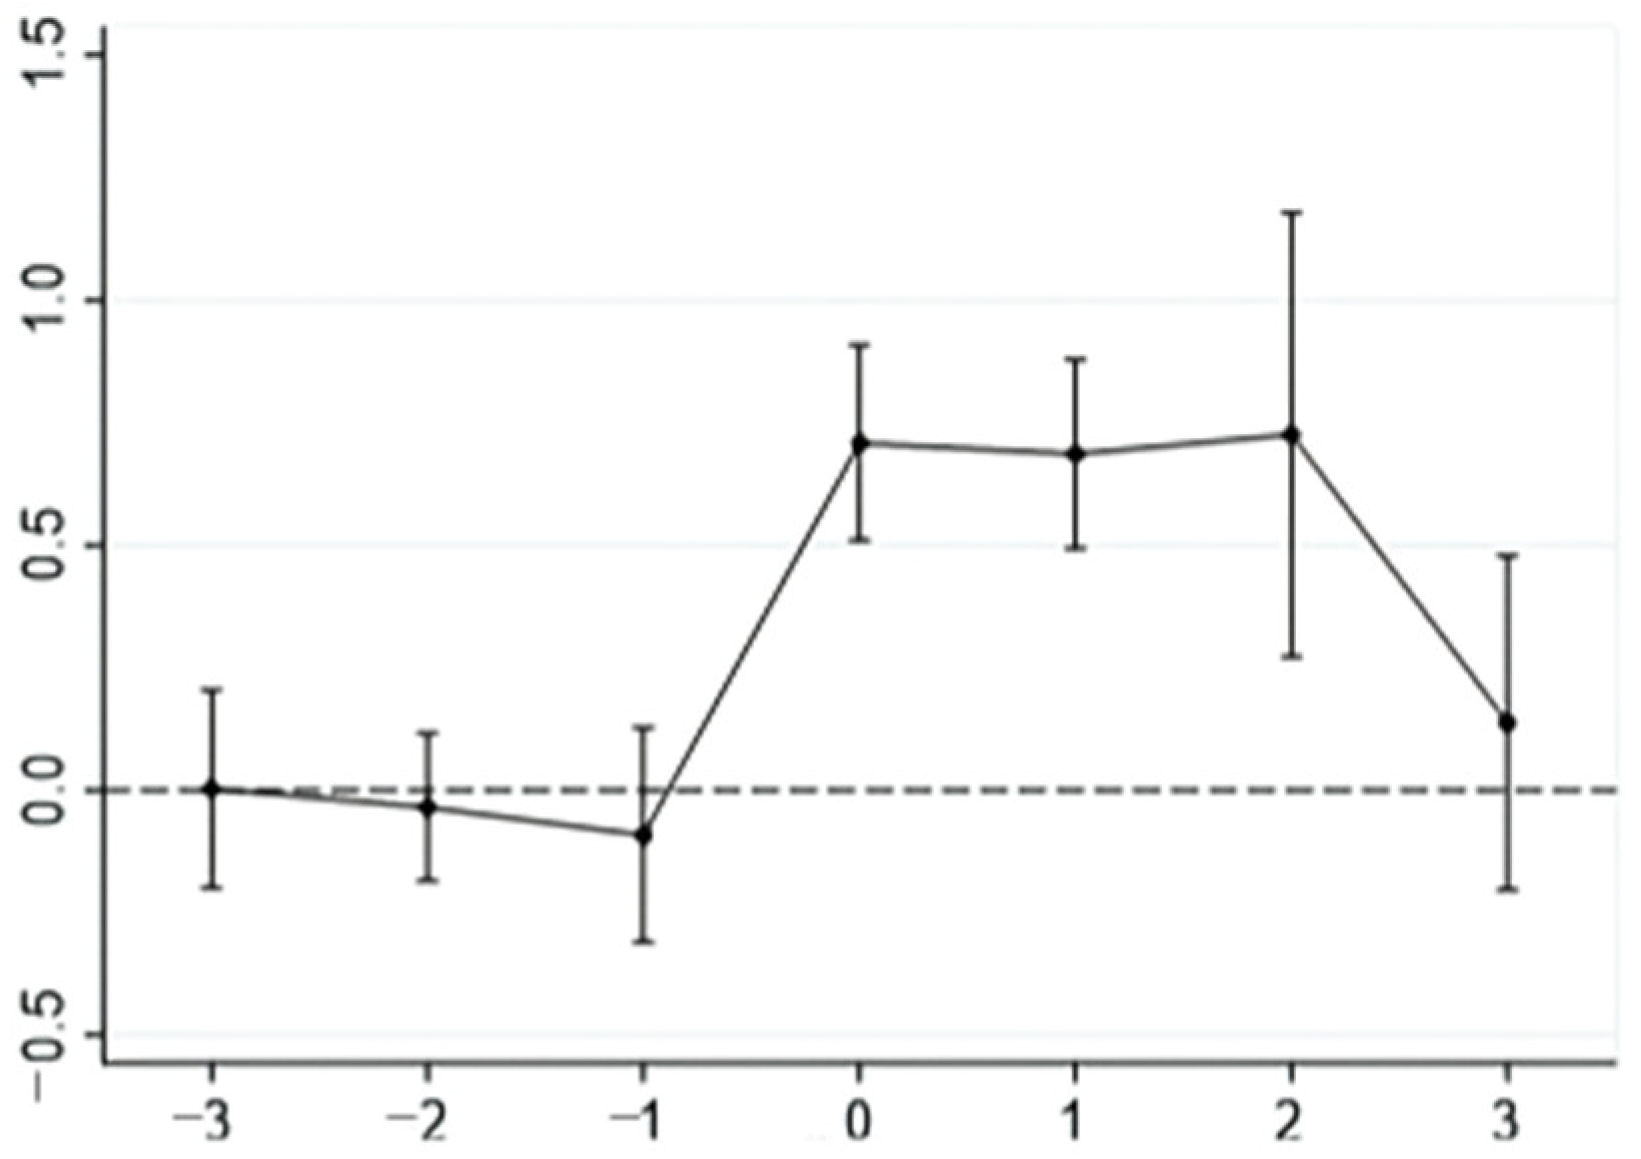
To verify that the green innovation trends of firms affected by policy (the treatment group) and those unaffected by policy should be parallel in the absence of R&D tax policy intervention, this section compares the changes in green innovation indicators before and after policy implementation using a parallel assumption test. The coefficients and significance levels of the interaction term are examined through testparm; the p-value is significantly less than 0.001, indicating that the parallel trend hypothesis holds. The parallel trend was also tested graphically, as shown in the following figure: before policy implementation, the two lines showed a parallel trend, but after implementation, a significant difference emerged.
Furthermore, the event study method was used to conduct parallel trend tests. The results showed that the first three periods of the policy met the requirements for parallel trend tests. During the policy period, the confidence intervals for all three experimental periods did not include 0. After the policy period ended, the confidence interval included 0 again. In this study, the parallel trend test criteria were fully met, and the testing standards were satisfied.
The analysis in this study examines the confidence intervals across seven consecutive periods, spanning from Period −3 to Period 3. The mean values demonstrate a clear upward trend over time, starting at 0 in Period −3 and progressively increasing to 0.734 by Period 0 (See Figure 2).
In the initial periods (−3 to −1), the confidence intervals are relatively narrow, reflecting lower variability in the data. Although the mean points of the −2 period and the −1 period are not at 0, their confidence intervals still contain 0, which means they are still in a relatively parallel range. The transition to positive periods (0 through 3) reveals both higher mean values and greater dispersion.
The insignificant parallel trend test in the third policy period reflects the diminishing effect of the R&D tax reductions over time. R&D tax reductions often have a short- to medium-term impact, as firms exhaust their capacity to respond to the policy. By the third period, the marginal benefit of the policy could fade, leading to convergence between treated and control groups. Firms may have already optimized their behavior in earlier policy phases, leaving little room for additional effects in later stages. This aligns with the “front-loading” phenomenon common in policy evaluations.

4.4.2. Placebo Experiment

Table 11 presents the results of further placebo experiments, with policy implementation times advanced by one and two periods, respectively. The results show that the did coefficient remains significant. Considering the possibility of other concurrent policies affecting the outcomes, further analysis is needed for verification. Meanwhile, Column (3) shows the regression conducted without the influence of this policy, where the DID coefficient is negative, inconsistent with the experimental results, further confirming the robustness of the findings.

4.4.3. PSM-DID

First of all, the balance of covariates was tested. The results showed that all covariates passed the balance test. Afterward, the model was matched with nearest neighbors, and the results remained significant. Upon further processing, the benchmark regression was analyzed again, and fixed effects were added; both analyses yielded significant results. Then, the model was matched with calipers, indicating that the model passed the caliper match, further confirming its robustness (Table 12).
The empirical analysis employs a propensity score matching and Difference-in-Differences approach to evaluate the treatment effects on both the quantity and quality of green innovation. The baseline PSM-DID results demonstrate statistically significant positive effects, with the treatment variable showing coefficients of 0.179*** for innovation quantity and 0.277*** for innovation quality. These estimates, derived from models incorporating year and firm fixed effects along with comprehensive controls, establish a robust foundation for the treatment’s efficacy.
To validate the findings, multiple robustness checks were conducted. For instance, nearest-neighbor matching (1:1 without replacement) yielded a treatment coefficient of 0.172* for innovation quantity (greenrd), aligning with the baseline result. Caliper matching (δ = 0.01) further confirmed robustness, with coefficients of 0.181* (greenrd) and 0.269* (greenrdq)**. Additionally, placebo tests using pseudo-treatment groups showed insignificant effects (p > 0.1), ruling out spurious correlations. These results collectively reinforce the conclusion that the treatment significantly enhances both the scale (quantity) and value (quality) of green innovation.

4.4.4. Other Robustness Tests

Furthermore, this study conducts the following robustness tests: 1. The measurement of green innovation levels is changed to the proportion of green innovation in the current year, as shown in Columns (1) and (2). 2. Considering the varying implementation efforts and levels across different regions, this study introduces provincial-level control variables to account for unobservable factors at the regional level, as shown in Columns (3) and (4). 3. To avoid the impact of missing observations from individual companies on the regression results, samples with missing data during the study period are excluded and re-returned to the regression, as shown in Columns (5) and (6). 4. Excluding other policy interference and adding other policies that affect the green innovation of enterprises, this study selects pilot policies with similar times, including green finance pilot, low-carbon city pilot, and green factory identification, as shown in (7) and (8). 5. Considering the differences in industry demand for green innovation, most of the main bodies of green innovation are manufacturing enterprises, and heavy polluting industries have a greater demand for green innovation. Therefore, only manufacturing and heavy polluting industries are retained for regression. The results are shown in Columns (9) and (10). All these results indicate that the conclusions of this study remain valid after robustness tests (Table 13).

5. Discussion

5.1. Theoretical Contribution

Our study aims to make the following theoretical contributions. First, grounded in RDT, our study develops a dual-mediation analytical framework that identifies and verifies the mechanisms through which preferential policies promote green innovation by enhancing internal R&D investment intensity and alleviating external financing constraints. In contrast to the existing literature that primarily focuses on direct policy effects or isolated mechanisms, our study emphasizes the synergistic effect between internal innovation capacity enhancement and external financial environment improvement, thereby systematically unpacking how policy instruments shape corporate green transformation through resource allocation channels. This mechanism-based explanation not only expands the research on policy impact pathways in the green innovation literature but also deepens the applicability of RDT in the context of green transition, addressing the theoretical gap surrounding the question of how preferential policies take effect.
Second, our study extends the theoretical lens of RDT by identifying multi-level contextual factors that moderate the effectiveness of tax reductions. By incorporating the firm ownership type, industry resource munificence, and regional pollution level as moderating variables, we find that the positive effect of tax reductions on green innovation is more pronounced among firms with non-state ownership, those operating in resource-constrained industries, and those located in regions with higher levels of pollution. These findings suggest that preferential policies are not equally effective across contexts but rather more pronounced under specific dependence conditions. This insight enriches the theoretical understanding of resource dependence dynamics under evolving institutional environments and provides a clear analytical framework for answering the question of when tax reductions are most effective, thereby extending the boundary conditions and contextual applicability of RDT in preferential policy research.
Third, our study focuses on SMEs, a pivotal but under-researched group in green transformation, thereby addressing the structural bias in the existing literature that tends to concentrate on large firms. Under the RDT framework, we demonstrate that SMEs, due to their inherent resource vulnerabilities, are more responsive to preferential policies. By empirically identifying the significant positive effects of tax reductions on both the quantity and quality of green innovation among SMEs, our study expands the theoretical scope of green innovation policy research across firm size dimensions, deepens the understanding of behavioral responses in high-dependence organizational contexts, and enhances the applicability and explanatory power of RDT within heterogeneous firm structures.
Fourth, this study compares policy designs across multiple jurisdictions, providing cross-institutional evidence to support the generalizability of its findings. For example, South Korea’s cap-and-trade program—targeting NOx;, SOx, and particulate emissions from 136 factories—promoted green patenting both before and after implementation, supporting the view that “policy interventions drive innovation through resource injection” (Tolliver et al., 2020) [47]. In northern Italy, the Emilia-Romagna R&D subsidy program boosted patent applications, especially among small firms (Bronzini and Piselli, 2016) [48], reinforcing this study’s conclusion that “resource-constrained firms are more responsive to policy incentives.” Similarly, OECD data show that R&D tax incentives yield an average ratio of 1.4, with stronger effects on experimental development than on basic research [49]. This aligns with this study’s finding that “R&D tax relief enhances both the quantity and quality of green innovation in SMEs.” Together, these cases illustrate how resource dependency interacts with institutional environments to shape the effectiveness of innovation-driven policies. This contributes a cross-national framework for understanding the heterogeneous impacts of green innovation policies, moving beyond the constraints of single-context theoretical models.

5.2. Practical Implications

The findings of our study offer several important implications for policymakers seeking to improve the effectiveness of preferential policies. First, greater policy attention should be directed toward non-state-owned SMEs, which typically possess weaker resource endowments and higher dependence on external reductions. Priority should be given to these firms in terms of eligibility criteria and application procedures to improve the efficiency of policy resource allocation. Second, for industries with severe resource constraints, tax reductions should be supplemented with industry-specific tools—such as innovation subsidies, R&D vouchers, or university-industry collaboration support—to strengthen firms’ capacity to absorb and utilize policy resources. Third, in heavily polluted regions, tax reductions should be aligned with local environmental governance goals. For example, green innovation subsidies could be linked with regional emission reduction targets or integrated into carbon trading schemes to foster synergy between environmental performance and fiscal support.
For firms, the findings of our study highlight the need to act on two fronts during the green transition. First, firms should increase sustained investment in green R&D to strengthen their internal technological capabilities and enhance long-term innovation output. Second, they should actively identify and respond to government incentives, such as preferential policies, to alleviate financing constraints and reduce R&D costs by leveraging external institutional resources. For SMEs in particular, establishing a dual-drive mechanism that combines internal capacity building with external policy alignment can facilitate steady progress in green transformation amid both policy support and market pressures.

5.3. Limitations and Future Research

There are many deficiencies in the data, research perspectives, and methods of this study, which need to be further improved in the future to reveal the mechanism of preferential tax policies on the green innovation of SMEs in a more comprehensive and in-depth manner.
This study has explored the moderating effect of firm heterogeneity (such as ownership and industry differences) on policy effects, but the corporate governance, market competition, and industry sustainable development interactions of factors are still worth digging into. For example, this study analyzes the differences in the innovation response of enterprises with different governance structures under tax reductions or explores the impact of industry technology maturity on the effect of R&D tax reductions. In addition, it is necessary to conduct in-depth research on the potential negative effects of tax policies, such as exploring whether enterprises have short-term innovation behaviors, whether they are overly dependent on policy subsidies, and how to optimize policy design to avoid incentive distortions.
Through the DID method and the mediating effect model, we clearly reveal the short-term impact mechanism of tax reductions. The implementation of the fourth phase of the Golden Tax will bring more refined tax collection and sustainable management and data collection capabilities and provide new possibilities for the accurate matching of tax policies and enterprise innovation behaviors. Combined with new tax big data, such as the fourth phase of the Golden Tax, the dynamic matching relationship between policies and corporate behaviors can be more accurately evaluated. Future research can extend the observation window and explore the long-term cumulative effects of policies, such as whether firms form a stable green innovation path dependence due to continuous policy support.

6. Conclusions

This study leverages China’s 2017 R&D tax reduction policy as a quasi-natural experiment and selects SMEs listed on the New Third Board from 2013 to 2020 as the research sample. Employing a DID approach and a mediating effect model, this study examines the impact of preferential policies on corporate green innovation and explores the underlying mechanisms and contextual conditions under which these effects are manifested. The results indicate that tax reductions significantly enhance both the quantity and quality of green innovation among SMEs, suggesting that preferential policies can effectively facilitate green transformation under targeted policy interventions. Further analysis reveals that these effects are primarily transmitted through two channels: increased R&D investment intensity and the alleviation of financing constraints. Heterogeneity analysis shows that the policy impact is more pronounced among firms with non-state ownership, operating in resource-constrained industries, and located in regions with higher levels of pollution. These findings remain robust across a series of empirical tests. Our study extends the application boundaries of resource dependence theory in the context of green transformation and contributes to the empirical literature on policy instruments for promoting green innovation in SMEs.

Author Contributions

Conceptualization, C.L., S.F., Q.Y., J.W., S.W. and D.H.; Methodology, C.L.; Software, C.L.; Validation, C.L., S.F., S.W. and D.H.; Formal analysis, C.L.; Investigation, C.L., S.F. and D.H.; Resources, D.H.; Data curation, C.L. and J.W.; Writing—original draft, C.L., S.F., Q.Y., J.W., S.W. and D.H.; Writing—review & editing, S.F., Q.Y. and D.H.; Visualization, J.W.; Supervision, C.L., S.F. and D.H.; Project administration, D.H.; Funding acquisition, D.H. All authors have read and agreed to the published version of the manuscript.

Funding

This research was funded by National Natural Science Foundation grant number 72202108, Nankai University grant number ZB22ZXBZ0323 and China National University Student Innovation & Entrepreneurship Development Program grant number 202410055027.

Institutional Review Board Statement

Not applicable.

Informed Consent Statement

Not applicable.

Data Availability Statement

The data presented in this study are available on request from the corresponding author.

Conflicts of Interest

The authors declare no conflict of interest.

References

  1. Sang, S.; Yan, A.; Ahmad, M. CEO Experience and Enterprise Environment, Social and Governance Performance: Evidence from China. Sustainability 2024, 16, 4403. [Google Scholar] [CrossRef]
  2. Xu, J.; Liu, F.; Shang, Y. R&D Investment, ESG Performance and Green Innovation Performance: Evidence from China. Kybernetes, 2020; ahead-of-print. [Google Scholar]
  3. Sun, X.; Tang, J.; Li, S. Promote Green Innovation in Manufacturing Enterprises in the Aspect of Government Subsidies in China. Int. J. Environ. Res. Public Health 2022, 19, 7864. [Google Scholar] [CrossRef]
  4. Shi, H.; Zhou, Q. Government R&D Subsidies, Environmental Regulation and Corporate Green Innovation Performance. Financ. Res. Lett. 2024, 69, 106088. [Google Scholar]
  5. Peng, H.; Shen, N.; Ying, H.; Wang, Q. Can Environmental Regulation Directly Promote Green Innovation Behavior?—Based on Situation of Industrial Agglomeration. J. Clean. Prod. 2021, 314, 128044. [Google Scholar] [CrossRef]
  6. Appelt, S.; Bajgar, M.; Criscuolo, C.; Galindo-Rueda, F. R&D Tax Incentives: Evidence on Design, Incidence and Impacts; OECD Science, Technology and Industry Policy Papers, No. 32; OECD Publishing: Paris, France, 2016. [Google Scholar]
  7. Bai, Y.; Song, S.; Jiao, J.; Yang, R. The Impacts of Government R&D Subsidies on Green Innovation: Evidence from Chinese Energy-Intensive Firms. J. Clean. Prod. 2019, 233, 819–829. [Google Scholar]
  8. Guo, Y.; Xia, X.; Zhang, S.; Zhang, D. Environmental Regulation, Government R&D Funding and Green Technology Innovation: Evidence from China Provincial Data. Sustainability 2018, 10, 940. [Google Scholar] [CrossRef]
  9. Dangelico, R.M. Green Product Innovation: Where We Are and Where We Are Going. Bus. Strategy Environ. 2016, 25, 560–576. [Google Scholar] [CrossRef]
  10. He, L.; Li, Z.L.; Zhu, J. Government Subsidies, Tax Incentives or Low-Interest Loans?—A Comparative Study on the Role of Industrial Policies in Promoting Green Technology Innovation in the Environmental Protection Industry. J. China Univ. Geosci. (Soc. Sci. Ed.) 2020, 20, 42–58. [Google Scholar]
  11. Yang, G.; Liu, J.; Lian, P.; Rui, M. Tax Reduction Incentives, R&D Manipulation, and R&D Performance. Econ. Res. J. 2017, 52, 110–124. [Google Scholar]
  12. Dong, Y.; Men, C. SME Financing in Emerging Markets: Firm Characteristics, Banking Structure and Institutions. Emerg. Mark. Financ. Trade 2014, 50, 120–149. [Google Scholar] [CrossRef]
  13. Pfeffer, J.; Salancik, G.R. The External Control of Organizations: A Resource Dependency Perspective. Econ. J. 1979, 23, 2. [Google Scholar]
  14. Colclough, S.N.; Moen, Ø.; Hovd, N.S.; Chan, A. SME Innovation Orientation: Evidence from Norwegian Exporting SMEs. Int. Small Bus. J. Res. Entrep. 2019, 37, 780–803. [Google Scholar] [CrossRef]
  15. Liu, H.M. The Quality–Quantity Trade-Off: Evidence from the Relaxation of China’s One-Child Policy. J. Popul. Econ. 2014, 27, 565–602. [Google Scholar] [CrossRef]
  16. Song, M.; Wang, S.; Zhang, H. Could Environmental Regulation and R&D Tax Incentives Affect Green Product Innovation? Clean. Prod. 2020, 258, 120849. [Google Scholar]
  17. Wang, X.; Guo, D. ESG Performance and Green Innovation—Empirical Evidence from Listed Manufacturing Companies. Friends Account. 2024, 23, 28–35. [Google Scholar]
  18. Yuan, C.; Liu, S.; Yang, Y.; Chen, D.; Fang, Z.; Shui, L. An Analysis on Investment Policy Effect of China’s Photovoltaic Industry Based on Feedback Model. Appl. Energy 2014, 135, 423–428. [Google Scholar] [CrossRef]
  19. Tamazian, A.; Rao, B.B. Do Economic, Financial and Institutional Developments Matter for Environmental Degradation? Evidence from Transitional Economies. Energy Econ. 2010, 32, 137–145. [Google Scholar] [CrossRef]
  20. Wu, F.; Li, W. Tax Incentives and Corporate Green Transformation—Empirical Evidence Based on Textual Analysis of Annual Reports of Listed Companies. Public Financ. Res. 2017, 04, 100–118. [Google Scholar]
  21. Oduro, S.; Maccario, G.; De Nisco, A. Green Innovation: A Multidomain Systematic Review. Eur. J. Innov. Manag. 2022, 25, 567–591. [Google Scholar] [CrossRef]
  22. Xiang, X.; Liu, C.; Yang, M. Who is Financing Corporate Green Innovation? Int. Rev. Econ. Financ. 2022, 78, 321–337. [Google Scholar] [CrossRef]
  23. Aghion, P.; Howitt, P. A Model of Growth through Creative Destruction. Econometrica 1992, 60, 323–351. [Google Scholar] [CrossRef]
  24. Buyse, T.; Heylen, F.; Schoonackers, R. On the Impact of Public Policies and Wage Formation on Business Investment in Research and Development. Econ. Model. 2020, 88, 188–199. [Google Scholar] [CrossRef]
  25. Bloom, N.; Griffith, R.; Reenen, J.V. Do R&D Tax Credits Work? Evidence from a Panel of Countries 1979–1997. J. Public Econ. 2008, 85, 1–31. [Google Scholar]
  26. Hall, B.; Reenen, J.V. How Effective Are Fiscal Incentives for R&D? A Review of the Evidence. Res. Policy 2000, 29, 449–469. [Google Scholar] [CrossRef]
  27. Hall, P. Policy Paradigms, Social Learning, and the State: The Case of Economic Policymaking in Britain. Comp. Politics 1993, 25, 275–296. [Google Scholar] [CrossRef]
  28. Duguet, E. Are R&D Subsidies a Substitute or a Complement to Privately Funded R&D? Evidence from France Using Propensity Score Methods for Non-Experimental Data. Rev. D’Économie Polit. 2004, 114, 263–292. [Google Scholar]
  29. Lin, Y.; Monga, C. Growth Identification and Facilitation: The Role of the State in the Dynamics of Structural Change. Soc. Sci. Electron. Publ. 2010, 29, 259–310. [Google Scholar]
  30. Zhang, X.; Wang, Y. The Impact of Environmental Regulation and R&D Investment on Green Technology Innovation. Prog. Sci. Technol. Countermeas. 2017, 34, 111–119. [Google Scholar]
  31. Fazzari, S.; Hubbard, R.G.; Petersen, B. Financing Constraints and Corporate Investment. Brook. Pap. Econ. Act. 1988, 1, 141–195. [Google Scholar] [CrossRef]
  32. Kaplan, S.N.; Zingales, L. Do Investment-Cash Flow Sensitivities Provide Useful Measures of Financing Constraints? Q. J. Econ. 1997, 112, 169–215. [Google Scholar] [CrossRef]
  33. Fazzari, S.M.; Athey, M.J. Asymmetric Information, Financing Constraints, and Investment. Rev. Econ. Stat. 1987, 69, 481–487. [Google Scholar] [CrossRef]
  34. Harhoff, D.; Körting, T. Lending Relationships in Germany—Empirical Evidence from Survey Data. J. Bank. Financ. 1998, 22, 1317–1353. [Google Scholar] [CrossRef]
  35. Stiglitz, J.E.; Weiss, A. Credit Rationing in Markets with Imperfect Information. Am. Econ. Rev. 1981, 17, 393–410. [Google Scholar]
  36. Xu, Q.; Kim, T. Financial Constraints and Corporate Environmental Policies. Rev. Financ. Stud. 2022, 35, 576–635. [Google Scholar] [CrossRef]
  37. Xiao, C.; Song, A.; Gu, K. Analysis of the Incentive Effect of Additional Deduction for R&D Expenses on Enhancing Corporate Innovation Capacity: Moderating Effect of Financing Constraints. Tax Res. 2024, 5, 80–87. [Google Scholar]
  38. Dimos, C.; Pugh, G. The Effectiveness of R&D Subsidies: A Meta-Regression Analysis of the Evaluation Literature. Res. Policy 2016, 45, 797–815. [Google Scholar]
  39. Zhang, C.; Zhou, B.; Tian, X. Political Connections and Green Innovation: The Role of a Corporate Entrepreneurship Strategy in State-Owned Enterprises. J. Bus. Res. 2022, 146, 375–384. [Google Scholar] [CrossRef]
  40. Zhang, W.; Li, K.; Wang, S. A Research of the Regulating Role of CEO Power over the Internal Mechanism of Board of Director’s Influence on Corporate Innovation. Manag. Rev. 2018, 30, 70–82. [Google Scholar]
  41. Fresard, L. Financial Strength and Product Market Behavior: The Real Effects of Corporate Cash Holdings. J. Financ. 2010, 65, 1097–1122. [Google Scholar] [CrossRef]
  42. Wang, Q.; Zhang, D. Research on the Impact of Tax Incentives on Corporate Green Technology Innovation—From the Perspective of Financing Constraints as a Mediating Effect. J. Henan Univ. Technol. (Soc. Sci. Ed.) 2023, 39, 46–55. [Google Scholar]
  43. Lin, B.; Zhang, A. Can Government Environmental Regulation Promote Low-Carbon Development in Heavy Polluting Industries? Evidence from China’s New Environmental Protection Law. Environ. Impact Assess. Rev. 2023, 99, 106991. [Google Scholar] [CrossRef]
  44. Announcement of the State Taxation Administration on Issues Concerning the Scope of Collection for Pre-tax Additional Deduction of Research and Development Expenses. Available online: https://guizhou.chinatax.gov.cn/wjjb/zcfgk/szfl/ygsf/202203/t20220315_72985632.html (accessed on 28 May 2025).
  45. R&D Expenses Are Deducted Policy Implementation Guidelines. 2023. Available online: https://www.google.com/url?sa=t&source=web&rct=j&opi=89978449&url=https://www.most.gov.cn/xxgk/xinxifenlei/fdzdgknr/fgzc/zcjd/202307/W020230707684687155942.pdf&ved=2ahUKEwin0omx7tmOAxXaYfUHHWEuMoEQFnoECA0QAQ&usg=AOvVaw0jADBwNUEwDSMlFIjEG9ih (accessed on 28 May 2025).
  46. Feng, Q.H.; Liu, T. Selection Strategy and Coordination of Green Product R&D in Sustainable Competitive Supply Chain. Sustainability 2022, 14, 8884. [Google Scholar] [CrossRef]
  47. Tolliver, C.; Fujii, H.; Keeley, A.R.; Managi, S. Green Innovation and Finance in Asia. Asian Econ. Policy Rev. 2020, 16, 67–87. [Google Scholar] [CrossRef]
  48. Bronzini, R.; Piselli, P. The Impact of R&D Subsidies on Firm Innovation. Res. Policy 2016, 45, 442–457. [Google Scholar] [CrossRef]
  49. OECD. The Effects of R&D Tax Incentives and Their Role in the Innovation Policy Mix: Findings from the OECD MicroBeRD Project, 2016–2019; OECD Publishing: Paris, France, 2020. [Google Scholar]
Figure 1. Theoretical framework.
Sustainability 17 06834 g001
Figure 2. Results of event study. The dotted line reflects the parallel trend of different groups.
Sustainability 17 06834 g002
Table 1. Variable definitions.
Variable TypeVariable NameDefinition
Dependent VariablesgreenrdQuantity of green innovation, measured as the natural logarithm of (1 + number of green invention patents)
greenrdqQuality of green innovation, measured as the ratio of green invention patents to total green patents
Independent VariablesTimeDummy variable for policy period: time = 0 for 2017 and earlier; time = 1 for post-2017
TreatTreatment group dummy: treat = 1 for technology-based SMEs; treat = 0 for other SMEs
GPInteraction term between Time and Treat, capturing the policy effect in the model
Mediating VariablesKZKZ measure of financing constraints
lrdratioGreen innovation input intensity, measured by R&D expenditure divided by total revenue
Control VariablesTQTobin’s Q
CICapital intensity
LEVLeverage ratio
CASHOperating cash flow as a proportion of total assets
MkpMarket power
ROEReturn on equities
FOAFixed assets as a proportion of total assets
BSBoard size
MixCEO duality (whether the chairman and CEO roles are held by the same person)
Table 2. Descriptive statistics results.
VariableNMeanSDMinp50Max
lrdratio70482.1601.5600.631.735.59
TQ70480.3900.2800.010.362.55
CI70480.3101.760−2.040.182.9
LEV70480.05000.120−4.9500.050.86
CASH70480.3100.16000.300.95
Mkp70480.05000.230−2.610.057.45
ROE70488.1101.5100918
FOA70480.3800.480001
BS70480.4000.360−1.450.313.33
Mix704812.491.1706.4612.6117.21
KZ70480.4902.070−11.46011.35
Lrdratio70480.5700.32000.6901.17
Table 3. Results of the benchmark regression.
(1)(2)(3)(4)(5)(6)
QuantityQuality
VariableGreenrdGreenrdGreenrdGreenrdqGreenrdqGreenrdq
GP0.795 ***0.846 *** 0.084 ***0.094 ***
(0.030)(0.098) (0.004)(0.014)
TQ −0.006−0.006 −0.000−0.006
(0.006)(0.005) (0.001)(0.005)
LEV 0.489 ***0.489 *** 0.028 ***0.489 ***
(0.054)(0.066) (0.007)(0.072)
CASH −0.033−0.033 ** −0.001−0.033 **
(0.021)(0.013) (0.003)(0.014)
ROE −0.066−0.066 −0.008−0.066
(0.073)(0.076) (0.010)(0.073)
FOA −0.499 ***−0.499 *** −0.066 ***−0.499 ***
(0.066)(0.067) (0.009)(0.054)
BF 0.019 ***0.019 *** 0.002 **0.019 ***
(0.006)(0.006) (0.001)(0.006)
Mix −0.011−0.011 −0.005 *−0.011
(0.019)(0.018) (0.003)(0.018)
Mkp −0.130 ***−0.130 *** −0.008 *−0.130 ***
(0.030)(0.020) (0.004)(0.020)
CI 0.027 ***0.027 *** 0.005 ***0.027 ***
_diff (0.009)(0.009) (0.001)(0.008)
0.846 *** 0.846 ***
Year (0.066) (0.078)
YYYYYY
IdYYYYYY
Constant0.261 ***−0.071−0.0710.021 ***−0.033 *−0.071
(0.008)(0.129)(0.126)(0.001)(0.018)(0.115)
N704870487048704870487048
adj. R20.2540.0940.0940.0360.0190.094
Note: *, **, *** indicate significance at the 10%, 5%, and 1% levels, respectively. The standard error of the robustness is shown in parentheses.
Table 4. Analysis results of the mediating effect—quantity.
(1)(2)(3)(4)(5)(6)(7)(8)
KZWWSAInput
VariableKZGreenrdWWGreenrdSAGreenrdLrdratioGreenrd
GP−0.448 **0.846 ***−0.632 ***0.279 *−0.328 **0.512 ***0.48 ***0.53 ***
(0.217)(0.098)(0.185)(0.152)(0.132)(0.107)(0.024)(0.100)
KZ −0.010 *
(0.005)
WW −0.015 **
(0.006)
SA −0.417 ***
(0.112)
lrdratio 0.6 ***
(0.049)
YearYYYYYYYY
IdYYYYYYYY
ControlsYYYYYYYY
Constant−1.223 ***−0.0710.884 ***0.142−0.647 **−0.0930.554 ***−0.439 ***
(0.285)(0.129)(0.243)(0.173)(0.200)(0.141)(0.031)(0.130)
N70487048704870487048704870487048
adj. R20.4250.0940.3870.0820.3510.0670.1740.142
Note: *, **, *** indicate significance at the 10%, 5%, and 1% levels, respectively.
Table 5. Analysis results of the mediating effect—quality.
(1)(2)(3)(4)(5)(6)(7)(8)
KZWWSAInput
VariableKZGreenrdWWGreenrdSAGreenrdLrdratioGreenrd
GP−0.448 **0.094 ***−0.732 ***0.275 *−0.334 **0.523 ***0.44 ***0.056 ***
(0.217)(0.014)(0.185)(0.152)(0.132)(0.107)(0.024)(0.014)
KZ −0.001 *
(0.001)
WW −0.017 **
(0.006)
SA −0.445 ***
(0.112)
lrdratio 0.045 ***
(0.007)
YearYYYYYYYY
IdYYYYYYYY
ControlsYYYYYYYY
Constant−1.223 ***−0.0710.884 ***0.142−0.647 **−0.0930.554 ***−0.439 ***
(0.285)(0.129)(0.243)(0.173)(0.200)(0.141)(0.031)(0.130)
N70487048704870487048704870487048
adj. R20.4250.0190.3870.0820.3510.0670.1530.067
Note: *, **, *** indicate significance at the 10%, 5%, and 1% levels, respectively.
Table 6. Regression of the mediating effect.
(1)(2)
VariableGreenrdGreenrdq
GP0.832 ***0.423 ***
(0.035)(0.043)
KZ−0.360 ***−0.545 ***
(0.135)(0.137)
lrdratio0.344 ***0.345 ***
(0.127)(0.067)
c_KZ−0.264 ***−0.354 ***
(0.009)(0.043)
c_lrdratio0.164 ***0.347 ***
(0.079)(0.021)
YearYY
IdYY
Constant0.261 ***−0.033 *
(0.008)(0.018)
N70487048
adj. R20.3420.435
Note: *, *** indicate significance at the 10%, and 1% levels, respectively.
Table 7. VIF tests of the mediating variables.
VariableVIF1/VIF
did3.270.306
KZ2.850.351
lrdratio2.530.395
GP2.340.427
KZ2.210.452
lrdratio2.150.465
TQ2.080.481
CI2.120.472
LEV2.090.478
CASH2.050.488
Mkp2.030.493
ROE2.450.408
FOA2.320.431
BS2.180.459
Mix2.120.472
MeanVIF0.439
Table 8. Heterogeneity analysis—quantity.
(1)(2)(3)(4)(5)(6)
SOE (H4)ROA (H5)PM (H6)
SOENSOEHighLowHighLow
VariableGreenrdGreenrdGreenrdGreenrdGreenrdGreenrd
GP0.6960.849 ***−0.4480.845 ***0.760 ***1.213 ***
(0.978)(0.099)(0.997)(0.099)(0.107)(0.265)
treat0.6330.667 ***1.929 ***0.665 ***0.664 ***0.571 ***
(0.800)(0.065)(0.522)(0.065)(0.069)(0.200)
time0.136 *0.0100.1320.0110.033−0.004
(0.070)(0.021)(0.457)(0.021)(0.025)(0.034)
YearYYYYYY
IdYYYYYY
ControlYYYYYY
Constant0.024−0.061−4.933 **−0.083−0.026−0.201
(0.529)(0.134)(2.292)(0.130)(0.163)(0.203)
N633639527700149142114
adj. R20.0620.1010.4080.0930.1130.063
Note: *, **, *** indicate significance at the 10%, 5%, and 1% levels, respectively.
Table 9. Heterogeneity analysis—quality.
(1)(2)(3)(4)(5)(6)
SOE (H4)ROA (H5)PM (H6)
SOENSOEHighLowHighLow
VariableGreenrdqGreenrdqGreenrdqGreenrdqGreenrdqGreenrdq
GP0.0800.093 ***−0.0190.093 ***0.089 ***0.108 ***
(0.116)(0.014)(0.159)(0.014)(0.016)(0.029)
treat−0.027−0.018 *0.052−0.017 *−0.020 **−0.017
(0.095)(0.009)(0.083)(0.009)(0.010)(0.022)
time−0.001−0.003−0.065−0.004−0.002−0.006
(0.008)(0.003)(0.073)(0.003)(0.004)(0.004)
YearYYYYYY
IdYYYYYY
ControlsYYYYYY
Constant−0.051−0.033 *−0.746 *−0.032 *−0.048 **−0.008
(0.063)(0.019)(0.366)(0.018)(0.024)(0.023)
N633639527700149142114
adj. R2−0.0080.021−0.1430.0190.0230.020
Note: *, **, *** indicate significance at the 10%, 5%, and 1% levels, respectively.
Table 10. Regression of the moderating effect.
(1)(2)(3)(4)
VariableGreenrdGreenrdGreenrdqGreenrdq
GP0.732 *** 0.435 ***
(0.030) (0.098)
non-SOE0.334 ***0.267 ***0.365 ***0.105 ***
(0.026)(0.046)(0.065)(0.086)
lowROA0.343 ***0.417 ***0.117 ***0.415 ***
(0.034)(0.021)(0.021)(0.020)
PM0.064 ***0.043 ***0.317 ***0.665 ***
(0.009)(0.009)(0.021)(0.046)
_diff 0.823 *** 0.324 ***
(0.066) (0.078)
YearYYYY
IdYYYY
Constant0.261 ***−0.071−0.033 *−0.071
(0.008)(0.126)(0.018)(0.115)
N7048704870487048
adj. R20.2530.2350.0560.098
Note: *, *** indicate significance at the 10%, 5%, and 1% levels, respectively.
Table 11. Results of placebo trials.
(1)(2)(3)
VariableGreenrdGreenrdGreenrd
did10.068 ***
(0.014)
treat1−0.016
(0.011)
time1−0.001
(0.003)
did2 0.055 ***
(0.015)
treat2 −0.016
(0.013)
time2 −0.000
(0.003)
did3 −0.093 ***
(0.014)
treat3 0.017 *
(0.009)
time 0.090 ***
(0.013)
YearYYY
IdYYY
ControlsYYY
Constant−0.033 *−0.032 *−0.052 **
(0.018)(0.018)(0.020)
N704870487048
adj. R20.0160.0140.019
Note: *, **, *** indicate significance at the 10%,5%, and 1% levels, respectively. The standard error of the robustness is shown in parentheses.
Table 12. Further analysis results.
(1)(2)
PSM-DIDPSM-DID
VariableGreenrdGreenrdq
GP0.179 ***0.277 ***
(0.030)(0.0597)
YearYY
IdYY
ControlsYY
Constant2.835 ***1.870 ***
(173.24)(38.29)
Note: *** indicate significance at the 1% levels, respectively, and the parentheses are the robust standard error values.
Table 13. Other robustness test results.
(1)(2)(3)(4)(5)(6)(7)(8)(9)(10)
GreenrdGreenrdqGreenrdGreenrdqGreenrdGreenrdqGreenrdGreenrdqGreenrdGreenrdq
GP0.011 **0.071 *0.169 ***0.083 ***0.080 ***0.078 **0.017 ***0.084 ***0.102 ***0.120 ***
(0.006)(0.038)(0.061)(0.029)(0.029)(0.035)(0.005)(0.032)(0.017)(0.019)
YearYYYYYYYYYY
IdYYYYYYYYYY
RegionNNYYNNNNNN
ControlsYYYYYYYYYY
Other policyNNNNNNYYNN
N7048704870487048704870487048704870487048
Adj_R20.0870.1450.1230.1550.1460.1580.1450.1570.0860.144
Note: *, **, *** indicate significance at the 10%, 5% and 1% levels, respectively.
Disclaimer/Publisher’s Note: The statements, opinions and data contained in all publications are solely those of the individual author(s) and contributor(s) and not of MDPI and/or the editor(s). MDPI and/or the editor(s) disclaim responsibility for any injury to people or property resulting from any ideas, methods, instructions or products referred to in the content.

