Article

Research on Pathways to Improve Carbon Emission Efficiency of Chinese Airlines

School of Air Transport, Shanghai University of Engineering Science, Shanghai 201620, China
*
Author to whom correspondence should be addressed.
Sustainability 2025, 17(15), 6826; https://doi.org/10.3390/su17156826 (registering DOI)
Submission received: 11 June 2025 / Revised: 4 July 2025 / Accepted: 23 July 2025 / Published: 27 July 2025

Abstract

As an energy-intensive industry, the aviation sector’s carbon emissions have drawn significant attention. Against the backdrop of the “dual carbon” goals, how to enhance the carbon emission efficiency of airlines has become an urgent issue to be addressed for both industry development and low-carbon targets. This paper constructs an evaluation system for the carbon emission efficiency of airlines and uses the SBM-DDF model under the global production possibility set, combined with the bootstrap-DEA method, to calculate the efficiency values. On this basis, the fuzzy-set qualitative comparative analysis method is employed to analyze the synergistic effects of multiple influencing factors in three dimensions: economic benefits, transportation benefits, and energy consumption on improving carbon emission efficiency. The research findings reveal that, first, a single influencing factor does not constitute a necessary condition for achieving high carbon emission efficiency; second, there are four combinations that enhance carbon emission efficiency: “load volume-driven type”, “scale revenue-driven type”, “high ticket price + technology-driven type”, and “passenger and cargo synergy mixed type”. These discoveries are of great significance for promoting the construction of a carbon emission efficiency system by Chinese airlines and achieving high-quality development in the aviation industry.

1. Introduction

Against the backdrop of the continuous advancement of the global carbon neutrality trend, carbon reduction in the aviation industry has become a key area of international environmental policy. For instance, since 2012, the European Union has included aviation in the emissions trading system (EU ETS), requiring airlines operating within the EU region to purchase carbon quotas to internalize carbon costs [1]. In addition, the International Civil Aviation Organization (ICAO) has launched the International Aviation Carbon Offset and Emission Reduction Mechanism (CORSIA), aiming to stabilize the carbon emissions of international flights at the 2020 level and offset them through market-based mechanisms [2]. Meanwhile, major economies such as the European Union, the United States, and China have all committed to achieving “net zero emissions” by the middle of this century. This has put forward stricter emission reduction requirements for high-carbon industries, including aviation, and accelerated the pace of transformation towards green and low-carbon operation models [3].
Under the background of the comprehensive advancement of the “dual carbon” strategy, carbon emission efficiency has become an important indicator to measure the green development level of China’s aviation industry. With the continuous strengthening of national policy guidance and the sustained promotion of technological progress, Chinese airlines have generally shown a stable and improving development trend in terms of carbon emission efficiency. According to the data released by the Civil Aviation Administration of China, in 2023, the total turnover of civil aviation transportation in China was 1188.34 billion ton-kilometers, with an estimated total carbon emission of about 110 million tons, and the carbon emission intensity per unit of transportation turnover was approximately 0.0923 kgCO2/ton-kilometer. Compared with the level of about 0.0955 kgCO2/ton-kilometer in 2019, it has decreased by approximately 3.3% [4]. This indicates that the carbon emission efficiency of China’s civil aviation transportation system has continued to improve after experiencing fluctuations during the pandemic, showing a steady recovery and green transformation trend.
At the airline level, many enterprises are actively exploring green transformation paths. For instance, in recent years, Air China has introduced new-generation energy-efficient aircraft such as the Boeing 787, optimized route scheduling, and engine management technologies. As a result, its carbon emission intensity per unit in 2021 has dropped below the industry average [5]. Low-cost airlines such as Spring Airlines have also demonstrated strong competitive advantages in terms of carbon emission efficiency by relying on strategies such as high passenger-load factor, high flight utilization rate, and unified aircraft model management [6]. These practices fully demonstrate that airlines are gradually transforming towards an efficient and low-carbon operation model, laying a solid foundation for the green development of transportation. Therefore, conducting an analysis of the carbon emission efficiency differences at the enterprise level not only helps to identify key paths for efficiency improvement but also provides data support for the government to formulate differentiated policy support mechanisms, which is of great significance for promoting the green and high-quality development of China’s aviation industry. However, to further improve the carbon emission efficiency of airlines, two key issues need to be addressed: First, it is necessary to calculate the carbon emission efficiency more scientifically and accurately in order to better understand the current situation of carbon emission efficiency for each airline. Second, it is necessary to fully explore and analyze the key influencing factors of carbon emission efficiency and ultimately seek effective optimization measures.
In previous studies on the influencing factors of carbon emission efficiency, most of them started from three dimensions: economic scale, transportation structure, and energy structure, and constructed a comprehensive DEA/SBM model for efficiency evaluation. For instance, Kou et al. (2022) in their study on road freight transportation in the European Union took transport revenue, energy usage, and GHG emissions as input and output variables to achieve a coordinated assessment of economy, energy, and environment [7]. Q Ma et al. used the super-efficiency SBM and the spatial Dubin model to analyze the carbon emission efficiency (TCEE) of each province, and explored the influence mechanism of carbon emission efficiency from three aspects: economy, energy, and transportation. Drawing on the above framework, the significance of the carbon emission efficiency of airlines can be demonstrated from three dimensions: economic benefits, transportation benefits, and energy consumption [8].
In the process of promoting the improvement of the carbon emission efficiency of airlines, economic benefits, transportation benefits, and energy consumption can all play an important role in carbon emission efficiency. At the economic benefit level, the incentive mechanism oriented towards economic performance can effectively guide airlines to seek a balance between profit and environmental protection. For instance, Cui Q et al. found through DEA model analysis that optimizing operational efficiency and introducing incentive mechanisms can help airlines achieve revenue growth while reducing carbon emissions [9]. At the level of transportation benefits, route optimization, improvement of the fleet utilization rate, and load factor management are regarded as the key factors for improving carbon emission efficiency. Wang Z et al. conducted an empirical analysis of Chinese airlines and confirmed the significant correlation between transportation operation efficiency and carbon emission efficiency [10]. At the level of energy consumption, Xu L et al. pointed out the risks that airlines face in the process of adopting sustainable aviation fuel (SAF) and other low-carbon technologies, emphasizing the key role of fuel efficiency improvement and the application of new energy technologies in carbon reduction [11]. In summary, these three aspects, economic benefit, transport benefit, and energy consumption of Chinese airlines, all individually influence carbon emission efficiency. However, research analyzing the synergistic effects among these dimensions is scarce. Understanding and optimizing the interactions between these three dimensions is crucial for achieving sustainable development in the aviation industry.
Based on the above, this paper explores how multiple combinations of economic benefit, transport benefit, and energy consumption synergistically influence the carbon emission efficiency of various Chinese airlines, aiming to contribute to the literature in the following aspects: First, establishing a new input–output indicator system for airline carbon emission efficiency. Simultaneously, based on the SBM-DDF model under a global production possibility set combined with the bootstrap-DEA method, the carbon emission efficiency of various airlines in recent years is measured, expanding research on airline carbon emission efficiency evaluation. Second, analyzing external influencing factors under economic benefit, transport benefit, and energy consumption separately, and using the fs-QCA method to explore the synergistic effects of multiple combinations of economic benefit, transport benefit, and energy consumption on improving carbon emission efficiency.

2. Research Review

2.1. Measurement Methods of Carbon Emission Efficiency

Airline carbon emission efficiency generally refers to the ability of an airline to reduce carbon emissions per unit of output through technological innovation, operational optimization, and other measures during air transportation, thereby enhancing environmental performance. That is, carbon emission efficiency measures the carbon dioxide emissions corresponding to per unit of transport output, reflecting the effectiveness of an airline in managing its carbon footprint during operations [12]. In terms of measurement, basic DEA models such as the CCR model, BCC model, and CCW model are commonly used to estimate technical efficiency and management efficiency relative to an efficient production frontier. However, traditional DEA methods cannot handle undesirable outputs and may overestimate efficiency. Tone proposed the non-radial SBM model, which directly considers slack variables for inputs, desirable outputs, and undesirable outputs, addressing the issue of undesirable outputs and efficiency overestimation [13]. Fukuyama and Weber combined the SBM model with the directional distance function (DDF), considering slack variables while ensuring flexibility in the measurement direction, and making it suitable for more complex efficiency measurement environments [14]. Liu Zuan kuo et al. constructed a global production possibility set based on the SBM directional distance function. This set is built using input–output data from all decision-making units across all periods within the observation period, establishing a unified reference production frontier while considering the production technology levels of all periods [15]. The calculated efficiency CE values are then processed using the bootstrap-DEA method. This involves generating numerous simulated samples from the original sample data through numerical simulation, followed by an efficiency calculation using the SBM directional distance function under the global production possibility set. After bootstrap bias correction, the efficiency values become closer to the true efficiency values [16].

2.2. Research on Carbon Emission Efficiency and Its Influencing Factors

First, the impact of economic benefit on airline carbon emission efficiency. In applications to energy and environment research, Zhou, P. et al. emphasized the widespread use of DEA in evaluating corporate energy and environmental efficiency. They pointed out that enterprises often improve energy and environmental efficiency while increasing operating revenue, supporting the enhancement of carbon emission efficiency. This suggests that an increase in operating revenue may be positively correlated with the improvement of carbon emission efficiency [17]. Revenue per flight (revenue per flight) reflects operational efficiency; flights with higher revenue are usually operated more efficiently. If emissions can be effectively controlled, the carbon emission efficiency is relatively better. This indicates that an increase in the revenue per flight may be correlated with the improvement of carbon emission efficiency [18]. Therefore, increases in both revenue per flight and total operating revenue can effectively drive improvements in airline carbon emission efficiency.
Second, the impact of transport factors on airline carbon emission efficiency. Ding, H. et al., taking China Eastern Airlines as the research object, used a panel data regression model to analyze the relationship between average load factor (passenger-load factor) and carbon emission intensity. They found that for every 100% increase in average load factor, carbon emission intensity could decrease by approximately 33.927 tons per million ton-kilometers [19]. This indicates that increasing the load factor helps airlines improve carbon emission efficiency and is an important means to achieve carbon reduction. Ma, Q. et al. adopted a compromise approach to solve the airline fleet assignment problem in a stochastic environment. They ultimately found, concerning both profit and emission reduction, that larger aircraft could bring higher profits and lower emissions. The study concluded that aircraft with larger seat classes have lower carbon emissions per unit of transport volume, thereby enhancing carbon emission efficiency [20]. This suggests that airlines with larger average load factors can achieve economies of scale, positively impacting carbon emission efficiency improvement. Hong, S. et al. raised the question of whether a high degree of cargo business improves the operational efficiency of passenger/cargo mixed airlines. To answer this, they used DEA to calculate the carbon emission efficiency scores for 29 major global airlines between 1998 and 2002, followed by non-parametric statistical tests. They found that airlines with a higher proportion of cargo business in their overall operations had significantly higher efficiency than those with a lower proportion. Therefore, a higher proportion of cargo and mail turnover is more conducive to improving airline carbon emission efficiency [21].
Finally, the impact of energy consumption intensity on airline carbon emission efficiency. Energy consumption in air transport primarily comes from aviation fuel, the combustion of which is the main source of aviation carbon emissions. Therefore, advancements in energy-saving technology not only relate to the amount of fuel consumed but also directly affect the absolute level of carbon emissions and carbon emission efficiency per unit of output. Singh, V. et al. systematically analyzed research on fuel consumption optimization in air transport, emphasizing the importance of fuel consumption per flight hour in energy efficiency assessments and exploring how technological progress directly affects fuel consumption and carbon emissions [22]. Furthermore, multinational governments and international aviation organizations (such as the ICAO) are vigorously promoting the application of green technologies in the aviation industry, further strengthening the strategic position of energy-saving technology in improving aviation carbon emission efficiency [23]. Therefore, improvements in energy-saving technology levels may also effectively enhance airline carbon emission efficiency.
In summary, while existing research has analyzed external factors influencing carbon emission efficiency within the three dimensions of economic benefit, transport, and energy consumption intensity, these focus on the impact of single factors. However, existing research has not considered the impact of combinations of different factors on carbon emission efficiency. Limited by traditional linear regression thinking, research on the joint effects of multiple factors under the combined influence of economic benefit, transport, and energy consumption intensity is still relatively scarce. Therefore, it is necessary to further explore the synergistic effects of multiple configurations on airline carbon emission efficiency.

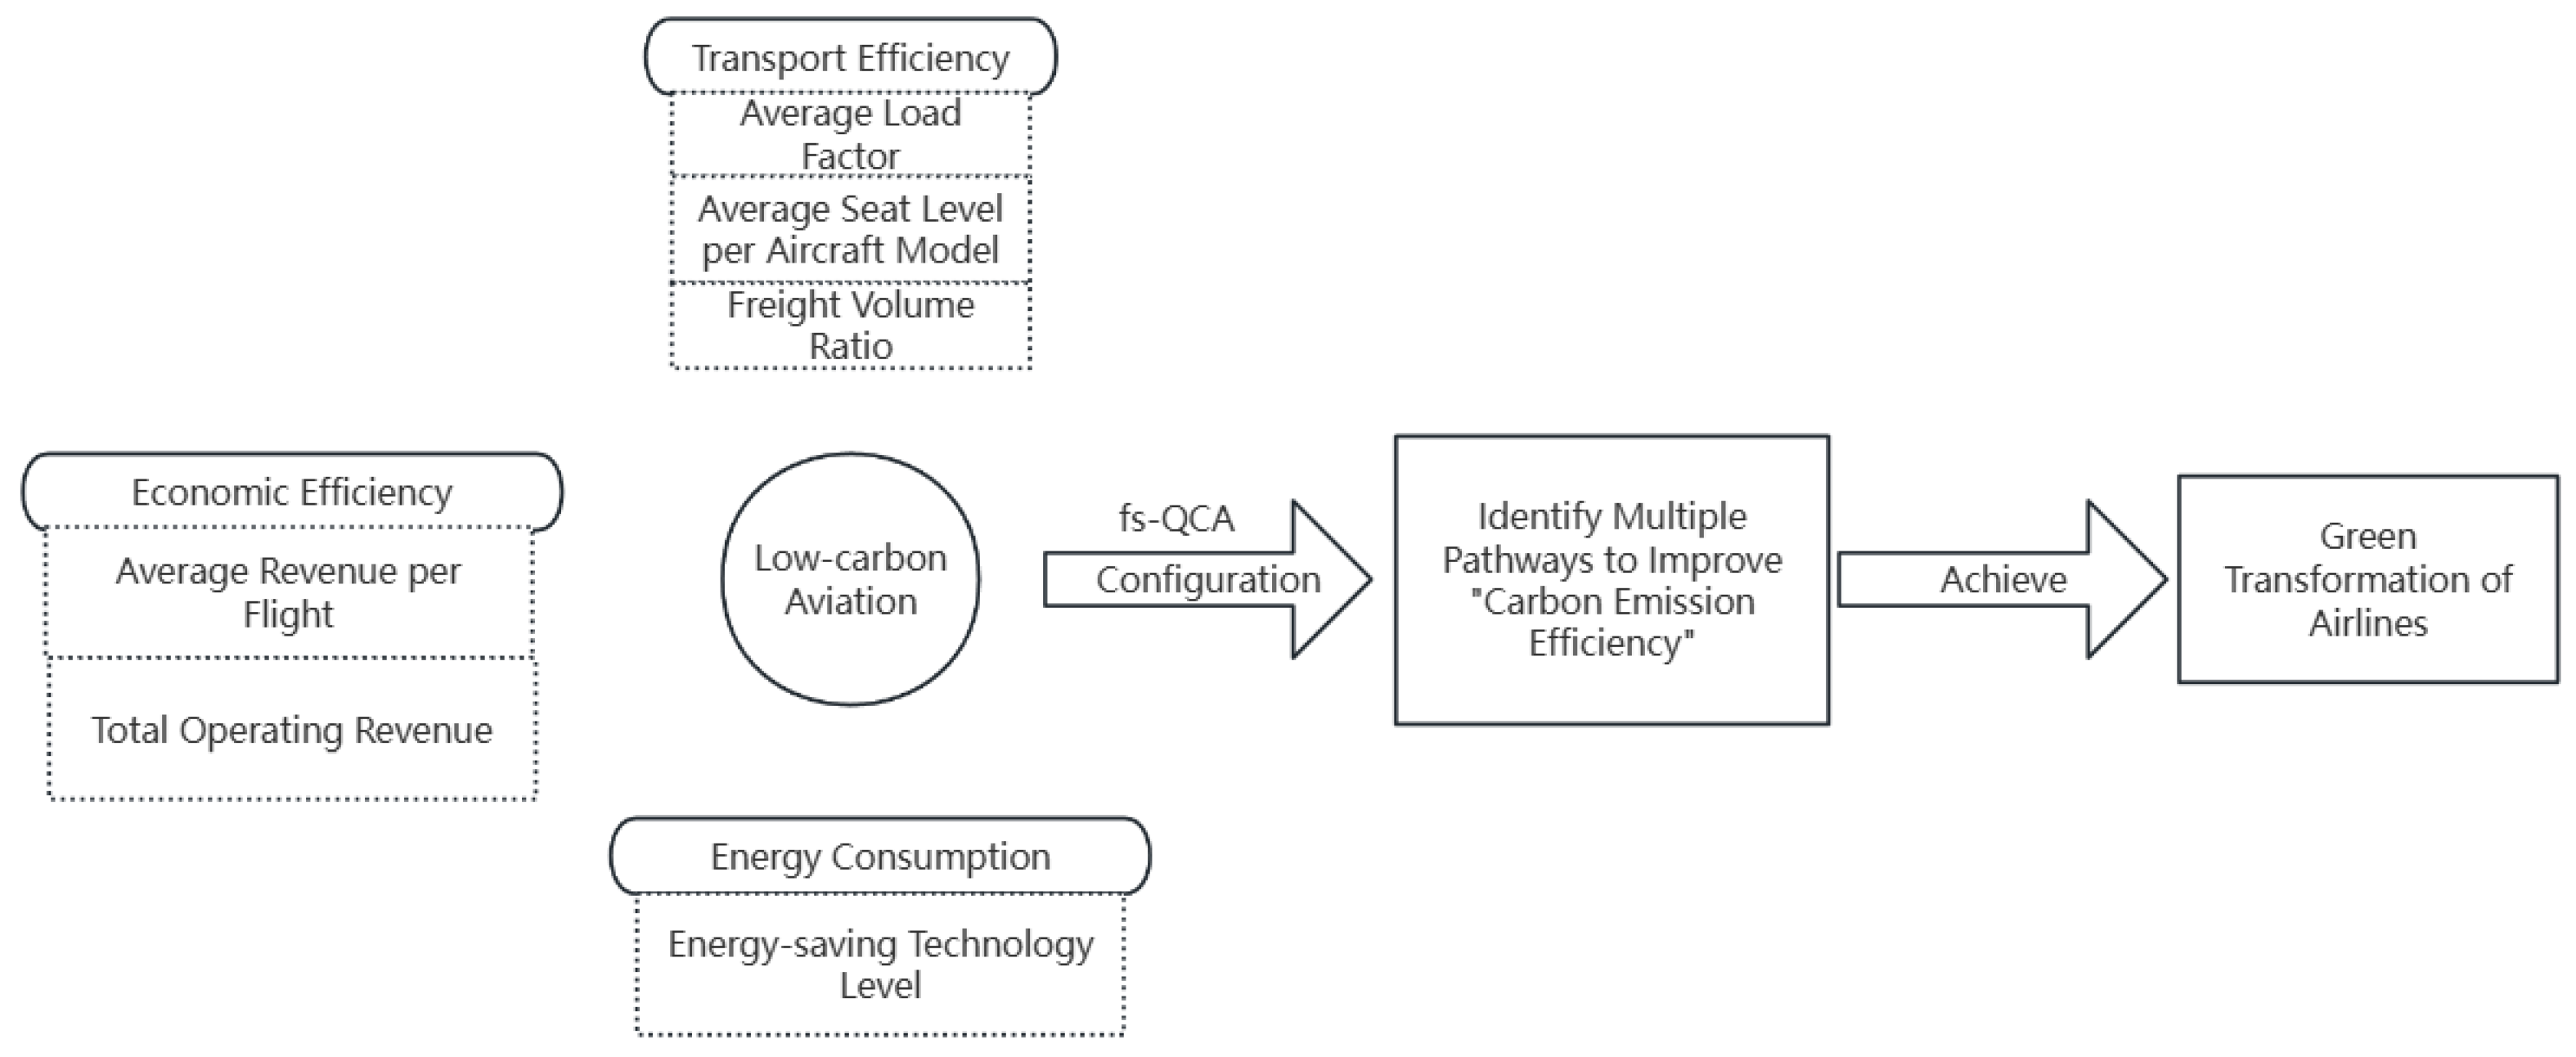
2.3. Theoretical Framework

China’s air transport industry is in a critical transition period regarding carbon emission control, and improving carbon emission efficiency has become a core task for the industry’s green development. The civil aviation system itself has a complex structure with interactions among multiple influencing factors. Previous research often used single variables or linear regression, making it difficult to reveal the combinatorial effects of these variables. To systematically analyze the key factors influencing the carbon emission efficiency of Chinese airlines, this paper constructs a theoretical analysis model from three dimensions: economic benefit, transport benefit, and energy consumption. It employs the fs-QCA method to identify key configurational pathways for promoting carbon emission efficiency improvement, as shown in Figure 1. This theoretical framework not only emphasizes representative variables in each dimension but also considers the availability of indicators and collinearity issues. It aims to reveal the multi-path mechanism for the green transformation of airlines through variable combinations.

2.3.1. Economic Benefit

Economic factors determine whether enterprises have sufficient funds and incentives to invest in green technology transformation. The economic benefit dimension includes the revenue per flight (RPF) and the total operating revenue (TOR). RPF is calculated as “TOR/Number of Flights”, reflecting the airline’s profitability in pricing strategy, cabin services, value-added services, etc. Stronger profitability means more adequate financial security for green transformation. This indicator serves as a benchmark for “Cost per Flight” in the ICAO system and is a key economic support variable for measuring carbon emission efficiency [24]. In addition, RPF also reflects the diversification capabilities of airlines in their revenue structure, such as additional service revenue, frequent flyer programs, premium cabin services, etc. If airlines can increase the revenue per flight by optimizing their product portfolio, their ability to mobilize funds for green investment will also be enhanced accordingly [25]. TOR measures the overall economic scale of the airline. Relevant research shows that air traffic volume and economic growth level are the main drivers of carbon emission growth, and total revenue is a core indicator of economic scale [26]. While TOR measures the development level of an enterprise, it may also be positively correlated with carbon emission intensity. Therefore, this study not only focuses on scale growth itself, but also attaches great importance to the balance mechanism between scale expansion and carbon emission control, emphasizing the feasibility of green transformation under “high-quality growth” [27].

2.3.2. Transport Benefit

Transport structure and efficiency directly affect carbon emissions per unit of transport. The transport dimension includes the average load factor (ALF), the average seat capacity (ASC), and the cargo share (CS). ALF, calculated as “Total Traffic Turnover/Number of Flights”, is an important indicator for measuring transport efficiency in mixed passenger–cargo operations. The ICCT considers it the basis for estimating RPK and RTK in carbon intensity assessments [28]. ASC is represented by the average number of seats in the airline’s fleet. Higher seat density leads to lower carbon emissions per seat, contributing to improved overall carbon efficiency [29]. Furthermore, ALF not only represents transportation efficiency but also reflects the comprehensive management level of flight scheduling, fare strategies, and route matching. Higher ALF can significantly reduce carbon emissions per passenger kilometer or freight kilometer, which helps improve overall operational efficiency [30]. ASC is closely related to aircraft type selection. For instance, the high-seat configuration of a wide-body aircraft can reduce carbon emission intensity under high-load conditions [31]. CS: The proportion of cargo turnover to the total traffic turnover. The EESI report also indicates that air cargo contributed approximately 19% of the carbon emissions in 2018 [26]. In conclusion, this dimension not only examines the transportation efficiency itself, but also takes into account its structural optimization role in enhancing carbon efficiency.

2.3.3. Energy Consumption

The energy use structure and the energy-saving technology level are core measures of an airline’s low-carbon capability. Energy-saving technology level (ESTL) is represented by “Jet Fuel Consumption/Flight Hour”. This indicator can eliminate the interference of flight frequency and commercial strategies, allowing for a more precise assessment of the airline’s comprehensive level in energy-saving technology and flight management. It is widely used in energy efficiency research [32]. In addition, High-level ESTL performance usually indicates the adoption of a new generation of low-fuel-consumption aircraft (such as A320neo, B787), optimized route planning, and flight altitude management strategies [33]. Given that almost all carbon emissions come from jet fuel, changes in ESTL will directly affect the carbon emission efficiency of airlines and are an important technical indicator for measuring green capabilities.

3. Methods and Materials

3.1. Research Method

This paper selects fuzzy-set Qualitative Comparative Analysis (fs-QCA) as the research method. The main reasons are as follows:
First, from a research perspective, traditional regression or correlation analysis methods typically focus on the net effects of individual condition variables on the outcome variable, assuming a linear and symmetric causal relationship. However, this “net effect” thinking makes traditional methods difficult to show the interaction and complex causal paths among multiple factors. In research on factors influencing airline carbon emission efficiency, multiple factors usually do not act singularly but jointly influence efficiency through various combinations. QCA can identify multiple paths through which these different combinations affect carbon emission efficiency, helping to reveal the mechanism of synergistic influence [34].
Second, from the perspective of research applicability, configurational theory emphasizes the asymmetry of causality. Certain condition combinations can lead to high efficiency when present, but their absence does not necessarily correspond to low efficiency [35]. This differs from the linear, symmetric causal logic assumed by traditional regression analysis. In traditional methods, the effect of condition variables is usually considered to be a consistent positive or negative relationship. However, this approach struggles to identify complex causal structures under multiple paths and mechanisms [36]. Through QCA, researchers can not only analyze multiple factor combinations that enhance efficiency but also further understand the commonalities and differences between different paths, thereby providing theoretical support for differentiated improvement strategies for airlines.
Finally, concerning research sample size, traditional regression analysis requires substantial data support to achieve better statistical results. This paper uses performance data from 13 Chinese airlines over 7 years, resulting in 91 observation units. While this does not reach the large sample size required for complex traditional regressions, it is relatively sufficient compared to typical case studies. QCA is particularly suitable for small-to-medium sample research with a limited number of cases (typically dozens of cases) [37]. Furthermore, the carbon emission efficiency of airlines is regarded as a continuous variable. The QCA using binary sets requires the discretization of data, which may cause information loss. Fs-QCA can perform scale calibration on continuous variables within the range of 0 to 1, maintaining data continuity and enhancing measurement accuracy [38].
In summary, the fs-QCA method better meets the needs of this study in terms of research perspective, applicability, and sample conditions, facilitating an in-depth exploration of pathways to improve airline carbon emission efficiency.

3.2. Data Source

Based on data availability, reasonableness, and the representativeness of various airlines in the Chinese aviation market, the performance data of 13 Chinese airlines from 2015 to 2021 were used as the research sample. The airlines are: Air China, China Eastern Airlines, China Southern Airlines, Hainan Airlines, Spring Airlines, Shandong Airlines, Juneyao Air, Shenzhen Airlines, Sichuan Airlines, Okay Airways Company Limited, China Express Airlines, 9 Airlines, and Ruili Airlines. Data sources primarily include the Civil Aviation Statistical Yearbook (2016–2022), annual reports, and the social responsibility reports of the 13 airlines. Some indicators had missing data for a few years, with a missing proportion below 5% deemed acceptable. Missing values were filled using regression imputation. Based on the availability and completeness of the indicators, this paper adopts a regression imputation method based on the indicators (total turnover and fuel consumption) for imputation, which is specifically implemented through the IterativeImputer module of the scikit-learn library in Python. The code was developed and run using PyCharm (version 2025.1.1).

3.3. Variables

3.3.1. Outcome Variable

This paper measures the carbon emission efficiency of Chinese airlines using the SBM-DDF model under a global production possibility set combined with the bootstrap-DEA method [39], based on the perspectives of inputs, desirable outputs, and undesirable outputs. Synthesizing the indicator selections of previous scholars, this paper selects labor and fleet size as input indicators. Labor is represented by the number of employees in the airline, fleet size by the number of aircraft actually operated, and fuel consumption by the total jet fuel consumption. Operating revenue and total traffic turnover are selected as desirable output indicators. Carbon dioxide emissions are used as the undesirable output [40]. Airline carbon emissions are calculated based on the accounting method referenced in the Guidelines for Accounting and Reporting Greenhouse Gas Emissions by Chinese Civil Aviation Enterprises (Trial), utilizing jet fuel consumption. In conclusion, the specific indicators of the carbon emission efficiency of airlines are shown in Table 1.

3.3.2. Condition Variable

Based on data from the 13 airlines from 2015 to 2021, the aim is to identify pathways leading to high carbon emission efficiency. The condition variables include revenue per Flight (RPF), total operating revenue (TOR), average load factor (ALF), average seat capacity (ASC), energy-saving technology level (ESTL), and cargo share (CS).

3.4. Research Steps

This paper employs the fs-QCA method to address the above issues, conducting research work in the following four specific aspects: First, calibrate the data to transform the outcome variable and condition variables into fuzzy-set variables with continuity between 0 and 1, achieving dimensional unity; simultaneously, use descriptive analysis to reveal the differences in carbon emission efficiency among Chinese airlines. Second, conduct a necessity analysis to test whether sufficient and necessary relationships exist between individual condition variables and carbon emission efficiency, thereby determining whether improving carbon emission efficiency relies on any single condition factor. Third, perform configurational analysis to identify configurations leading to high carbon emission efficiency and the complementary relationships among condition variables within each configuration. Fourth, conduct robustness tests to ensure the reliability of the configurational results for Chinese airline carbon emission efficiency.

4. Research Results

4.1. Data Calibration and Descriptive Analysis

The core purpose of variable calibration is to transform raw variables into set membership scores between 0 and 1, defining the degree to which each case belongs to a specific set [41]. Each condition variable and the outcome variable are treated as an independent set. All cases need to obtain membership scores in these sets, reflecting the degree to which they “belong to the set”. This study adopts the direct calibration method proposed by Ragin, setting three qualitative anchor points based on theoretical knowledge and actual data distribution to achieve the conversion from continuous variables to set membership. The calibration process typically uses the 90th, 50th, and 10th percentiles of the sample data as the anchors for full membership, crossover point, and full non-membership, respectively [35]. The specific calibration data and descriptive analysis are shown in Table 2.
Furthermore, given that the SBM-DDF model is still based on the traditional DEA framework, its analysis objects should have a certain degree of homogeneity. Although Spring Airlines, as a low-cost airline, differs from traditional airlines in business model, it is comparable in core operational indicators such as input (such as fuel consumption and the number of employees) and output (such as transportation turnover and carbon emissions), and it holds significant representativeness in China’s civil aviation market. Therefore, this paper refers to existing studies (Wang and Xu, 2020; Cui and Li, 2016) that included different types of airlines as a whole, while also retaining Spring Airlines as the research object. Meanwhile, to avoid bias in the efficiency results due to heterogeneity, this paper conducts robustness analysis for both cases by simultaneously using the SBM-DDF model combined with the bootstrap-DEA method [10,42]. The results show that the inclusion of Spring Airlines does not significantly affect the overall efficiency ranking, indicating that the model results have a certain robustness.

4.2. Necessity Analysis

Although fs-QCA primarily focuses on the sufficiency of condition combinations, relying solely on sufficiency might overlook the fundamental role of certain single conditions. Necessity testing separates the discussion of “necessary but not sufficient” from “sufficient” relationships, making the research’s depiction of complex causal mechanisms more complete. In necessity condition analysis, if the consistency of a condition variable exceeds 0.9, it indicates that the variable is a necessary condition [36]. As shown in the table below, the consistency of all condition variables is below 0.9. Therefore, it is concluded that none of the six condition variables are a necessary condition for airline carbon emission efficiency. The explanatory power of single antecedent conditions for carbon emission efficiency is weak, necessitating a focus on the synergistic matching effect among the condition variables. The results of the necessity analysis are shown in Table 3.

4.3. Configurational Analysis

Configurational analysis (QCA) is a set-theoretic comparative method that treats each case as a combination of set memberships for conditions and outcomes, aiming to identify “sufficient” or “necessary” condition configurations that lead to the outcome. This study uses fs-QCA 3.0 to construct a truth table. According to Schneider and Wagemann (2012), the consistency threshold should be no less than 0.8, the frequency threshold relative to the sample size should be chosen as 2, and the PRI threshold should be 0.7 [35,43]. After adjusting these three thresholds, the collected case data were analyzed, yielding three solutions: the complex solution, the parsimonious solution, and the intermediate solution. The intermediate solution is presented here as it balances theoretical plausibility and empirical coverage. The table below shows the four configurations for high carbon emission efficiency identified in the intermediate solution. The configuration for airlines to achieve high carbon emission efficiency is shown in Table 4.
As shown in Table 4, the overall solution consistency for the intermediate solution leading to high airline carbon emission efficiency is 0.909, and the overall solution coverage is 0.434. For individual configurations, all four configurations have a consistency greater than 0.9, and raw coverage ranges from 0.200 to 0.343, meeting the standards for fs-QCA analysis. Among the four configurations, the unique coverage of H1 and the raw coverage of H2 are relatively higher, indicating that configurations H1 and H2 are the most empirically relevant among the four. This paper names the four configurations for high carbon emission efficiency to better compare the differences between them: “Load Factor Dominant” (H1), “Scale Revenue Driven” (H2), “High Fare + Technology Driven” (H3), and “Passenger–Cargo Synergy Mixed” (H4).

4.3.1. Load Factor Dominant (H1)

Configuration H1 indicates that a high ALF, combined with the absence of high RPF and the absence of high CS as core conditions, and complemented by the absence of high TOR and the absence of high ESTL as peripheral conditions, can lead to high airline carbon emission efficiency. This configuration shows that under an operational model centered on high-load factors and low fares, even without large-scale revenue support or high-end energy-saving investments, relying on high cabin utilization can achieve the lowest carbon emissions per passenger, thereby improving overall carbon emission efficiency. Specifically: High ALF (seat utilization ≈ 85%+) directly allocates fuel and carbon emissions across more passengers, reducing carbon intensity per passenger; low fares enhance the demand elasticity, helping the airline maintain or increase load factors, and further consolidating the high load; low CS allows flight configuration and scheduling to focus more on passengers, free from cargo weight/timing constraints, simplifying operational rhythm; the absence of high revenue and high energy-saving technology reduces investment and operating costs, enabling small or regional airlines to achieve carbon efficiency optimization with limited capital investment based on high-load factors. Taking Spring Airlines as an example, its ASC reached over 85% in 2018, with a passenger-load factor consistently far exceeding the industry average. Its carbon emissions per seat-kilometer were about 10% lower than the domestic average. Under the low-fare and high-frequency operation strategy, despite limited investment in fleet renewal and cargo business, it maintained leading carbon emission efficiency across the industry. Juneyao Airlines is renowned for its single-aircraft operation and high flight frequency, achieving a high unit carbon emission efficiency under the condition of limited resource investment. Okay Airways, as a regional airline, has also achieved a relatively good carbon emission performance by optimizing its short-haul route network and increasing passenger-load factors.

4.3.2. Scale Revenue Driven (H2)

Configuration H2 indicates that a high TOR and the absence of a high CS are core conditions; this complemented by the absence of a high RPF, the absence of a high ALF, the absence of a high ASC, and the absence of a high ESTL, can lead to high airline carbon emission efficiency. This configuration shows that under the premise of a strong overall revenue capability, even if RPF is low, transport efficiency is not high, and if the energy-saving technology foundation is weak, airlines can still rely on scale advantages and management-scheduling capabilities to achieve improved carbon emission efficiency. Specifically: High TOR represents strong market expansion capability and a diversified revenue structure, such as relying on high-frequency flights and covering more route networks, spreading carbon costs through scale; weak cargo capability has limited impact: Although low CS indicates the limited contribution of the cargo business to overall transport, its impact on carbon emission efficiency can be compensated by capital accumulation and the resource allocation capabilities brought by high revenue; low load efficiency and insufficient technology are not decisive: The enterprise may not possess advanced energy-saving technology or highly efficient flight operations, but through strong overall scheduling capabilities, route layout, and business integration, it can still maintain relatively good carbon emission performance. China Eastern Airlines, China Southern Airlines, and Sichuan Airlines have extensive route networks and large-scale transportation capacity, with dense layouts in hub cities across the country, enjoying significant market coverage advantages. Although some transportation efficiency or technical indicators are not outstanding, with a huge operation system and dispatching capacity, the overall carbon emission efficiency is improved through the scale effect.

4.3.3. High Fare + Technology Driven (H3)

Configuration H3 indicates that high RPF and high ESTL, combined with the absence of high TOR, the absence of high ALF, and the absence of high CS as core conditions, and complemented by the absence of high ASC as a peripheral condition, can lead to high airline carbon emission efficiency. This configuration shows that under the dual drive of high fares supporting profitability and energy-saving technology optimizing operations, even without a large-scale revenue base, low load factors, and weak cargo business, airlines can still optimize carbon emission efficiency by improving per-flight profitability and reducing unit energy consumption. Specifically: High RPF means the airline can obtain higher returns by providing differentiated services (e.g., business class, route advantages, or brand premium), supporting the costs required for green transformation; high ESTL indicates technological advantages in aircraft selection, route planning, flight control systems, etc., effectively controlling total carbon emissions; even lacking traditional scale advantages, such enterprises can gain competitiveness in carbon efficiency through technology and high per-flight profit margins. Taking Shenzhen Airlines as an example, relying on a solid regional market foundation and resource support from its parent company Air China, it maintained stable TOR. Shenzhen Airlines and Hainan Airlines are more inclined towards the high-end market in terms of route positioning, with relatively high flight service quality and relatively high average ticket prices. They also made early plans for energy-saving models, introduced digital dispatching systems, and focused on improving the level of operation technology management. Ruili Airlines has maintained a high flight efficiency in regional operations and has made certain investments in new energy-saving equipment, demonstrating the synergy between technology-driven and ticket revenue.

4.3.4. Passenger–Cargo Synergy Mixed (H4)

Configuration H4 indicates that high RPF, high TOR, and high CS, combined with the absence of high ALF and the absence of high ESTL as core conditions, and complemented by the absence of high ASC as a peripheral condition, can lead to high airline carbon emission efficiency. This configuration shows that through a diversified profit structure formed by passenger profitability, a strong scale revenue base, and cargo business support, airlines can achieve high carbon emission efficiency even with low ASC and limited technology investment. Specifically: Passenger–cargo synergy effect: High CS means flight resources are utilized more fully, with belly cargo and passenger transport synergistically improving the comprehensive transport efficiency per flight, spreading carbon emissions; high fares and high revenue: High average fares and operating income form a solid revenue base, enabling the airline to maintain strong operational capacity despite lacking advanced energy-saving technology; structural optimization under low technology: Although ESTLs are not high, optimizing capacity structure and product structure achieves revenue maximization, indirectly improving carbon efficiency. Typical cases in this configuration include Air China and Hainan Airlines. For example, Hainan Airlines implements a high-end service strategy on several international and intercontinental routes, with fare levels at the high end of the industry, while also focusing on cargo route development, forming unique advantages in passenger–cargo synergy. Although the proportion of fuel-efficient aircraft is slightly lower, through revenue structure and transport structure optimization, its unit carbon emission performance remains excellent. Air China and Shandong Airlines have been actively developing belly cargo, trunk cargo, and mail services. On the basis of stabilizing passenger revenue, they have improved the overall utilization rate of flight resources through cargo business, achieving a revenue structure of passenger and cargo synergy. In addition, Sichuan Airlines has also developed cargo and mail services in the western region. It has a strong ability to match and adjust passengers and cargo in its route scheduling, demonstrating the positive promoting effect of comprehensive operational capabilities on carbon emission efficiency.

4.4. Robustness Test

To test the robustness of the results, this paper refers to previous research. First, the raw consistency threshold was adjusted from 0.8 to 0.85. The configurations obtained were completely consistent with the original model [44]. Second, the calibration anchor points were reselected, adjusting the full membership, crossover, and full non-membership anchors to the 95th, 50th, and 5th percentiles, respectively. The new configurations did not change significantly, and the consistency and coverage of each configuration showed no obvious changes. Therefore, the conclusions of this study are robust [45].

5. Conclusions

5.1. Discussion of Results

Against the backdrop of the continuous advancement of the “dual carbon” strategy, enhancing the carbon emission efficiency of airlines has become a key issue that policymakers and aviation enterprises urgently need to address. This study emphasizes that the factors influencing carbon emission efficiency are not limited to a single technical or operational indicator, but rather the synergy among multiple factors such as economic benefits, transportation scale, and energy usage. In this study, by integrating DEA and fsQCA methods, the carbon emission efficiency of 13 major airlines in China was calculated, and an in-depth exploration was conducted on how the combination of multiple factors jointly drives the improvement of carbon efficiency.
Firstly, an efficiency evaluation system was established, which includes labor force, fleet size, and fuel consumption as input indicators, transportation turnover volume and operating income as expected output indicators, and carbon emissions as non-expected output. Secondly, the fsQCA results show that there is no single variable that can constitute a necessary condition for high carbon emission efficiency. Instead, a coordinated combination of multiple conditions is required to achieve high efficiency performance. Thirdly, four typical path configurations were identified, including “capacity-driven type”, “scale revenue-driven type”, “high fare + technology-driven type”, and “passenger and freight coordinated hybrid type”. The different paths reflect the diverse strategic choices of Chinese airlines in enhancing carbon efficiency, providing practical references for enterprises to carry out differentiated low-carbon transformation. In conclusion, this study not only achieves the integration of efficiency measurement and causal configuration at the methodological level but also provides practical and operationally valuable path guidance for the green transformation of aviation enterprises.

5.2. Theoretical Significance

First, this paper introduces the SBM-DDF model combined with the bootstrap-DEA method to conduct a robust assessment of the carbon emission efficiency of Chinese airlines. This not only overcomes the problem of traditional DEA methods ignoring undesirable outputs (such as carbon emissions) but also effectively eliminates sample bias and random interference through bootstrap technology, enhancing the credibility and explanatory power of the efficiency evaluation results. In the field of aviation carbon emission research, the existing literature mostly uses traditional DEA or the Malmquist index, neglecting the impact of environmental constraints and statistical noise. The methodological innovation in this paper provides a more realistic evaluation paradigm for subsequent research.
Second, this paper introduces the fs-QCA method into the study of factors influencing carbon efficiency. Unlike traditional linear statistical tools, like regression models, fs-QCA can handle the multiplicity of causality, the asymmetry of condition combinations, and the complex relationships in small samples. This provides a richer perspective for understanding the diverse pathways airlines face in improving carbon efficiency. This not only compensates for the insufficient consideration of interactions between factors in existing research but also enhances the explanatory power and applicability of the research findings to practical problems.
Third, the study finds that different levels of economic benefit, transport benefit, and energy consumption can achieve improvements in carbon emission efficiency through multiple combinations, demonstrating a clear characteristic of “equifinality”. Even without all favorable conditions, enterprises can achieve high-efficiency development through specific configurations. This breaks the linear causal assumptions that “high economic benefit means high efficiency” or “energy constraints mean low efficiency,” proposing a new idea of “configurational optimization replacing single-factor optimization” and expanding the theoretical logic framework in green transformation research.

5.3. Practical Significance

Firstly, it provides differentiated emission reduction path references for different types of airlines. Research has found that four paths, namely “high passenger-load factor driven type”, “scale benefit driven type”, “high fare + technology driven type”, and “passenger and freight coordinated hybrid type”, can all achieve high carbon emission efficiency. This indicates that both low-cost airlines (such as Spring Airlines) and large state-owned airlines (such as China Eastern Airlines and Hainan Airlines) can choose appropriate low-carbon development paths based on their own resource endowments, thereby avoiding a “one-size-fits-all” carbon reduction model and promoting precise transformation of enterprises.
Secondly, it provides a basis for classified policy formulation and industry management. Regulatory authorities can formulate more targeted policy tools based on the route characteristics of different airlines. For instance, enterprises that rely on technological innovation can be granted subsidies for the purchase of green aircraft. For enterprises that rely on high-load operations, the approval of routes and the frequency arrangement can be optimized. For enterprises that coordinate passenger and freight transportation, policies to support freight transportation can be strengthened to enhance overall transportation efficiency. This is conducive to building a civil aviation green governance system featuring “categorized support and coordinated advancement”.
Finally, it is suggested that small- and medium-sized airlines, under the condition of limited resources, actively explore feasible strategies for improving carbon efficiency. Although the configurations identified in this study are mostly concentrated in large airlines with relatively abundant resources, this does not mean that small- and medium-sized airlines have no room for improvement. In the absence of high income and high-tech investment, small- and medium-sized enterprises can still improve their carbon emission efficiency by increasing passenger-load factors, optimizing route structures, and strengthening operational management. This provides a feasible direction for the green development of resource-constrained enterprises and also expands the scope of application of the low-carbon transformation path.

5.4. Limitations and Outlook

Although this study has made some explorations in carbon emission efficiency measurement and influencing factor analysis, the following limitations remain: First, limited data coverage. Due to data acquisition constraints, the research sample mainly focused on major domestic airlines and did not comprehensively cover small- and medium-sized airlines, which may affect the generalizability of the research results. Second, external environmental disturbance factors were not considered. External factors such as international oil price fluctuations and public health emergencies (e.g., the COVID-19 pandemic) impacting airline operations and carbon efficiency have not been incorporated into the analytical framework. Third, the analysis of interaction mechanisms needs deepening. Although the influence of economic, transport, and energy factors was identified, the interaction effects and mediating pathways among these three have not been thoroughly explored.
Addressing the above shortcomings, future research can be expanded in the following aspects: First, broaden data sources to enhance sample representativeness. Incorporating data from more small- and medium-sized airlines and international aviation companies will improve the breadth and adaptability of the research. Second, introduce dynamic analysis frameworks. Methods such as dynamic network DEA and temporal fs-QCA can be used to reveal the temporal evolution characteristics and the driving mechanisms of efficiency changes more deeply. Third, integrate policy variables and non-economic factors. Introducing variables such as carbon trading policies, environmental regulations, and corporate environmental awareness is expected to enrich the explanatory power of efficiency-influencing factors. Fourth, explore integrated multi-method analysis paths. Combining methods like PLS-SEM and fs-QCA can achieve complementarity between quantitative analysis and configurational analysis, uncovering carbon efficiency improvement pathways under different scenarios.

Author Contributions

Conceptualization, L.Z. and J.Z.; methodology, L.Z. and J.Z.; software, L.Z.; validation, L.Z.; formal analysis, L.Z.; resources, L.Z.; data curation, L.Z.; writing—original draft preparation, L.Z.; writing—review and editing, L.Z. and J.Z.; supervision, J.Z.; project administration, J.Z. All authors have read and agreed to the published version of the manuscript.

Funding

This research was funded by the Shanghai Philosophy and Social Science Planning Project (General Project), grant number 2024BJC002 (Project Title: Research on the Coupling Mechanism and Empowerment Path between Green Efficiency of Transportation and High-Quality Economic Development in the Yangtze River Economic Belt).

Institutional Review Board Statement

Not applicable.

Informed Consent Statement

Not applicable.

Data Availability Statement

Data will be made available on request.

Conflicts of Interest

The authors declare no conflicts of interest.

References

  1. Scheelhaase, J.; Maertens, S.; Grimme, W. Options for improving the EU Emissions Trading Scheme (EU ETS) for aviation. Transp. Res. Procedia 2021, 59, 193–202. [Google Scholar] [CrossRef]
  2. Mai, D.T.T. Revising the EU ETS and CORSIA in times of the COVID-19 pandemic: Challenges for reducing global aviation emissions. Clim. Policy 2021, 21, 1357–1367. [Google Scholar] [CrossRef]
  3. Schinas, O.; Bergmann, N. Emissions trading in the aviation and maritime sector: Findings from a revised taxonomy. Clean. Logist. Supply Chain 2021, 1, 100003. [Google Scholar] [CrossRef]
  4. Civil Aviation Administration of China. Statistical Bulletin on the Development of the Civil Aviation Industry in 2023; CAAC: Beijing, China, 2024. Available online: http://www.caac.gov.cn/ (accessed on 20 July 2025).
  5. Air China Limited. 2021 Environmental, Social and Governance Report; Air China Limited: Beijing, China, 2022; Available online: http://www.airchina.com.cn/ (accessed on 4 July 2025).
  6. Spring Airlines Co., Ltd. 2021 Corporate Social Responsibility Report; Spring Airlines Co., Ltd.: Shanghai, China, 2022; Available online: https://www.ch.com/ (accessed on 4 July 2025).
  7. Domagała, J.; Kadłubek, M. Economic, energy and environmental efficiency of road freight transportation sector in the EU. Energies 2022, 16, 461. [Google Scholar] [CrossRef]
  8. Ma, Q.; Jia, P.; Kuang, H. Spatial imbalance and factors influencing carbon emission efficiency in China’s transport industry. Front. Earth Sci. 2022, 10, 986467. [Google Scholar] [CrossRef]
  9. Cui, Q.; Hu, Y.; Yu, L. Can the aviation industry achieve carbon emission reduction and revenue growth simultaneously under the CNG2020 strategy? An empirical study with 25 benchmarking airlines. Energy 2022, 245, 123272. [Google Scholar] [CrossRef]
  10. Wang, Z.; Xu, X.; Zhu, Y.; Gan, T. Evaluation of carbon emission efficiency in China’s airlines. J. Clean. Prod. 2020, 243, 118500. [Google Scholar] [CrossRef]
  11. Xu, L.; Yin, H.; Sun, M.; Wang, M.; Shen, K.; Ji, J. Carbon Abatement Technology Transformation and Correlated Risks in the Airline Industry. Sustainability 2025, 17, 1399. [Google Scholar] [CrossRef]
  12. Yu, J.; Lu, M.; Wang, K.; Ge, J.; Tao, Z.; Xu, Z.; Chen, L. Decomposing Carbon Intensity Trends in China’s Civil Aviation: A Comprehensive Analysis from 1998 to 2019. Aerospace 2024, 11, 480. [Google Scholar] [CrossRef]
  13. Tone, K.A. Slacks-based measure of efficiency in data envelopment analysis. Eur. J. Oper. Res. 2001, 130, 498–509. [Google Scholar] [CrossRef]
  14. Fukuyama, H.; Weber, W.L. A directional slacks-based measure of technical inefficiency. Socio-Econ. Plan. Sci. 2009, 43, 274–287. [Google Scholar] [CrossRef]
  15. Liu, Z.; Xin, L. The Impact of the “Belt and Road” Initiative on Green Total Factor Productivity in Key Chinese Provinces Along the Route. China Popul. Resour. Environ. 2018, 28, 87–97. (In Chinese) [Google Scholar]
  16. Song, M.L.; Zhang, L.L.; Liu, W.; Fisher, R. Bootstrap-DEA analysis of BRICS’ energy efficiency based on small sample data. Appl. Energy 2013, 112, 1049–1055. [Google Scholar] [CrossRef]
  17. Zhou, P.; Ang, B.W.; Poh, K.L. A survey of data envelopment analysis in energy and environmental studies. Eur. J. Oper. Res. 2008, 189, 1–18. [Google Scholar] [CrossRef]
  18. Lee, J.; Mo, J. Analysis of technological innovation and environmental performance improvement in aviation sector. Int. J. Environ. Res. Public Health 2011, 8, 3777–3795. [Google Scholar] [CrossRef]
  19. Ding, H.; Zhang, Y.; Li, X. Carbon Emission Intensity and Its Abatement Choices: Evidence from China Eastern Airlines. Sustainability 2023, 15, 16383. [Google Scholar] [CrossRef]
  20. Ma, Q.; Song, H.; Zhu, W. Low-carbon airline fleet assignment: A compromise approach. J. Air Transp. Manag. 2018, 68, 86–102. [Google Scholar] [CrossRef]
  21. Hong, S.; Zhang, A. An efficiency study of airlines and air cargo/passenger divisions: A DEA approach. World Rev. Intermodal Transp. Res. 2010, 3, 137–149. [Google Scholar] [CrossRef]
  22. Singh, V.; Sharma, S.K. Fuel consumption optimization in air transport: A review, classification, critique, simple meta-analysis, and future research implications. Eur. Transp. Res. Rev. 2015, 7, 12. [Google Scholar] [CrossRef]
  23. International Civil Aviation Organization (ICAO). Environmental Report 2022: Innovation for a Green Transition; ICAO: Montréal, QC, Canada, 2023; Available online: https://www.icao.int/environmental-protection/Pages/envrep2022.aspx (accessed on 4 July 2025).
  24. International Air Transport Association (IATA). Annual Review 2024. IATA. Available online: https://www.iata.org/contentassets/c81222d96c9a4e0bb4ff6ced0126f0bb/iata-annual-review-2024.pdf (accessed on 4 July 2025).
  25. Brueckner, J.K.; Kahn, M.E.; Nickelsburg, J. How do airlines cut fuel usage, reducing their carbon emissions? Econ. Transp. 2024, 38, 100358. [Google Scholar] [CrossRef]
  26. Environmental and Energy Study Institute (EESI). The Growth in Greenhouse Gas Emissions from Commercial Aviation; EESI: Washington, DC, USA, 2021; Available online: https://www.eesi.org/files/FactSheet_Climate_Impacts_Aviation_2019rev2021.pdf (accessed on 4 July 2025).
  27. Yue, S.; Liao, W.; Ji, Q.; Wang, C. The effect of financial performance on aviation carbon emissions. J. Air Transp. Manag. 2025, 126, 102800. [Google Scholar] [CrossRef]
  28. International Council on Clean Transportation (ICCT). CO2 Emissions from Commercial Aviation, 2018. ICCT. Available online: https://theicct.org/wp-content/uploads/2021/06/ICCT_CO2-commercl-aviation-2018_20190918.pdf (accessed on 4 July 2025).
  29. Ishka Global. One Aircraft, Many Intensities: Comparing CO2/ASK of New-Tech Operators; Ishka Global: London, UK, 2022. [Google Scholar]
  30. ICCT (International Council on Clean Transportation). CO2 Emissions from Commercial Aviation: 2013, 2018, and 2019; ICCT: Washington, DC, USA, 2020; Available online: https://theicct.org/publication/co2-emissions-from-commercial-aviation-2013-2018-and-2019/ (accessed on 4 July 2025).
  31. ICCT (International Council on Clean Transportation). Fuel Burn of New Commercial Jet Aircraft: 1960 to 2019; ICCT: Washington, DC, USA, 2020; Available online: https://theicct.org/publication/fuel-burn-of-new-commercial-jet-aircraft-1960-to-2019/ (accessed on 4 July 2025).
  32. International Council on Clean Transportation (ICCT). Aviation Fuel Efficiency: ‘If You Can’t Measure It, You Can’t Improve It.’; ICCT: Washington, DC, USA, 2021. [Google Scholar]
  33. Wikipedia Contributors. (n.d.). Fuel Economy in Aircraft. Wikipedia. Available online: https://en.wikipedia.org/wiki/Fuel_economy_in_aircraft (accessed on 4 July 2025).
  34. Fiss, P.C. A Fuzzy Set Approach to Typologies in Organization Research. Acad. Manag. J. 2010, 54, 393–420. [Google Scholar] [CrossRef]
  35. Schneider, C.Q.; Wagemann, C. Set-Theoretic Methods for the Social Sciences: A Guide to Qualitative Comparative Analysis; Cambridge University Press: Cambridge, UK, 2012. [Google Scholar]
  36. Misangyi, V.F.; Greckhamer, T.; Furnari, S.; Fiss, P.C.; Crilly, D.; Aguilera, R. Embracing causal complexity: The emergence of a neo-configurational perspective. J. Manag. 2017, 43, 255–282. [Google Scholar] [CrossRef]
  37. Marx, A.; Rihoux, B.; Ragin, C. The origins, development, and application of Qualitative Comparative Analysis: The first 25 years. Eur. Political Sci. Rev. 2014, 6, 115–142. [Google Scholar] [CrossRef]
  38. Zschoch, M.A. Configurational Comparative Methods: Qualitative Comparative Analysis (QCA) and Related Techniques, Benoit Rihoux and Charles Ragin, eds., Thousand Oaks CA: Sage Publications, 2009, pp. xxv, 209. Can. J. Political Sci. Rev. Can. Sci. Polit. 2011, 44, 743–746. [Google Scholar] [CrossRef]
  39. Gan, T. An Empirical Study on Carbon Emission Efficiency of Air Transport Enterprises. Master’s Thesis, Nanjing University of Aeronautics and Astronautics, Nanjing, China, 2019. (In Chinese). [Google Scholar] [CrossRef]
  40. Yang, Y.; Guo, G. Research on Carbon Emission Efficiency of Aviation Enterprises Based on Super-efficiency SBM Model. J. Environ. Eng. Technol. 2023, 13, 1779–1786. (In Chinese) [Google Scholar]
  41. Ragin, C.C. Redesigning Social Inquiry: Fuzzy Sets and Beyond; University of Chicago Press: Chicago, IL, USA, 2009. [Google Scholar]
  42. Cui, Q.; Li, Y.; Yu, C.L.; Wei, Y.M. Evaluating energy efficiency for airlines: An application of virtual frontier dynamic slacks based measure. Energy 2016, 113, 1231–1240. [Google Scholar] [CrossRef]
  43. Broekhoff, D.; Gillenwater, M.; Colbert-Sangree, T.; Cage, P. Securing Climate Benefit: A Guide to Using Carbon Offsets; Stockholm Environment Institute & Greenhouse Gas Management Institute: Stockholm, Sweden, 2019; p. 60. [Google Scholar]
  44. Li, W.; Zhang, J.; Zhu, H.; Hao, T.; Mei, L.; Su, Y. Green Marketing and the Path to Realizing Local Sustainable Development---Joint Dynamic Analysis of Data Envelopment Analysis (DEA) and Fuzzy Set Qualitative Comparative Analysis (fs-QCA) Based on China’s Provincial Panel Data. Sustainability 2024, 16, 4644. [Google Scholar] [CrossRef]
  45. Xia, J.; Zhang, L.; Song, Y. The impact of environmental regulatory instruments on agribusiness technology innovation—A study of configuration effects based on fs-QCA. PLoS ONE 2024, 19, e0294662. [Google Scholar] [CrossRef]
Figure 1. Theoretical Framework.
Sustainability 17 06826 g001
Table 1. Input–output indicators for carbon emission efficiency of airlines.
CategoryIndicatorVariableMeasurement Unit
InputsFleet SizeActive AircraftNumber of Aircraft
LaborEmployeesNumber of Employees
Fuel ConsumptionJet Fuel Consumption100 million tons
Desirable OutputsOperating RevenueTotal Operating RevenueBillion CNY (¥)
Traffic TurnoverTotal Traffic Turnover10,000 ton-km
Undesirable OutputCarbon EmissionsCO2 Emissions100 million tons
Table 2. Calibration and descriptive analysis results.
SetCalibration AnchorsDescriptive Analysis
Full MemberCrossoverFull Non-MemberMeanStd. Dev.MinMaxUnit
CE Eff1.0710.8770.6350.8740.170.3751.188/
RFP25.63410.6425.41113.447.8072.79934.579¥10k/Flight
TOR1144.794160.8117.643360.424435.70151543.22¥100 million
ALF3.4262.1191.2042.022.1260.3924.48510k ton-km/Flight
ASC201.852164.4126.971166.233134.43576244.736Seats/Aircraft
ESTL5.2022.5031.8743.252.5040.9786.73410k tons/h
CS0.2980.0970.0320.130.0990.0120.458/
Table 3. Necessity analysis results.
Antecedent ConditionConsistency for High CE EffCoverage for High CE Eff
RFP0.6910.742
~RFP0.5440.56
TOR0.5920.7
~TOR0.6130.579
ALF0.7170.767
~ALF0.5120.53
ASC0.6910.668
~ASC0.5610.647
ESTL0.7240.672
~ESTL0.5310.643
CS0.5780.663
~CS0.6450.626
∼, Negation (NOT).
Table 4. The configuration for airlines to achieve high carbon emission efficiency.
Antecedent ConditionHigh Airline Carbon Emissions
H1H2H3H4
RFP
TOR
ALF
ASC-
ESTL
CS
Consistency0.9381870.908890.9480860.936534
Raw Coverage0.3425410.2459830.2938430.200422
Unique Coverage0.0833830.2612330.02298850.0169258
Solution Coverage0.434275
Solution Consistency0.909016
● indicates the presence of the core condition, ⭙ indicates the absence of the core condition, ⮾ indicates the absence of the marginal condition, and - indicates dispensable.
Disclaimer/Publisher’s Note: The statements, opinions and data contained in all publications are solely those of the individual author(s) and contributor(s) and not of MDPI and/or the editor(s). MDPI and/or the editor(s) disclaim responsibility for any injury to people or property resulting from any ideas, methods, instructions or products referred to in the content.

