

Climate Risks and Common Prosperity for Corporate Employees: The Role of Environment Governance in Promoting Social Equity in China


Abstract
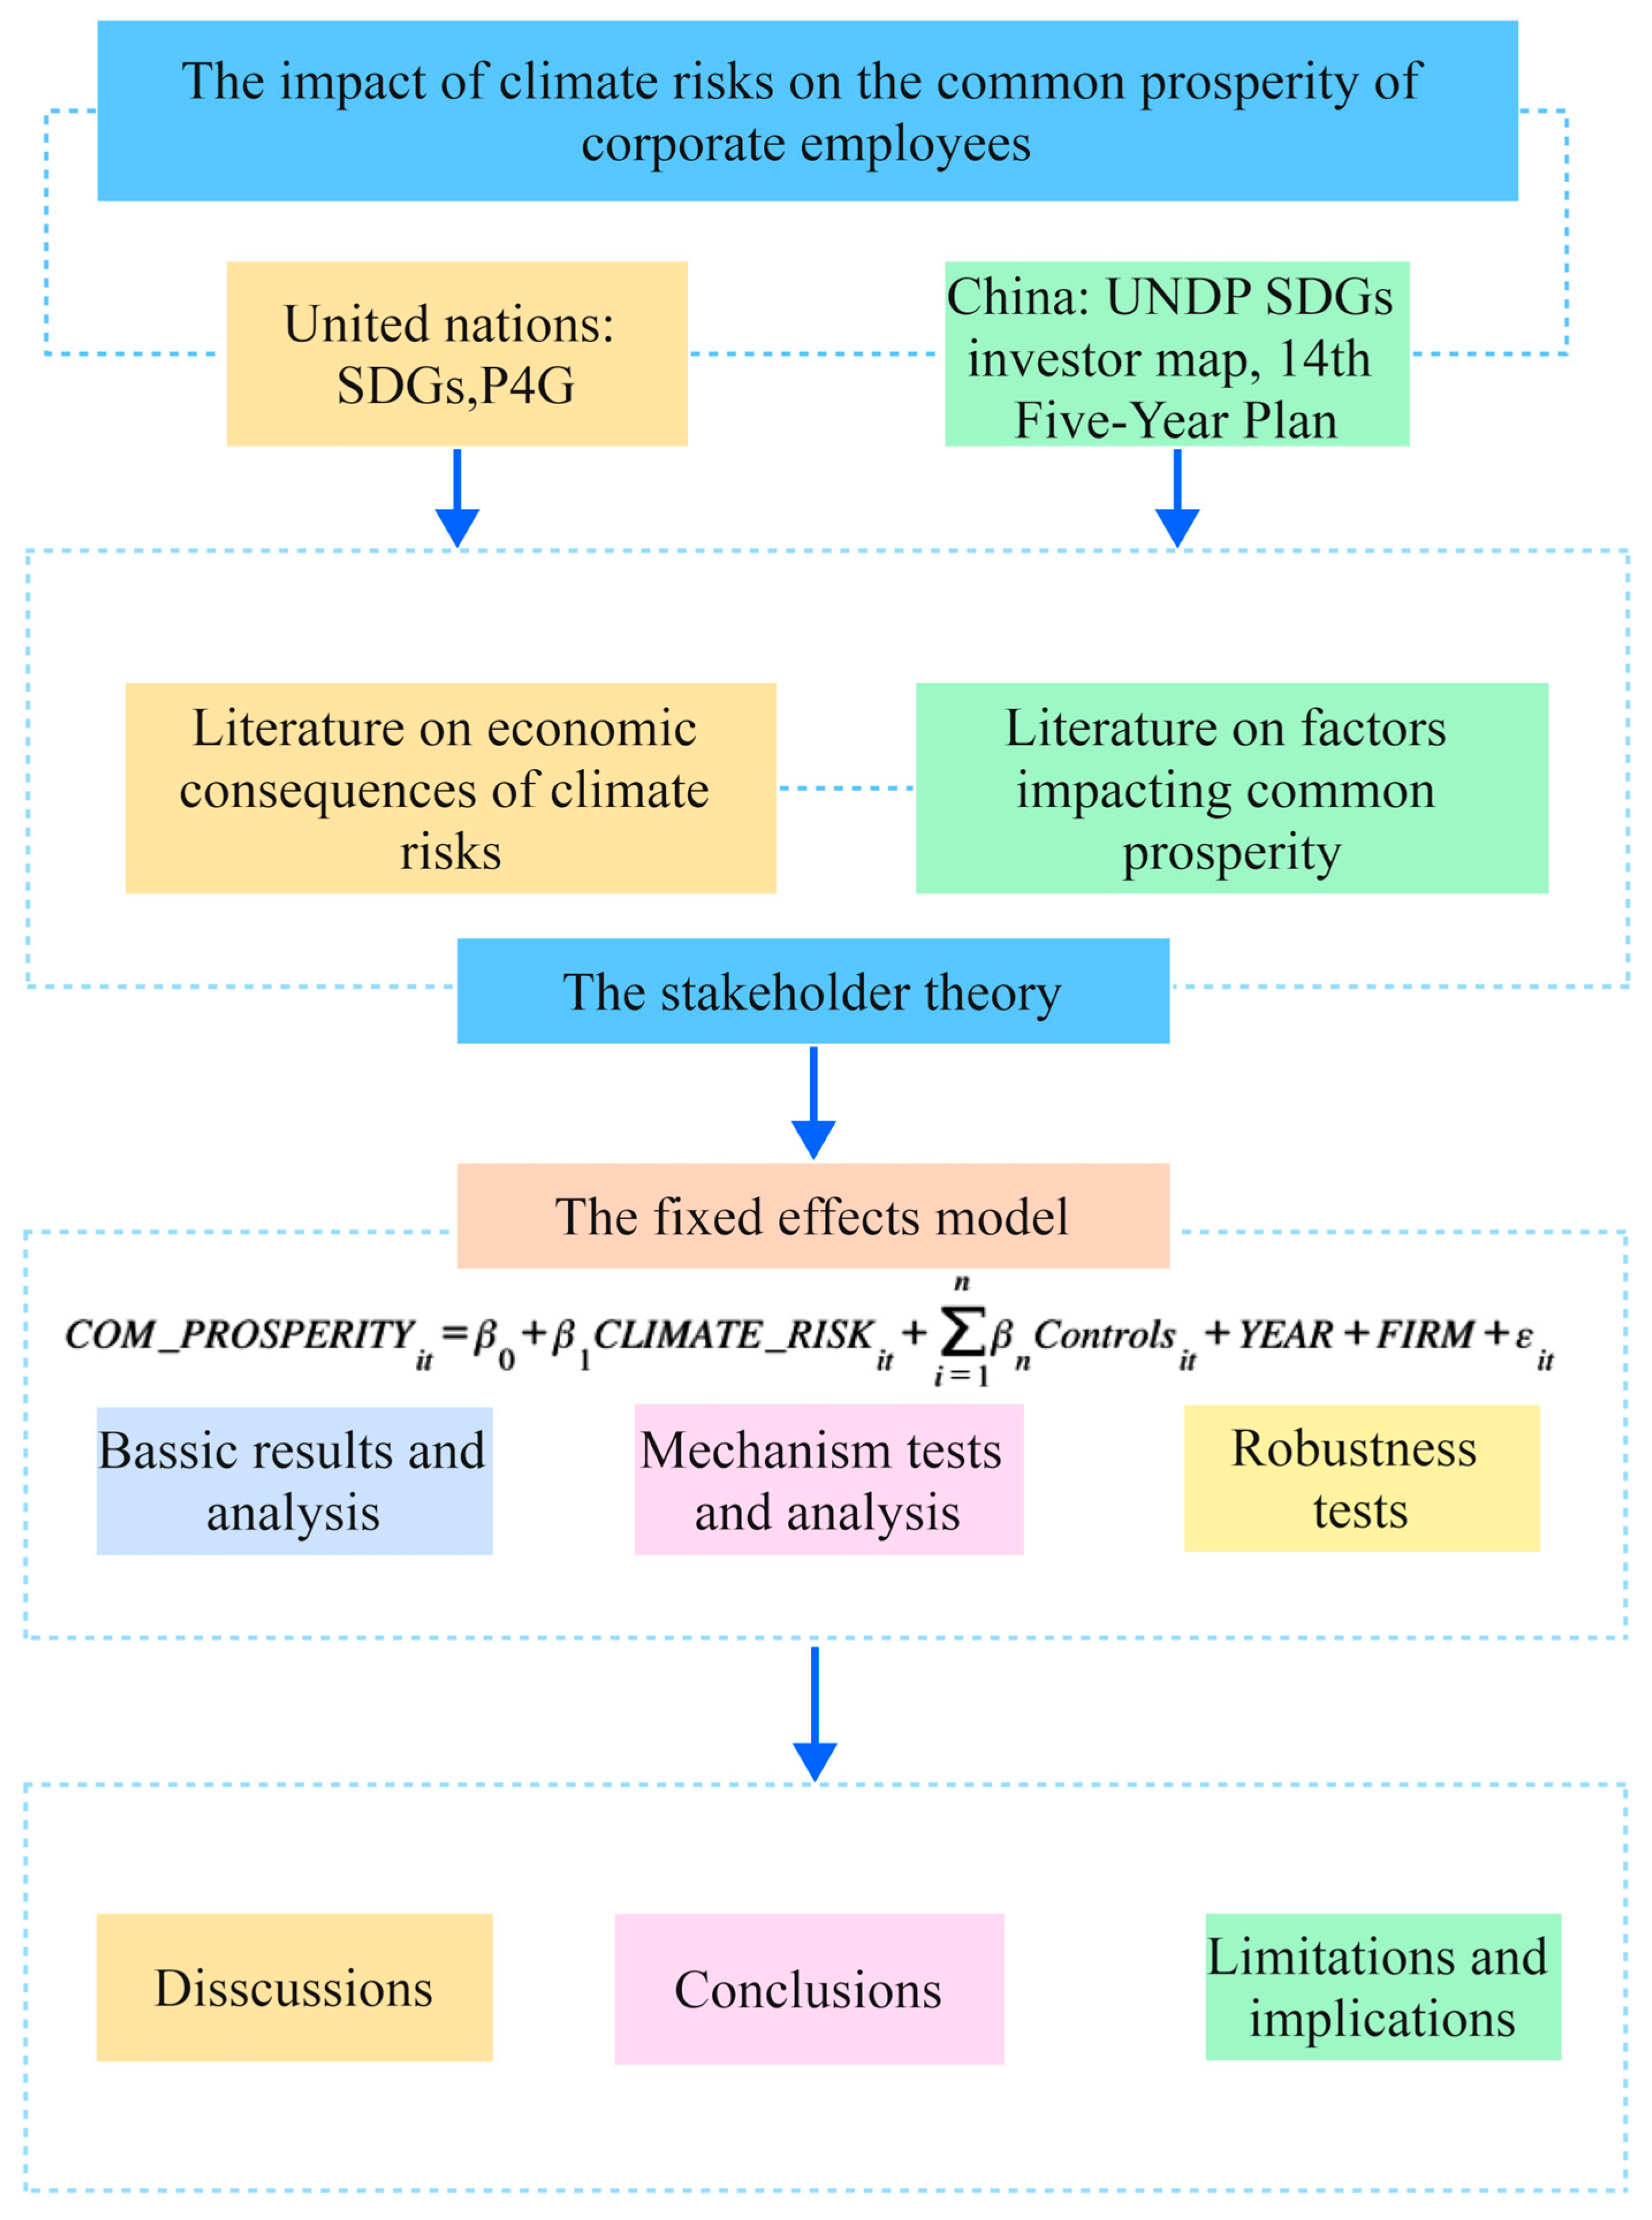
1. Introduction
- (1)
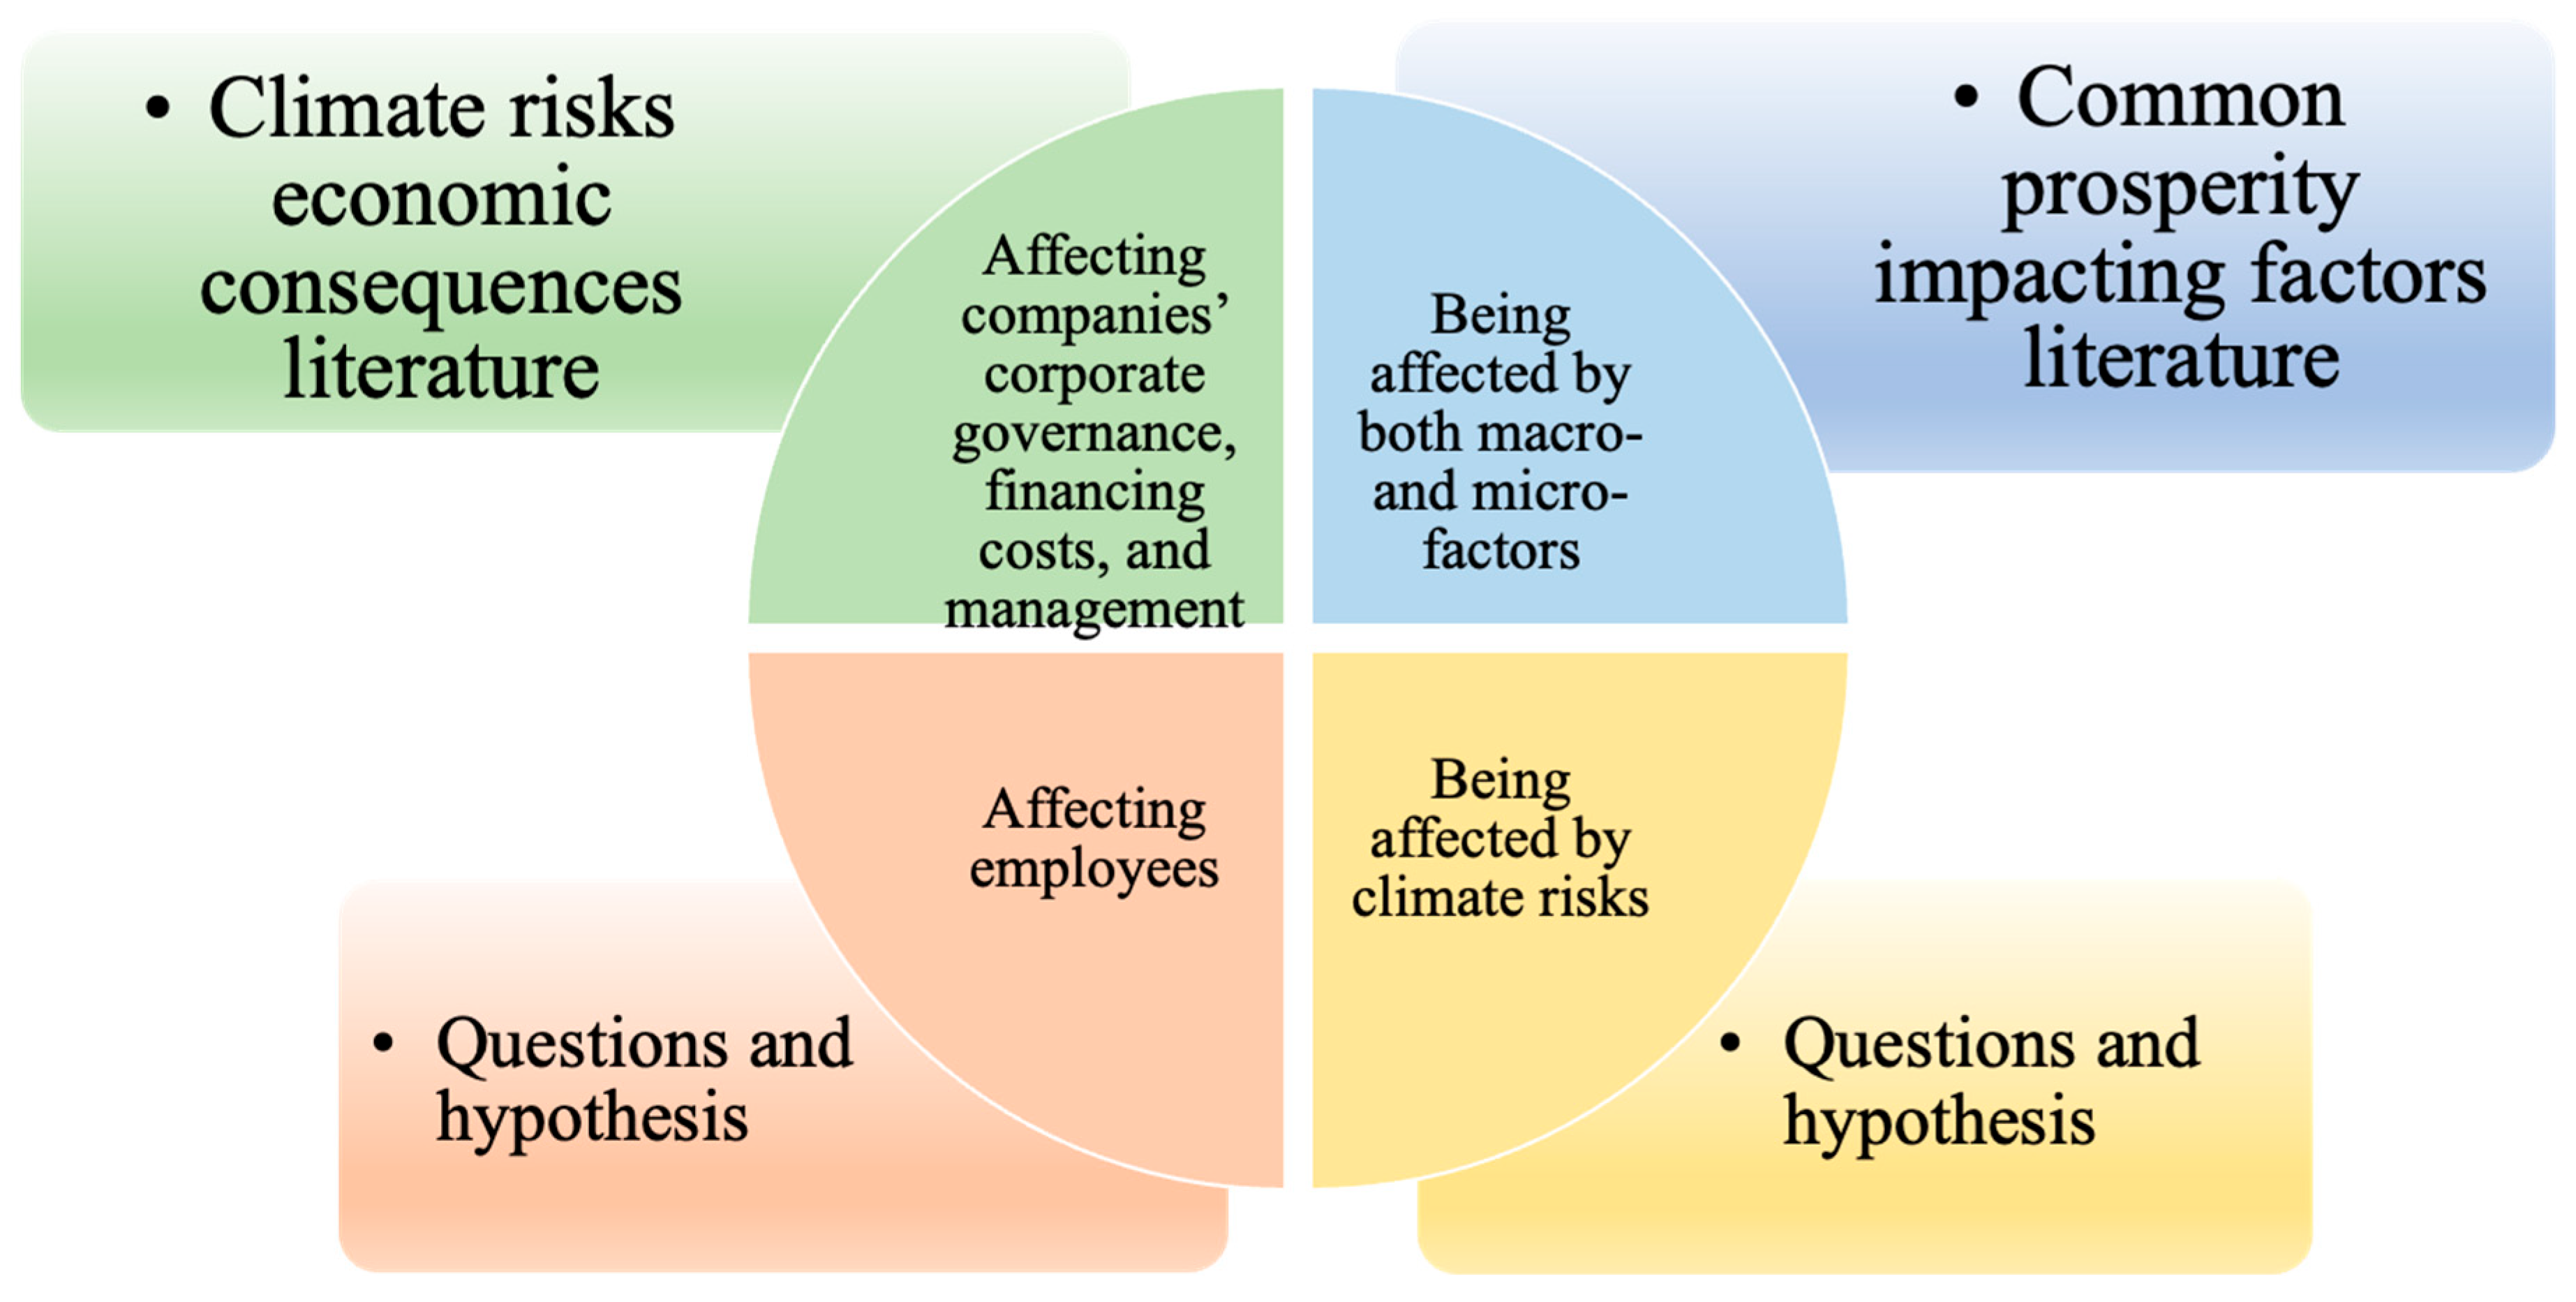
- It breaks through the corporate financial perspective of research on the economic consequences of climate risk and expands the boundaries of research on the impact of climate risk on micro-level corporate entities by focusing on employees as core stakeholders (existing studies such as Ge et al. (2025) focus on the corporate-level consequences of financing costs [6]).
- (2)
- It expands the research on common prosperity from a micro level, using corporate employees as a sub-group to empirically test the impact of climate risk, thereby enriching the research on the micro-level driving mechanisms of common prosperity (existing research such as Lyu et al. (2025) focuses on common prosperity at the macro level [14]).
- (3)
- It innovatively constructs a measurement system for common prosperity among employees from the three dimensions of compensation, employment, and guarantees, overcoming the single reliance on labor income share in traditional research (such as Li et al. (2025) [15]) and more comprehensively capturing the rights and interests of employees.
2. Literature Review and Hypothesis Development
3. Materials and Methods
3.1. Data and Samples
3.2. Methodology
3.2.1. The Fixed-Effects Model
3.2.2. Models and Variables
4. Results and Analysis
4.1. Analysis of Main Regression Results
4.2. Mechanism Analysis
4.3. Moderating Effect Analysis
4.4. Robustness Tests
5. Discussions
6. Conclusions
- (1)
- This study confirms our research objectives. That is, this study confirms that climate risk has a significant impact on the common prosperity of corporate employees. Moreover, overall, climate risk has a certain promotional effect on the common prosperity of corporate employees.
- (2)
- This study does not confirm the impact of climate risk on corporate employee compensation (H1). According to the regression results in Table 3, the regression coefficient between climate risk and corporate employee compensation is negative but insignificant. Therefore, this study cannot conclude that climate risk has a negative impact on corporate employee compensation.
- (3)
- This study also did not confirm the impact of climate risk on corporate employee employment (H2). According to the regression results in Table 3, the regression coefficient between climate risk and corporate employee employment is insignificant. Therefore, this study cannot conclude that climate risk has a negative impact on corporate employee employment.
- (4)
- This study confirmed that climate risk has a positive effect on corporate employee guarantees (H3). According to the regression results in Table 3, the regression coefficient between climate risk and corporate employee guarantees is positive and significant. Combined with the robustness test of this study, it can be concluded that climate risk can positively promote corporate employee guarantees.
- (5)
- This study confirmed that climate risk increases the financial constraints of the company (H4), which increases financial costs for the company, preventing increases in the compensation of corporate employees.
- (6)
- This study confirmed that climate risk improves the ESG performance of the company (H5). This conclusion illustrates that climate risks will push corporations to adopt more sustainable measures, thereby promoting improvements in employee guarantees.
- (7)
- This study confirms the mediating role of internal supervision (internal control, IC_SCORE) and external supervision (audit quality, BIG4, AUD_FEE) in corporations. According to the regression results in Table 4 and Table 5, the interaction variable between corporate audit quality and internal control and climate risk is significantly positive. Combined with the results of the main regression, it can be concluded that climate risk forces corporations to improve corporate governance, thereby promoting the common prosperity of corporate employees.
- (8)
- This study confirms the positive moderating effect of corporate size and corporate performance on the relationship between climate risk and the common prosperity of corporate employees. According to the results in Table 6, the interaction variables between corporate size and performance proxies and climate risk are significantly positive. Combined with the results of the main regression, it can be concluded that the larger the corporate size and the higher the corporate performance, the more obvious the promoting effect of climate risk on the common prosperity of corporate employees.
7. Limitations and Implications
7.1. Limitations
- (1)
- This study uses text analysis to measure climate risks. Future research may consider combining text analysis with remote sensing data and field survey data to measure climate risks.
- (2)
- This study examines corporate employees without distinguishing among different levels of employees. Follow-up research may consider further studying common prosperity among employees at different levels within a corporation.
- (3)
- This study’s measurement of common prosperity among employees is limited to three quantifiable dimensions: compensation, employment, and security. It does not fully cover the subjective dimensions of “spiritual confidence and self-reliance,” “social unity and harmony,” and “living a happy and beautiful life.” Future research can combine questionnaire survey data to explore the relationship between climate risk and common prosperity from a more comprehensive perspective.
- (4)
- This study focuses on measuring common prosperity in terms of compensation, employment and guarantees. It is a preliminary exploration of the micro-level dimensions of common prosperity, rather than a comprehensive portrayal of common prosperity in society as a whole. Future research could combine social survey data with subjective well-being indicators to construct a more comprehensive measurement system.
- (5)
- In terms of industry selection, high-carbon and low-carbon industries may respond differently to climate risks, which in turn may have different impacts on the common prosperity of employees.
7.2. Implications
- (1)
- Implications for corporate managers: Companies need to incorporate climate risk into their strategic management systems and transform environmental pressures into institutional advantages that protect employee rights and interests by improving internal control processes and enhancing audit independence.
- (2)
- Implications for policymakers: The government can guide corporations to fulfill their responsibilities for employee rights through climate regulation and ESG incentive policies. For example, it can incorporate employee protection indicators into corporate climate rating systems and provide tax incentives or green financing support for investments in employee rights in high-climate-risk industries.
- (3)
- Implications for social governance entities: As coordinators of multiple stakeholder interests, social governance entities (such as industry associations and trade unions) should focus on reducing information asymmetry and power imbalances. By establishing platforms for employees, corporations, and regulatory agencies to consult on climate risk response measures, trade unions can work with corporations to design climate-adaptive welfare programs (such as flexible work arrangements during extreme weather) to meet employee needs. In addition, non-governmental organizations (NGOs) can publish corporate “climate fairness rankings” to highlight best practices in balancing climate governance and employee rights. This public pressure can complement formal regulation and urge underperforming companies to improve.
- (4)
- Implications for corporate employees: As key stakeholders affected by climate risks and corporate responses, employees can actively participate in relevant processes to protect their rights and interests. By raising awareness of their rights, employees can understand the link between climate risks and workplace benefits. For example, they can recognize that improvements in internal controls (such as standardized safety protocols) and external audits (such as third-party oversight) should translate into better protection of their legal rights (such as occupational health and social security). In addition, through participation in feedback mechanisms and channels such as trade unions or employee representative meetings, they can express their opinions on climate risk adaptation measures and advocate for the satisfaction of employee needs, such as flexible work arrangements during extreme weather events or transparent disclosure of the impact of climate-related investments on employee welfare. This active participation helps to align corporate climate strategies with employee welfare.
Author Contributions
Funding
Institutional Review Board Statement
Informed Consent Statement
Data Availability Statement
Conflicts of Interest
Appendix A

| Seed Words in Chinese | Seed Words Translated in English (The Order of English Words Corresponds to the Order of Chinese Words) |
|---|---|
| 节能, 电能, 能源, 清洁, 燃料, 生态, 节水, 环境, 绿色, 转型, 太阳能, 升级, 循环, 改造, 利用率, 核电, 风电, 天然气, 增效, 燃油, 效率, 循环, 再生, 高效, 光伏, 减排, 降耗, 灾害, 地震, 台风, 海啸, 洪涝, 旱涝, 火灾, 极端, 暴雨, 恶劣, 内涝, 大风, 沙尘, 冰雹, 特殊, 旱灾, 飓风, 霜冻, 水灾, 风暴, 泥石流, 滑坡, 洪水, 洪灾, 干旱, 暴雪, 凌冻, 雪灾, 冰雪, 气候, 天气, 自然, 潮湿, 水温, 降温, 寒冷, 气温, 降雨, 温度, 雨水, 雨季, 雨情, 冰冻, 降水, 早霜, 低温, 高温, 雨雪 | Energy saving, electrical energy, energy, clean, fuel, ecology, water saving, environment, green, transformation, solar energy, upgrade, cycle, retrofit, utilization, nuclear power, wind power, natural gas, efficiency, fuel, efficiency, recycling, regeneration, high efficiency, photovoltaic, emission reduction, consumption reduction, disaster, earthquake, typhoon, tsunami, flood, drought, waterlogging, fire, extreme, torrential rainfall, severe, flooding, gale, sand, dust, hail, special, drought, hurricane, frost, flood, storm, mudslide, landslide, flood, flooding, drought, blizzard, freezing, snow, snow and ice, climate, weather, nature, moisture, water temperature, cooling, cold, temperature, rain, rainy, rainy, rainy, frozen, precipitation, early frost, cold, high temperature, rain and snow |
| Expanded Words in Chinese | Expanded Words Translated in English (The Order of English Words Corresponds to the Order of Chinese Words) |
|---|---|
| 节能, 能源, 清洁, 生态, 环境, 转型, 太阳能, 升级, 循环, 利用率, 核电, 风电, 天然气, 增效, 燃油, 效率, 再生, 减排, 环保, 绿色, 低碳, 降耗, 燃料, 节水, 光伏, 高效, 改造, 油耗, 电耗, 能耗, 风电, 光伏, 效能, 集约, 灾害, 地震, 台风, 海啸, 旱涝, 极端, 恶劣, 内涝, 大风, 沙尘, 飓风, 霜冻, 水灾, 风暴, 泥石流, 滑坡, 凌冻, 雪灾, 旱灾, 洪涝, 暴雨, 龙卷风, 冰雹, 洪灾, 雨雪, 冰冻, 暴雪, 冻害, 干旱, 旱情, 强降雨, 洪水, 严寒, 风沙, 气候, 天气, 潮湿, 水温, 降温, 寒冷, 气温, 降雨, 温度, 雨水, 雨季, 雨情, 降水, 阴雨, 多雨, 极寒, 冬季, 汛期, 高湿, 水情, 水位, 光照, 缺水, 高寒, 寒潮, 沉降, 地下水, 汛情, 地表, 蓄水 | Energy saving, energy, clean, ecology, environment, transformation, solar, upgrade, cycle, utilization, nuclear, wind, natural gas, efficiency, fuel, efficiency, renewable, emission reduction, environmental protection, green, low carbon, consumption reduction, fuel, water conservation, photovoltaic, high efficiency, retrofitting, fuel consumption, electricity consumption, energy consumption, wind, photovoltaic, efficacy, intensification, disasters, earthquakes, typhoons, tsunamis, droughts and floods, extremes, harsh, floods, high winds, dust, hurricanes, frost, floods, storms, mudslides flows, landslides, freezing, snow, droughts, floods, torrential rains, tornadoes, hail, floods, rain, snow, freezing, storms snow, freezes, droughts, droughts, heavy rains, floods, severe cold, wind and sand, climate, weather, humidity, water temperatures, precipitation warmth, cold, temperatures, rainfall, temperatures, rain, rainy season, rain, rain, precipitation, cloudy rains, rainy, extremely cold, winter, flood season, high humidity, water conditions, water level, light, water shortage, high cold, cold snap, subsidence, groundwater, flood conditions, surface, water storage |
Appendix B
| (1) | (2) | (3) | (4) | (5) | (6) | (7) | (8) | (9) | (10) | (11) | (12) | |
|---|---|---|---|---|---|---|---|---|---|---|---|---|
| VARIABLES | F1EMP_SALARY | F1EMP_EMPLOYEEMENT | F1EMP_GURANTEE | F2EMP_SALARY | F2EMP_EMPLOYEEMENT | F2EMP_GURANTEE | EMP_SALARY | EMP_EMPLOYEEMENT | EMP_GURANTEE | EMP_SALARY | EMP_EMPLOYEEMENT | EMP_GURANTEE |
| CLIMATE_RISK | −0.5546 | 0.3448 | 0.5931 ** | 1.0177 ** | −0.0380 | 1.5846 *** | ||||||
| (0.4148) | (0.3493) | (0.2420) | (0.4592) | (0.4213) | (0.2839) | |||||||
| L1CLIMATE_RISK | −0.4059 | −0.0031 | 0.5427 ** | |||||||||
| (0.3947) | (0.2887) | (0.2253) | ||||||||||
| L2CLIMATE_RISK | 0.8094 * | −0.1955 | 1.4325 *** | |||||||||
| (0.4352) | (0.3227) | (0.2597) | ||||||||||
| Controls | YES | YES | YES | YES | YES | YES | YES | YES | YES | YES | YES | YES |
| Constant | 49.8597 *** | 24.6614 *** | 26.1635 *** | 80.0491 *** | 41.1551 *** | 25.4498 *** | 41.6271 *** | −39.3034 *** | 23.6131 *** | 46.1789 *** | −42.5943 *** | 23.1317 *** |
| Observations | 20,171 | 20,171 | 20,171 | 16,134 | 16,134 | 16,134 | 22,391 | 22,391 | 22,391 | 17,884 | 17,884 | 17,884 |
| R-squared | 0.6544 | 0.8117 | 0.5632 | 0.6634 | 0.8118 | 0.5798 | 0.6591 | 0.8562 | 0.5660 | 0.6671 | 0.8635 | 0.5833 |
| FIRM FE | YES | YES | YES | YES | YES | YES | YES | YES | YES | YES | YES | YES |
| YEAR FE | YES | YES | YES | YES | YES | YES | YES | YES | YES | YES | YES | YES |
| (1) | (2) | (3) | (4) | (5) | (6) | (7) | (8) | |
|---|---|---|---|---|---|---|---|---|
| VARIABLES | F1SA | F2SA | SA | SA | F1ESG | F2ESG | ESG | ESG |
| CLIMATE_RISK | 0.0053 ** | 0.0103 *** | 1.8272 *** | 1.5768 ** | ||||
| (0.0026) | (0.0027) | (0.5366) | (0.6839) | |||||
| L1CLIMATE_RISK | 0.0064 ** | 1.7945 *** | ||||||
| (0.0026) | (0.5553) | |||||||
| L2CLIMATE_RISK | 0.0123 *** | 1.4823 ** | ||||||
| (0.0025) | (0.7015) | |||||||
| Controls | YES | YES | YES | YES | YES | YES | YES | YES |
| Constant | −4.3623 *** | −4.4706 *** | −4.0938 *** | −4.2415 *** | −30.9612 *** | −14.5145 | −48.9394 *** | −49.6705 *** |
| Observations | (0.1040) | (0.0805) | (0.1346) | (0.1590) | (11.3712) | (12.0446) | (11.3396) | (13.8412) |
| R-squared | 20,156 | 16,111 | 22,391 | 17,884 | 6326 | 5220 | 6343 | 5258 |
| FIRM FE | 0.9846 | 0.9868 | 0.9844 | 0.9863 | 0.8056 | 0.8142 | 0.8008 | 0.8119 |
| YEAR FE | YES | YES | YES | YES | YES | YES | YES | YES |
| (1) | (2) | (3) | (4) | (5) | |
|---|---|---|---|---|---|
| VARIABLES | EMP_SALARY | EMP_EMPLOYEEMENT | EMP_GURANTEE | SA | ESG |
| CLIMATE_RISK | −0.2658 | 0.2730 | 1.2040 *** | 0.0110 *** | 1.5825 *** |
| (0.4041) | (0.2699) | (0.2457) | (0.0031) | (0.5575) | |
| Controls | YES | YES | YES | YES | YES |
| Constant | 43.8628 *** | −45.6672 *** | 24.2821 *** | −4.6701 *** | −53.4380 *** |
| (6.9202) | (6.4205) | (4.2087) | (0.1407) | (10.8313) | |
| Observations | 25,391 | 25,391 | 25,391 | 25,391 | 7411 |
| R-squared | 0.6541 | 0.8593 | 0.5616 | 0.9838 | 0.8029 |
| FIRM FE | YES | YES | YES | YES | YES |
| YEAR FE | YES | YES | YES | YES | YES |
| (1) | (2) | (3) | (4) | (5) | |
|---|---|---|---|---|---|
| VARIABLES | EMP_SALARY | EMP_EMPLOYEEMENT | EMP_GURANTEE | SA | ESG |
| AVECLIMATE_RISK | −0.7987 * | 0.4640 | 1.0579 *** | 0.0141 *** | 1.9109 *** |
| (0.4263) | (0.2832) | (0.2265) | (0.0031) | (0.5561) | |
| Controls | YES | YES | YES | YES | YES |
| Constant | 38.6791 *** | −38.9557 *** | 27.1520 *** | −4.1305 *** | −46.1949 *** |
| (6.1154) | (5.5435) | (3.3601) | (0.1263) | (9.8388) | |
| Observations | 25,391 | 25,391 | 25,391 | 25,391 | 7411 |
| R-squared | 0.6463 | 0.8503 | 0.5496 | 0.9818 | 0.7960 |
| FIRM FE | YES | YES | YES | YES | YES |
| YEAR FE | YES | YES | YES | YES | YES |
| (1) | (2) | (3) | (4) | (5) | |
|---|---|---|---|---|---|
| VARIABLES | EMP_SALARY | EMP_EMPLOYEEMENT | EMP_GURANTEE | SA | ESG |
| CLIMATE_RISK | −0.1174 | 0.2312 | 0.6815 *** | 0.0108 *** | 1.4315 *** |
| (0.5016) | (0.3410) | (0.2185) | (0.0032) | (0.4132) | |
| Controls | YES | YES | YES | YES | YES |
| Constant | 28.9270 *** | −41.8688 *** | 39.8843 *** | −3.8904 *** | −38.0200 *** |
| (8.4803) | (6.7289) | (2.9601) | (0.1389) | (9.0177) | |
| Observations | 16,557 | 16,557 | 16,557 | 16,557 | 5938 |
| R-squared | 0.7009 | 0.8671 | 0.6070 | 0.9843 | 0.8509 |
| FIRM FE | YES | YES | YES | YES | YES |
| YEAR FE | YES | YES | YES | YES | YES |
References
- Meleo, L.; Nava, C.R.; Pozzi, C. Aviation and the costs of the European Emission Trading Scheme: The case of Italy. Energy Policy 2016, 88, 138–147. [Google Scholar] [CrossRef]
- Tomassi, A.; Falegnami, A.; Meleo, L.; Romano, E. The GreenSCENT Competence Frameworks. In The European Green Deal in Education; Routledge: Oxfordshire, UK, 2024; pp. 25–44. [Google Scholar]
- Tomassi, A.; Falegnami, A.; Romano, E. Disinformation in the Digital Age: Climate Change, Media Dynamics, and Strategies for Resilience. Publications 2025, 13, 24. [Google Scholar] [CrossRef]
- Dunford, M. The Chinese Path to Common Prosperity. Int. Crit. Thought 2022, 12, 35–54. [Google Scholar] [CrossRef]
- Wan, H.; Knight, J. China’s growing but slowing inequality of household wealth, 2013–2018: A challenge to ‘common prosperity’? China Econ. Rev. 2023, 79, 101947. [Google Scholar] [CrossRef]
- Ge, W.; Qi, Z.; Wu, Z.; Yu, L. Abnormal Temperatures, Climate Risk Disclosures and Bank Loan Pricing: International Evidence. Br. J. Manag. 2025, 36, 726–744. [Google Scholar] [CrossRef]
- Wang, H.; Niu, X.; Xing, H. Regional Climate Risk and Corporate Social Responsibility: Evidence from China. Emerg. Mark. Financ. Trade 2025, 61, 21–43. [Google Scholar] [CrossRef]
- Naseer, M.M.; Guo, Y.; Zhu, X. When climate risk hits corporate value: The moderating role of financial constraints, flexibility, and innovation. Financ. Res. Lett. 2025, 74, 106780. [Google Scholar] [CrossRef]
- Jiang, C.; Li, Y.; Zhang, X.; Zhao, Y. Climate risk and corporate debt decision. J. Int. Money Financ. 2025, 151, 103261. [Google Scholar] [CrossRef]
- Almaghrabi, K.S. Climate Change Exposure and the Readability of Narrative Disclosures in Annual Reports. Sustainability 2025, 17, 5175. [Google Scholar] [CrossRef]
- Venturini, A. Climate change, risk factors and stock returns: A review of the literature. Int. Rev. Financ. Anal. 2022, 79, 101934. [Google Scholar] [CrossRef]
- Su, Z.; Deng, C.; Feng, Y.; Bai, Y.; Xu, Z. Climate risks and corporate supply chain configuration: Evidence from China. Res. Int. Bus. Financ. 2025, 76, 102852. [Google Scholar] [CrossRef]
- Sautner, Z.; VAN Lent, L.; Vilkov, G.; Zhang, R. Firm-Level Climate Change Exposure. J. Financ. 2023, 78, 1449–1498. [Google Scholar] [CrossRef]
- Lyu, J.; Li, L.; Liu, Y.; Deng, Q. Promoting common prosperity: How do digital capability and financial literacy matter? Int. Rev. Financ. Anal. 2025, 97, 103779. [Google Scholar] [CrossRef]
- Li, X.; Zheng, H.; Jiang, Y. An efficient allocation or financial distortion: Can employee stock ownership promote common prosperity within enterprises? Int. Rev. Econ. Financ. 2025, 98, 103905. [Google Scholar] [CrossRef]
- Fan, C.; Bae, S.; Liu, Y. Taxation and corporate investment efficiency in common prosperity. Q. Rev. Econ. Financ. 2025, 102, 102013. [Google Scholar] [CrossRef]
- Annelin, A.; Che, L. Audit Team Distance and Audit Quality Threatening Behavior. Audit. A J. Pract. Theory 2024, 43, 27–49. [Google Scholar] [CrossRef]
- Breuer, M.; Dehaan, E. Using and Interpreting Fixed Effects Models. J. Account. Res. 2024, 62, 1183–1226. [Google Scholar] [CrossRef]
- Borenstein, M.; Hedges, L.V.; Higgins, J.P.; Rothstein, H.R. A basic introduction to fixed-effect and random-effects models for meta-analysis. Res. Synth. Methods 2010, 1, 97–111. [Google Scholar] [CrossRef]
- Allison, P.D. Fixed Effects Regression Models; SAGE Publications: Thousand Oaks, CA, USA, 2009. [Google Scholar]
- Li, Q.; Shan, H.; Tang, Y.; Yao, V.; Goldstein, I. Corporate Climate Risk: Measurements and Responses. Rev. Financ. Stud. 2024, 37, 1778–1830. [Google Scholar] [CrossRef]
- Aristova, E.; Nichols, L. Climate change on the board: Navigating directors’ duties. J. Corp. Law Stud. 2024, 24, 479–514. [Google Scholar] [CrossRef]
- Ginglinger, E.; Moreau, Q. Climate risk and capital structure. Manag. Sci. 2023, 69, 7492–7516. [Google Scholar] [CrossRef]
- Huynh, T.D.; Nguyen, T.H.; Truong, C. Climate risk: The price of drought. J. Corp. Financ. 2020, 65, 101750. [Google Scholar] [CrossRef]
- Hong, H.; Li, F.W.; Xu, J. Climate risks and market efficiency. J. Econ. 2019, 208, 265–281. [Google Scholar] [CrossRef]
- Yang, X.; Wei, L.; Deng, R.; Cao, J.; Huang, C. Can climate-related risks increase audit fees?–Evidence from China. Financ. Res. Lett. 2023, 57, 104194. [Google Scholar] [CrossRef]
- Ren, X.; Li, Y.; Shahbaz, M.; Dong, K.; Lu, Z. Climate risk and corporate environmental performance: Empirical evidence from China. Sustain. Prod. Consum. 2022, 30, 467–477. [Google Scholar] [CrossRef]
- Ding, R.; Liu, M.; Wang, T.; Wu, Z. The impact of climate risk on earnings management: International evidence. J. Account. Public Policy 2021, 40, 106818. [Google Scholar] [CrossRef]
- Huang, H.H.; Kerstein, J.; Wang, C. The impact of climate risk on firm performance and financing choices: An international comparison. In Crises and Disruptions in International Business: How Multinational Enterprises Respond to Crises; Springer: Berlin/Heidelberg, Germany, 2022; pp. 305–349. [Google Scholar]
- Liu, Y.; Han, J. Climate Risk Disclosure and Financial Analysts’ Forecasts: Evidence from China. Sustainability 2025, 17, 3178. [Google Scholar] [CrossRef]
- Lin, B.; Wu, N. Climate risk disclosure and stock price crash risk: The case of China. Int. Rev. Econ. Financ. 2023, 83, 21–34. [Google Scholar] [CrossRef]
- Liu, Y.; Dong, K.; Nepal, R.; Afi, H. How do climate risks affect corporate ESG performance? Micro evidence from China. Res. Int. Bus. Financ. 2025, 76, 102855. [Google Scholar] [CrossRef]
- Tian, Y.; Chen, S.; Dai, L. How climate risk drives corporate green innovation: Evidence from China. Financ. Res. Lett. 2024, 59, 104762. [Google Scholar] [CrossRef]
- Ma, N.; Ma, X. Does the ESG rating promote common prosperity within enterprises? Financ. Res. Lett. 2024, 69, 106066. [Google Scholar] [CrossRef]
- Yang, M.; Peng, H.; Yue, S. How returning home for entrepreneurship affects rural common prosperity. Int. Rev. Econ. Financ. 2025, 98, 103871. [Google Scholar] [CrossRef]
- Yang, L.; Tan, X.; Tan, G.; Paraman, P. Economic policy uncertainty and common prosperity within the enterprise: Evidence from the Chinese market. PLoS ONE 2024, 19, e0309370. [Google Scholar] [CrossRef]
- Deng, Y.; Li, C.; Wang, S.; Tang, R. The impact of economic openness on common prosperity: Insights from provincial panel data. Int. Rev. Econ. Financ. 2025, 98, 103908. [Google Scholar] [CrossRef]
- Li, Q.; Zhan, K.; Jiang, H.; Li, T.; Zhang, Y. Impact of financial regulation on labor income share: Evidence from China. Pac.-Basin Financ. J. 2024, 88, 102538. [Google Scholar] [CrossRef]
- Chen, J.; Ping, Y.; Jia, J.; Li, G.; Hashmi, S.H. A study of the effect of population aggregation on common prosperity: Evidence from 283 Chinese cities. PLoS ONE 2023, 18, e0292265. [Google Scholar] [CrossRef]
- Li, M.; Wen, W.; Ma, W.; Jin, Y. Research on the Common Prosperity Effect of Integrated Regional Expansion: An Empirical Study Based on the Yangtze River Delta. Land 2025, 14, 426. [Google Scholar] [CrossRef]
- Guo, D.; Li, L.; Pang, G. How does digital inclusive finance affect county’s common prosperity: Theoretical and empirical evidence from China. Econ. Anal. Policy 2024, 82, 340–358. [Google Scholar] [CrossRef]
- Zhao, T.; Jiao, F. Does digital financial inclusion promote common prosperity? The role of regional innovation. Electron. Commer. Res. 2024, 1–26. [Google Scholar] [CrossRef]
- Zhang, C.; Zhu, Y.; Zhang, L. Effect of digital inclusive finance on common prosperity and the underlying mechanisms. Int. Rev. Financ. Anal. 2024, 91, 102940. [Google Scholar] [CrossRef]
- Zhang, J.; Dong, X.; Li, J. Can Digital Inclusive Finance Promote Common Prosperity? An Empirical Study Based on Micro Household Data. J. Financ. Econ. 2022, 48, 4–17. [Google Scholar] [CrossRef]
- Zou, J.; Yao, L.; Wang, B.; Zhang, Y.; Deng, X. How does digital inclusive finance promote the journey of common prosperity in China? Cities 2024, 150, 105083. [Google Scholar] [CrossRef]
- Chen, K.; Chen, X.; Wang, Z.-A.; Zvarych, R. Does artificial intelligence promote common prosperity within enterprises?—Evidence from Chinese-listed companies in the service industry. Technol. Forecast. Soc. Change 2024, 200, 123180. [Google Scholar] [CrossRef]
- Kopyrina, O.; Wu, K.; Ying, Z. Investment Incentives and Corporate Sustainability: Evidence from China. 2023. Available online: https://papers.ssrn.com/sol3/papers.cfm?abstract_id=4324684 (accessed on 2 April 2025).
- Dong, K.; Wei, S.; Liu, Y.; Zhao, J. How does energy poverty eradication promote common prosperity in China? The role of labor productivity. Energy Policy 2023, 181, 113698. [Google Scholar] [CrossRef]
- Liu, Y.; Dong, X.; Dong, K. Pathway to prosperity? The impact of low-carbon energy transition on China’s common prosperity. Energy Econ. 2023, 124, 106819. [Google Scholar] [CrossRef]
- Zhou, M.; Guo, F. Mechanism and spatial spillover effect of digital economy on common prosperity in the Yellow River Basin of China. Sci. Rep. 2024, 14, 23086. [Google Scholar] [CrossRef]
- Wang, H.; Zhang, T.; Wang, X.; Zheng, J. Does the digital economy enhance common prosperity? Examining the mediating influence of resilience in environmental investment. Heliyon 2024, 10, e34408. [Google Scholar] [CrossRef]
- Ansoff, H.I. The Concept of Strategy; Taylor & Francis: Abingdon, UK, 1965. [Google Scholar]
- Freeman, R.E. Strategic Management: A Stakeholder Approach; Pitman; Cambridge University Press: Cambridge, UK, 2010. [Google Scholar]
- Li, M.; Yao, S. Can Climate Risk Disclosure Attract Analyst Coverage? A Study Based on the Dual Perspective of Information Supply and Demand. Sustainability 2025, 17, 3960. [Google Scholar] [CrossRef]
- Fan, L.; Xu, W. The Impact of Green Finance Policies on Corporate Debt Default Risk—Evidence from China. Sustainability 2025, 17, 1648. [Google Scholar] [CrossRef]
- Mu, P.; Zhang, S. Role of homestead system reform in rural common prosperity. Financ. Res. Lett. 2024, 69, 106011. [Google Scholar] [CrossRef]
- Deng, B.; Wang, T.; Tao, C.; Ji, L. Targeted poverty alleviation and corporate investment in poor counties: An empirical analysis from the geographical distribution of new subsidiaries of listed firms. China J. Account. Stud. 2023, 12, 47–70. [Google Scholar] [CrossRef]
- Chen, S.; Yang, G.; Martínez, M.d.C.V. How do industry and province attributes impact corporate contribution to poverty alleviation: A multilevel analysis. PLoS ONE 2023, 18, e0293505. [Google Scholar] [CrossRef]
- Tian, R.; Li, X. Dynamic impact of climate risks on financial systemic risk: Evidence from China. Int. Rev. Financ. 2025, 25, e12470. [Google Scholar] [CrossRef]
- Lennox, C.S.; Wu, X. Mandatory Internal Control Audits, Audit Adjustments, and Financial Reporting Quality: Evidence from China. Account. Rev. 2022, 97, 341–364. [Google Scholar] [CrossRef]
- Shen, Q.; Faraway, J. An F Test for Linear Models with Functional Responses. Stat. Sin. 2004, 14, 1239–1257. [Google Scholar]
- Sureiman, O.; Mangera, C.M. F-test of overall significance in regression analysis simplified. J. Pract. Cardiovasc. Sci. 2020, 6, 116–122. [Google Scholar] [CrossRef]
- Hausman, J.A. Specification Tests in Econometrics. Econometrica 1978, 46, 1251–1271. [Google Scholar] [CrossRef]
- Dziak, J.J.; Coffman, D.L.; Lanza, S.T.; Li, R.; Jermiin, L.S. Sensitivity and specificity of information criteria. Brief. Bioinform. 2019, 21, 553–565. [Google Scholar] [CrossRef]
- Bozdogan, H. Model selection and Akaike’s Information Criterion (AIC): The general theory and its analytical extensions. Psychometrika 1987, 52, 345–370. [Google Scholar] [CrossRef]
- Sakamoto, Y.; Ishiguro, M.; Kitagawa, G. Akaike Information Criterion Statistics; Reidel, D., Ed.; Springer: Dordrecht, The Netherlands, 1986; Volume 81, Issue 10.5555, p. 26853. [Google Scholar]
- Vrieze, S.I. Model selection and psychological theory: A discussion of the differences between the Akaike information criterion (AIC) and the Bayesian information criterion (BIC). Psychol. Methods 2012, 17, 228–243. [Google Scholar] [CrossRef]
- Neath, A.A.; Cavanaugh, J.E. The Bayesian information criterion: Background, derivation, and applications. WIREs Comput. Stat. 2012, 4, 199–203. [Google Scholar] [CrossRef]
- Du, J.; Xu, X.; Yang, Y. Does Corporate Climate Risk Affect the Cost of Equity?-Evidence from Textual Analysis with Machine Learning. Chin. Rev. Financ. Stud. 2023, 15, 19–46+125. [Google Scholar]
- Li, Y.; Wang, D.; Meng, D.; Hu, Y. Peer effect on climate risk information disclosure. China J. Account. Res. 2024, 17, 100375. [Google Scholar] [CrossRef]
- Hadlock, C.J.; Pierce, J.R. New Evidence on Measuring Financial Constraints: Moving Beyond the KZ Index. Rev. Financ. Stud. 2010, 23, 1909–1940. [Google Scholar] [CrossRef]
- Fazzari, S.; Hubbard, R.G.; Petersen, B.C. Financing Constraints and Corporate Investment; National Bureau of Economic Research: Cambridge, MA, USA, 1987. [Google Scholar]
- Beck, T.; Demirgüç-Kunt, A.; Maksimovic, V. Financial and legal constraints to growth: Does firm size matter? J. Financ. 2005, 60, 137–177. [Google Scholar] [CrossRef]
- Petersen, M.A.; Rajan, R.G. The Effect of Credit Market Competition on Lending Relationships. Q. J. Econ. 1995, 110, 407–443. [Google Scholar] [CrossRef]
- Zhang, X.; Zhao, X.; He, Y. Does It Pay to Be Responsible? The Performance of ESG Investing in China. Emerg. Mark. Financ. Trade 2022, 58, 3048–3075. [Google Scholar] [CrossRef]
- Halbritter, G.; Dorfleitner, G. The wages of social responsibility—Where are they? A critical review of ESG investing. Rev. Financ. Econ. 2015, 26, 25–35. [Google Scholar] [CrossRef]


| Type | Name | Explanation |
|---|---|---|
| Dependent variable | EMP_SALARY | Employee compensation score. |
| EMP_EMPLOYEEMENT | Employee employment score. | |
| EMP_GURANTEE | Employee guarantee score. | |
| SA | Financing Constraint Index = 0.737 × Size + 0.043 × Size2 − 0.040 × Age. Among them, Size is the natural logarithm of the total assets of the enterprise; Age is the number of years the enterprise has been in operation. | |
| ESG | ESG ratings from Bloomberg. | |
| Independent variable | CLIMATE_RISK | Climate risk keyword frequency divided by the number of words in the text of the annual report. |
| Control variables | ROA | The net profit of the firm divided by the total assets of the firm. |
| SIZE | The logarithm of the firm’s total assets. | |
| LEV | The equity of the firm divided by the total liabilities of the firm. | |
| GROWTH | Operating income for the year divided by operating income for the previous year less 1. | |
| DTURN | Average monthly turnover rate of current year’s stocks—average monthly turnover rate of last year’s stocks. | |
| REC | Accounts receivable as a percentage of total assets. | |
| INV | Inventory to total assets. | |
| BM | Market-to-book ratio. | |
| HHI | Total assets of individual firms as a share of total assets of firms in the industry. | |
| SOE | Dummy variables. If the firm is a state-owned enterprise, the value is taken as 1. Otherwise, it is taken as 0. | |
| DUAL | Dummy variables. Chairman and CEO are the same person, the value takes 1. Otherwise, it takes 0. | |
| MAGTMALER | Percentage of males in management. | |
| OPACITY | Subject to disclosure by the Shenzhen Stock Exchange (SZSE) and Shanghai Stock Exchange (SHSE). 1 = Excellent, 2 = Good, 3 = Pass, 4 = Fail. | |
| AUD_FEE | Audit costs in logarithmic terms. | |
| YEAR_FE | Year fixed effects. | |
| FIRM_FE | Firm fixed effects. |
| Panel A | ||||||
|---|---|---|---|---|---|---|
| Variable Name | Observation Number | Mean | P25 | Median | P75 | SD |
| EMP_SALARY | 25822 | 53.85 | 46.81 | 53.37 | 60.54 | 9.75 |
| EMP_EMPLOYEEMENT | 25822 | 55.86 | 47.72 | 55.45 | 63.25 | 11.35 |
| EMP_GURANTEE | 25822 | 52.04 | 50.50 | 50.50 | 51.23 | 4.43 |
| SA | 25822 | −3.91 | −4.08 | −3.91 | −3.75 | 0.27 |
| ESG | 7450 | 35.09 | 28.48 | 32.31 | 39.18 | 9.08 |
| CLIMATE_RISK | 25822 | 0.37 | 0.15 | 0.25 | 0.42 | 0.38 |
| ROA | 25822 | 0.04 | 0.01 | 0.04 | 0.07 | 0.07 |
| LEV | 25822 | 0.42 | 0.26 | 0.41 | 0.56 | 0.20 |
| SIZE | 25822 | 22.36 | 21.42 | 22.15 | 23.09 | 1.33 |
| GROWTH | 25822 | 0.15 | −0.04 | 0.09 | 0.25 | 0.38 |
| DTURN | 25822 | −0.18 | −0.32 | −0.07 | 0.07 | 0.55 |
| REC | 25822 | 0.13 | 0.04 | 0.11 | 0.18 | 0.10 |
| INV | 25822 | 0.13 | 0.05 | 0.11 | 0.17 | 0.11 |
| BM | 25822 | 0.63 | 0.44 | 0.63 | 0.82 | 0.26 |
| HHI | 25822 | 0.07 | 0.02 | 0.05 | 0.09 | 0.07 |
| SOE | 25822 | 0.31 | 0.00 | 0.00 | 1.00 | 0.46 |
| DUAL | 25822 | 0.30 | 0.00 | 0.00 | 1.00 | 0.46 |
| MAGTMALER | 25822 | 78.97 | 71.43 | 80.00 | 87.50 | 11.65 |
| OPACITY | 25822 | 1.57 | 1.00 | 2.00 | 2.00 | 0.97 |
| INDDIRR | 25822 | 37.90 | 33.33 | 36.36 | 42.86 | 5.38 |
| AUD_FEE | 25822 | 13.98 | 13.53 | 13.86 | 14.31 | 0.65 |
| Panel B | ||||||
| Year | Frequency | Percentage | Cumulative Percentage | |||
| 2016 | 2218 | 8.59 | 8.59 | |||
| 2017 | 2400 | 9.29 | 17.88 | |||
| 2018 | 2877 | 11.14 | 29.03 | |||
| 2019 | 2927 | 11.34 | 40.36 | |||
| 2020 | 3125 | 12.1 | 52.46 | |||
| 2021 | 3451 | 13.36 | 65.83 | |||
| 2022 | 4193 | 16.24 | 82.07 | |||
| 2023 | 4631 | 17.93 | 100 | |||
| Total | 25,822 | 100 | ||||
| Panel C | ||||||
| Industry | Frequency | Percentage | Cumulative Percentage | |||
| A:Agriculture/forestry/livestock | 276 | 1.07 | 1.07 | |||
| B: Mining | 516 | 2 | 3.07 | |||
| C1: Manufacturing | 1567 | 6.07 | 9.14 | |||
| C2: Manufacturing | 4967 | 19.24 | 28.37 | |||
| C3: Manufacturing | 10,330 | 40 | 68.38 | |||
| C4: Manufacturing | 567 | 2.2 | 70.57 | |||
| D: Electricity/gas/water (Utilities) | 805 | 3.12 | 73.69 | |||
| E: Construction | 588 | 2.28 | 75.97 | |||
| F: Wholesale/retail trade | 1135 | 4.4 | 80.36 | |||
| G: Transportation/storage | 692 | 2.68 | 83.04 | |||
| H: Hotels and catering | 57 | 0.22 | 83.26 | |||
| I: Telecommunications, radio, television and satellite transmission services | 1914 | 7.41 | 90.67 | |||
| K: Real estate | 745 | 2.89 | 93.56 | |||
| L: Leasing | 306 | 1.19 | 94.74 | |||
| M: Research and experimental development | 360 | 1.39 | 96.14 | |||
| N: Social service | 410 | 1.59 | 97.73 | |||
| O: Residential services, repairs and other services | 5 | 0.02 | 97.75 | |||
| P: Education | 31 | 0.12 | 97.87 | |||
| Q: Healthcare | 70 | 0.27 | 98.14 | |||
| R: Communication/cultural | 368 | 1.43 | 99.56 | |||
| S: Integrated business | 113 | 0.44 | 100 | |||
| Total | 25,822 | 100 |
| (1) | (2) | (3) | (4) | (5) | (6) | |
|---|---|---|---|---|---|---|
| VARIABLES | EMP_SALARY | EMP_EMPLOYEEMENT | EMP_GURANTEE | EMP_SALARY | EMP_EMPLOYEEMENT | EMP_GURANTEE |
| CLIMATE_RISK | −0.3414 | 1.5610 *** | 1.6035 *** | −0.3896 | 0.4241 | 1.3191 *** |
| (0.3947) | (0.3603) | (0.2352) | (0.3915) | (0.2630) | (0.2260) | |
| ROA | −0.4903 | 2.4318 *** | 0.8507 * | |||
| (1.1718) | (0.8857) | (0.4665) | ||||
| LEV | 2.6086 *** | −0.1514 | −2.3098 *** | |||
| (0.7874) | (0.6063) | (0.3728) | ||||
| SIZE | −0.3782 | 5.5342 *** | 1.3931 *** | |||
| (0.2483) | (0.2276) | (0.1266) | ||||
| GROWTH | 1.7422 *** | 2.0710 *** | −0.2532 *** | |||
| (0.1591) | (0.1317) | (0.0655) | ||||
| DTURN | 0.0479 | −0.3588 *** | −0.2616 *** | |||
| (0.0862) | (0.0664) | (0.0413) | ||||
| REC | 5.8493 *** | 1.4709 | −0.0178 | |||
| (1.5638) | (1.1567) | (0.7002) | ||||
| INV | 3.0404 ** | 3.9630 *** | 0.9200 | |||
| (1.3267) | (1.1436) | (0.6221) | ||||
| BM | 0.4351 | −2.6647 *** | 0.6024 ** | |||
| (0.4689) | (0.3653) | (0.2434) | ||||
| HHI | 0.6799 | 2.8827 | −1.8167 | |||
| (2.9536) | (1.8574) | (1.2178) | ||||
| SOE | 1.4118 *** | 1.2516 *** | −0.0214 | |||
| (0.4307) | (0.3608) | (0.2114) | ||||
| DUAL | 0.0425 | 0.3707 ** | 0.1440 | |||
| (0.1938) | (0.1490) | (0.0931) | ||||
| MAGTMALER | −0.0005 | −0.5157 *** | 0.0088 | |||
| (0.0104) | (0.0084) | (0.0055) | ||||
| OPACITY | −0.0166 | −0.1230 ** | 0.1539 *** | |||
| (0.0657) | (0.0504) | (0.0352) | ||||
| INDDIRR | −0.0191 | 0.0408 *** | 0.0041 | |||
| (0.0165) | (0.0131) | (0.0101) | ||||
| AUD_FEE | 1.4938 *** | 0.7374 *** | −0.5301 *** | |||
| (0.3453) | (0.2641) | (0.1772) | ||||
| Constant | 54.0179 *** | 55.3420 *** | 51.4343 *** | 39.1554 *** | −39.0606 *** | 27.2193 *** |
| (0.1445) | (0.1319) | (0.0861) | (6.1100) | (5.5408) | (3.3173) | |
| Observations | 25,391 | 25,391 | 25,391 | 25,391 | 25,391 | 25,391 |
| R-squared | 0.6400 | 0.7722 | 0.5404 | 0.6463 | 0.8503 | 0.5501 |
| FIRM FE | YES | YES | YES | YES | YES | YES |
| YEAR FE | YES | YES | YES | YES | YES | YES |
| (1) | (2) | (3) | (4) | |
|---|---|---|---|---|
| VARIABLES | SA | ESG | SA | ESG |
| CLIMATE_RISK | 0.0144 *** | 2.4793 *** | 0.0141 *** | 1.9109 *** |
| (0.0031) | (0.5837) | (0.0031) | (0.5561) | |
| ROA | −0.0192 ** | −3.0468 * | ||
| (0.0095) | (1.6961) | |||
| LEV | −0.0214 ** | −6.7747 *** | ||
| (0.0105) | (1.2610) | |||
| SIZE | 0.0055 | 3.3263 *** | ||
| (0.0045) | (0.3737) | |||
| GROWTH | −0.0048 *** | −0.5610 *** | ||
| (0.0012) | (0.1936) | |||
| DTURN | −0.0091 *** | −0.4278 ** | ||
| (0.0006) | (0.2156) | |||
| REC | 0.0117 | −0.8295 | ||
| (0.0216) | (2.5545) | |||
| INV | −0.0176 | 3.7941 ** | ||
| (0.0150) | (1.9180) | |||
| BM | −0.0169 *** | −1.9696 *** | ||
| (0.0042) | (0.7015) | |||
| HHI | 0.0815 ** | −4.1635 | ||
| (0.0320) | (3.0658) | |||
| SOE | −0.0116 *** | −0.4933 | ||
| (0.0033) | (0.6103) | |||
| DUAL | 0.0004 | 0.1903 | ||
| (0.0016) | (0.2944) | |||
| MAGTMALER | 0.0000 | −0.0128 | ||
| (0.0001) | (0.0166) | |||
| OPACITY | 0.0016 *** | −0.4245 *** | ||
| (0.0005) | (0.1121) | |||
| INDDIRR | 0.0001 | 0.0276 | ||
| (0.0002) | (0.0219) | |||
| AUD_FEE | 0.0072 * | 0.5462 | ||
| (0.0042) | (0.4891) | |||
| Constant | −3.9136 *** | 34.0475 *** | −4.1305 *** | −46.1949 *** |
| (0.0011) | (0.2387) | (0.1263) | (9.8388) | |
| Observations | 25,391 | 7411 | 25,391 | 7411 |
| R-squared | 0.9813 | 0.7835 | 0.9818 | 0.7960 |
| FIRM FE | YES | YES | YES | YES |
| YEAR FE | YES | YES | YES | YES |
| (1) | (2) | (3) | (4) | (5) | (6) | |
|---|---|---|---|---|---|---|
| VARIABLES | EMP_SALARY | EMP_EMPLOYEEMENT | EMP_GURANTEE | EMP_SALARY | EMP_EMPLOYEEMENT | EMP_GURANTEE |
| BIG4_CLIMATE | −0.2406 | −0.3789 | 1.3000 ** | |||
| (0.7665) | (0.4726) | (0.6557) | ||||
| AUDFEE_CLIMATE | −0.7089 ** | 0.4683 ** | 1.6460 *** | |||
| (0.3086) | (0.1914) | (0.3287) | ||||
| CLIMATE_RISK | −0.3673 | 0.4591 * | 1.1989 *** | 9.7316 ** | −6.2626 ** | −22.1817 *** |
| (0.4048) | (0.2738) | (0.2244) | (4.4211) | (2.7618) | (4.6470) | |
| BIG4 | 0.5737 | 0.1959 | 0.7542 | |||
| (0.7947) | (0.5767) | (0.4718) | ||||
| AUD_FEE | 1.4483 *** | 0.7302 *** | −0.6356 *** | 1.7907 *** | 0.5412 * | −1.2194 *** |
| (0.3512) | (0.2678) | (0.1785) | (0.3679) | (0.2863) | (0.1990) | |
| ROA | −0.4983 | 2.4315 *** | 0.8274 * | −0.4145 | 2.3817 *** | 0.6746 |
| (1.1723) | (0.8856) | (0.4650) | (1.1709) | (0.8856) | (0.4647) | |
| LEV | 2.6196 *** | −0.1581 | −2.2383 *** | 2.5570 *** | −0.1173 | −2.1900 *** |
| (0.7876) | (0.6066) | (0.3710) | (0.7875) | (0.6068) | (0.3686) | |
| SIZE | −0.3813 | 5.5350 *** | 1.3791 *** | −0.3909 | 5.5426 *** | 1.4225 *** |
| (0.2483) | (0.2277) | (0.1260) | (0.2480) | (0.2278) | (0.1260) | |
| GROWTH | 1.7453 *** | 2.0710 *** | −0.2432 *** | 1.7363 *** | 2.0750 *** | −0.2393 *** |
| (0.1593) | (0.1316) | (0.0655) | (0.1592) | (0.1316) | (0.0650) | |
| DTURN | 0.0487 | −0.3591 *** | −0.2576 *** | 0.0386 | −0.3526 *** | −0.2399 *** |
| (0.0862) | (0.0664) | (0.0413) | (0.0860) | (0.0664) | (0.0410) | |
| REC | 5.8437 *** | 1.4747 | −0.0563 | 5.7828 *** | 1.5148 | 0.1365 |
| (1.5632) | (1.1562) | (0.6937) | (1.5626) | (1.1568) | (0.6898) | |
| INV | 3.0324 ** | 3.9666 *** | 0.8748 | 3.0278 ** | 3.9714 *** | 0.9494 |
| (1.3280) | (1.1431) | (0.6194) | (1.3252) | (1.1435) | (0.6208) | |
| BM | 0.4403 | −2.6624 *** | 0.6066 ** | 0.4624 | −2.6828 *** | 0.5389 ** |
| (0.4690) | (0.3651) | (0.2427) | (0.4691) | (0.3649) | (0.2411) | |
| HHI | 0.6827 | 2.8753 | −1.7679 | 0.6751 | 2.8859 | −1.8053 |
| (2.9533) | (1.8571) | (1.2159) | (2.9469) | (1.8548) | (1.1970) | |
| SOE | 1.4143 *** | 1.2500 *** | −0.0048 | 1.4078 *** | 1.2543 *** | −0.0119 |
| (0.4305) | (0.3611) | (0.2100) | (0.4324) | (0.3606) | (0.2075) | |
| DUAL | 0.0416 | 0.3704 ** | 0.1425 | 0.0438 | 0.3698 ** | 0.1410 |
| (0.1939) | (0.1490) | (0.0928) | (0.1938) | (0.1490) | (0.0925) | |
| MAGTMALER | −0.0005 | −0.5157 *** | 0.0090 | −0.0005 | −0.5156 *** | 0.0089 |
| (0.0104) | (0.0084) | (0.0055) | (0.0104) | (0.0084) | (0.0055) | |
| OPACITY | −0.0162 | −0.1225 ** | 0.1527 *** | −0.0102 | −0.1272 ** | 0.1390 *** |
| (0.0657) | (0.0504) | (0.0351) | (0.0656) | (0.0504) | (0.0348) | |
| INDDIRR | −0.0190 | 0.0409 *** | 0.0042 | −0.0192 | 0.0409 *** | 0.0044 |
| (0.0165) | (0.0131) | (0.0101) | (0.0165) | (0.0131) | (0.0101) | |
| Constant | 39.8073 *** | −38.9927 *** | 28.9192 *** | 35.2512 *** | −36.4813 *** | 36.2845 *** |
| (6.1659) | (5.5958) | (3.3330) | (6.3052) | (5.6694) | (3.5147) | |
| Observations | 25,391 | 25,391 | 25,391 | 25,391 | 25,391 | 25,391 |
| R-squared | 0.6463 | 0.8503 | 0.5510 | 0.6464 | 0.8504 | 0.5533 |
| FIRM FE | YES | YES | YES | YES | YES | YES |
| YEAR FE | YES | YES | YES | YES | YES | YES |
| (1) | (2) | (3) | |
|---|---|---|---|
| VARIABLES | EMP_SALARY | EMP_EMPLOYEEMENT | EMP_GURANTEE |
| IC_CLIMATE | −1.5378 | −0.4831 | 1.8831 ** |
| (1.2038) | (0.9731) | (0.7680) | |
| CLIMATE_RISK | 0.5211 | 0.7056 | 0.1598 |
| (0.8680) | (0.7162) | (0.5027) | |
| IC_SCORE | 1.1814 * | 0.7616 | −0.1032 |
| (0.6321) | (0.5061) | (0.3108) | |
| ROA | −0.6422 | 2.2545 ** | 0.7600 |
| (1.1861) | (0.8855) | (0.4650) | |
| LEV | 2.6052 *** | −0.0330 | −2.2278 *** |
| (0.7933) | (0.6093) | (0.3749) | |
| SIZE | −0.4098 | 5.5129 *** | 1.3709 *** |
| (0.2506) | (0.2270) | (0.1281) | |
| GROWTH | 1.7151 *** | 2.0350 *** | −0.2587 *** |
| (0.1613) | (0.1327) | (0.0662) | |
| DTURN | 0.0381 | −0.3570 *** | −0.2592 *** |
| (0.0866) | (0.0666) | (0.0416) | |
| REC | 6.0524 *** | 1.4411 | −0.0522 |
| (1.5654) | (1.1587) | (0.7050) | |
| INV | 2.9931 ** | 3.8858 *** | 0.8601 |
| (1.3291) | (1.1541) | (0.6251) | |
| BM | 0.4731 | −2.5863 *** | 0.6439 *** |
| (0.4728) | (0.3652) | (0.2454) | |
| HHI | 0.5413 | 2.7924 | −1.9372 |
| (2.9525) | (1.8641) | (1.2249) | |
| SOE | 1.4145 *** | 1.2518 *** | 0.0053 |
| (0.4290) | (0.3615) | (0.2111) | |
| DUAL | 0.0475 | 0.3353 ** | 0.1402 |
| (0.1953) | (0.1497) | (0.0940) | |
| MAGTMALER | −0.0001 | −0.5159 *** | 0.0090 |
| (0.0104) | (0.0084) | (0.0055) | |
| OPACITY | 0.0033 | −0.1196 ** | 0.1630 *** |
| (0.0660) | (0.0506) | (0.0357) | |
| INDDIRR | −0.0206 | 0.0409 *** | 0.0053 |
| (0.0165) | (0.0132) | (0.0101) | |
| AUD_FEE | 1.5700 *** | 0.7504 *** | −0.5275 *** |
| (0.3481) | (0.2652) | (0.1793) | |
| Constant | 38.0712 *** | −39.2792 *** | 27.6119 *** |
| (6.1387) | (5.5570) | (3.3329) | |
| Observations | 25,117 | 25,117 | 25,117 |
| R-squared | 0.6460 | 0.8504 | 0.5501 |
| FIRM FE | YES | YES | YES |
| YEAR FE | YES | YES | YES |
| (1) | (2) | (3) | (4) | (5) | (6) | |
|---|---|---|---|---|---|---|
| VARIABLES | EMP_SALARY | EMP_EMPLOYEEMENT | EMP_GURANTEE | EMP_SALARY | EMP_EMPLOYEEMENT | EMP_GURANTEE |
| CLIMATE_RISK_SIZE | 0.0430 | 0.3110 ** | 1.4297 *** | |||
| (0.2029) | (0.1396) | (0.1417) | ||||
| CLIMATE_RISK_ROA | 4.6695 | 1.6582 | 5.2040 *** | |||
| (3.7414) | (2.3380) | (1.8063) | ||||
| CLIMATE_RISK | −1.3855 | −6.7716 ** | −31.7612 *** | −0.5184 | 0.3783 | 1.1755 *** |
| (4.7227) | (3.2393) | (3.2009) | (0.4096) | (0.2745) | (0.2260) | |
| ROA | −0.4966 | 2.3867 *** | 0.6430 | −1.7808 | 1.9735 * | −0.5875 |
| (1.1710) | (0.8852) | (0.4616) | (1.5143) | (1.1034) | (0.6210) | |
| LEV | 2.6129 *** | −0.1203 | −2.1669 *** | 2.7030 *** | −0.1179 | −2.2046 *** |
| (0.7883) | (0.6064) | (0.3679) | (0.7929) | (0.6112) | (0.3709) | |
| SIZE | −0.3934 | 5.4247 *** | 0.8895 *** | −0.4026 | 5.5255 *** | 1.3659 *** |
| (0.2587) | (0.2304) | (0.1305) | (0.2490) | (0.2286) | (0.1262) | |
| GROWTH | 1.7429 *** | 2.0759 *** | −0.2306 *** | 1.7369 *** | 2.0691 *** | −0.2592 *** |
| (0.1592) | (0.1316) | (0.0646) | (0.1593) | (0.1316) | (0.0655) | |
| DTURN | 0.0492 | −0.3497 *** | −0.2196 *** | 0.0475 | −0.3590 *** | −0.2621 *** |
| (0.0861) | (0.0664) | (0.0406) | (0.0862) | (0.0664) | (0.0414) | |
| REC | 5.8504 *** | 1.4794 | 0.0215 | 5.7804 *** | 1.4464 | −0.0945 |
| (1.5642) | (1.1557) | (0.6903) | (1.5637) | (1.1568) | (0.6999) | |
| INV | 3.0480 ** | 4.0179 *** | 1.1724 * | 2.9683 ** | 3.9374 *** | 0.8396 |
| (1.3281) | (1.1444) | (0.6305) | (1.3296) | (1.1431) | (0.6214) | |
| BM | 0.4314 | −2.6915 *** | 0.4791 ** | 0.4759 | −2.6502 *** | 0.6479 *** |
| (0.4699) | (0.3658) | (0.2402) | (0.4710) | (0.3643) | (0.2426) | |
| HHI | 0.6810 | 2.8903 | −1.7818 | 0.6474 | 2.8711 | −1.8529 |
| (2.9544) | (1.8534) | (1.1875) | (2.9612) | (1.8553) | (1.2153) | |
| SOE | 1.4128 *** | 1.2588 *** | 0.0116 | 1.4330 *** | 1.2591 *** | 0.0022 |
| (0.4304) | (0.3615) | (0.2085) | (0.4294) | (0.3605) | (0.2110) | |
| DUAL | 0.0422 | 0.3685 ** | 0.1343 | 0.0409 | 0.3701 ** | 0.1423 |
| (0.1939) | (0.1490) | (0.0918) | (0.1939) | (0.1490) | (0.0930) | |
| MAGTMALER | −0.0005 | −0.5157 *** | 0.0087 | −0.0003 | −0.5156 *** | 0.0090 |
| (0.0104) | (0.0084) | (0.0055) | (0.0104) | (0.0084) | (0.0055) | |
| OPACITY | −0.0172 | −0.1269 ** | 0.1361 *** | −0.0198 | −0.1241 ** | 0.1504 *** |
| (0.0655) | (0.0504) | (0.0346) | (0.0657) | (0.0504) | (0.0352) | |
| INDDIRR | −0.0191 | 0.0410 *** | 0.0046 | −0.0193 | 0.0408 *** | 0.0038 |
| (0.0165) | (0.0131) | (0.0100) | (0.0165) | (0.0131) | (0.0101) | |
| AUD_FEE | 1.4950 *** | 0.7461 *** | −0.4901 *** | 1.4940 *** | 0.7374 *** | −0.5299 *** |
| (0.3456) | (0.2639) | (0.1709) | (0.3452) | (0.2642) | (0.1775) | |
| Constant | 39.4840 *** | −36.6864 *** | 38.1342 *** | 39.6812 *** | −38.8739 *** | 27.8053 *** |
| (6.2587) | (5.6139) | (3.3540) | (6.1238) | (5.5629) | (3.3081) | |
| Observations | 25,391 | 25,391 | 25,391 | 25,391 | 25,391 | 25,391 |
| R-squared | 0.6463 | 0.8504 | 0.5567 | 0.6463 | 0.8503 | 0.5504 |
| FIRM FE | YES | YES | YES | YES | YES | YES |
| YEAR FE | YES | YES | YES | YES | YES | YES |
Disclaimer/Publisher’s Note: The statements, opinions and data contained in all publications are solely those of the individual author(s) and contributor(s) and not of MDPI and/or the editor(s). MDPI and/or the editor(s) disclaim responsibility for any injury to people or property resulting from any ideas, methods, instructions or products referred to in the content. |
© 2025 by the authors. Licensee MDPI, Basel, Switzerland. This article is an open access article distributed under the terms and conditions of the Creative Commons Attribution (CC BY) license (https://creativecommons.org/licenses/by/4.0/).
Share and Cite
Zhang, Y.; Xia, P.; Zheng, X. Climate Risks and Common Prosperity for Corporate Employees: The Role of Environment Governance in Promoting Social Equity in China. Sustainability 2025, 17, 6823. https://doi.org/10.3390/su17156823
Zhang Y, Xia P, Zheng X. Climate Risks and Common Prosperity for Corporate Employees: The Role of Environment Governance in Promoting Social Equity in China. Sustainability. 2025; 17(15):6823. https://doi.org/10.3390/su17156823
Chicago/Turabian StyleZhang, Yi, Pan Xia, and Xinjie Zheng. 2025. "Climate Risks and Common Prosperity for Corporate Employees: The Role of Environment Governance in Promoting Social Equity in China" Sustainability 17, no. 15: 6823. https://doi.org/10.3390/su17156823
APA StyleZhang, Y., Xia, P., & Zheng, X. (2025). Climate Risks and Common Prosperity for Corporate Employees: The Role of Environment Governance in Promoting Social Equity in China. Sustainability, 17(15), 6823. https://doi.org/10.3390/su17156823