Article

Sustainability Assessment of Rural Biogas Production and Use Through a Multi-Criteria Approach: A Case Study in Colombia

by
Franco Hernan Gomez
1,2,3,*,
Nelson Javier Vasquez
4,
Kelly Cristina Torres
5,
Carlos Mauricio Meza
6 and
Mentore Vaccari
1,2
1
Department of Civil, Environmental, Architectural Engineering and Mathematics, University of Brescia, Via Branze 43, 25123 Brescia, Italy
2
Research Centre on Appropriate Technologies for Environmental Management in Resource Limited Countries (CeTAmb), University of Brescia, Via Branze 43, 25123 Brescia, Italy
3
Group on Governance of Climate Change (GGCC), Universitat Politècnica de Catalunya-BarcelonaTech, Av. Maristany, 16, 08019 Barcelona, Spain
4
Environmental Sciences PhD Program, Universidad del Cauca, Calle 5 No. 4-70, 190001 Popayán, Colombia
5
Research Group on Conservation and Use of Biodiversity (BioCon), Instituto Universitario de La Paz-Unipaz, Km 14 vía Bucaramanga, 687031 Barrancabermeja, Colombia
6
Research Group on Environmental Engineering (GIAS), Instituto Universitario de La Paz-Unipaz, Km 14 vía Bucaramanga, 687031 Barrancabermeja, Colombia
*
Author to whom correspondence should be addressed.
Sustainability 2025, 17(15), 6806; https://doi.org/10.3390/su17156806 (registering DOI)
Submission received: 11 June 2025 / Revised: 13 July 2025 / Accepted: 23 July 2025 / Published: 26 July 2025

Abstract

There is still a need to develop scenarios and models aimed at substituting fuelwood and reducing the use of fossil fuels such as liquefied petroleum gas (LPG), on which low-income rural households in the Global South often depend. The use of these fuels for cooking and heating in domestic and productive activities poses significant health and environmental risks. This study validated, in three different phases, the sustainability of a model for the production and use of biogas from the treatment of swine-rearing wastewater (WWs) on a community farm: (i) A Multi-Criteria Analysis (MCA), incorporating environmental, social/health, technical, and economic criteria, identified the main weighted criterion to C8 (use of small-scale technologies and low-cost access), with a score of 0.44 points, as well as the Tubular biodigester (Tb) as the most suitable option for the study area, scoring 8.1 points. (ii) Monitoring of the Tb over 90 days showed an average biogas production of 2.6 m3 d−1, with average correlation 0.21 m3 Biogas kg Biomass−1. Using the experimental biogas production rate (k = 0.0512 d−1), the process was simulated with the BgMod model, achieving an average deviation of only 10.4% during the final production phase. (iii) The quantification of benefits demonstrated significant reductions in firewood use: in Scenario S1 (kitchen energy needs), biogas replaced 83.1% of firewood, while in Scenario S2 (citronella essential oil production), the substitution rate was 24.1%. In both cases, the avoided emissions amounted to 0.52 tons of CO2eq per month. Finally, this study proposes a synthesised, community-based rural biogas framework designed for replication in regions with similar socio-environmental, technical, and economic conditions.

1. Introduction

In rural areas of the Global South, energy access is not only limited but often inequitable, with marginalised communities bearing the brunt of energy poverty. The widespread reliance on firewood and liquefied petroleum gas (LPG) among smallholder farming families imposes significant economic, health, and environmental costs [1,2,3]. The dependence on firewood accelerates deforestation, soil degradation, and carbon emissions, while the purchase of LPG constitutes a substantial and volatile expense for low-income households. Moreover, women are disproportionately affected by the use of firewood for food preparation, having health effects from indoor air pollution and the time burden of biomass collection [4,5,6]. Studies highlight that biogas adoption in rural areas of the Global South enhances energy efficiency, women’s health, economic empowerment, and participation in energy decisions. Nevertheless, challenges remain in optimising implementation models to improve organisational capacity, social inclusion, and gender equity in vulnerable contexts [7,8,9,10]
The Multi-Criteria Analysis (MCA) was applied in this research as a versatile, participatory, diverse, and evaluable tool [11,12,13,14,15]. In this case study, it was applied to evaluate three low-cost biodigester technologies to determine their suitability for rural applications and the best conditions for developing anaerobic digestion (AD) as a suitable anaerobic microbiological process for the treatment of swine-rearing wastewater (WWs) [16,17,18], where decomposed organic substrate transformed into biogas and digestate with specific conditions of temperature: 10–45 °C for Mesophile bacteria, pH: 6.8–7.2, hydraulic retention time (HRT): 30–40 d [19,20], Organic Load Rate (OLR): 2 kgvs m3 d−1 [17,21]. The MCA is based on the potential use of different sources of animal and agricultural biomass waste present in the study area and the fuelwood or LPG requirements for combustion in food preparation by rural families and the thermal requirements for community production processes [22,23,24]. The main characteristics of the low-cost biodigesters prioritised for analysis are the following: The Fixed Dome digester is constructed underground to reduce temperature fluctuations. It offers advantages such as low construction costs, durability, and local job creation [5,6,8]. However, it has drawbacks including the inability to remove sediment buildup, which reduces its effective volume and gas production over time. Additionally, it requires specific technical skills for construction and maintenance, and repairs are challenging once built [8,9,22]. The Floating Drum digester features a movable, metal gas holder with anti-corrosion coating, supported by a guiding frame to prevent tilting [9,10,20]. This design provides easy operation with visual gas indicators and consistent gas pressure. Despite these benefits, the steel drum is costly, needs regular maintenance like repainting, and is vulnerable to corrosion, leading to higher long-term expenses. Skilled labour is also necessary for its upkeep [8,22]. The Tubular digester is the simplest and most economical option, using a prefabricated plastic bag for the digestion chamber instead of concrete tanks [7,8,22]. It is lightweight, easy to transport, and adaptable to various climates without requiring skilled labour, with average correlations of m3Biogas kgswine biomass−1 ranging between 0.31 and 0.42. Its disadvantages include a shorter lifespan, vulnerability to physical damage, limited local material availability, and lower gas pressure, which necessitates added weights [8,23,24,25].
The deployment of community-based biogas systems not only decentralises energy generation but democratises access to it, aligning with the principles of a just energy transition: equity, inclusivity, sustainability, and circular economy. Ultimately, biogas systems offer an integrated strategy for advancing a just energy transition to participate in climate action while improving their livelihoods and environmental conditions [4,16,26]. This paper explores the sustainability, replicability, and socioenvironmental impacts of biogas adoption in rural energy communities, with a focus on its contribution to equitable and inclusive energy systems in the Global South [4,27,28], and contributes by providing experimental results in places in Colombia as the Peasant Reserve Zone of the Cimitarra River Valley (ZRC-VRC), where initiatives to build biodigesters and produce biogas have never been developed [29,30,31].

2. Materials and Methods

2.1. Location of the Study

The case study took place in the ZRC-VRC in Colombia, a region known for its rich biodiversity, abundant water resources, and natural forests [15,31,32,33]. The region is marked by widespread rural vulnerability, with most residents living below the poverty line and exposed to persistent armed conflict. Currently, the ZRC-VRC covers 570,196 hectares where 29,000 people live, including peasants, artisanal miners, and fishermen, who live in 130 villages [30,34,35,36,37]. Figure A1 shows the location of the community of Puerto Matilde (N 07°0.233′ W 074°12.151′), where the pilot plants for the production of biogas and essential oils, subject of the present research, are located. The average daily temperature in the area is 32 °C, with no seasonal temperature changes. The community is located at 117 m above sea level [31].

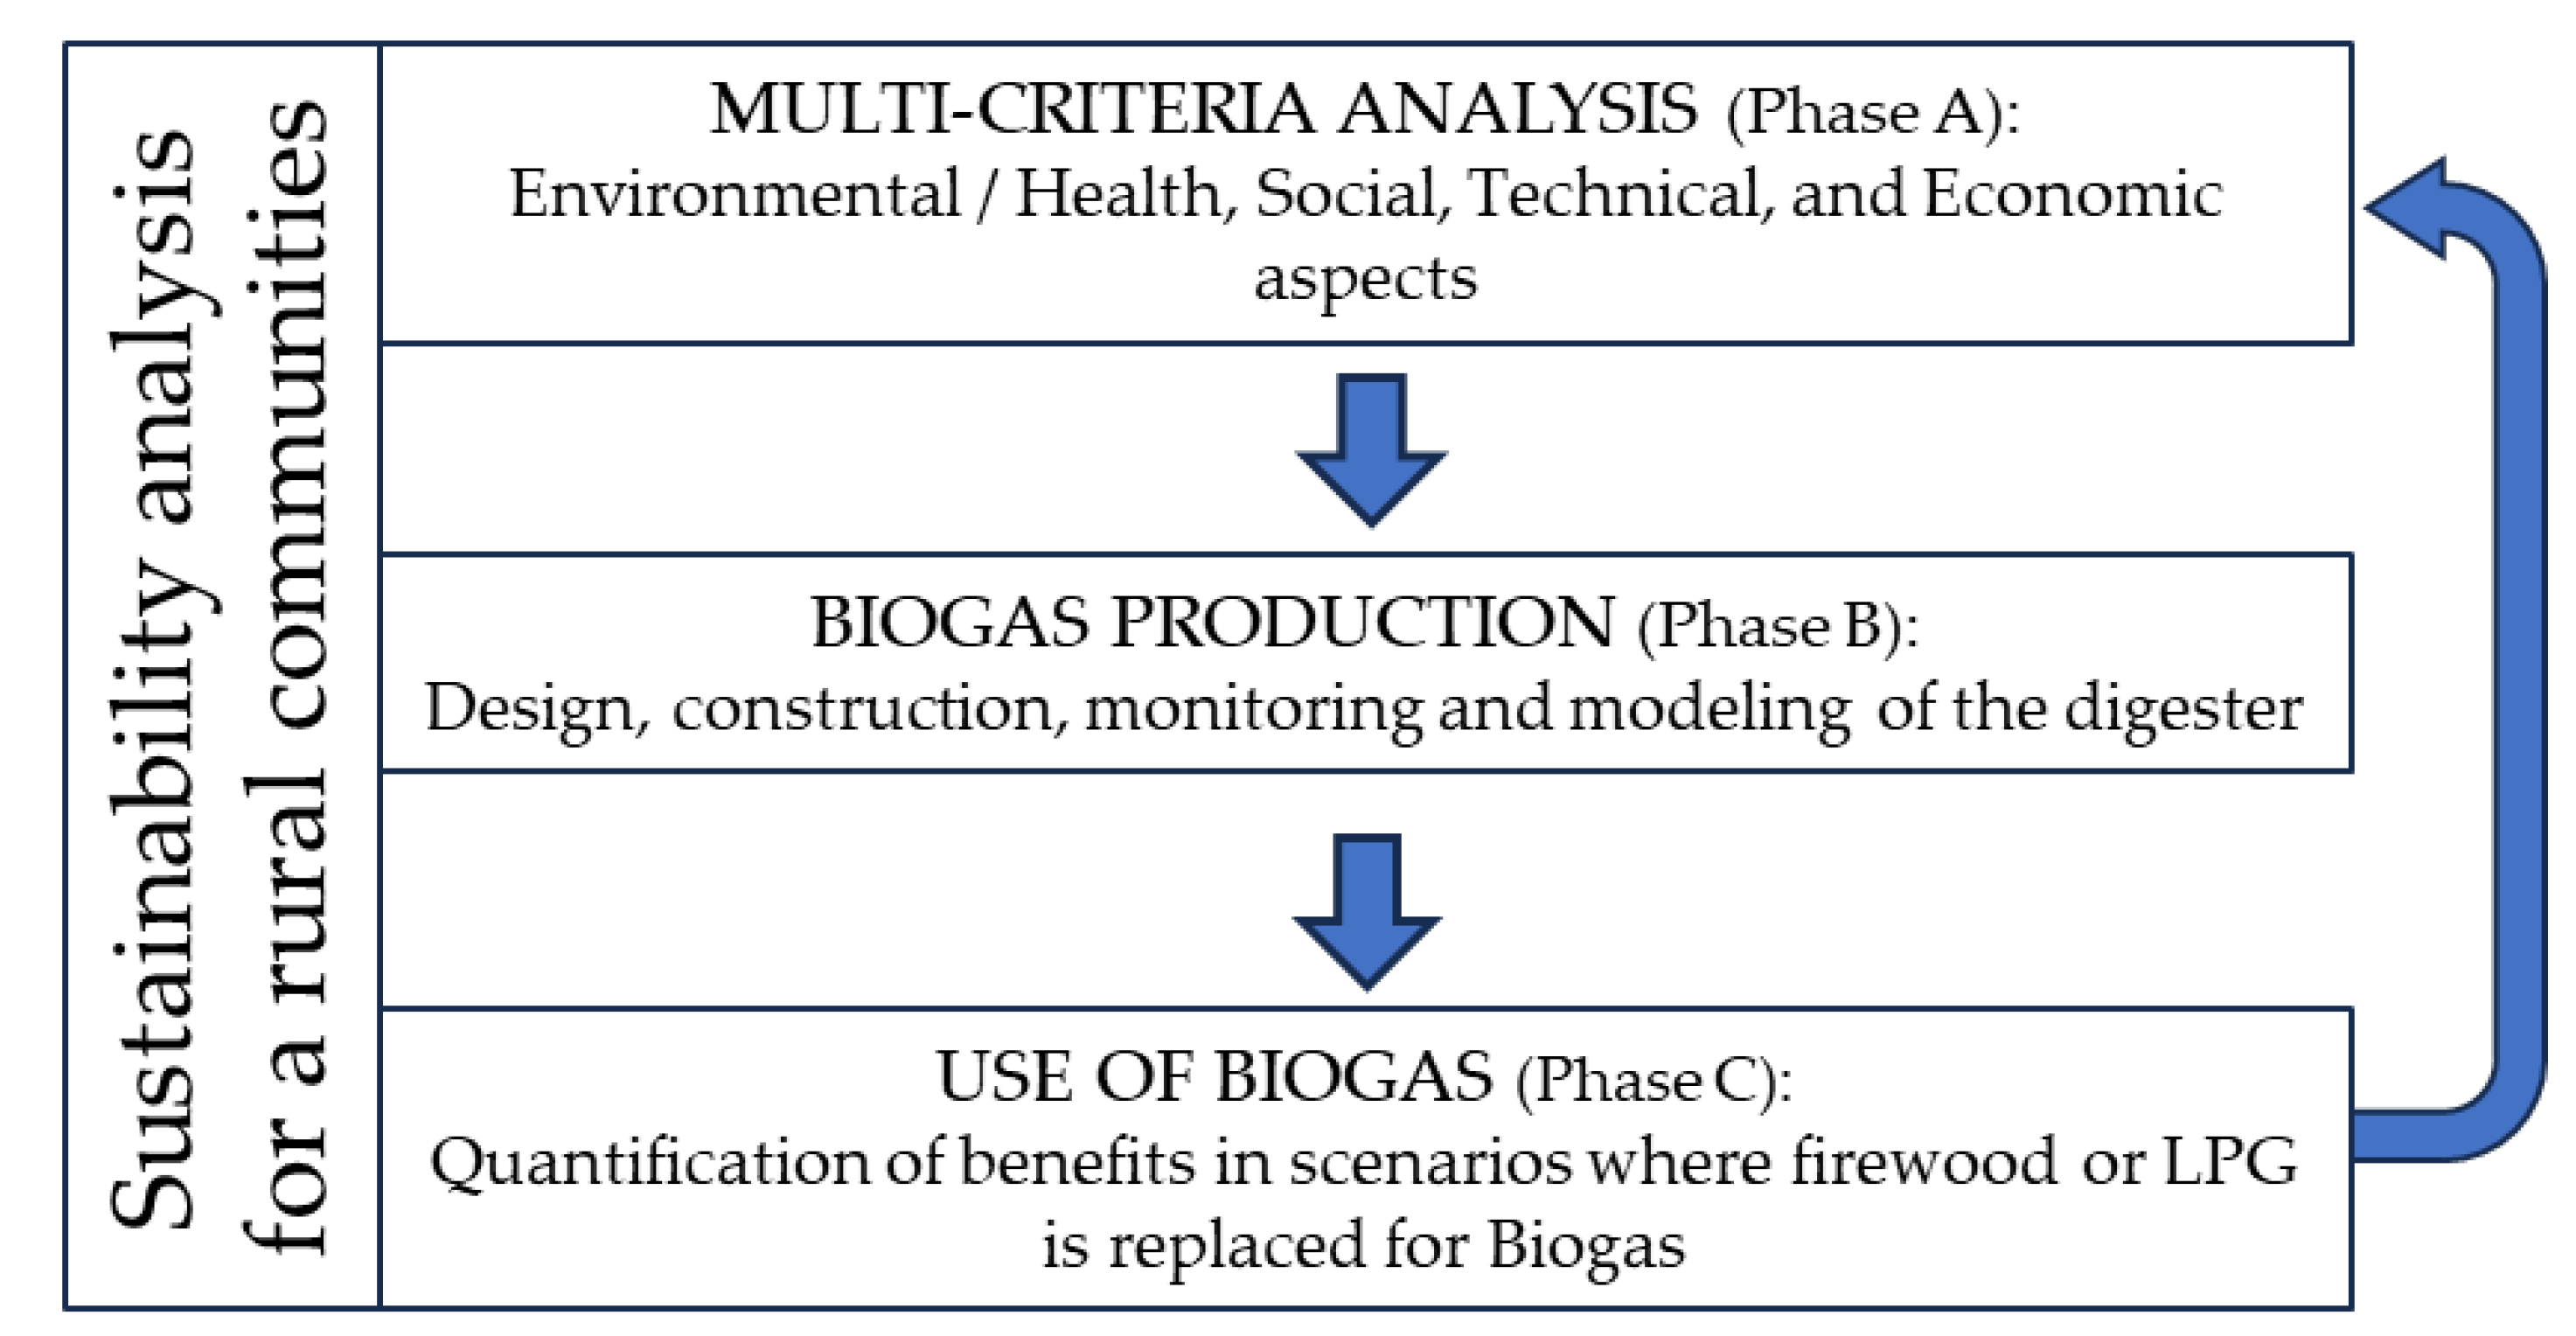
2.2. Structure of Analysis for Assessment Methodology

Three phases were carried out with different aims. The block diagram of the three phases of sustainability analysis can be seen in Figure 1.
Phase A (Ph-A) was carried out to develop the Multi-Criteria Analysis (MCA) applied to evaluate which technology is the most appropriate for the treatment of wastewater from the pig rearing process among the low-cost biodigesters, using a review of technical information, to acquire a specific assessment of the environmental, social/health, technical, and economic aspects.
Phase B (Ph-B) was the design, construction, and monitoring of biogas production. Using the experimental results, a simple mathematical model was also identified to simulate the biogas production process under the conditions of the case study.
Phase C (Ph-C) was to verify the quantification of environmental, social/health, technical, and economic benefits through the use of biogas in scenarios where firewood or LPG is replaced for cooking or in community-based productive activities.

2.3. Ph-A—Multi-Criteria Analysis (MCA)

The MCA was applied to evaluate which technology is the most appropriate for the treatment of wastewater from the pig rearing process among the low-cost biodigesters: Fixed Dome digester, Floating Drum digester and Tubular digester (overall goal for MCA). The assessment MCA was divided into six main phases [11,12,13,14].
i.
Definition of the matrix, which represents general criteria (GC), C1 to C12. To identify GC, the criteria from other similar research were used and adapted to the context and territory. Table 1 lists the GC used for this case study.
ii.
Assignment of weights to the criteria by comparison in pairs (Wpi), to establish their importance. In pairwise comparison, each criterion is compared with the others by asking the following: How much more important is each criterion in relation to each other, concerning the overall goal? Importance is rated from 1 (equal) to 9 (absolute), with intermediate values [11,12].
iii.
Normalisation of the comparison criteria, is used to make the data in the matrix homogeneous and operational.
iv.
Weighting of the standardised values (Wsi), calculated for each of the criteria, by averaging the values of the specific standardised relative weights.
v.
The sensitivity analysis, performed by calculating the Consistency Index (CI) and the Coherence Coefficient (CR), consists of assessing whether the pairwise comparisons are logically consistent. For the case study matrix with number of criteria ni= 12, it is necessary to give as results CR < 0.1 and CI ≥ 11%, to conclude an adequate coherence in the comparisons. The calculation steps to determine CI and CR can be seen in Equations (1) and (2) [11,12].
CI = ((Ēi Wsi − 1) − ni) ni−1
CR = CI RI−1
where
  • Ēi is average of the specific values of Ei = Σ(Wpi Wsi);
  • RI is the Random Index; for ni = 12, it is 1.49.
vi.
Final score for each alternative, the products of the score assigned to the alternative for each criterion, and the relative weight of that criterion are added together. In the case study, a scale of 0 to 3 is applied, as follows: 0: The criterion has a strong negative influence on the alternative; 1: The criterion has a negative influence; 2: The criterion has no influence; 3: The criterion has a positive influence; 4: The criterion has a strong positive influence. The best alternative is the one with the highest final score [11,12].
Table 1. General criteria (GC).
Impact CategoryCodeGeneral Impact Criteria
Environmental
[8,12,13,14]
C1Pollutant emissions in water, air, and soil.
C2Consumption of natural resources and raw materials (wood, water, fuel consumption, or non-renewable energy).
C3Deforestation in areas with high biodiversity.
Social/Health
[4,11,18,23]
C4Effects on human health and local biodiversity.
C5Organisational culture of the local community.
C6Living conditions of the local community over time.
Technical
[8,15,23]
C7Use of local resources and reproducibility.
C8Use of small-scale technologies and access for low cost.
C9Ease of management.
Economic
[3,11,12,13]
C10Technological development and investment in infrastructure.
C11Generation of employment and development of the local economy.
C12Incentive to the local market/biogas-based energy community.
The assessments of the MCA exercise were carried out by a total of 10 people, made up of delegates from the ACVC (the social organisation that promotes the use of the biogas community), delegates from the ACVC technical team, and the research team. These delegates established their respective score through face-to-face and virtual participatory workshops. Each of the participants had their own specific online Excel file, where they could enter their quantitative ratings, the file also had a respective tab for rating the consistency of the answers. Each rating per person counted equally. The final results were the average results of all participants in the MCA exercise. The MCA assessment team defined the initial considerations: The system boundary for the analysis is the community farm, which includes a piggery and a rural household with eight members who use firewood and LPG to prepare their food. It also includes an essential oil extraction unit, which relies on firewood for thermal energy. The team took the initial consideration of prioritising wastewater treatment from pig rearing, due to its ease of collection, availability, existing infrastructure, and budgetary constraints. Other sources of organic waste present within the system boundaries were reserved for future research and implementation scenarios.

2.4. Ph-B—Characteristics of Swine-Rearing Wastewater (WWs) and Swine Biomass

The WWs that feed the biodigester come from washing the pig breeding stables. WWs’s average concentration of COD was 3.72 mg L−1, and BOD5 was 1.73 mg L−1. The average pH for each monitoring day was 6.8 with a standard deviation (s) of 0.4. For the solid samples of swine biomass, the Total Solid was 19.2% ± 3.1% and the Volatile Solid result was 71.6% ± 5.3%. The samples were taken at the pilot plant and transported to Barrancabermeja to be analysed at the environmental engineering laboratory at Unipaz University. Except for pH, the reported parameters were only determined once before the experimental phase.

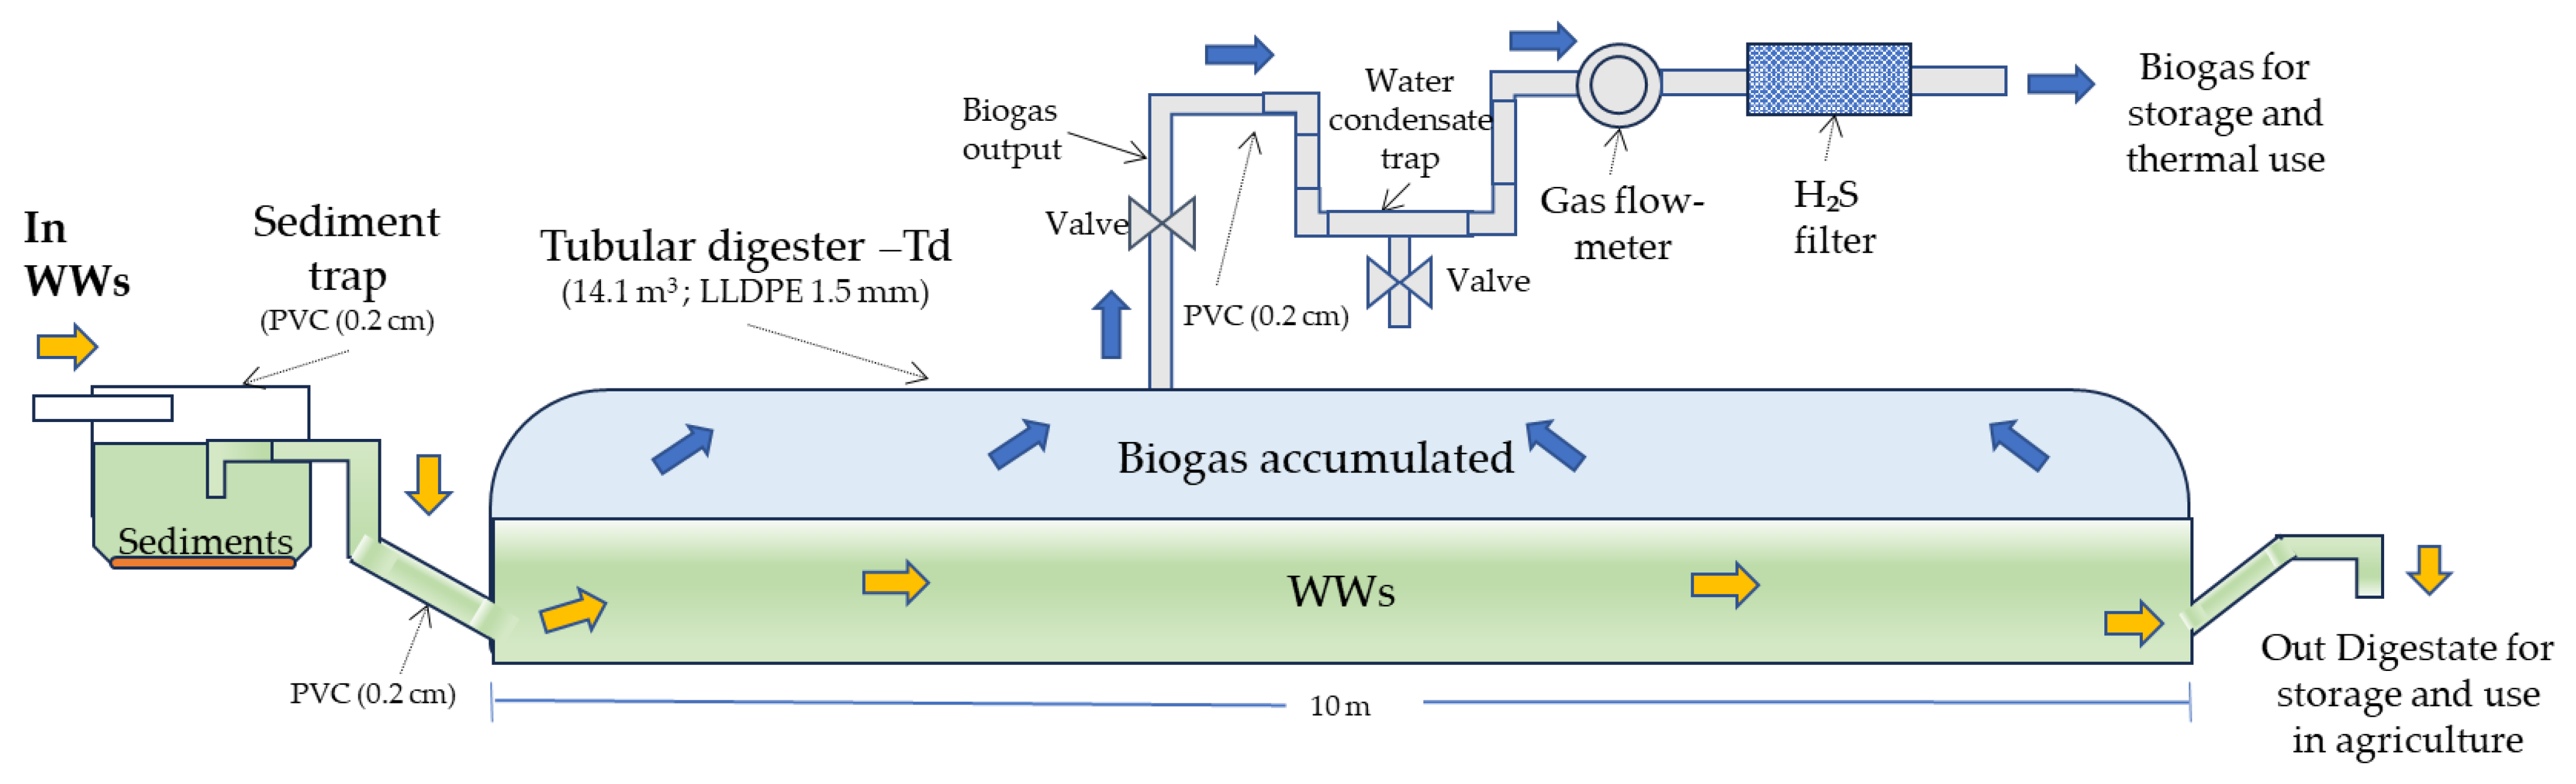
2.5. Ph-B—Pilot-Scale System—Tubular Digester (Td)

One pilot-scale system was utilised (Tubular digester Td) to test the biogas production efficiency. The system consists of a sediment trap (150 L) for pretreatment, the Tb digester, a condensate trap, a flow meter to measure the biogas produced, and a hydrogen sulfide (H2S) filter constructed with iron turnings as packing material [38,39,40]. The biogas was stored in plastic bags with a capacity of 1 m3 each, and the digestate was collected in a 500 L tank for subsequent use in agriculture. Td was made of low-density linear polyethylene (LLDPE) with a thickness of 1.5 mm. Inlet and outlet pipes (1.1 cm internal diameter) were made of polyvinyl chloride (PVC). The construction and characteristics details of Td can be seen in Figure 2. The simplified design process for the Td calculates the total volume of the digester chamber using the following Equations (3) and (4) [17,41,42].
V . m𝑖𝑥 = ( Q D S + Q W )   ρ W 1
where
  • V . m𝑖𝑥 = Daily volumetric flow of mix = 0.29 m3 d−1;
  • QW = Daily quantity of water enters the digester = 275 kg d−1;
  • QDS = Daily quantity of swine biomass enters the digester = 14.3 kg d−1;
  • ρW = water density = 1000 kg m3 −1.
V T = ( HRT   V . m𝑖𝑥 )   ( 1 x ) 1
where
  • VT = digestion chamber volume = 10.8 m3;
  • V . m𝑖𝑥 = daily volumetric flow of mix = 0.29 m3 d−1;
  • HRT = Hydraulic Retention Time = 30 day;
  • x = gas volume ratio = 0.2 m3 biogas m3 −1.
Considering that the theoretical total volume for the Td was 10.8 m3, the Td closest to this value was purchased on the market, with a length of 10 m.
The experimental phase was conducted using Td operating in a horizontal and continuous flow mode for 90 days. During this period, it received swine-rearing wastewater (WW) averaging 1 h per day (460 L h−1). The daily production quantity was monitored using the biogas flow meter. The volume (m3) of biogas produced was measured with the Gas flow-meter Wuhan Acme Agro-Tech, JBD2.5-SA, Max. flow rate: 4 m3 h−1, Min. flow rate: 0.04 m3 h−1, pressure losses < 200 Pa. Figure A2 in Appendix A presents a sequence of images illustrating the installation and commissioning process of the systems studied.
Figure 2. Characteristics of the Tubular digester (Td) systems used. The Swine-Rearing Wastewater (WWs) is the light green band, and the biogas produced is the light blue band. The biogas produced passes through a water condensate trap and an H2S filter before being used as fuel.
Sustainability 17 06806 g002

2.6. Ph-B: Biogas Production Model for Td (Continuous Biogas/Biomass Flow and Non-Stationary Systems—BgMod)

Based on experimental data on biogas production and operating conditions, the mathematical model (BgMod) was developed to simulate the production of biogas at continuous flow and non-stationary regime; using plug-flow behaviour assumed a pseudo first-order production model with a kinetic constant to have a design tool for future system replicas. The amount of volumetric concentration of Biogas (m3Biogas kgdry biomass−1) that will be produced by at time t (Ci(t)) was calculated as reported in Equations (5) and (6) [43,44,45].
Ci(t) = 1 − [((Cin VBiogas − C) exp (−(k + (Q V − 1)) t)) + C]
C = Q Cin (Q + k V)−1
where Cin represents the initial concentration to the system (m3biogas kgdry biomass−1); VBiogas; k is the first-order accumulation kinetic constant (d−1) determined with the logarithmic trend line of the experimental data; t= HRT is the hydraulic residence time (exposure time (d); Q is the flow rate (m3 d−1); VT is the volume of Td (m3); C represents the maximum concentration of biogas that the Td can produce (m3 Biogas Kgdry biomass−1).

2.7. Ph-C: Quantification of the Environmental Benefits of Replacing Wood or LPG with Biogas

The analysis aims to assess the relative merits of using biogas and digestate products. Specifically, evaluations of two different scenarios have been carried out. The first evaluation phase (S1) concerns the production of biogas for use in household food preparation and the second (S2) concerns the production of biogas for use in community production activities (distillation of essential oils). Calculations were made using the IPCC Method 1, seeking to characterise the impact category to the results of the MCA work [46]. The following baseline data were taken into account: (S1) household consumption of fuelwood for food preparation is 15.6 kg d−1 by family and consumes 1 LPG cylinder of 40 lb = 0.03 m3 per month; (S2) wood-fired 0.5-ton citronella essential oil pilot plant requires 1500 kg monthly. (Cp fuelwood = 4.5 kWh kg−1) (Cp LPG = 26.1 kWh m3 −1). Biogas (rural digester): 60% Typical Cooking Efficiency. CO2 equivalence of CH4: 25 gCO2eq gCH4−1; CH4 density = 0.717 kg m3 −1, CH4 energy content: 50 MJ kg−1 [47].

3. Results and Discussion

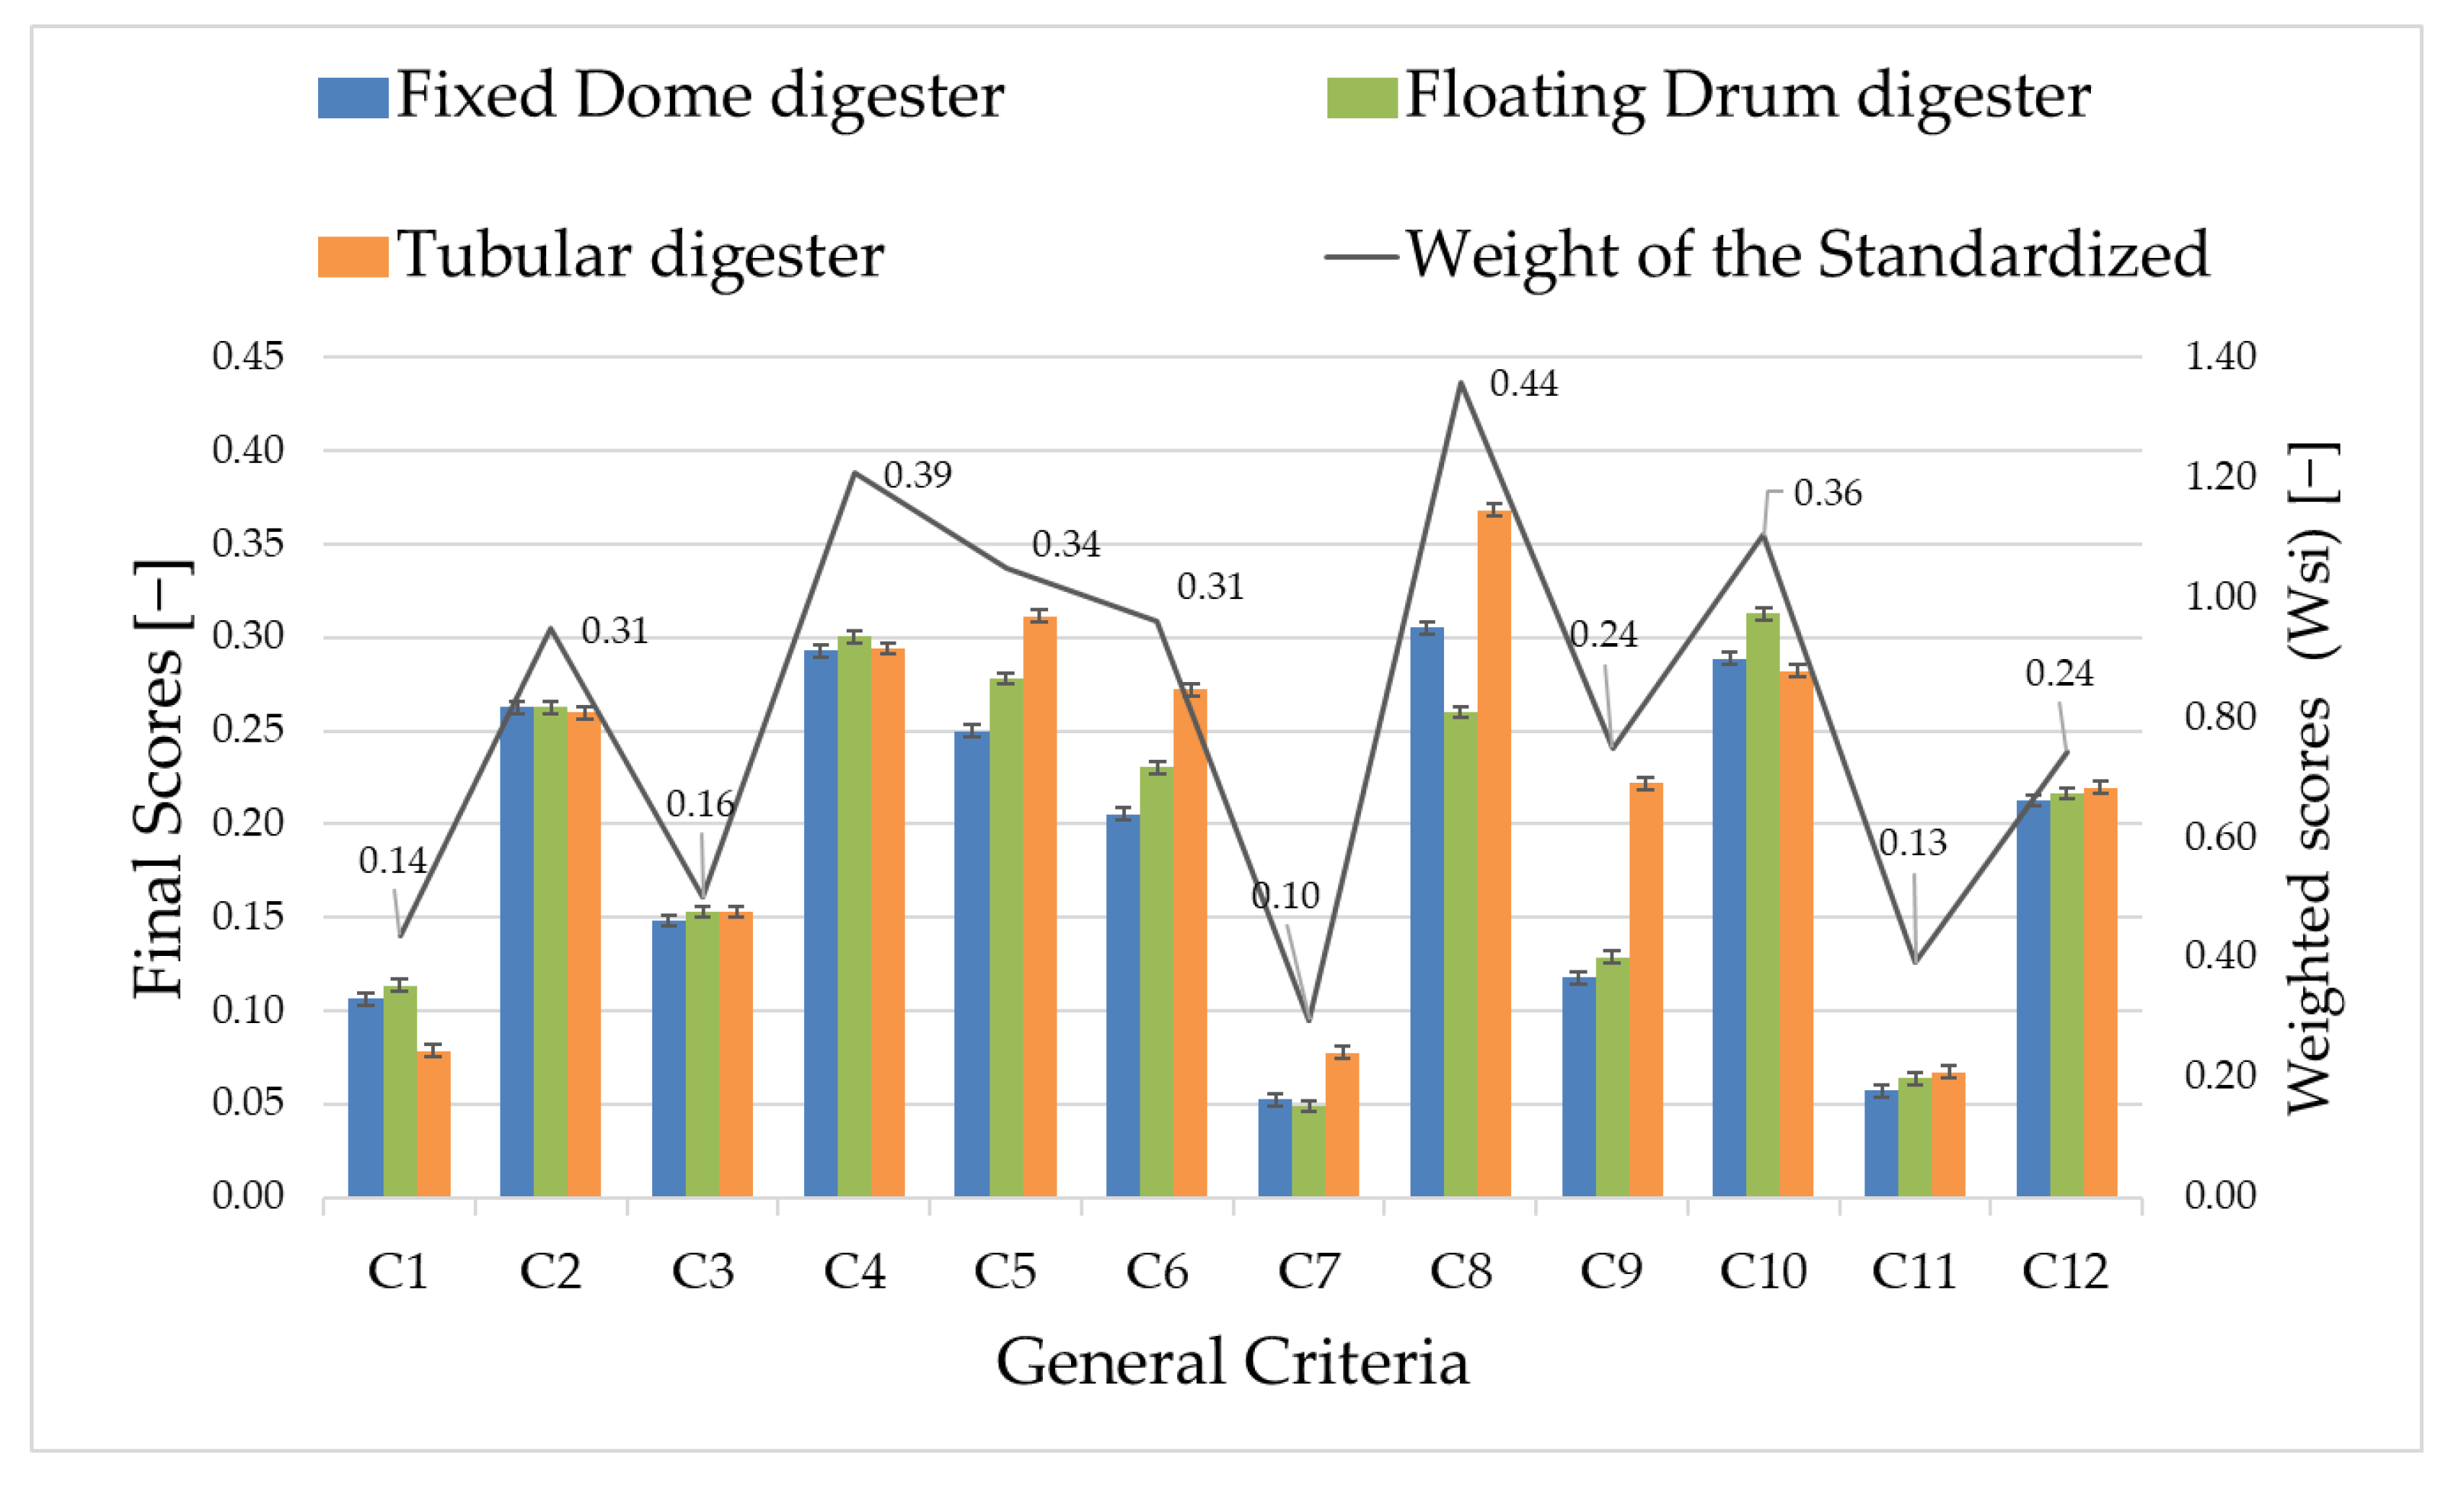
3.1. Ph-A—Results of the Multi-Criteria Analysis MCA

The matrix of weights to the criteria by comparison in pairs to establish their importance (Wpi) is presented in Appendix ATable A1. The weighting of standardised values (Wsi) is presented in Appendix ATable A2. Calculation of the final scores for the comparison of alternatives: The final impact score for each alternative is presented in Appendix ATable A3. The first standardised weighting scores (Wsi) were C8 (use of small-scale technologies and access for low cost: 0.44 points), followed by C4 (effects on human health and local biodiversity: 0.39 points), C10 (technological development and investment in infrastructure: 0.36 points) and C5 (organisational culture of the local community: 0.34 points). According to the sensitivity analysis method, the algebraic criteria for the consistency of the results were met: the GC matrix showed a CI equal to 14.1% and CR = 0.095. It suggests consistency in the pairwise comparisons of GC. The last part of the MCA exercise was developed and it was decided to build a Tubular model: Tubular digester— Td: 8.11 points—followed by Floating Drum digester (7.37 points) and Fixed Dome digester (7.15 points). Figure 3 shows the results of the impact assessment conducted through the MCA. The results of the criteria weighting and sensitivity analysis are in line with AMC benchmark studies [14,15].
The Tubular digester (Td) was selected as the most suitable option for a household-scale application, given its low capital cost, high adaptability, and minimal technical skill requirements. An important criterion was economic feasibility, as the targeted communities have limited financial resources. Moreover, being a first implementation, the aim was to prioritise an optimised and low-risk experimental setting. In contrast, the Floating Drum digester was deemed unsuitable due to its high construction cost, the need for specialised skills associated with the steel drum, logistical challenges related to transportation, and extended construction time. The decision to install a Tubular digester (Td) aligns with research findings and the growing trend in the adoption of this type of biodigester in Global South countries, particularly in Colombia, by implementing biogas in peasant areas and converting waste (manure/domestic wastewater) into clean energy, improving quality of life, reducing respiratory diseases, preventing deforestation (replacing firewood/charcoal), and producing biofertilisers for crops [17,20,21,22,23]. The evaluation team highlighted the Tubular biodigester (Td) as the most suitable option given its low cost, ease of construction and maintenance, and proven performance in similar rural contexts such as Puerto Matilde and the ZRC-VRC [24,25].
Laboratory analyses confirmed that the biomass inputs, particularly the SVT and ST values, fall within the optimal range for efficient anaerobic digestion (AD) [38,39]. These characteristics, combined with its potential to enhance local organisational and productive capacities, support its implementation. The system contributes to a circular peasant economy by integrating pig farming, the treatment of livestock waste through AD, and the valorisation of co-products like biogas and digestate. Additionally, the process offers social and health benefits, especially for women, including reduced time spent collecting firewood and lower exposure to indoor air pollution—critical for preventing chronic obstructive pulmonary disease (COPD) among those primarily responsible for cooking. However, it is essential to ensure that responsibilities linked to biodigester operation do not disproportionately increase women’s workloads, as noted in related studies [6,7,8,9,10]. Once the biodigester type and biomass volume were established, the reactor chamber was dimensioned according to the design methodology described in Section 2.5. Ph-B.

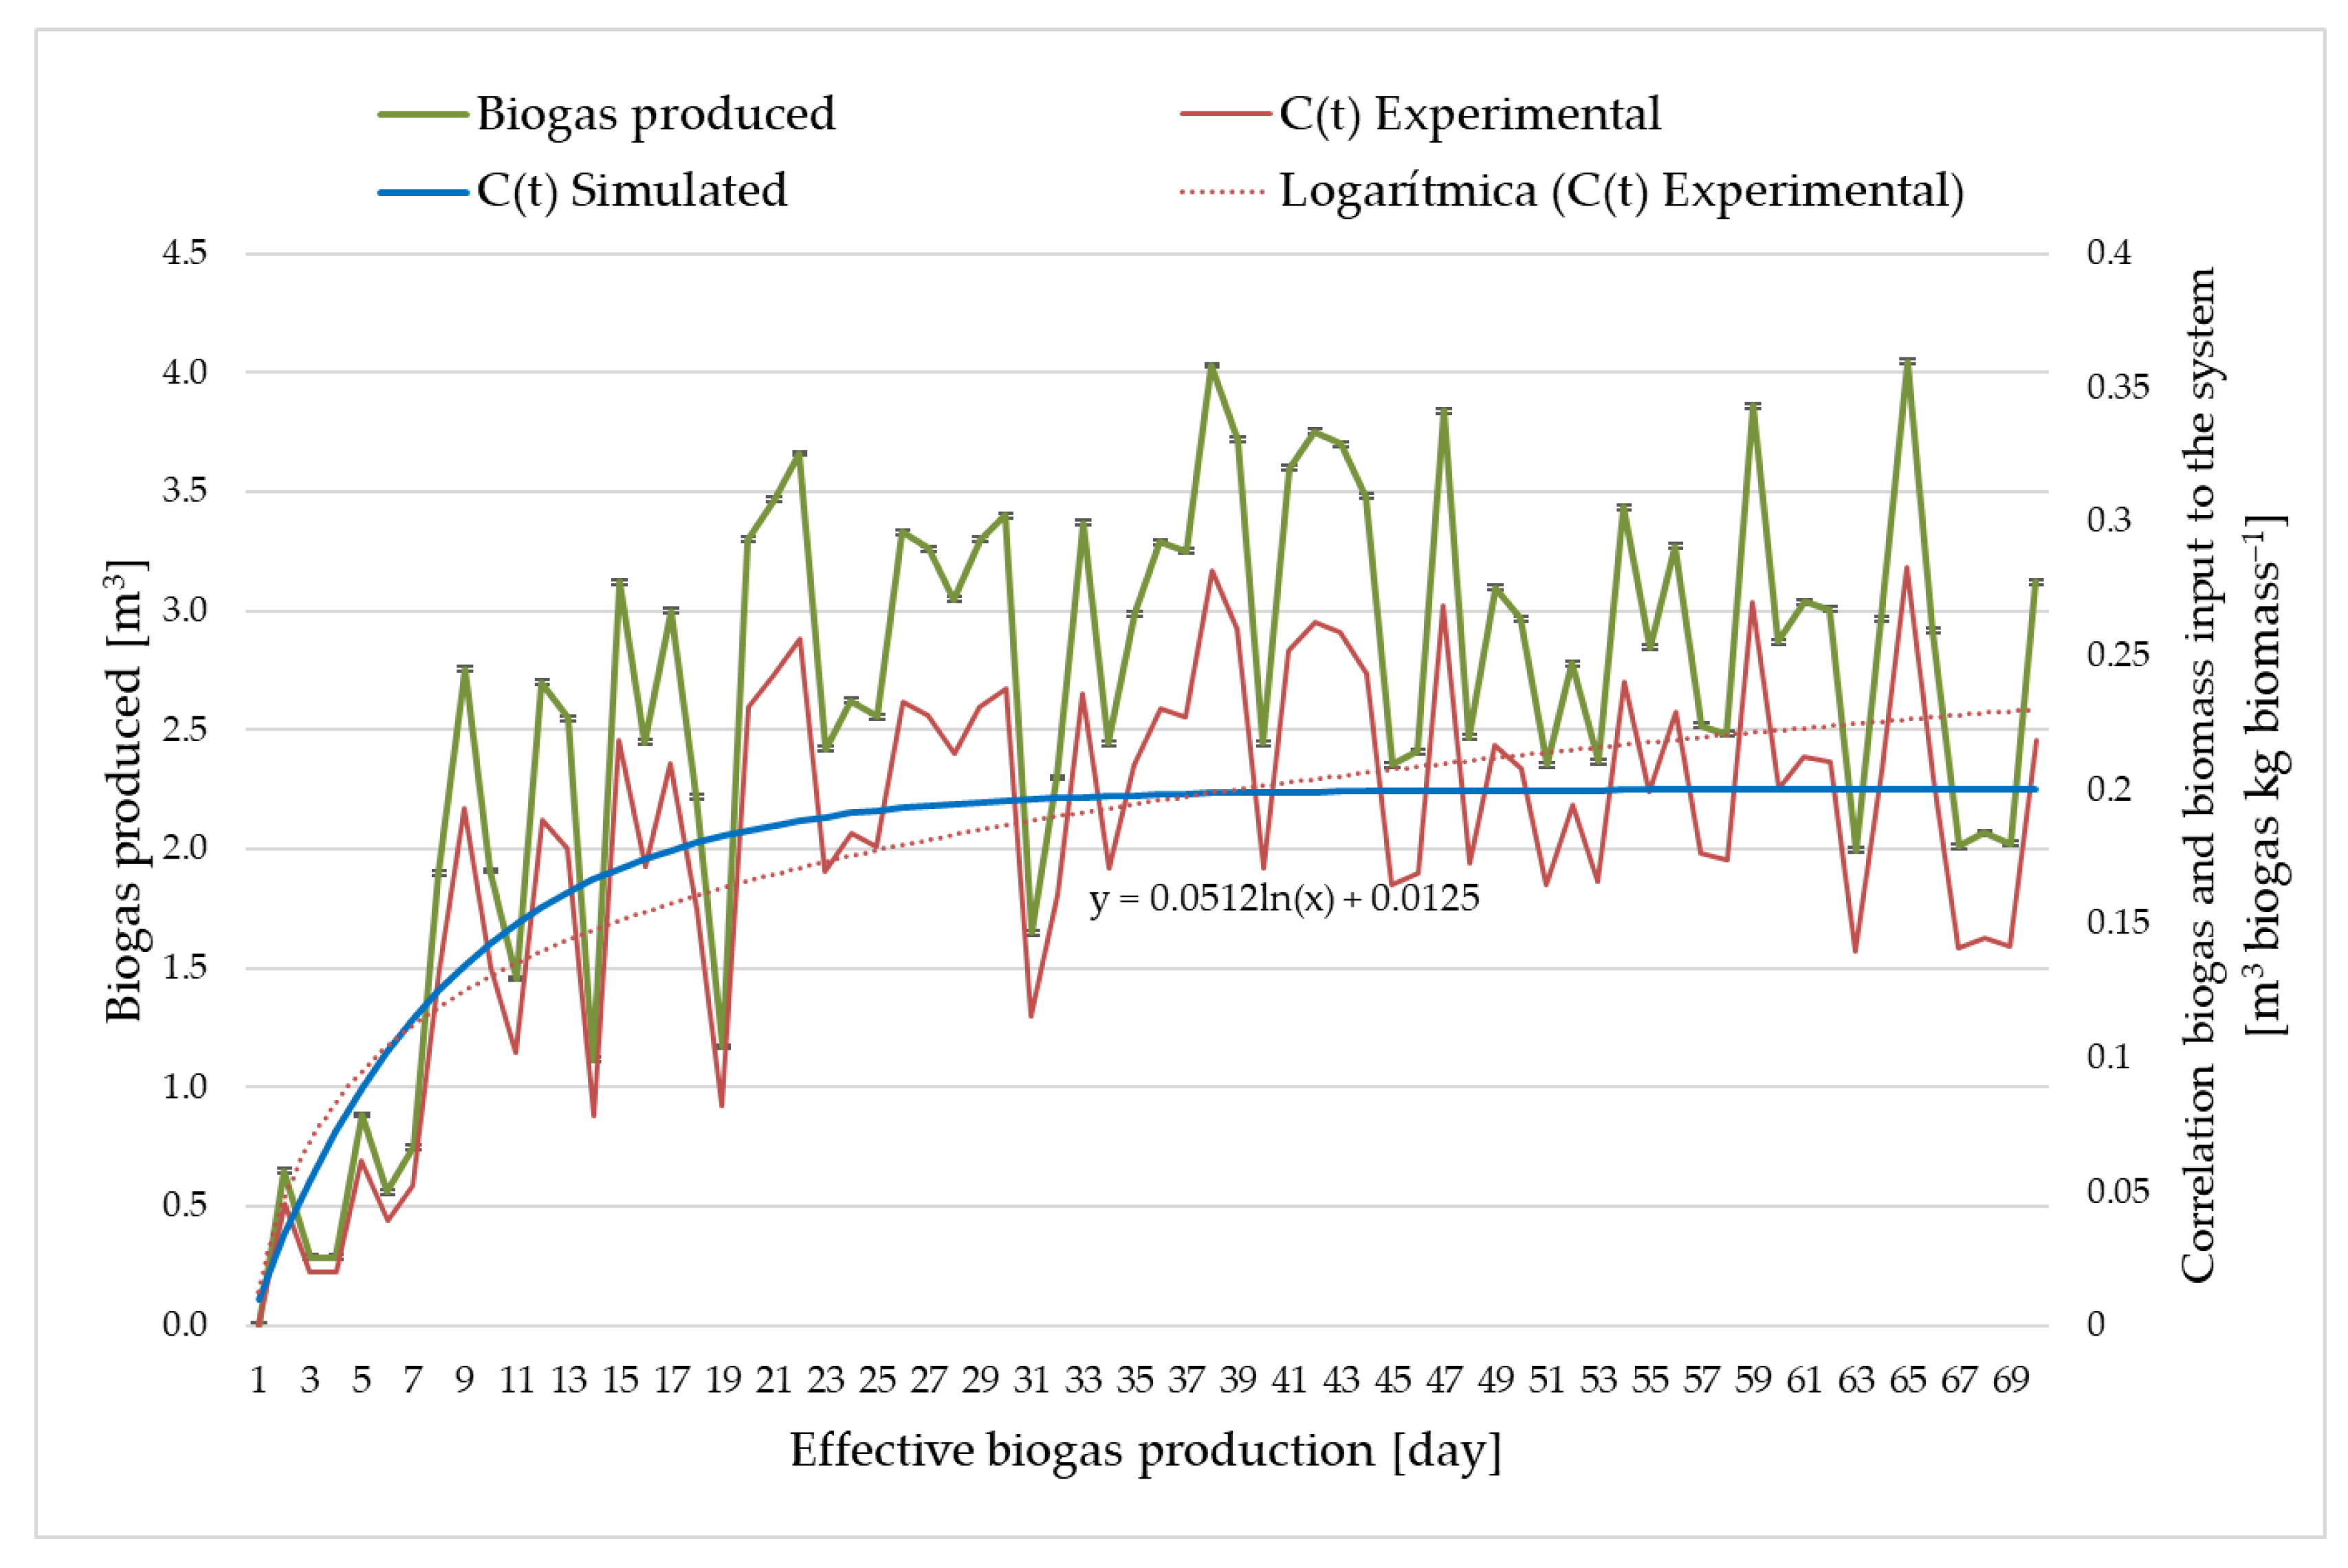
3.2. Ph-B—Results of the Characterisation of the Biogas Production Model for Td (Continuous Biomass Flow and Non-Stationary Systems—BgMod)

Monitored over a period of approximately 90 days, the biogas production behaviour proved to be particularly interesting, as gas production was first observed on day 20, earlier than the theoretically expected onset at around 30 days [7,17]. Consistent feeding of the biodigester and high ambient temperatures, with daytime peaks reaching 39 °C, contributed to this early onset of biogas production, consistent with findings reported by [19,20]. The system reached a biogas production peak of 4.03 m3 on day 58 (day 38 of effective biogas production), with an average production of 2.69 m3 d−1 throughout the monitoring period, results that are also aligned with those reported in similar contexts [21,22].
Regarding the correlation between biogas volume produced and biomass input, the case study yielded a value of 0.21 m3 of biogas per kg of biomass. Although slightly lower, this result follows the trend of average correlations reported in the literature (0.31 to 0.42 m3 kg−1) [8,42]. It is expected that the correlation value would approach the theoretical average with a longer stabilisation period of the anaerobic digestion (AD) process. The biogas produced was used for combustion tests in one of the community households. The biogas production monitoring results are presented in Figure 4 (green line), showing a fluctuating but overall upward trend.
Based on the experimental production data, a kinetic constant was also estimated (k = 0.0512 d−1). This constant was applied in the model, using operational data to simulate biogas production under continuous flow and non-stationary conditions, assuming plug-flow behaviour and a pseudo first-order production model. The simulation results in terms of biogas produced (m3) per kg of biomass added were encouraging: the average difference between the experimental and simulated correlations was only 16.7%, and during the final monitoring phase, the difference decreased to just 10.4% (Figure 4). These results suggest that the AD process was still in a consolidation phase and that, with extended monitoring, experimental and simulated models would likely converge further. The identified BioMat model is considered a useful tool for rapidly and simply simulating future biogas production scenarios in contexts and operational conditions similar to the case study.

3.3. Ph-C— Quantification of Environmental, Social/Health, Technical, and Economic Benefits from the Implementation of Biogas in the Case Study

The main results of the benefits of biogas implementation can be seen in Table 2. Results based on calculation methodological considerations, for S1: Firewood required for food preparation for a rural household of six members: 15.6 kg per day. In some cases, peasant families use a GLP tank of 40 pounds connected to a gas stove; the tank is recharged or changed once every 30 days. When the gas is over, a mud stove fed with firewood is used. In the S2, a wood-fired 0.5-ton citronella essential oil pilot plant requires 1500 kg monthly. This design ensures sustainable small-scale production while maintaining consistent steam quality for effective oil extraction. Table 2 summarises the quantified environmental, social/health, technical, and economic benefits observed during the biogas implementation in the case study. It also presents targeted actions and recommendations derived from the experimental process, structured by impact category to support replication and address key implementation barriers. These proposed measures align with previously established frameworks and approaches in the literature [9,10,11,25,26,27].
The results confirm the sustainability of the biogas implementation model in both domestic cooking scenarios—substituting firewood or LPG—and productive applications, such as replacing firewood for heat in essential oil distillation. Biogas production contributes to reducing deforestation by displacing firewood demand, thereby helping to preserve ecosystem services and biodiversity. Furthermore, biogas systems support climate change mitigation by capturing methane from organic waste streams, avoiding uncontrolled emissions during anaerobic decomposition in open environments or untreated manure storage [47]. By reducing the burden of firewood collection, particularly for women, biogas also enables time reallocation toward education, entrepreneurship, or community leadership, fostering local development and gender equity. These findings align with the perspectives highlighted by various authors [6,7,8,25,26,27,28].

3.4. Framework for Implementing Appropriate Biogas Technologies on Rural Communities/Rural Farms

Finally, this research proposes a comprehensive stepwise framework to replicate community-based biogas production systems in rural areas with similar socio-environmental conditions. The general structure of this model is illustrated in Figure 5, which outlines the integration of technical components, organisational strategies, and resource flows. Central to this approach is a Multi-Criteria Analysis (MCA), which supports context-specific decision-making by incorporating environmental, technical, economic, and socio-gender dimensions. In general terms, the following methodological steps are proposed: Step 1: Identification in the study system of the potential of solid or liquid biomass waste from human, animal, agricultural crops, and community production processes; Step 2: Identification of heat requirements in food preparation activities in households and productive activities; Step 3. Definition of the type of biodigester: design, construction, operating conditions, maintenance, type of inoculum. Step 4: Definition of the role of the community organisational process and women farmers in managing the operation of the biodigester and its derivatives: biogas and digestate.
The model is grounded in appropriate technologies—such as Tubular biodigesters, wastewater pretreatment units, gas purification systems, and digestate reuse mechanisms—that are low-cost, easy to maintain, and adaptable to diverse rural settings. These systems enhance circularity and energy self-sufficiency by valorising locally available organic biomass from agricultural and household sources. Crucially, organisational capacity is essential for ensuring system maintenance, fostering collective ownership, and enabling inclusive participation. The engagement of rural families—particularly women’s groups and community associations—reinforces local governance and avoids disproportionate burdens, especially regarding system upkeep and biogas handling. The biogas produced is intended not only for household cooking but also for technical requirements of local productive activities, such as food transformation or essential oil distillation, strengthening rural livelihoods and value chains. In doing so, the model contributes to the construction of decentralised and community-driven energy solutions, supporting the broader goal of a just energy transition in the Global South. This replicable pathway advances energy sovereignty, climate mitigation, and socially inclusive development, consistent with recent academic contributions [4,6,10,16]. Finally, it is important to highlight that this research aimed to serve as a theoretical–practical exercise, contributing both innovatively and technically by successfully implementing a biodigester system in a highly vulnerable rural area of Colombia. This territory, marked by ongoing armed conflict and limited economic resources, presented significant challenges for intervention. However, the initiative fostered organisational strengthening through small-scale pig farming and the valorisation of animal waste, promoting local resilience and reducing the risk of forced displacement. These findings align with the approaches of previous research focused on sustainable livelihoods and territorial permanence in conflict-affected rural settings [34,35,36,44].

4. Conclusions

This research paper confirms the sustainability and replicability of the Tubular biodigester Tb for biogas production as an effective alternative to firewood and LPG use in low-income rural settings of the Global South, through a three-phase validation—including Multi-Criteria Analysis (MCA), field monitoring, process simulation using the BgMod model—and the quantification of environmental benefits. Identified as the main weighted criterion the use of small-scale technologies and low-cost access (C8), with a score of 0.44 points, as well as to the Tubular Tb, identified as the optimal system, scoring 8.1 points and achieving an average biogas yield of 2.6 m3 d−1 over a 90-day period with average correlation 0.21 m3 Biogas kg Biomass−1. The model showed good predictive performance, with a mean deviation of 10.4% in the final production phase. Biogas substitution of firewood reached 83.1% for household cooking (S1) and 24.1% for productive applications (S2), with an associated reduction of 0.52 tons CO2eq month−1 in atmospheric emissions. These results highlight the potential of decentralised biogas systems to mitigate environmental and health impacts while improving energy access in rural communities. The proposed framework offers a scalable solution for regions with similar socio-environmental and economic conditions.
This research is constrained by its limited scale, context-specific conditions, and lack of long-term performance data. Future research should assess system durability, seasonal fluctuations in biogas production, and nutrient recovery from digestate. Further exploration is also needed on the replicability of the model in diverse rural settings, its integration into crop–livestock systems, and the pivotal role of community engagement—especially women’s participation—in the management of decentralised biogas technologies to advance energy sovereignty and environmental sustainability.

Author Contributions

Conceptualisation, F.H.G., N.J.V. and C.M.M.; methodology, C.M.M. and N.J.V.; validation, F.H.G., K.C.T. and M.V.; formal analysis, F.H.G., C.M.M. and N.J.V.; investigation, F.H.G. and C.M.M.; resources, K.C.T. and F.H.G.; data curation, F.H.G. and N.J.V.; writing—original draft preparation, F.H.G. and N.J.V.; writing—review and editing, K.C.T. and M.V.; visualisation, N.J.V. and C.M.M.; supervision, K.C.T. and M.V.; project administration, K.C.T., F.H.G. and M.V.; funding acquisition, F.H.G., M.V. and K.C.T. All authors have read and agreed to the published version of the manuscript.

Funding

This research received no external funding.

Institutional Review Board Statement

Not applicable.

Informed Consent Statement

Not applicable.

Data Availability Statement

All data generated or analysed during this study are included in this published article.

Acknowledgments

The authors highlight that this paper was made possible thanks to the academic collaboration agreement between the Research Center on Appropriate Technologies for Environmental Management in Limited Resources Countries (CeTAmb) of the University of Brescia (Italy), the UNIPAZ Instituto Universitario de la Paz (Colombia) and the Peasant Association of the Cimitarra River Valley ACVC (Colombia). The authors would like to thank Federico Foltran, student at the Politecnico di Milano (Italy), for his theses in Energy Engineering, which was an important input for the present paper. The authors also extend gratitude to the “Colombia Científica/Bio-reto” Project of the CENIVAM Research Centre at the Industrial University of Santander (Bucaramanga/Colombia), whose efforts led to the installation of the essential oil extraction pilot plant in Puerto Matilde. Likewise, we acknowledge the association Engineers Without Borders of Milan (Italy) ISF-Milano, who laid the groundwork for the initial implementation of biogas in the ZRC-VRC. Our thanks also go to the Ministry of Energy of Colombia and its Biogas-Based Energy Communities program for enabling the repowering of the biodigester installed in Puerto Matilde (Colombia).

Conflicts of Interest

The authors declare no conflict of interest.

Abbreviations

The following abbreviations are used in this manuscript:
ADAnaerobic Digestion
BODBiological Oxygen Demand
BgModContinuous Biogas flow and non-stationary system Model
CODChemical oxygen demand
GCGeneral criteria
HRTHydraulic retention time
LPGLiquefied Petroleum Gas
MCAMulti-Criteria Analysis
OLROrganic Load Rate
TbTubular biodigester
WWsSwine Wastewater
ZRC-VRCPeasant Reserve Zone of the Cimitarra River Valley

Appendix A

Figure A1. Physical map of the ZRC-VRC in Colombia [30]. Location of the community of Puerto Matilde (N 07°0.233′ W 074°12.151′), where the pilot plants for the production of biogas and essential oils are located. The light green area of the map corresponds to the currently established ZRC-VRC and the violet area of the map corresponds to the planned expansion of the ZRC-VRC.
Sustainability 17 06806 g0a1
Table A1. Assignment of weights to the criteria by comparison in pairs. The matrix of the weights is related. The scale that provides a relationship between qualitative and numerical values is the relative importance scale according to which the given value (between 1 and 9) represents the relative importance between the two criteria: Equal 1; Weak 3; Significant 5; Strong 7; Absolute 9; Intermediate values 2, 4, 6, 8.
Impact CategoryCodeGeneral Impact CriteriaC1C2C3C4C5C6C7C8C9C10C11C12
Environmental C1Pollutant emissions in water, air, and soil.1.00.44.00.50.30.20.30.30.22.01.50.3
C2Consumption of natural resources and raw materials (wood, water, fuel consumption, or non-renewable energy).2.51.01.131.01.00.71.03.00.43.52.52.0
C3Deforestation in areas with high biodiversity.0.32.21.00.40.30.40.30.70.41.51.50.7
Social/ HealthC4Effects on human health and local biodiversity.2.01.03.01.01.01.00.71.50.73.02.52.0
C5Organisational culture of the local community.3.01.03.01.01.00.71.51.50.53.53.52.0
C6Living conditions of the local community.4.01.53.01.01.51.01.01.51.503.53.02.0
TechnicalC7Use of local resources and reproducibility.4.01.03.01.50.71.01.01.51.04.02.52.0
C8Use of small-scale technologies and access for low cost.4.00.32.00.70.70.70.71.00.33.02.01.2
C9Ease of management.5.52.53.02.02.00.71.03.01.03.53.01.0
EconomicC10Technological development and investment in infrastructure. 0.60.30.70.30.30.30.20.30.31.00.70.6
C11Generation of employment and development of the local economy.0.70.40.70.40.30.30.40.50.31.51.01.2
C12Incentive to the local market/Biogas-based energy community3.00.71.50.70.70.70.71.21.02.51.71.0
Table A2. Average of the relative weight weighted by each criterion: weight of the standardised criterion.
Impact CategoryGeneral CriteriaNormalised Value for Each CriterionAverage of Weighting Factor by Each Criterion
C1C2C3C4C5C6C7C8C9C10C11C12
EnvironmentalC10.0960.0970.4760.1450.1000.1010.0930.0480.0760.2010.1900.0650.141
C20.2400.2320.1340.2890.2990.3040.3480.5440.1620.4440.3170.3920.309
C30.0260.5220.1190.1090.1000.1520.1160.1210.1460.1900.1900.1470.161
Social/HealthC40.1920.2320.3570.2890.2990.4050.2610.2720.2590.3810.3170.3920.305
C50.2880.2320.3570.2890.2990.3040.5220.2720.1950.4440.4440.3920.337
C60.3840.3480.3570.2890.4480.4050.3480.2720.5840.4440.3810.3920.388
TechnicalC70.3840.2320.3570.4340.2240.4050.3480.2720.3890.5070.3170.3920.355
C80.3840.0770.2380.2170.2240.3040.2610.1810.1300.3810.2540.2450.241
C90.5280.5800.3570.5790.5970.3040.3480.5440.3890.4440.3810.1960.437
EconomicC100.0640.0680.0890.0960.0870.1180.0930.0600.1130.1270.0950.1230.095
C110.0720.0970.0890.1210.0870.1350.1450.0910.1300.1900.1270.2290.126
C120.2880.1550.1780.1930.1990.2700.2320.2270.3890.3170.2220.1960.239
Table A3. Final scores. Each criterion was assigned a value between 1 and 3. The final impact score for each criterion was obtained by multiplying the relative weights of each criterion by the score given.
Impact CategoryCod.General Impact CriteriaWeighting Factor by Each CriterionFixed Dome Digester
(Score)
Floating Drum DigesterTubular DigesterFixed Dome Digester
(Final Score)
Floating Drum Digester
(Final Score)
Tubular Digester
(Final Score)
Environmental C1Pollutant emissions in water, air, and soil.0.1412.352.511.740.330.350.24
C2Consumption of natural resources and raw materials (wood, water, fuel consumption, or non-renewable energy).0.3092.872.682.650.820.820.81
C3Deforestation in areas with high biodiversity.0.1612.862.952.950.460.480.48
Social/HealthC4Effects on human health and local biodiversity.0.3052.452.412.130.910.930.91
C5Organisational culture of the local community.0.3372.512.672.380.780.860.97
C6Living conditions of the local community.0.3882.072.352.740.640.720.85
TechnicalC7Use of local resources and reproducibility.0.3551.731.612.560.160.150.24
C8Use of small-scale technologies and access for low cost.0.2412.171.852.520.950.811.15
C9Ease of management.0.4371.221.662.860.370.400.69
EconomicC10Technological development and investment in infrastructure. 0.0952.532.742.470.900.970.88
C11Generation of employment and development of the local economy.0.1261.411.581.660.180.200.21
C12Incentive to the local market/Biogas-based energy community0.2392.772.822.860.660.670.68
Final score total:7.157.378.11
Figure A2. Sequence of images of the facilities in study area 1.
Sustainability 17 06806 g0a2aSustainability 17 06806 g0a2b

References

  1. World Health Organization (WHO). Household Air Pollution and Health. 2021. Available online: https://www.who.int/news-room/fact-sheets/detail/household-air-pollution-and-health (accessed on 17 May 2025).
  2. Gould, C.F.; Urpelainen, J. LPG as a clean cooking fuel: Adoption, use, and impact in rural India. Energy Policy 2018, 122, 395–408. [Google Scholar] [CrossRef]
  3. Garfí, M.; Ferrer-Martí, L.; Velo, E.; Ferrer, I. Evaluating benefits of low-cost household digesters for rural Andean communities. Renew. Sustain. Energy Rev. 2012, 16, 575–581. [Google Scholar] [CrossRef]
  4. Cellini, M.; Loos, S.; Mirenda, C.; Pisacane, L.; Striebing, C.; Tagliacozzo, S. Exploring the nexus of gender and energy transitions: A systematic literature review. Energy Res. Soc. Sci. 2024, 119. [Google Scholar] [CrossRef]
  5. Miller, C.; Pereira Coronel, L.C.; Pirelli, T.; Morese, M. Stocktaking Paper—Regional Analysis of Biogas Value Chains; FAO: Rome, Italy, 2020; Available online: https://www.fao.org/3/cc7032en/cc7032en.pdf (accessed on 15 May 2025).
  6. Villamor, G.B. Gender and Water-Energy-Food Nexus in the Rural Highlands of Ethiopia: Where Are the Trade-Offs? Land 2023, 12, 585. [Google Scholar] [CrossRef]
  7. Shrestha, R.P.; Jirakiattikul, S.; Chapagain, B.; Katuwal, H.; Gyawali, S.; Shrestha, M. Biogas adoption and its impact on women and the community: Evidence from Nepal. Int. J. Environ. Stud. 2024, 81, 537–553. [Google Scholar] [CrossRef]
  8. Garfí, M.; Martí-Herrero, J.; Garwood, A.; Ferrer, I. Household anaerobic digesters for biogas production in Latin America: A review. Renew. Sustain. Energy Rev. 2016, 60, 599–614. [Google Scholar] [CrossRef]
  9. Surendra, K.C.; Takara, D.; Jasinski, J.; Khanal, S.K. Household anaerobic digester for bioenergy production in developing countries: Opportunities and challenges. Environ. Technol. 2013, 34, 1671–1689. [Google Scholar] [CrossRef]
  10. Tavera-Ruiz, C.; Martí-Herrero, J.; Mendieta, O.; Jaimes-Estévez, J.; Gauthier-Maradei, P.; Azimov, U.; Escalante, H.; Castro, L. Current understanding and perspectives on anaerobic digestion in developing countries: Colombia case study. Renew. Sustain. Energy Rev. 2023, 173, 113097. [Google Scholar] [CrossRef]
  11. Nzila, C.; Dewulf, J.; Spanjers, H.; Tuigong, D.; Kiriamiti, H.; van Langenhove, H. Multi criteria sustainability assessment of biogas production in Kenya. Appl. Energy 2012, 93, 496–506. [Google Scholar] [CrossRef]
  12. Garfì, M.; Ferrer-Martí, L. Decision-making criteria and indicators for water and sanitation projects in developing countries. Water Sci. Technol. 2011, 64, 83–101. [Google Scholar] [CrossRef]
  13. Garfì, M.; Tondelli, S.; Bonoli, A. Multi-criteria decision analysis for waste management in Saharawi refugee camps. Waste Manag. 2009, 29, 2729–2739. [Google Scholar] [CrossRef]
  14. Collivignarelli, M.C.; Gomez, F.H.; Caccamo, F.M.; Sorlini, S. Reduction of pathogens in greywater with biological and sustainable treatments selected through a multicriteria approach. Environ. Sci. Pollut. Res. 2022, 30, 38239–38254. [Google Scholar] [CrossRef]
  15. Gomez, F.H.; Pelegri, N.; Lopez, J.G.; Torres, K.C.; Vaccari, M. Impact of Artisanal Gold Mining in Community Conserved Areas with High Biodiversity Using a Multi-Criteria Approach: A Case Study in Colombia. Pollutants 2024, 4, 276–290. [Google Scholar] [CrossRef]
  16. Luna-Delrisco, M.; González, C.A.; Mendoza-Hernández, S.; Vanegas-Trujillo, E.; Meneses, L.d.R.; Rio, J.S.-D.; Castillo-Meza, L.E.; Santos-Ballardo, D.U.; Montoya, J.P.G. Evaluating the socio-economic drivers of household adoption of biodigester systems for domestic energy in rural Colombia. Sustain. Energy Technol. Assess. 2024, 73, 104146. [Google Scholar] [CrossRef]
  17. Kinyua, M.N.; Rowse, L.E.; Ergas, S.J. Review of small-scale tubular anaerobic digesters treating livestock waste in the developing world. Renew. Sustain. Energy Rev. 2016, 58, 896–910. [Google Scholar] [CrossRef]
  18. Martí-Herrero, J.; Chipana, M.; Cuevas, C.; Paco, G.; Serrano, V.; Zymla, B.; Heising, K.; Sologuren, J.; Gamarra, A. Low cost tubular digesters as appropriate technology for widespread application: Results and lessons learned from Bolivia. Renew. Energy 2014, 71, 156–165. [Google Scholar] [CrossRef]
  19. Alvarez, R.; Lidén, G. Semi-continuous co-digestion of solid slaughterhouse waste, manure, and fruit and vegetable waste. Renew. Energy 2008, 33, 726–734. [Google Scholar] [CrossRef]
  20. Garfí, M.; Gelman, P.; Comas, J.; Carrasco, W.; Ferrer, I. Agricultural reuse of the digestate from low-cost tubular digesters in rural Andean communities. Waste Manag. 2011, 31, 2584–2589. [Google Scholar] [CrossRef]
  21. Esposito, G.; Frunzo, L.; Liotta, F.; Panico, A.; Pirozzi, F. Bio-Methane Potential Tests to Measure the Biogas Production from The Digestion and Co-Digestion of Complex Organic Substrates. Open Environ. Eng. J. 2012, 5, 1–8. [Google Scholar] [CrossRef]
  22. Rajendran, K.; Aslanzadeh, S.; Taherzadeh, M.J. Household Biogas Digesters—A Review. Energies 2012, 5, 2911–2942. [Google Scholar] [CrossRef]
  23. Surendra, K.; Takara, D.; Hashimoto, A.G.; Khanal, S.K. Biogas as a sustainable energy source for developing countries: Opportunities and challenges. Renew. Sustain. Energy Rev. 2014, 31, 846–859. [Google Scholar] [CrossRef]
  24. Martí-Herrero, J. Reduced hydraulic retention times in low-cost tubular digesters: Two issues. Biomass Bioenergy 2011, 35, 4481–4484. [Google Scholar] [CrossRef]
  25. Rocha-Meneses, L.; Luna-Delrisco, M.; González, C.A.; Moncada, S.V.; Moreno, A.; Rio, J.S.-D.; Castillo-Meza, L.E. An Overview of the Socio-Economic, Technological, and Environmental Opportunities and Challenges for Renewable Energy Generation from Residual Biomass: A Case Study of Biogas Production in Colombia. Energies 2023, 16, 5901. [Google Scholar] [CrossRef]
  26. Pizarro-Loaiza, C.; Antón, A.; Torrellas, M.; Torres-Lozada, P.; Palatsi, J.; Bonmatí, A. Environmental, social and health benefits of alternative renewable energy sources. Case study for household biogas digesters in rural areas. J. Clean. Prod. 2021, 297, 126722. [Google Scholar] [CrossRef]
  27. Lazaro, L.L.B.; de Aquino Neiva, S.; Serrani, E. Energy Poverty, Justice, and Gender in Latin America—Understanding the Intersection. In Energy Poverty, Justice and Gender in Latin America; Lazaro, L.L.B., Neiva, S.d.A., Serrani, E., Eds.; Springer: Cham, Switzerland, 2024. [Google Scholar] [CrossRef]
  28. Deublein, D.; Steinhauser, A. Anaerobic Digestion of Biowaste in Developing Countries: Practical Information and Case Studies; IWA Publishing: Dübendorf, Switzerland, 2011; Available online: https://www.eawag.ch/fileadmin/Domain1/Abteilungen/sandec/publikationen/SWM/Anaerobic_Digestion/biowaste.pdf (accessed on 15 May 2025).
  29. ACVC. Asociación Campesina del Valle del Río Cimitarra, Instituto Colombiano de Desarrollo Rural,; Corporación Desarrollo y Paz del Magdalena Medio. Actualización del Plan de Desarrollo Sostenible ZRC-VRC. Barrancabermeja (Colombia). 2012. Available online: https://reservacampesinariocimitarra.org/wp-content/uploads/2022/07/PLAN-DE-DESARROLLO-ZRC-VALLE-RIO-CIMITARRA-2_compressed.pdf (accessed on 1 June 2025).
  30. ACVC. Asociación Campesina del Valle del Río Cimitarra, UNDP and Soluterra. Estudio Participativo de Tenencia de la Tierra y el Territorio, Usos y Conflictos en La Zona de Reserva Campesina Del Valle Del Río Cimitarra—Cartografía. BARRANCA-BERMEJA—Colombia. 2014. Available online: https://reservacampesinariocimitarra.org/wp-content/uploads/2022/07/Informe-final-PNUD-ACVC-20072014-4_compressed.pdf (accessed on 2 June 2025).
  31. ACVC. Asociación Campesina del Valle del Río Cimitarra, Fondo Acción, Conserva Colombia. Biodiversity Assessment of the Caño Negro and Cimitarra River Marsh Complex in the Cimitarra River Valley Peasant Reserve Zone. Colombia. Barranca-bermeja. Junio de 2017. 2017. Available online: https://reservacampesinariocimitarra.org/informe-caracterizacion-biologica-de-la-zona-de-cienagas-del-valle-del-rio-cimitarra-colombia/ (accessed on 2 June 2025).
  32. Arbeláez-Cortés, E.; Villamizar-Escalante, D.; Trujillo-Arias, N. New voucher specimens and tissue samples from an avifaunal survey of the Middle Magdalena Valley of Bolívar, Colombia, bridge geographical and temporal gaps. Wilson J. Ornithol. 2020, 132, 773–779. [Google Scholar] [CrossRef]
  33. Trujillo-Arias, N.; Serrano-Cardozo, V.H.; Ramirez-Pinilla, M.P. Role of a Campesine Reserve Zone in The Magdalena Valley (Colombia) in The Conservation of Endangered Tropical Rainforests. Nat. Conserv. Res. 2023, 8, 1–15. [Google Scholar] [CrossRef]
  34. Duarte, J.; Mantilla, A.; Castaño, F. Diversity of Plant Uses by a Farming Community of Northwestern Colombia: A Quantitative Approach. Econ. Bot. 2023, 77, 153–168. [Google Scholar] [CrossRef]
  35. Molina, A. The Cimitarra River Valley Rural Reserve Zone: An Unfinished Exercise in Citizen Participation and Collective Management of Territory. Rev. Colomb. De Geogr. 2011, 20, 21–33. [Google Scholar] [CrossRef]
  36. Quijano-Mejia, C.M.; Linares-García, J. Zonas de Reserva Campesina: Territorialidades en disputa. El caso del Valle del río Cimitarra, Colombia. Prospectiva 2017, 225–251. [Google Scholar] [CrossRef]
  37. Falla, J.T.; Castrillón, C.A.R. The new rural dynamics in peasants reserve zones in Colombia. Perspect. Geogr. 2018, 23. [Google Scholar] [CrossRef]
  38. Ferrer, I.; Gamiz, M.; Almeida, M.; Ruiz, A. Pilot project of biogas production from pig manure and urine mixture at ambient temperature in Ventanilla (Lima, Peru). Waste Manag. 2009, 29, 168–173. [Google Scholar] [CrossRef]
  39. Lüer, M. Installation manual for Low-Cost Polyethylene Tube Digesters. 2010. Available online: https://energypedia.info/images/1/19/Low_cost_polyethylene_tube_installation.pdf (accessed on 5 February 2025).
  40. Martí-Herrero, J.; Cipriano, J. Design methodology for low cost tubular digesters. Bioresour. Technol. 2012, 108, 21–27. [Google Scholar] [CrossRef]
  41. Mayerle, S.F.; de Figueiredo, J.N. Designing optimal supply chains for anaerobic bio-digestion/energy generation complexes with distributed small farm feedstock sourcing. Renew. Energy 2016, 90, 46–54. [Google Scholar] [CrossRef]
  42. Qiao, W.; Yan, X.; Ye, J.; Sun, Y.; Wang, W.; Zhang, Z. Evaluation of biogas production from different biomass wastes with/without hydrothermal pretreatment. Renew. Energy 2011, 36, 3313–3318. [Google Scholar] [CrossRef]
  43. Giraldi, D.; de Michieli Vitturi, M.; Iannelli, R. FITOVERT: A dynamic numerical model of subsurface vertical flow constructed wetlands. Environ. Model. Softw. 2010, 25, 633–640. [Google Scholar] [CrossRef]
  44. Gomez, F.H.; Collivignarelli, M.C.; Bellazzi, S.; Torres, K.C.; Sorlini, S.; Vaccari, M. Mercury removal from mining wastewater by bioaccumulation and thermal separation in Eichhornia crassipes. Environ. Sci. Pollut. Res. 2024, 32, 798–810. [Google Scholar] [CrossRef]
  45. Collivignarelli, M.C.; Miino, M.C.; Gomez, F.H.; Torretta, V.; Rada, E.C.; Sorlini, S. Horizontal Flow Constructed Wetland for Greywater Treatment and Reuse: An Experimental Case. Int. J. Environ. Res. Public Health 2020, 17, 2317. [Google Scholar] [CrossRef]
  46. Jiménez-González, C.; Kim, S.; Overcash, M.R. Methodology for developing gate-to-gate Life cycle inventory information. Int. J. Life Cycle Assess. 2000, 5, 153–159. [Google Scholar] [CrossRef]
  47. IPCC. 2019 Refinement to the 2006 IPCC Guidelines for National Greenhouse Gas Inventories—Volume 4: Agriculture, Forestry and Other Land Use. Chapter 10: Emissions from Livestock and Manure Management. Available online: https://www.ipcc-nggip.iges.or.jp/public/2019rf/pdf/4_Volume4/19R_V4_Ch10_Livestock.pdf (accessed on 9 July 2025).
  48. Food and Agriculture Organization (FAO). Biogas from Anaerobic Digestion: Powering Green Growth; Technical Report; FAO: Rome, Italy, 2013; Available online: https://www.fao.org/4/i1273e/i1273e.pdf (accessed on 9 July 2025).
Figure 1. Block diagram of the proposed sustainability analysis for production and use of biogas in rural communities.
Sustainability 17 06806 g001
Figure 3. Contribution of GC to final impact scores (blue bars for Fixed Dome digester, green bars for Floating Drum digester, and orange bars for Tubular digester). C1: Pollutant emissions in water, air, and soil; C2: Consumption of natural resources and raw materials; C3: Deforestation in areas with high biodiversity; C4: Effects on human health and local biodiversity; C5: Organisational culture of the local community; C6: Living conditions of the local community; C7: Use of local resources and reproducibility; C8: Use of small-scale technologies and access for low cost; C9: Ease of management; C10: Technological development and investment in infrastructure.; C11: Generation of employment and development of the local economy; C12: Incentive to the local market/biogas-based energy community. The black line represents the normalised weighted scores for each criterion (weighted scores—Wsi).
Sustainability 17 06806 g003
Figure 4. Biogas production monitoring (green line); correlation between biogas produced per kg of biomass added experimental C(t) (dark red line); correlation between biogas produced per kg of biomass added simulated (blue line).
Sustainability 17 06806 g004
Figure 5. Stepwise frameworks for the implementation of appropriate biogas technologies in rural community-based systems. The red boxes represent the possible sources of organic waste from household and/or community production activities. The dark blue boxes represent the four suggested steps for developing the MCA. The light blue boxes represent some minimum aspects necessary for the proper functioning of the tubular biodigester. If the tubular biodigester is not working properly, the model suggests resuming the AMC to identify what is failing and find solutions.
Sustainability 17 06806 g005
Table 2. Quantification results of benefits from the implementation of biogas and key actions and recommendations to enhance biogas implementation.
Impact CategoryS1: For kitchen energy needs by family:
Wood-fired: 468 kg monthly or 1 LPG = 0.03 m3 monthly. Percentage of firewood substitution by biogas 83.1%
S2: For 0.5-ton citronella essential oil plant:
Wood-fired 1500 kg monthly. Percentage of firewood substitution by biogas 24.1%
Actions/Recommendations to be developed
EnvironmentalStop consuming the following amount of firewood per month= 388.4 kg. Emissions to the atmosphere would be avoided in one month by optimising the anaerobic process = 48.4 m3 CH4. Equivalent to tons of carbon dioxide (CO2) per month = 0.52 Ton CO2eq. Treatment of livestock wastewater that, if left untreated, will be a source of pollution and a health risk. The use of local organic waste improves circularity and resource sustainability, while proper digestate management and methane monitoring ensure environmental protection and system efficiency.
Social/HealthImprovements in Quality of Life: Effective reduction of indoor pollution from firewood use, reflected in the prevalence of chronic obstructive pulmonary disease (COPD), primarily among women. Biogas substitution for firewood improves indoor air quality and health, especially for women. Promoting women’s involvement in system management enhances gender equity and supports community-led energy transitions.
TechnicalUse of the biogas produced (2.6 m3 d−1) for heat requirements in household or productive activities. Monthly energy potential of the biogas produced = 520,516 Kcal month−1. Production of treated digestate: 275 L d−1 to be used as liquid fertiliser for forage crops or protein bank or the same citronella crop. Locally adapted systems using available materials and skills enable decentralised implementation. Simplified procedures and training foster user autonomy, while documenting pilot cases supports replication and technical scaling. Routine maintenance of rural pig waste biodigesters, particularly desludging to remove sediment, is typically required every 12 to 24 months [48].
EconomicMonthly savings on LPG purchase (1 cylinder of 40 pounds for a household): USD 30. Commercial fertilisers derived from hydrocarbons would no longer be consumed and would be replaced by coproducts derived from bioprocesses. Approximate monthly savings of USD 60 approx. Financial sustainability requires microfinancing, cost-sharing, and co-benefit valuation (e.g., fuel savings, biofertilisers). Cooperative models enhance scalability and community ownership.
Disclaimer/Publisher’s Note: The statements, opinions and data contained in all publications are solely those of the individual author(s) and contributor(s) and not of MDPI and/or the editor(s). MDPI and/or the editor(s) disclaim responsibility for any injury to people or property resulting from any ideas, methods, instructions or products referred to in the content.

