Article

Socio-Economic Analysis for Adoption of Smart Metering System in SAARC Region: Current Challenges and Future Perspectives

1
National University of Medical Sciences (NUMS), Rawalpindi 46000, Pakistan
2
U.S-Pakistan Centre for Advanced Studies in Energy, National University of Sciences and Technology (NUST), Islamabad 44000, Pakistan
3
National Transmission and Dispatch Company (NTDC), Islamabad 44000, Pakistan
4
Alternate Development Services (ADS), Islamabad 44000, Pakistan
*
Authors to whom correspondence should be addressed.
Sustainability 2025, 17(15), 6786; https://doi.org/10.3390/su17156786
Submission received: 30 May 2025 / Revised: 4 July 2025 / Accepted: 5 July 2025 / Published: 25 July 2025
(This article belongs to the Section Development Goals towards Sustainability)

Abstract

Cross-border energy trading activity via interconnection has received much attention in Southern Asia to help the South Asian Association for Regional Cooperation (SAARC) region’s energy deficit states. This research article proposed a smart metering system to reduce energy losses and increase distribution sector efficiency. The implementation of smart metering systems in utility management plays a pivotal role in advancing several Sustainable Development Goals (SDGs), i.e.; SDG (Affordable and Clean Energy), and SDG Climate Action. By enabling real-time monitoring, accurate measurement, and data-driven management of energy resources, smart meters promote efficient consumption, reduce losses, and encourage sustainable behaviors among consumers. The adoption of a smart metering system along with Strengths, Weaknesses, Opportunities, Threats (SWOT) analysis, socio-economic analysis, current challenges, and future prospects was also investigated. Besides the economics of the electrical distribution system, one feeder with non-technical losses of about 16% was selected, and the cost–benefit analysis and cost–benefit ratio was estimated for the SAARC region. The import/export ratio is disturbing in various SAARC grids, and a solution in terms of community microgrids is presented from Pakistan’s perspective as a case study. The proposed work gives a guidelines for SAARC countries to reduce their losses and improve their system functionality. It gives a composite solution across multi-faceted evaluation for the betterment of a large region.

Graphical Abstract

1. Introduction

The generation of electrical power in most developing nations is being carried out by the private as well as the public sectors. Several types of energy meters are used to measure consumer’s power usage. In response to significant technological improvements, traditional energy meters are being phased out in developed countries [1]. With the emergence of diverse power electronic loads, these conventional meters may not perform in the expected economical way. However, distribution companies in SAARC countries still depend on the use of traditional energy meters to quantify electricity needs [2]. Electricity consumers have difficulties since they are ignorant of their precise energy usage and hence cannot assist in reducing the nationwide peak electricity demand. Globally, there is a yearly economic loss of around USD 89 billion on account of power theft and inefficiencies of conventional energy metering system. At the distribution end, a smart metering system can minimize these losses and might help in lowering the energy use, thereby reducing the carbon footprint [3,4]. The deployment of a smart metering system requires complete replacement of the existing conventional metering network, but this comes with its own set of challenges, like availability of the capital cost, complexities associated with the installation, social acceptance, network coverage challenges, and security, and privacy concerns [5,6].
Smart meters improve energy performance and reduce costs and energy demands. A smart meter is a programmable electronic device that may efficiently measure the electricity usage, communicates with utilities, and monitors and manages the power consumption of home appliances. Smart meters also assist utilities in transmitting electricity usage and pricing information to consumers [7].
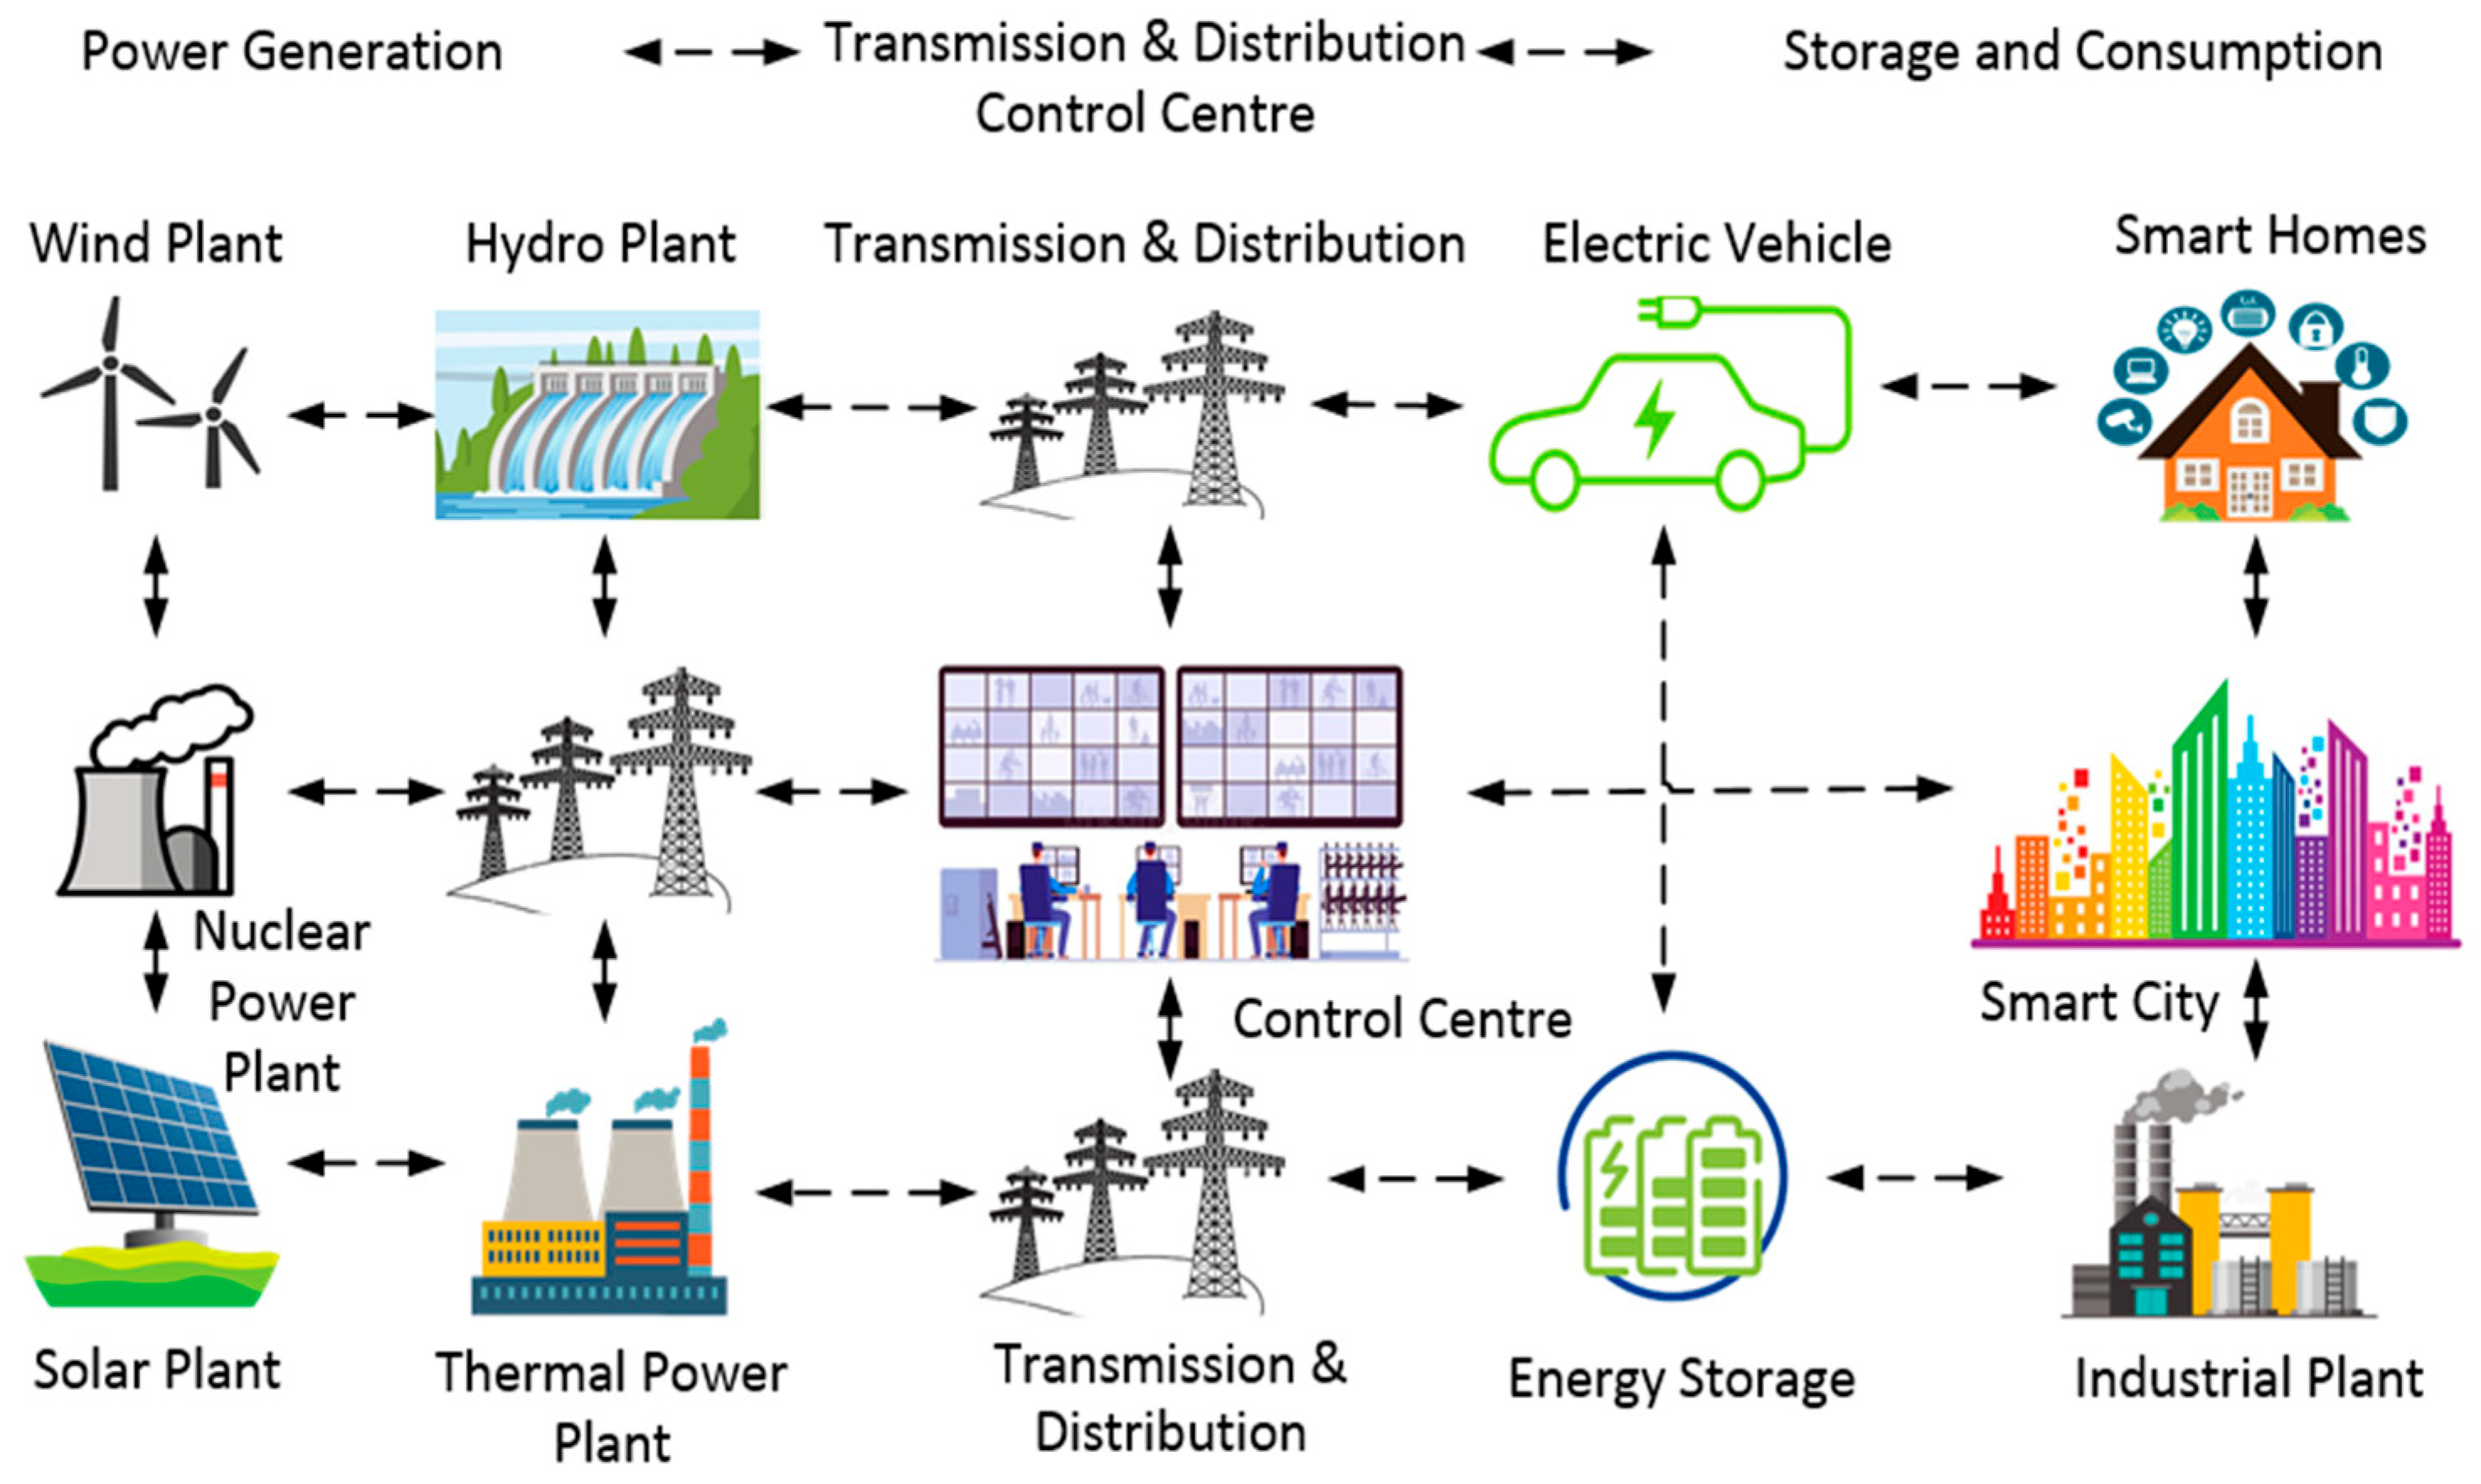
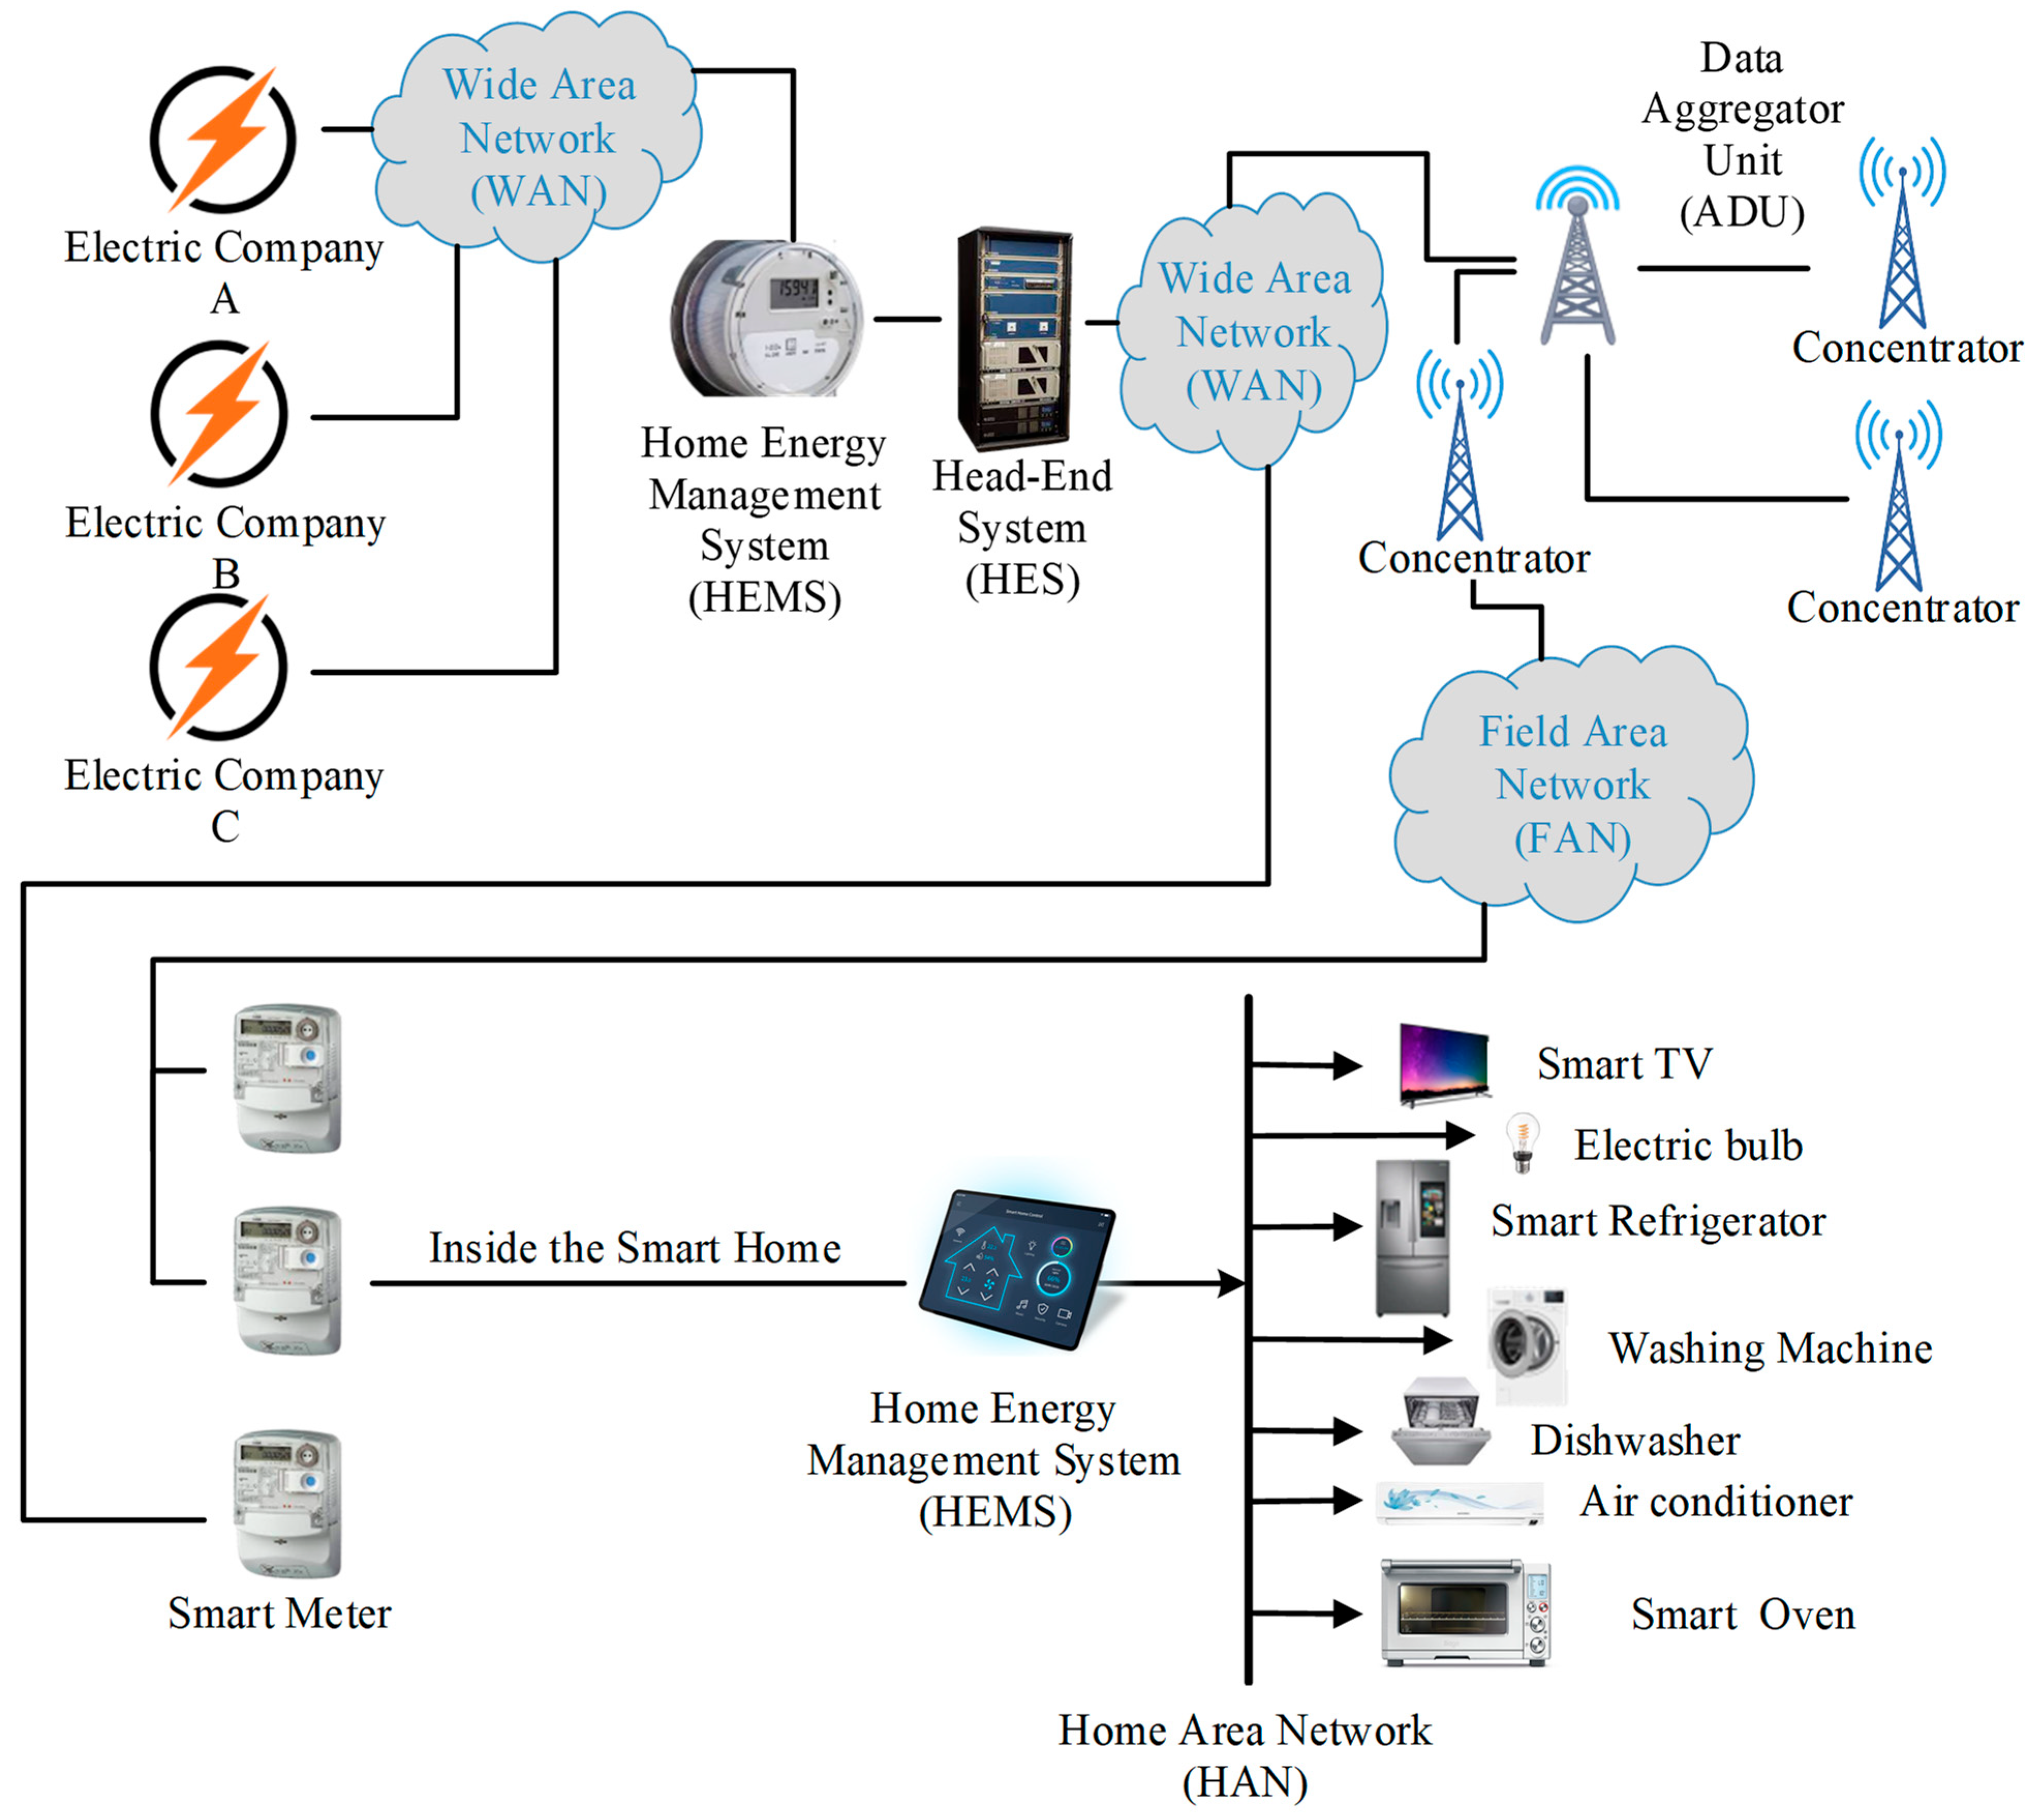
Figure 1 illustrates a smart grid with Distributed Generation (DG) sources, traditional generators, fossil fuel-based power plants, Renewable Energy Systems (RES), and loads such as electric vehicles (EVs), industrial plants, smart buildings, and a data center that directs the complete communication infrastructure. Furthermore, Figure 2 exhibits the smart metering infrastructures connected to the communication and security networks. A smart metering system technology primarily consists of communication, metering, and control unit. Some advanced smart meters also come up with a micro-controller having an analogue to digital converter that is used to process the large amount of data and then perform several calculations efficiently [8,9]. To accurately measure the power supply, voltage and current sensors were used. The measured data from sensors was converted into digital data using an analogue to digital-converter and fed to the microcontroller [10]. Then the microcontroller sensitively calculated the total power usage using this digital data. The Electrically Erasable Programmable Read-Only Memory (EEPROM) device is available to store the measured data. To connect or disconnect the power supply, the control unit of the smart meters is used while power usage and other useful information are demonstrated in the display section [11,12]. As a part of “demand response”, the utility companies can send different tariff rates based on “Time of Use” to their consumers with the help of smart meters. Consumers may instantaneously access their electricity consumption data using an in-house display (IHD) [13,14].
Moreover, the utility can use smart meters to reduce energy use, as they will have the ability to remotely connect or disconnect the various home appliances being used by customers [15,16]. To combat electricity theft, smart meters play a vital role as they can instantly identify and can communicate tampering signals back to the utility. Distribution companies would be able to monitor the quality of the delivered electricity remotely, enhancing their operational and service skills [17,18]. Several communication technologies are employed worldwide to provide two-way communication between utility companies and customers. Previous literature recommended that radio-frequency mesh networks, cellular networks, and power line communication are the technologies most often employed globally [19,20].

1.1. Research Gaps and Novelty

This research focuses on the economic and social aspects of introducing smart metering systems in the SAARC countries. Several nations in the western hemisphere have already implemented this technology on an industrial and a domestic level. However, the social, economic, and environmental aspects related to the adoption of this smart technology in the realm of renewable resources have never been considered in the past. In this research work, emphasis is given to the social and environmental aspects of the smart metering system. The Strengths, Weakness, Opportunities, Threats (SWOT) analysis method is used to review different aspects of smart metering roll-out specifically in the SAARC countries. However, the cost–benefit analysis is performed to examine the economic analysis.
  • To conduct this research work, the electrical power system of Pakistan was taken as a reference among other SAARC countries, and the analysis was conducted by examining different aspects of the electrical distribution system in the region.
  • The cost-to-benefit ratio for the rollout of smart meters has been estimated for all SAARC nations.
  • Moreover, a comprehensive cost–benefit analysis was carried out in order to adopt a smart metering system in a single reference feeder, and the results were discussed.
  • The import/export ratio is disturbing in various SAARC grids, and a solution in-terms of community microgrids have presented from Pakistan’s perspective as a case study.
  • Prior studies focus on individualized feedback loops. SAARC’s collectivist cultural norms necessitate community-based feedback and consumption benchmarks, which is a noble contribution to the body of knowledge.

1.2. Analyze Power and Supply System in Pakistan

In order to carry out this research, Pakistan’s electrical power infrastructure is used as a reference among the SAARC nations. Economically, Pakistan is classified as semi-industrialized and is a developing nation. It has long been self-sufficient in terms of funding its power infrastructure. The electrical distribution companies (DISCOs) have made state-owned energy companies contributing to the planning and executing of developments in the energy sector. Conventional, unsustainable methods such as burning fossil fuels to create power are widely employed. The government’s energy-saving goals and enabling green electrification in the country seem difficult in such circumstances. Similarly to other SAARC countries, Pakistan’s power production cost is relatively expensive. In Pakistan, the Water and Power Development Authority (WAPDA) was established in 1958 with an agenda for power generation, transmission, and distribution. Currently, Pakistan’s energy consumption was estimated to be 112,070,000 GWh in 2020 [21], while the domestic sector is the primary and the largest electricity consumer in the country.
There are four major power producers in the country [22]:
  • WAPDA (Water and Power Development Authority)
  • PAEC (Pakistan Atomic Energy Commission)
  • KESCO (Karachi Electric Supply Company)
  • IPPs (Independent Power Producers)
There are 5077 km of 500 kV transmission lines in Pakistan, with grids at Sheik Muhammadi Peshawar, Rewat, Sheikhupura, Gatti Faisalabad, Nokhar, New Multan, Muzaffargarh, Sahiwal Yousafwala, Guddu, Dadu, Jamshoro, and Nki. Moreover, thirty-two 220 kV grid stations have a total length of 7359 km of 220 kV transmission lines in Pakistan [23]. After transmission, the distribution companies (DISCOs) PESCO, IESCO, GEPCO, LESCO, FESCO, MEPCO, QESCO, and HESCO distribute the power to the consumer end. A genuine and realistic integration of smart metering is required in developing nations like Pakistan. However, the smart metering technique raises operational and maintenance expenses initially but will have a beneficial effect on the power sector.

1.3. General Estimate of Pakistan Energy Potential

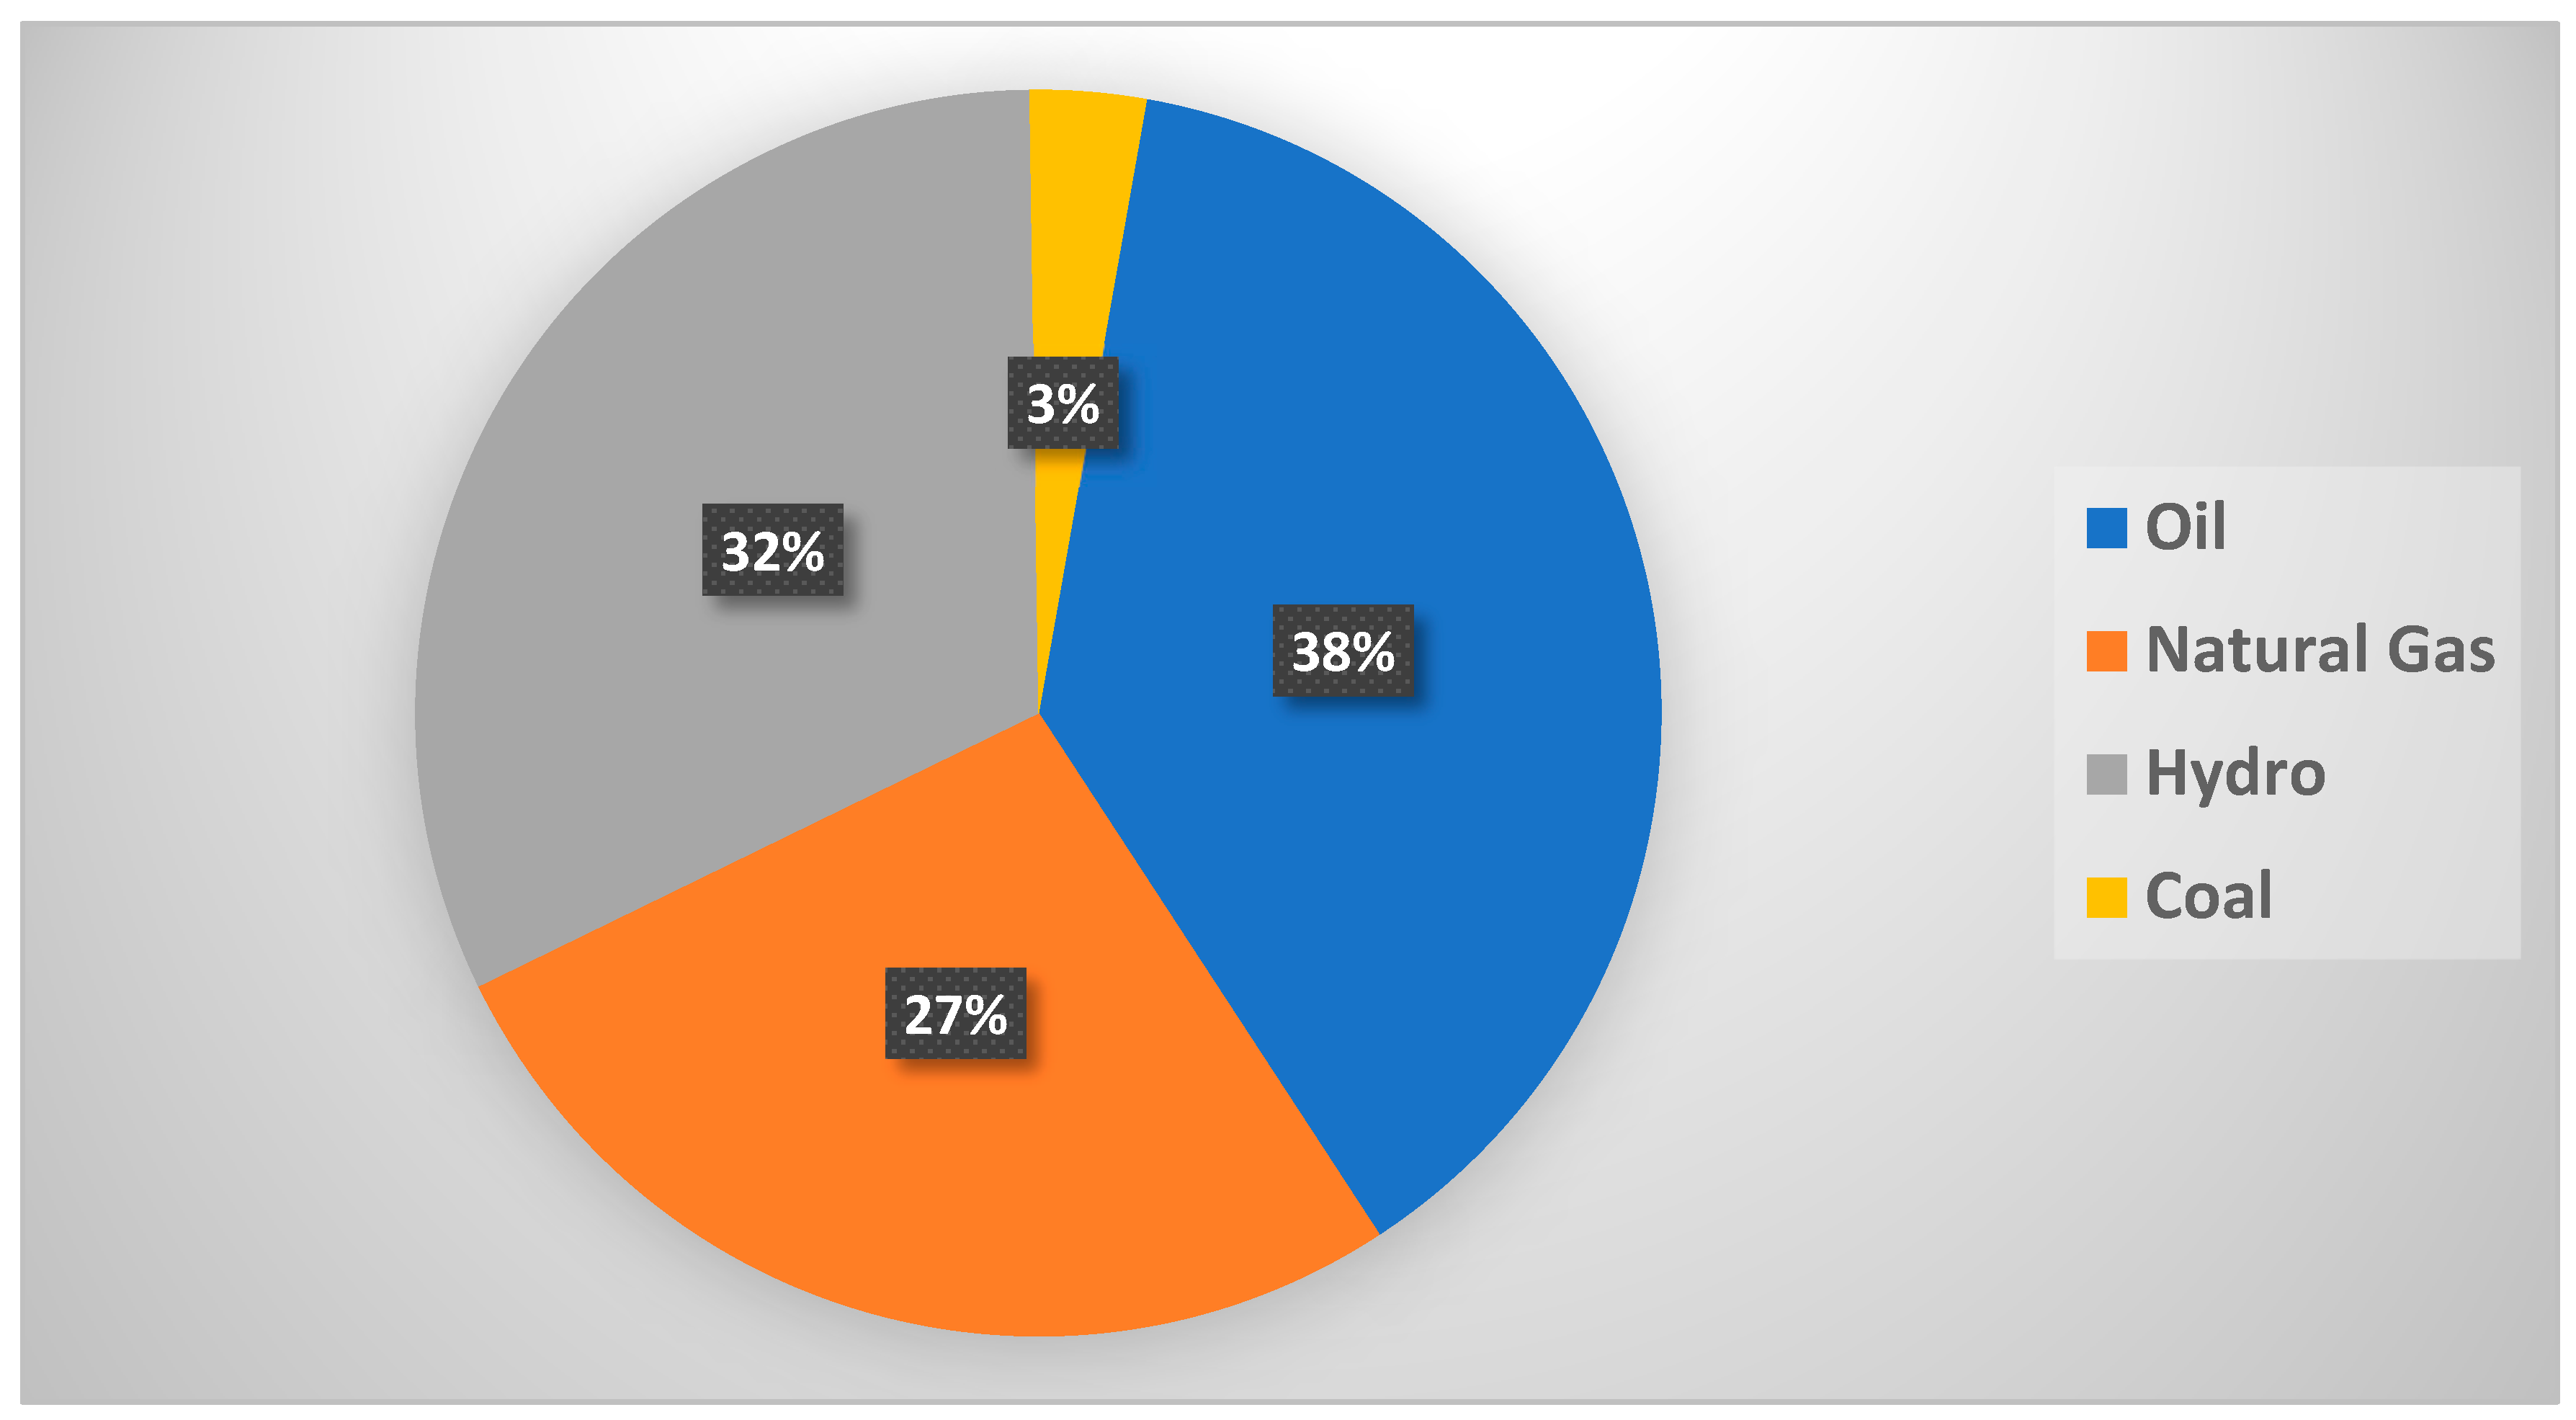
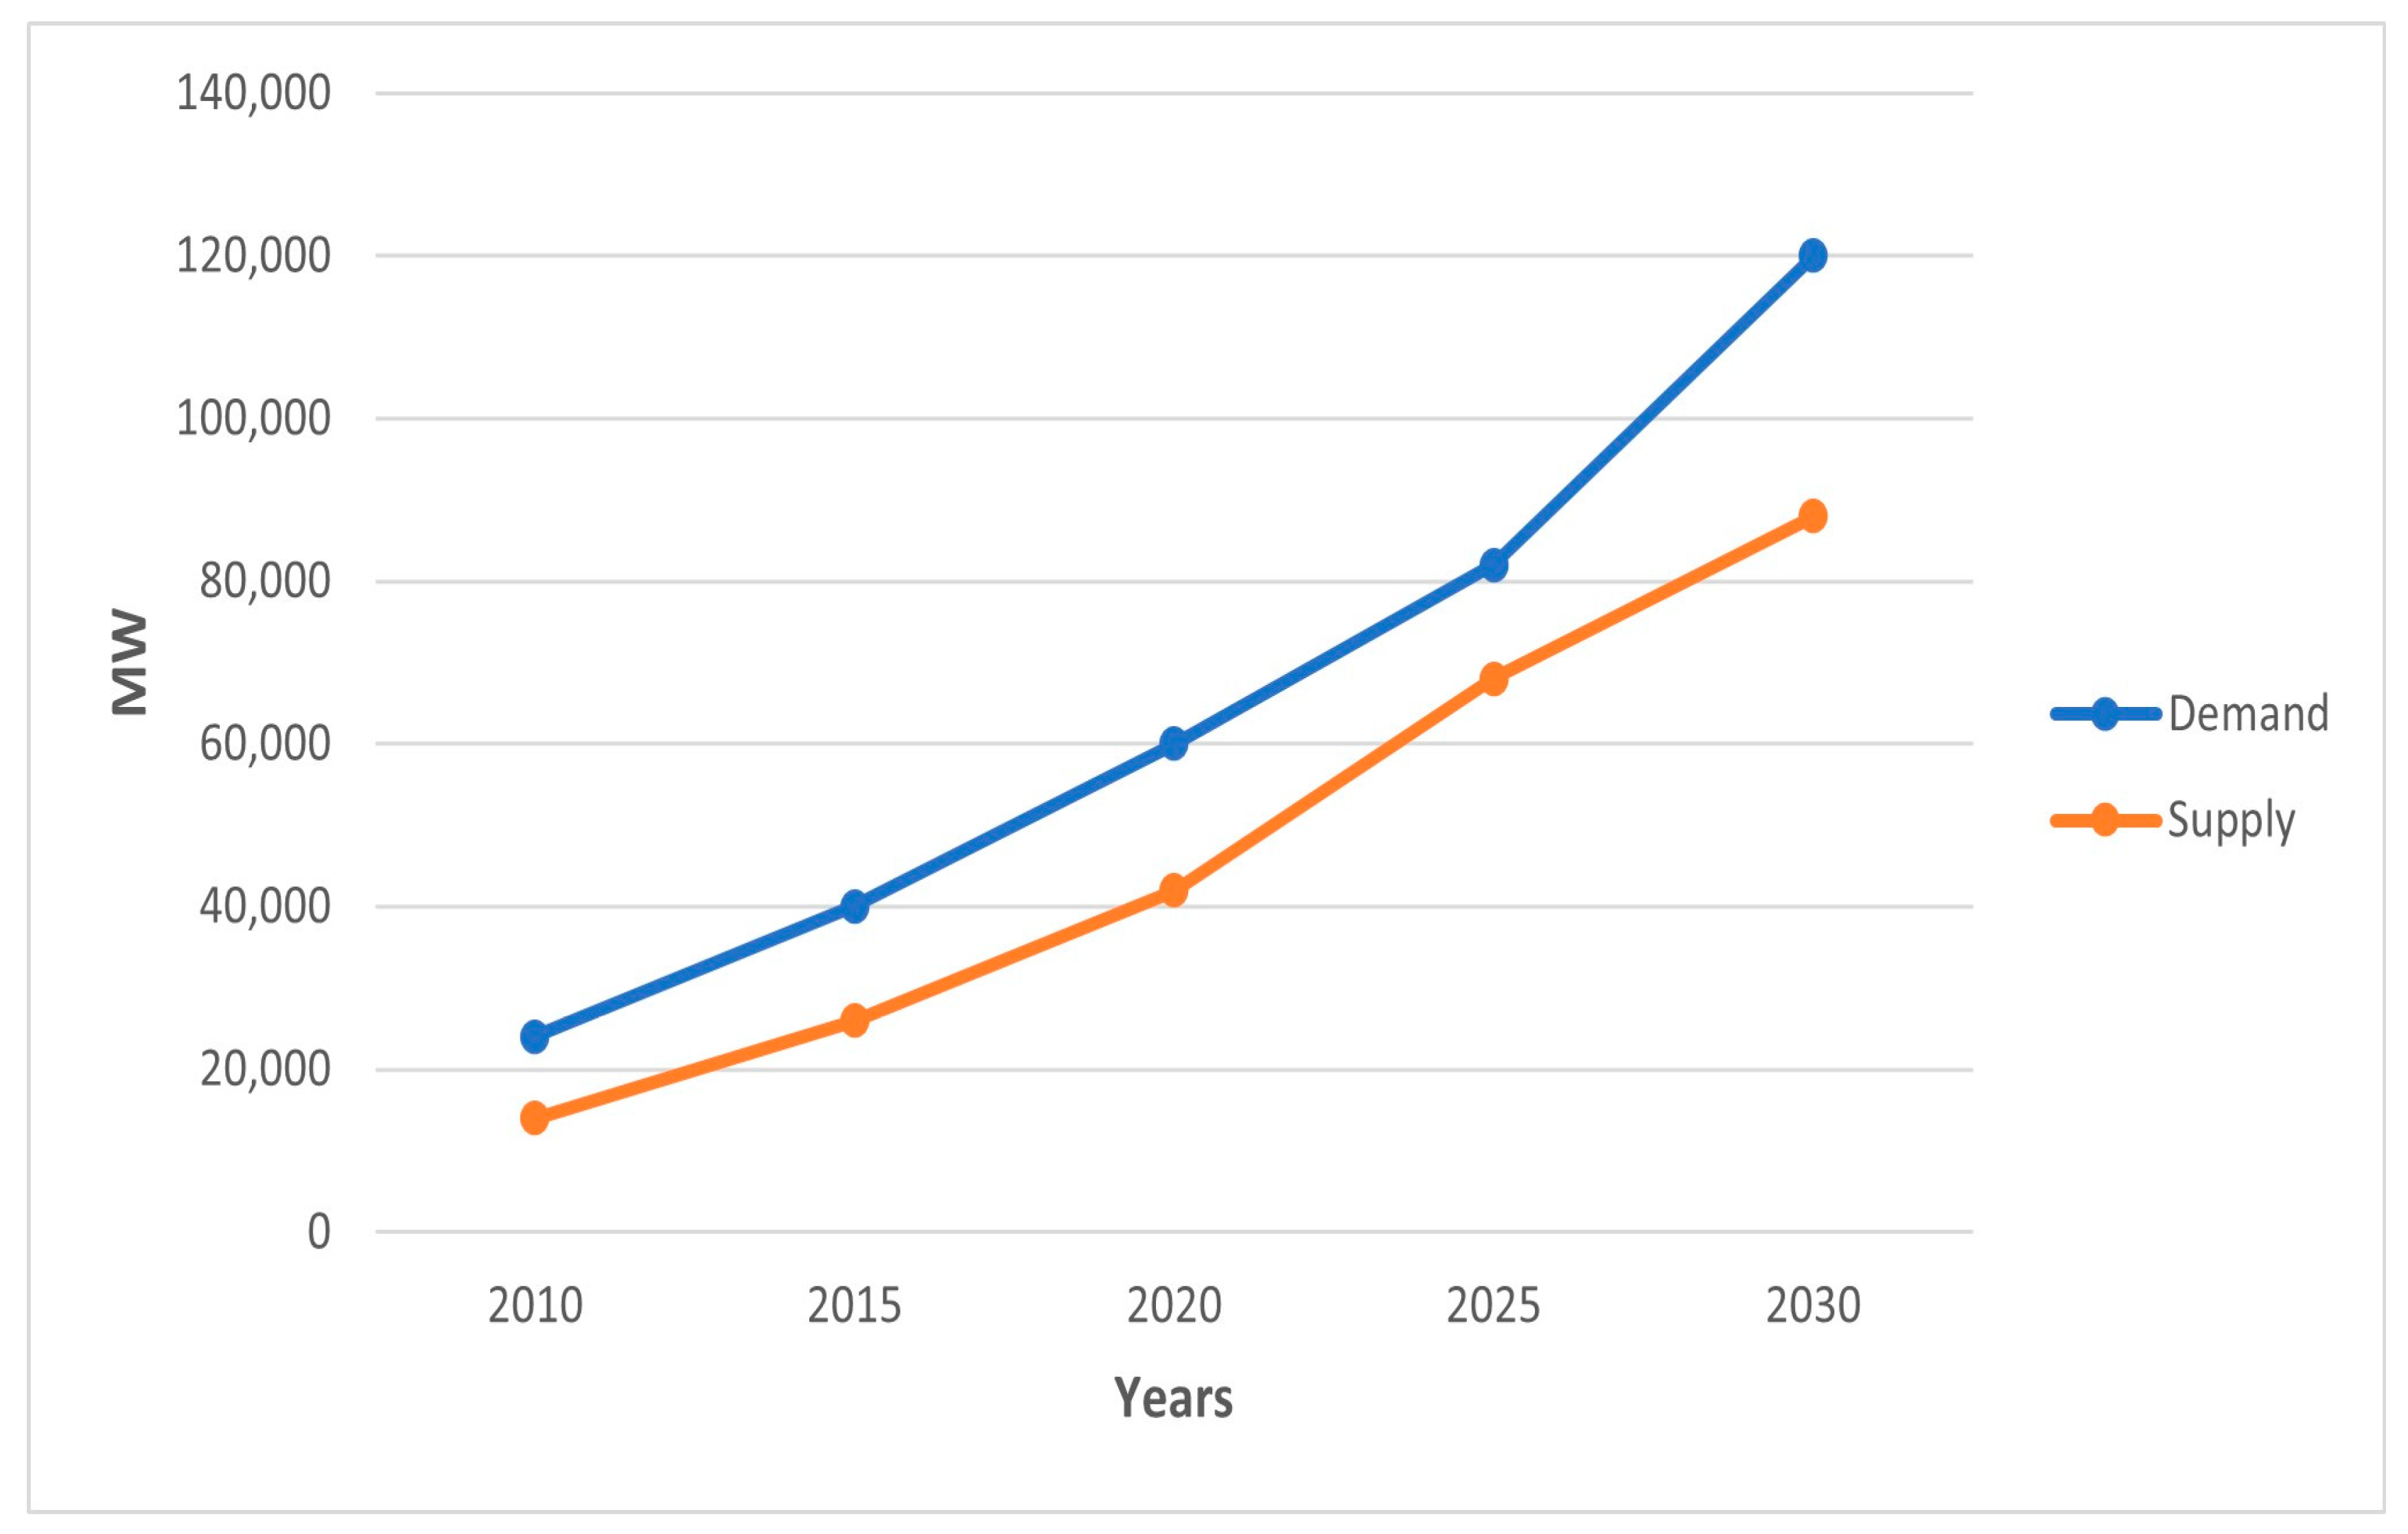
Pakistan’s geographical location allows it to serve as a trade and energy corridor for SAARC countries. To support SAARC nations and maintain economic growth, Pakistan must fulfill both its direct and indirect energy demands. In Pakistan, there was a 26.82% shortfall in total electricity production, which is expected to rise to 50% in coming years [24]. During peak demand, especially in the summers, daily load shedding averages 13–14 h in urban regions, whereas it lasts for about 16–19 h daily in rural areas. The system needs short and long-term energy solutions as shown in Pakistan’s energy situation in Figure 3. A significant proportion of the nation’s energy supplies are being imported that includes oil (38%), hydro (32%), natural gas (27%), and coal (3%) [25].
From the Board of Investment data, Pakistan has a power capacity of 22,797 MW. Only 12,000–13,000 MW of daily power is available to meet the peak demand of 17,000–21,000 MW [24]. As shown in Figure 4, annual energy consumption increases by 8 to 10%.
The requirement to regularly import oil is the nation’s main economic concern. The Asian Development Bank (ADB) and the World Bank have worked hard to prevent the worsening of the energy situation in Pakistan [24]. However, the government has given minimal attention to environmental concerns, energy efficiency, and sustainable development. To protect the environment and existing energy resources, there should be no rise in fossil fuel-generated electricity. Rather, the nation should prioritize the discovery of additional renewable and sustainable fuel sources. Estimates for renewable energy (RE) in Pakistan were at 1% in 2010. In 2030, the government of Pakistan has set a goal of obtaining 5% renewable energy [26].

2. SWOT Analysis of Electric Distribution Companies

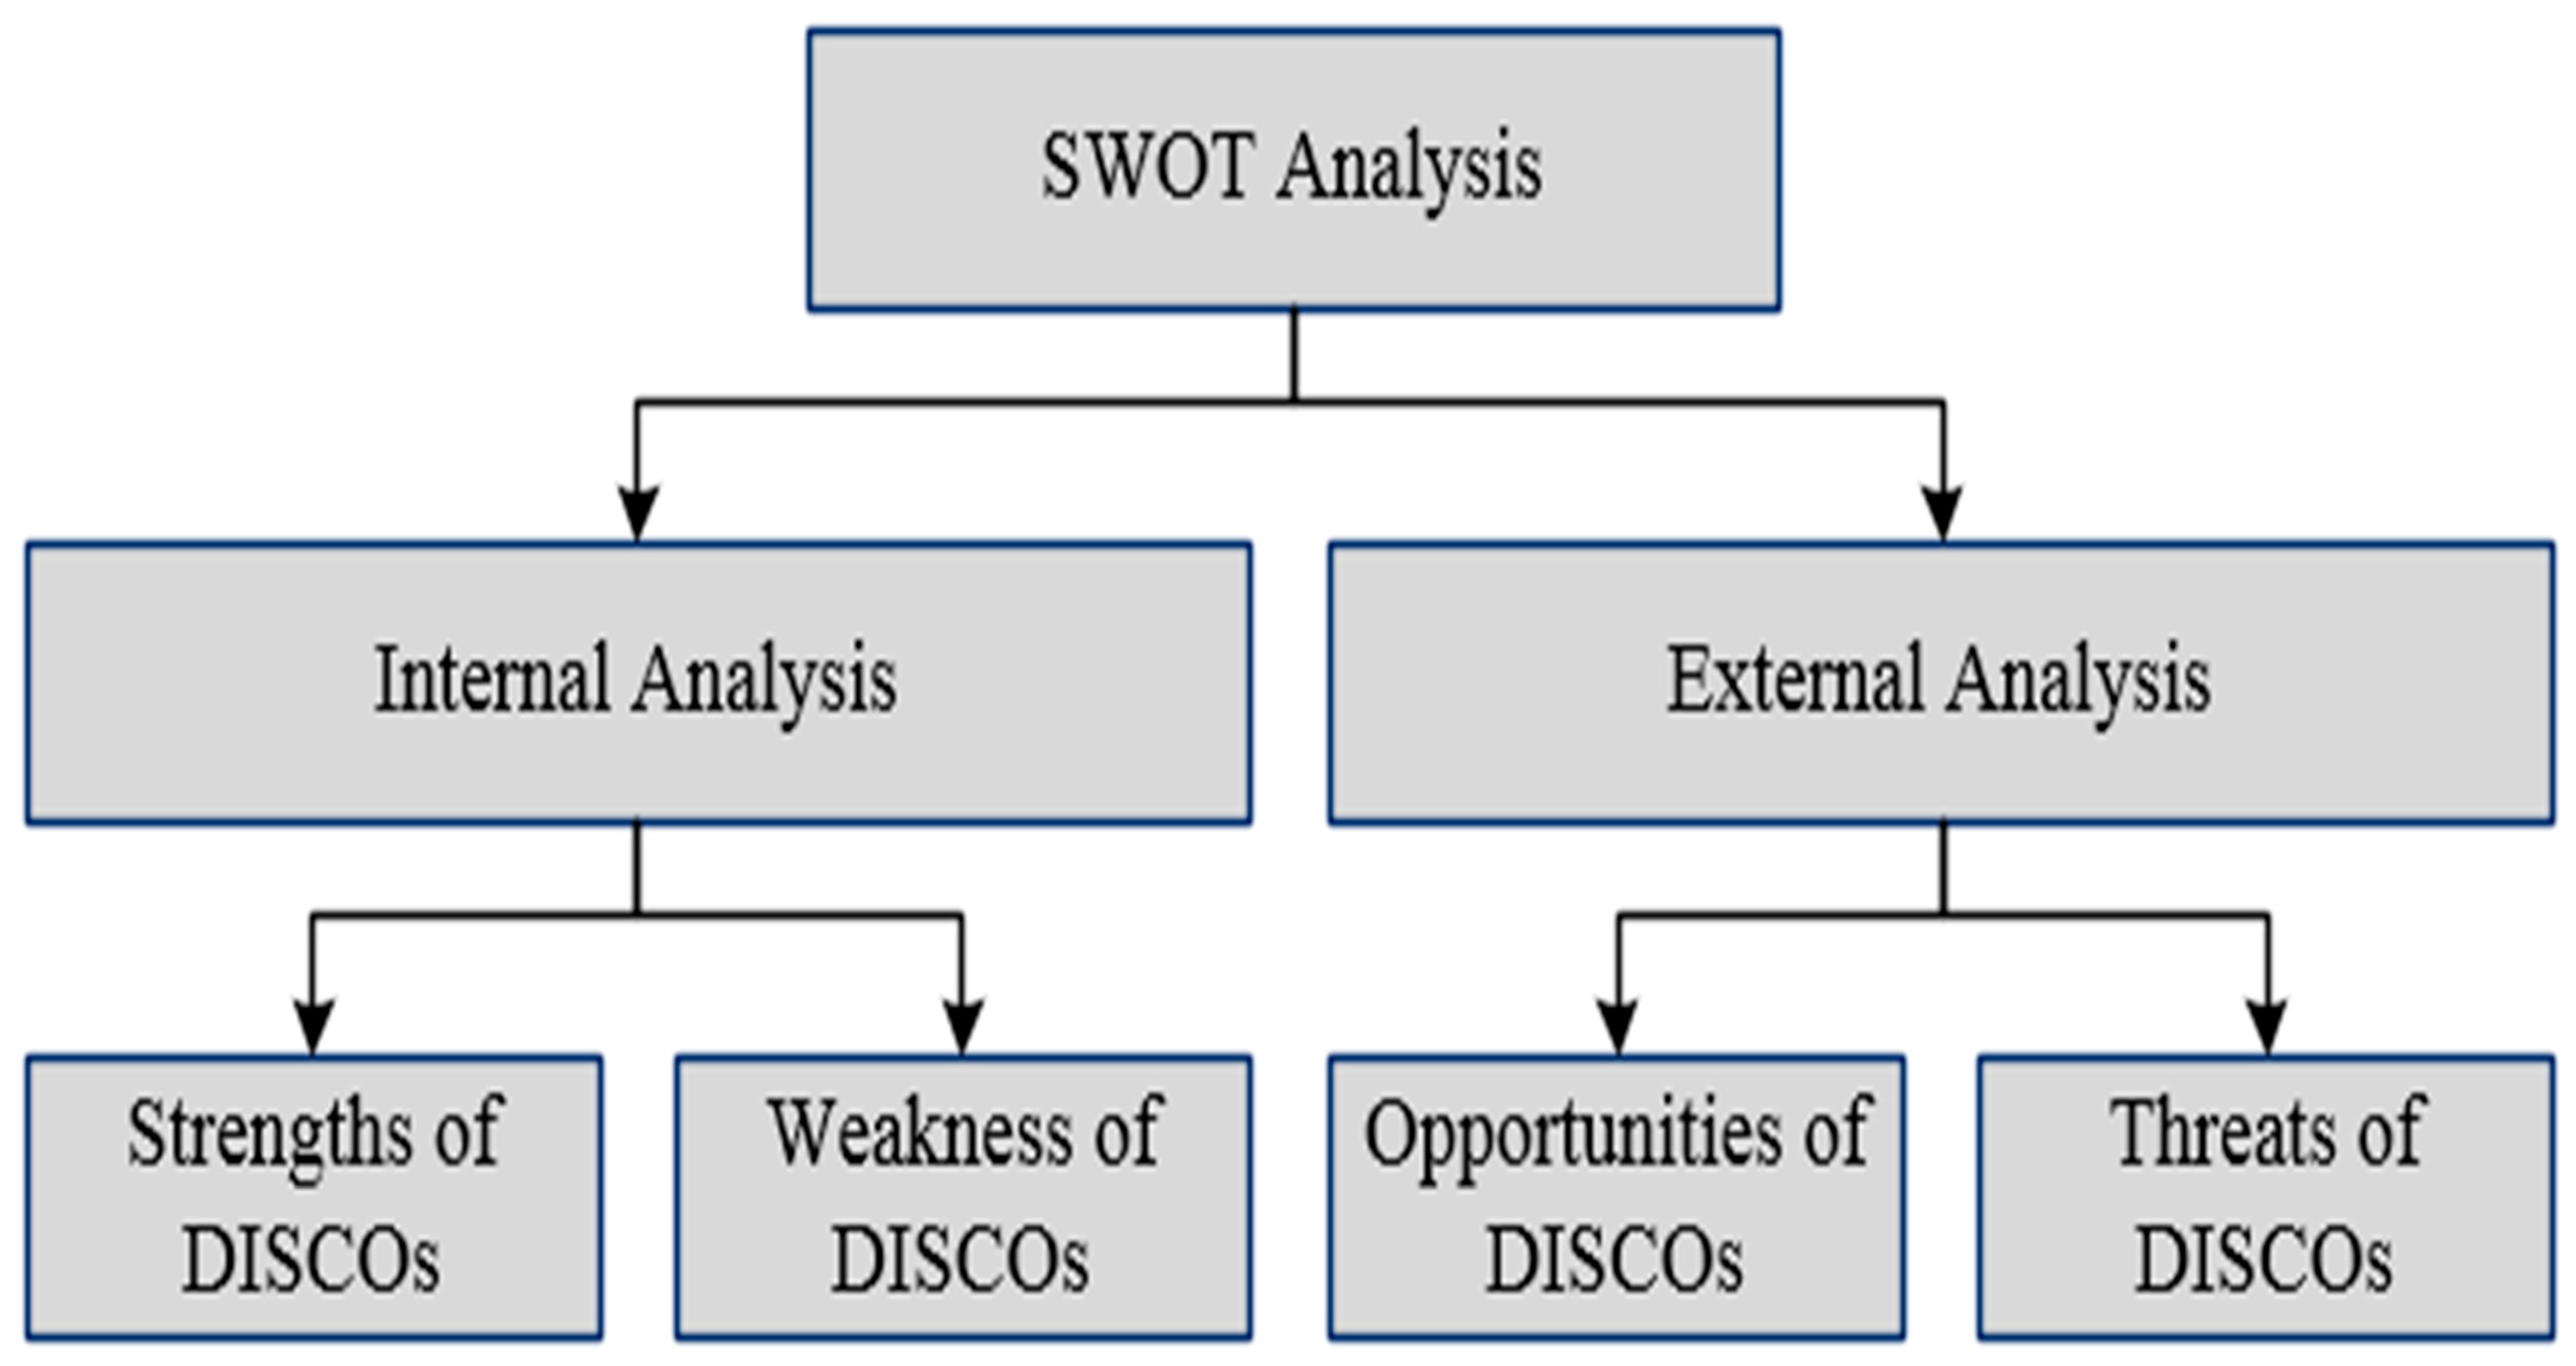
The research work was primarily divided into three sections. The first phase comprises a SWOT analysis of existing electric distribution network, the second phase provides a detailed analysis of smart metering in SAARC region, and the third phase describes results and discussions. In qualitative research, the SWOT analysis technique is performed to examine the socio-economic aspects of implementing a smart metering system in SAARC region. Among other SAARC countries, we have considered the case of Pakistan as a reference to understand the problems related to electrical distribution sector in SAARC region. SWOT analysis is a qualitative research technique used to develop strategic decisions while analyzing finances, human resources, marketing strategies, logistics, information systems, etc. The technique helps to discover the internal and external factors for the subject project. The internal factors include strengths and weaknesses, while external factors are opportunities and threats as explained in Figure 5 [27].

2.1. Strength of Electrical Distribution Companies (DISCOs)

Ten electrical distribution firms make up the majority of Pakistan’s electrical distribution network. These companies are responsible for meeting the electrical demands of the respective geographical region’s industrial, agriculture, commercial, and domestic sectors. These utility companies are facing complications like line losses, failure in recovering electricity usage charges from consumers, electricity theft, and poor management that severely affect their performances [28].
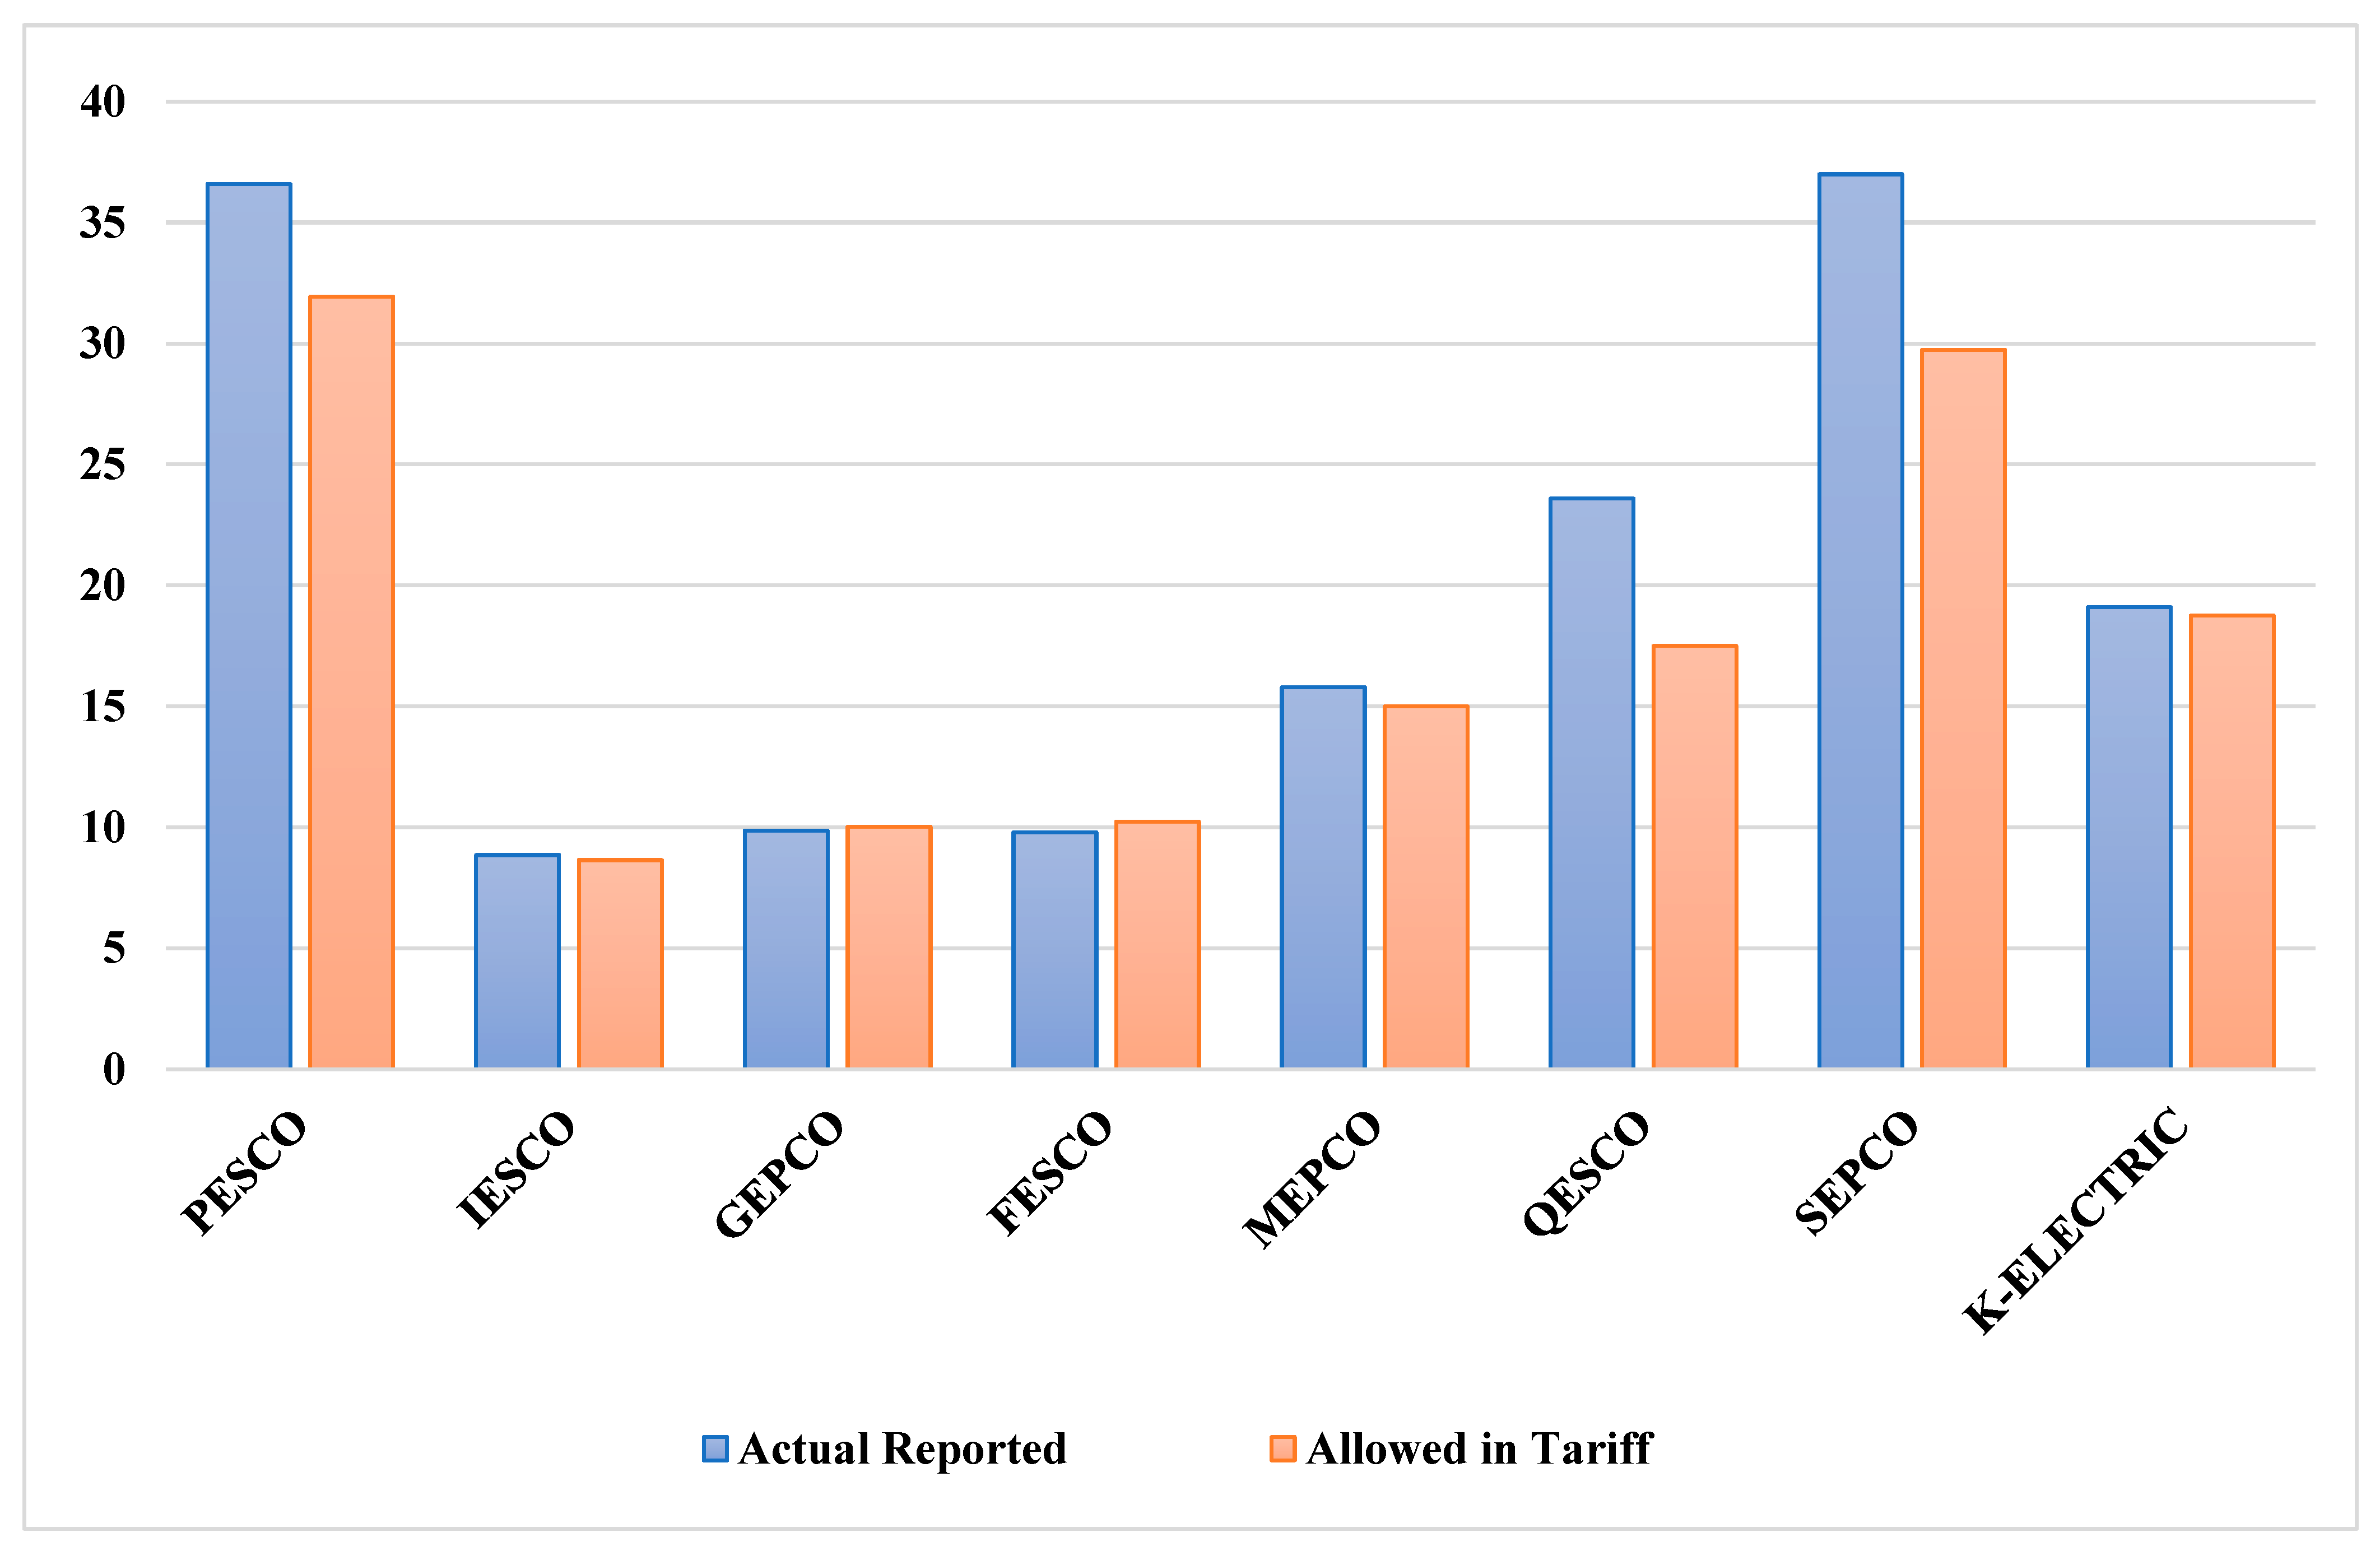
According to the NEPRA’s report for the year 2018–19, it was quantified that Peshawar Electric Supply Company (PESCO) and Sukkur Electric Supply Company (SEPCO) face annual losses of around 36.6% and 37%, Hyderabad Electric Supply Company (HESCO) has annual loss of 29.5% and Quetta Electric Supply Company (QESCO) faces 23.6% losses. At the same time, Lahore Electric Supply Company (LESCO), Gujranwala Electric Supply Company (GEPCO), and Islamabad Electric Supply Company (IESCO) have annual losses of 13.2%, 9.87%, and 8.86%, respectively, while Faisalabad Electric Supply Company (FESCO) has annual losses of 9.8%, Multan Electric Power Company (MEPCO) has annual losses of 15.8%, and Karachi Electric Supply Company (K-Electric) has annual losses of 19.1% [29]. The differences between the actual reported losses and the permissible losses as per NEPRA’s instructions to the respective distribution companies (DISCOs) are elucidated in Table 1 and Figure 6.
According to the government estimates, Pakistan faces transmission and distribution losses of around 23%, and ranks in the top 14 out of 131 countries worldwide with this kind of immense transmission and distribution losses. For the distribution system that faces huge annual losses due to electricity theft and inefficient operations, implementing a smart metering system can be considered a win–win situation. These high outage percentages can be easily curbed with the implementation of a smart metering system [30,31].

2.2. Weakness of Electrical Distribution Companies (DISCOs)

In recent years, the Government of Pakistan initiated three projects to implement a smart metering system in collaboration with international investors. The aim was to engage electricity distributors with smart technologies enabling controlled electricity management. The main problem was the availability of funds to invest in bringing this innovative technology to its consumers and distributors. In 2010, the USAID program was initiated to help Pakistan to improve its electricity distribution system. The Asian Development Bank (ADB) provided USD 4 billion loans to introduce the smart metering system in the country. An individual investment of USD 990 million in 2010 was assigned to implement smart metering infrastructure in Pakistan [32]. Implementation of smart metering infrastructure was also initiated in 2010 by PEPCO in a few distribution companies. LESCO implemented a few selected feeders and invested a budget of PKR 6.2 million for the implementation phase.
Given Pakistan’s severe financial strain, this is a challenging endeavor and a source of vulnerability for the nation. It will take approximately USD 900 billion to completely replace the current billing system. Additionally, a significant financial investment is required to assemble smart meters locally. Currently, there is not enough infrastructure to manufacture meters and their communication setup. Finances will be required to establish repair workshops and provide technical staff training to help expedite construction and repair works [33].
Resistance of the stakeholders tends to be the most difficult challenge that the government faces when we talk about the alteration of technology. The government may also have to face resistance from the employees of DISCOs. This resistance might be due to the fear of downsizing staff with the adoption of new technology. The government might also have to face the challenge of dealing with new and innovative technology, as initially, there may exist very little expertise to understand and successfully implement it. Furthermore, there will be obstacles in dealing with customers who fear increasing electricity prices or reductions in utility subsidies provided earlier. The government might also face difficulty in implementing the smart metering system’s extensive telecommunications and IT infrastructure. To successfully implement this project, the government will require specialized technical staff. The development of cybersecurity will also be a considerable challenge to manage, as it will require new strategies and measures to ensure that all of the communication system and consumer data is secured from cyber threats [34].

2.3. Opportunities of Electrical Distribution Companies (DISCOs)

There is a serious electricity theft problem in Pakistan’s electrical distribution sector. In some cases, old meters are bypassed, and others are tampered with by just tilting the meter. Coupled with smart meters, distribution companies have an excellent opportunity to rid themselves of this problem. Smart meters can recognize and pinpoint customers who tamper with their energy meters. The utility companies will be in possession of tools to tackle the non-technical and technical losses in the system. Deployment of smart metering infrastructure can also help in the reduction of operational costs of the system. Utilities can receive information directly from the user end through a two-way communication system. Real-time resolution of several issues requires minimal engagement between the ends [35]. The implementation of a smart metering system will provide the Government of Pakistan with the opportunity to take the first step toward establishing the infrastructure of a smart grid. One of the most important characteristics of the smart grid system is that it allows two-way communication between the utility and its customers [36].
Most of Pakistan’s electricity consumers are unaware of peak and off-peak electricity usage hours. Utility companies typically calculate the electricity bills and send average electricity consumption rate to the consumers. Generally, electricity meters used in Pakistan do not include a feature that allows recording energy consumption according to Time of Use. However, using smart meters, distribution companies can implement different tariffs based on peak demand. They can offer incentives to consumers who use electricity during off-peak hours and impose a surcharge during peak demand periods [37]. A smart metering system enables distribution companies to implement energy conservation measures such as demand response. Through the use of the load forecasting feature of smart meters, utilities will be able to adjust electricity demand according to available supply [38].

2.4. Threats of Electrical Distribution Companies (DISCOs)

Developed countries such as the United Kingdom, the United States of America, and China that have successfully implemented various smart metering system projects have developed regulations tailored to their regional conditions. The governments approve these regulations in their respective countries. Thus, before implementing a smart metering system, each country ought to establish policies and regulations. The National Electric Power Regulatory Authority (NEPRA) is responsible for issuing and enforcing regulations governing the power sector in Pakistan. Currently, there are no regulations in place for this project. To bring this technology to market, NEPRA will need to analyze the needs of power consumers and utility companies. After conducting a thorough analysis, NEPRA will need to develop new regulations and policies to facilitate the implementation of a smart metering system [39].
The installation of a smart metering system necessitates international procurement. Currently, smart meters and other appliances cannot be manufactured locally in Pakistan. If components need to be imported from other nations, then currency fluctuations should also be considered. Pakistan is currently dealing with a substantial financial challenge, and the current scenario poses a serious threat when it comes to the implementation of a smart metering system in the country [40].
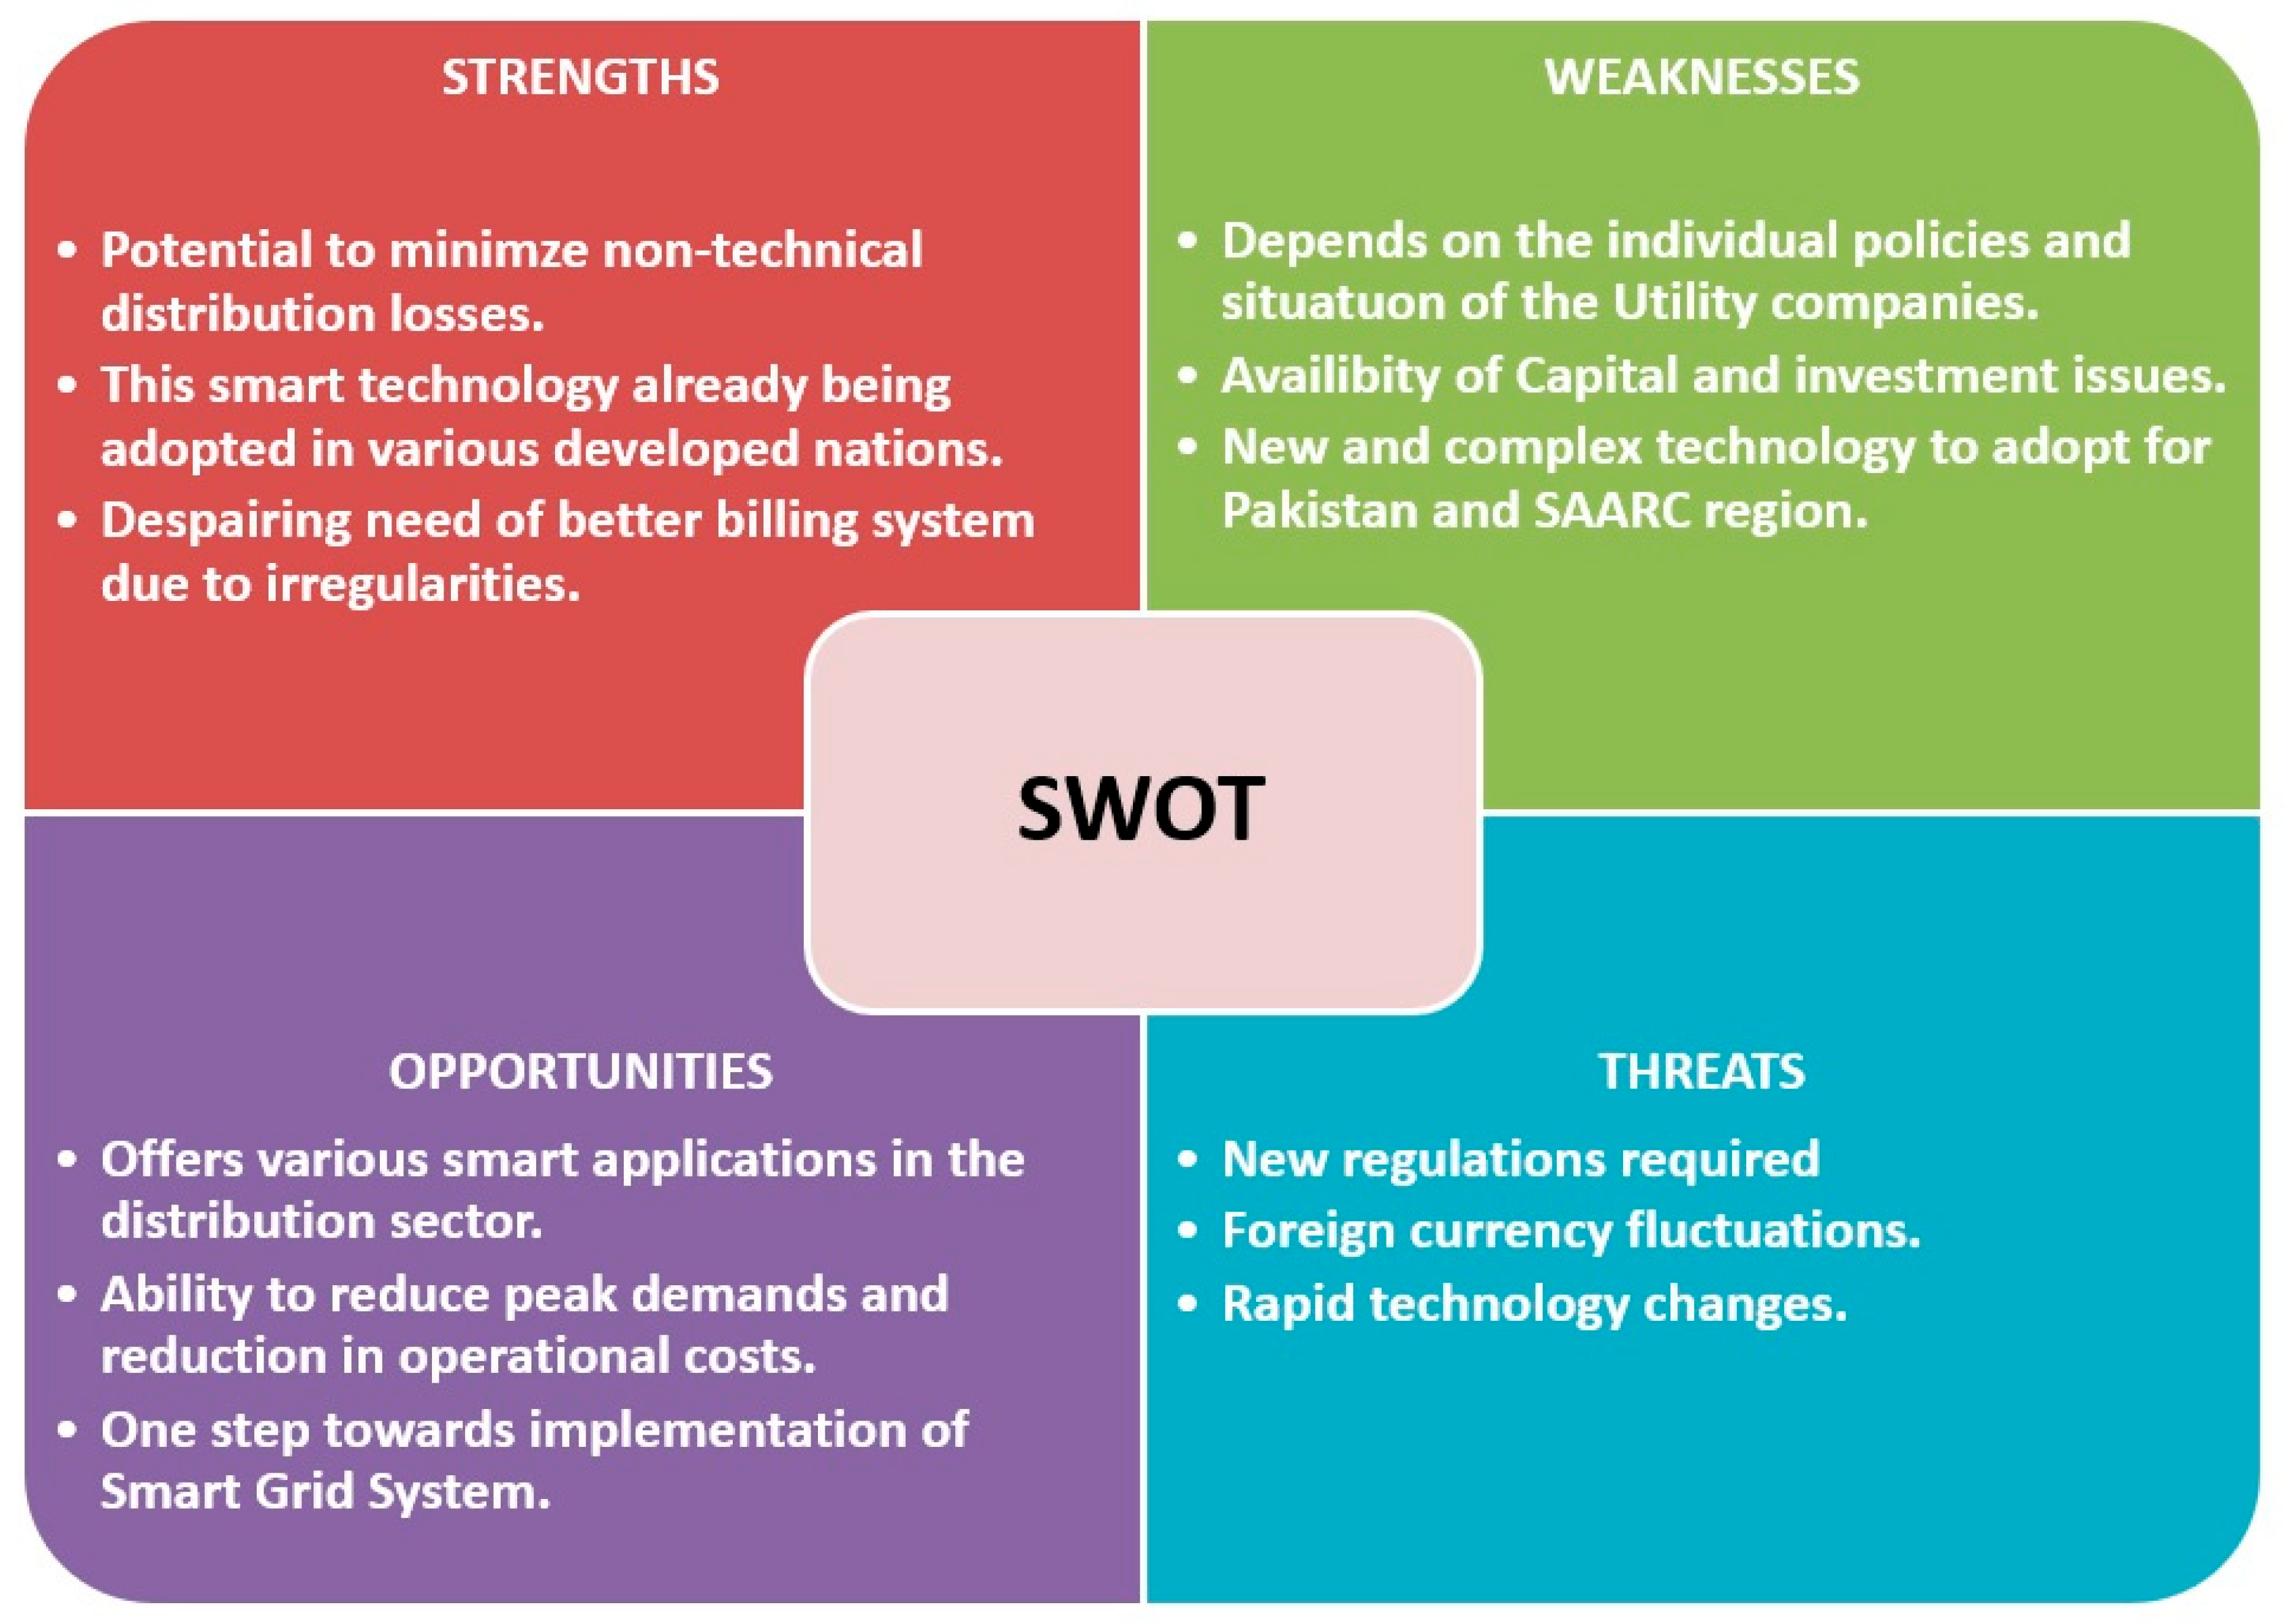
From the results of SWOT analysis, the SWOT matrix is generated that is used to present the model in a better and understanding way as exhibited in Figure 7. The SWOT matrix is basically a “2 × 2” matrix. The first row of that matrix contains internal factors which are strengths and weaknesses. The external factors are given in the second row of the matrix which is opportunities and threats. The SWOT analysis with details can be found in Appendix A, Table A1.

3. Smart Metering System in SAARC Countries

In SAARC/developing countries, power outages are prevalent due to the limited generation capacity. Using renewable energy resources in electricity production can alleviate environmental concerns. Along with the use of renewable energy resources for power generation, smart metering system roll-out at a larger scale can enable utilization of electricity in the most economical way. Applications of smart meters like bill forecasting, Time of Use (TOU) and Home Management System (HMS) can play a vital in the development of efficient electrical distribution system [41]. The current billing method might not account for overall energy consumption data as SAARC nations have minimal or inaccurate consumer records and insufficient data processing facilities to make precise energy management decisions. A smart metering system can help in reducing peak demands and allows energy management in industrial automation as well as in commercial and residential sectors. Smart meters can be remotely controlled using a two-way communication network. The devices are interconnected through a server and apps/computer software and can be controlled using computers or mobile phones. A web server educates its users about energy efficiency and various tariffs being implemented by distribution companies. It sends a message and alarm to reduce energy usage during peak hours. The smart meters communicate by means of Wi-Fi, HTTP, and bi-directional mobile apps. This system manages peak and off-peak power and offers an electricity monitoring remotely [42].

3.1. Structure of Smart Metering

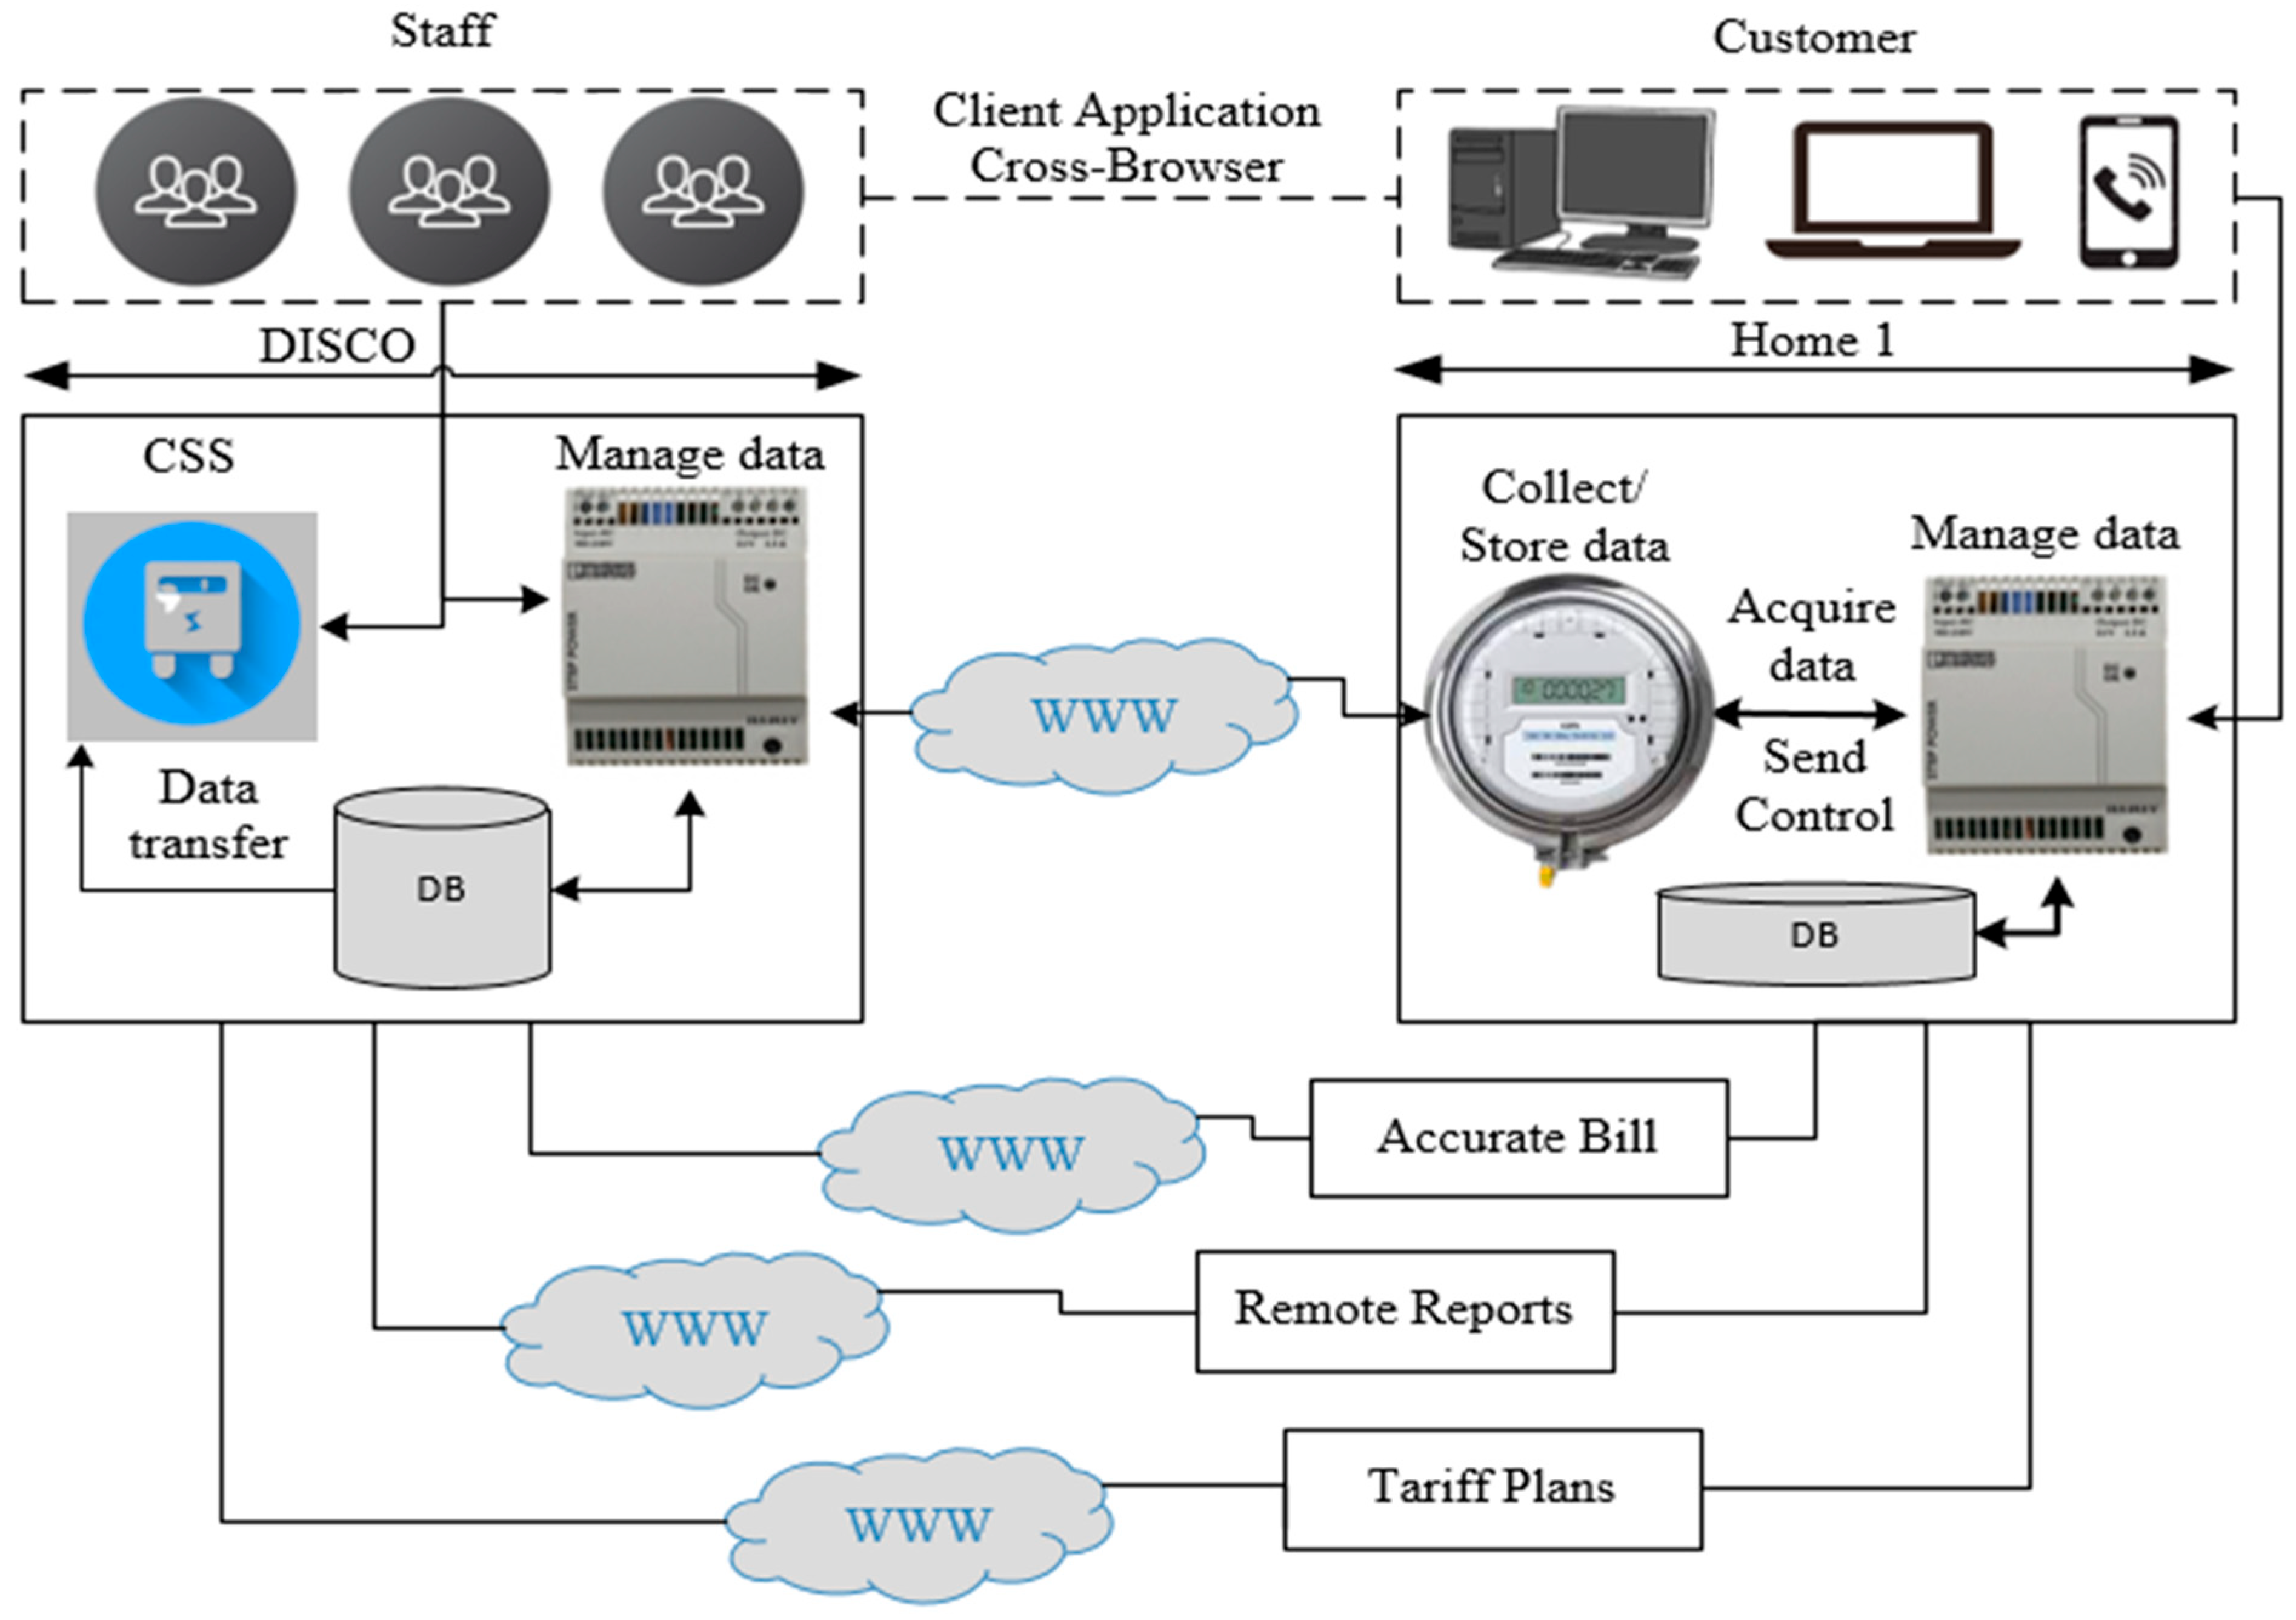
A smart meter is a high-tech bidirectional communicational device. It collects energy consumption data, sends it to utilities, and generates bills. Smart meters track real-time consumption and online data from electrical distribution companies and send it to the CSS (Cascading Style Sheets) database for processing. The website database connects service providers, smart meters, and customers. Figure 8 shows the smart metering system architecture [43,44]. Customers can monitor their consumption, pay bills, and print receipts online using the website’s database. With real-time data, distribution companies can generate computerized bills and analyze the data either automatically (the system determines tariff plans and recommends a better tariff plan) or manually (DISCO’s management modifies tariff pricing based on user consumption behavior and provides a unique tariff to every customer).
As a result, both customers and utility companies can perform multiple operations. Thus, consumers are aware of their energy consumption and encouraged to reduce it. There are some smart metering network requirements for each meter that transmits and collects data [43]:
  • Meter data must be sent to a meter data management system (MDMS) regardless of customer size.
  • Data must be protected since this network handles very sensitive consumer data, such as electricity usage.
  • The communication network must be managed and maintained. Management and quick recovery functions must be put in place.
  • Smart meters will be used for a longer period, so selecting a communication method with a long-term view is essential.
  • Manufacturing and maintenance should be cost-effective.
Comparison of Smart Metering Technologies for the SAARC Region [45,46,47,48,49,50,51] is shown in Table A2 in Appendix A.
Total Cost of Ownership (TCO), including network maintenance, must be lowered for large numbers of smart meters.
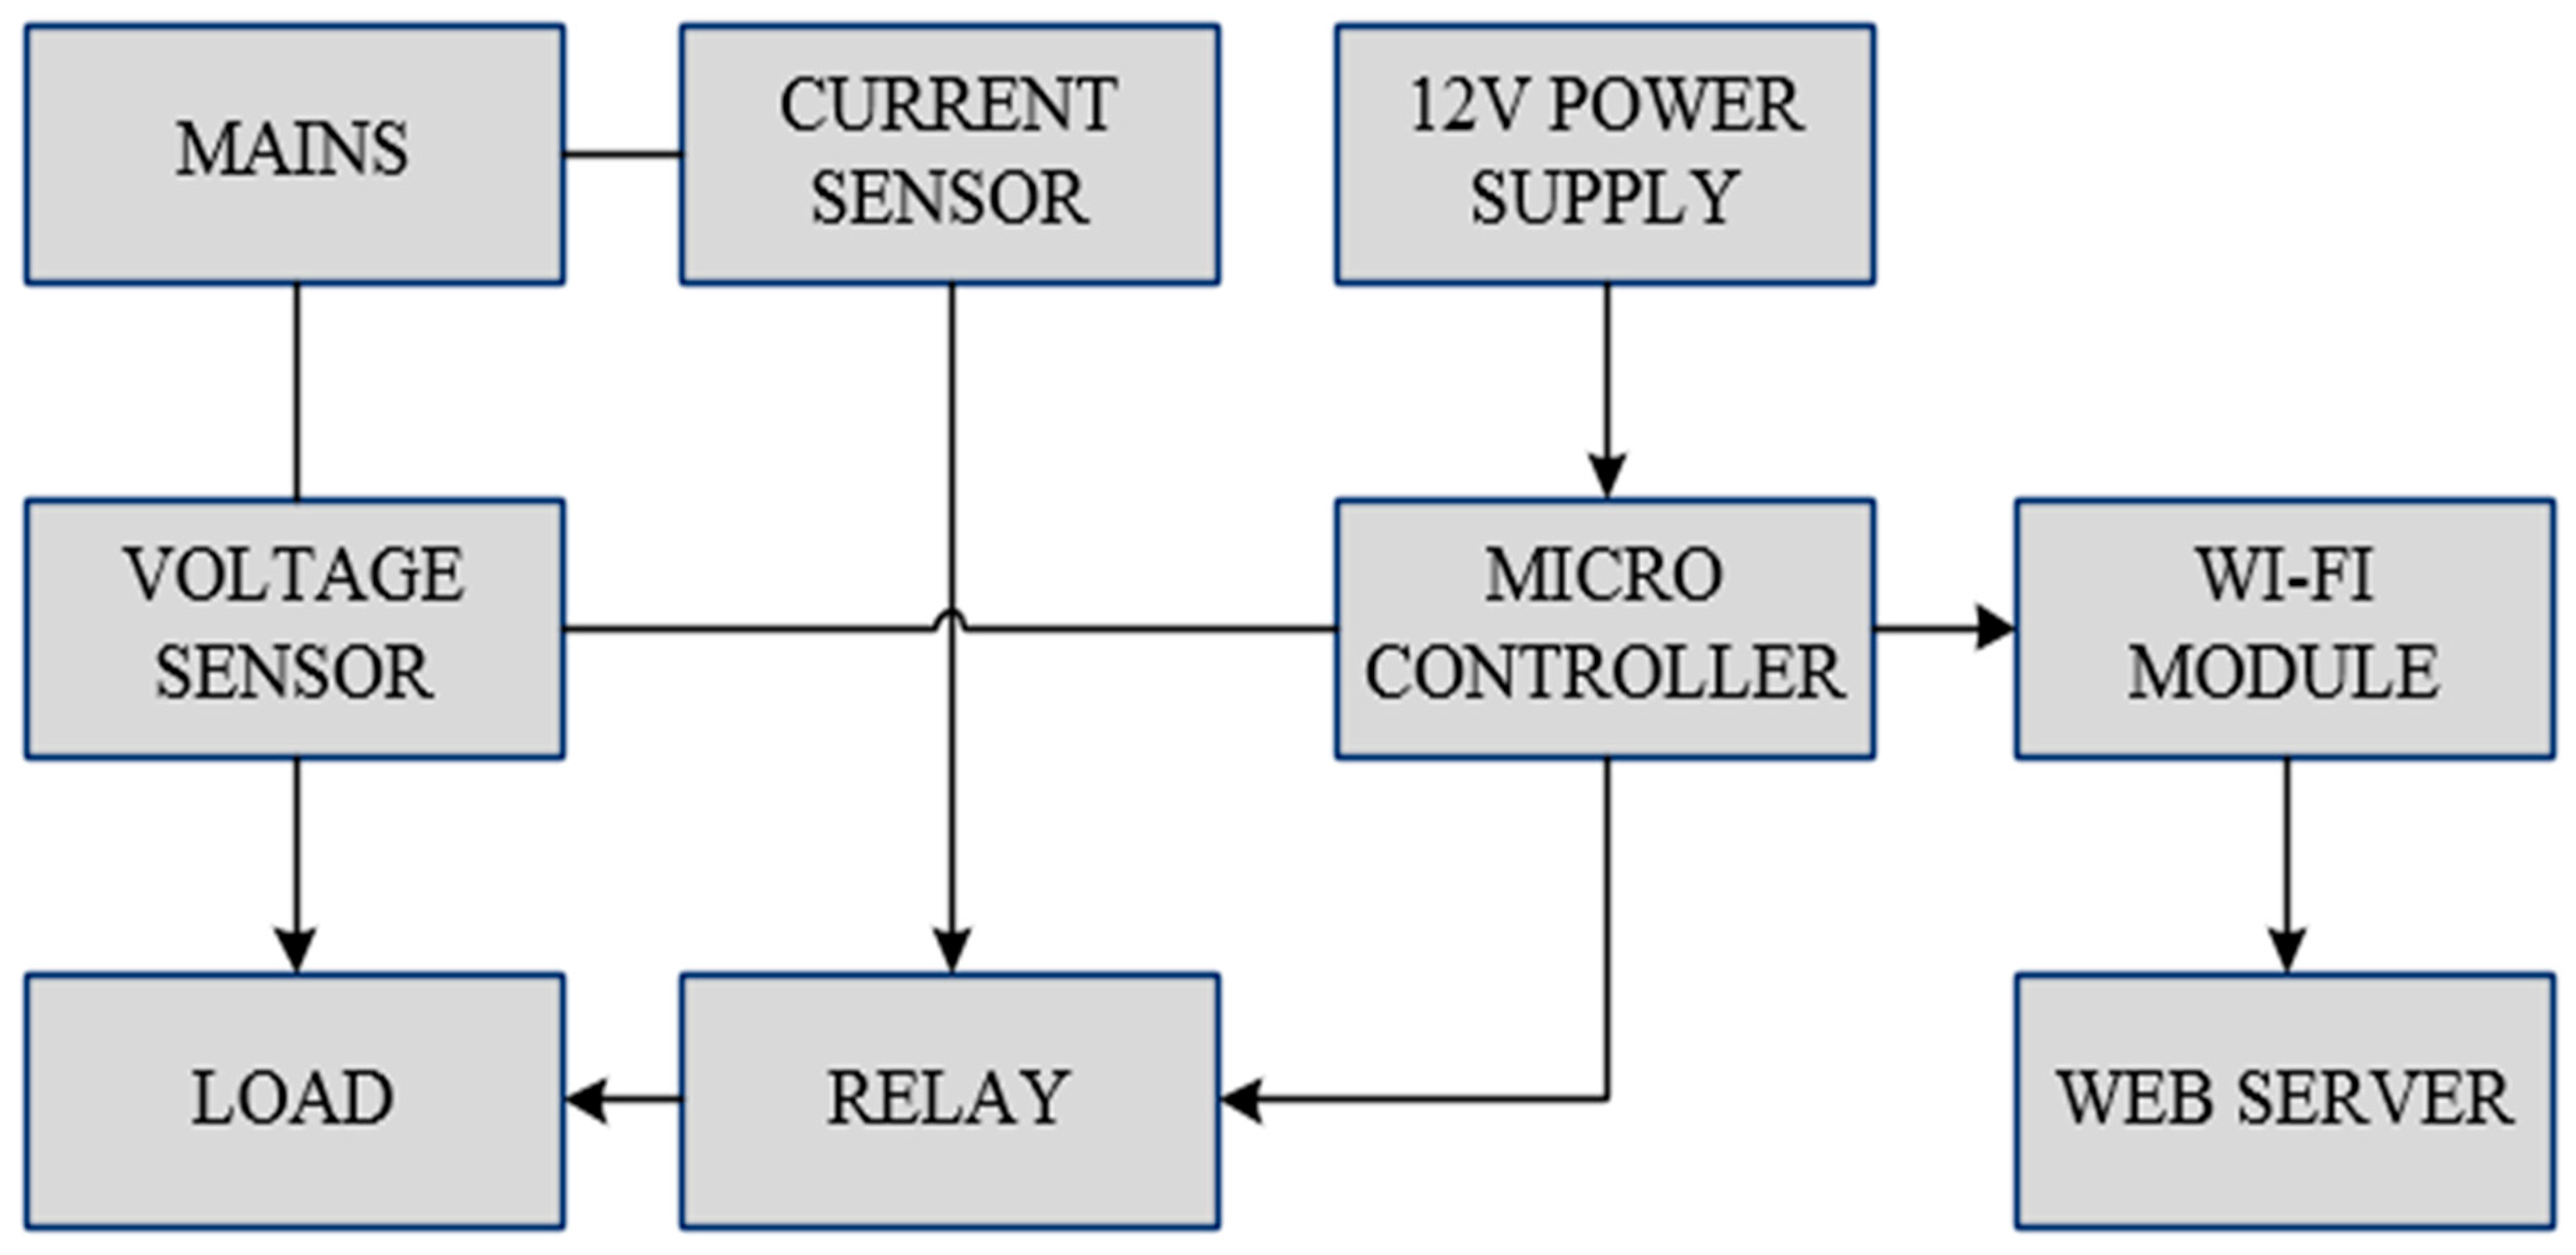
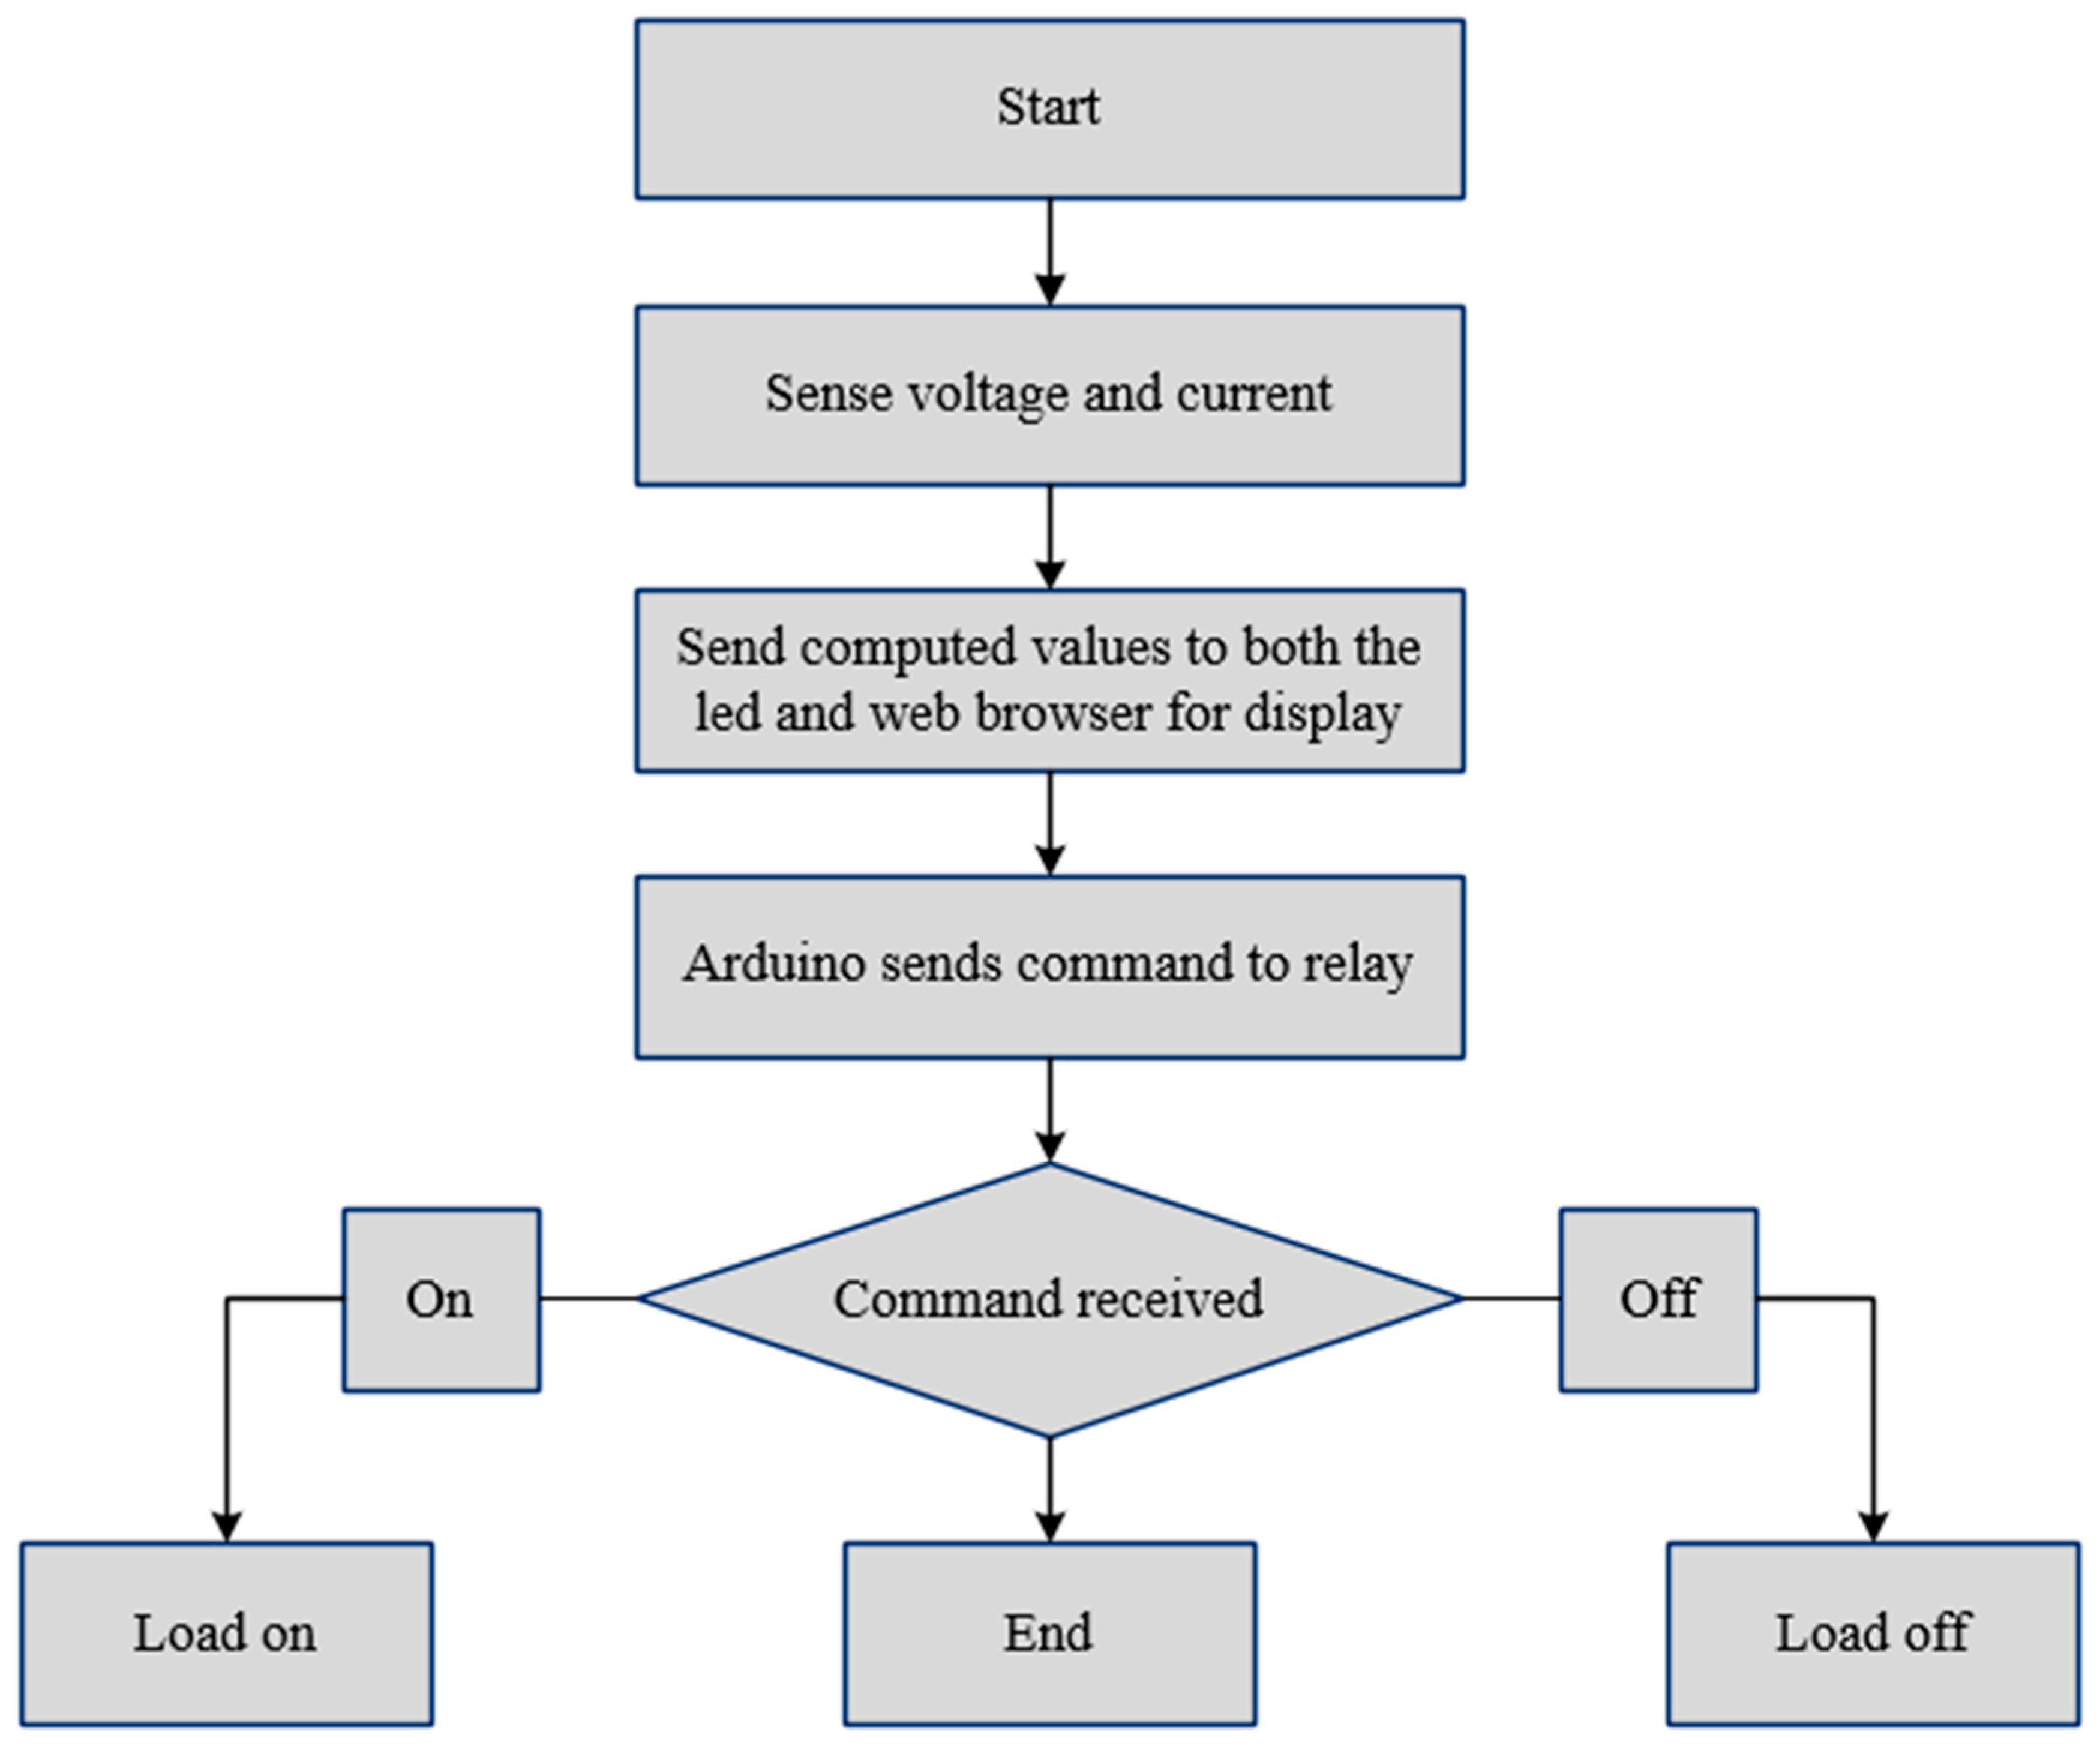
Figure 9 depicts the approaches used to develop and build the smart metering system, and Figure 10 depicts the tasks involved in achieving the flow diagram’s objective in operations [45]. The system’s implementation steps are also discussed.
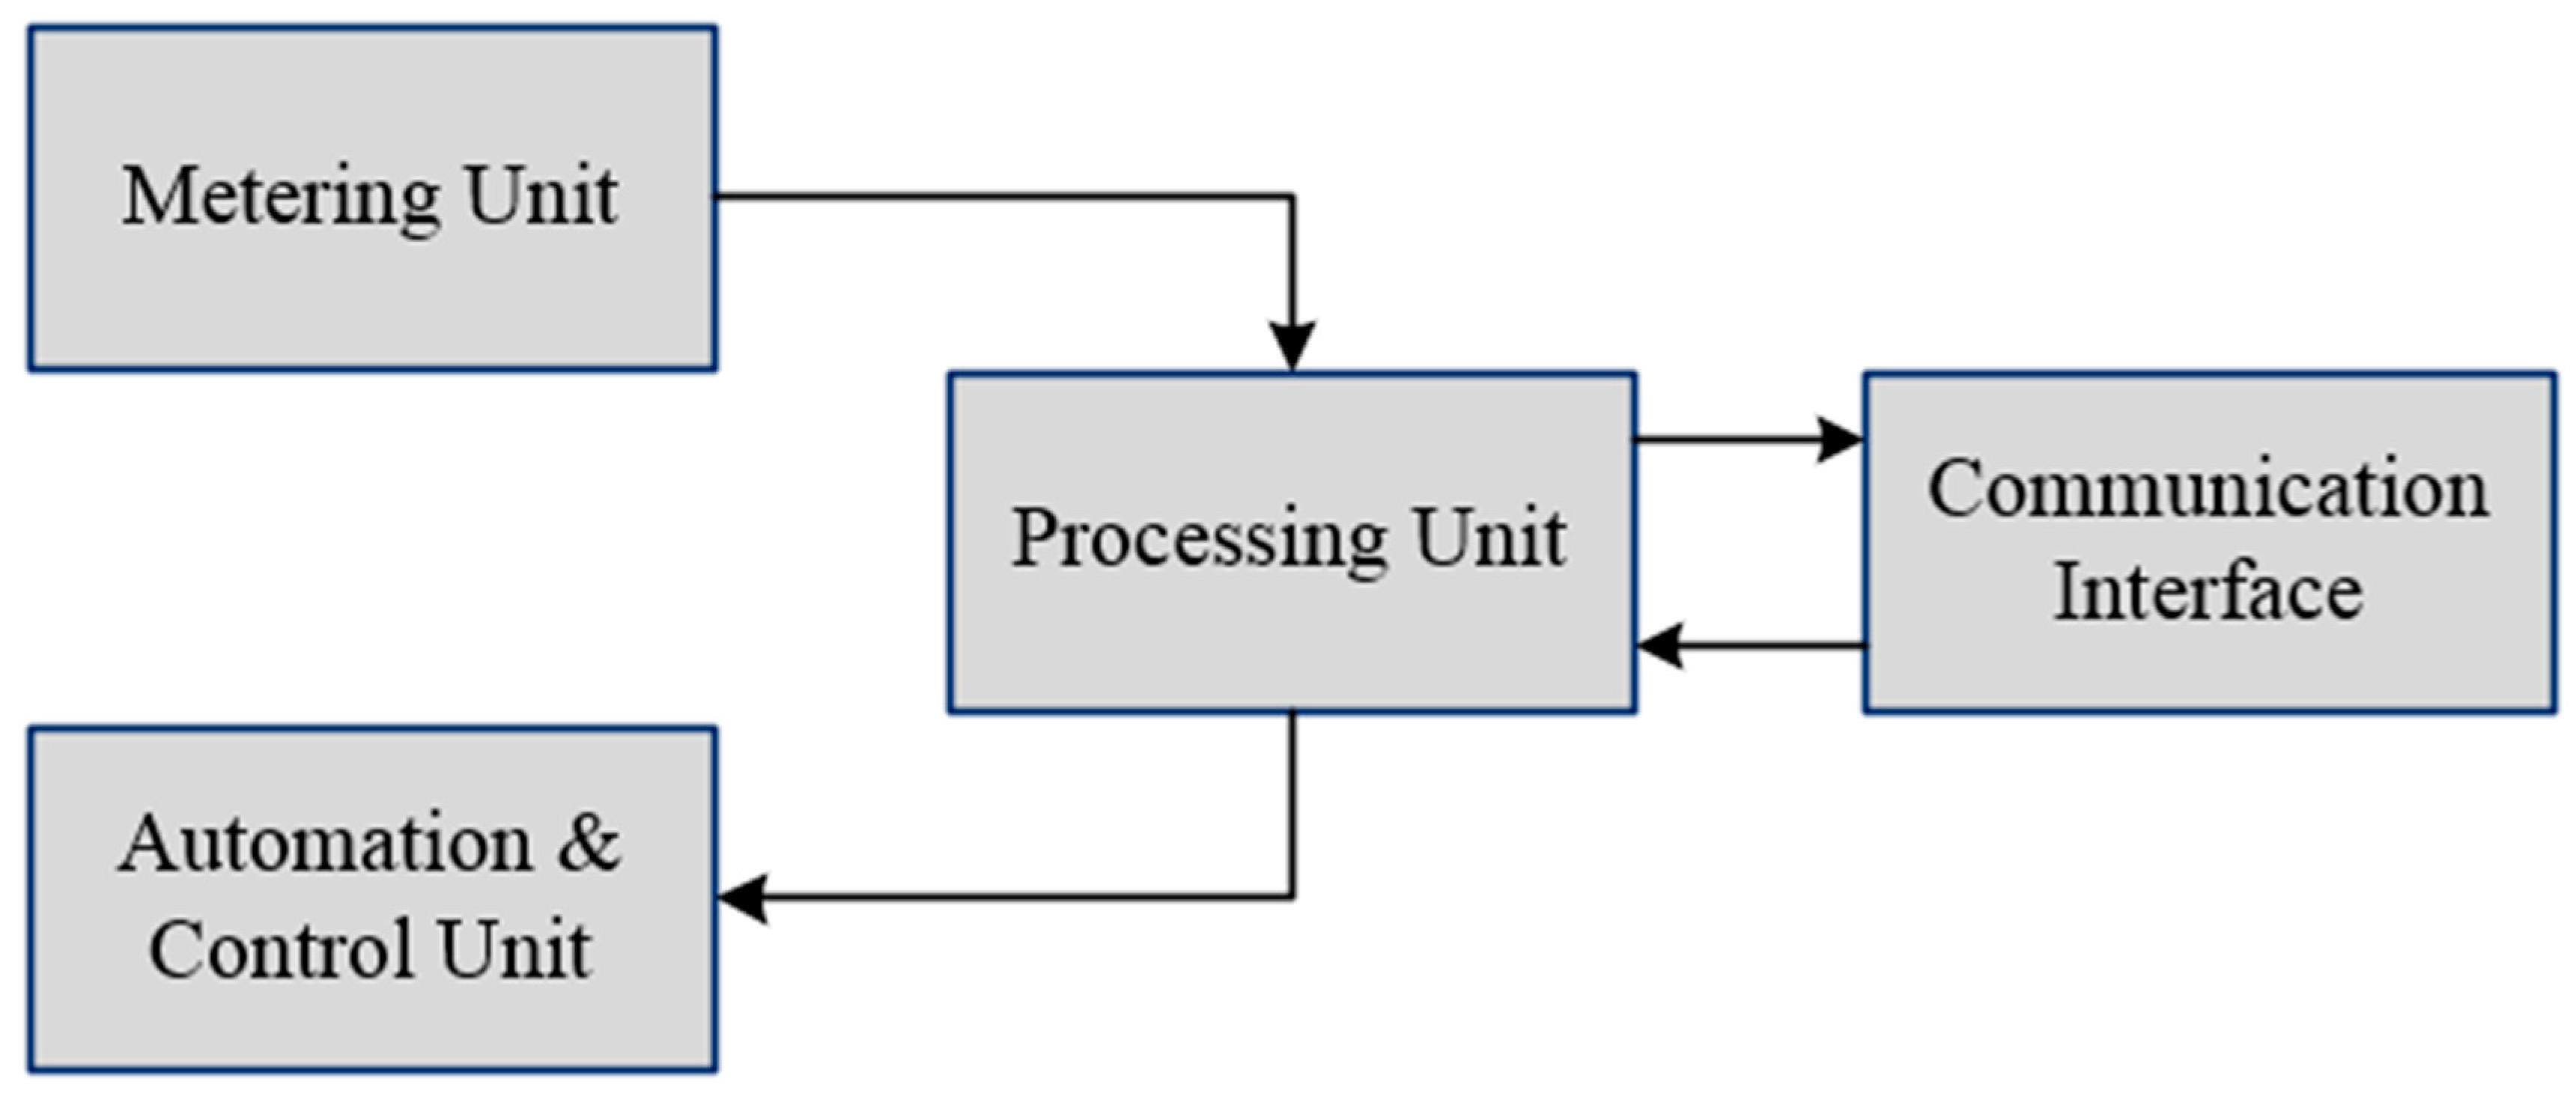
The energy usage is essentially measured by a smart meter. A voltage and current sensor, microcontroller, an LCD, and a web browser are used to compute energy usage. As demonstrated in Figure 10, a consumer can efficiently control energy use by computing power utilization from voltage and current per time [45]. This data is sent to the processing unit for calculation. A voltage and current sensor connected to the processor measures average real power consumption. The voltage sensor used here is a simple voltage divider [46]. There are four stages in measuring energy usage: metering, control, processing, and communication, as shown in Figure 11.

3.2. Functional and Non-Functional Requirements

The process of determining customer expectations for a system, and documenting, measuring, and testing these requirements to develop a system that fulfills the expectations is known as requirements analysis. While requirements analysis could be categorized in several ways, this research work concentrates only on two categories of needs: functional and non-functional.
The functional requirements are essentially the primary tasks that the consumer desires the software to perform. This article concentrates here on the system’s major functions, which includes automatic meter readings, estimation and processing of bills. As explained below, the system deals with two types of users: administrative users (utility’s workers) and consumers (buyers) [43].
  • Administration: The administration (employee) must have complete system access and should be able to handle client files such as adding new files, editing, deleting, and viewing client records, as well as managing the customer accounts such as creating new accounts, editing, deleting, and viewing customer accounts. Moreover, they must be able to monitor and assess consumer consumption, manage smart meter data, make tariff plans, generate reports, and respond to website warnings.
  • Customer: The buyer logs in using the login credentials provided by system administration and can perform tasks such as applying for connection, managing bank details like updating private information, viewing consumption, checking utility companies’ newsletters, viewing update utilization fees, complaining network maintenance, and requesting service un-subscription.
Non-functional requirements include that customers must be able to pay consumption costs by using credit cards. During login, customers will be authenticated to guarantee their legitimacy and access to only their authorized data/account. Non-subscribers can browse the website and apply for a new electrical connection, while subscribers can log in and forward the web page [43,47]. Smart meter features include the following items.
  • 30 min meter reading data
    Smart meters should provide 30 min meter values to a meter data management system (MDMS). When missing, MDMS can request the meter data using two-way communication.
  • Smart meter setting and control
    After receiving the request data from MDMS, the smart meter performs the desired reports and processes the findings to MDMS.
  • Terminal manually communication
    When the MDMS and smart meter communication network is unavailable, setting, meter reading, and control will be handled directly via an on-site manual interface.
  • Home Area network
    The research team requires smart homes to develop an interface for smart meters and home energy management systems (HEMSs).
  • Network Security
    Smart meters must be secured to protect against cyber threats such as unauthorized access, data leakage, or tampering.
  • Operation and Maintenance
    Smart meters automatically send facility management data to MDMS to help operate the large-scale network efficiently. The communication software of smart meters is updated remotely via a two-way communication network.

3.3. Electrical Distribution Companies (DISCOs) Detailed Situation Analysis

The distribution companies analyze technical losses, calculate losses in every voltage level of the electric network, and compare generated and consumed power. They compare calculated and measured losses by region and voltage level. Smart meters create supply-and-demand reserves, a consumer profile, and real-time imbalance detection. The system compares current and past indicators to create a daily aggregate profile. All single auxiliary transformers, communication lines, and telemetry stations will have smart energy meters. The installation of meters at the grid is complicated. Thus, a DISCO’s energy demand management team monitors all the transformers for successful installation of smart meters [48]. Numerous installation errors can affect the accuracy of energy measurements, such as mismatched measurements of transformers and inappropriate wiring. Smart meters can also detect installation problems and notify the utilities.
To satisfy the energy requirements of SAARC countries, local electric infrastructure must be modernized. The current electrical infrastructure is unable to keep up with the day-to-day increase in power use. Nevertheless, distribution companies dispatch employees to physically gather meter readings. Since most power distribution devices are not automated or computerized, the employee reads meters, checks for faulty equipment, and measures units of electricity consumption. In a traditional metering system in SAARC countries, SCADA stores all the collected data. This data is used to assess customer’s power consumption, predict bills and quarterly reports, and update consumer tariff plans. Distribution companies (DISCOs) use SCADA for network monitoring and Access, Excel, and other software for data storage [46]. The manual processes used by DISCOs for performing data collection, storage, management, backup, recovery, performance, and scalability are inadequate according to the current requirements in the energy sector.

4. Results and Discussions

4.1. Social Impact of Smart Metering in SAARC Countries

The implementation of smart meters in SAARC countries has multiple benefits. It depends on how electrical distribution companies use this technology. The societal benefits associated with the adoption of smart meters may be interpreted as the primary advantages against the capital investments [49]. The most important aspect related to the social welfare of society with the implementation of smart metering system is the creation of new job opportunities in the market. Smart metering infrastructure is a complex system having a vast communication network that can initiate different work opportunities for the people. Furthermore, it can introduce the concept of demand response to use the available energy resources in an economical way. The smart system will be able to provide the facility of readily accessible electricity usage data to consumer that leads to better management of their usage patterns. It will result in a reduction of the monthly bills and will encourage the consumers to participate in several demand response schemes offered by the utility companies [50].
To realize the advantages of smart meters, there is an elementary need that customers should be enthusiastic for the acceptance of this technology. The opposition can be commonly observed in the expansion of other energy development projects, so it can slow down the implementation of the smart metering system. Recent rollout projects of smart meters in SAARC countries suggest that the successful execution of the smart metering system is questionable unless it is appropriately directed to users’ viewpoint [51].
Conventional norms and ethics often resist new technology. Inadequately addressing society’s concerns about new technology slow its implementation and acceptance. The triumphant deployment of the new technology mainly depends on the widespread acceptance by multiple ranges of people and societies. The acceptance of smart meters by the consumers is commonly diminished by different fears, which are mostly related to the escalated energy bills, violation of the privacy of their usage data, and being unable to control the electricity usage. It is important to change public perception of this new technology and gain public trust for successful implementation [52].
The electricity usage data of the consumers in Smart metering system can be used unethically to discover residents’ activities. This raises security and privacy concerns among its users. The Netherlands addressed privacy concerns in 2008 during their smart metering roll-out project. Dutch laws set standards for smart meters, ensuring privacy and data protection [53]. For social acceptance, the country’s legislation introduces flexible consumer functions. Consumers could turn on and off smart meter functions. These issues are crucial for consumer acceptance of smart meters [54]. The social importance and acceptance can be realized and magnified if the electricity consumers discern the usefulness of smart meters for the environment and society. For example, Sweden’s law subsidizes consumers who use smart meters for hourly electricity tariffs. This example was followed later on by Denmark and Finland [55,56].

4.2. Environmental Impact of Smart Metering in SAARC Countries

Smart meters play a vital role in the reduction of greenhouse gas (GHG) emissions, as different consumers can participate in demand response plans and can reduce their energy consumption with the usage of smart meters. This device is a bit expensive and incentivizes off-peak consumption. By reducing peak demand, utilities will be in possession to increase load factors and diversity factors of the respective grids. Smart meters can offer various Demand Side Management (DSM) techniques and can help to conserve energy resources [57]. Recent research has explained that implementing a smart metering system could lead to a constructive impression of reducing energy consumption and minimizing peak demands. On average, one house with four people emits around 543 kg CO2 annually. With the introduction of home automation using a smart metering system, this figure can be reduced to 473 kg CO2 per year [58]. A net 70 kg CO2 emissions per year from one house can be saved by implementing smart meters at the domestic level.
India and Pakistan are the major emitters of greenhouse gases in South Asia. The GHG emissions in SAARC countries in 2021 are estimated in the millions of tons. After the implementation of the smart metering system in some areas, this figure was lowered by 5% compared to the previous year’s emission [59]. The smart metering system allows more flexibility in adjusting the energy consumption in homes. This consequently reduces CO2 emissions and reduces its impact on climate change.

4.3. Cost–Benefit Analysis of SAARC Countries

A cost–benefit analysis was performed for all SAARC countries and the results are explained in this section. The assumptions for the cost–benefit analysis are shown in Table A3 in Appendix A.
Pakistan: In 2021–2022, the total electricity generation capacity in the country was reported as 41,557 MW and the annual consumption was 89,361 GWh [60]. Only 29,000 smart meters had been installed or replaced with the old ones in different areas [4]. The government decided to invest PKR 30 billion in the smart meter project for LESCO (Lahore Electric Supply Company) and PKR 17 billion for IESCO (Islamabad Electric Supply Company) [61]. The estimated price of the smart meter unit is PKR 14,200 in Pakistan. Tax applied on a smart meter is PKR 2414 in 2021 as the tax rate is 17% in Pakistan. The cost of a smart meter is affordable to roughly half of Pakistan’s population. An interest rate is about 15% with the cash flow of PKR 3000, which is the same for 12 years, and the net present value (NPV) is PKR 2055.
India: In 2020, the annual electricity production in India was 1383.5 TWh (1,383,500 GWh) [62]. A total of 3.73 million smart meters have been placed countrywide as of January 2022, out of a total allocation of 11.16 million smart meters [63]. India proposed a budget of INR 220 million to convert conventional electricity meters into smart meters by the year 2022. Smart meter prices vary from company to company for all users who use more than 200 kWh of electricity per month. It is reported that approximately 35 million potential clients consume more than 200 kWh per month, and smart meters’ total cost can be assumed as INR 21 billion [64]. In 2021, India had over 2 million smart meters installed across the country by various entities [65]. The Indian government budgeted INR 220 billion for the renewable energy and power sectors in the financial year 2020. In India, 18 million smart meters had been developed as of 2019. India will invest USD 25.9 billion in smart meters and grids to modernize its power sector [66]. The approximated cost of the smart meter unit in India is INR 12,475 with an interest rate of 4.9%. The tax rate is 18% in India which will be INR 2245.5 for a smart meter in 2021. The cash flow for this project is INR 2500 for the next 12 years. Thus, the net present value is 9805 INR. The total number of houses in India is 248.8 million, and the energy sector has the same requirements for smart meters [67].
Bangladesh: The total electricity generation capacity in Bangladesh is 25,700 MW and the annual electricity consumption in year 2021 was 80,000 GWh [68]. In 2020 and onward, power distribution companies planned to install 8.8 million smart prepaid meters [69]. The German government granted BPDB EUR 4.09 million for the cost of a pilot prepaid metering project in Chittagong [70]. Per day energy generation in Bangladesh is 12,000 MW. A smart meter costs around USD 1050 with a tax rate of about 15% (USD 156) in 2021 and an interest rate of 5% with a cash flow rate of USD 200 for the next 12 years, typically more than conventional meters costing between USD 100 and 500. Thus, the net present value must be USD 732 [71].
Nepal: In July 2021, Nepal’s annual electricity production was 6052 GWh. and in 2020 it was 6012 GWh [72]. In Nepal, 1.5 million households have available electricity, and the total system energy needed was 8960.31 GWh [73,74]. Nepal carried out six smart meter projects by 2021, deploying 450,000 smart meters by May 2021, 3 million smart meters by May 2023, and a total of 5 million smart meters by May 2025 [75]. Nepal assigns NPR 62.47 billion to the energy sector [76]. Electric meter box price ranges from NPR 21,000–24,000. The tax rate is 15%, costing NPR 3218.1 for a smart meter in 2021 in Nepal. The present cost of a smart meter is NPR 21,454 with a cash flow of NPR 4000, an interest rate of 11.06%, and NPV becomes NPR 4433.
Bhutan: In 2020, the total energy production in Bhutan was 7880 GWh, and annual electricity consumption was reported as 2180 GWh [77]. There are about 163,000 houses in Bhutan. About 96% of houses use electricity for lightning. Bhutan imports smart meters and has a 50% tax rate of RTN 11,250 for a smart meter in 2021. The smart meter price in Bhutan is quite high, which is RTN 22,500, with cash flow being the same as RTN 4200, the interest rate of 12.9% for the next 12 years, and NPV must be RTN 2457. Approximately the same number of meters are needed to be installed in Bhutan to accommodate utility users [78].
Sri Lanka: Total electricity generating capacity of Sri Lanka is 4086 MW and the annual production is 14,671 GWh [79]. In Sri Lanka, power is available to the entire population [80]. The ANTE LECO Metering Company produces 2000 new smart electric meters daily and has already sold nearly 100,000 smart meters in the country [81]. The union finance minister Nirmala Sitharaman has proposed a budget of LKR 220 million to convert conventional meters into smart meters. The tax on a smart meter is LKR 16 in 2021 as the tax rate is 8% in Sri Lanka. A smart meter price ranges from LKR 10–200, and here LKR 200 is taken. The profit per year is LKR 50 with an interest rate of 19%. Thus, the net present value becomes LKR 30 for the next 12 years of this project. A smart meter is also essential for optimal operation if the end-user incorporates a solar or other renewable energy source.
Maldives: The Maldives consists of 1200 small coral islands and 26 solar hybrid microgrids connected with a shared SCADA system for monitoring and control. A number of 68,249 resident households were counted in the 2014 Census. STELCO’s smart meters record electricity uses for billing and monitoring. The Maldives produces 402 GWh electricity annually, while its annual electricity consumption is 373.9 GWh [82]. A total of 26 island microgrids in the northern Maldives have 3.2 MWh battery storage, 2.65 MW of solar capacity, and diesel backup. A 100 kW PV system on Fohdoo supplies electricity to one-third of the island, saving 35,000 L of diesel yearly. The tax rate is 6%, which costs MVR 1976.1 for each smart meter in 2021 in the Maldives. Smart meters are imported and have a bit high pricing of MVR 32,935 with a cash flow of 6000 each year, the interest rate of 7% and NPV must be MVR 14,710 in the Maldives. This is a bit higher due to high inflation in the country. Most consumers use solar power; thus, a smart meter can limit energy expenses by sending power to the grid during the day and drawing it at night.
Afghanistan: Total local annual electricity production in Afghanistan is 1000 GWh, while the annual energy demand is 5530 GWh [83]. Afghanistan’s access to electricity (% of the population) was reported at 97.7% in 2020 [84]. Total meters are assumed to be 1 million. The average electricity tariff increased from 0.8 to 0.12 per KWh on a yearly basis. From 2013 through 2016, 3 billion dollars was allocated to the power sector [85]. Smart meter price is USD 150 in Afghanistan with a cash flow of USD 35 per year. Afghanistan imports smart meters and has a 20% tax rate of USD 30 for one smart meter in 2021. The interest rate is 12.14% for cost–benefit analysis, and NPV becomes USD 65.
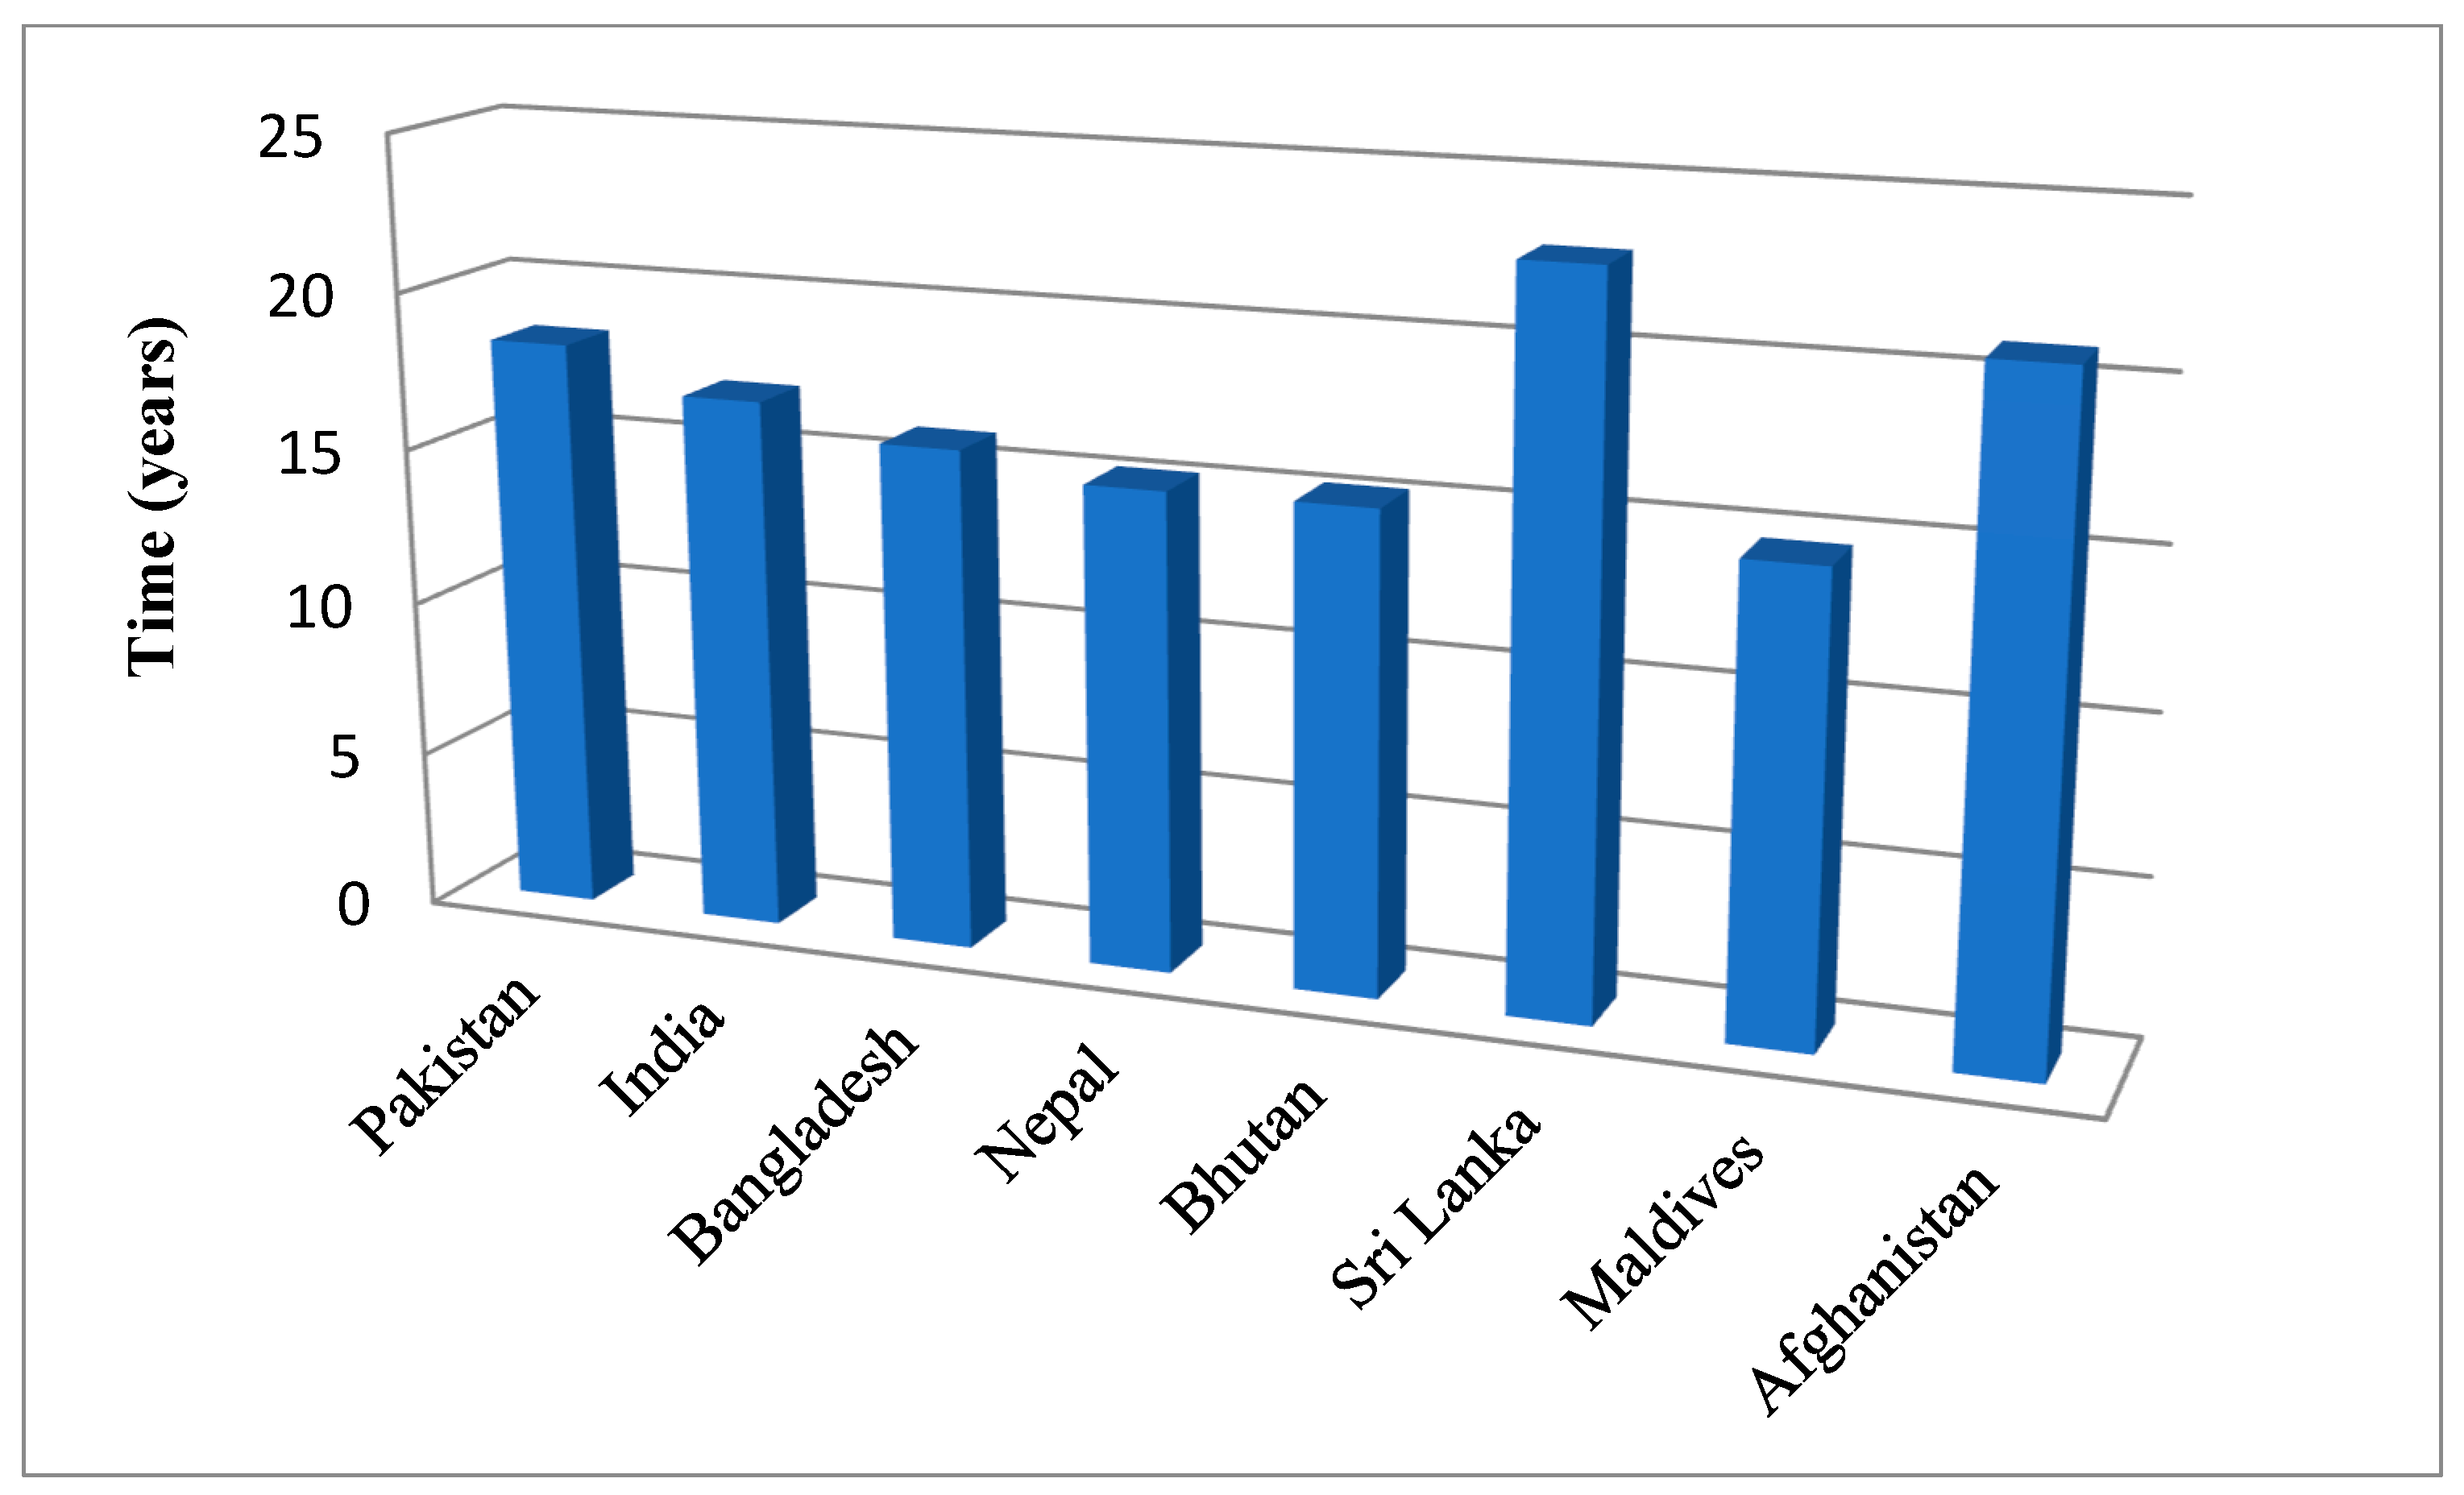
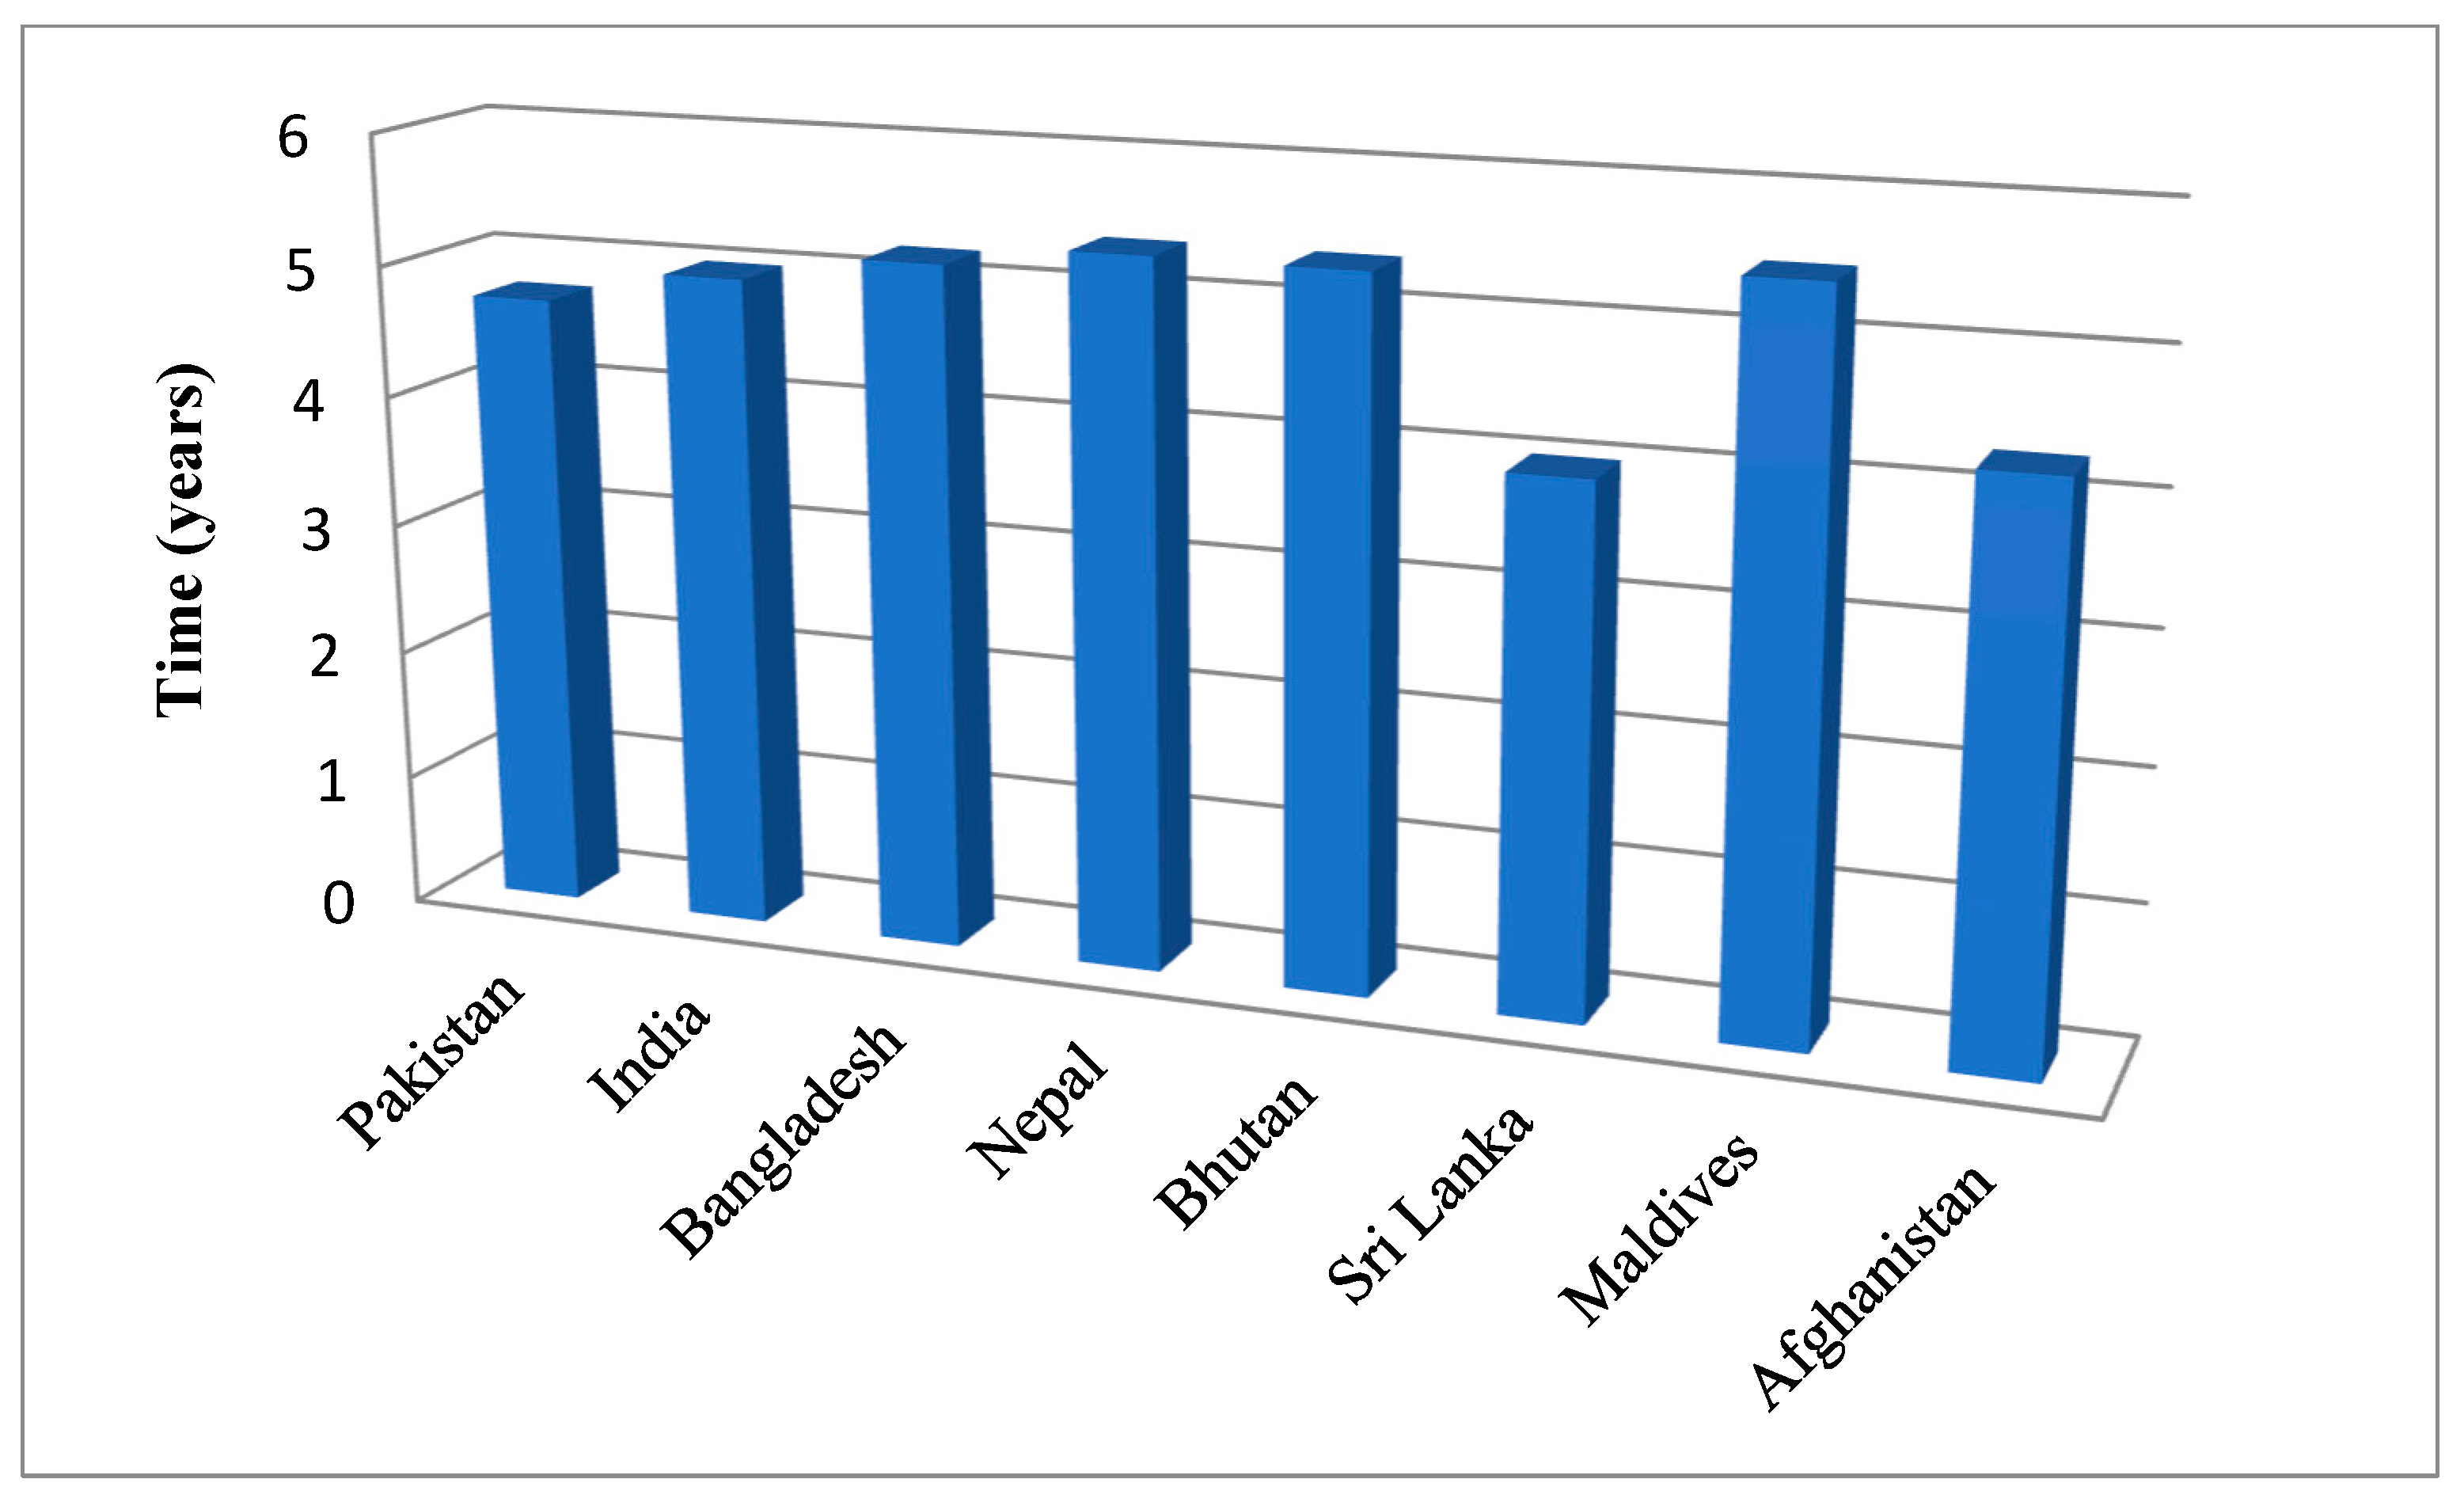
The cost–benefit analysis of smart meter systems for SAARC countries’ internal rate of return and payback period is exhibited in Figure 12 and Figure 13.
A single reference feeder was selected that is operational under the control of an electrical distribution company. Then, non-technical losses associated with the utility’s use of the traditional billing system were analyzed. The capital cost of implementing smart metering infrastructure in that feeder was then calculated. This cost comprises fixed costs and operational and maintenance costs (O&M). The fixed or one-time applied cost includes procuring the required equipment for the implementation phase. However, operational and maintenance costs are variable costs that are estimated for five years. After that, the benefits that can be achieved with the implementation are analyzed in detail. In the end, the cost–benefit ratio and break-even point were calculated.

4.4. Reference Feeder Analysis of Abbottabad, Pakistan

We selected feeder “CANTT. NO.1 PSR”, working under Peshawar Electric Supply Company in Abbottabad, KPK, Pakistan, for reference in this study. This feeder is connected to the “132 KV Grid station” on Murree Road, Abbottabad, Pakistan. The total number of feeders connected with the grid is 14. The number of domestic consumers being fed with feeder “CANTT. NO.1 PSR” is 7500. The electricity usage data of the reference feeder for one year is given in Table 2.
The total kWh supplied to the consumers of the reference feeder was 17,769,000 for the year 2020/21, while the feeder faced 16% of non-technical losses and was only paid for 14,925,960 kWh. We will estimate the total cost of implementing the smart metering system for this feeder. The cost of the smart meters required for the consumers fed by the selected feeder is explained in Table 3.
This is the part of fixed cost. The estimated cost for installing smart meters at consumers’ premises is PKR 60,000,000 [86]. We considered the “RF Mesh network” in the neighborhood network as a communication medium. While collecting complex data coming from the consumer’s side, a data concentrator unit (DCU) should be installed. For optimal results, at least one data concentrator unit is required per 100 energy meters [87]. There are 7500 consumers attached to the feeder, so we will need to install 75 data concentrator units for the selected feeder. The detailed estimated cost for the installation of the “Neighborhood Area Network” is explained in Table 3, which also comes under the fixed cost category [86,88].
The estimated cost for installing the Neighborhood Area Network was PKR 8,250,000. The overall smart system installed at the utility end consists of a Head End System (HES), a meter data management system (MDMS), a computer hardware and networking system, and System Integration. The respective costs are given in Table 3, which are also fixed costs. The cost given in Table 4 is the overall cost of installing a smart metering infrastructure in a grid station. We are considering only one feeder, so the total number of feeders connected with the 132 kV grid station is “14”. Consequently, this cost is divided by 14 to get the average cost for one feeder [86,88]. The estimated cost for one feeder is PKR 17,142,857. If we sum up all the mentioned fixed costs, the total fixed cost becomes PKR 85,392,857 (=60,000,000 + 8,250,000 + 17,142,857).
The Operational and Maintenance cost (O&M) is variable. We used five years to estimate the variable cost. The first cost under the O&M category is the “annual maintenance of installed smart meters” at the consumer’s end. We set the cost with the ratio of 2.5% of the total cost of the installed smart meters per annum. “Data concentrator unit” (DCU) maintenance will fall under the second category. The overall annual cost of the data concentrator unit is computed as 2.5% of the cost of the unit itself. The third category was “Annual maintenance of Head End System”. This cost was calculated with a ratio of 20% of the total cost of the Head End System per annum. The fourth category was entitled “Meter Data Management System Annual Maintenance.” The entire cost of the meter data management system is determined by the ratio of 20% of the total cost. Computer hardware and networking systems are put into yearly maintenance in the fifth category; 10% of the total cost of the computer hardware and networking system was used to estimate this cost [86,88]. All these costs are given in Table 4.
To calculate the overall costs for the implementation project, we add up the fixed and variable costs, and the total cost becomes PKR 101,866,000 (=Total fixed cost + Total variable cost = 85,392,857 + 16,473,214). An interest rate of 7% to the overall cost for 5 years accumulates to the total cost of PKR 137,519 million.
Now, the benefits associated with the project’s implementation will be estimated. The first benefit will be the cost savings associated with the meter reading. Around PKR 30 per month can be saved for each user because the meter reader will no longer be required to record energy consumption data manually, and this data will be free of human error. Table 5 summarizes the expected savings in this category:
The second advantage is the cost reduction associated with manual data entry and bill calculation. With a smart metering system, approximately PKR 15 per month can be saved per consumer compared to manual data entry and bill computation. The estimated savings for this category are provided in Table 5. The primary benefit of implementing a smart metering system will be the reduction of non-technical losses (electricity theft). From Table 2, we can see that the total units supplied by the feeder for the period February 2020 to March 2021 were 17,769,000 kWh. At the same time, the return units for which PESCO was paid were 14,925,960 kWh. Thus, the utility faced a loss of around 16% for the reference feeder. With the implementation of a smart metering system, this loss can be reduced to 6%. The utility will benefit from saving the cost of reducing electricity theft by up to 10% [86,88]. The benefit of reducing non-technical losses was calculated in Table 6 based on a rate of 1 kWh at PKR 18.
Summing up all the benefits are shown below:
  • Annual benefits = 2,700,000 + 1,350,000 + 31,804,200
  • Annual benefits = PKR 35.854 million.
If we analyze the total benefits against the applied cost, we get a ratio of:
  • Pay-back period = Total Cost/Total Benefits = 137,519,120/35,854,200
  • Pay-back period = 3.835 years
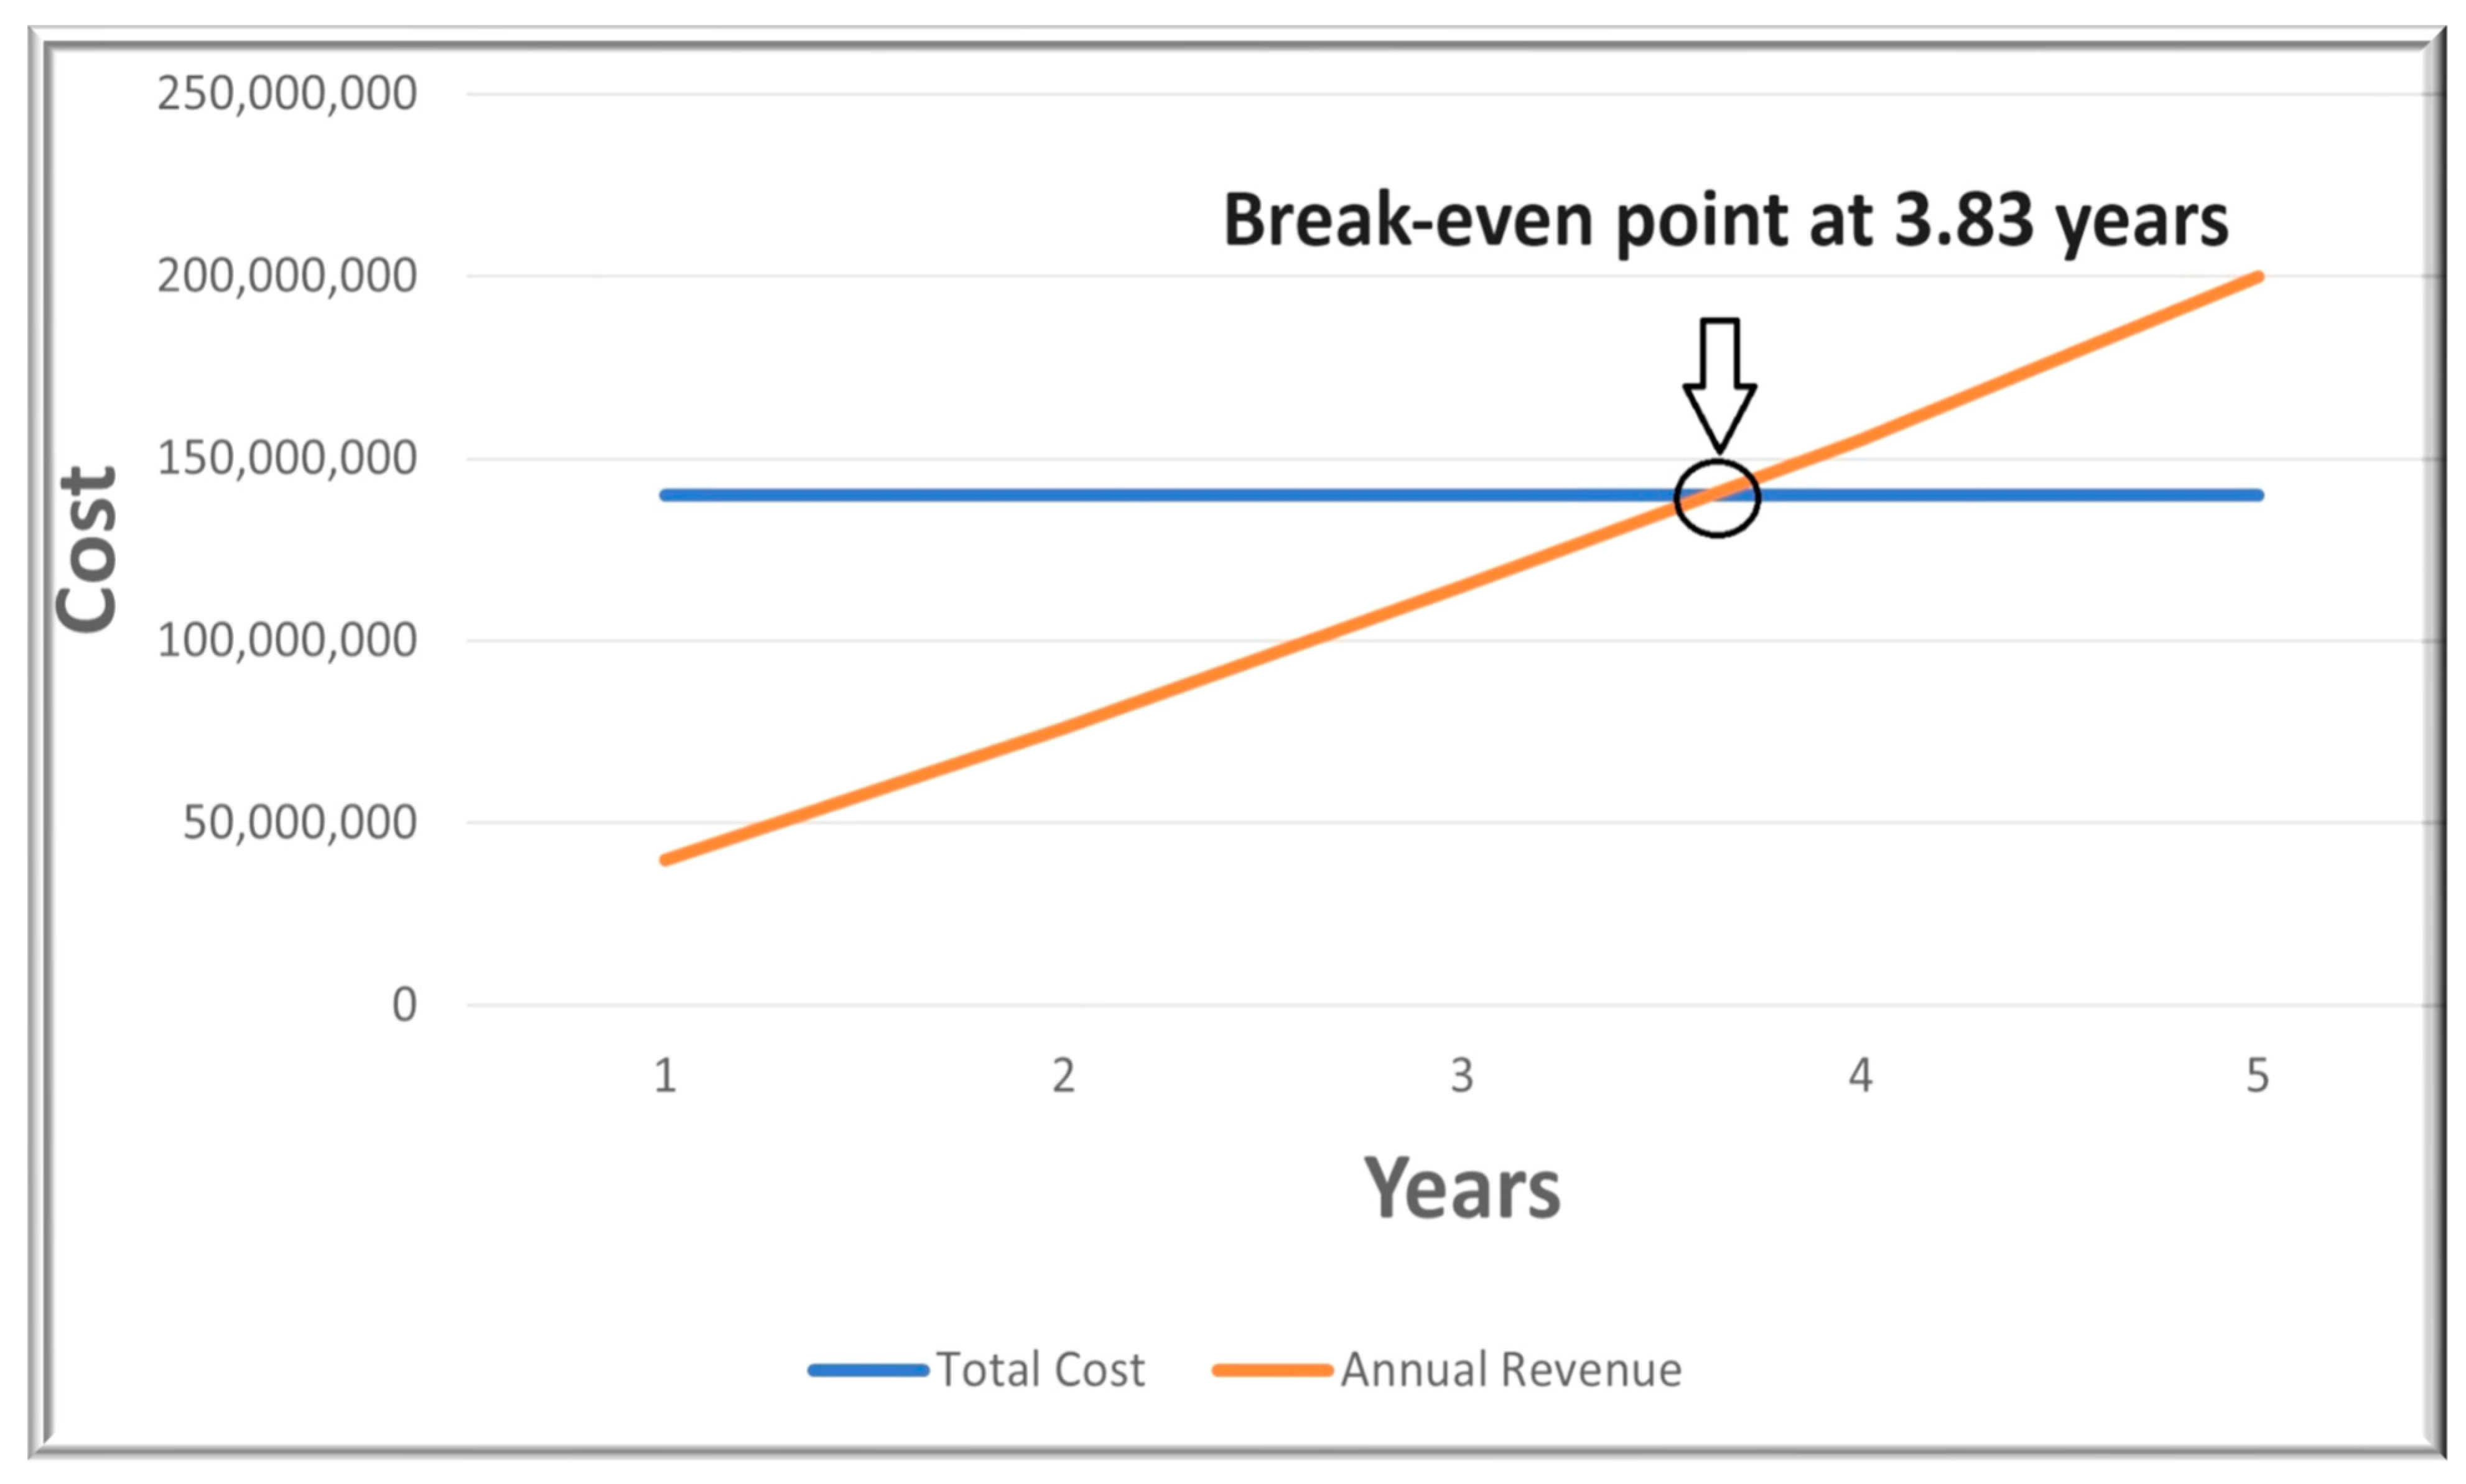
  • The break-even point is explained in Figure 14.
The calculated break-event point for the proposed project is 3.835 years. This project can recoup its capital costs within this time frame. The revenue generated cuts the cost graph at the value of “3.835” years, indicating that the proposed project was capable of covering its applicable costs during this time and will move to the profit portion after this period. The proposed project’s application cost can be covered by operational gains such as reduced electricity theft, bill computation, meter reading savings, increased consumer services, and faster outage detections. Only electricity theft and meter reading savings were considered here for the calculations.

4.5. Cost to Benefit Ratio of SAARC Countries

In cost–benefit analysis, the benefit-cost ratio (BCR or cost–benefit ratio = benefits/costs) measures an asset or project’s ability to generate cash flows. The BCR is the ratio of the project’s benefits to the present values of a project’s costs. If BCR > 1, the asset or project will yield a higher value. HXE12 static single-phase RF enabled energy meters to assess electric energy for single-phase two-wire residential and commercial users. The meters meet with IEC 62053-21 and 62052-11 [89,90] and WAPDA standards for accuracy class 1. These meters employ low-energy radio waves to send data.
The Three-Phase Electronic Electricity Meter HXE 34 measures active and reactive energy, maximum demand, and multi-tariffs for industrial clients in three-phase networks. The meter meets IEC 62053-21, IEC 62052-11, and WAPDA Standards [91]. The measurement system uses a high-quality measuring IC. Measuring elements are shielded from external magnetic fields up to 0.5 Tesla, over-voltages, and high-frequency disturbances [92]. This type of metering element ensures outstanding metering features, high metering reliability, little effect of influence quantities, and no re-calibration over the meter’s lifetime.
The seven-segment LCD displays eight-digit measurements (all integers or multiple decimals). Each parameter/quantity has an LCD ID. The symbol representing energy flow direction, tariff flags, and meter status are also shown. The meters register energy at different rates with hour-by-hour and minute-by-minute resolutions. Seasons and holidays can be configured for up to four tariffs. Smart meter costs differ in all countries, and the benefits and cost–benefit ratios are shown in Table 7.
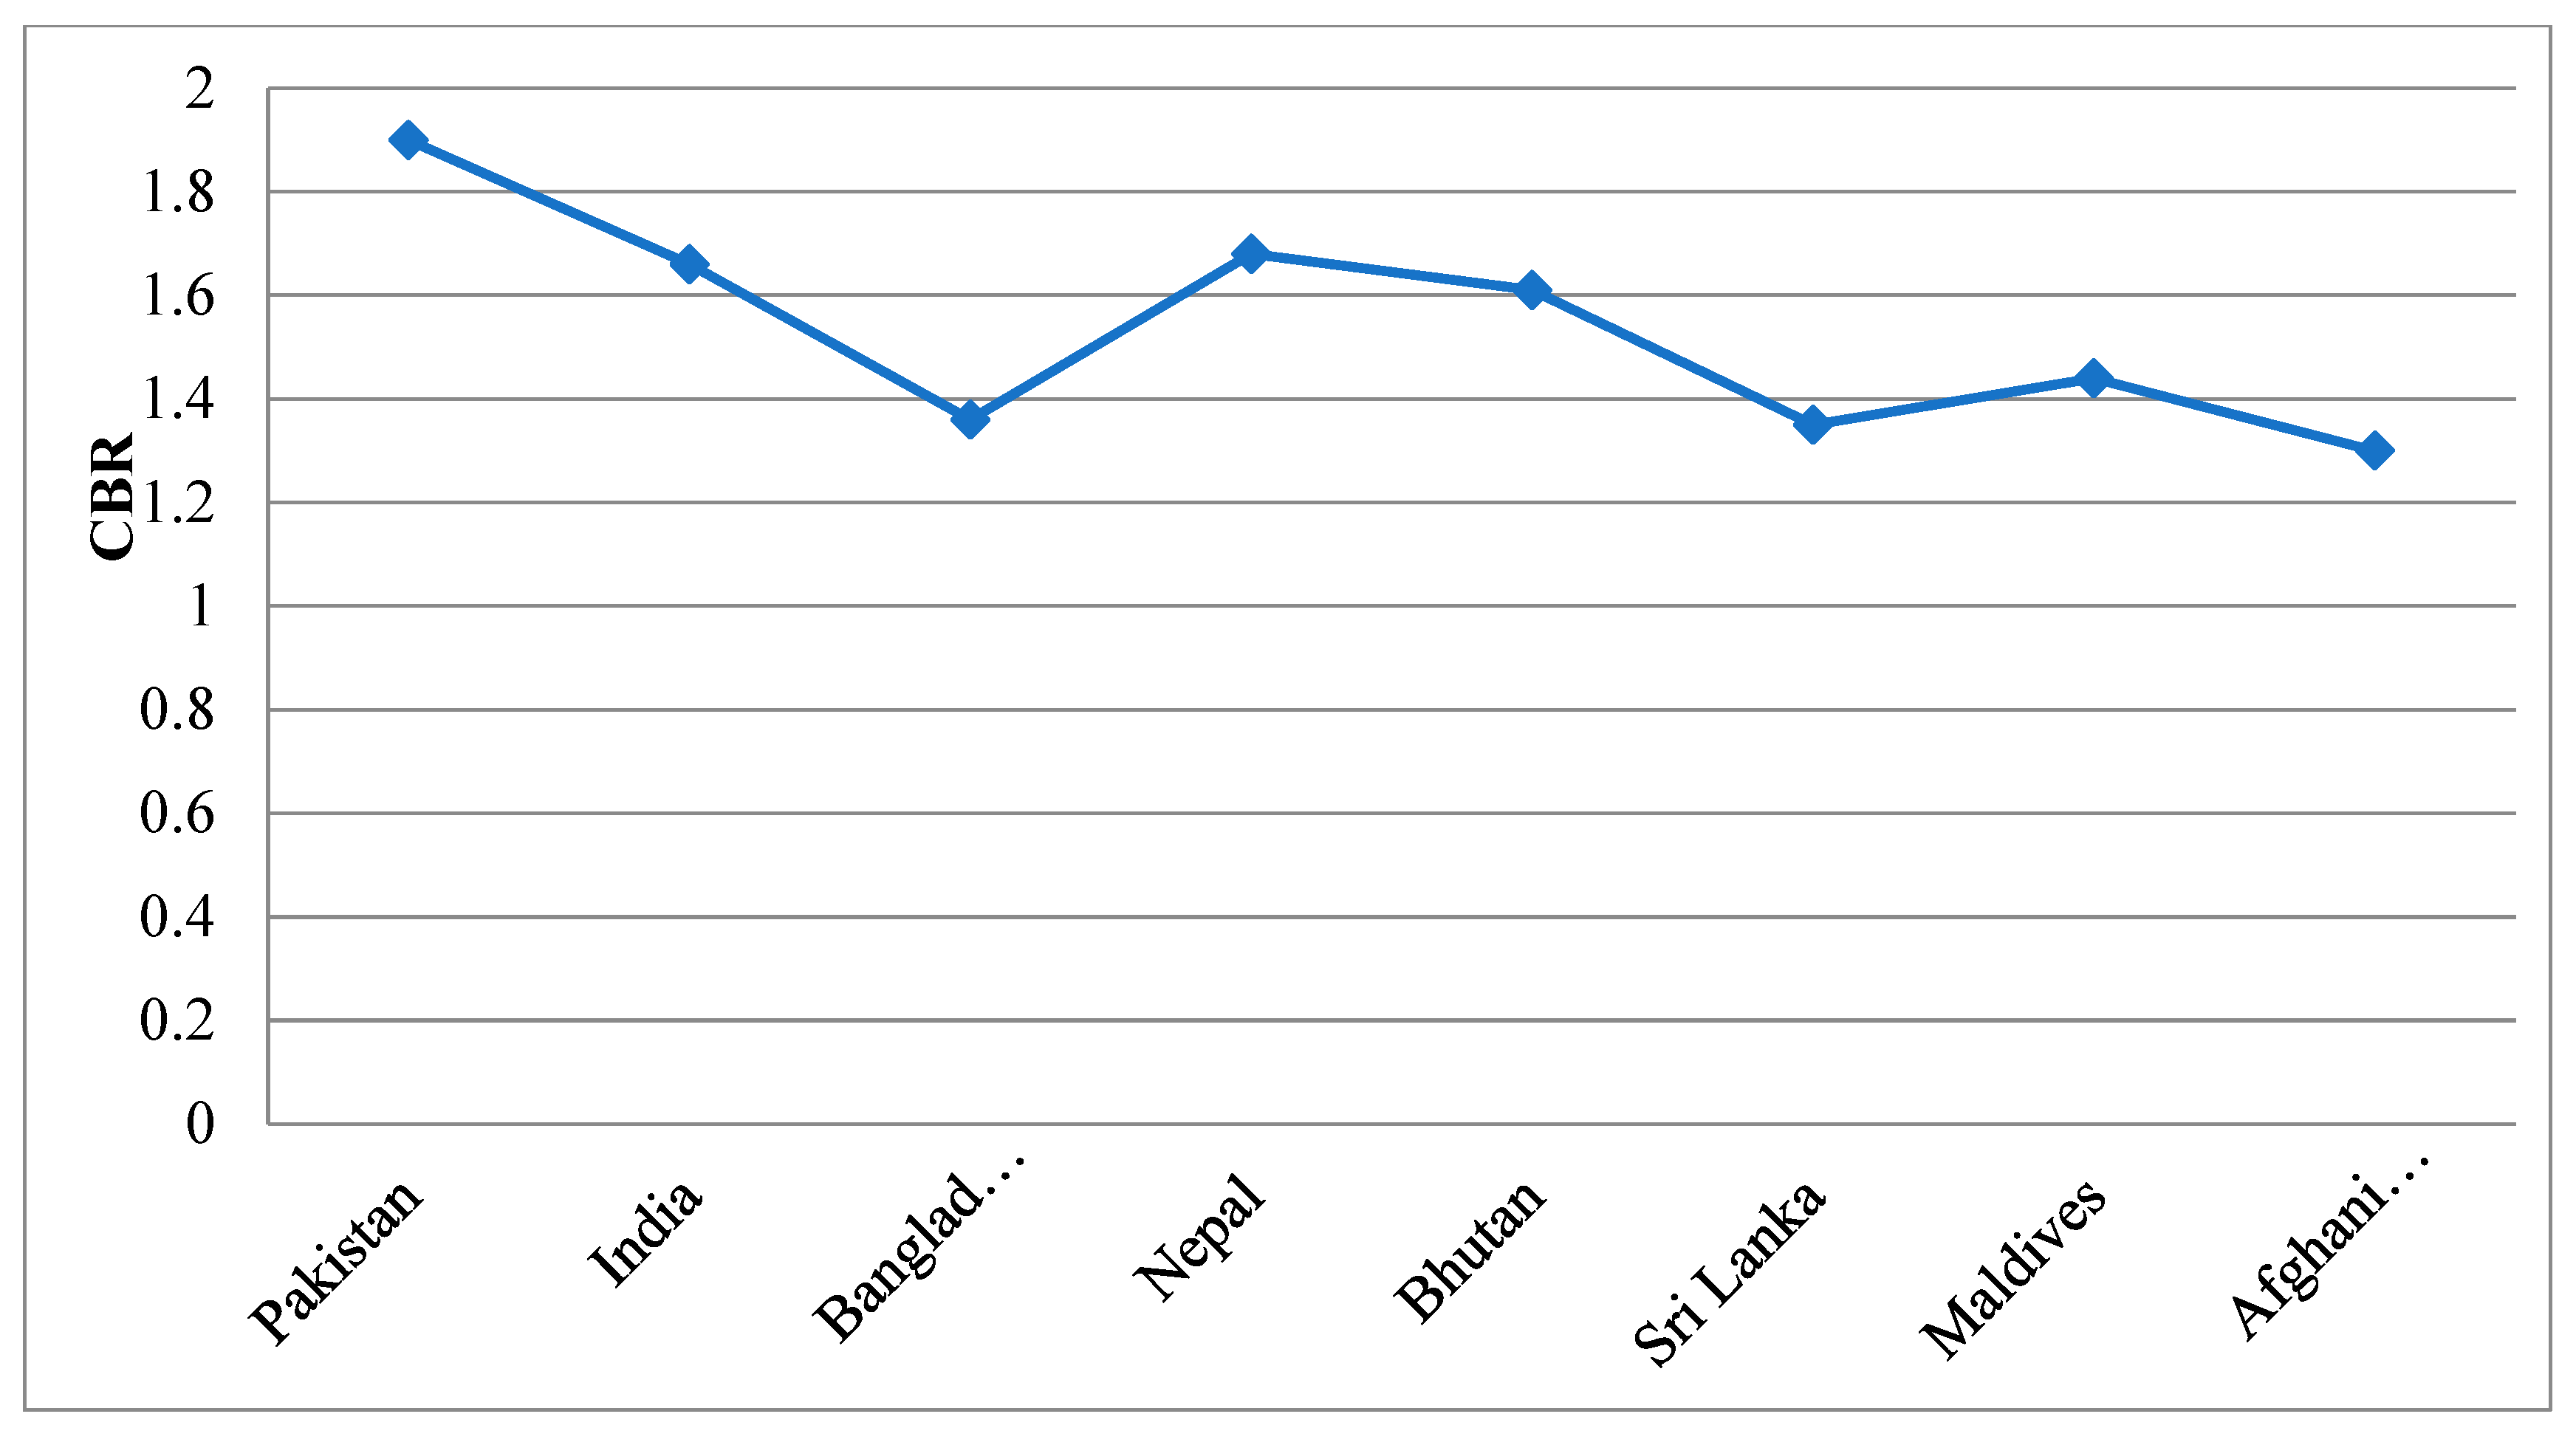
Pakistan has set aside a sizable budget for the installation of smart meters, costing PKR 14,200 per meter and offering the highest cost–benefit ratio among SAARC nations at 1.9. Afghanistan invests a very low budget in the energy sector and smart meters, with a minimum cost–benefit ratio is 1.30 for smart meters. The cost–benefit ratio is illustrated in Figure 15 of smart meters in SAARC countries.

4.6. Current Challenges in the Adoption of Smart Metering

Some major challenges in implementing Smart metering infrastructure for SAARC countries are discussed [93,94,95,96,97].
  • Mega-scale computing networks, bequest grid stations, smart electrical products, and complicated communication technologies will be the biggest obstacles for developing nations.
  • Smart meter design, implementation, and maintenance are expensive. Investing billions of dollars in a smart metering system is difficult. The project must be seen as a societal need while raising energy consumption and limited resources.
  • Due to poor distribution system infrastructure in developing countries, it is very difficult to synchronize this smart technology with the existing distribution network. Thus, smart meters are attached with integrated devices used only when all the electrical appliances and different distribution network devices are incorporated into the communication network. With the increase in customers, integrating the devices will become more complicated.
  • Consumer data is collected and sent continuously. This repeating process is costly. This system also comes with privacy and cyber security risks. Continuous customer communications with the utility can show the residence’s existence and appliance usage. Distribution companies will struggle to establish mechanisms to authenticate administrators for clients to determine transmittable parameters.
  • Smart meters can help utility design demand-side management techniques to reduce energy consumption and offer solutions to control consumers’ appliances. Energy-saving solutions can enable the utilities to use existing sources without creating a new generation or transmission infrastructure.
  • A smart metering system involves large data transfers between smart meters and a utility server. Managing and storing this huge data is tedious. Before adopting a communication network, numerous technical questions must be answered, like some communication networks have poor bandwidth and excessive traffic, due to which data transmission volume is reduced.
  • The project’s capital cost increases when integrated modulation, data storage, and demodulation equipment are added. Client security and privacy will be at risk if a cellular network is used to reduce project costs. Some communication networks are cheaper to set up and keep up than others, but utilities may have network limits, coverage, data capacity, and broadcasting problems. Moreover, damage to wired communication stops data flow and utilizes a lot of energy.

4.7. Future Perspectives of Smart Metering

In connection with the transition to smart grid technology, smart meters have intelligent capabilities and can play a versatile role in meeting consumer demands. Smart meter can measure and communicate comprehensive instantaneous electricity consumption and offer better control of electricity usage, facilitating real-time monitoring and offering real-time pricing at the consumer’s end. They analyze the electricity usage data transmitted back to the grid, so the utility companies should be aware of the electricity usage pattern of the respective consumers [98].
This smart technology appears to be the most significant innovation in the energy distribution sector in recent years and is indispensable for all market participants. A smart metering system can:
  • Offer a solution to the utility companies seeking a reduction in meter reading costs;
  • Provide the way-out to operators looking to modernize the grid station;
  • Propose the best solution for governments to achieve energy saving and efficiency goals.
Smart meters offer a variety of functionalities that utilities may adopt in the future to enhance their functionality and provide additional services to their customers. Demand-side management is one of the most vital applications that utilities may adopt with smart metering system rollout. Demand-side management is a terminology that is frequently used to refer to the programs that utilities can implement to manage the energy usage pattern of their consumers. Several energy-saving schemes can be introduced to maximize the efficiency of available energy resources without demanding new generation facilities and transmission frameworks [99]. The major examples of demand-side management programs include demand response schemes, energy conservation plans offered by utilities, fuel trade-off plans, and residential and commercial load monitoring and management schemes. Residential load management programs typically focus on lowering energy usage, encouraging consumers to adopt more energy-efficient consumption patterns, and building energy-efficient structures [98,100].
Currently, most developing countries have no concept of adapting DSM techniques. Due to the unavailability of any direct communication platform with their customers, utility companies cannot offer any DSM application to their consumers. Implementing a smart metering system will enable utility companies to offer various functionalities like “Time of Use” tariffs and DSM technologies to maximize the efficiency of available energy resources [98]. Another important application offered using smart meters is the “home energy management system” (HEMS). It is a mesh network that aids in managing a household’s electrical power supply to reduce energy consumption. A smart metering system enables the communication between the utility and home network services by implementing automated meter management and automatic meter reading via smart energy meters. A smart meter is considered a critical element in building an advanced metering infrastructure that monitors the energy usage of several home appliances [101]. Smart meters can transmit energy usage data from consumers to utility companies. This data can be used to make electricity generation and distribution decisions and prepares consumer bills. The utility companies will be able to transmit cumulative energy usage data, associated pricing, and power control commands to the smart meters installed at the consumer’s end. This enables displaying the information on an in-home display that will encourage the customers to reduce their energy consumptions specially during the peak load [102].

5. Benchmarking Analysis

5.1. Social Perspectives (Community Grid)

In most developing nations, like Pakistan, the power the import/export ratio is unbalanced in various SAARC grids like IESCO in Pakistan, where import is 39% and export is 61%. This power mismatch is negatively impacted the returns and earning of DISCOs. The unit rates in NM have decreased from 22 Rs per kWh to 11 Rs per kWh, hence discouraging the NM regime. In this section, a solution is proposed in terms of community microgrids, presented from Pakistan’s perspective as a case study. Such a solution encourages indigenization of the local resources and a win–win situation amongst the stakeholders. This study has categorized the following community grids:
  • Cat-1: Low-scale residential community, including 6 homes;
  • Cat-2: Medium-scale residential community, including 12 homes;
  • Cat-3: Large-scale residential community, including 18 homes.
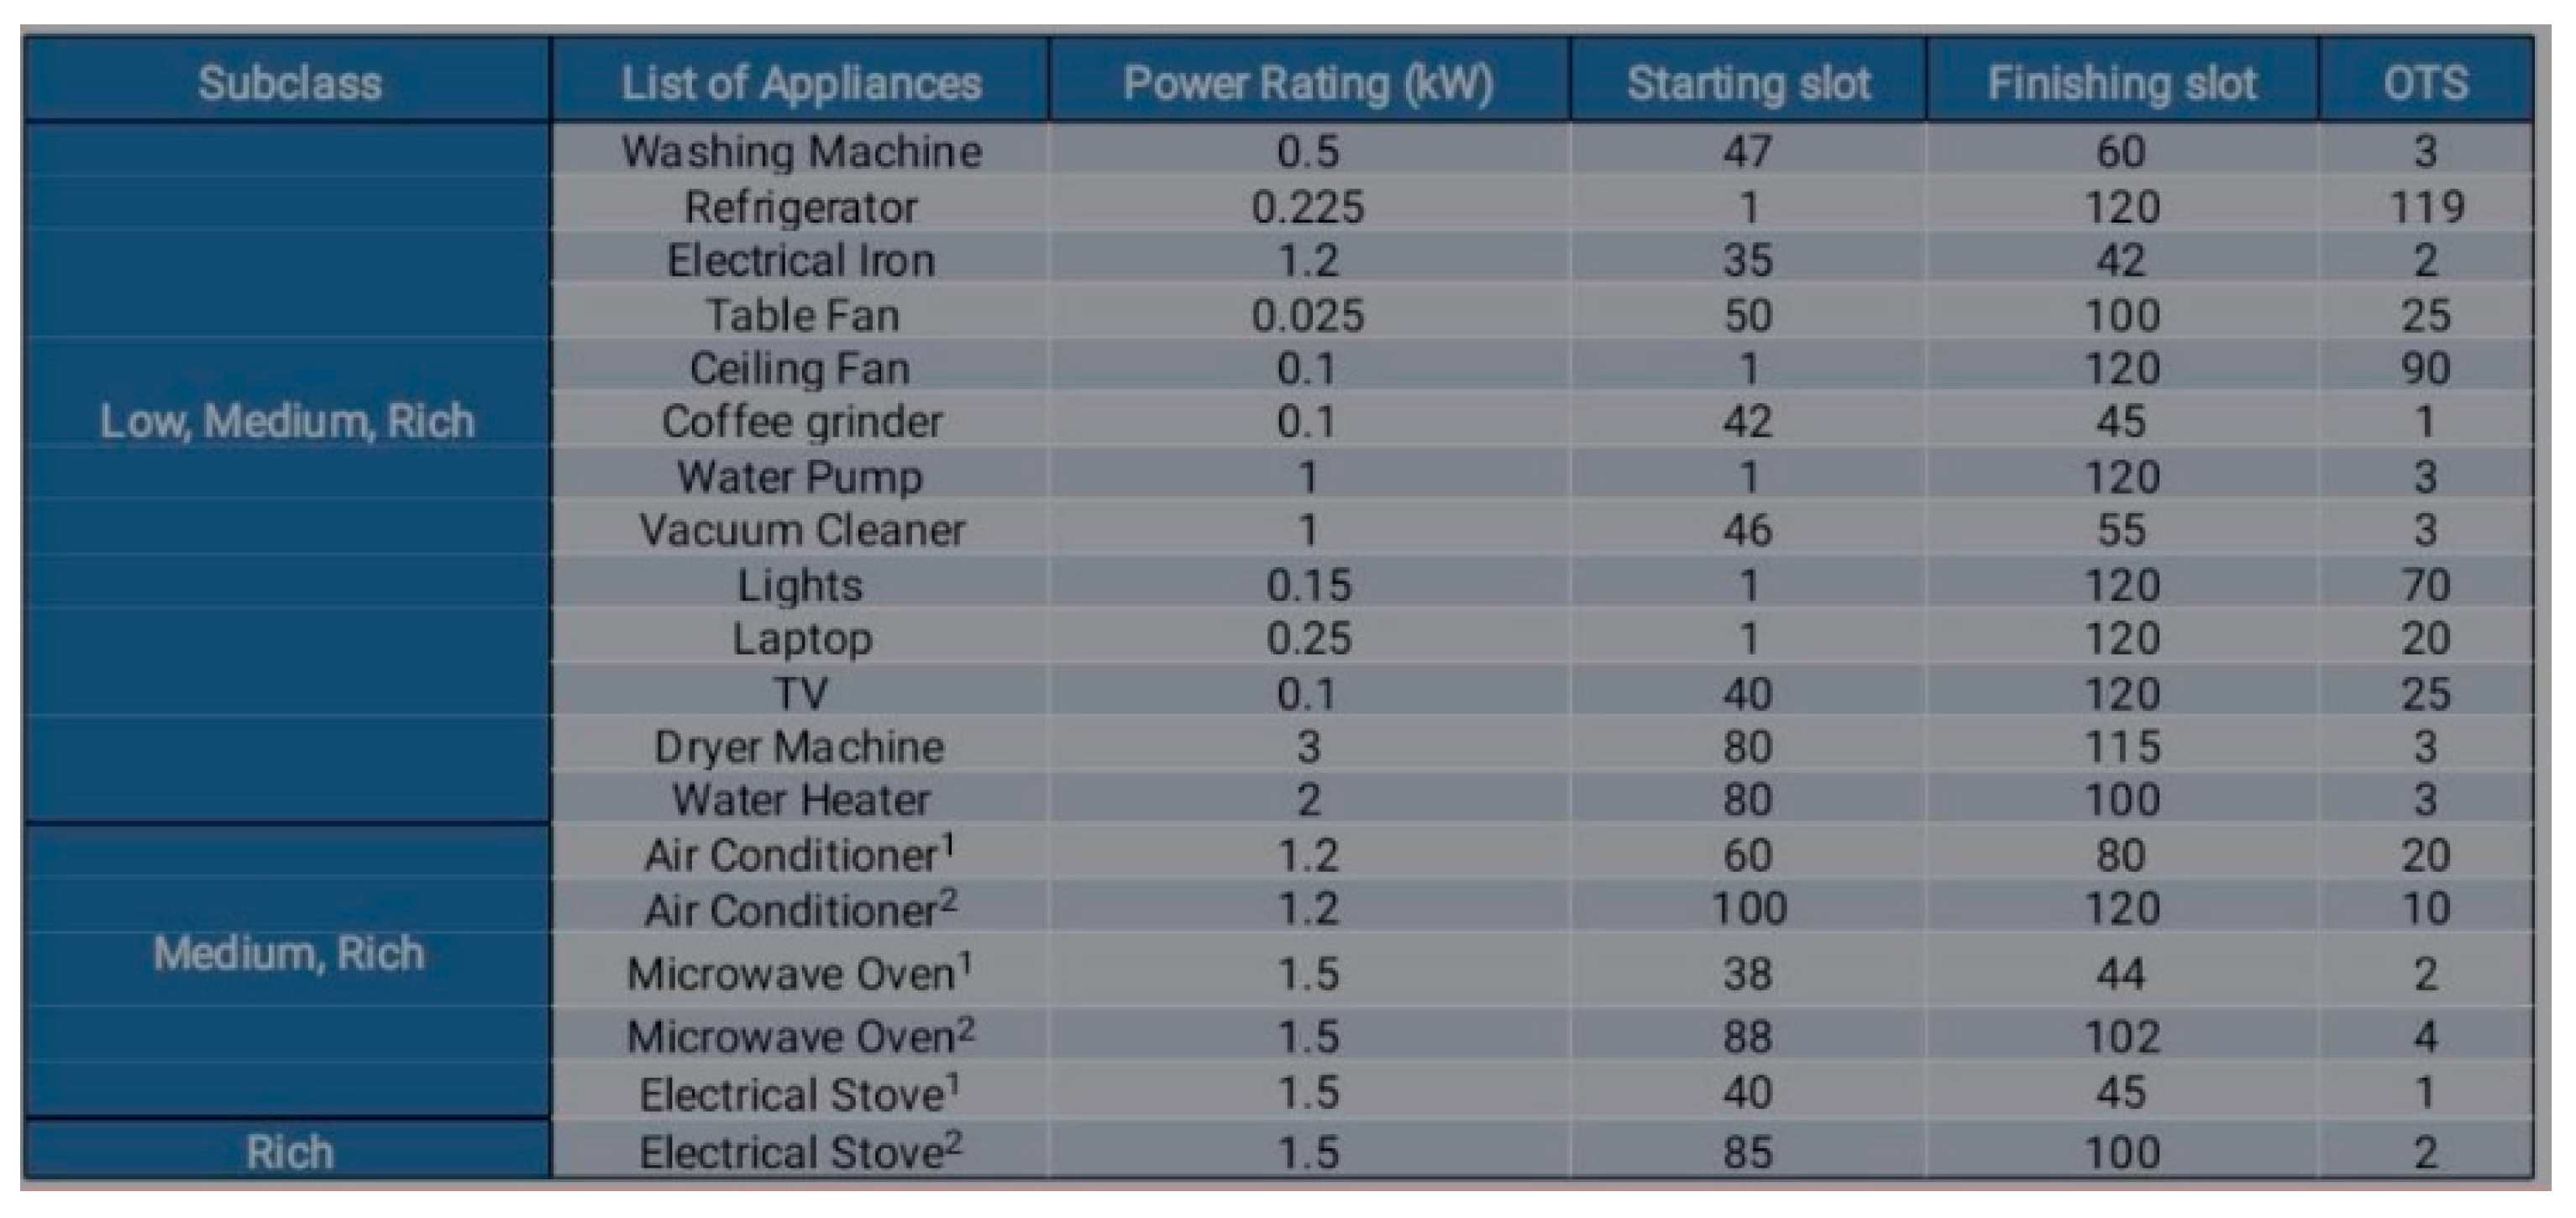
In these communities, each home has maximum load of 14 kW each, where average load varies across 1 kW to 10 kW (as per average load of Pakistan). In this study, the average load of each house is taken as 12 kW, respectively. Please refer to Figure A1 in appendix for load classes.
On the basis of tariffs, the following three categorizations were considered:
  • Tariff-1 (T1): 19.325 Rs/PKR/kWh
  • Tariff-2 (T2): 14.285 Rs/PKR/kWh
  • Tariff-3 (T3): 9.25 Rs/PKR/kWh
On the basis of RER capacities (solar, wind, and biomass), the following three categorizations were considered. The three sources are considered such as Solar, Wind and Biomass, respectively.
  • RER Size-1: 10 kW
  • RER Size-2: 20 kW
  • RER Size-3: 30 kW
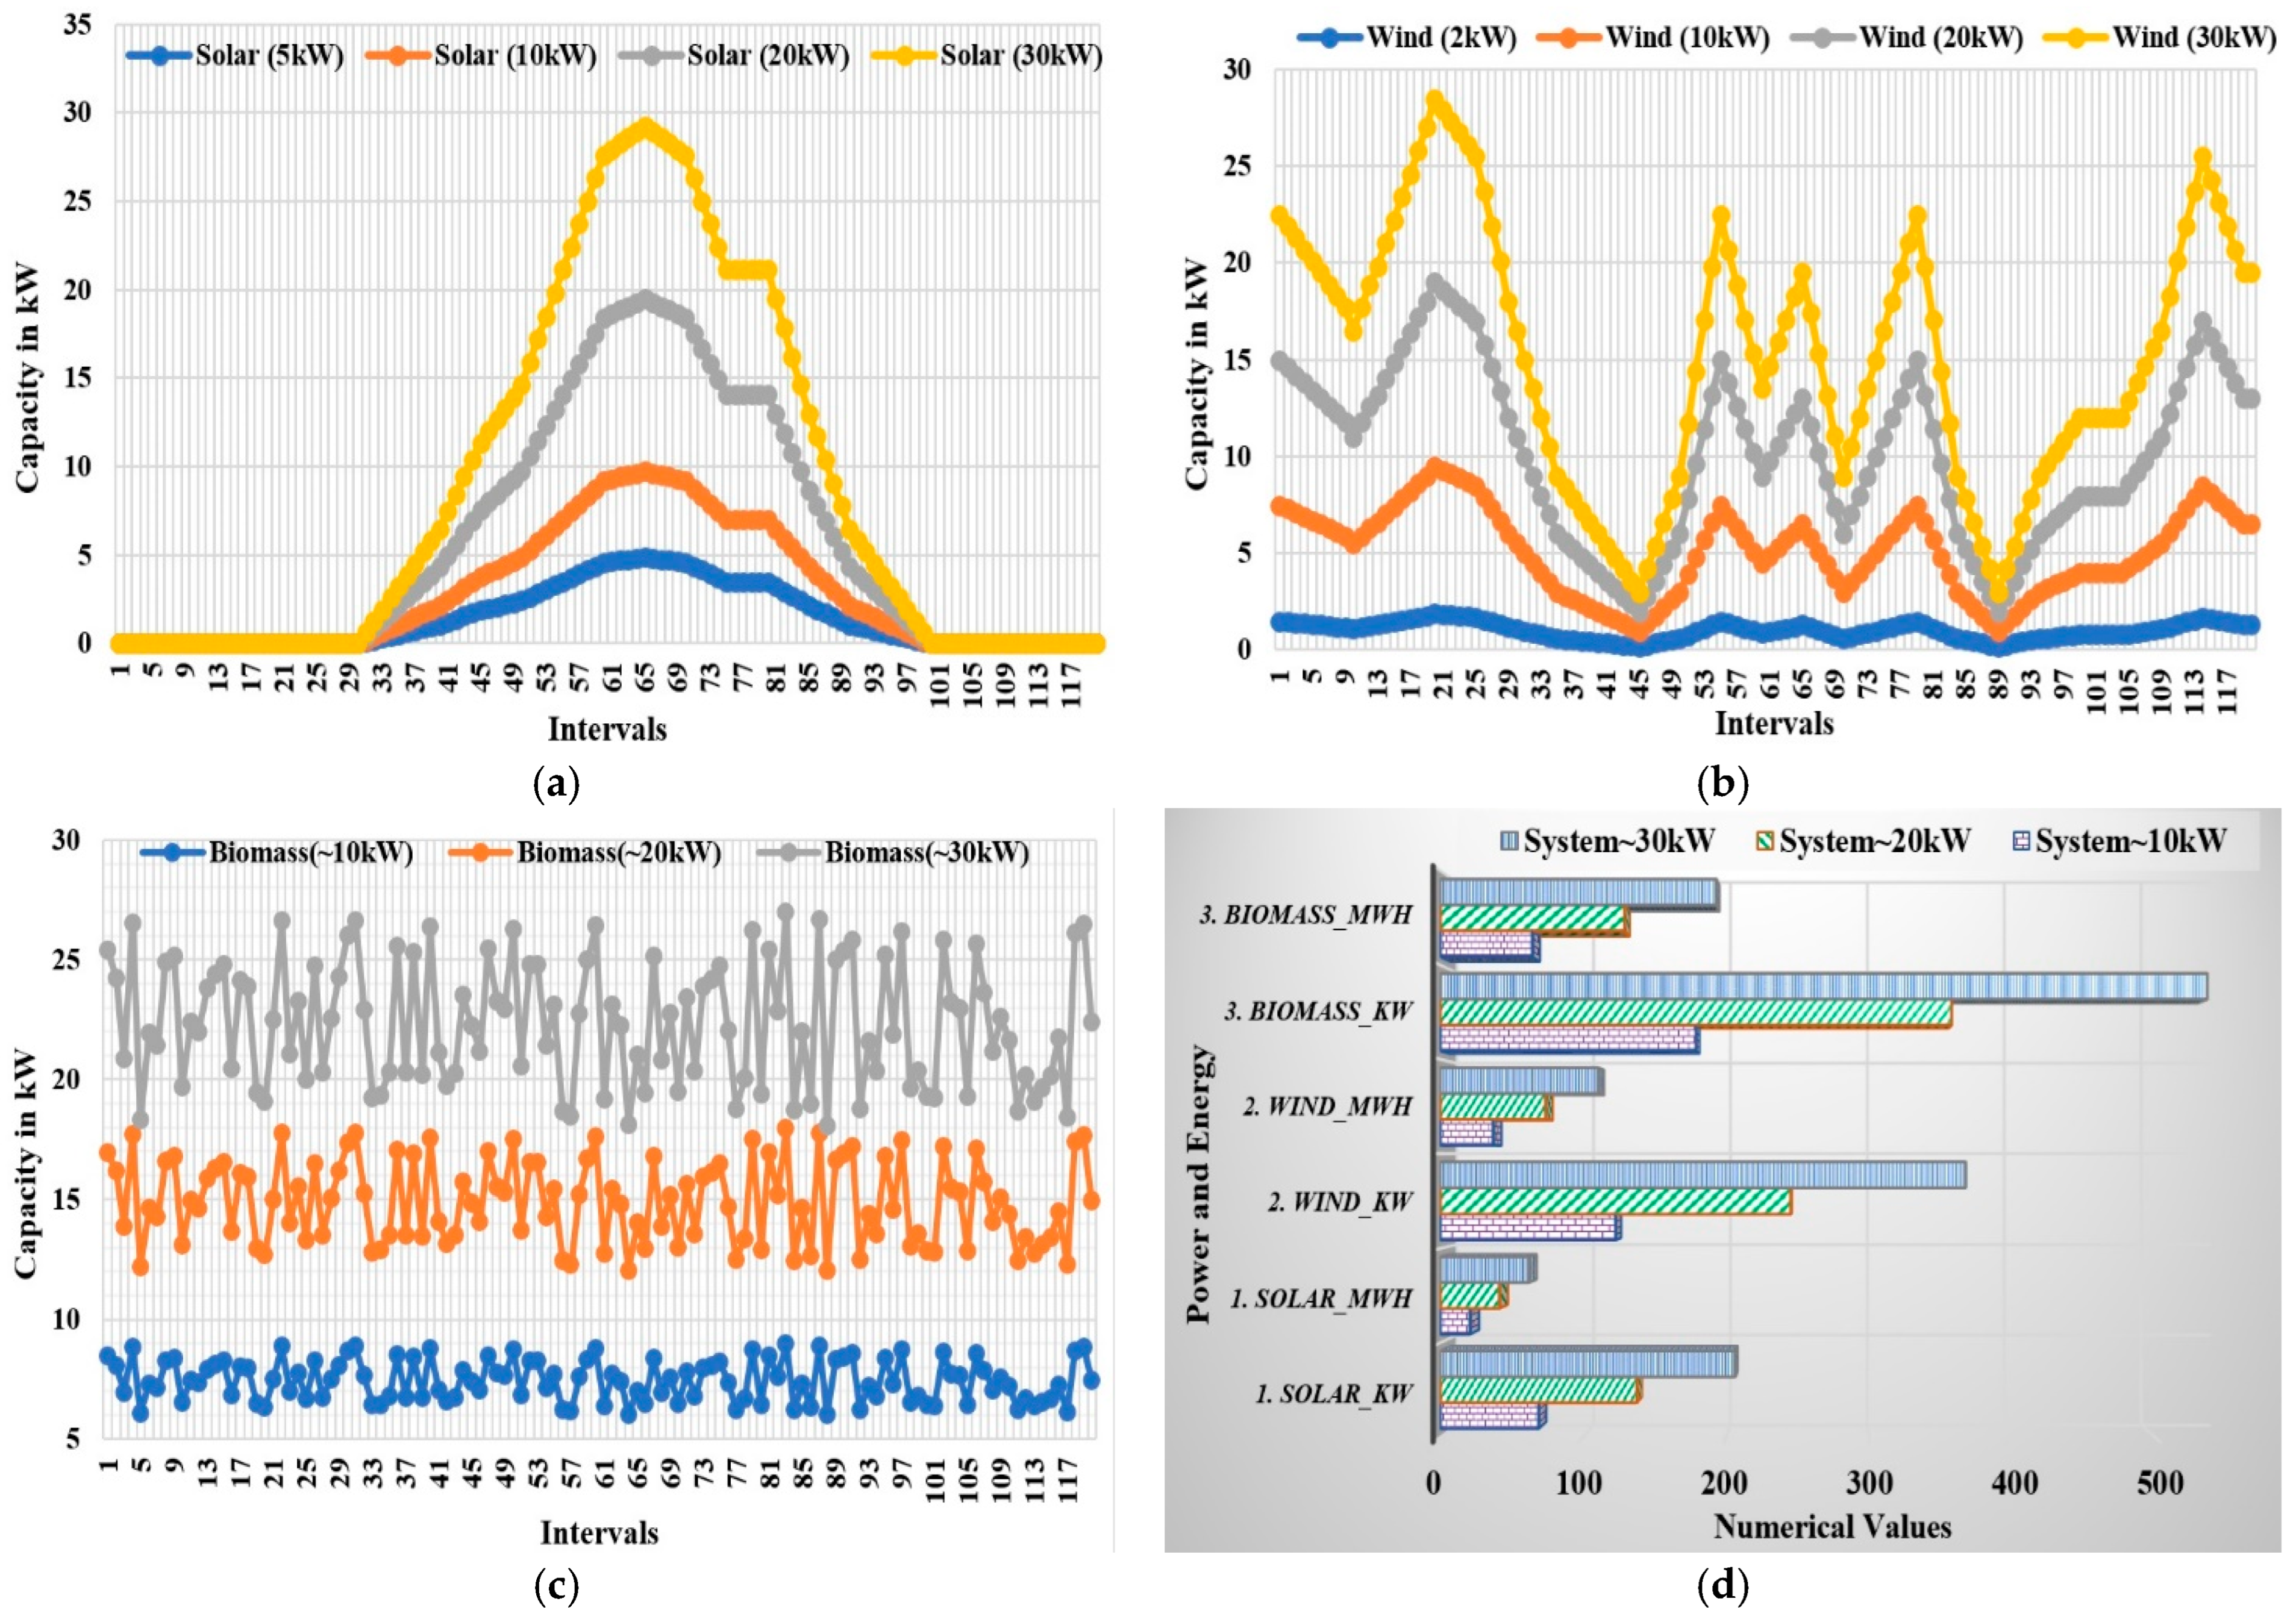
The simulation was conducted on MATLAB/SIMULINK 2019(b) on a Core i3 processor. The results regarding indigenous sources trends with solar capacity are shown in Figure 16a, where the capacities of 5 kW, 10 kW, 20 kW, and 30 kW are shown. In Figure 16b, wind power distribution is shown across capacities of 2 kW, 10 kW, 20 kW, and 30 kW. In Figure 16c, biomass capacities are evaluated across 10 kw, 20 kW, and 30 kW. It must be noted that evaluations are conducted across a day (24 h), and each time interval is around 12 min each. The solar and wind are weather dependent as shown in Figure 16a,b, and biomass is mostly deterministic in nature with a stable feed of input. The comparative analysis of power and energy outcomes across each resource are demonstrated in Figure 16d.
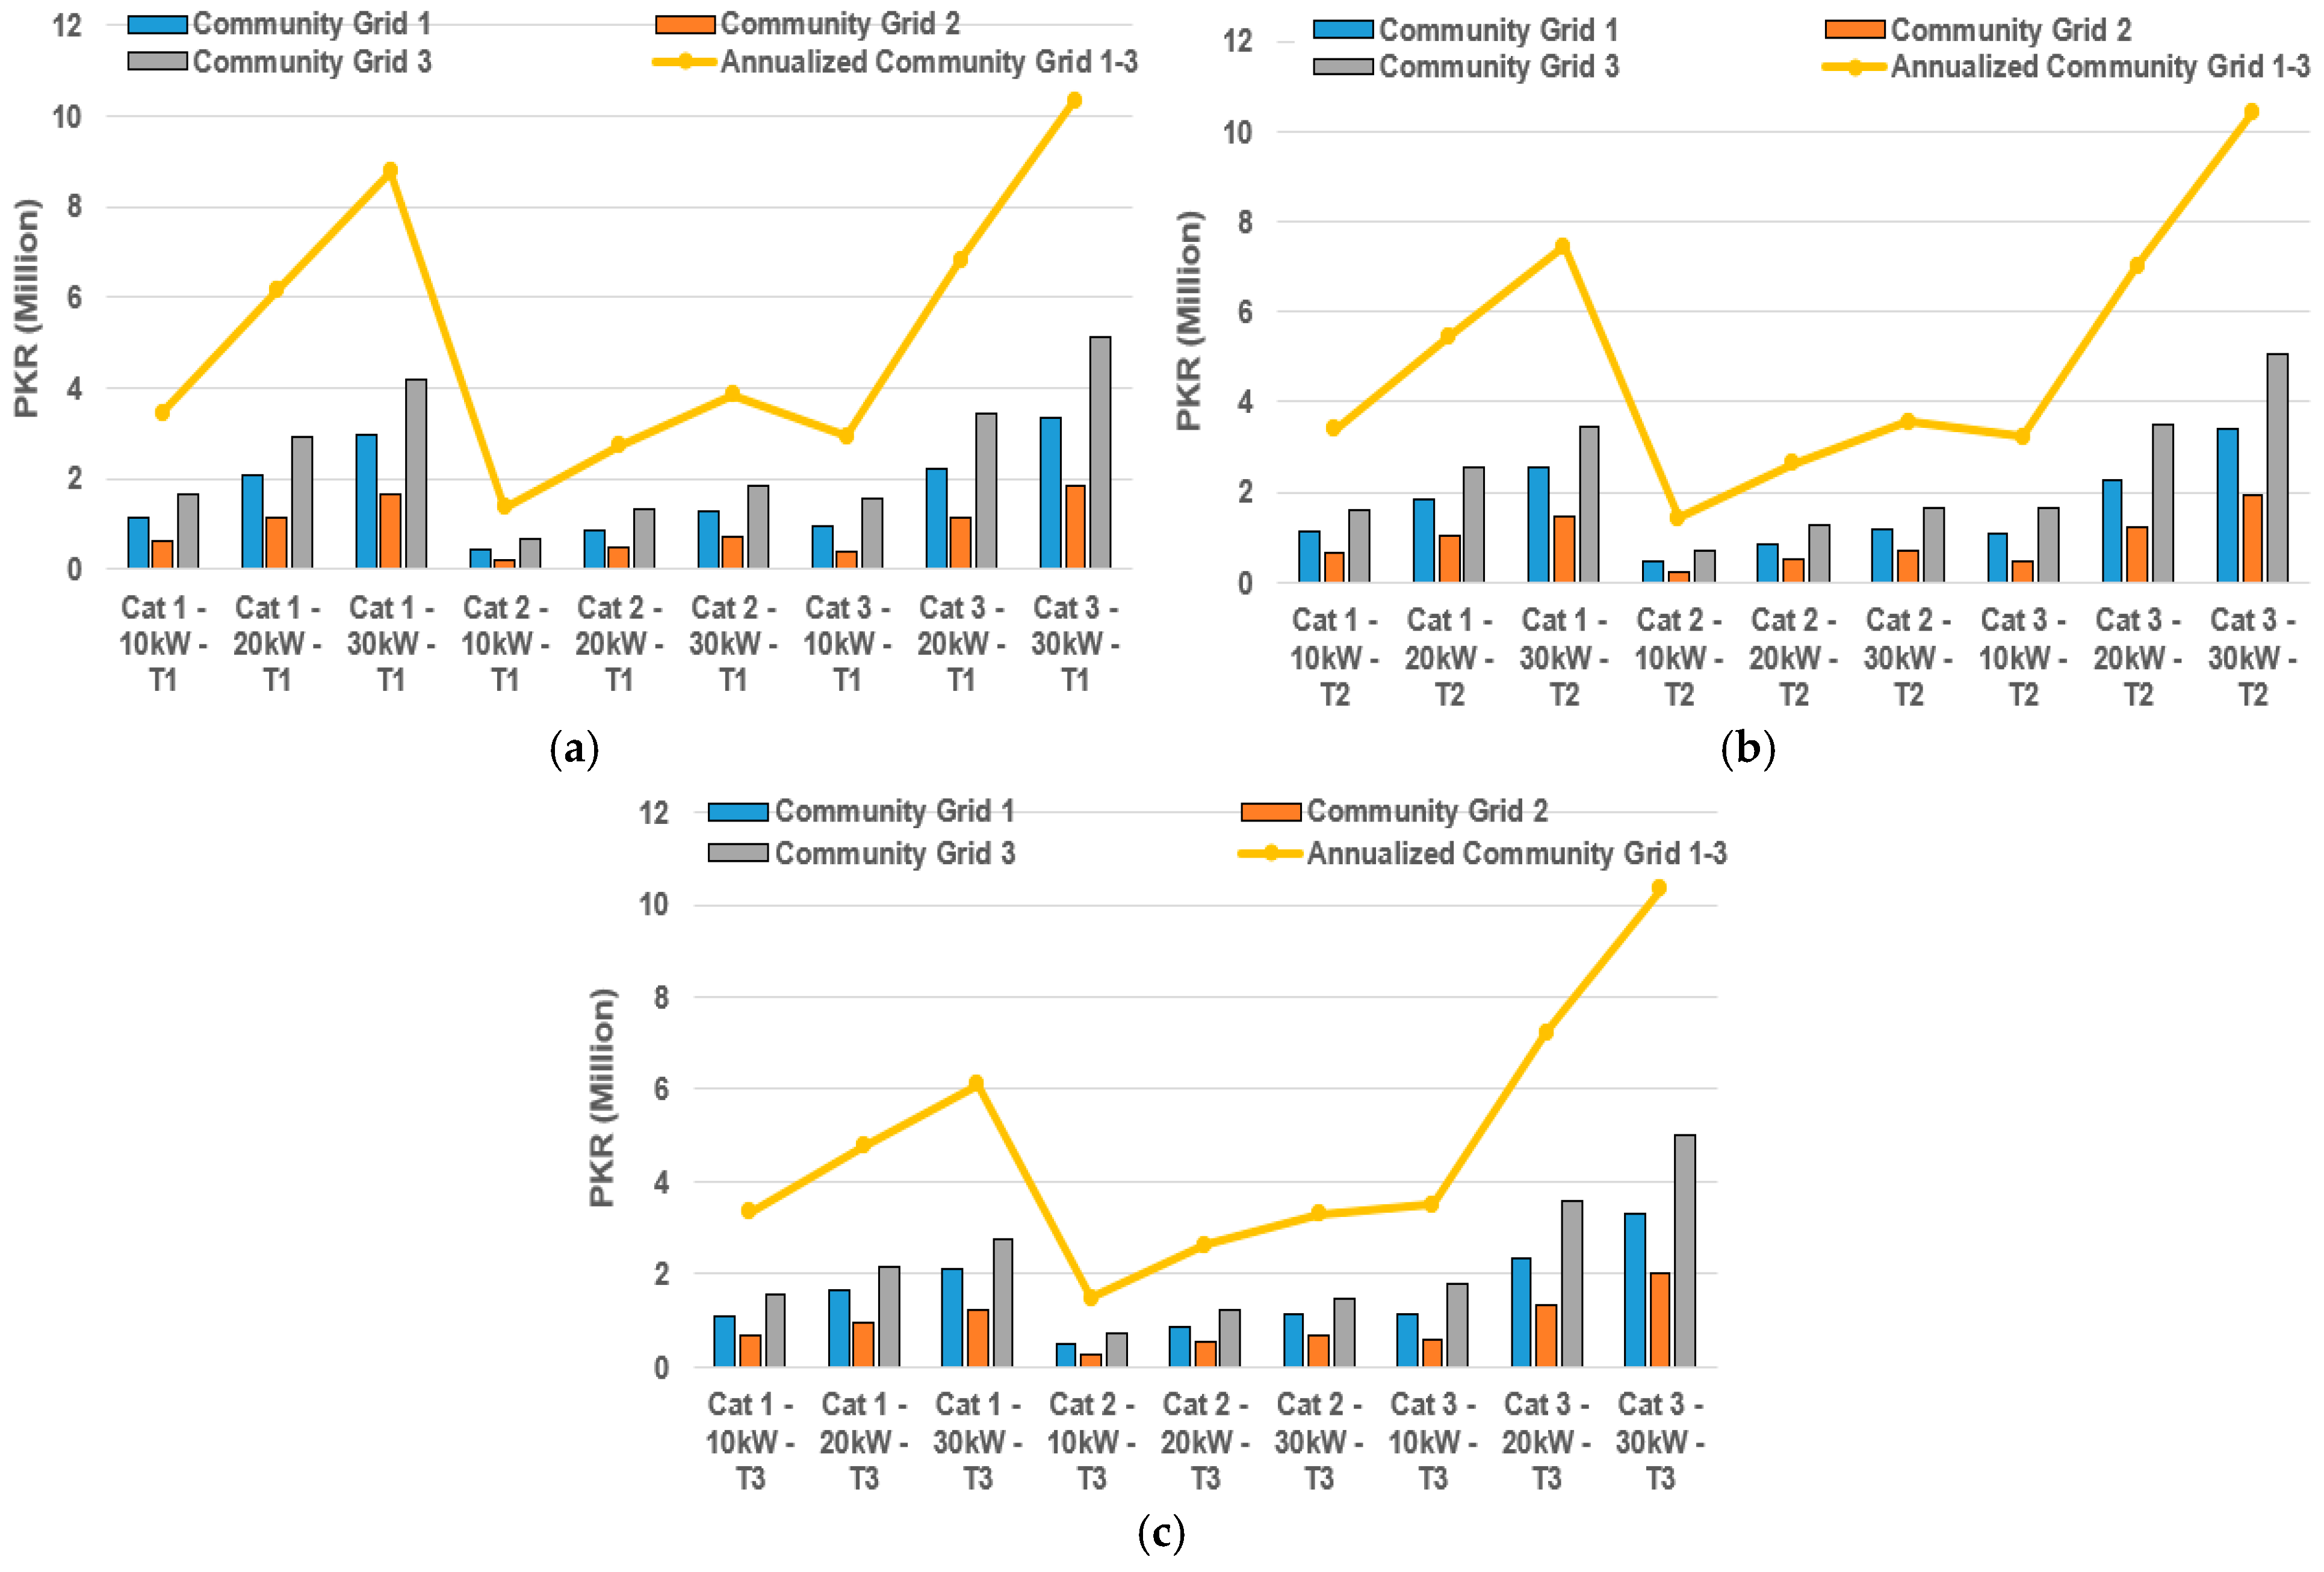
The results in Figure 17a–c have arrange the three cases (1–3) on the basis of unified tariff rates and the size of renewable in ascending order, as shown below.
  • Case-1: Demonstrated across Cat-1–3 and tariff 1 (T1), at 19.325 Rs/PKR/kWh, as shown in Figure 17a. The details of the results are illustrated in Table 8.
  • Case-2: Demonstrated across Cat-1–3 and tariff 2 (T2), at 14.285 Rs/PKR/kWh, as shown in Figure 17b. The details of the results are illustrated in Table 9.
  • Case-3: Demonstrated across Cat-1–3 and tariff 3 (T3), at 9.25 Rs/PKR/kWh, as shown in Figure 17c. The details of the results are illustrated in Table 10.
It can be observed in Figure 17a–c and Table 8, Table 9 and Table 10, that the annual savings are higher in T1 as compared to T2 and T3.
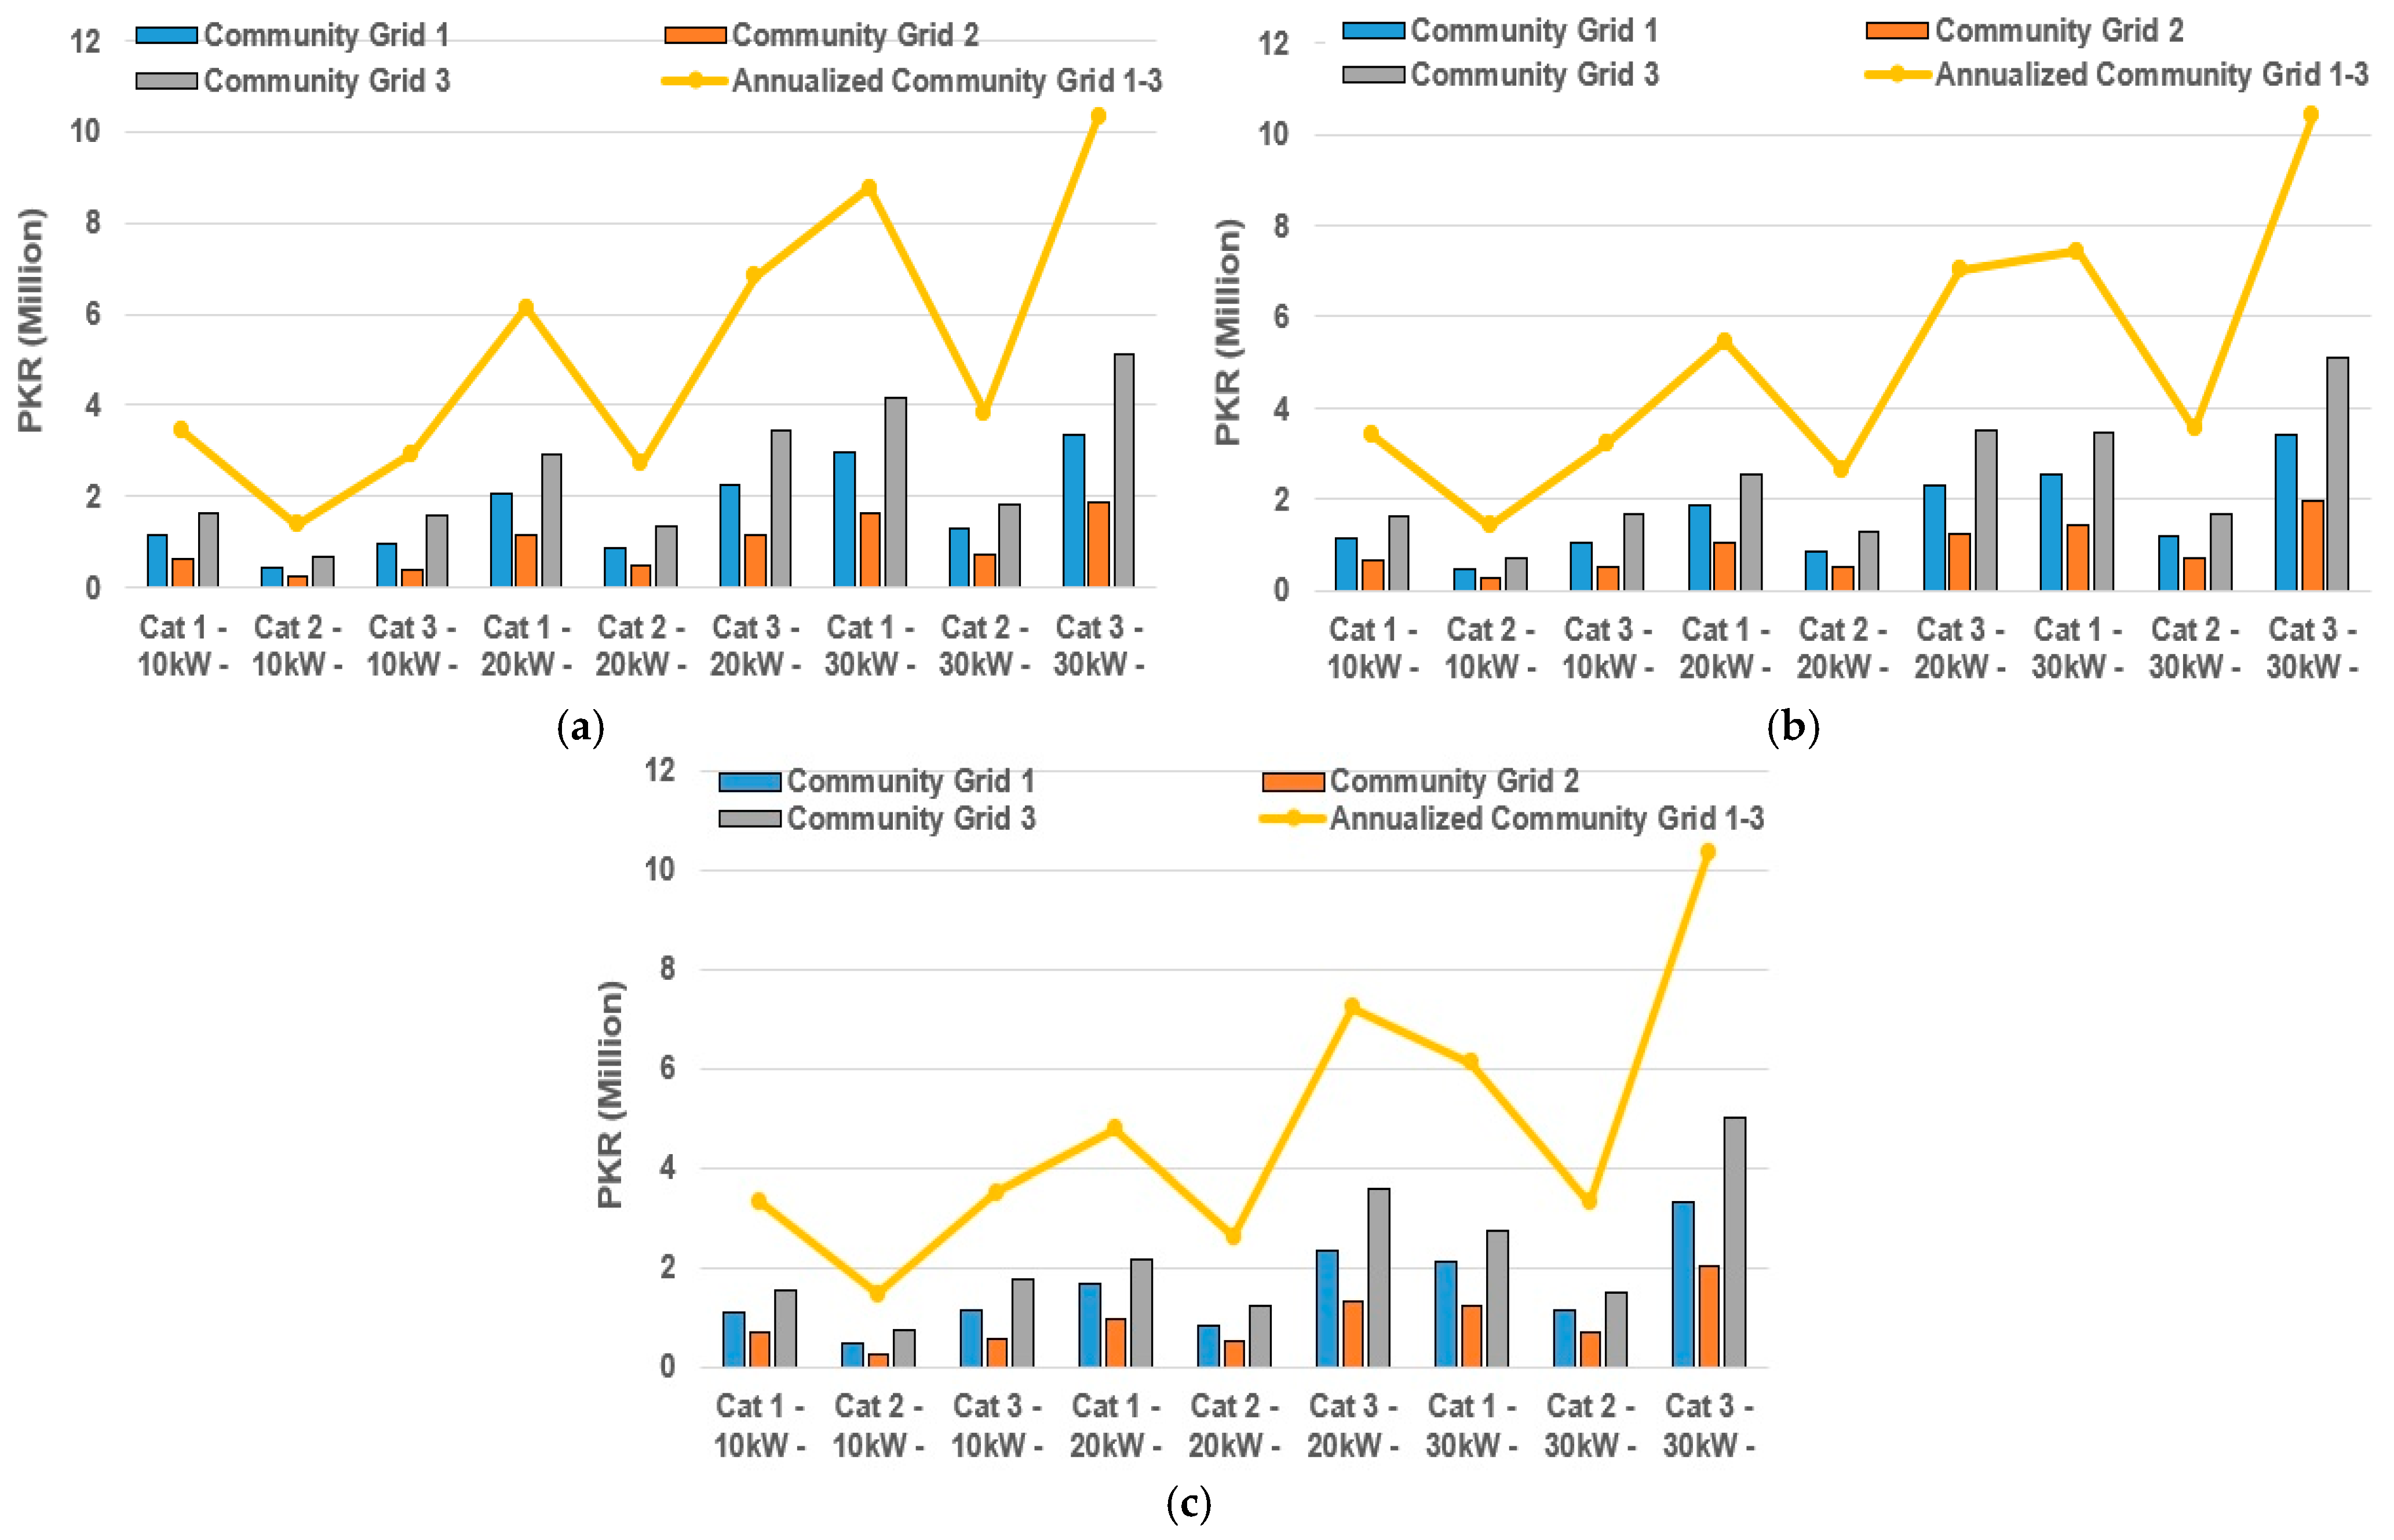
The results in Figure 18a–c are arranged in three cases (1–3) on the basis of multiple tariff rates and the size of renewable in ascending order as per capacity, as shown below.
  • Case-1: Demonstrated across community Cat-1–3 and T1-T3, at 19.325 Rs/PKR/kWh, as shown in Figure 18a. The details of the results are illustrated in Table 11.
  • Case-2: Demonstrated across community Cat-1–3 and T1-T3, at 14.285 Rs/PKR/kWh, as shown in Figure 18b. The details of the results are illustrated in Table 12.
  • Case-3: Demonstrated across community Cat-1–3 and T1-T3, at 9.25 Rs/PKR/kWh, as shown in Figure 18c. The details of the results are illustrated in Table 13.
It can be observed in Figure 18a–c and Table 11, Table 12 and Table 13 that the annual savings are higher in T1 as compared to T2 and T3; however, the savings are less than their unified tariff counterparts, as noted in Figure 17a–c and Table 8, Table 9 and Table 10, respectively.

5.2. Comparison Perspective

5.2.1. Socio-Economic Factors Assessment

This study expands the global discourse by situating smart metering acceptance within a multidimensional socio-economic framework specific to emerging economies, offering insight into affordability, governance, and infrastructure gaps not covered in prior literature. The main focus from SAARC with Pakistan as sample size is shown for the sake of analysis. Regarding novelty emphasis on SAARC-specific socioeconomics, following points needs to be presented, as also illustrated in Table 14.
Contrast with [49]: Bugden and Stedman’s U.S.-centric study identifies familiarity and climate risk perception as primary acceptance drivers [49].
Poverty and affordability: In SAARC, 22% population below poverty line in Bangladesh and non-technical loss reduction (15–40% in regional utilities) dominate acceptance [103]. This reframes smart meters as anti-theft tools rather than environmental enablers.
Gap Bridging: Prior studies, e.g., Fischer’s psychological model [104], focus on individualized feedback loops [105]. SAARC’s collectivist cultural norms necessitate community-based feedback, which is a noble contribution to the body of knowledge [106,107].

5.2.2. Critical Infrastructure Details

Data Latency: SAARC’s rural coverage gaps necessitate hybrid RF-PLC (radio frequency–power line communication) networks. Added specifications: ≤5 s latency for outage alerts (vs. ≤15 s in EU standards [103]).
Cybersecurity: Adapted IEC 62351 for SAARC’s high-fraud regions [106]:
Threat: Meter-tampering attacks (30% revenue loss in Pakistan [103]).
Solution: Blockchain-based audit trails for meter data management systems (MDMS).
Interoperability: ISO/IEC 62056 [107] to integrate Bangladesh’s Schneider meters with India’s TATA Power MDMS [105].
Communication Architecture: Smart Meter → RF Mesh → Concentrator → Fiber Backhaul → MDMS (IPv6)
Standards Compliance: Contrasted SAARC’s voltage tolerances (0.94–1.06 p.u. [103]) with EU’s stricter band (0.95–1.05 p.u. [104]).

5.3. Limitations Future Research Directions

This study relies on secondary data sources, and certain assumptions (such as theft reduction and smart meter lifespan) may vary under real-world conditions. Regional heterogeneity among SAARC nations also limits full generalizability. Pilot deployment studies in both urban and rural feeders across SAARC countries to validate assumptions in theft detection, billing efficiency, and consumer satisfaction. Integration with Distributed Energy Resources (DERs) such as rooftop PV systems and battery storage can also be considered with and actual feeder. Behavioral studies on consumer trust, digital literacy, and willingness to adopt smart meters is another research dimension along with policy experiments to assess tariff reforms linked with Time of Use (ToU) metering. Finally, smart meters linked with microgrids can also be studied under resilience modeling frameworks to improve community-based energy security.

6. Conclusions and Policy Implications

In most developing nations, the power distribution network incurs substantial financial losses due to inadequate operation and management of distribution enterprises that rely on obsolete traditional equipment. There is a pressing need to adopt new technologies to boost energy efficiency and eliminate annual economic losses.
This work demonstrates that the adoption of smart metering systems significantly contributes to the achievement of key Sustainable Development Goals. Specifically, it supports the efficient use of energy through real-time. It promotes energy efficiency, enabling demand-side management, and facilitating the integration of renewable energy sources. Furthermore, it directly contributes to SDG by reducing greenhouse gas emissions through optimized resource consumption and smarter utility infrastructure. By providing accurate data, empowering consumers, and enabling sustainable resource management, smart metering systems act as a critical tool in the global effort to build resilient, efficient, and environmentally responsible utility services.
This article discusses the economic and social implications of implementing a smart metering system in SAARC nations, in order to enhance the operational efficiency of the electrical distribution system. The main query associated with the adoption of a smart metering system is not whether it will be a profitable trade, but the efficiency of the recovery of capital cost invested and the advantages and incentives provided to the customers to support the implementation process. The obstacles that may emerge during the implementation phase are discussed in this article. We selected Pakistan from among the other SAARC countries as a reference case. A SWOT analysis was carried out for the distribution companies working in Pakistan, and their operations and working capacities were evaluated. Then, the difficulties that arise in commercializing the technology and many facets of the smart metering system in relation to current distribution network scenarios were reviewed. To perform economic analysis, the cost-to-benefit ratio for the rollout of smart meters was analyzed for all SAARC nations, considering their respective interest rates and net present values. After that, a cost–benefit analysis was performed on one selected feeder that is operational under PESCO (DISCO) in Pakistan. The selected feeder was facing 16% of non-technical losses. It was determined that adoption of a smart metering system is favorable to improve the electrical distribution system’s performance. The proposed project has the capability to reduce non-technical losses by 10%, and can recover the capital cost in a period of 3.835 years. It was also observed that a unified tariff is better than multiple tariffs across the net metering regime.

Author Contributions

Conceptualization, Z.K. and S.A.A.K.; methodology, M.H.; software, Z.K. and S.A.A.S.; validation, M.Y., A.H.T. and S.A.A.K.; formal analysis, M.H.; investigation, M.H.; resources, A.H.T.; data curation, M.Y.; writing—original draft preparation, M.A., Z.K. and S.A.A.K.; writing—review and editing, M.A., S.A.A.S. and Z.K.; visualization, M.Y.; supervision, S.A.A.K. and M.H.; project administration, Z.K.; funding acquisition, S.A.A.K. and M.H. All authors have read and agreed to the published version of the manuscript.

Funding

This funding is supported by HEC-NRPU No. 15087 HEC, Pakistan.

Institutional Review Board Statement

Not applicable.

Informed Consent Statement

Not applicable.

Data Availability Statement

Data is available on request.

Conflicts of Interest

Author Sayyed Ahmad Ali Shah, Mustafa Anwar are employed by the company National Transmission and Dispatch Company (NTDC). The remaining authors declare that the research was conducted in the absence of any commercial or financial relationships that could be construed as a potential conflict of interest.

Appendix A

Figure A1. Load classification (fans, lights, refrigerators, TVs, and laptop were considered). Note: Where 1 and 2 are numbers of air conditioners and Microwave Oven.
Sustainability 17 06786 g0a1
Table A1. Detailed overview of SWOT analysis with key points and actionable insights [28,29,30,31,32,33,34,35,36,37,38,39,40].
SWOT QuadrantKey PointsActionable Insight
Strength
Reduced losses, remote monitoring
Integrate AMI with real-time pricing algorithms
Low labor costs
Partner with local universities for meter assembly training
Weakness
Poor management, high costs
Develop capacity-building programs for DISCO staff
Intermittent grid power
Deploy battery-backed meters (2–72 h autonomy)
Opportunity
Local manufacturing, regional integration
Launch PPPs for domestic meter production
Youth workforce growth
Launch SAARC Smart Grid Skill Council for manufacturing
Threat
Cybersecurity, public resistance
Enforce national smart meter security compliance standards
Cross-border data governance
Adopt BRICS data policy for intra-regional exchanges
Table A2. Comparison of smart metering technologies for SAARC region [49,50,51].
TechnologyApprox. Cost (USD/unit)ReliabilityInfrastructure RequiredSuitability in SAARC
RF Mesh50HighCentral hubs and mesh gatewaysUrban India, Pakistan, Sri Lanka
GSM/2G/4G35MediumMobile telecom towersRural Bangladesh, Nepal, Pakistan
PLC40Medium-LowStable power linesLess suitable due to noise in grids
LoRaWAN30MediumGateways with wide coverageEmerging interest in Bhutan and Nepal
NB-IoT45–60HighCellular Narrowband IoTHigh-potential in urban SAARC with 5G expansion
Note: RF Mesh offers high reliability in dense urban areas, while GSM-based metering is more adaptable for rural areas with mobile coverage. Power line communication (PLC) faces technical challenges due to frequent voltage sags, spikes, and harmonics in SAARC grid.
Table A3. Assumptions for cost–benefit analysis.
ParameterValues
Smart meter cost per unitUSD 40–60
Lifespan of meters10 years
Reduction in commercial losses10–20% based on pilot data from Pakistan’s AMI projects
Energy cost savings:USD 0.07/kWh (based on average tariff data).
Reduction in meter reading and theft-related operational costs25–40%.
Deployment cost per feeder (1000 customers):USD 50,000
Discount rateA baseline of 10% was used, reflecting public sector investment criteria in South Asia [108].
Sensitivity analysisTo be conducted in future studies with 6%, 8%, 10%, and 12% to test robustness.

References

  1. Khan, N.S.; Khan, N.S.; Kazmi, S.A.A.; Anwar, M.; Mughal, S.U.R.; Ullah, K.; Rathi, M.K.; Salal, A. Enhancing Renewable Energy Integration in Developing Countries: A Policy-Oriented Analysis of Net Metering in Pakistan Amid Economic Challenges. Sustainability 2024, 16, 6034. [Google Scholar] [CrossRef]
  2. Aslam, W.; Soban, M.; Akhtar, F.; Zaffar, N.A. Smart meters for industrial energy conservation and efficiency optimization in Pakistan: Scope, technology and applications. Renew. Sustain. Energy Rev. 2015, 44, 933–943. [Google Scholar] [CrossRef]
  3. Hossain, M.R. Evolution of Smart Grid and Some Pertinent Issues n.d. In Proceedings of the Universities Power Engineering Conference (AUPEC), Sydney Australia, 20–22 November 2024. [Google Scholar]
  4. Hussain, Z.; Memon, S.; Zardari, S.; Hussain Shah, R.; Ali Bhutto, Z. Systematic Analysis of Smart Meter Technologies and Their Implantation Challenges in Pakistan. Sect. B Sci.Int. 2016, 28, 113–120. [Google Scholar]
  5. Sharifi, A.; Allam, Z.; Bibri, S.E.; Khavarian-Garmsir, A.R. Smart Cities and Sustainable Development Goals (SDGs): A Systematic Literature Review of Co-Benefits and Trade-Offs. Cities 2024, 146, 104659. [Google Scholar] [CrossRef]
  6. Wendt, C.; Kosin, D.; Adam, M.; Benlian, A. Sustainable energy consumption behaviour with smart meters: The role of relative performance and evaluative standards. Inf. Syst. J. 2024, 34, 1995–2023. [Google Scholar] [CrossRef]
  7. Rashed Mohassel, R.; Fung, A.; Mohammadi, F.; Raahemifar, K. A survey on Advanced Metering Infrastructure. Int. J. Electr. Power Energy Syst. 2014, 63, 473–484. [Google Scholar] [CrossRef]
  8. Knowles, W.; Prince, D.; Hutchison, D.; Disso, J.F.P.; Jones, K. A survey of cyber security management in industrial control systems. Int. J. Crit. Infrastruct. Prot. 2015, 9, 52–80. [Google Scholar] [CrossRef]
  9. Chaudhar, A.Y.; Mulay, P.; Chavan, S. The Role of Smart Electricity Meter Data Analysis in Driving Sustainable Development. MethodsX 2025, 14, 103196. [Google Scholar] [CrossRef] [PubMed]
  10. Yan, Y.; Qian, Y.; Sharif, H.; Tipper, D. A survey on cyber security for smart grid communications. IEEE Commun. Surv. Tutorials 2012, 14, 998–1010. [Google Scholar] [CrossRef]
  11. EEI. Smart Meters and Smart Meter Systems: A Metering Industry Perspective An EEI-AEIC-UTC White Paper A Joint Project of the EEI and AEIC Meter Committees; EEI: Washington, DC, USA, 2011. [Google Scholar]
  12. Fan, Z.; Kulkarni, P.; Gormus, S.; Efthymiou, C.; Kalogridis, G.; Sooriyabandara, M.; Zhu, Z.; Lambotharan, S.; Chin, W.H. Smart Grid Communications: Overview of Research Challenges, Solutions, and Standardization Activities. IEEE Commun. Surv. Tutor. 2012, 15, 21–38. [Google Scholar] [CrossRef]
  13. Sharma, K.; Mohan Saini, L. Performance analysis of smart metering for smart grid: An overview. Renew. Sustain. Energy Rev. 2015, 49, 720–735. [Google Scholar] [CrossRef]
  14. Sharma, K.; Saini, L.M. Power-line communications for smart grid: Progress, challenges, opportunities and status. undefined 2017, 67, 704–751. [Google Scholar] [CrossRef]
  15. Erlinghagen, S.; Lichtensteiger, B.; Markard, J. Smart meter communication standards in Europe—A comparison. Renew. Sustain. Energy Rev. 2015, 43, 1249–1262. [Google Scholar] [CrossRef]
  16. Available online: https://kimbal.io/blog/blog-tile-smart-metering-the-critical-building-block-to-empower-utilities-2-2/ (accessed on 16 July 2025).
  17. Bilgin, B.E.; Gungor, V.C. Performance evaluations of ZigBee in different smart grid environments. Comput. Networks 2012, 56, 2196–2205. [Google Scholar] [CrossRef]
  18. Hansen, A.; Staggs, J.; Shenoi, S. Security analysis of an advanced metering infrastructure. Int. J. Crit. Infrastruct. Prot. 2017, 18, 3–19. [Google Scholar] [CrossRef]
  19. Berger, T. Analysis of current VPN technologies. In Proceedings of the First International Conference on Availability, Reliability and Security (ARES’06), Vienna, Austria, 20–22 April 2006; Voume 2006, pp. 108–115. [Google Scholar] [CrossRef]
  20. Lewis, R.P.; Igic, P.; Zhou, Z. Assessment of communication methods for smart electricity metering in the U.K. In Proceedings of the 2009 IEEE PES/IAS Conference on Sustainable Alternative Energy (SAE), Valencia, Spain, 28–30 September 2009. [Google Scholar] [CrossRef]
  21. How Much Electricity Is Produced in Pakistan Water?—AnswersToAll n.d. Available online: https://answer-to-all.com/object/how-much-electricity-is-produced-in-pakistan-water/ (accessed on 19 August 2022).
  22. Master Wind Energy n.d. Available online: http://masterwind.com.pk/pages/wind-energy (accessed on 7 July 2025).
  23. Qazi, A.U.; Azhar, M.S.; Abbas, S.; Hameed, A. Capacity Evaluation of Power Transmission Line Towers under Wind Loading: A Case Study. Pak. J. Eng. Appl. Sci. 2017, 20, 49–60. [Google Scholar]
  24. Raheem, A.; Abbasi, S.A.; Memon, A.; Samo, S.R.; Taufiq-Yap, Y.H.; Danquah, M.K.; Harun, R. Renewable energy deployment to combat energy crisis in Pakistan. Energy. Sustain. Soc. 2016, 6, 16. [Google Scholar] [CrossRef]
  25. Farooqui, S.Z. Prospects of renewables penetration in the energy mix of Pakistan. Renew. Sustain. Energy Rev. 2014, 29, 693–700. [Google Scholar] [CrossRef]
  26. Khan, H.A.; Pervaiz, S. Technological review on solar PV in Pakistan: Scope, practices and recommendations for optimized system design. Renew. Sustain. Energy Rev. 2013, 23, 147–154. [Google Scholar] [CrossRef]
  27. Dyson, R.G. Strategic development and SWOT analysis at the University of Warwick. Eur. J. Oper. Res. 2004, 152, 631–640. [Google Scholar] [CrossRef]
  28. Ullah, K. Electricity Infrastructure in Pakistan: An Overview. Int. J. Energy Inf. Commun. 2013, 4, 11–26. [Google Scholar]
  29. NEPRA, State of Industry Report 2020 n.d. Available online: https://rise.esmap.org/data/files/library/pakistan/Renewable%20Energy/Pakistan_NEPRA%20Annual%20Report_%202018-19.pdf (accessed on 7 July 2025).
  30. Shahzad, K.; Bajwa, S.U.; Ansted, R.B.; Mamoon, D. Khaliq-ur-Rehman Evaluating human resource management capacity for effective implementation of advanced metering infrastructure by electricity distribution companies in Pakistan. Util. Policy 2016, 41, 107–117. [Google Scholar] [CrossRef]
  31. Zaidi, S.S.H.; Zafar, R.S.; Mughal, A.Z.; Masood, A.; Ahsan, S. Advanced Metering Infrastructure and Customer Side System. In Proceedings of the 1st International Electrical Engineering Congress (IEEC 2016), Karachi, Pakistan, 13–14 May 2016. [Google Scholar]
  32. Qazi, U.; Jahanzaib, M.; Ahmad, W.; Hussain, S. An institutional framework for the development of sustainable and competitive power market in Pakistan. Renew. Sustain. Energy Rev. 2017, 70, 83–95. [Google Scholar] [CrossRef]
  33. Syed, F.; Siddique, M.S.; Syed, W.; Raza, S. Advance Metering Infrastructure Technology and Challenges in Pakistan 2018. Available online: https://portals.au.edu.pk/aujogr/Pdf_Files/180508.pdf (accessed on 7 July 2025).
  34. Rauf, O.; Wang, S.; Yuan, P.; Tan, J. An overview of energy status and development in Pakistan. Renew. Sustain. Energy Rev. 2015, 48, 892–931. [Google Scholar] [CrossRef]
  35. Khosa, A.A.; Rashid, T.; Shah, N.H.; Usman, M.; Khalil, M.S. Performance analysis based on probabilistic modelling of Quaid-e-Azam Solar Park (QASP) Pakistan. Energy Strateg. Rev. 2020, 29, 100479. [Google Scholar] [CrossRef]
  36. Meliani, M.; El Barkany, A.; El Abbassi, I.; Moumen Darcherif, A.; Mahmoudi, M. Smart grid implementation in Morocco: Case study. Mater. Today Proc. 2021, 45, 7675–7679. [Google Scholar] [CrossRef]
  37. Ullah, A.; Neelum, Z.; Jabeen, S. Factors behind electricity intensity and efficiency: An econometric analysis for Pakistan. Energy Strateg. Rev. 2019, 26, 100371. [Google Scholar] [CrossRef]
  38. Minchala-Avila, L.I.; Armijos, J.; Pesántez, D.; Zhang, Y. Design and Implementation of a Smart Meter with Demand Response Capabilities. Energy Procedia 2016, 103, 195–200. [Google Scholar] [CrossRef]
  39. Yang, B.; Liu, S.; Gaterell, M.; Wang, Y. Smart metering and systems for low-energy households: Challenges, issues and benefits. Adv. Build. Energy Res. 2017, 13, 80–100. [Google Scholar] [CrossRef]
  40. Shaheen, F. Fluctuations in Exchange Rate and its Impact on Macroeconomic Performance of Pakistan n.d. Available online: https://www.qurtuba.edu.pk/thedialogue/The%20Dialogue/8_4/Dialogue_October_December2013_410-418.pdf (accessed on 7 July 2025).
  41. Westermann, P.; Deb, C.; Schlueter, A.; Evins, R. Unsupervised learning of energy signatures to identify the heating system and building type using smart meter data. Appl. Energy 2020, 264, 114715. [Google Scholar] [CrossRef]
  42. Jiménez-Castillo, G.; Rus-Casas, C.; Tina, G.M.; Muñoz-Rodriguez, F.J. Effects of smart meter time resolution when analyzing photovoltaic self-consumption system on a daily and annual basis. Renew. Energy 2021, 164, 889–896. [Google Scholar] [CrossRef]
  43. Bader Faraj Preconditions Analysis of Smart Metering Systems Deployment in Libya. n.d. Available online: https://ela.kpi.ua/handle/123456789/35856 (accessed on 7 July 2025).
  44. Available online: https://sdgresources.relx.com/smart-grid (accessed on 16 July 2025).
  45. Sanni, T.F.; Adoghe, A.U.; Amaize, P.A.; Ajaegbu, C.D. Smart Metering System: A Solution for Adoption in Developing Countries. In Proceedings of the 2018 IEEE PES/IAS PowerAfrica, Cape Town, South Africa, 28–29 June 2018; pp. 623–627. [Google Scholar] [CrossRef]
  46. Maruf, M.H.; Haq, M.A.; Dey, S.K.; Al Mansur, A.; Shihavuddin, A.S.M. Adaptation for sustainable implementation of Smart Grid in developing countries like Bangladesh. Energy Rep. 2020, 6, 2520–2530. [Google Scholar] [CrossRef]
  47. Utomo, D.; Hsiung, P.A. A Multitiered Solution for Anomaly Detection in Edge Computing for Smart Meters. Sensors 2020, 20, 5159. [Google Scholar] [CrossRef] [PubMed]
  48. Khan, A.J. Structure and Regulation of the Electricity Networks in Pakistan on JSTOR n.d. Available online: https://file.pide.org.pk/pdf/PDR/2014/Volume4/505-530.pdf (accessed on 7 July 2025).
  49. Jin, T.; Wang, W.; Liu, Y.; Huang, Q.; Mohamed, M.A. Advanced electricity theft detection in smart metering systems via Channel-Correlation enhanced hierarchical kernel networks and matrix completion. Measurement 2025, 253, 117768. [Google Scholar] [CrossRef]
  50. Kakran, S.; Chanana, S. Smart operations of smart grids integrated with distributed generation: A review. Renew. Sustain. Energy Rev. 2018, 81, 524–535. [Google Scholar] [CrossRef]
  51. Buchanan, K.; Russo, R.; Anderson, B. The question of energy reduction: The problem(s) with feedback. Energy Policy 2015, 77, 89–96. [Google Scholar] [CrossRef]
  52. Wüstenhagen, R.; Wolsink, M.; Bürer, M.J. Social acceptance of renewable energy innovation: An introduction to the concept. Energy Policy 2007, 35, 2683–2691. [Google Scholar] [CrossRef]
  53. Verbong, G.; Geels, F. The ongoing energy transition: Lessons from a socio-technical, multi-level analysis of the Dutch electricity system (1960–2004). Energy Policy 2007, 35, 1025–1037. [Google Scholar] [CrossRef]
  54. Buchanan, K.; Banks, N.; Preston, I.; Russo, R. The British public’s perception of the UK smart metering initiative: Threats and opportunities. Energy Policy 2016, 91, 87–97. [Google Scholar] [CrossRef]
  55. Wilson, C.; Hargreaves, T.; Hauxwell-Baldwin, R. Smart homes and their users: A systematic analysis and key challenges. Pers. Ubiquitous Comput. 2014, 19, 463–476. [Google Scholar] [CrossRef]
  56. Hamilton, B.A.; Miller, J. Understanding the Benefits of the Smart Grid; National Energy Technology Laboratory: Washington, DC, USA, 2010.
  57. Bamberg, S. How does environmental concern influence specific environmentally related behaviors? A new answer to an old question. J. Environ. Psychol. 2003, 23, 21–32. [Google Scholar] [CrossRef]
  58. Gadenne, D.; Sharma, B.; Kerr, D.; Smith, T. The influence of consumers’ environmental beliefs and attitudes on energy saving behaviours. Energy Policy 2011, 39, 7684–7694. [Google Scholar] [CrossRef]
  59. Environmental Protection Agency Climate Science & Climate Change Environmental Monitoring & Assessment n.d. Available online: https://www.undp.org/sites/g/files/zskgke326/files/2025-02/environmental_report-complete_02_0.pdf (accessed on 7 July 2025).
  60. Installed Capacity to Generate Power n.d. Available online: https://www.thenews.com.pk/print/847878-installed-capacity-to-generate-37-261-mw-power (accessed on 20 August 2022).
  61. Govt Shelves Rs30bn Smart Metering Project for Lesco—Business—DAWN.COM n.d. Available online: https://www.dawn.com/news/1654059 (accessed on 20 August 2022).
  62. Sandha, S.K. Growth of Electricity Sector in India from 1947–2020; Central Electricity Authority: New Delhi, India, 2020.
  63. Smart Meter Installations Across the Country Grow Steadily—Mercom India n.d. Available online: https://mercomindia.com/smart-meter-installations-grow-steadily/ (accessed on 20 August 2022).
  64. Sovacool, B.K.; Hook, A.; Sareen, S.; Geels, F.W. Global sustainability, innovation and governance dynamics of national smart electricity meter transitions. Glob. Environ. Change 2021, 68, 102272. [Google Scholar] [CrossRef]
  65. India’s Smart Meter Rollout—250 Million Meters by 2025 n.d. Available online: https://www.smart-energy.com/industry-sectors/smart-meters/indias-smart-meter-rollout-250-million-meters-by-2025/ (accessed on 20 August 2022).
  66. Rituraj, R.; Kadar, P.; Varkonyi-Koczy, A.R. Smart Meter: Advantages and its Roadmap in India. In Proceedings of the 2021 IEEE 4th International Conference and Workshop Óbuda on Electrical and Power Engineering (CANDO-EPE), Budapest, Hungary, 17–18 November 2021; pp. 131–138. [Google Scholar] [CrossRef]
  67. 8 Million Households Across India; 202 mn Hindus, 31 mn Muslims n.d. Available online: https://www.financialexpress.com/policy/economy-total-households-248-8-million-202-mn-hindus-31-mn-muslims-census-261418/ (accessed on 7 July 2025).
  68. Bangladesh Electricity Production—July 2022 Data—2013-2021 Historical n.d. Available online: https://tradingeconomics.com/bangladesh/electricity-production (accessed on 20 August 2022).
  69. nstallation of More 8.8m Smart Prepaid Meters|Dhaka Tribune n.d. Available online: https://archive.dhakatribune.com/bangladesh/power-energy/2020/03/12/installation-of-more-tk88-lakh-smart-pre-payment-meters (accessed on 20 August 2022).
  70. Uniform Prepaid E-metering System n.d. Available online: https://powerdivision.gov.bd/site/page/ae49fd24-a37e-4644-a2c1-638bfc3bf537/ (accessed on 20 August 2022).
  71. Arafat, Y.; Hassan, M.M.; Alam, M. Prospects of Smart Metering System in Bangladesh: Cost Benefit Analysis. In Proceedings of the 2022 International Conference on Innovations in Science, Engineering and Technology (ICISET), Chittagong, Bangladesh, 26–27 February 2022; pp. 561–566. [Google Scholar] [CrossRef]
  72. Nepal Electricity Production, 1975–2022|CEIC Data n.d. Available online: https://www.ceicdata.com/en/indicator/nepal/electricity-production (accessed on 20 August 2022).
  73. Shrestha, R.M.; Rajbhandari, S. Energy and environmental implications of carbon emission reduction targets: Case of Kathmandu Valley, Nepal. Energy Policy 2010, 38, 4818–4827. [Google Scholar] [CrossRef]
  74. Yadav, R.K.; Dahal, I.D.; Karki, U.; Bista, P.; Bajracharya, A.; Dahal, P.; Giri, K.; Niraula, P. Nepal Electricity Authority Generator Directorate n.d. Available online: https://energypedia.info/wiki/Nepal_Energy_Situation (accessed on 7 July 2025).
  75. Development Bank A. Smart Metering Road Map for Nepal; ADB: Mandaluyong, Philippines, 2018. [Google Scholar] [CrossRef]
  76. Nepal Allocates $778 Million Budget for Energy Sector. Available online: https://www.aa.com.tr/en/energy/finance/nepal-allocates-778-million-budget-for-energy-sector/20354 (accessed on 3 January 2025).
  77. Bhutan: Energy Country Profile. Available online: https://ourworldindata.org/energy/country/bhutan (accessed on 7 January 2025).
  78. Bhutan’s population is 735,553. Available online: https://kuenselonline.com/index.php/dz/news/bhutanx27s-population-is-735553 (accessed on 7 January 2025).
  79. Sri Lanka—Energy n.d. Available online: https://www.trade.gov/country-commercial-guides/sri-lanka-energy (accessed on 20 August 2022).
  80. Access to Electricity (% of Population)—Sri Lanka|Data n.d. Available online: https://data.worldbank.org/indicator/EG.ELC.ACCS.ZS?locations=LK (accessed on 20 August 2022).
  81. Pictures: Smart Meters to Replace Electricity Meters—NewsWire n.d. Available online: https://tribune.com.pk/story/1412529/iesco-launch-new-electricity-meters (accessed on 7 July 2025).
  82. Energy Consumption on the Maldives n.d. Available online: https://www.worlddata.info/asia/maldives/energy-consumption.php (accessed on 20 August 2022).
  83. Energy Consumption in Afghanistan n.d. Available online: https://www.worlddata.info/asia/afghanistan/energy-consumption.php (accessed on 20 August 2022).
  84. Afghanistan—Access To Electricity (% Of Population)—2022 Data 2023 Forecast 1990–2020 Historical n.d. Available online: https://tradingeconomics.com/afghanistan/access-to-electricity-percent-of-population-wb-data.html (accessed on 20 August 2022).
  85. ADB. Energy Supply Improvement Investment Program (RRP AFG 47282-001). n.d.; Asian Development Bank (ADB): Manila, Philippines, 2016. [Google Scholar]
  86. Pillai, R.; Bhatnagar, R.; Thukral, H. AMI rollout strategy and cost-benefit analysis for India. CIRED Open Access Proc. J. 2017, 2017, 2602–2605. [Google Scholar] [CrossRef]
  87. Huang, W.H.; Chen, G.W.; Teng, J.H.; Liu, B.H. Development of an IEC61850-Based DCU for AMI. In Proceedings of the 2016 3rd International Conference on Green Technology and Sustainable Development (GTSD), Kaohsiung, Taiwan, 24–25 November 2016; Volume 2016, pp. 126–131. [Google Scholar] [CrossRef]
  88. Shah, I.; Khan, M. Cost Benefit Analysis of Smart Metering—International Journal of Engineering Works n.d. Available online: https://www.ijew.io/paper/analysis-of-smart-metering (accessed on 7 July 2025).
  89. Available online: https://cdn.standards.iteh.ai/samples/23377/def61e0e073642a9adbb28e18c9d5077/IEC-62053-21-2020.pdf (accessed on 8 July 2025).
  90. Available online: https://cdn.standards.iteh.ai/samples/23376/a93fb3cf9870451cae24e9705b9fda74/IEC-62052-11-2020.pdf (accessed on 8 July 2025).
  91. Bi-Directional Energy Meters—Smart Metering—KBK Electronics (Pvt.) Ltd. n.d. Available online: https://kbk.com.pk/product_categories/bi-directional-energy-meters/ (accessed on 20 August 2022).
  92. Three Phase Four Wire LT-TOU Bi-Directional Smart Meter—Smart Metering—KBK Electronics (Pvt.) Ltd. n.d. Available online: https://kbk.com.pk/products/three-phase-four-wire-lt-tou-bi-directional-smart-meter/ (accessed on 20 August 2022).
  93. Yan, Y.; Qian, Y.; Sharif, H.; Tipper, D. A survey on smart grid communication infrastructures: Motivations, requirements and challenges. IEEE Commun. Surv. Tutor. 2013, 15, 5–20. [Google Scholar] [CrossRef]
  94. Depuru, S.S.S.R.; Wang, L.; Devabhaktuni, V.; Gudi, N. Smart meters for power grid—Challenges, issues, advantages and status. In Proceedings of the 2011 IEEE/PES Power Systems Conference and Exposition, Phoenix, AZ, USA, 20–23 March 2011. [Google Scholar] [CrossRef]
  95. Pedersen, A.B.; Hauksson, E.B.; Andersen, P.B.; Poulsen, B.; Traeholt, C.; Gantenbein, D. Facilitating a Generic Communication Interface to Distributed Energy Resources: Mapping IEC 61850 to RESTful Services. In Proceedings of the 2010 First IEEE International Conference on Smart Grid Communications, Gaithersburg, MD, USA, 4–6 October 2010; pp. 61–66. [Google Scholar] [CrossRef]
  96. Govinda, K. Design of Smart Meter Using Atmel 89S52 Microcontroller. Procedia Technol. 2015, 21, 376–380. [Google Scholar] [CrossRef]
  97. Bennett, C.; Highfill, D. Networking AMI smart meters. In Proceedings of the 2008 IEEE Energy 2030 Conference, Atlanta, GA, USA, 17–18 November 2008. [Google Scholar] [CrossRef]
  98. Subhash, B.; Rajagopal, V. Overview of smart metering system in Smart Grid scenario. In Proceedings of the 2014 Power And Energy Systems: Towards Sustainable Energy, Bangalore, India, 13–15 March 2014. [Google Scholar] [CrossRef]
  99. Kalogridis, G.; Cepeda, R.; Denic, S.Z.; Lewis, T.; Efthymiou, C. ElecPrivacy: Evaluating the privacy protection of electricity management algorithms. IEEE Trans. Smart Grid 2011, 2, 750–758. [Google Scholar] [CrossRef]
  100. Saele, H.; Grande, O.S. Demand response from household customers: Experiences from a pilot study in Norway. IEEE Trans. Smart Grid 2011, 2, 102–109. [Google Scholar] [CrossRef]
  101. Hobby, J.D.; Shoshitaishvili, A.; Tucci, G.H. Analysis and methodology to segregate residential electricity consumption in different taxonomies. IEEE Trans. Smart Grid 2012, 3, 217–224. [Google Scholar] [CrossRef]
  102. Wang, Z.; Zheng, G. Residential appliances identification and monitoring by a nonintrusive method. IEEE Trans. Smart Grid 2012, 3, 80–92. [Google Scholar] [CrossRef]
  103. Raza, A.; Liaqat, M.; Adnan, M.; Iqbal, M.S.; Jingzhao, L.; Ahmad, I. SAARC super smart grid: Navigating the future—Unleashing the power of an energy-efficient integration of renewable energy resources in the SAARC region. Comput. Electr. Eng. 2024, 118 Pt B, 109405. [Google Scholar] [CrossRef]
  104. Nachreiner, M.; Mack, B.; Matthies, E.; Tampe-Mai, K. An analysis of smart metering information systems: A psychological model of self-regulated behavioural change. Energy Res. Soc. Sci. 2015, 9, 85–97. [Google Scholar] [CrossRef]
  105. Marvin, S.; Chappells, H.; Guy, S. Pathways of smart metering development: Shaping environmental innovation. Comput. Environ. Urban Syst. 1999, 23, 109–126. [Google Scholar] [CrossRef]
  106. Cyber Security: Cybersecurity for Power System Control Centers and Communication Networks, IEC 62351, 2023. Available online: https://www.iec.ch/blog/cyber-security-understanding-iec-62351 (accessed on 24 December 2024).
  107. IEC 62056-6-1:2023; Electricity Metering Data Exchange. Available online: https://webstore.iec.ch/en/publication/67916 (accessed on 24 December 2024).
  108. State Bank of Pakistan Report 2023. Available online: https://www.sbp.org.pk/ecodata/CRates/index.asp (accessed on 26 December 2024).
Figure 1. Smart grid system technology.
Sustainability 17 06786 g001
Figure 2. Smart meter system technology.
Sustainability 17 06786 g002
Figure 3. Energy imports in Pakistan, net (% of energy use).
Sustainability 17 06786 g003
Figure 4. Energy supply and demand from 2010 to 2030 in Pakistan.
Sustainability 17 06786 g004
Figure 5. Components of SWOT analysis.
Sustainability 17 06786 g005
Figure 6. Transmission and distribution (T&D) losses (%).
Sustainability 17 06786 g006
Figure 7. SWOT matrix.
Sustainability 17 06786 g007
Figure 8. Architecture of a smart metering system.
Sustainability 17 06786 g008
Figure 9. Block layout of a smart meter.
Sustainability 17 06786 g009
Figure 10. Flow chart of smart meter.
Sustainability 17 06786 g010
Figure 11. Data flow in a smart meter.
Sustainability 17 06786 g011
Figure 12. Internal rate of return for smart metering in SAARC countries.
Sustainability 17 06786 g012
Figure 13. Payback period for smart metering in SAARC countries.
Sustainability 17 06786 g013
Figure 14. Break-even point of the project.
Sustainability 17 06786 g014
Figure 15. Cost–benefit ratio of smart meters in SAARC countries.
Sustainability 17 06786 g015
Figure 16. Indigenous sources trends with capacity. (a) Solar across 5, 10, 20, and 30 kW, (b) wind across 2, 10, 20, and 30 kW, (c) biomass across 10, 20, and 30 kW, and (d) power and energy across each resource.
Sustainability 17 06786 g016
Figure 17. (a) Unified tariff (T1) across Cat-1–3. (b) Unified tariff (T2) across Cat-1–3. (c) Unified tariff (T3) across Cat-1–3.
Sustainability 17 06786 g017
Figure 18. (a) Multiple tariffs (T1–T3) across Cat-1–3 based on capacity. (b) Multiple tariffs (T1–3) across Cat-1–3 based on capacity. (c) Multiple tariffs (T1–3) across Cat-1–3 based on capacity.
Sustainability 17 06786 g018
Table 1. Annual losses of DISCO in Pakistan and allowable losses presented by NEPRA.
Name of DiscoActual Reported (%)Allowed in Tariff (%)Breach of Target (%)
PESCO36.631.954.65
IESCO8.868.650.21
GEPCO9.8710.03Nil
FESCO9.810.240.44
LESCO13.211.761.44
MEPCO15.815.000.8
QESCO23.617.506.1
SEPCO37.029.757.25
HESCO29.522.596.91
K-Electric19.118.750.35
W. Average:17.92316.1811.742
Table 2. Electrical usage data of feeder CANTT. No.1 PSR.
Sr. NoMonthkWh Supplied
1March 20201,457,000
2April 20201,440,000
3May 20201,550,000
4June 20201,620,000
5July 20201,798,000
6August 20201,736,000
7September 20201,500,000
8October 20201,488,000
9November 20201,350,000
10December 20201,302,000
11January 20211,240,000
12February20211,288,000
Total kWh Supplied in 1 year 17,769,000
Table 3. Cost analysis of system at consumer end, NAN, and utility end.
EquipmentUnit Rate (PKR)QuantityTotal (PKR)
Cost at consumer end
Single phase installed smart meter 8000750060,000,000
Cost of Neighborhood Area Network (NAN)
Data Concentrator Unit100,000757,500,000
Setting up Mesh Network10,00075750,000
Grand Total (PKR Million)--8,250,000
Cost of system at utility end
Head End System35 (Million)135,000,000
Meter Data Management System35 (Million)135,000,000
Hardware and Networking system85 (Million)185,000,000
Integration of System85 (Million)185,000,000
Grand Total (PKR)--240,000,000
Cost per Feeder--17,140,000
Table 4. Detailed estimated O&M cost.
ItemCost per AnnumTotal Cost 5 Years (PKR)
Maintenance of Smart meters1,500,0007,500,000
Maintenance of DCU187,500937,500
Maintenance of Head End System500,0002,500,000
Maintenance of MDMS500,0002,500,000
Maintenance of Computer Hardware and Networking system607,1423,035,714
Grand Total (PKR)16,473,214
Table 5. Savings on manual meter reading and bill calculations.
CategoryBenefitTotal Saving (PKR)
Savings on meter reading
Annual savings on meter reading30 × 7500 × 122,700,000
Total (PKR Million)2.7
Savings on bill calculations
Annual savings on bill calculation15 × 7500 × 12 1,350,000
Total (PKR Million)1.35
Overall savings (PKR Million)4.05
Table 6. Savings on non-technical losses due to smart metering.
CategoryEnergy Saved (kWh)kWh Rate (PKR)Total Cost (PKR)
Annual savings1,766,9001831,804,200
Total (PKR)17.058 million
Table 7. Cost–benefit ratio for SAARC countries.
CountryTotal CostCostsBenefitsCost–Benefit Ratio
PakistanPKR 14,200 PKR 4700PKR 89501.9
IndiaINR 12,475INR 4690INR 77851.66
BangladeshUSD 1040USD 440USD 6001.36
NepalNPR 21,454 NPR 8000NPR 13,4541.68
BhutanBTN 22,500BTN 8600BTN 13,9001.61
Sri LankaUSD 200USD 115USD 851.35
MaldivesMVR 32,935MVR 13,480MVR 19,4551.44
AfghanistanUSD 150USD 65USD 851.30
Table 8. Daily, monthly, and yearly savings with T1 = 19.325 Rs/PKR/kWh.
Tariff-1 (T1)
T1 = 19.325
Daily Saving (PKR)Monthly Saving (PKR)Yearly Saving (Million PKR)
MG1/CG1MG2/CC2MG3/CC3MG1/CG1MG2/CC2MG3/CC3MG1/CG1MG2/CC2MG3/CC3Annual
Cat 1–10 kW-T13169.521797.214595.203238.95,085.587753,916.30491137,856.09721.1410270.6469961.6542733.442295877
Cat 1–20 kW-T15766.5783163.0768126.873651172,997.34994,892.273243,806.20952.0759681.1387072.9256756.140349978
Cat 1–30 kW-T18204.6814558.09111,584.2676246,140.4414136,742.7449347,528.02792.9536851.6409134.1703368.76493457
Cat 2–10 kW-T13150.2631582.3794817.40589537,803.1549418,988.5507757,808.870740.4536380.2278630.6937061.375206917
Cat 2–20 kW-T16151.9413471.7649227.43063973,823.2886441,661.17084110,729.16770.8858790.4999341.328752.714563526
Cat 2–30 kW-T18939.2035005.78512,796.35336107,270.431860,069.41967153,556.24031.2872450.7208331.8426753.850753101
Cat 3–10 kW-T12690.1991086.94388.48430880,705.982232,606.9975131,654.52920.9684720.3912841.5798542.939610107
Cat 3–20 kW-T16215.84431589599.976755186,475.329694,739.9971287,999.30262.2377041.136883.4559926.830575552
Cat 3–30 kW-T19321.7595156.74314,241.28491279,652.7841154,702.2987427,238.54743.3558331.8564285.12686310.33912356
Table 9. Daily, monthly, and yearly savings with T2 = 14.285 Rs/PKR/kWh.
Tariff-2 (T2)
T2 = 14.285
Daily Saving (PKR)Monthly Saving (PKR)Yearly Saving (Million PKR)
MG1/CG1MG2/CC2MG3/CC3MG1/CG1MG2/CC2MG3/CC3MG1/CG1MG2/CC2MG3/CC3Annual
Cat 1–10 kW-T23129.9481821.3274465.79896193,898.4299154,639.81041133,973.96881.1267810.6556781.6076883.39014651
Cat 1–20 kW-T25147.6822938.7667063.736701154,430.455888,162.98444211,912.1011.8531651.0579562.5429455.454066495
Cat 1–30 kW-T27039.184027.2519620.096562211,175.3879120,817.5351288,602.89692.5341051.449813.4632357.447149838
Cat 2–10 kW-T23228.6941713.7764926.83657438,744.3261820,565.3122459,122.038890.4649320.2467840.7094641.421180128
Cat 2–20 kW-T25951.9333494.9588847.12245471,423.1946841,939.49995106,165.46950.8570780.5032741.2739862.634337969
Cat 2–30 kW-T28317.5114796.72211,571.1135499,810.135657,560.66937138,853.36251.1977220.6907281.666243.55469001
Cat 3–10 kW-T22947.3761351.2764642.72478288,421.2742140,538.2895139,281.74351.0610550.4864591.6713813.218895686
Cat 3–20 kW-T26328.6713421.6599751.104096189,860.1402102,649.7818292,533.12292.2783221.2317973.5103977.020516539
Cat 3–30 kW-T29427.4265395.25914,113.23282,822.7923161,857.7595423,396.90013.3938741.9422935.08076310.41692942
Table 10. Daily, monthly, and yearly savings with T3 = 9.25 Rs/PKR/kWh.
Tariff-2 (T2)
T2 = 14.285
Daily Saving (PKR)Monthly Saving (PKR)Yearly Saving (Million PKR)
MG1/CG1MG2/CC2MG3/CC3MG1/CG1MG2/CC2MG3/CC3MG1/CG1MG2/CC2MG3/CC3Annual
Cat 1–10 kW-T23129.9481821.3274465.79896193,898.4299154,639.81041133,973.96881.1267810.6556781.6076883.39014651
Cat 1–20 kW-T25147.6822938.7667063.736701154,430.455888,162.98444211,912.1011.8531651.0579562.5429455.454066495
Cat 1–30 kW-T27039.184027.2519620.096562211,175.3879120,817.5351288,602.89692.5341051.449813.4632357.447149838
Cat 2–10 kW-T23228.6941713.7764926.83657438,744.3261820,565.3122459,122.038890.4649320.2467840.7094641.421180128
Cat 2–20 kW-T25951.9333494.9588847.12245471,423.1946841,939.49995106,165.46950.8570780.5032741.2739862.634337969
Cat 2–30 kW-T28317.5114796.72211,571.1135499,810.135657560.66937138,853.36251.1977220.6907281.666243.55469001
Cat 3–10 kW-T22947.3761351.2764642.72478288,421.2742140,538.2895139,281.74351.0610550.4864591.6713813.218895686
Cat 3–20 kW-T26328.6713421.6599751.104096189,860.1402102,649.7818292,533.12292.2783221.2317973.5103977.020516539
Cat 3–30 kW-T29427.4265395.25914,113.23282,822.7923161,857.7595423,396.90013.3938741.9422935.08076310.41692942
Table 11. Daily, monthly, and yearly savings with T1–T3 = 19.325, 14.285, 9.25 Rs/PKR/kWh.
Tariff-2 (T2)
T2 = 14.285
Daily Saving (PKR)Monthly Saving (PKR)Yearly Saving (Million PKR)
MG1/CG1MG2/CC2MG3/CC3MG1/CG1MG2/CC2MG3/CC3MG1/CG1MG2/CC2MG3/CC3Annual
Cat 1–10 kW-T23169.519591797.2101644595.20323895,085.587753,916.30491137,856.09721.1410270520.6469956591.6542731663.442295877
Cat 1–20 kW-T23129.9476641821.3270144465.79896193,898.4299154,639.81041133,973.96881.1267811590.6556777251.6076876263.39014651
Cat 1–30 kW-T23052.1918391912.2289584311.17385391,565.7551757,366.86873129,335.21561.0987890620.6884024251.5520225873.339214074
Cat 2–10 kW-T25766.57833163.0757678126.873651172,997.34994,892.273243,806.20952.0759681881.1387072762.9256745146.140349978
Cat 2–20 kW-T25147.681862938.7661487063.736701154,430.455888,162.98444211,912.1011.853165471.0579558132.5429452135.454066495
Cat 2–30 kW-T24601.0352670.4193336001.531552138,031.0580,112.58180,045.94661.65637260.961350962.1605513594.778274919
Cat 3–10 kW-T28204.681384558.09149511,584.2676246,140.4414136,742.7449347,528.02792.9536852971.6409129384.1703363358.76493457
Cat 3–20 kW-T27039.1795954027.251179620.096562211,175.3879120,817.5351288,602.89692.5341046541.4498104213.4632347627.447149838
Cat 3–30 kW-T25889.7923415.8117656.857328176,693.76102,474.33229,705.71992.120325121.229691962.7564686386.106485718
Table 12. Daily, monthly, and yearly savings with T1–T3 = 19.325, 14.285, 9.25 Rs/PKR/kWh.
Tariff-2 (T2)
T2 = 14.285
Daily Saving (PKR)Monthly Saving (PKR)Yearly Saving (Million PKR)
MG1/CG1MG2/CC2MG3/CC3MG1/CG1MG2/CC2MG3/CC3MG1/CG1MG2/CC2MG3/CC3Annual
Cat 1–10 kW-T23150.2629111582.3792314817.40589537,803.1549418,988.5507757,808.870740.4536378590.2278626090.6937064491.375206917
Cat 1–20 kW-T23228.6938481713.776024926.83657438,744.3261820,565.3122459,122.038890.4649319140.2467837470.7094644671.421180128
Cat 1–30 kW-T23335.5771311847.0910825030.86015140,026.9255722,165.0929960,370.321820.4803231070.2659811160.7244438621.470748084
Cat 2–10 kW-T26151.940723471.7642379227.43063973,823.2886441,661.17084110,729.16770.8858794640.499934051.3287500122.714563526
Cat 2–20 kW-T25951.932893494.9583298847.12245471,423.1946841,939.49995106,165.46950.8570783360.5032739991.2739856332.634337969
Cat 2–30 kW-T25889.6413793672.3603598668.4199170,675.6965544,068.32431104,021.03890.8481083590.5288198921.2482524672.625180717
Cat 3–10 kW-T28939.202655005.78497212,796.35336107,270.431860,069.41967153,556.24031.2872451820.7208330361.8426748833.850753101
Cat 3–20 kW-T28317.51134796.72244811,571.1135499,810.135657,560.66937138,853.36251.1977216270.6907280321.666240353.55469001
Cat 3–30 kW-T27901.910084711.53904810,311.2374294,822.9209656,538.46858123,734.8491.1378750520.6784616231.4848181893.301154863
Table 13. Daily, monthly, and yearly savings with T1–T3 = 19.325, 14.285, 9.25 Rs/PKR/kWh.
Tariff-2 (T2)
T2 = 14.285
Daily Saving (PKR)Monthly Saving (PKR)Yearly Saving (Million PKR)
MG1/CG1MG2/CC2MG3/CC3MG1/CG1MG2/CC2MG3/CC3MG1/CG1MG2/CC2MG3/CC3Annual
Cat 1–10 kW-T22690.1994071086.8999174388.48430880,705.982232,606.9975131,654.52920.9684717860.391283971.5798543512.939610107
Cat 1–20 kW-T22947.3758071351.2763174642.72478288,421.2742140,538.2895139,281.74351.0610552910.4864594741.6713809223.218895686
Cat 1–30 kW-T23208.2794071619.3799174900.69245696,248.3822248,581.3975147,020.77371.1549805870.582976771.7642492843.502206641
Cat 2–10 kW-T26215.844323157.9999039599.976755186,475.329694,739.9971287,999.30262.2377039551.1368799653.4559916326.830575552
Cat 2–20 kW-T26328.671343421.6593949751.104096189,860.1402102,649.7818292,533.12292.2783216821.2317973823.5103974757.020516539
Cat 2–30 kW-T26483.5683686.4310839910.102999194,507.04110,592.9325297,303.092.334084481.327115193.567637087.22883675
Cat 3–10 kW-T29321.759475156.7432914,241.28491279,652.7841154,702.2987427,238.54743.3558334091.8564275845.12686256810.33912356
Cat 3–20 kW-T29427.426415395.25865114,113.23282,822.7923161,857.7595423,396.90013.3938735081.9422931145.08076280110.41692942
Cat 3–30 kW-T29178.8215619.58113,898.8293275,364.63168,587.43416,964.8793.304375562.023049165.00357854810.33100327
Table 14. Comparison of factors.
S#:FactorBugden and Stedman [49]This Study [P] (SAARC)
1Primary Acceptance DriverFamiliarity with technologyCost recovery from loss reduction
2Engagement TriggerReal-time pricing plansPrepaid tariffs and theft alerts
3BarrierPrivacy concernsGrid reliability (4–8 h daily outages)
Disclaimer/Publisher’s Note: The statements, opinions and data contained in all publications are solely those of the individual author(s) and contributor(s) and not of MDPI and/or the editor(s). MDPI and/or the editor(s) disclaim responsibility for any injury to people or property resulting from any ideas, methods, instructions or products referred to in the content.