1. Introduction
1.1. Context and Justification
The circular economy has emerged as a major paradigm to solve the environmental and sustainability challenges of the 21st century. In contrast to the traditional linear economic model, which follows the “take, make, dispose” pattern, the circular economy will close the product life cycle through reduction, reuse, recycling, and recovery strategies. The model is not only more resource-efficient but it also enhances innovation and business competitiveness [
1,
2,
3]. The circular economy is a model that moves away from the traditional linear approach, focusing on sustainability by promoting the continuous use of resources. Its core principles include eliminating waste and pollution, keeping products and materials in use through reuse and recycling, and regenerating natural systems [
4]. To achieve these objectives, strategies like sustainable product design, resource efficiency, lifecycle management, business model innovation, circular supply chains, and active consumer engagement are put into practice. Additionally, collaborative consumption, digitalization of product information, and green public procurement are promoted to drive the transition towards a more sustainable and economically beneficial system [
5].
During the transition to a circular economy practice, strategic and operational decisions are crucial. These decisions cover a wide range of activities, from material selection and product design to waste management and policy formulation [
6,
7]. All these areas requires careful consideration of multiple, often conflicting, criteria. For example, the selection of materials for a product may involve balancing cost, durability, and environmental impacts, while product design may need to account for functionality, recyclability, and energy efficiency. Additionally, waste management strategies must weigh the benefits of various recycling and recovery methods against their environmental footprints and economic competitiveness. In short, the transition to a circular economy involves balancing a range of criteria, typically environmental, economic, and social criteria, and the Analytic Hierarchy Process (AHP) may prove to be a helpful tool in this regard.
The AHP is a structured and systematic decision-making technique designed to support complex decisions, making it particularly valuable in the context of the circular economy. Developed by Thomas L. Saaty in the 1970s, AHP aids decision-makers in navigating the complexities of circular economy initiatives by decomposing decision problems into a hierarchy of manageable sub-problems [
8]. This approach facilitates comprehensive comparisons of various criteria and alternatives, considering both quantitative data and qualitative judgments. By organizing decisions into pairwise comparisons and synthesizing the results, AHP allows for the systematic evaluation of alternatives across multiple indicators, facilitating more balanced and sustainable choices [
8,
9].
Furthermore, the AHP’s ability to integrate multiple criteria makes it especially well-suited for circular economy applications. By incorporating factors like environmental impacts, cost, resource efficiency, and social implications, the AHP ensures a balanced and comprehensive evaluation. This method enhances transparency and consistency in decision-making, providing stakeholders with a clear rationale for the selected options.
The AHP has been effectively utilized across various sectors to advance circular economy initiatives. For instance, Oliveira et al. (2023) utilized the AHP in the Brazilian textile industry to prioritize key factors such as product expansion, upcycling, and increased sustainability, which are critical for adopting circular economy practices [
10]. Similarly, Balwada et al. (2021) applied the AHP in the plastics sector to identify the most effective waste collection methods, determining that the Deposit and Refund system is the most suitable for supporting circular economy goals in plastic waste management [
11]. Additionally, Gallucci et al. (2023) employed a fuzzy AHP to rank macro and sub-indicators of circularity at the EU level, identifying “competitiveness and innovation” and “secondary raw materials” as pivotal criteria [
12].
Given the proven effectiveness of the AHP in supporting circular economy strategies, this study explores its broader applicability in complex decision-making environments. Within the EU ECOFACT Project, the AHP is applied to optimize the must cooling process in the brewing sector, where water and energy consumption are key factors. Beyond evaluating this specific case, this study delves into the methodological limitations of the AHP, such as its sensitivity to subjective inputs and the complexity of large-scale implementation. Additionally, it explores how the AHP can complement circular economy principles, reinforcing its role as a decision-support tool for sustainable resource management.
This article examines the application of the AHP as a tool for advancing decision-making within the context of the circular economy. By integrating the AHP with circular economy principles, this study evaluates its capacity to support more informed material selection, streamline waste management strategies, and guide product design towards greater recyclability and potential for reuse. Additionally, it examines how the AHP can enhance sustainable supply chains, guide strategic investment decisions, conduct life cycle assessments for better resource efficiency, and support the adoption of circular business models. The article also explores the role of the AHP in policy formulation and as a risk assessment tool to advance circular economy initiatives.
In addition, to validate the application of the AHP under complex systems, a case study in brewery sector under the EU ECOFACT Project (
https://ecofact-project.eu/, accessed on 26 February 2025) is presented. Lastly, the article explores the versatility of the AHP in various applications of the circular economy, beyond that observed in the case study. The
Section 6 summarizes the main discoveries, addressing the replicability potential of the methodology, and offers recommendations for future research.
1.2. Limitations of the Classical AHP and the Need for Alternatives
The AHP has established itself as a popular tool for decision-making, particularly in contexts involving multiple criteria. Its appeal largely stems from its user-friendly nature and systematic framework. Still, it is important to recognize that the classic AHP model is not perfect. Certain limitations can hinder its performance in specific scenarios, which has prompted researchers and practitioners to propose various alternative approaches. The following points outline some of the main issues that have driven the evolution of AHP variants:
One of the most prominent criticisms of the classical AHP is the consistency problem in pairwise comparisons. Although the AHP uses matrices to assess the relative importance of criteria and alternatives, ensuring consistency in these comparisons is difficult. Inconsistent judgments (e.g., A is more important than B, B is more important than C, but A is less important than C) can compromise the reliability of results and decision outcomes.
The classical AHP also assumes that relationships between criteria are linear and additive; essentially, it treats the importance of each criterion as if you can just sum them up. Yet, in real-world decision-making, relationships between criteria are often more complex and interconnected. This linear approach limits the AHP’s capacity to accurately reflect and model such nuanced dependencies, potentially leading to oversimplified or even misleading outcomes.
The classical AHP demonstrates a notable sensitivity to even minor fluctuations in input values, which can result in substantial shifts in the final decision. This sensitivity is particularly pronounced when the alternatives under consideration are closely matched. In such cases, even minimal adjustments within the pairwise comparisons can produce significant changes in the decision outcome.
The AHP tends to assume that every criterion and alternative can be evaluated with exact values, which, frankly, is not always realistic. In real-world situations, uncertainty and imprecision in people’s judgments are just part of the package. Traditional AHP is not particularly well-equipped to address this kind of ambiguity, and as a result, the overall quality and reliability of the decision-making process can take a hit.
Due to these limitations, various alternatives and hybrid approaches have been developed to address these weaknesses and improve the robustness and applicability of the AHP framework. Below, in
Table 1, we explore some of the most notable variants and hybrids of the AHP.
2. Synergies Between the AHP and Circular Economy
The implementation of the AHP within a brewery context enabled stakeholders to systematically evaluate various operational scenarios and identify strategies that balanced resource usage with efficiency. Rather than serving as a mere procedural step, the AHP supported nuanced decision-making by allowing for the consideration of multiple, often competing, factors. This approach ultimately contributed to decisions that were both effective and sustainable.
Furthermore, the utility of the AHP extends well beyond the confines of the brewing industry. Its flexible methodology makes it applicable across a broad range of sectors, whether in manufacturing, urban planning, or other resource-intensive fields. By facilitating more informed and balanced decisions, the AHP presents itself as a valuable tool for promoting sustainability and responsible resource management in diverse professional environments.
2.1. Material Selection for Circularity
The AHP stands out as a valuable tool for selecting materials that align with circular economy principles. When a company develops a new product line, it faces the challenge of evaluating materials based on a variety of criteria, including recyclability, durability, and environmental impacts, to name just a few. These decisions are not trivial; they directly affect the sustainability of the product, shape consumer perceptions, and influence production costs.
By leveraging the AHP, companies can systematically compare material options such as recycled plastics, reusable metals, and bioplastics. The methodology structures the decision-making process, ultimately generating a ranked list of materials and highlighting the most balanced and sustainable choice. This comprehensive evaluation process not only streamlines material selection but also ensures that choices support corporate circularity objectives and broader environmental responsibilities.
Recent research illustrates the practical impact of the AHP in this context. Amarasinghe et al. (2024) applied a fuzzy version of the AHP (FAHP) within the construction industry to evaluate material circularity [
26]. Their framework prioritized criteria such as design for disassembly and avoidance of hazardous substances, demonstrating that structured methodologies can significantly improve material selection in line with circular economy objectives [
26].
Similarly, Markatos and Pantelakis (2022) developed a decision support tool for material selection in the aviation industry, integrating life-cycle-based metrics and a circular economy indicator [
27]. By utilizing multi-criteria decision analysis (MCDA), their tool enables the identification and selection of materials on the basis of ecological, economic, and circularity considerations. These examples underscore the value of structured decision-making processes for advancing sustainability and supporting the transition to a circular economy across multiple industries [
27].
2.2. Waste Management Optimization
Beyond material selection, the AHP plays a pivotal role in optimizing waste management strategies. Rather than relying on ad hoc decisions, the AHP enables municipalities to systematically evaluate various waste management alternatives, ranging from enhanced recycling initiatives and composting facilities to the adoption of waste-to-energy technologies.
This structured decision-making framework allows stakeholders to assess each option based on critical criteria, such as
Cost-effectiveness—evaluating financial feasibility and long-term sustainability;
Environmental impacts—measuring emissions, resource conservation, and ecological footprints;
Operational efficiency—assessing infrastructure requirements, logistics, and implementation feasibility.
By employing the AHP, municipalities and organizations can better align their waste management policies with broader sustainability objectives, resulting in more effective resource allocation and measurable reductions in landfill use.
A notable application of this method is demonstrated in the study by Apaydin and Akçay Han (2023), where the AHP was utilized to assess five distinct waste separation methods at the source in Türkiye [
28]. This real-world example underscores the AHP’s practical value in guiding evidence-based decisions within the complex domain of waste management [
28].
2.3. Circular Product Design
The AHP plays a pivotal role in advancing circular product design by offering a structured methodology for evaluating alternative solutions based on established circularity principles. Consider, for instance, a furniture manufacturer developing a new line of office chairs. The design team might weigh options such as modular systems to enable easy part replacement, components engineered for straightforward disassembly to facilitate recycling and repair, or the use of biodegradable materials to mitigate environmental impact.
The AHP provides a systematic approach for defining and comparing key criteria relevant to circularity, such as
Ease of disassembly—how efficiently the product can be taken apart for recycling or repair;
Material recyclability—the extent to which materials can be repurposed at the end of the product’s life cycle;
Component reuse potential—the ability to reuse parts in new products or refurbishments;
Product durability—the longevity and resilience of the design in daily use.
By assigning weights to these criteria and conducting pairwise comparisons among design alternatives, the AHP generates a prioritized ranking of options. This process ensures that the final design selection not only complies with circular economy objectives but also maintains functionality, durability, and environmental integrity.
This structured decision-making framework facilitates the development of sustainable and resource-efficient products, enabling companies to integrate circularity into their design practices more effectively. A concrete example of such application appears in the work of Desai, Bidanda, and Lovell (2012), who utilized the AHP to create a material and process selection engine (MPSE) within a Design for Manufacture (DFM) context [
29]. Their framework incorporated multiple criteria into design decisions, empowering both designers and customers to make informed choices about materials and processes. The demonstrated effectiveness of the AHP in optimizing product design highlights its value across various industries, including furniture manufacturing [
29].
2.4. Sustainable Supply Chain Management
The AHP is a practical and systematic method for evaluating suppliers in the pursuit of sustainable supply chain management. Rather than relying on superficial claims or marketing buzzwords, the AHP enables decision-makers to dissect and prioritize what actually matters, things like carbon emissions, the use of recycled or eco-friendly materials, labour standards, and reliability in meeting delivery schedules.
For example, a clothing manufacturer aiming to develop a more sustainable supply chain for its new collection must carefully choose among multiple suppliers. This decision involves considering environmental practices, labour conditions, and cost-effectiveness while ensuring operational reliability.
To guide this selection process, the AHP defines and prioritizes key evaluation criteria, such as
Carbon footprint—the supplier’s overall environmental impact, including emissions and energy use;
Use of eco-friendly materials—the extent to which suppliers incorporate sustainable fabrics and production methods;
Adherence to fair labour practices—compliance with ethical working conditions, wages, and labour rights;
Supplier reliability—the ability to deliver high-quality materials on time and consistently meet production demands.
By assigning weights to these criteria and performing pairwise comparisons of supplier options, the AHP enables a structured and objective evaluation. The resulting ranked list of suppliers highlights those that best align with sustainability goals while maintaining cost-effectiveness and reliability.
Through this systematic decision-making approach, the AHP supports companies in building ethical, sustainable, and efficient supply chains, ensuring long-term environmental and social responsibility in the industry.
Researchers like Tushar, Bari, and Khan (2022) have demonstrated robust applications of the AHP in combination with other decision-making frameworks (such as PROMETHEE II) to guide supplier selection in industries like construction [
30]. They emphasized criteria like pollution control, green packaging, and regulatory compliance as foundational for a circular supply chain. By using the fuzzy AHP to weigh these factors and PROMETHEE II to rank options, they provided a more objective and transparent way for managers, especially in emerging economies, to enhance the sustainability of their supply chains [
30].
2.5. Strategic Investment in Circular Initiatives
The AHP serves as a valuable decision-making tool for guiding strategic investments in circular economy initiatives by assessing projects based on key sustainability and business criteria.
For instance, a technology firm evaluating various circular strategies: investing in recycling programs, refurbishing legacy products, or developing environmentally friendly product lines. These decisions are rarely straightforward; each option must be weighed carefully in terms of feasibility, potential impact, and alignment with overarching sustainability objectives.
The AHP structures this evaluation by defining and ranking key criteria, such as
Expected environmental benefits—the potential reductions in waste, emissions, and resource consumption;
Cost-effectiveness—the financial viability and return on investment of the initiative;
Technological feasibility—the availability and maturity of technologies required for implementation;
Market demand—the potential consumer interest and commercial viability of the project.
Through a systematic process of assigning weights to these factors and conducting pairwise comparisons among available options, the AHP enables a rigorous, evidence-based assessment. The outcome is a prioritized list of initiatives, highlighting those most effectively balancing sustainability impact, economic feasibility, and business potential. This methodological rigor ensures that investment decisions are closely aligned with long-term sustainability strategies, facilitating optimal resource allocation and advancing both environmental and economic goals.
A parallel can be drawn to the work of Gupta, Jha, and Singh (2021), who developed a decision-making framework for Foreign Direct Investment (FDI) under conditions of uncertainty [
31]. Their multi-criteria, hierarchical approach identified critical determinants for FDI and prioritized investments across sectors such as information technology, retail, and healthcare. Their findings underscore the value of structured, systematic methodologies, like the AHP, in guiding complex investment decisions, whether in the realm of FDI or in advancing circular economy initiatives, ensuring alignment with broader strategic and sustainability imperatives [
31].
2.6. Risk Assessment in Circular Economy Initiatives
Another promising application of the AHP lies in its use for risk assessment within circular economy initiatives, offering a way to systematically identify and address obstacles that might impede the adoption of circular practices. Risk evaluation is essential; without it, achieving meaningful progress is nearly impossible. What sets the AHP apart is its ability to prioritize risks based on their relative importance, enabling stakeholders to weigh environmental, economic, and operational factors in tandem.
For instance, in the context of sustainable food supply chains, the AHP has been employed to pinpoint key success factors, ensuring that management strategies genuinely support circular economy principles. The method’s flexibility extends further; hybrid approaches such as the fuzzy AHP have been integrated with other assessment tools to evaluate quality and sustainability in sectors like bakeries and agriculture. This combination allows for nuanced decision-making that promotes resource efficiency while minimizing risks.
A recent study on sustainable whisky production underscores the AHP’s adaptability. Researchers used the method to assess risks associated with waste recovery, energy efficiency, and resource optimization, key concerns for industries aiming to transition towards circular models. The study’s findings demonstrate that the AHP can deliver actionable insights, aligning risk management with broader sustainability objectives and supporting operational resilience [
32].
2.7. Formulating Policies to Advance the Circular Economy Using the AHP
The AHP serves as a valuable tool for formulating effective circular economy policies, primarily due to its structured and systematic decision-making framework. Policymakers begin by clearly defining policy objectives, which often include improving resource efficiency, minimizing waste, fostering innovation, and promoting sustainable business practices. Key decision criteria, such as environmental impacts, economic feasibility, social implications, technological advancement, and regulatory compliance, guide the assessment of various policy alternatives.
Potential policy options might encompass tax incentives for companies adopting circular practices, regulatory requirements for enhanced product design and recycling, public awareness campaigns to educate stakeholders, and support for research and development in waste management technologies. Through the AHP, these alternatives are evaluated against the established criteria, allowing policymakers to rank options based on their overall effectiveness.
Once the most promising policies are identified, detailed implementation strategies can be developed. These strategies typically outline targeted actions, timelines, designated responsibilities, and mechanisms for monitoring and evaluation, ensuring that the chosen policies are executed effectively.
The AHP’s capacity to facilitate transparent and comprehensive evaluations of complex trade-offs leads to more informed and effective policy decisions. For example, in a 2022 study by Saira Naseer and colleagues, the AHP was employed to assess alternative strategies for enhancing green economic efficiency in China. The researchers considered factors such as resource efficiency and green procurement, ultimately providing actionable insights for sustainable development policy. This case illustrates the AHP’s potential to inform circular economy policies that align with broader sustainability objectives [
33].
3. Methodology
This section details the step-by-step application of the Analytic Hierarchy Process (AHP) within the scope of this study, focusing on its practical use in decision-making related to the circular economy.
3.1. Define the Problem and Goal
The first step in the AHP process is to clearly define the decision problem and establish the overarching goal of the decision-making process. In the context of the circular economy, as in any other field, there are a wide range of potential objectives. Some examples of goals that may be pursued include [
8]
Material selection for circularity—prioritizing materials based on factors such as recyclability, environmental impact, and economic feasibility;
Waste management strategy optimization—comparing and selecting waste management approaches (e.g., recycling, composting, and landfill) to minimize environmental harm and maximize operational efficiency;
Product design for recyclability and reuse—evaluating and selecting product designs that enable easy recycling, disassembly, and material recovery;
Sustainable supply chain rationalization—assessing suppliers and logistic options to promote environmental sustainability and social responsibility;
Strategic investment decisions for circularity—identifying and prioritizing investments in circular economy initiatives, such as renewable energy projects or recycling infrastructure;
Life cycle assessments for resource efficiency—analysing product life cycles to uncover opportunities for resource efficiency improvements and emissions reduction;
Adoption of circular business models—comparing business models (e.g., product-as-a-service) based on factors like economic viability, environmental impacts, and social outcomes;
Policy formulation to advance circularity—evaluating policy options (e.g., incentives for sustainable practices or regulations on single-use plastics) to prioritize actions that support the circular economy.
3.2. Data Sources
The empirical data underpinning this AHP implementation originates from a real-world industrial demonstration within the EU ECOFACT project. Specifically, the case study centres on a large-scale food and beverage manufacturing facility utilizing continuous cooling processes. Ten discrete operational scenarios were constructed by varying the outlet water temperature in the must cooling system, each scenario reflecting a technically and environmentally feasible mode of operation.
Input parameters essential for optimization, such as batch size, flow rates, and ambient conditions, were obtained through a combination of on-site instrumentation, historical process logs, and simulation tools designed within the project framework. Data preparation included standardization, normalization, and validation through life cycle assessment (LCA) and life cycle costing (LCC) methodologies to ensure consistency and comparability across all scenarios.
It should be noted that, due to confidentiality agreements with the industrial partner, the full dataset of process values is not available for public disclosure. Nevertheless, this work provides a transparent account of the analytical approach, key performance indicators, and methodological steps to support reproducibility.
The data collection and preparation process followed several key steps:
Definition of process parameters—Real operational constraints (e.g., equipment capacity, temperature limits, and control logic) were identified in collaboration with site engineers and domain experts.
Scenario simulation—A set of ten plausible operating conditions was simulated using an optimization module, varying only the water outlet temperature while maintaining all other parameters constant to ensure comparability.
Calculation of performance indicators—For each scenario, key performance indicators (KPIs) were calculated using dynamic life cycle assessment (LCA) and life cycle costing (LCC) models. These KPIs included electricity consumption, water usage, cumulative energy demand, total cost, environmental externalities, and environmental footprint scores.
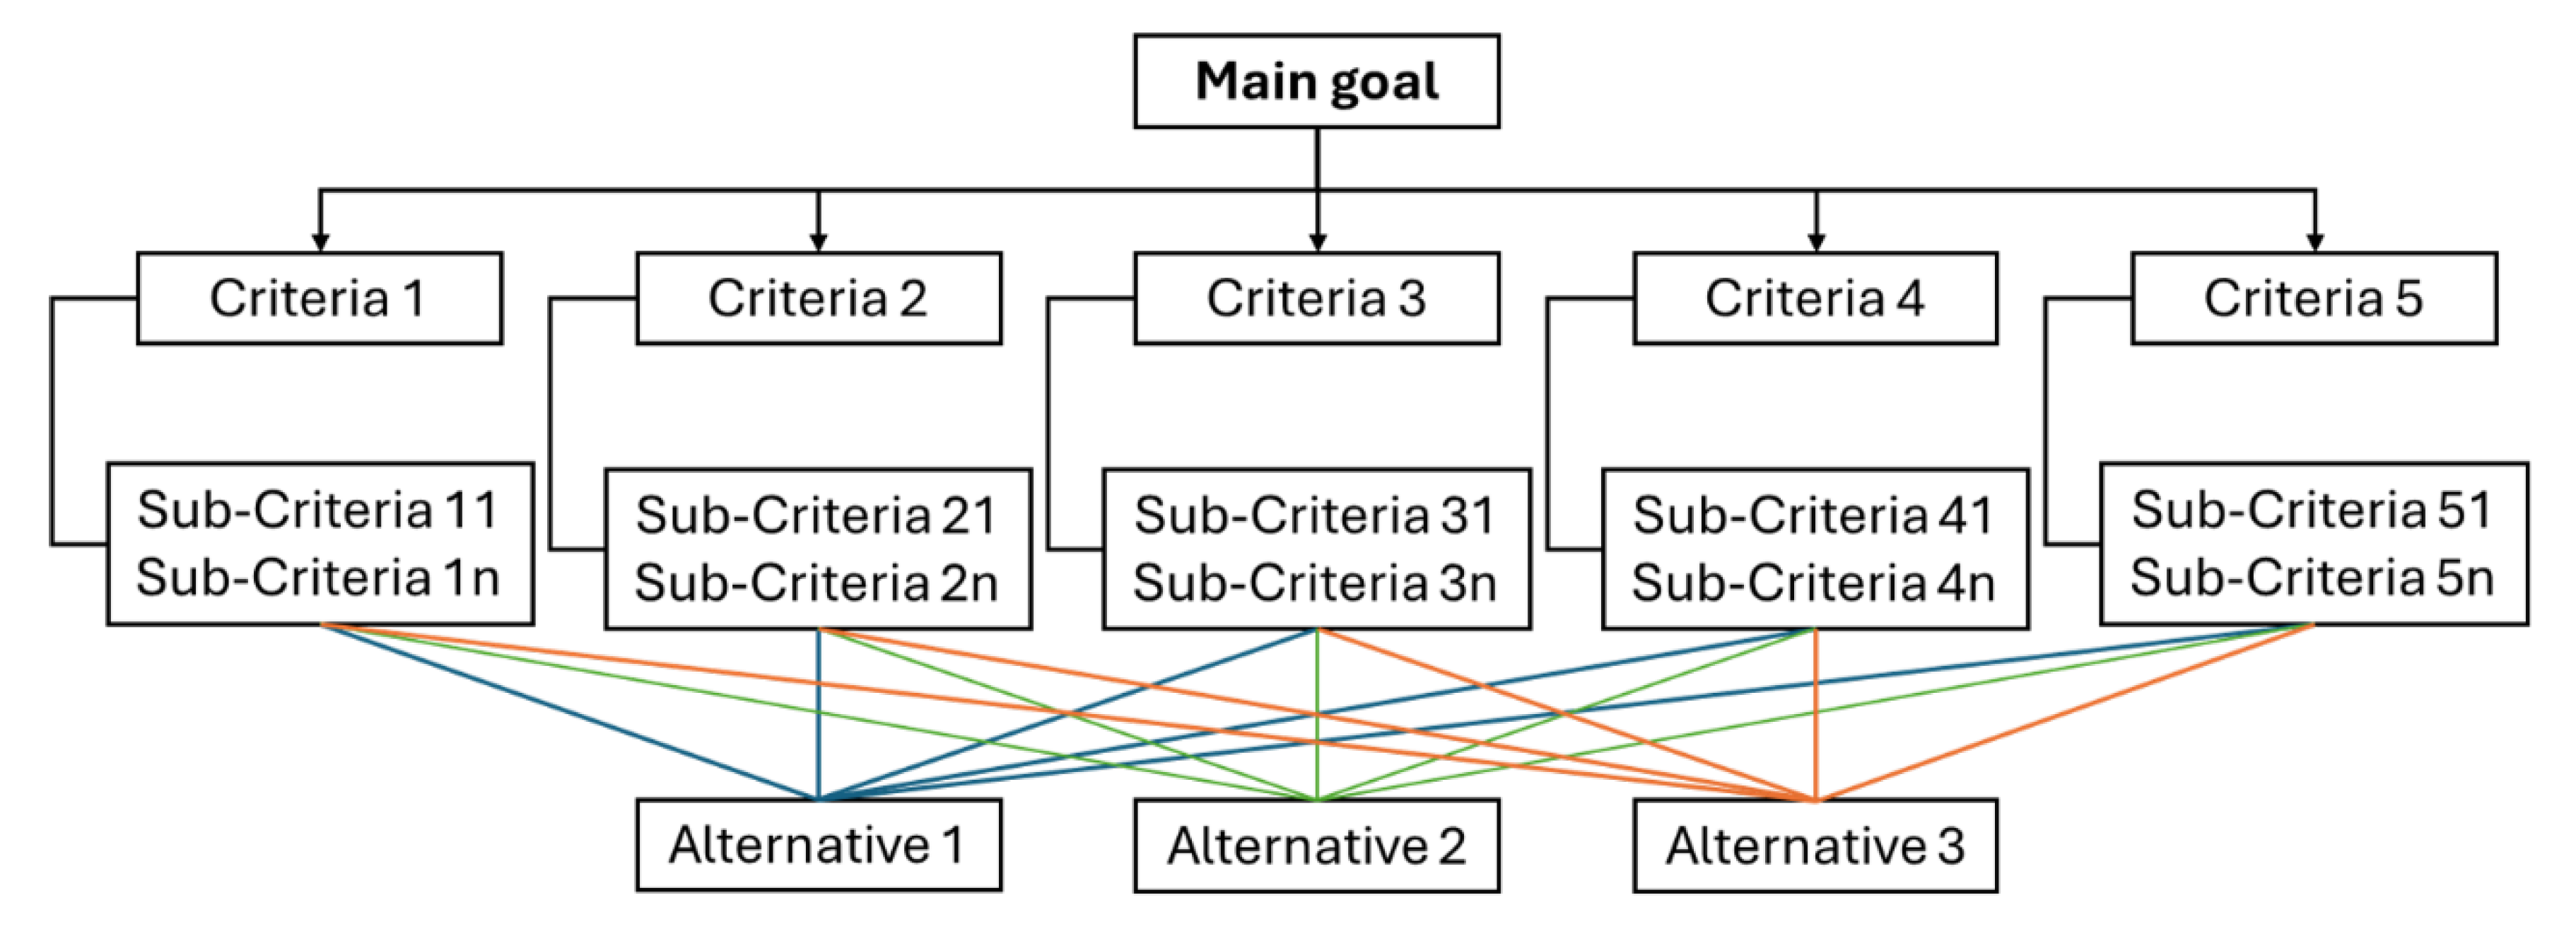
3.3. Structure the Hierarchy
The following step in the AHP process is to decompose the decision problem into a hierarchy of more manageable sub-problems, each of which can be analysed independently [
8]. This hierarchy typically starts with the overall goal at the top, followed by layers of criteria and sub-criteria, and finally, the alternatives at the bottom, as illustrated in
Figure 1.
In most cases, the criteria typically used include environmental, economic, and social factors. However, depending on the specific objectives, other criteria, such as technical aspects or additional relevant factors, can be incorporated. The same flexibility applies to the sub-criteria, which may also be adjusted to fit the particular context of the problem.
3.4. Pairwise Comparisons
The next step is to compare the elements at each level of the hierarchy in pairs, determining which element is more important and to what degree. This involves constructing a series of matrices where decision-makers assess the relative importance of each element. The comparison scale ranges from “equal importance” (1; the lowest value) to “absolutely more important” (9; the highest value), with intermediate values such as 2, 4, 6, and 8 used to express gradual differences in importance. In each matrix, the cell corresponding to the preferred criterion or sub-criterion is assigned the relevant value, while the opposite cell receives the inverse value (1/value) [
8]. The scale is illustrated in
Table 2.
The type of decision-maker will vary from case to case, but can range from experts and researchers to stakeholders or the general public.
3.5. Calculate Priority Weights
Use the results of the pairwise comparisons to calculate a set of priority weights for the criteria and sub-criteria. This typically involves normalizing the eigenvectors of the matrices derived from the pairwise comparisons [
8]. The process can be broken down into the following steps:
Sum the values in each column—For each column in the pairwise comparison matrix, sum all the values.
Normalize the matrix—Divide each entry in the matrix by the sum of its respective column. This converts the entries into proportions, reflecting the relative importance of each element.
Calculate the average of each row—To determine the priority weights, calculate the average of the normalized values in each row. This involves summing the normalized values in each row and dividing by the number of criteria.
This calculation reveals the relative importance of each criterion compared to others, as well as the significance of each sub-criterion within its respective criterion.
For example, in a manufacturing context focused on enhancing circular economy practices, various waste management strategies are evaluated. Criteria such as environmental impact, cost-effectiveness, and social acceptance are considered. Within the “environmental impact” criterion, sub-criteria could include greenhouse gas emissions, resource depletion, and water usage. By using the AHP, the priority weights are computed, helping to identify the most influential criteria and sub-criteria, which in turn guide decision-making processes.
3.6. Consistency Check
A key feature of the AHP is the consistency check, which ensures the reliability and validity of the pairwise comparisons. This step assesses the consistency of the decision-makers’ judgments across comparisons, helping to minimize biases and strengthen the robustness of the decision-making process. A consistency ratio (CR) is calculated, and if it exceeds a certain threshold (typically 0.1), it indicates that the judgments may need to be revised to improve consistency.
3.7. Aggregate the Weights
Finally, the AHP aggregates the judgments to produce a synthesized ranking or decision outcome. This synthesis combines the priority weights and pairwise comparisons, offering a comprehensive assessment that takes into account various dimensions of sustainability and business objectives.
4. Results
Within the ECOFACT project, a series of action plans have been developed, tailored to different use cases, with particular attention given to process adaptation, ancillary services, and infrastructure enhancement. To rigorously validate the proposed AHP methodology, this study presents its application using a brewery process as a case study.
The demonstration encompasses a suite of targeted implementation measures, primarily aimed at optimizing process adaptation and advancing infrastructure. The central focus is on the optimization of the must cooling process, a pivotal stage in brewing operations.
In the initial phase of the brewery demonstration, precise problem formulation was crucial for identifying the key factors, namely, water and electricity consumption, that significantly impact the efficiency of must cooling. Through comprehensive data collection and analysis, ten distinct scenarios were evaluated. Each scenario represented a unique balance between water and electricity usage, thereby illuminating the inherent trade-offs involved. This analysis underscored the critical importance of optimizing resource utilization. Subsequently, system modelling involved the application of dynamic Life Cycle Assessment (LCA) and Life Cycle Costing (LCC) methodologies to evaluate the effects of each scenario on technical, economic, and environmental key performance indicators (KPIs).
4.1. Formulating the Problem
The initial phase of the AHP methodology involves defining and formulating the problem to be addressed. In this demonstration, the focus is on optimizing the must cooling process, with particular attention to addressing the critical issues of water and electricity consumption within the broader context of a project aimed at improving resource efficiency.
Problem Identification. The project has identified water and electricity consumption as significant factors impacting the efficiency of the must cooling process. The goal is to optimize the use of these resources while ensuring the cooling process remains effective. This involves understanding how various operational scenarios impact resource usage and assessing their relative significance.
Data Collection and Analysis. Effective problem formulation requires the collection and analysis of reliable data. This involves gathering information about different scenarios within the must cooling process and evaluating their effects on resource consumption.
Various scenarios are explored using an optimization tool to assess their impacts on water and electricity usage.
Figure 2 shows the simulation results for the ten cooling scenarios, illustrating the inverse relationship between water and electricity consumption. As outlet water temperature increases, water consumption decreases due to shorter cooling cycles. However, this leads to higher electricity use, as additional mechanical cooling is required.
The table demonstrates that increasing the outlet water temperature results in reduced water consumption, but it leads to increased electricity consumption due to higher cooling requirements. For example, in Scenario 1, which features the lowest water temperature setpoint, water consumption is at its highest while electricity consumption is minimal. On the other hand, higher temperature setpoints lead to lower water usage but higher electricity consumption.
Problem Formulation. The next step involves formulating the problem by clearly defining objectives and constraints based on the collected data. This includes
Objective setting—The main objective is to balance water and electricity consumption while optimizing the must cooling process. Additional objectives may involve maintaining product quality and minimizing operational costs.
Constraint identification—Constraints could include technical limitations of the cooling system, budget restrictions, and environmental regulations.
By gaining a deep understanding these dynamics, the groundwork is laid for applying the AHP methodology to optimize the must cooling process, thereby enhancing resource efficiency and achieving sustainability goals.
System Modelling. In this phase, the must cooling demonstration system is modelled using dynamic LCA and LCC tools. The model incorporates different scenarios based on varying electricity and water consumption parameters.
The results for each scenario are analysed and divided into specific KPIs, categorized under technical, economic, and environmental criteria. The selected KPIs for each criterion are detailed in
Table 3.
Technical Criteria—This category includes KPIs such as direct electricity consumption in production, water consumption in manufacturing, and cumulative Energy Demand. These indicators reflect both the direct and indirect energy use associated with the must cooling process. While technical KPIs, particularly cumulative energy demand, can serve as indirect measures of environmental performance, they are categorized as technical KPIs in this analysis because they do not directly quantify the environmental impacts.
Economic Criteria—The economic dimension is assessed through two KPIs. The “total LCC cost” represents all internal costs incurred during the must cooling process while the “environmental prices” KPI calculates the societal cost associated with the environmental impacts of the process.
Environmental Criteria—The environmental aspect is represented by the “environmental footprint (single score EF3.0 method)” KPI. This indicator is chosen because it consolidates all other environmental KPIs into a single comprehensive score, providing a holistic measure of environmental performance.
To facilitate the demonstration, the KPI results from the LCA/LCC tools are related to a single batch (85 m
3 of must be cooled).
Figure 3,
Figure 4 and
Figure 5 present the performance of each scenario with respect to key sustainability indicators: economic, environmental, and technical indicators.
Figure 3 displays the aggregated LCA/LCC results for each scenario, providing an overview of how process modifications affect the main KPIs simultaneously. It highlights the trade-offs between operational costs, environmental externalities, and resource consumption under different cooling configurations.
From these results, it becomes clear that scenarios with reduced water consumption (notably Scenarios 6 to 10) generally lead to an increased electricity demand, along with higher operational costs and environmental prices.
Figure 4 focuses specifically on the environmental footprint, measured using the EF3.0 single score method, which aggregates multiple environmental impacts into a single value for comparison purposes.
The results in
Figure 4 show that Scenario 3 has the lowest environmental footprint among all ten alternatives. This scenario achieves a favourable balance by limiting energy and water usage without significantly increasing other environmental pressures. The figure also illustrates that improvements in one dimension (e.g., lower water use) do not always lead to overall environmental gains if they result in a higher electricity demand or operational intensity.
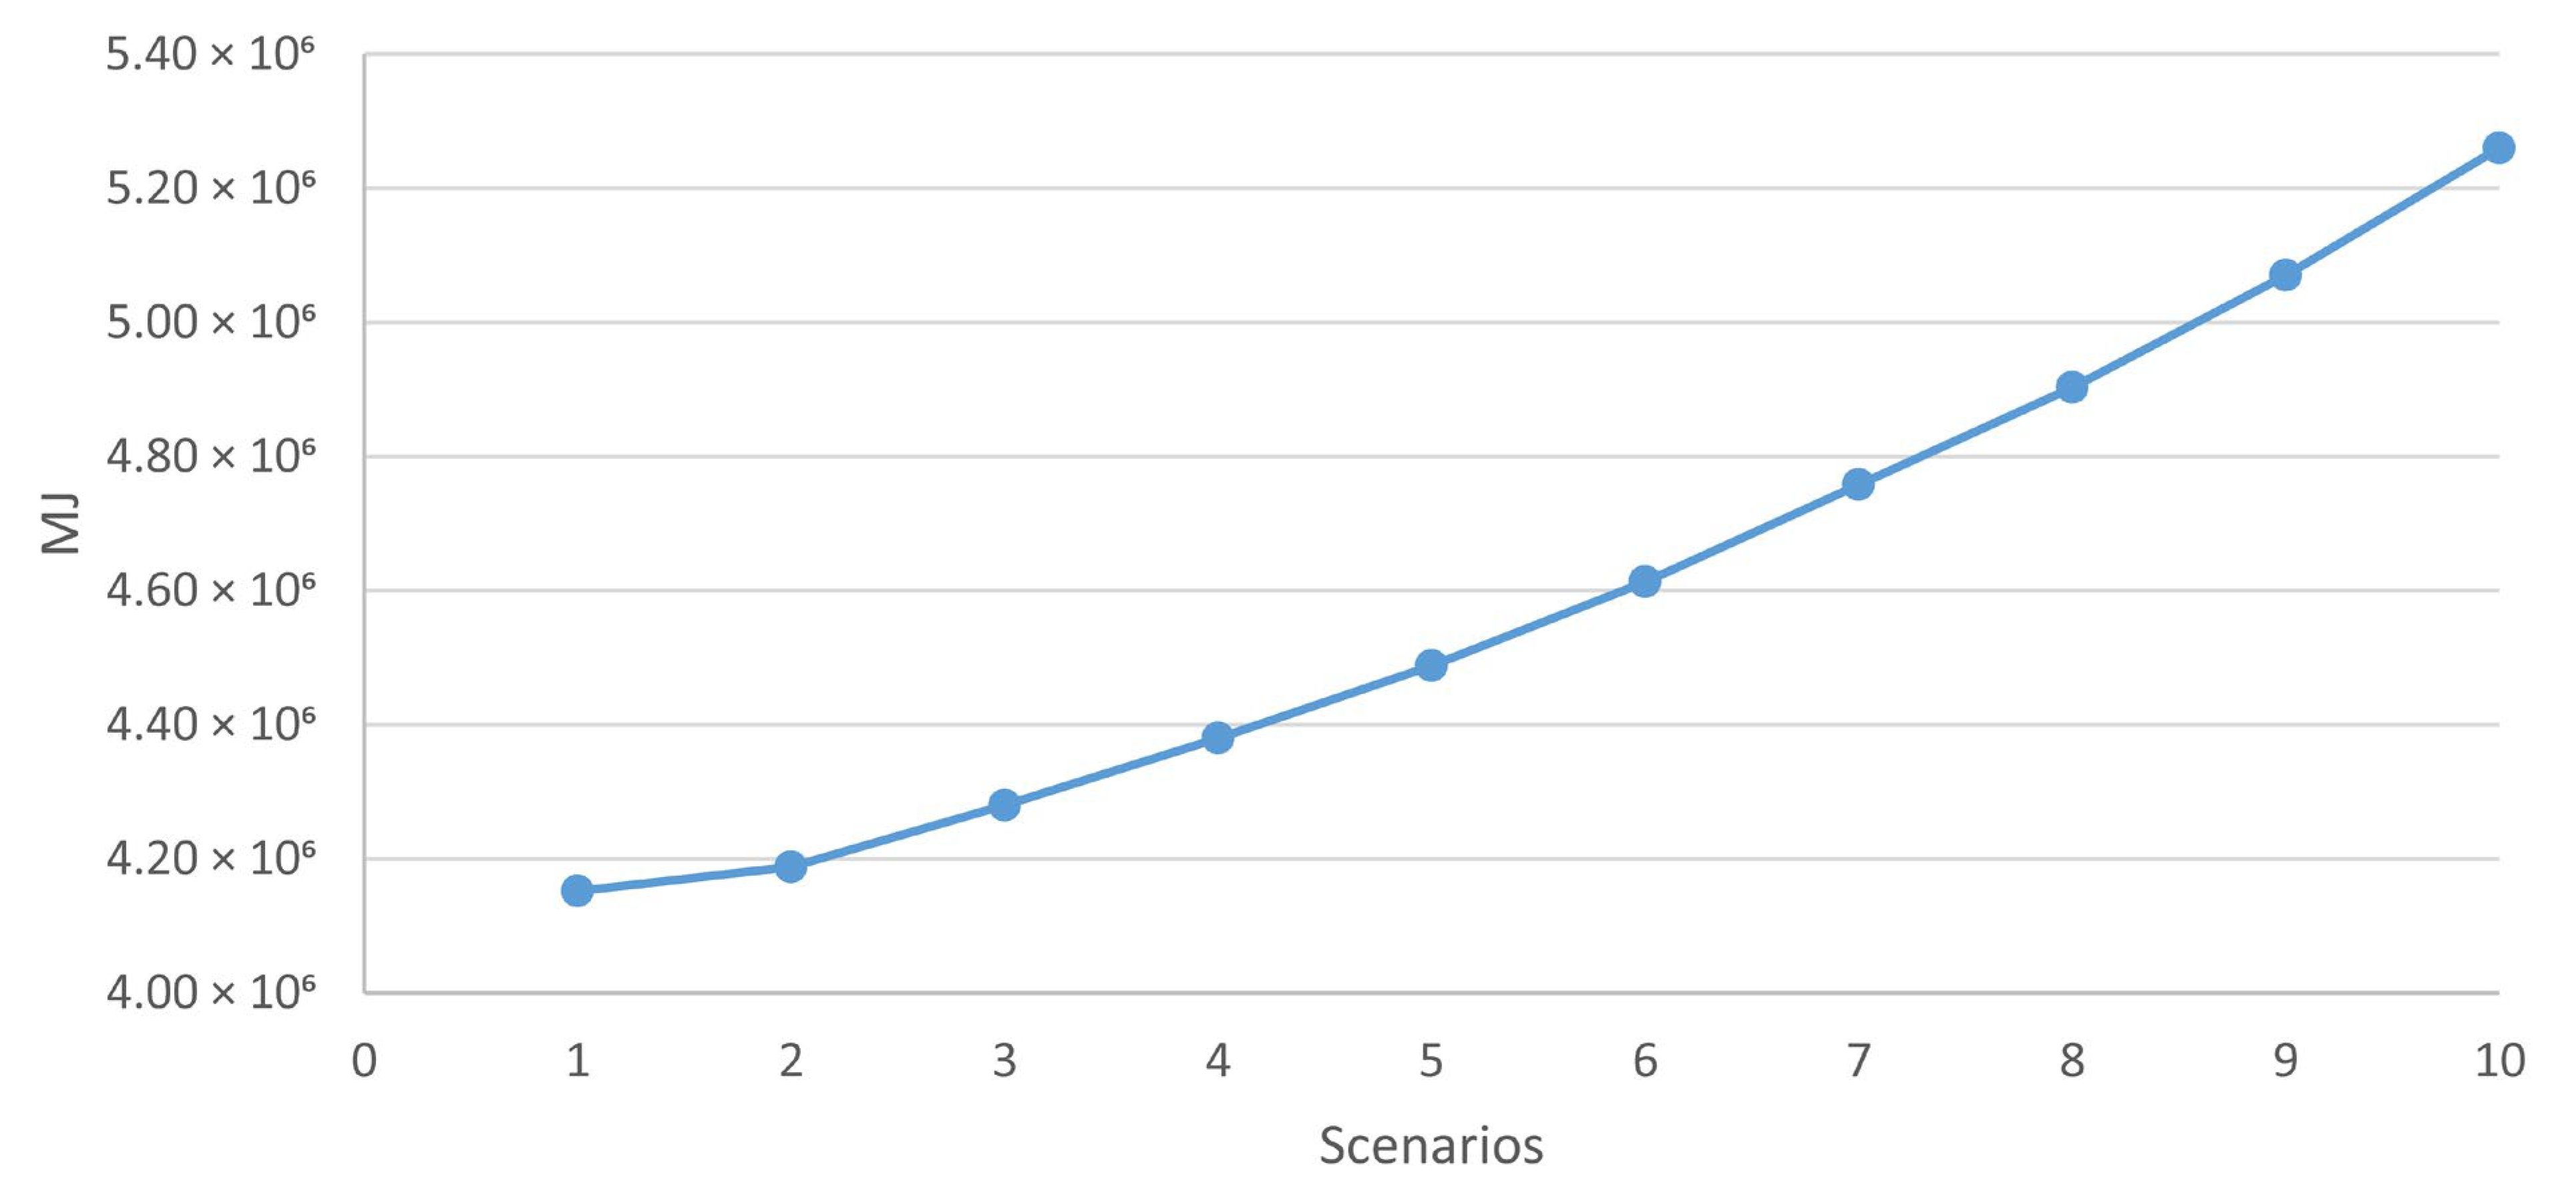
Figure 5 shows the cumulative energy demand (CED) in megajoules, reflecting both direct and indirect energy inputs.
As shown in
Figure 5, scenarios with higher outlet water temperature setpoints (e.g., Scenarios 6–10) generally require greater energy input due to increased reliance on mechanical cooling. Conversely, scenarios with lower setpoints (e.g., Scenarios 1–3) consume more water but result in a lower overall energy demand. This trade-off between water conservation and energy efficiency is central to the decision-making process and is directly addressed through the application of the AHP in the subsequent evaluation.
4.2. Analysis and Evaluation of User Preferences
In this segment, input from twelve key stakeholders, including process engineers, energy managers, and sustainability experts directly involved with the pilot, was gathered to assess and prioritize various criteria and KPIs. These individuals, recognized for their technical acumen, each completed a detailed questionnaire that required them to weigh the relative importance of different factors through pairwise comparisons. The intention here was to ensure that the resulting prioritization genuinely reflected hands-on operational expertise rather than abstract assumptions. To process these inputs, the AHP was utilized, enabling the structured calculation of weights by systematically evaluating the collected preferences.
Pairwise Comparison of Criteria. Initially, matrices are constructed for each criterion, with these criteria being compared pairwise against various KPIs at subordinate levels. The comparisons utilize an intensity scale ranging from one to nine, where the value indicates the degree to which one criterion or KPI dominates another. In each matrix, the cell corresponding reciprocal cell is given the inverse value (1/value). These preference values are sourced from the questionnaire responses provided by the demonstration project stakeholders. Iterative adjustments are then performed on the initial importance values to reduce the CR below the 10% threshold. The final calibrated importance values are presented in
Table 4.
For the criteria comparison,
Consistency Ratio (CR) = 7.97%. The consistency ratio reflects the coherence of judgments in pairwise comparisons. In this case, the criteria matrix has a CR of less than 8%, which is acceptable.
The technical criterion has a very strong importance value of eight compared to the economic criterion, with the opposite cell having the inverse value (1/8).
The technical criterion is seven times more important than the environmental criterion, with the inverse value (1/7).
The economic criterion has a moderate importance of two over the environmental criterion, with the inverse value (1/2) in the opposite cell.
Pairwise Comparison of Technical KPIs. In the pairwise comparison of technical KPIs, the resulting matrix is presented in
Table 5.
Consistency Ratio (CR) < 1%. The consistency ratio of the technical KPI matrix is less than 1%, indicating very good coherence.
Water consumption is five times more important than direct electricity consumption, with the inverse value (1/5).
Cumulative energy demand is five times more important than direct electricity consumption, with the inverse value (1/5).
Water consumption and cumulative energy demand are of equal importance (value 1).
Pairwise Comparison of Economic KPIs. The pairwise comparison for economic KPIs is summarized in
Table 6.
Consistency Ratio (CR) < 1%. The consistency ratio remains very low (<1%), which is acceptable.
The total LCC cost is eight times more important than environmental prices, with the inverse value (1/8).
Environmental KPI. The environmental criterion is represented solely by the “environmental footprint (single score EF3.0 method)” KPI. This indicator provides a comprehensive assessment of environmental performance by aggregating impacts across multiple environmental categories. Given its holistic nature, it is directly incorporated into the AHP algorithm without requiring pairwise comparisons with other environmental indicators.
Weight Calculation. The next step in the AHP process is the calculation of weights for each criterion and KPI, based on the pairwise comparison results. This involves computing the geometric mean of the values in each row of the pairwise comparison matrix. The resulting values are then normalized to ensure that the sum of all weights equal one. The final weight distribution is presented in
Table 7.
Based on user evaluations, the “cumulative energy demand” KPI emerges as the highest priority, receiving a weight of 35.71%, surpassing other KPIs. This metric quantifies both direct and indirect energy consumption throughout the entire life cycle of a product, in this case, the production of 1 L of beer. It encompasses the energy expended during raw material extraction, manufacturing, and disposal of both primary and auxiliary materials. Meanwhile, water and electricity consumption KPIs specifically account for the direct resource usage in production.
4.3. Verification and Ranking of User Preferences
The final step involves validating user preferences and aligning them with the KPI results across each scenario to establish a ranking based on their suitability to the user’s priorities.
To facilitate comparison, KPI results for each scenario are normalized into a single value, addressing differences in measurement units. Normalization is conducted relative to the maximum KPI value across all scenarios, ensuring a standardized scale where the worst KPI value is assigned a score of zero. This process guarantees that each KPI is proportionally represented in the evaluation.
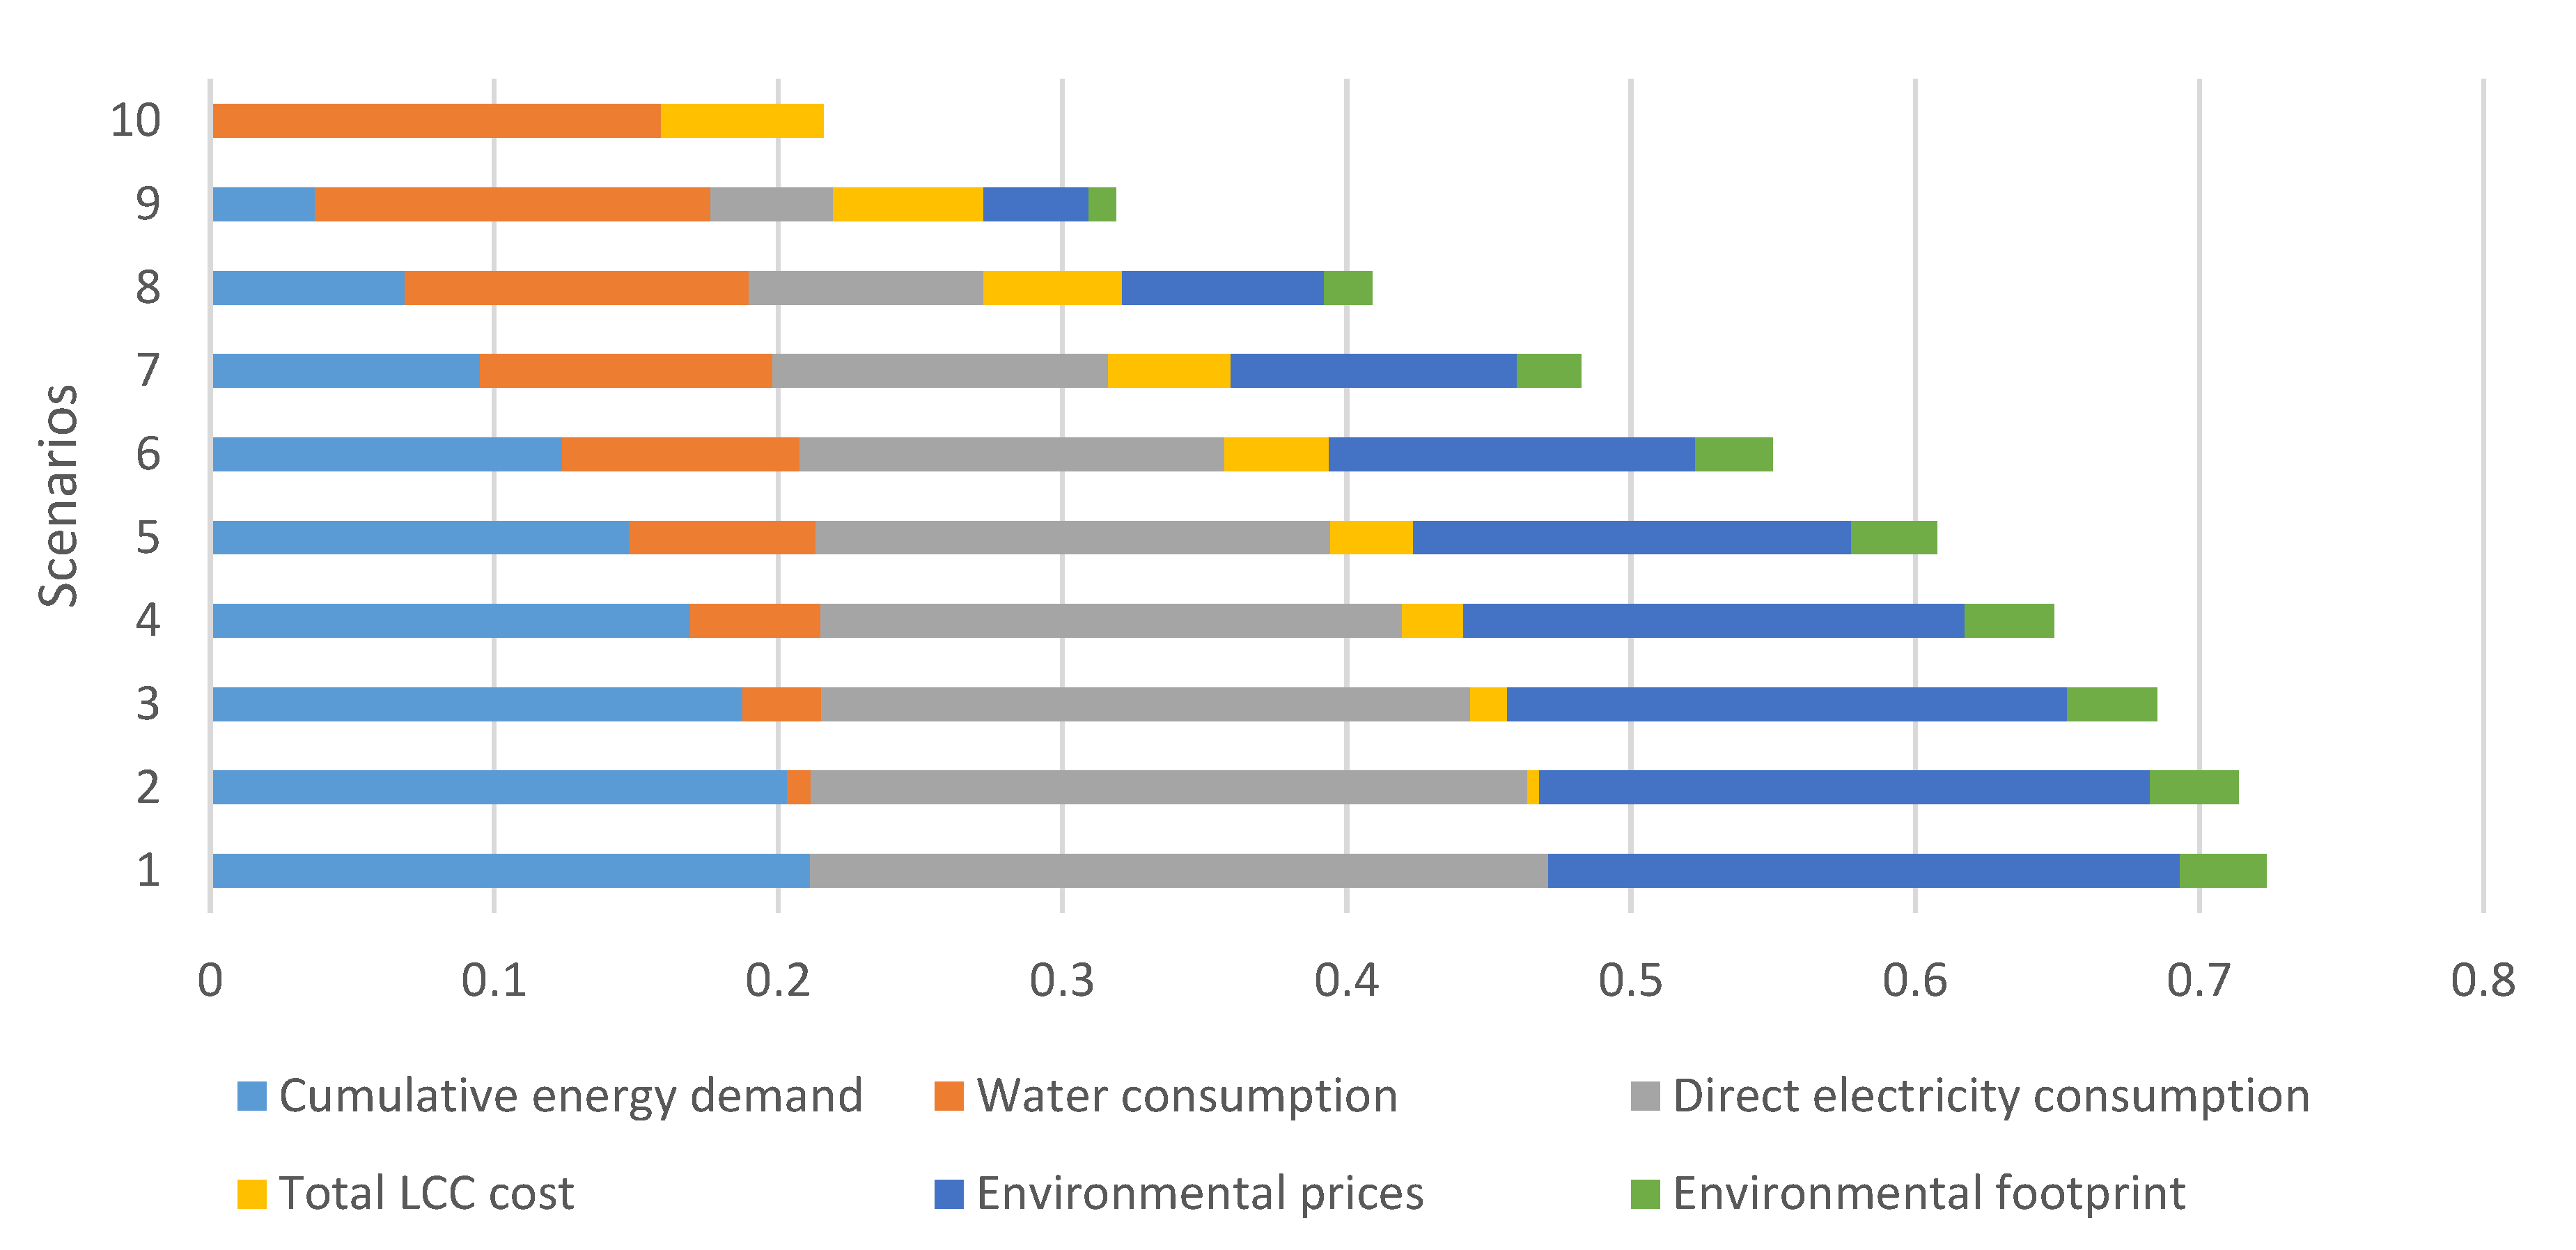
Figure 6 displays the normalized KPI results from the LCA/LCC analysis.
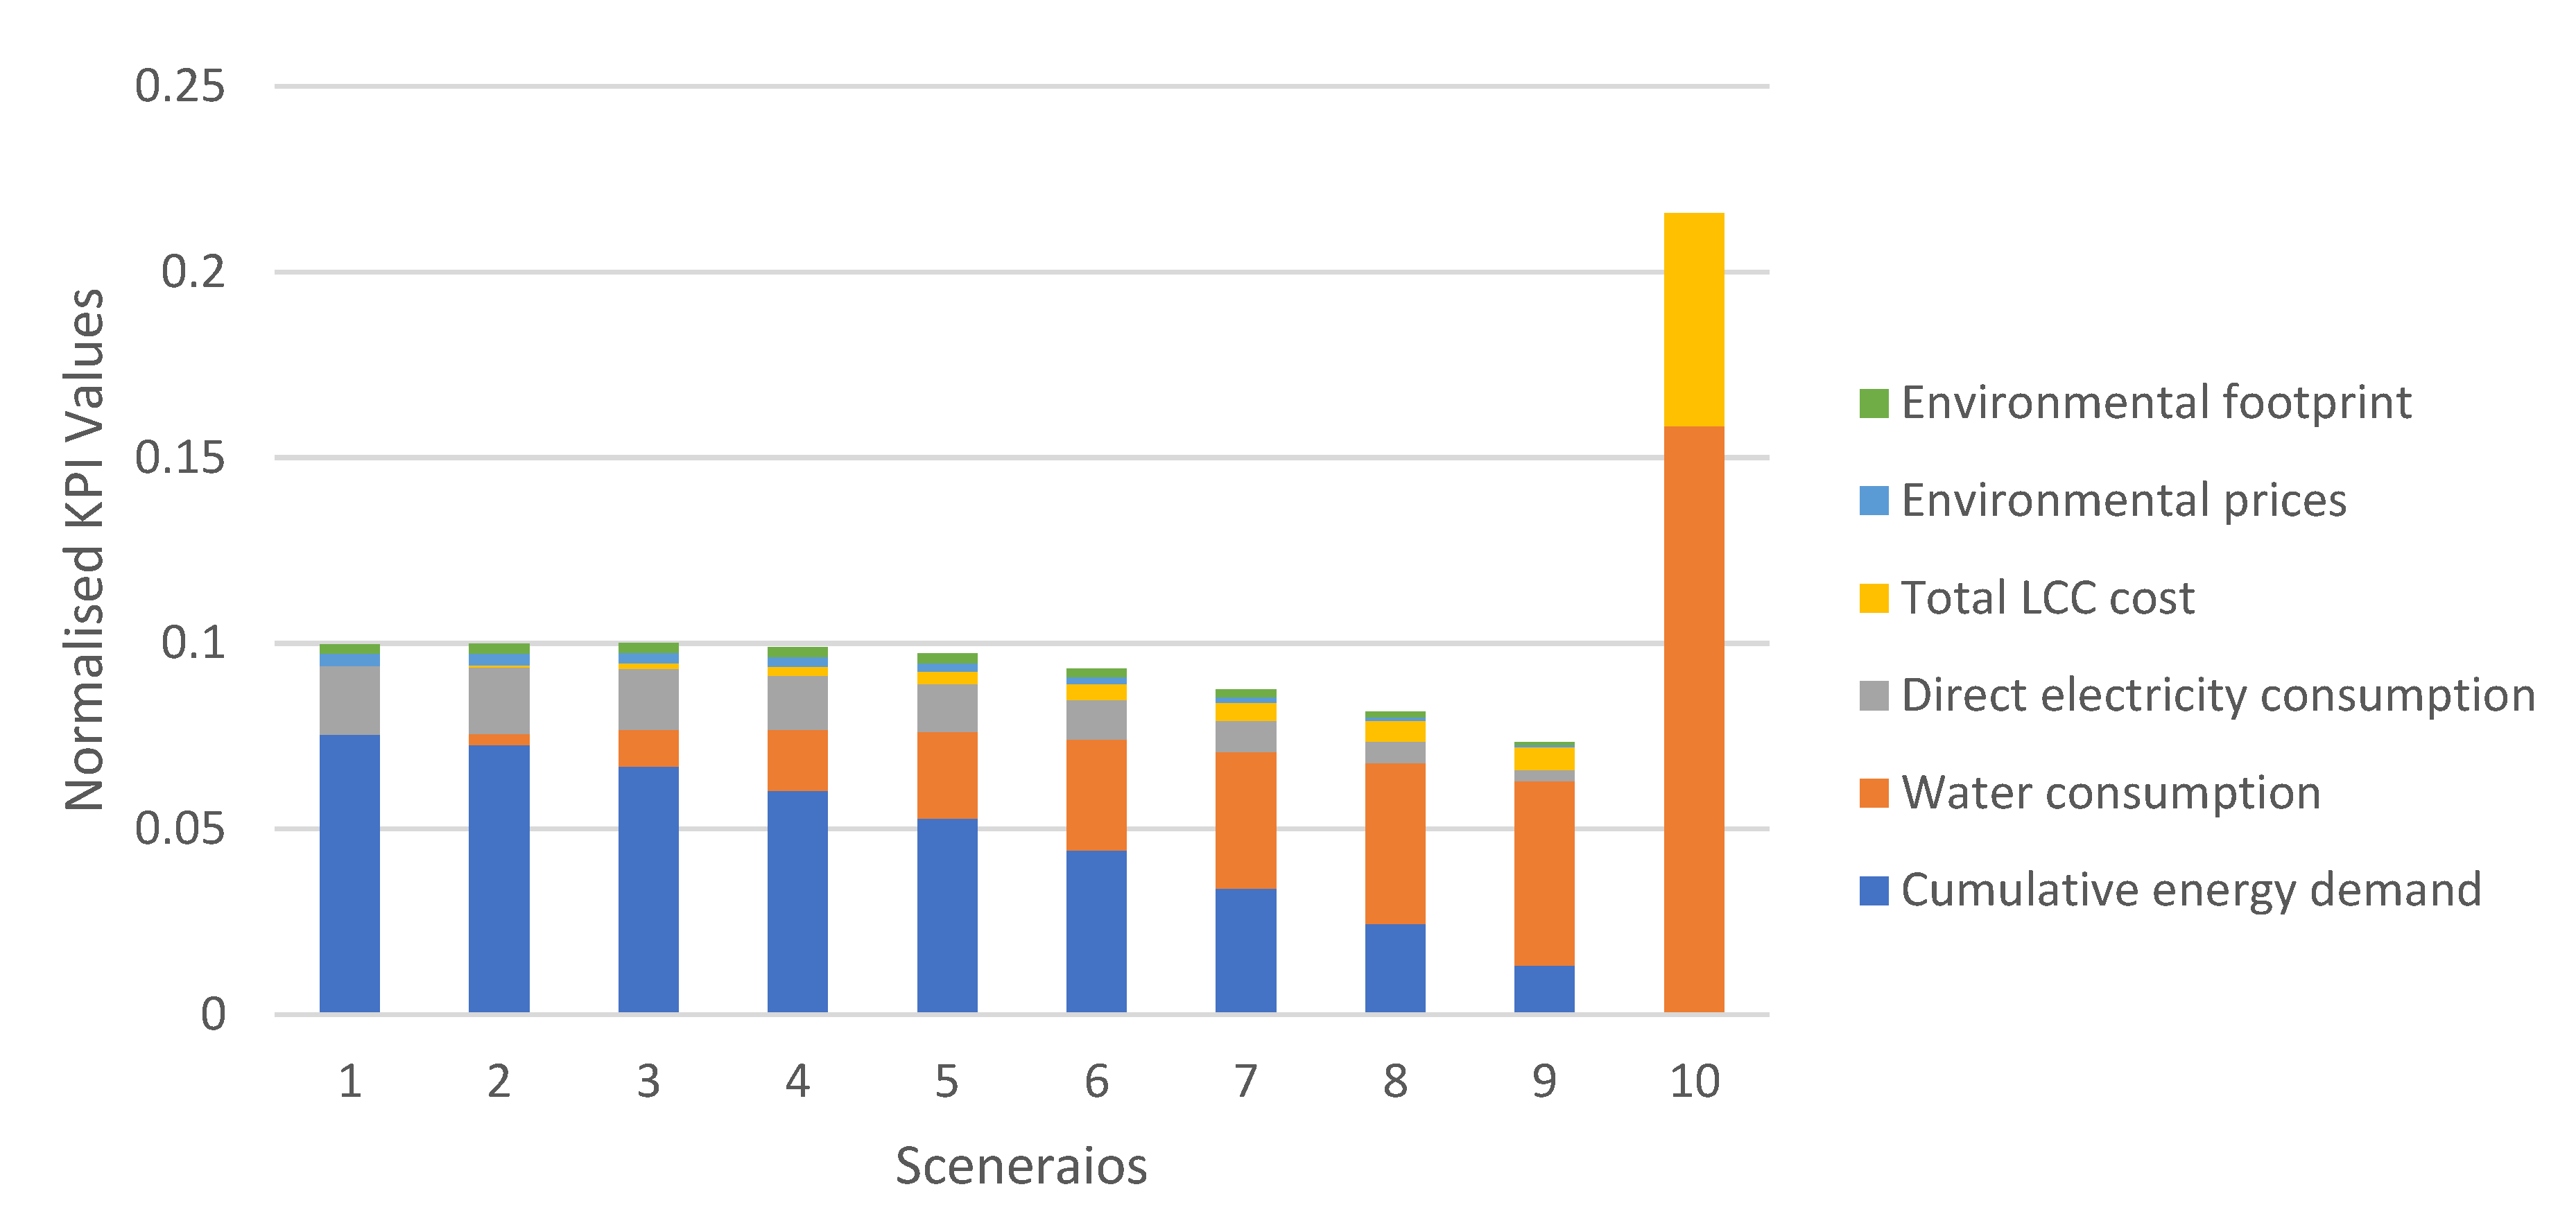
The user preference weights from
Table 7 are applied to the normalized KPI results for each scenario, as shown in
Figure 7.
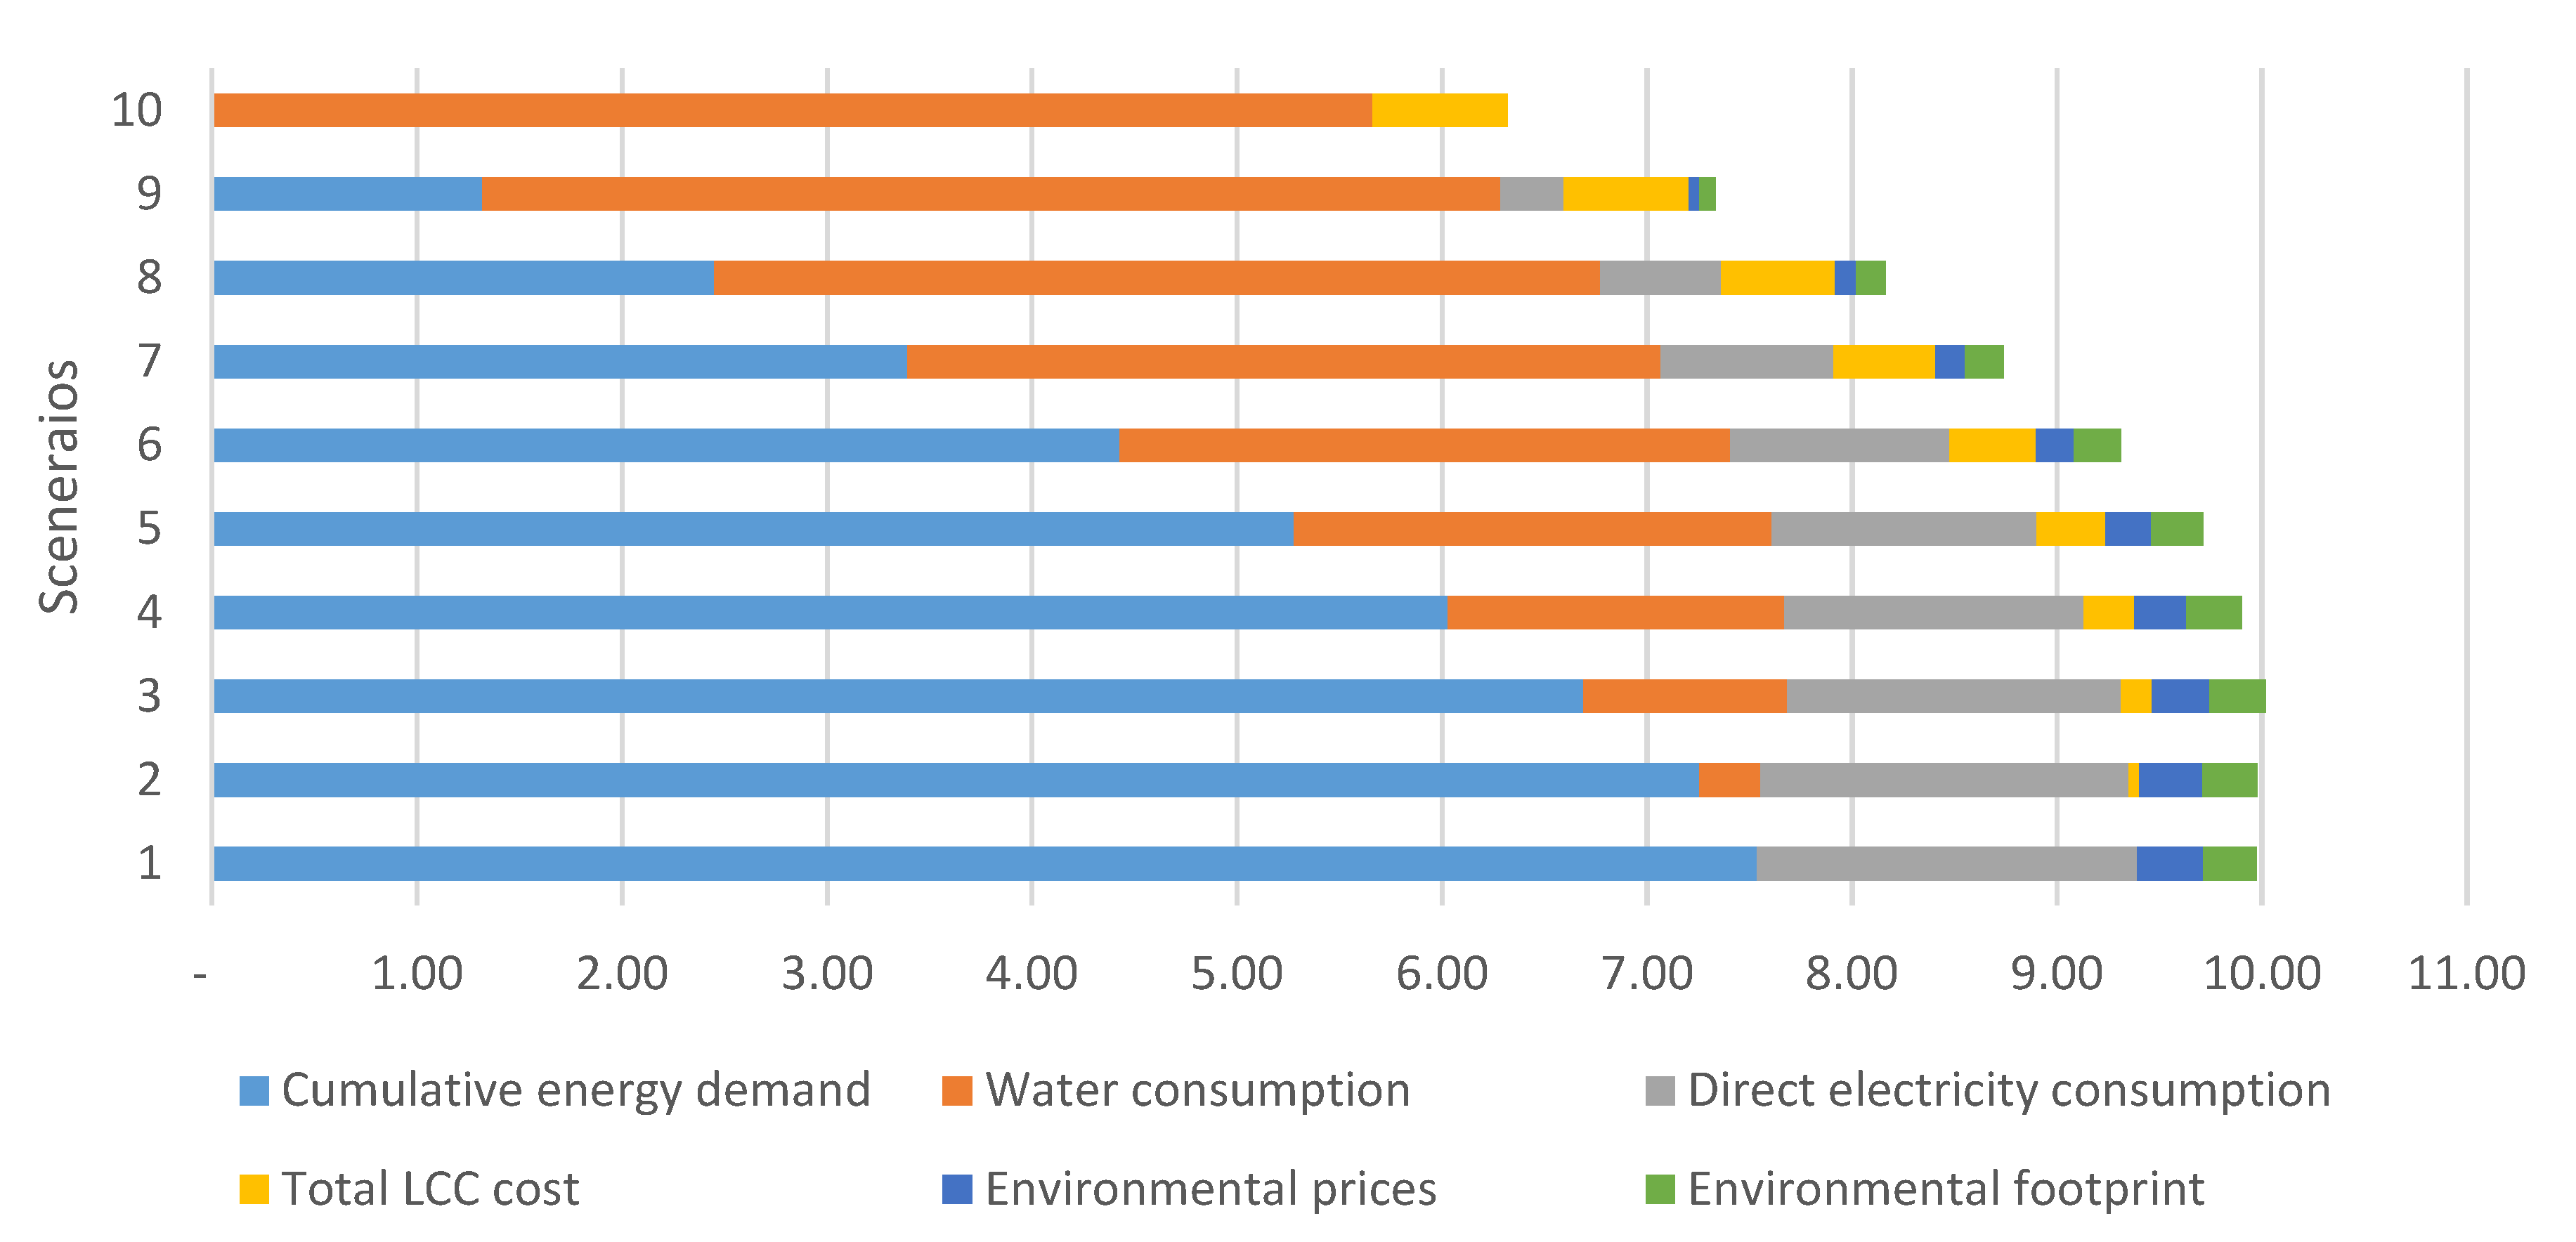
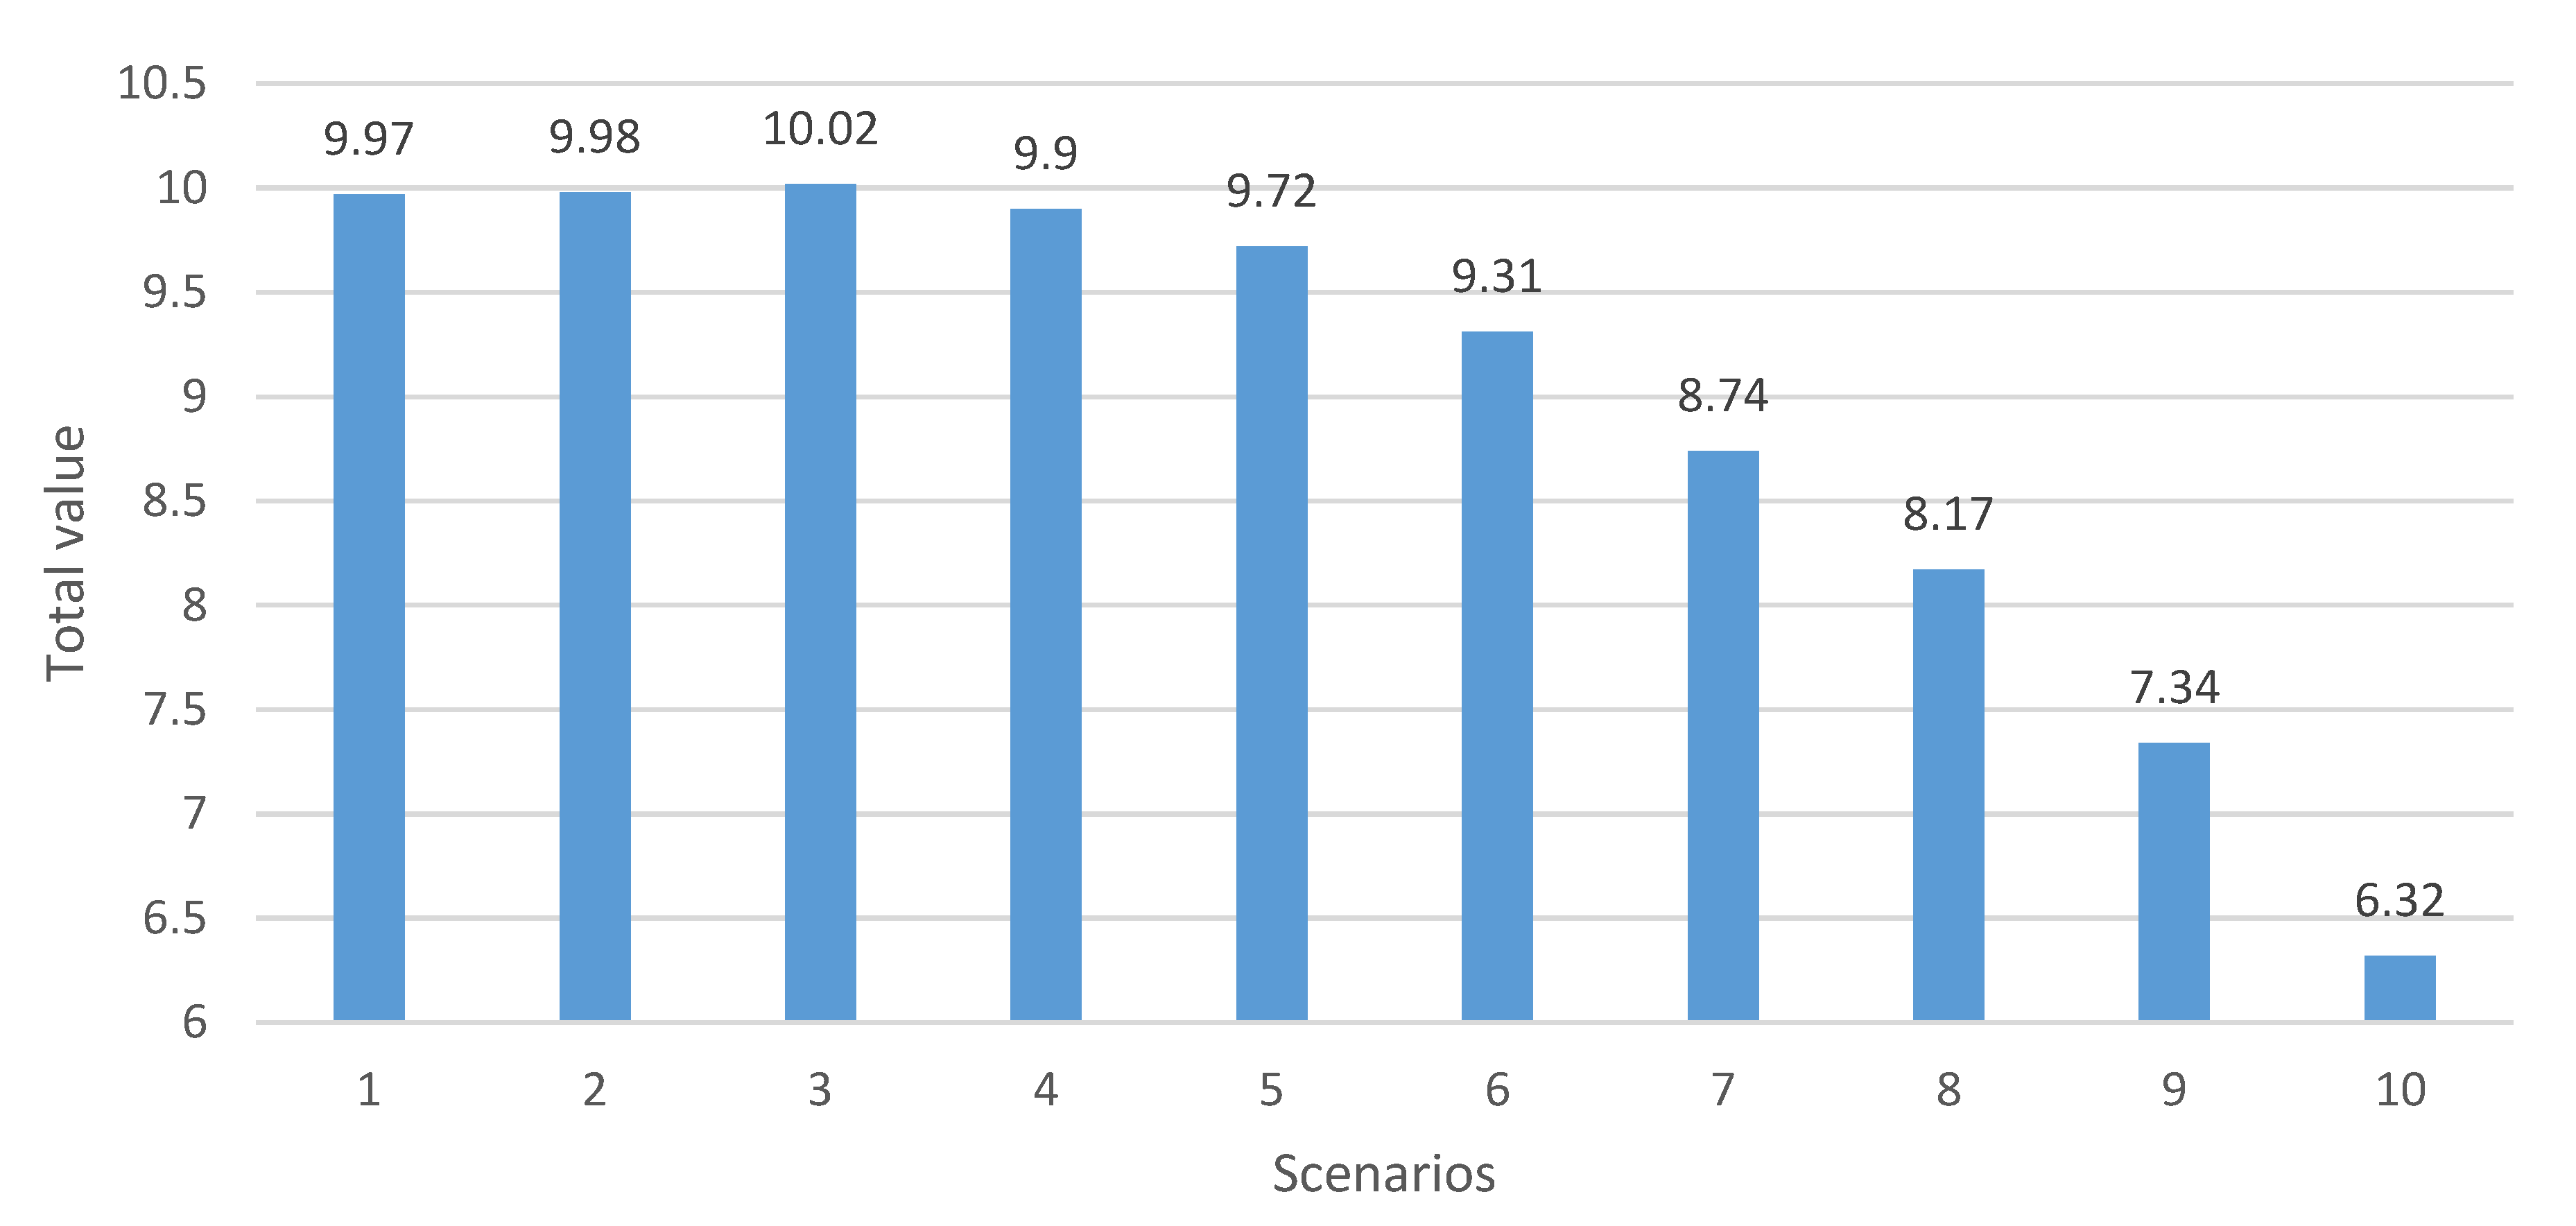
Finally, the total values for each scenario are calculated by summing the weighted normalized values. The scenario with the highest total value is the one that best fits the user’s preferences, as shown in
Figure 8.
As shown in
Figure 8, Scenario 3 fits the user’s preferences best, obtaining the highest score in the ranking. This scenario is characterized by moderately high water consumption but low electricity consumption and cumulative energy demand, which is the KPI with the highest preference.
Key insights are as follows:
Scenario 3 has the lowest environmental footprint (EF3.0 single score) compared to other scenarios.
Scenario 3 also has a high life cycle cost (Total LCC cost) but low environmental prices, indicating a balance between cost and environmental impact.
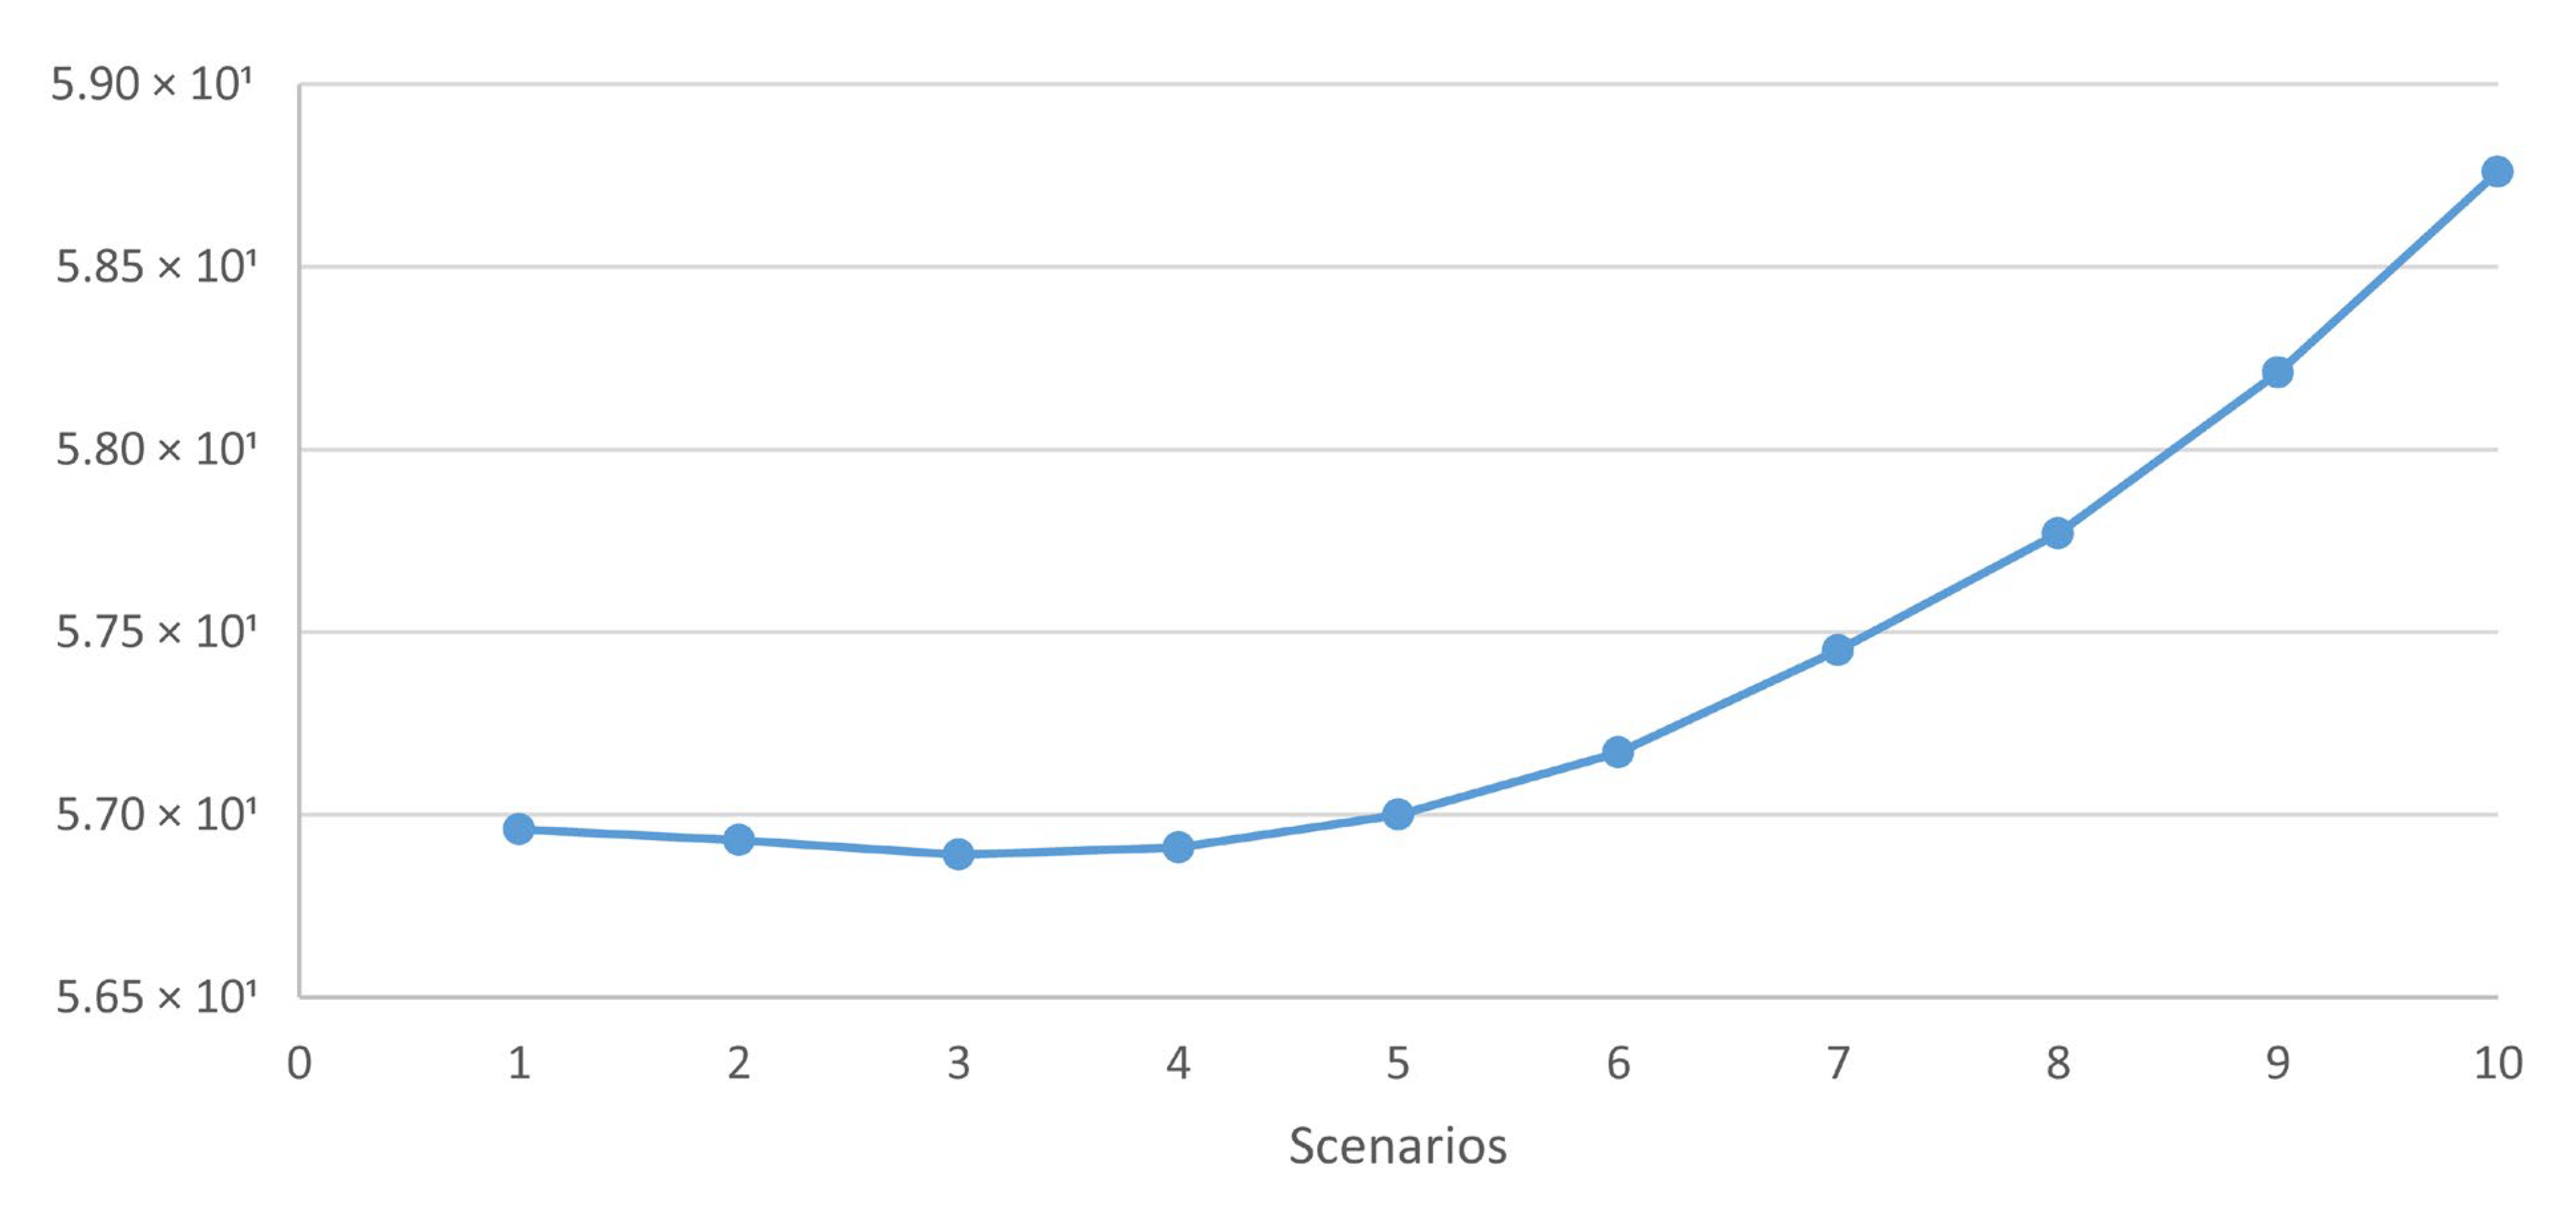
The trend analysis is as follows:
Figure 9 shows the results of the ranking of normalized values by scenario and the evolution of the scenario results, indicating a high score between Scenarios 1 and 5, while the total score decreases from Scenario 6 onwards.
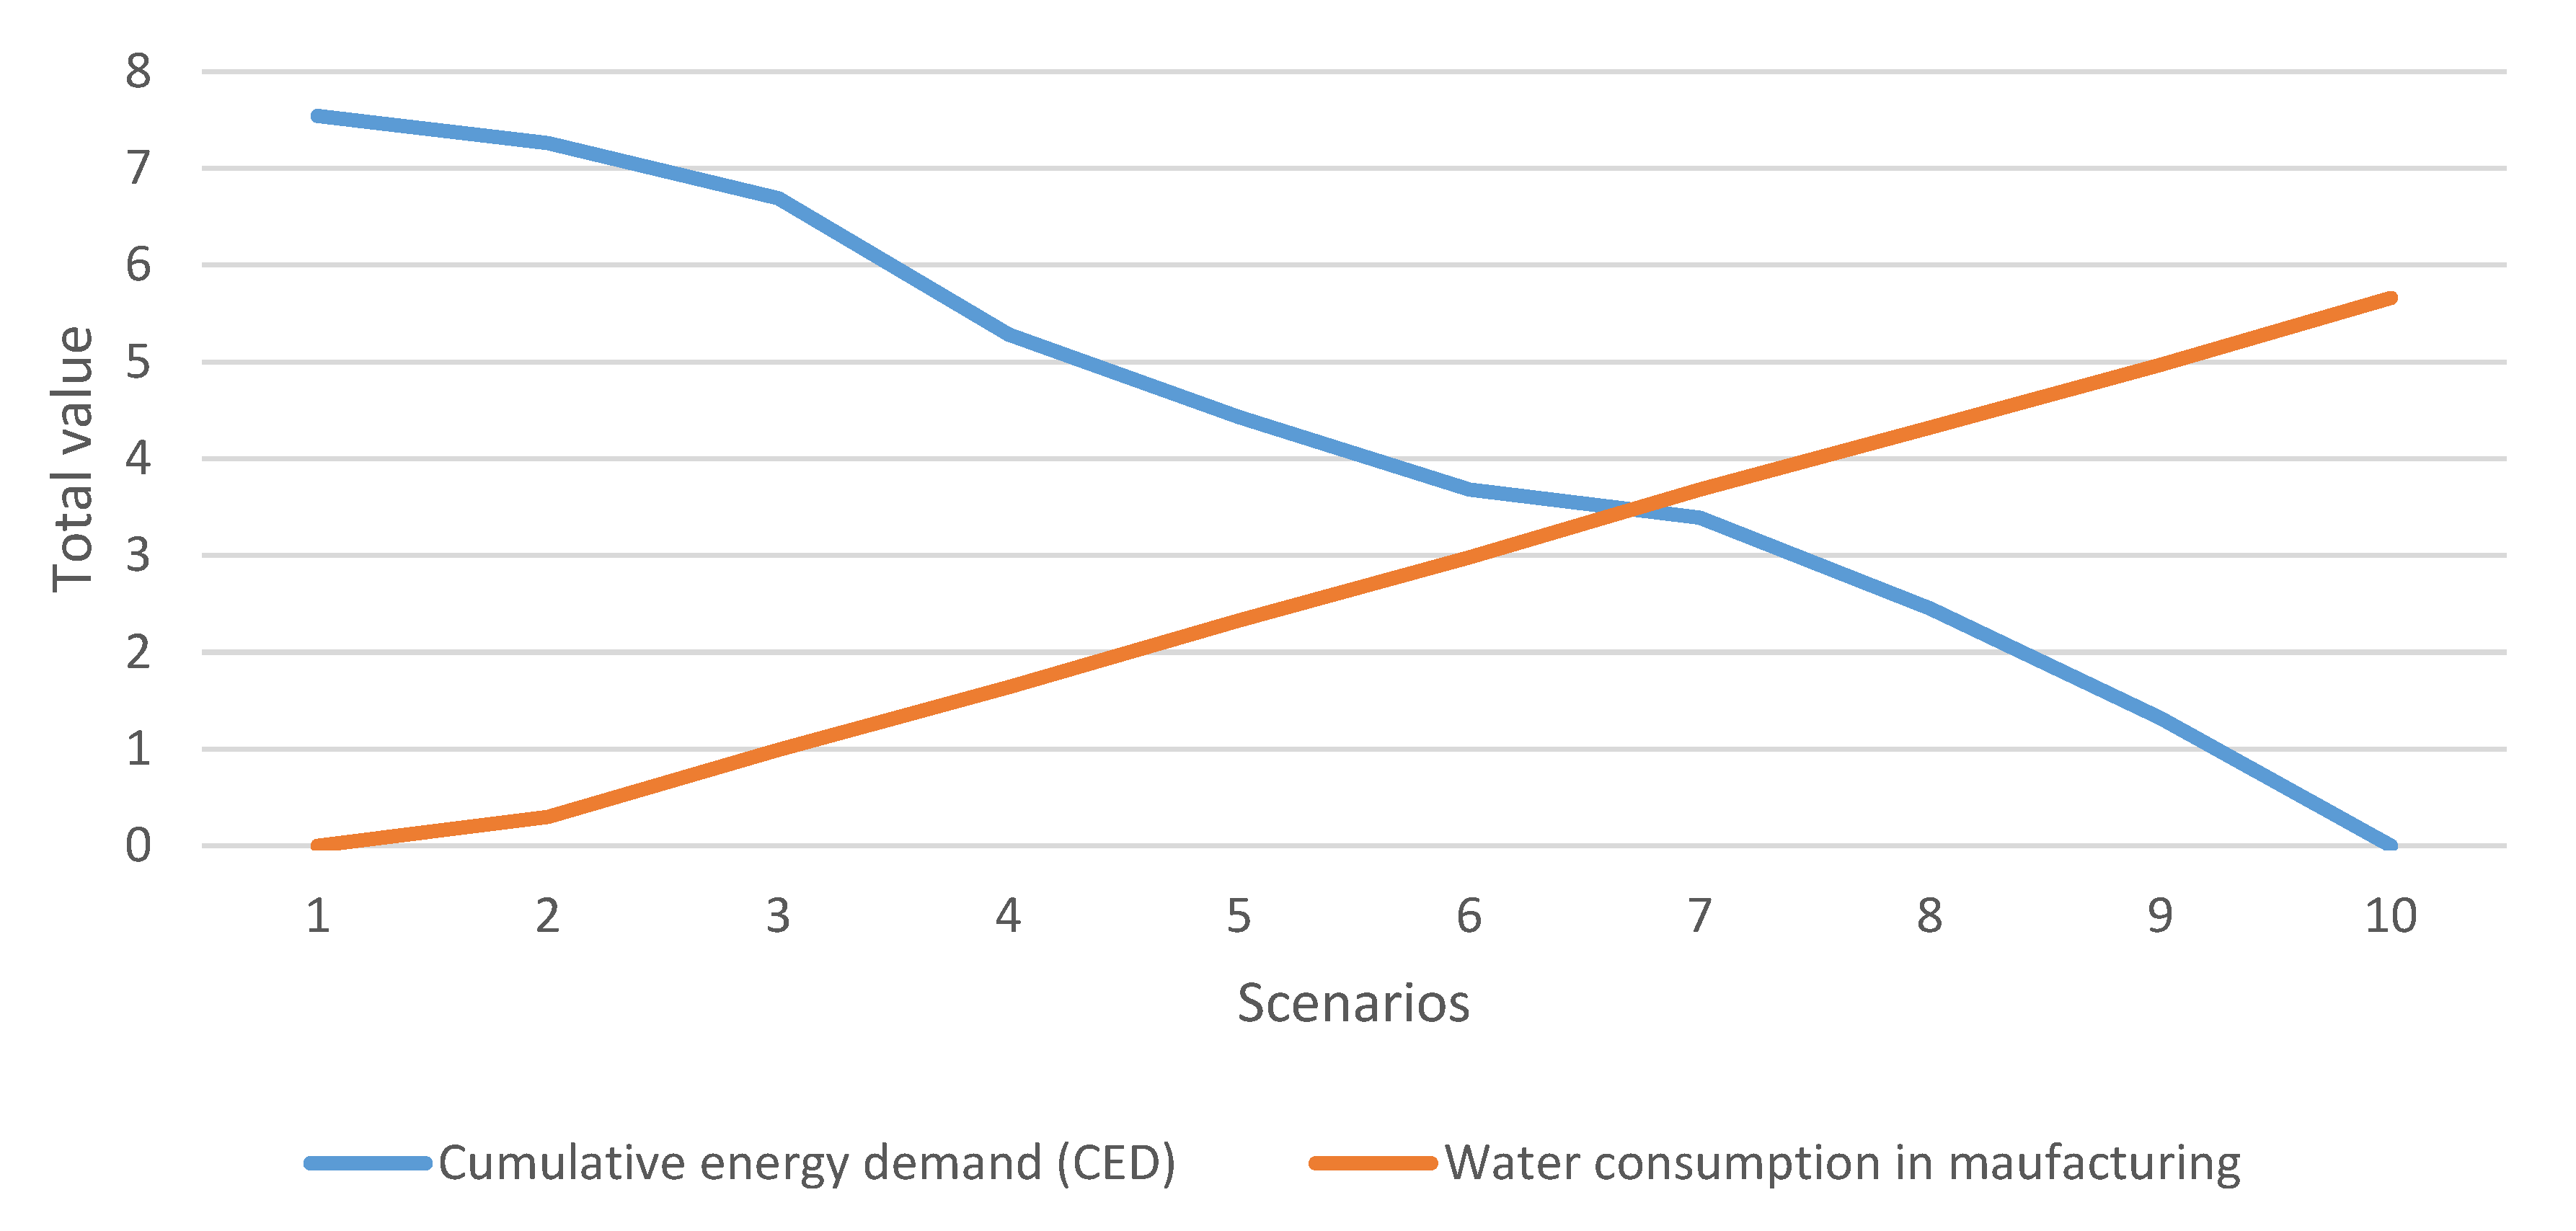
Figure 10 shows the evolution of normalized values of water consumption and cumulative energy demand by scenarios and illustrates the trend of normalized values for water consumption and cumulative energy demand, highlighting their opposite behaviours as the outlet water temperature setpoint increases (higher scenario numbers).
Figure 10.
Evolution of normalized values of water consumption and cumulative energy demand by scenario.
Figure 10.
Evolution of normalized values of water consumption and cumulative energy demand by scenario.
As the outlet water temperature setpoint increases, water consumption decreases, resulting in higher associated Environmental Characterization Factors (EcF) values. Simultaneously, the wort cooling performed in the first heat exchanger decreases, requiring the second heat exchanger to provide more cooling, leading to higher electricity consumption and lower CED values.
The operational conditions are as follows:
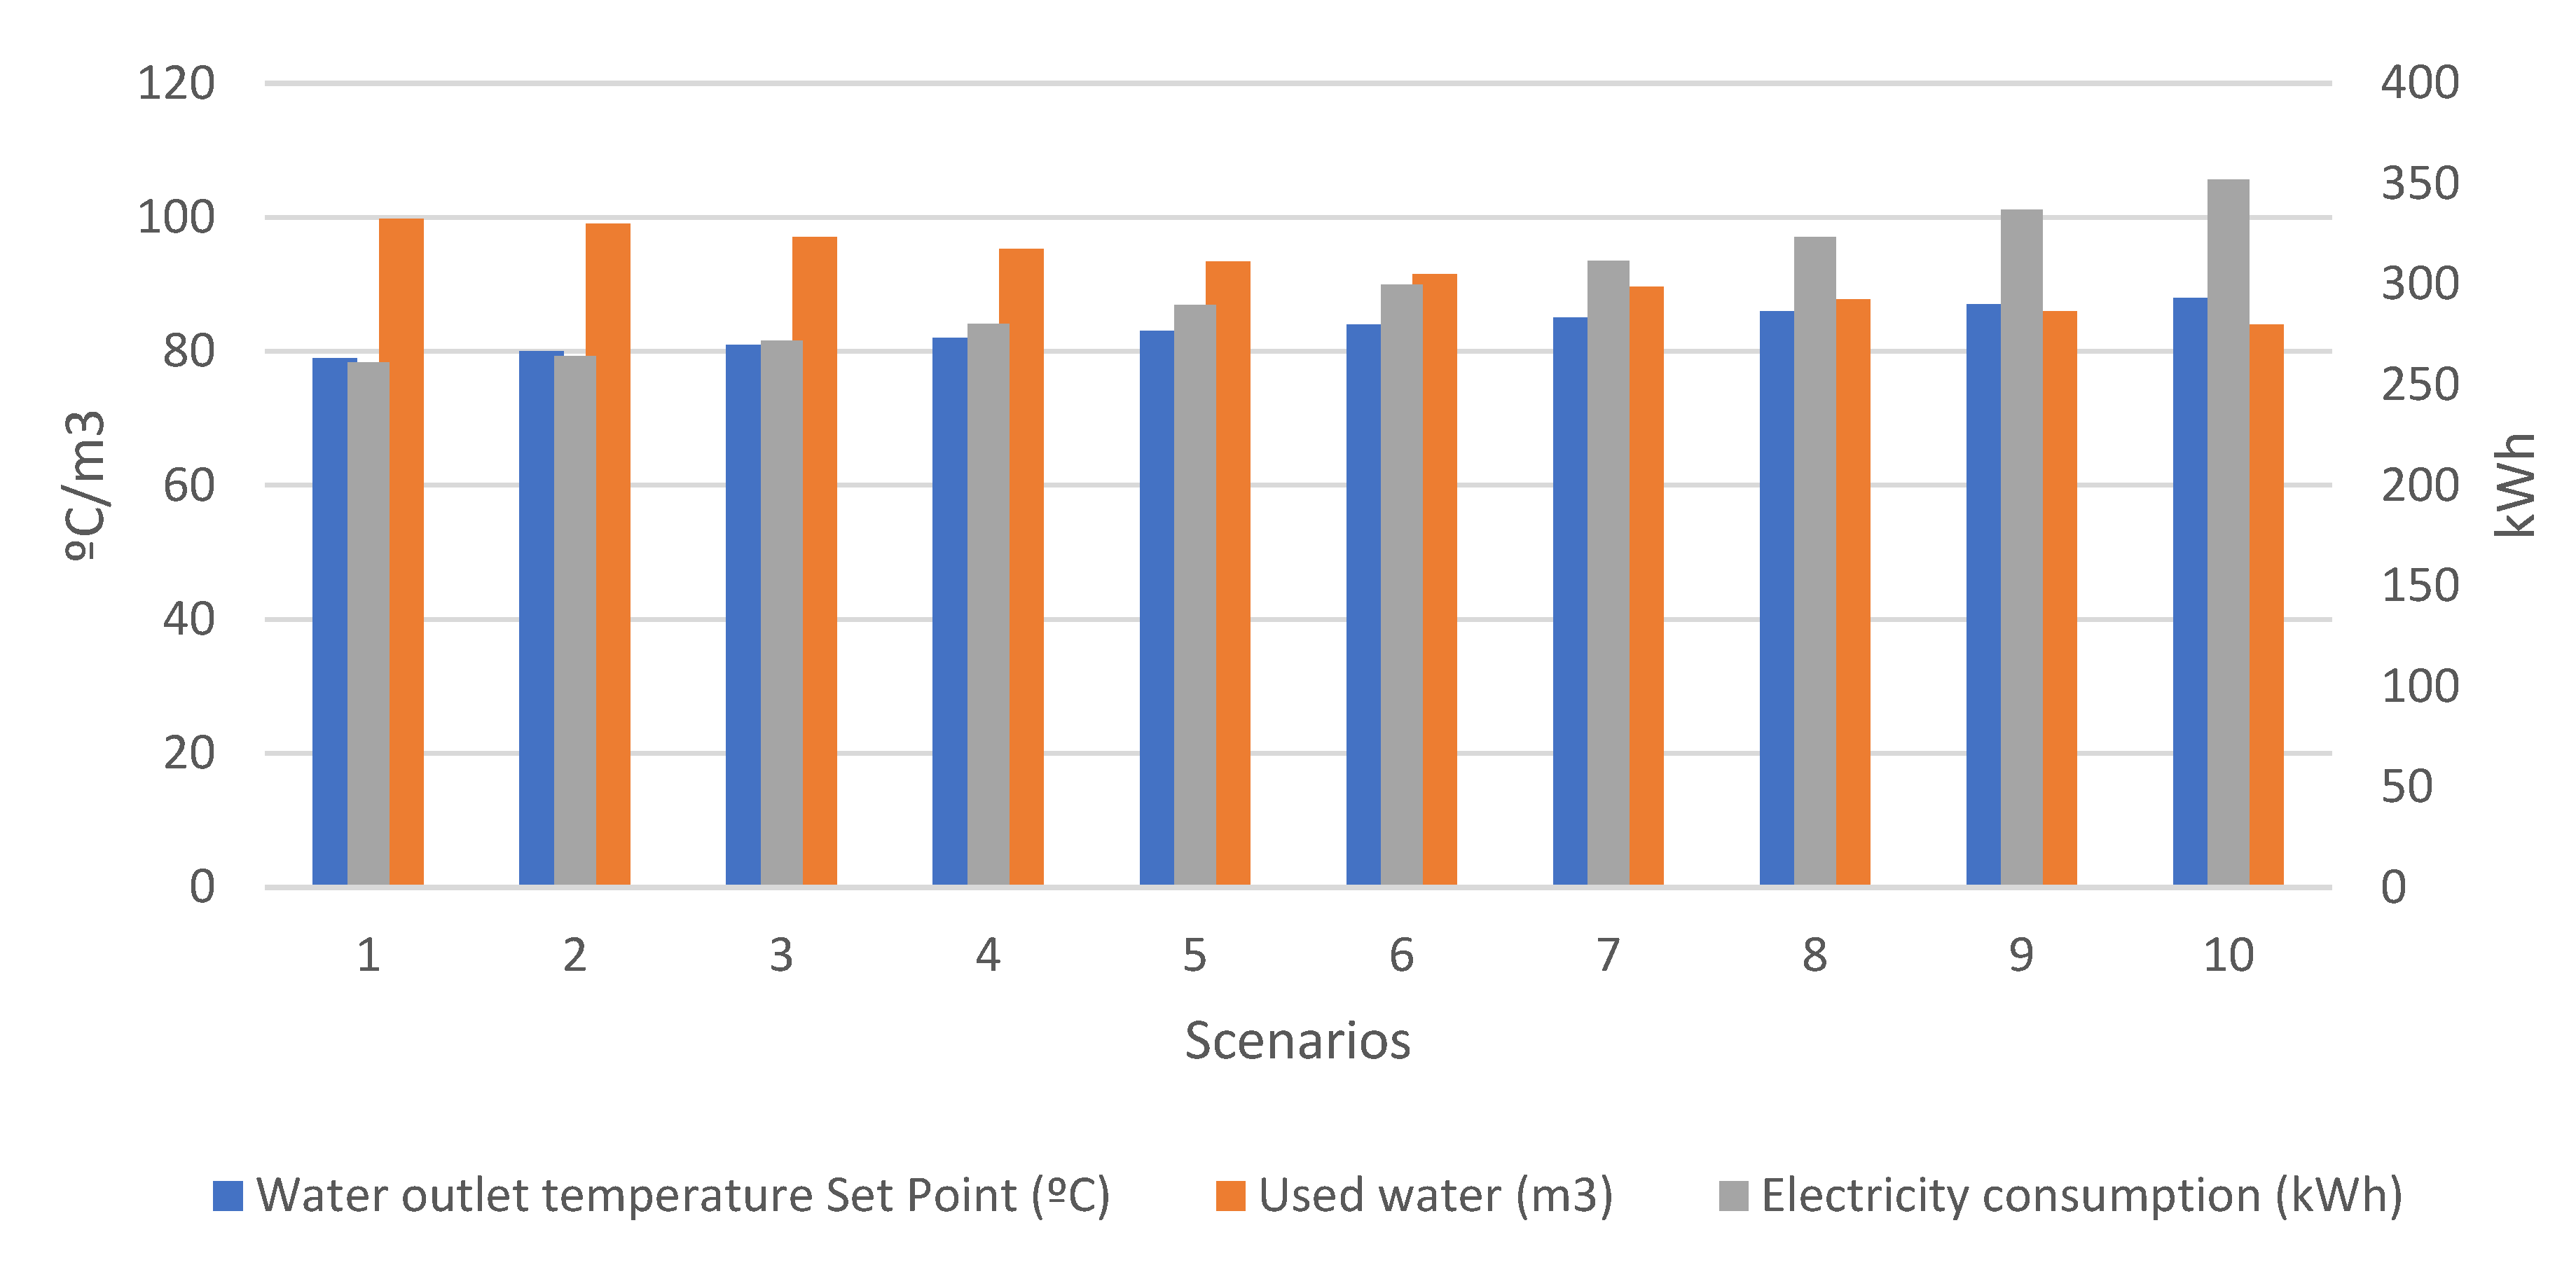
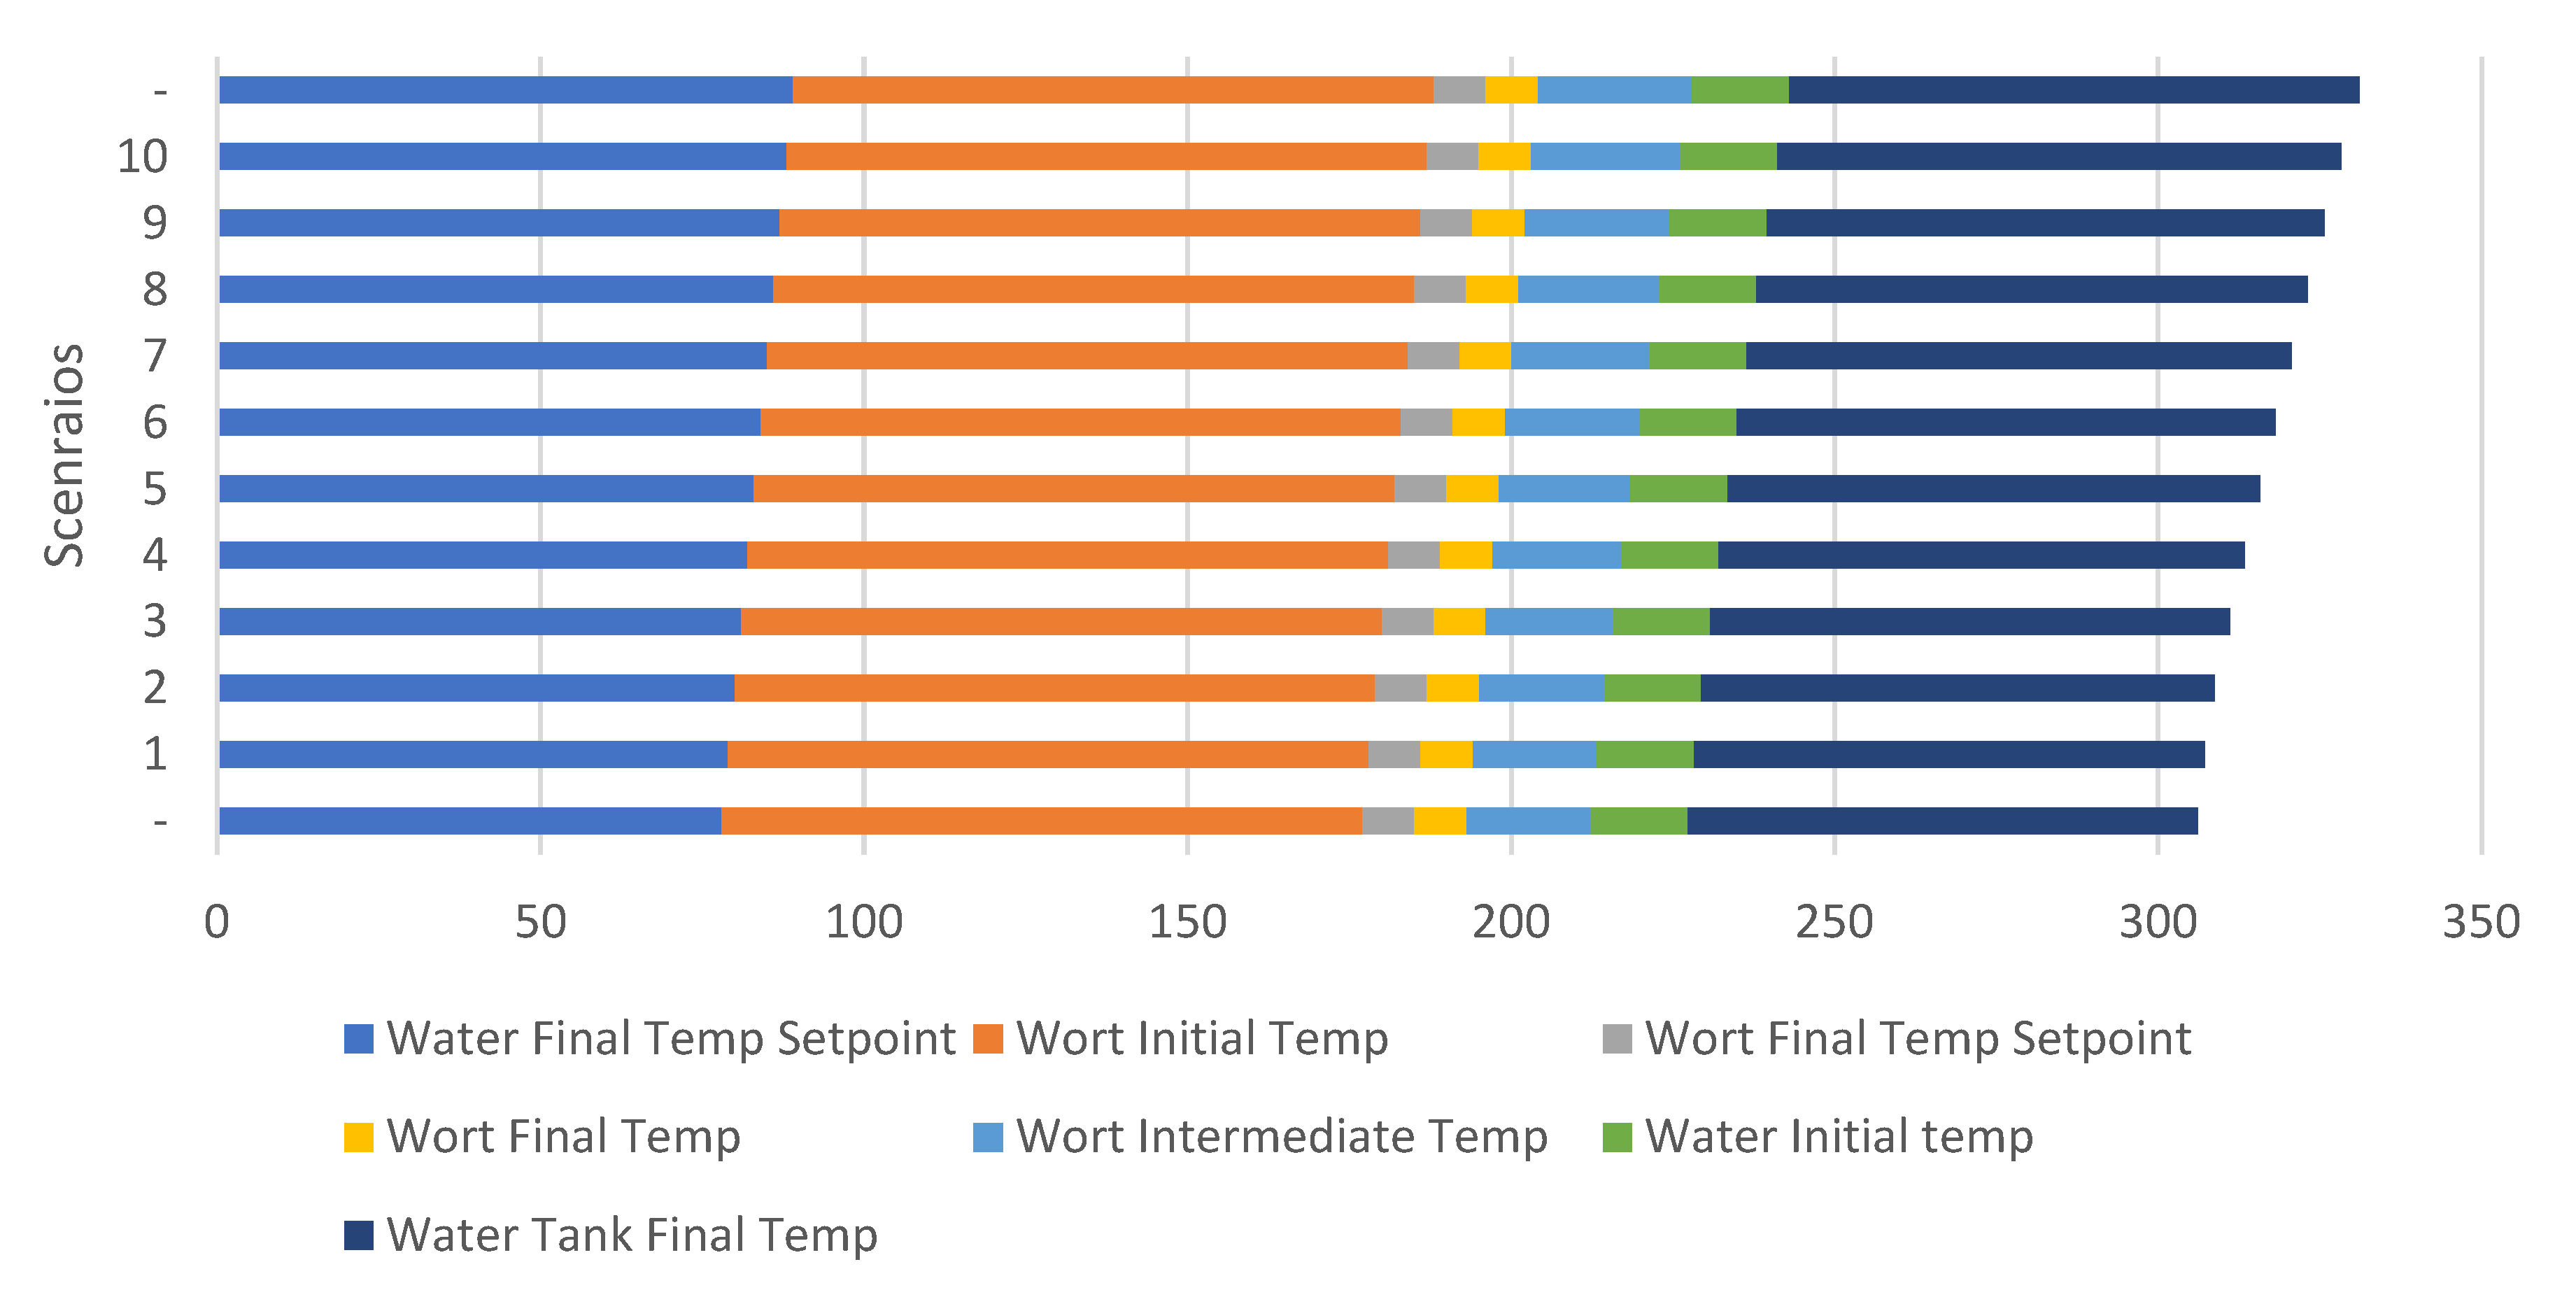
Figure 11 presents the temperature values obtained from the optimization module, showing the relationship between operational conditions and environmental indicators. The inlet temperature values and selected setpoints affect the intermediate and final temperature values of the wort, which in turn impact water and energy consumption, ultimately determining the environmental indicators.
The analysis confirms that Scenario 3 is the optimal scenario based on the user’s preferences, balancing low cumulative energy demand and electricity consumption with moderate water consumption and a low environmental footprint. This scenario demonstrates the importance of considering multiple KPIs and their interdependencies to achieve the best overall performance in the brewing process.
4.4. Sensitivity Analysis of Input Parameters
In order to evaluate the resilience of the assessment framework and to better understand how external shifts might influence decision-making, a sensitivity analysis was carried out on vital technical, economic, and environmental variables within the brewery’s production system. These variables either directly inform the multi-criteria decision-making process via the AHP or serve as the foundation for key performance indicators (KPIs) within the broader evaluation.
The analysis considered four main scenarios:
Scenarios 1 and 2—These scenarios applied 5% and 10% reductions in electricity, gas, and water consumption, drawing on production data from the years 2020 and 2019, respectively. Results indicated that environmental indicators, such as climate change, cumulative energy demand, and water use, were reduced by up to 10% in 2020 and up to 20% in 2019. This demonstrates a proportional relationship between resource efficiency and environmental performance. However, it is important to note that the absolute reduction in impact was relatively limited for 2020, largely due to diminished production volumes during the pandemic.
Scenario 3—This scenario investigated changes in secondary environmental parameters, including the use of increased recycled content in bottles and cans, as well as modifications to the electricity mix. A 10% increase in recycled content led to a 6.8% reduction in greenhouse gas emissions, while an updated emissions factor, reflecting a higher share of renewables in the energy grid as of 2021, resulted in a reduction of up to 59% in GHG emissions compared to the original baseline.
Scenario 4—This scenario examined economic outcomes under various conditions, including reductions in resource consumption, lower maintenance costs, and ±20% fluctuations in energy and water prices. These changes resulted in life cycle cost (LCC) variations of up to ±15%, highlighting the heightened sensitivity of economic indicators to market volatility, especially energy pricing.
Collectively, these scenarios illustrate that, even when realistic changes in operational or external conditions are introduced, certain alternatives, most notably those in Scenario 3, demonstrate consistent environmental and economic advantages. This provides further confidence in the robustness of the evaluation framework.
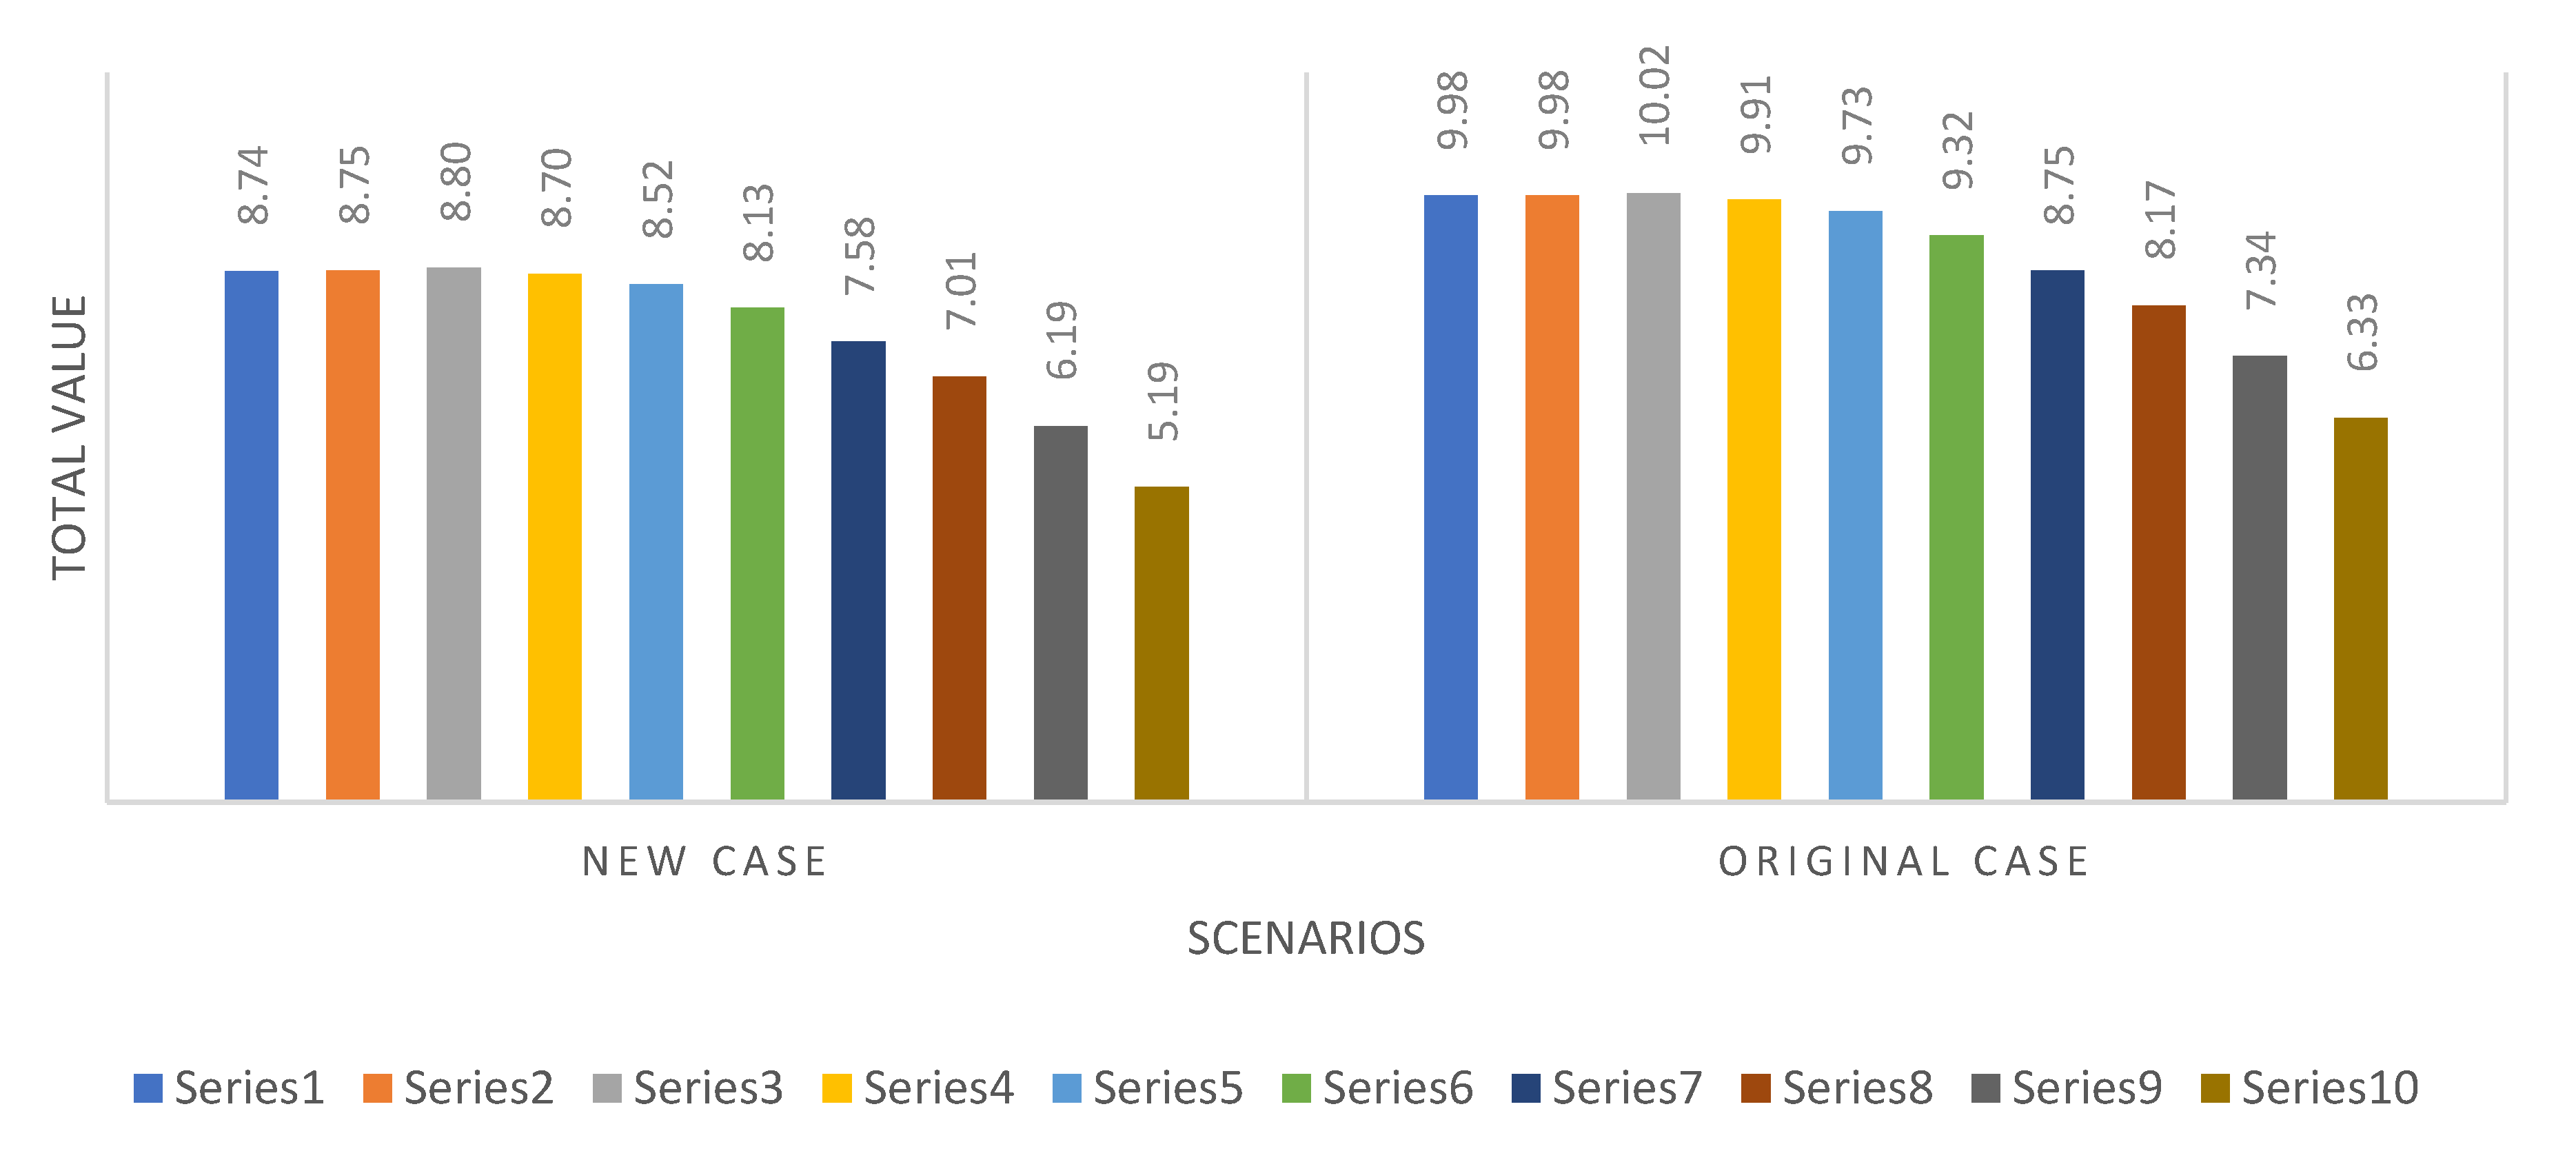
To more rigorously test the stability of the decision-making outcomes, a focused sensitivity analysis was performed on the AHP weight distribution. In this case, the weighting of the environmental criterion was increased from 8.52% to 25%, while the technical and economic criteria were proportionally adjusted to 64.48% and 10.52%, respectively. The revised ranking confirmed that Scenario 3 remained the top alternative, demonstrating that the decision outcome is robust even under significant shifts in expert judgment.
A comparison between the original and adjusted rankings (see
Figure 12) indicates that Scenario 3 consistently maintains its leading position and that the overall structure of preferences exhibits only minimal changes. This further reinforces confidence in the reliability and validity of the chosen multi-criteria decision-making approach.
While not exhaustive, this combined analysis of input variability and criteria weight shifts offers a solid foundation for the trustworthiness of the conclusions. A full probabilistic or multi-point sensitivity analysis of the AHP structure remains a relevant opportunity for future work.
5. Discussion
This study reaffirms the practical value of the AHP as a robust decision-making framework, particularly in contexts aligned with circular economy principles. While the immediate focus was on optimizing must cooling in the brewing sector, the AHP’s broader applicability is evident. The methodology offers a systematic means of evaluating complex criteria—think material selection, waste reduction, and energy efficiency—making it highly relevant for sustainability assessments that must balance environmental objectives with economic realities.
The AHP’s utility is not confined to day-to-day operations, either. It is increasingly relevant at the strategic level, supporting decisions in supply chain management, prioritizing circular investments, and conducting resource risk assessments. Its ability to synthesize multidimensional indicators enables balanced, transparent evaluations, which are essential for tackling typical CE challenges like resource optimization, circular product design, and emissions reductions.
Nevertheless, the method is not without its drawbacks. The AHP relies heavily on subjective pairwise comparisons, and even with consistency checks, bias can creep in. This becomes particularly problematic when different stakeholders have diverging priorities, as is often the case in public policy contexts. In this study, the narrow margin between top-ranked scenarios underscores a common limitation: when alternatives score similarly, identifying a clear “best” option becomes challenging. Such ambiguity can impede decisive action, especially in scenarios involving significant investment or strategic transformation. It may thus be prudent to integrate the AHP with complementary approaches or to involve a broader range of stakeholders to enhance decision robustness and credibility.
The sector-specific nature of AHP applications also places limits on the generalizability of findings. While this research focused on brewing, the method has demonstrated adaptability in fields as diverse as textiles, automotive, and furniture manufacturing. Yet, each sector brings its own operational complexities, resource flows, and strategic priorities. Industries such as pulp and paper, chemicals, or food processing could benefit from the AHP, but would inevitably require tailored adaptations. Comparative, multi-case research designs are needed to explore how the AHP can be customized across diverse industrial landscapes while maintaining methodological rigor.
Addressing these limitations calls for methodological integration. Tools like PROMETHEE, fuzzy logic, and Delphi techniques can improve the management of uncertainty and better capture a range of stakeholder preferences. The advancement of artificial intelligence presents further opportunities: machine learning could automate weighting using historical data, and natural language processing might allow qualitative insights—from interviews or stakeholder discussions—to be systematically included in the model.
Looking ahead, such methodological innovations will be central to making the AHP more dynamic and responsive. For example, real-time updates to weights and rankings could reflect shifting market conditions or evolving stakeholder perspectives. To address this limitation, the incorporation of comparative case studies from diverse industrial contexts could significantly improve the external validity and relevance of the findings. While the present research focuses on the brewing sector, recent applications of the AHP and its variants in other manufacturing industries reinforce the method’s adaptability. For instance, in the textile industry, an AHP-based model was used to evaluate sustainability performance across economic, environmental, social, and technical dimensions, revealing nuanced trade-offs in resource-intensive operations [
35]. In the tire industry, an integrated approach combining the AHP, Delphi, and value stream mapping was applied to assess workstation-level sustainability, showing how operational complexity and human factors can be embedded into decision-making [
36]. Similarly, in the automotive sector, a structured AHP framework was implemented to balance quality, cost, and emissions, illustrating how sectoral priorities shape criteria weights [
37]. These findings are echoed in the wooden furniture industry, where sustainable performance was assessed using lean-based AHP tools and yielded insights applicable to SMEs and low-tech environments [
38]. There is also potential for the AHP to inform complex, large-scale initiatives, such as regional or national CE policies, that require the integration of social, economic, political, and environmental considerations.
In summary, the AHP remains a strong and flexible foundation for advancing circular economy strategies. However, to unlock its full potential, ongoing methodological innovation, sector-specific adaptation, and interdisciplinary integration are essential. These steps will not only address current limitations but also enhance the relevance and effectiveness of the AHP as a tool for sustainability-oriented decision-making.
6. Conclusions
The application of the Analytic Hierarchy Process (AHP) in this brewery case demonstrates its notable value as a structured decision-support tool, particularly for optimizing complex industrial operations within the framework of circular economy principles. In this study, ten different cooling configurations were rigorously evaluated. The AHP provided a systematic means to balance technical, economic, and environmental considerations. Scenario 3 repeatedly emerged as the most favourable alternative, effectively achieving a compromise between energy consumption, electricity usage, water demand, and overall environmental impact.
Yet, it is important to acknowledge a significant limitation identified in the analysis: several scenarios yielded results that were very closely ranked, making it challenging to clearly distinguish a single optimal option. This underscores a well-known weakness of the classical AHP: its limited discriminative capacity in cases where alternatives are only marginally different. In such situations, alternative approaches such as the fuzzy AHP, Analytic Network Process (ANP), or hybrid methodologies that combine the AHP with other multi-criteria decision-making (MCDM) techniques may provide greater sensitivity and support for decision-making.
While the AHP remains a robust and valuable instrument for addressing complex challenges associated with the circular economy, its effectiveness could be further enhanced by integration with emerging methods. Future research should consider combining the AHP with artificial intelligence, fuzzy logic, or dynamic weighting schemes to improve adaptability and precision in increasingly complex decision environments.


