Article

Evaluation of the Coupling Coordination Degree Between PM2.5 and Urbanization Level: A Case in Guangdong Province

1
School of Geography and Remote Sensing, Guangzhou University, Guangzhou 510006, China
2
Institute of Aerospace Remote Sensing Innovations, Guangzhou University, Guangzhou 510006, China
3
Department of Biological, Geological, and Environmental Sciences, 33-40126, Via S. Alberto 163, 48123 Ravenna, Italy
*
Authors to whom correspondence should be addressed.
Sustainability 2025, 17(15), 6751; https://doi.org/10.3390/su17156751
Submission received: 25 June 2025 / Revised: 15 July 2025 / Accepted: 22 July 2025 / Published: 24 July 2025

Abstract

PM2.5 (particulate matter with an aerodynamic diameter ≤ 2.5 µm) pollution is one of the most common problems triggered by the acceleration of urbanization. The coordinated development of cities and the environment has been a topic of significant interest in recent years. Based on the spatiotemporal relationship between the evolution of urbanization levels and PM2.5 concentrations, and starting from multiple factors characterizing urbanization, this study constructs a coupling coordination degree model between PM2.5 and urbanization levels to explore the interaction and degree of coordination between urbanization and PM2.5 in Guangdong Province from 2000 to 2021. The research reveals that the conflict between the urbanization process and PM2.5 pollution in various cities of Guangdong Province is gradually easing. The year 2011 was a turning point as the PM2.5 pollution levels in cities that were in an uncoordinated phase began to improve. The coupling coordination degree between urbanization and PM2.5 pollution in Guangdong Province exhibits significant spatial heterogeneity. The coupling coordination degree in most coastal cities is higher than that in inland cities. Cities in economically underdeveloped regions also face relatively lower pressure from pollution emissions. These regions are characterized by lagging urbanization, and their coupling coordination degree is slowly increasing as urbanization progresses. In economically developed regions, the coupling coordination degree between urbanization levels and PM2.5 pollution has reached a basic level of coordination, although the specific types vary.

1. Introduction

Since the beginning of the 21st century, China has achieved remarkable progress in urbanization. According to the National Bureau of Statistics, the urbanization rate reached 67% by 2025 [1,2], and the United Nations projects it will rise to 71.2% by 2050 [3]. However, rapid urbanization has also exacerbated environmental challenges, particularly air pollution, with PM2.5 (particulate matter ≤ 2.5 μm in aerodynamic diameter) emerging as a major public and governmental concern. PM2.5 consists of fine inhalable particles primarily generated from fuel combustion and the atmospheric conversion of sulfur and nitrogen oxides [4,5,6]. Intensive economic activities have led to substantial PM2.5 emissions, contributing to frequent haze events in urban areas. PM2.5 can cause a series of serious diseases and is closely related to our physical health [7]. Prolonged exposure to elevated PM2.5 levels is associated with respiratory disorders. To address this issue, China has implemented stringent policies, including the Air Pollution Prevention and Control Action Plan (2013) and the Three-Year Blue Sky Action Plan (2018–2021). These measures have successfully reduced PM2.5 concentrations, with the Ministry of Ecology and Environment (MOE) confirming target attainment in 2018and plan completion in 2021 [8,9]. In 2023, the State Council further reinforced its commitment by issuing the Air Quality Continuous Improvement Action Plan, which prioritizes PM2.5 reduction [10]. Urbanization is a multidimensional process encompassing economic, environmental, and social transformations [11]. As urbanization accelerates, mass rural-to-urban migration, urban expansion, and shifts in industrial structure, energy consumption, and transportation intensify air quality pressures [12,13].
Balancing urban development with environmental sustainability persists as a critical challenge for policymakers. As a key indicator of socioeconomic progress, urbanization profoundly impacts human well-being and ecological sustainability [14,15,16]. Current research thus emphasizes a multidimensional assessment framework that integrates economic growth, policy systems, sociocultural factors, technological progress, and spatiotemporal heterogeneity [17,18]. Recent methodological advancements have significantly enhanced the evaluation of urbanization. Yang et al. (2020) established a comprehensive evaluation system incorporating demographic, spatial, economic, and social dimensions, demonstrating economic urbanization’s dominant contribution [19]. Feng et al. (2025) addressed measurement limitations in traditional urbanization assessments for developing countries by developing an innovative methodology that quantifies urban settlement sizes in China using remote-sensing big data [20]. Subsequent studies have introduced more sophisticated analytical tools, including the MDCE (multicoordination evaluation, which refers to the analysis of the coordinated development of population–land urbanization from multiple dimensions and different perspectives) model for population–land urbanization coordination analysis [21], the VWANUI index for urban land extraction using nighttime light data [22], and various economic-light indices for urbanization assessment [23,24,25,26,27].
These methodological breakthroughs highlight three key research trends: (I) increasing adoption of geospatial technologies, particularly nighttime light data applications, (II) development of composite indices for multidimensional evaluation, and (III) enhanced analytical frameworks for urbanization process dynamics. Such advancements provide robust technical support for both theoretical research and practical applications in urbanization studies. The rapid urbanization process has brought increasing attention to its intricate relationship with air pollution [28,29]. Key urbanization-driven factors, including energy consumption patterns and industrial adjustment, have been identified as major contributors to deteriorating air quality [30,31,32].
Urban expansion has led to surging energy demands, particularly fossil fuel consumption, resulting in substantial emissions of atmospheric pollutants. Concurrently, the structural transition from agricultural to industrial and service-based economies has intensified emissions of industrial exhaust containing particulate matter (PM2.5), sulfur dioxide, and nitrogen oxides, significantly exacerbating air pollution levels [33,34,35]. Empirical studies by Fu et al. (2020) have demonstrated that urban population size, per capita GDP, industrial sector proportion, and fossil fuel combustion constitute primary determinants of PM2.5 concentration variations [30,36,37,38,39]. As the most economically advanced and rapidly urbanizing region in China, Guangdong Province presents a particularly compelling case for examining urbanization–air pollution dynamics [40]. The province’s dense urban agglomerations and intensive industrial/transportation activities create conditions conducive to severe air pollution challenges [41].
Against this backdrop, there is an urgent need to assess the coordination between economic development and environmental quality within the framework of ecological civilization. This study addresses this need by developing a coupled coordination degree model that examines the spatiotemporal relationship between multidimensional urbanization indicators and PM2.5 concentrations. Our investigation focuses on Guangdong Province, where we systematically analyze: the interaction mechanisms between urbanization processes and PM2.5 pollution, coordination dynamics, and the underlying influence pathways of various urbanization factors on air quality degradation.
We construct a coupling coordination degree model between PM2.5 and urbanization levels. Results reveal that the conflict between the urbanization process and PM2.5 pollution in various cities of Guangdong Province is gradually easing.

2. Materials and Methods

2.1. Data Sources

2.1.1. Fine Particulate Matter
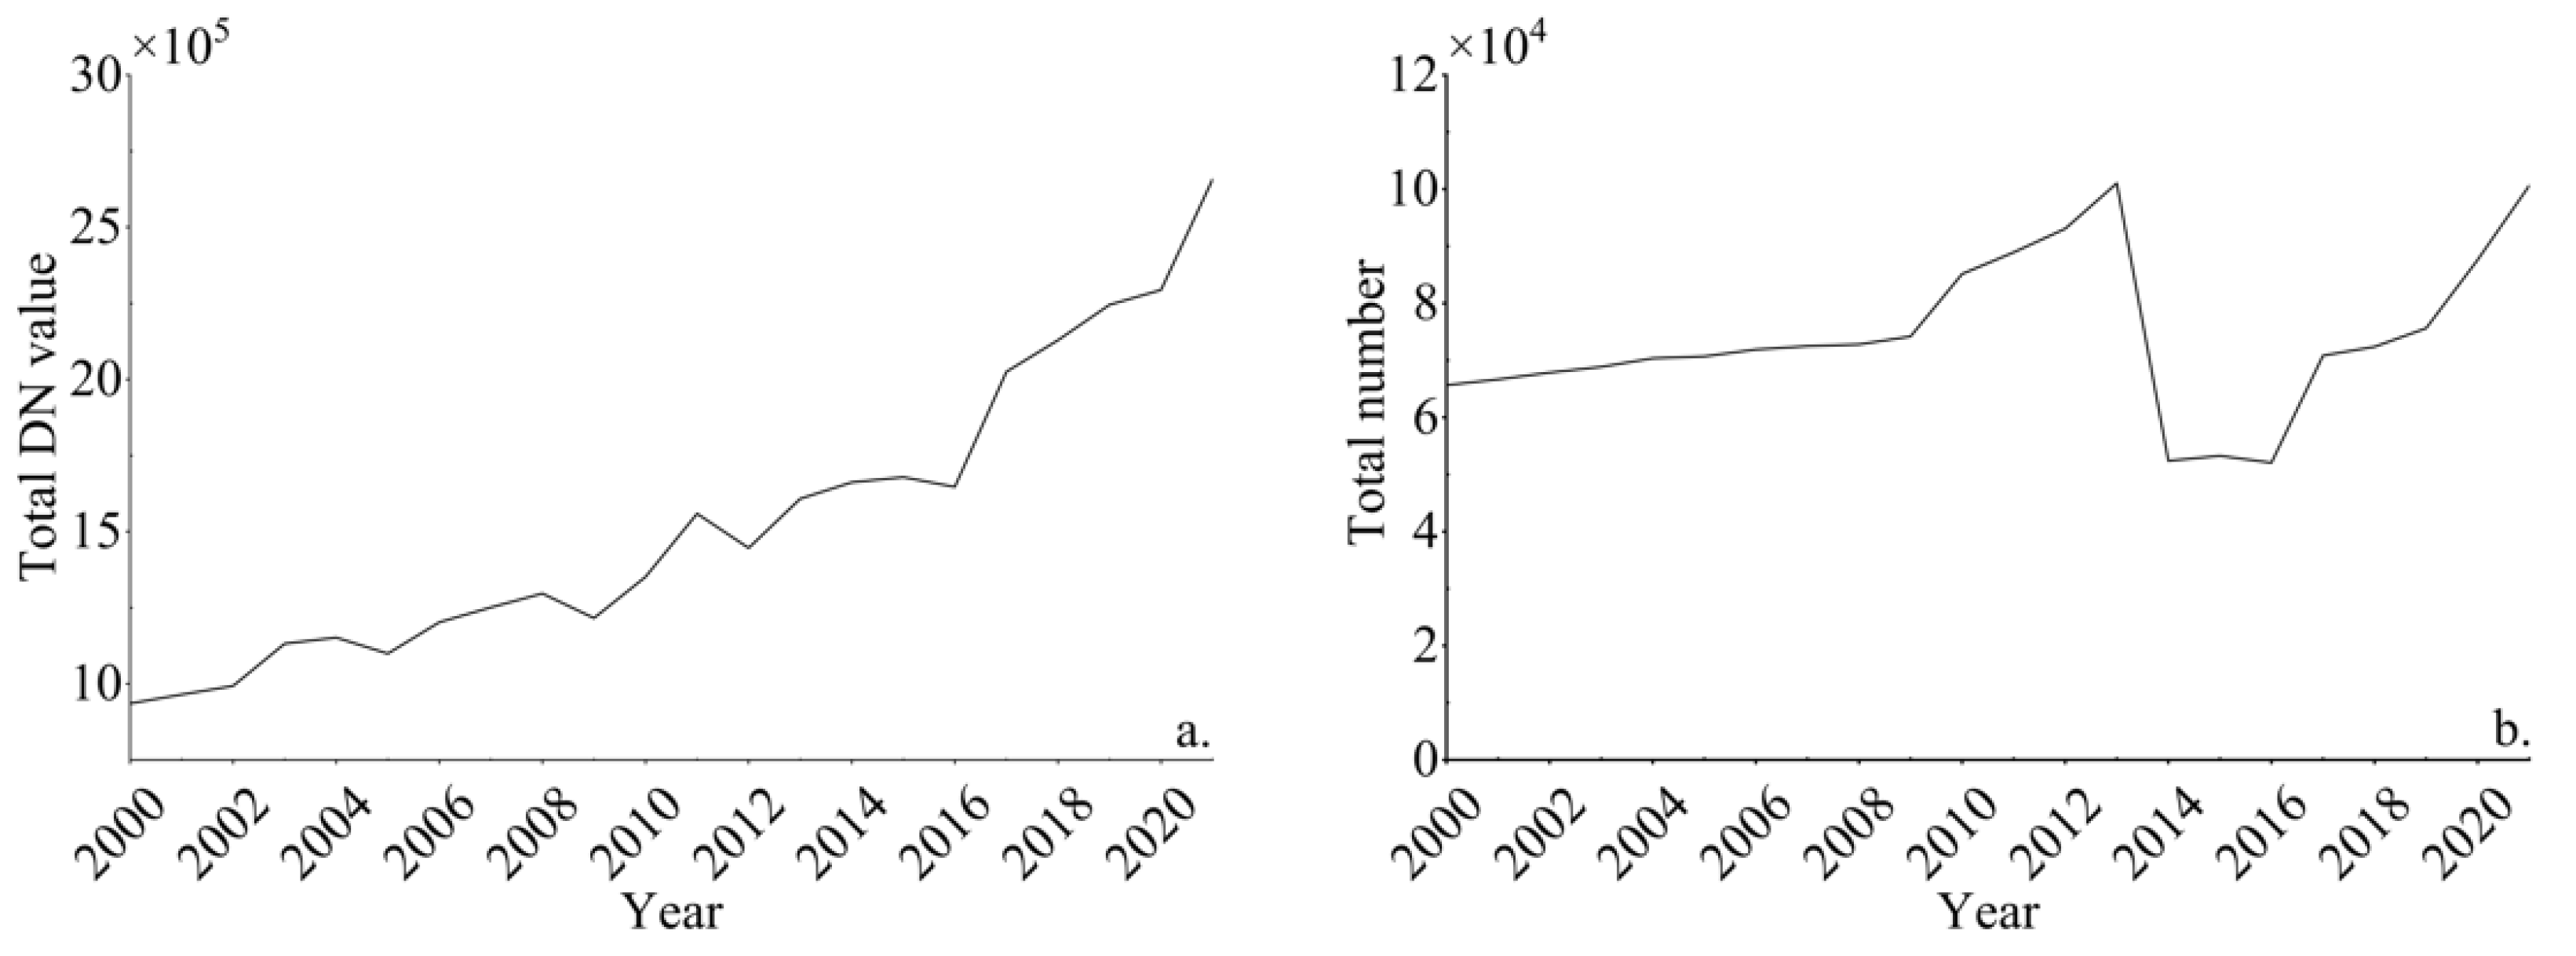
The PM2.5 concentration data were derived from the China High Air Pollutants (CHAP) dataset, a high-resolution (1 km) near-surface air pollution database for China spanning 2000–2021. This dataset was developed using an innovative spatiotemporal extreme random tree model that effectively compensates for spatial gaps in MODIS MAIAC aerosol optical depth (AOD) products. The model incorporates multisource data assimilation, including ground-based monitoring observations from environmental protection agencies, atmospheric reanalysis data, and detailed emission inventories. Through this comprehensive approach, the CHAP dataset provides continuous daily PM2.5 estimates with complete spatial coverage across China. Extensive validation against independent measurements demonstrated the dataset’s high accuracy, with a coefficient of determination (R2) of 0.92 and root mean square error (RMSE) of 10.76 µg/m3 [42]. The 1 km spatial resolution enables precise characterization of fine-scale pollution patterns, making this dataset particularly valuable for urban-scale air quality studies.

2.1.2. Night Lights

The nighttime light data used in this study were obtained from two satellite platforms: the Defense Meteorological Satellite Program’s Operational Linescan System (DMSP-OLS) and the Visible Infrared Imaging Radiometer Suite (VIIRS) onboard the Suomi National Polar-orbiting Partnership (NPP) satellite. We utilized Version 4 of the DMSP-OLS dataset (1992–2013), which provides cloud-free annual composites with a digital number range of 0–63 at 30 arc-second spatial resolution (~0.84–0.87 km in Guangdong Province). To complement this, we incorporated VIIRS data (2014–2021) that offers superior 500 m resolution and eliminates the saturation effects present in DMSP-OLS data. To ensure temporal consistency across the 2001–2021 study period, we implemented a rigorous standardization protocol involving: coordinate system conversion to Lambert azimuthal equal-area projection with 1 km resampling, radiometric normalization including VIIRS DN value clipping and transient light source removal, and comprehensive DMSP-OLS corrections for saturation effects and inter-annual calibration. The resulting dataset demonstrates excellent temporal continuity (Figure 1) and effectively minimizes sensor-specific artifacts while preserving authentic urban light signals, providing a reliable foundation for subsequent urbanization analysis.
There are indeed some limitations in using nighttime light data to characterize the level of urbanization development. In core urban areas, the light intensity can easily reach the sensor saturation value, which cannot reflect the gradient differences of actual economic activities and may underestimate the true development level of high-density urban areas. The misjudgment of the urban-rural transition zone often results in “fragmented lighting” in the urban-rural fringe, which is easily classified as “urban sprawl” by algorithms, but may lack supporting services and population aggregation in reality. In addition, spatial resolution also restricts the recognition of fine structures within the city (such as block scale) by nighttime light data.
The built-up areas of Guangdong Province for the years 2000, 2010, and 2021 were extracted using a threshold dichotomy method applied to nighttime light data. Validation was performed against officially built-up area statistics published in the Guangdong Statistical Yearbook, with comparative results presented in Table 1. Our extraction method demonstrated strong consistency with the statistical data, showing errors consistently below 10%. This represents a significant improvement, as Li et al. (2023) reported maximum errors of 11.19% [43]. The accuracy achieved in our study falls well within acceptable methodological limits for urban area extraction using remote sensing techniques.

2.1.3. MOD13A1 NDVI

The NDVI data were obtained from the MOD13A1 (https://ladsweb.modaps.eosdis.nasa.gov/missions-and-measurements/products/MOD13A1, accessed on 25 March 2025) product of the MODIS sensor onboard the Terra satellite, with a spatial resolution of 500 m. This dataset provides reliable vegetation index measurements through rigorous atmospheric correction and quality control procedures.

2.1.4. Land Cover Type

Huang et al. (2023) developed the annual China Land Cover Dataset (CLCD), a comprehensive land cover classification product generated from 335,709 Landsat images using the Google Earth Engine (GEE) platform [44]. This dataset, which has been continuously updated since 1985, was created by extracting spatiotemporal features from Landsat data and applying a random forest classification algorithm. To enhance the dataset’s spatiotemporal consistency, the authors implemented an advanced post-processing approach incorporating spatiotemporal filtering and logical inference techniques. Validation using 5463 visually interpreted samples demonstrated the robust performance of CLCD, achieving an overall accuracy of 80%.

2.1.5. Population Distribution

The LandScan global population distribution dataset, developed by Oak Ridge National Laboratory (ORNL) under the U.S. Department of Energy, represents a high-resolution (1 km) population modeling system that has been annually updated since 2000. This innovative dataset incorporates country-specific demographic parameters and geographic covariates to generate optimized population distribution estimates. The modeling framework integrates multiple data sources, including census statistics, satellite-derived urban extents, and transportation networks, to produce reliable population estimates that maintain spatial accuracy across diverse geographic contexts.

2.1.6. Road Maps

OpenStreetMap (OSM, https://www.openstreetmap.org, accessed on 25 March 2025) is an open-source world map that can be freely edited by the public. OSM’s road data includes a wide range of road information from around the globe, collected by volunteers around the world through various data sources, such as GPS devices, aerial imagery, topographic maps, and publicly available satellite images. Therefore, OSM’s road data is characterized by real-time updating, rich information, and extensive coverage.

2.1.7. Socioeconomic Statistics

The socioeconomic statistics in this article are derived from the Guangdong Statistical Yearbook and municipal statistical yearbooks and bulletins.

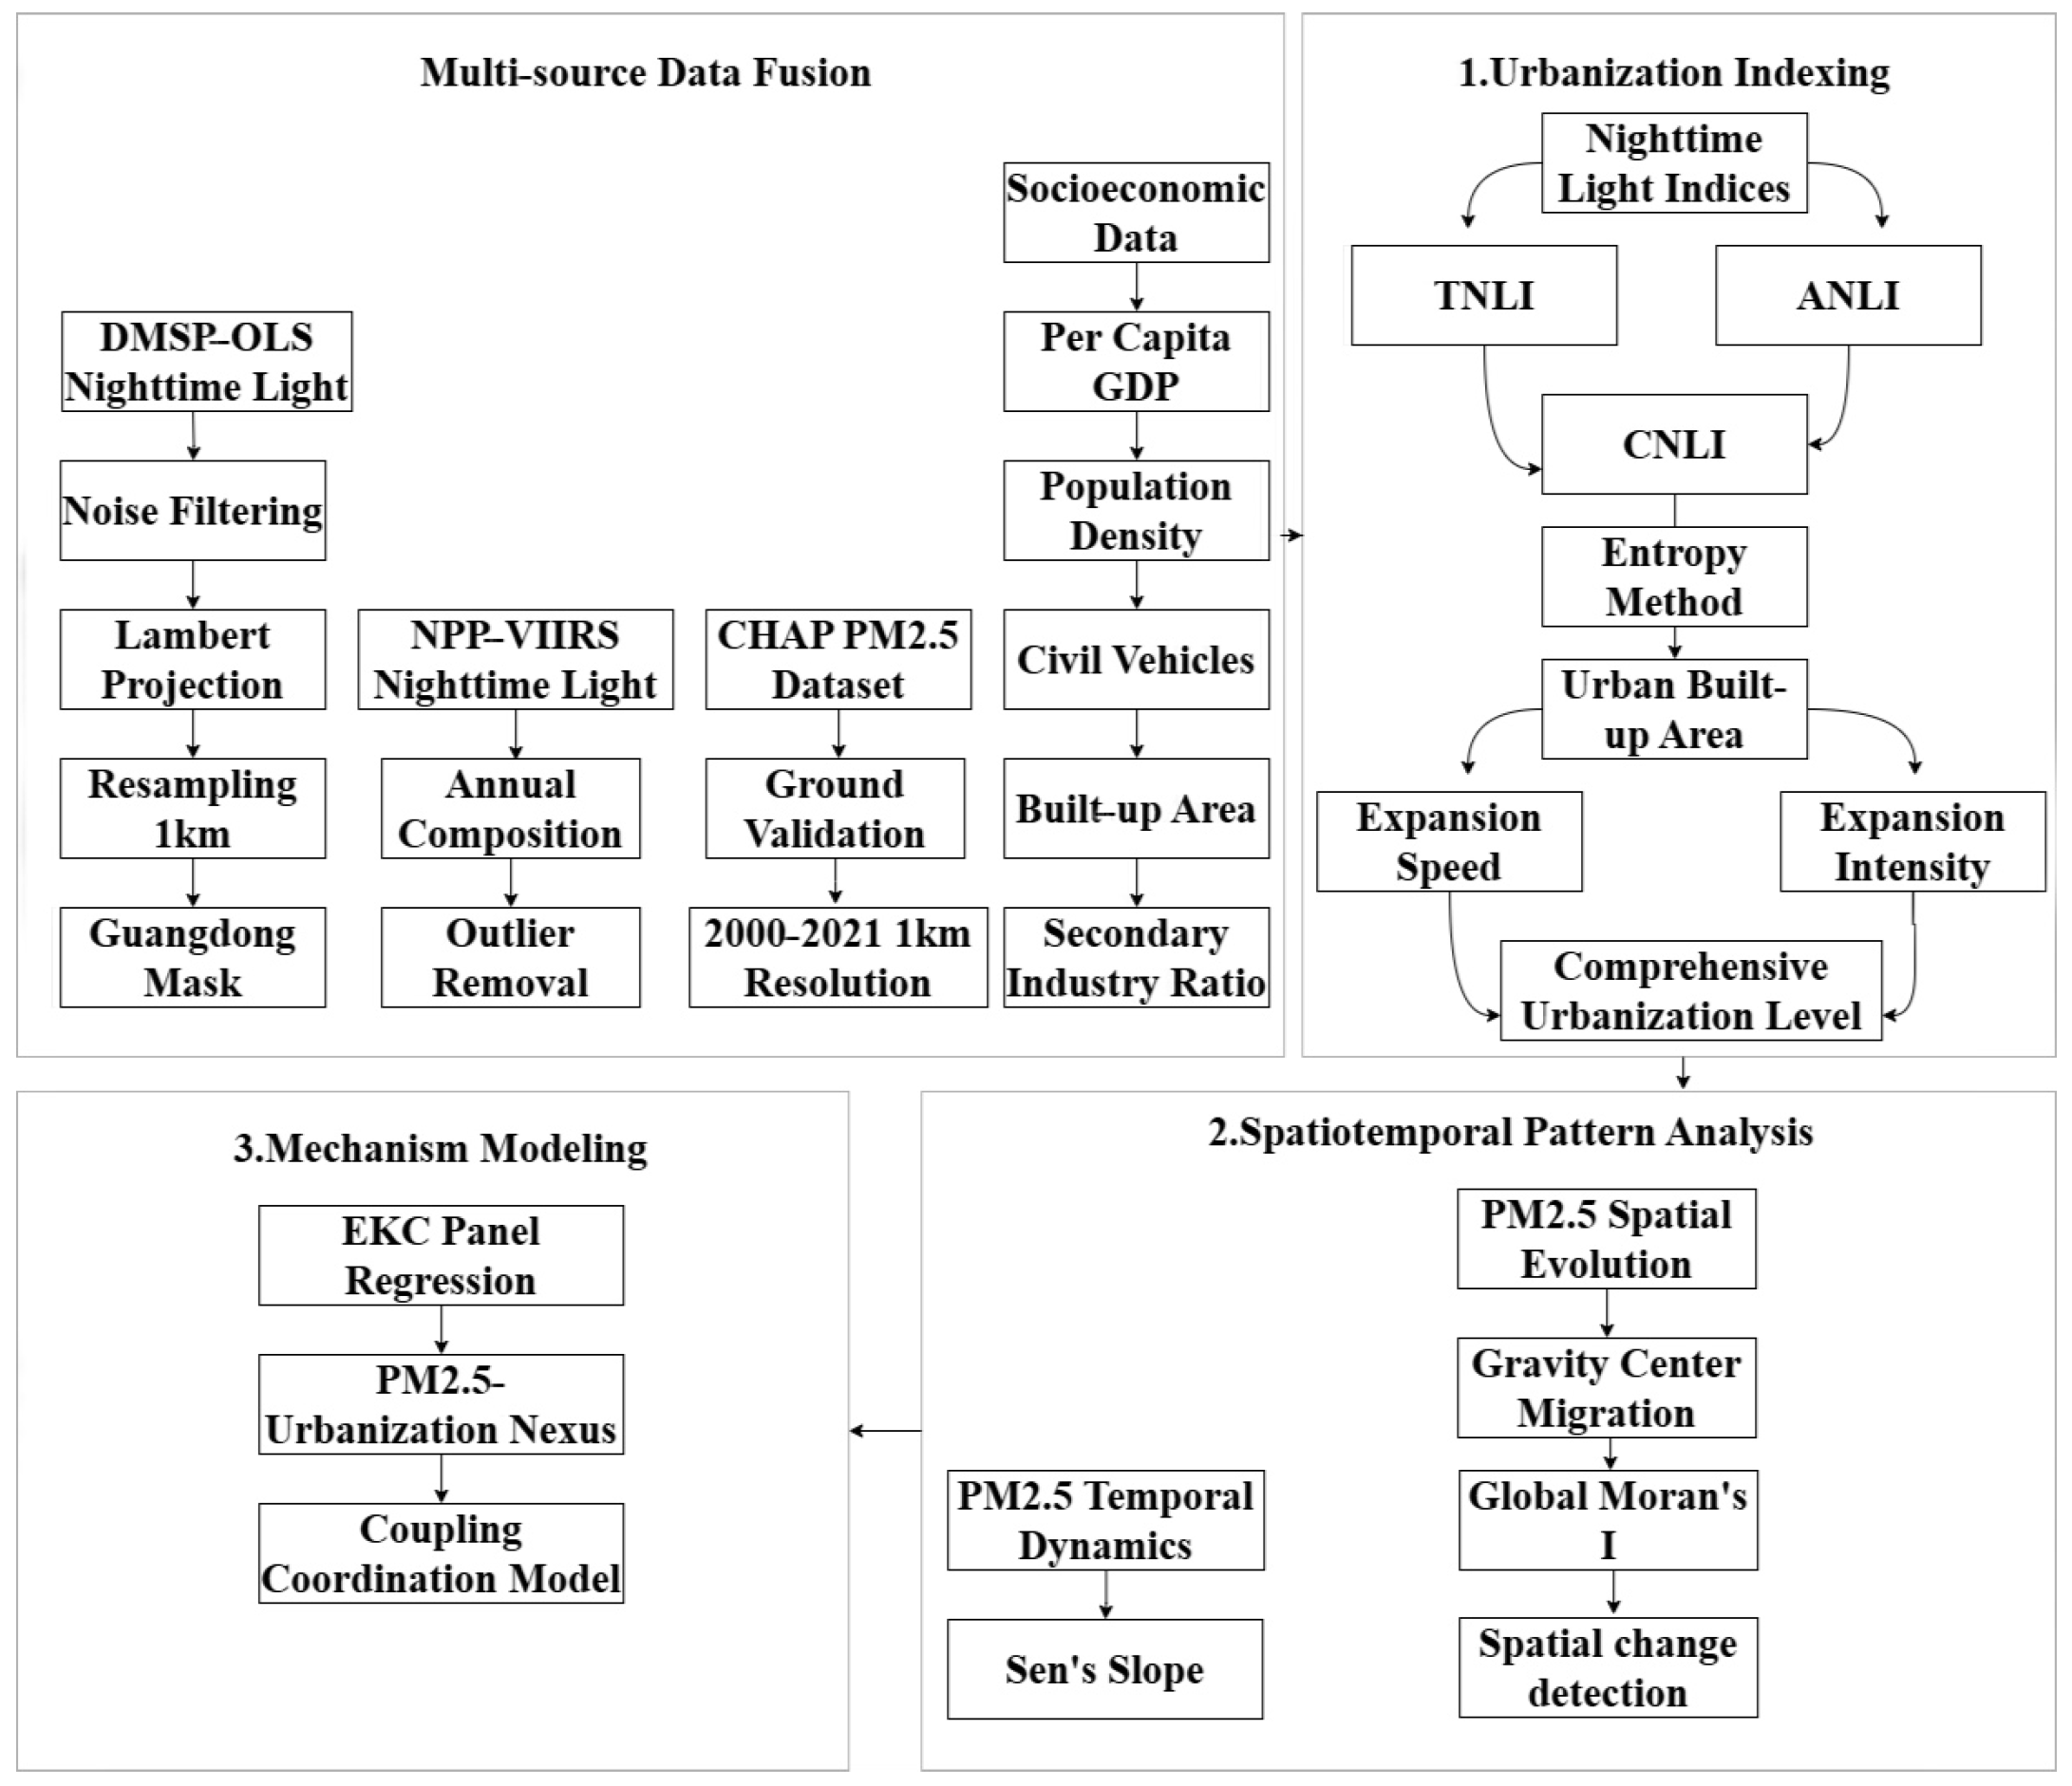
2.2. Research Methodology

We have drawn a Workflow of the methodology (Figure 2) based on the overall idea of the article to help readers better understand it. This study consists of three progressive sections: (I) Employing nighttime light data to extract urban built-up areas, demonstrating good accuracy through consistent results with statistical data. We constructed a comprehensive urbanization evaluation index using 19 urbanization factors, thereby validating the feasibility of nighttime light data for long-term urbanization characterization. (II) Using trend analysis and spatial autocorrelation methods, we revealed the changing trends and spatiotemporal aggregation characteristics of PM2.5 concentrations in Guangdong Province from 2000 to 2021. The abrupt change detection method was applied to identify the transition year of nighttime light intensity, which served as a demarcation point to divide the study period into two phases. (III) Establishing the relationship between PM2.5 concentrations and urbanization through three dimensions: land use, population, and economic development. By comparing the impact curves with the Environmental Kuznets Curve (EKC), we identified turning points where urbanization factors shifted from positive to negative drivers of PM2.5 concentrations. Furthermore, we developed a coupling coordination degree model based on long-term nighttime light data and PM2.5 concentrations to assess their interactive relationship. This allowed us to classify coordination zones and analyze the temporal evolution of coupling coordination levels across cities in Guangdong Province. All methodological approaches are summarized in Table 2.

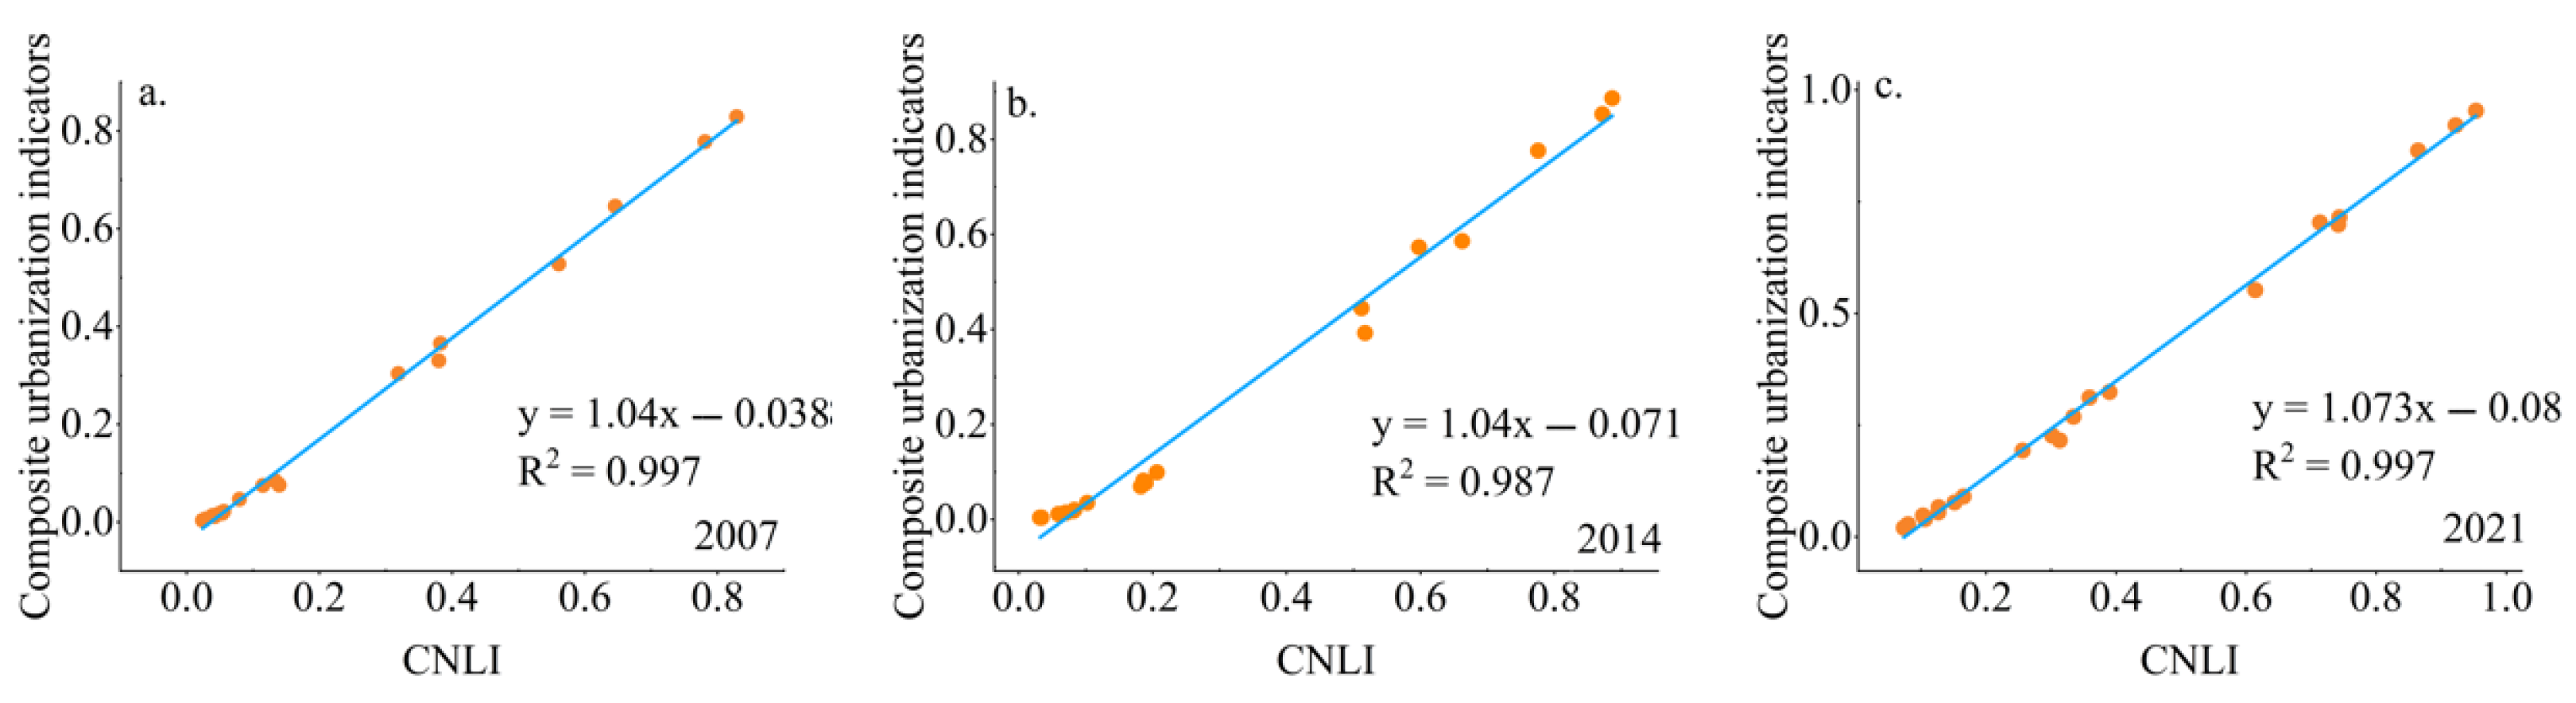
2.2.1. Construction of Comprehensive Evaluation Indicators for Urbanization

Urbanization represents an inevitable outcome of socioeconomic development across economic, social, cultural, and political domains. While disciplinary conceptualizations of urbanization vary, comprehensive assessments typically incorporate four fundamental dimensions: demographic, economic, spatial, and social characteristics. This study establishes an urbanization evaluation index system comprising four key components: demographic urbanization, economic urbanization, land urbanization, and spatial urbanization. The initial selection included 25 candidate indicators for assessing urbanization levels. To ensure methodological rigor, we conducted bivariate correlation analysis on all indicators, eliminating those with correlation coefficients exceeding 0.8 to avoid multicollinearity and information redundancy. This refinement process resulted in 19 statistically independent indicators for the final evaluation model. Owing to data unavailability for the year 2000, this study analyzes three representative years (2007, 2014, and 2021) that reflect distinct stages of urbanization in Guangdong province. The complete correlation matrix for the original 25 indicators is provided in the Supporting Information.
Given the challenges in analyzing long-term statistical data, this study investigates the feasibility of using a composite nighttime light index (CNLI) as a proxy for urbanization measurement. As demonstrated in Figure 3, the R2 between the comprehensive urbanization level derived from statistical data and the composite nighttime light index consistently exceed 0.7. This strong correlation confirms that the composite nighttime light index can effectively substitute for conventional urbanization indicators when constructing coupled coordination models.

2.2.2. PM2.5 Spatiotemporal Pattern Analysis

This study employs an integrated analytical framework to investigate PM2.5 variations in Guangdong Province from 2000 to 2021. Temporal patterns were analyzed using Mann–Kendall trend tests to identify significant monotonic changes, with Sen’s slope estimator quantifying trend magnitudes and piecewise regression detecting nonlinear transitions. Spatial characteristics were evaluated through global Moran’s I for autocorrelation assessment and spatiotemporal scan statistics to identify significant pollution clusters. Urbanization dynamics were examined using Pettitt’s test and Bayesian change-point analysis to objectively determine transition years in nighttime light data, enabling division into distinct urbanization phases: Phase 1 (pre-transition, slower growth) and Phase 2 (post-transition, accelerated expansion). Comparative phase analyses incorporated independent trend evaluations, spatial autocorrelation comparisons, and Geodetector-based quantification of urbanization factors (land use, population density, and GDP) influencing PM2.5 concentrations. This multidimensional approach provides a comprehensive assessment of urbanization–pollution interactions across temporal and spatial scales.

2.2.3. Coupled Coordination Degree Model

The concept of coupling refers to the interaction between two distinct systems under the influence of their inherent characteristics and external factors. Urbanization and ecological-environmental systems exhibit a complex, interdependent coupling relationship. Drawing upon coupling coordination degree models from physics, this study develops a PM2.5-urbanization coupling model formalized in Equation (1):
C = 2 × ( U × E ) ( U + E ) 2
In the model, U represents the urbanization level, E denotes PM2.5 concentration, and C indicates the coupling degree value, reflecting the interaction intensity between the two systems. The value range of C is bounded between 0 and 1 (0 ≤ C ≤ 1), where higher values signify greater coordination between PM2.5 concentrations and urbanization development.
However, relying solely on the coupling degree (C) may overlook the developmental disparities within the systems, potentially leading to high coupling values that reflect pseudo-coordination (“Pseudo coordination” refers to the formal establishment of a joint prevention and control mechanism for PM2.5 governance in urban agglomerations, but the actual implementation effect is far lower than expected due to administrative barriers, industrial interest conflicts, or data distortion) rather than genuine balanced development. To address this limitation, we introduce the coupling coordination degree (D) to better quantify the actual harmonious development level between the two systems. The formulation is as follows the Equations (2) and (3):
T = α × U + β × E
D = C × T
In the coupling coordination model, D represents the coupling coordination degree between urbanization level and PM2.5 concentration, with a value range of 0 < D ≤ 1. A higher value of D indicates a more harmonious and coordinated development between urbanization and air quality, whereas a lower value suggests an imbalanced relationship. T is the composite evaluation index. Where U and E denote the urbanization level and PM2.5 concentration indices, respectively. The coefficients α and β represent the weights assigned to each subsystem’s contribution to the coupling coordination degree. Previous research has demonstrated that urbanization level and PM2.5 concentration exert differential impacts on their coupling coordination relationship [64]. However, in previous studies, it has been found that the coupling degree is not significantly affected by the weights of urbanization and environmental indicators [65]. Therefore, we adopted the conventional approach of setting α = β = 0.5 to ensure an equitable weighting in our analysis.

3. Results and Discussion

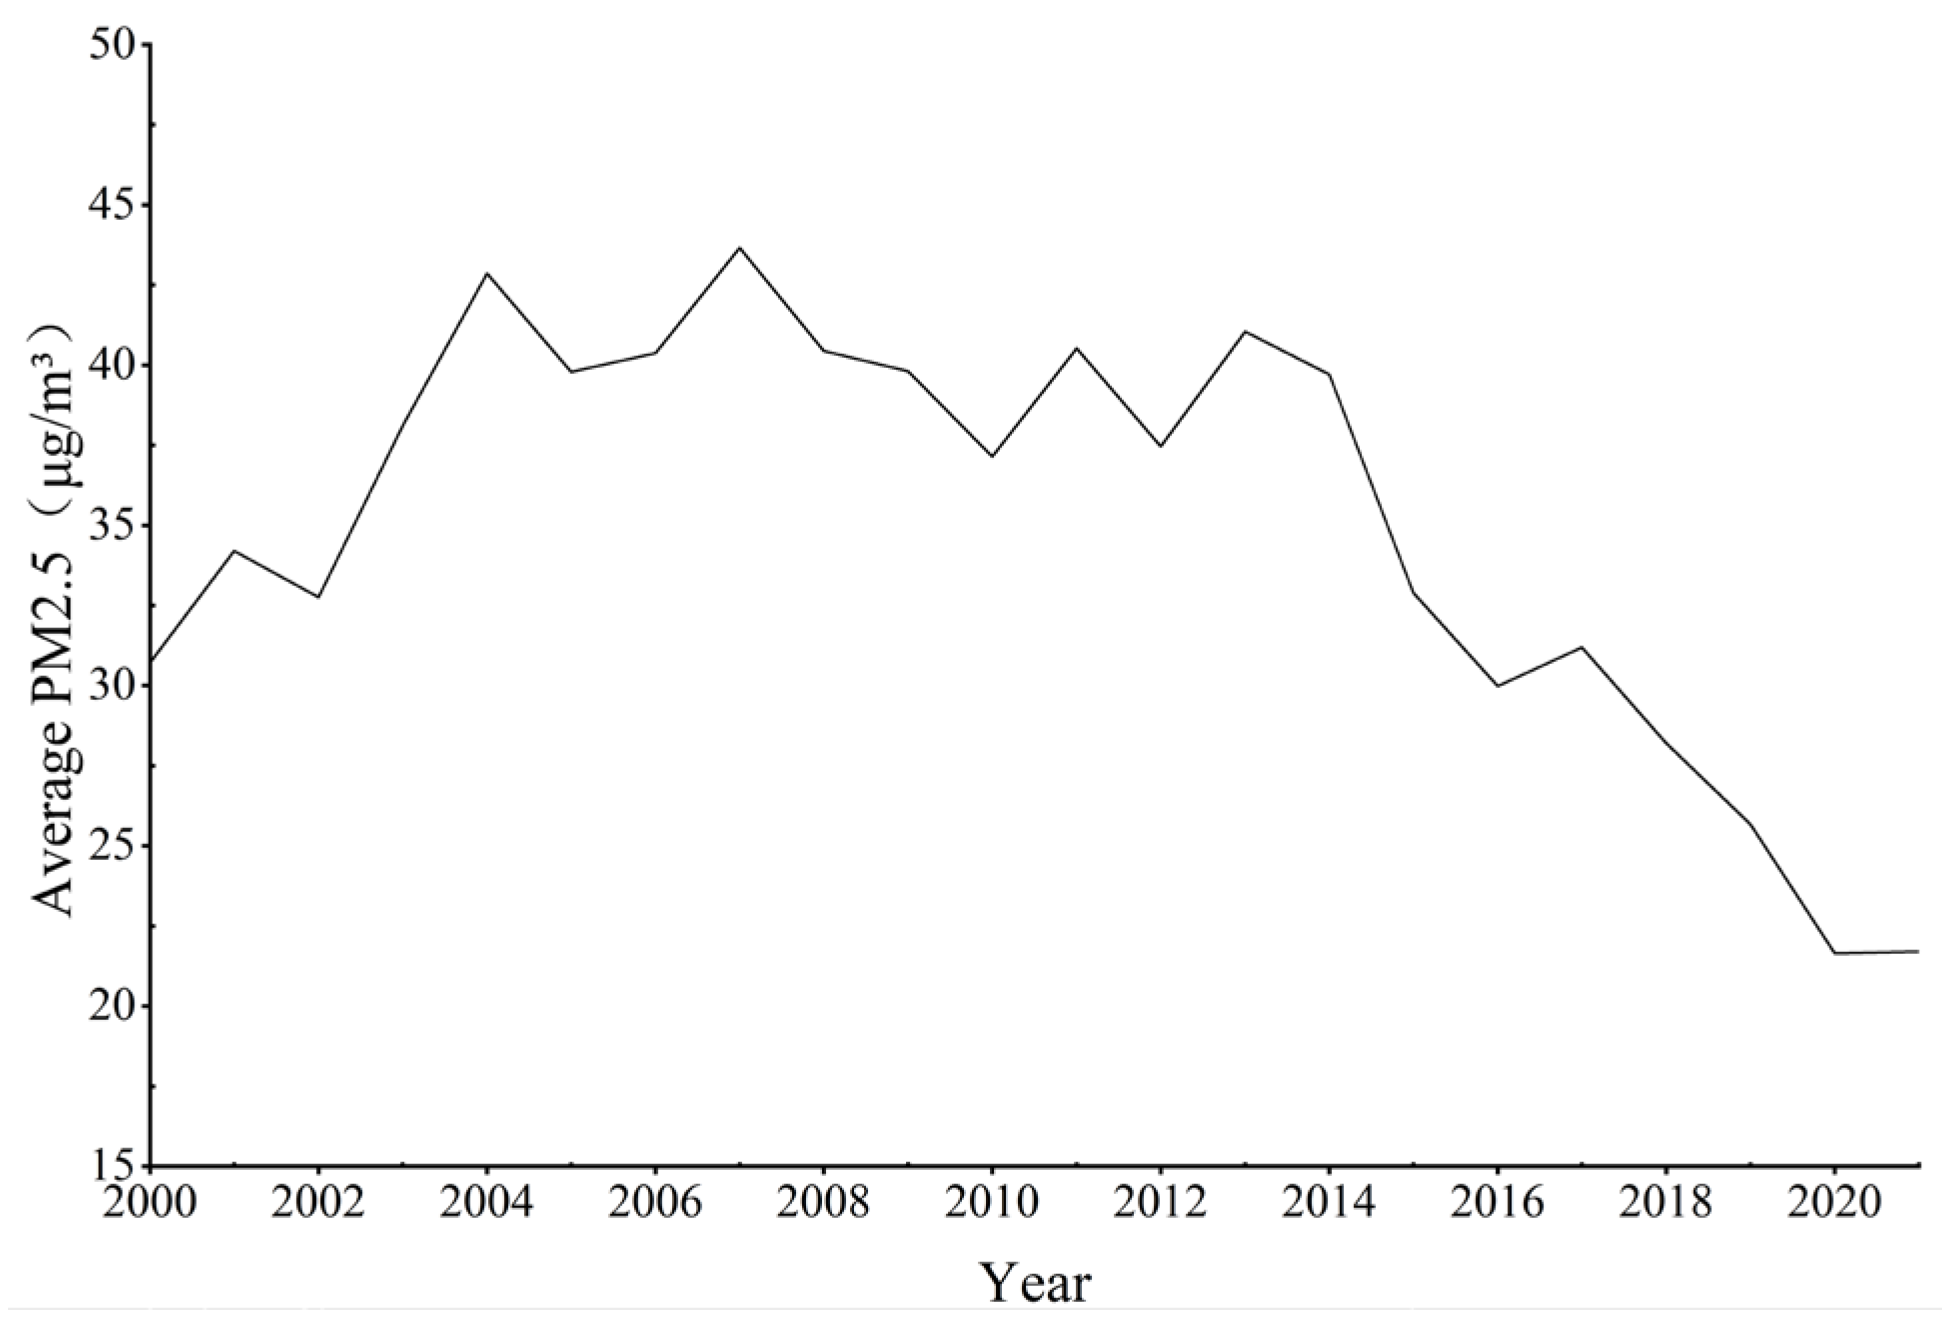
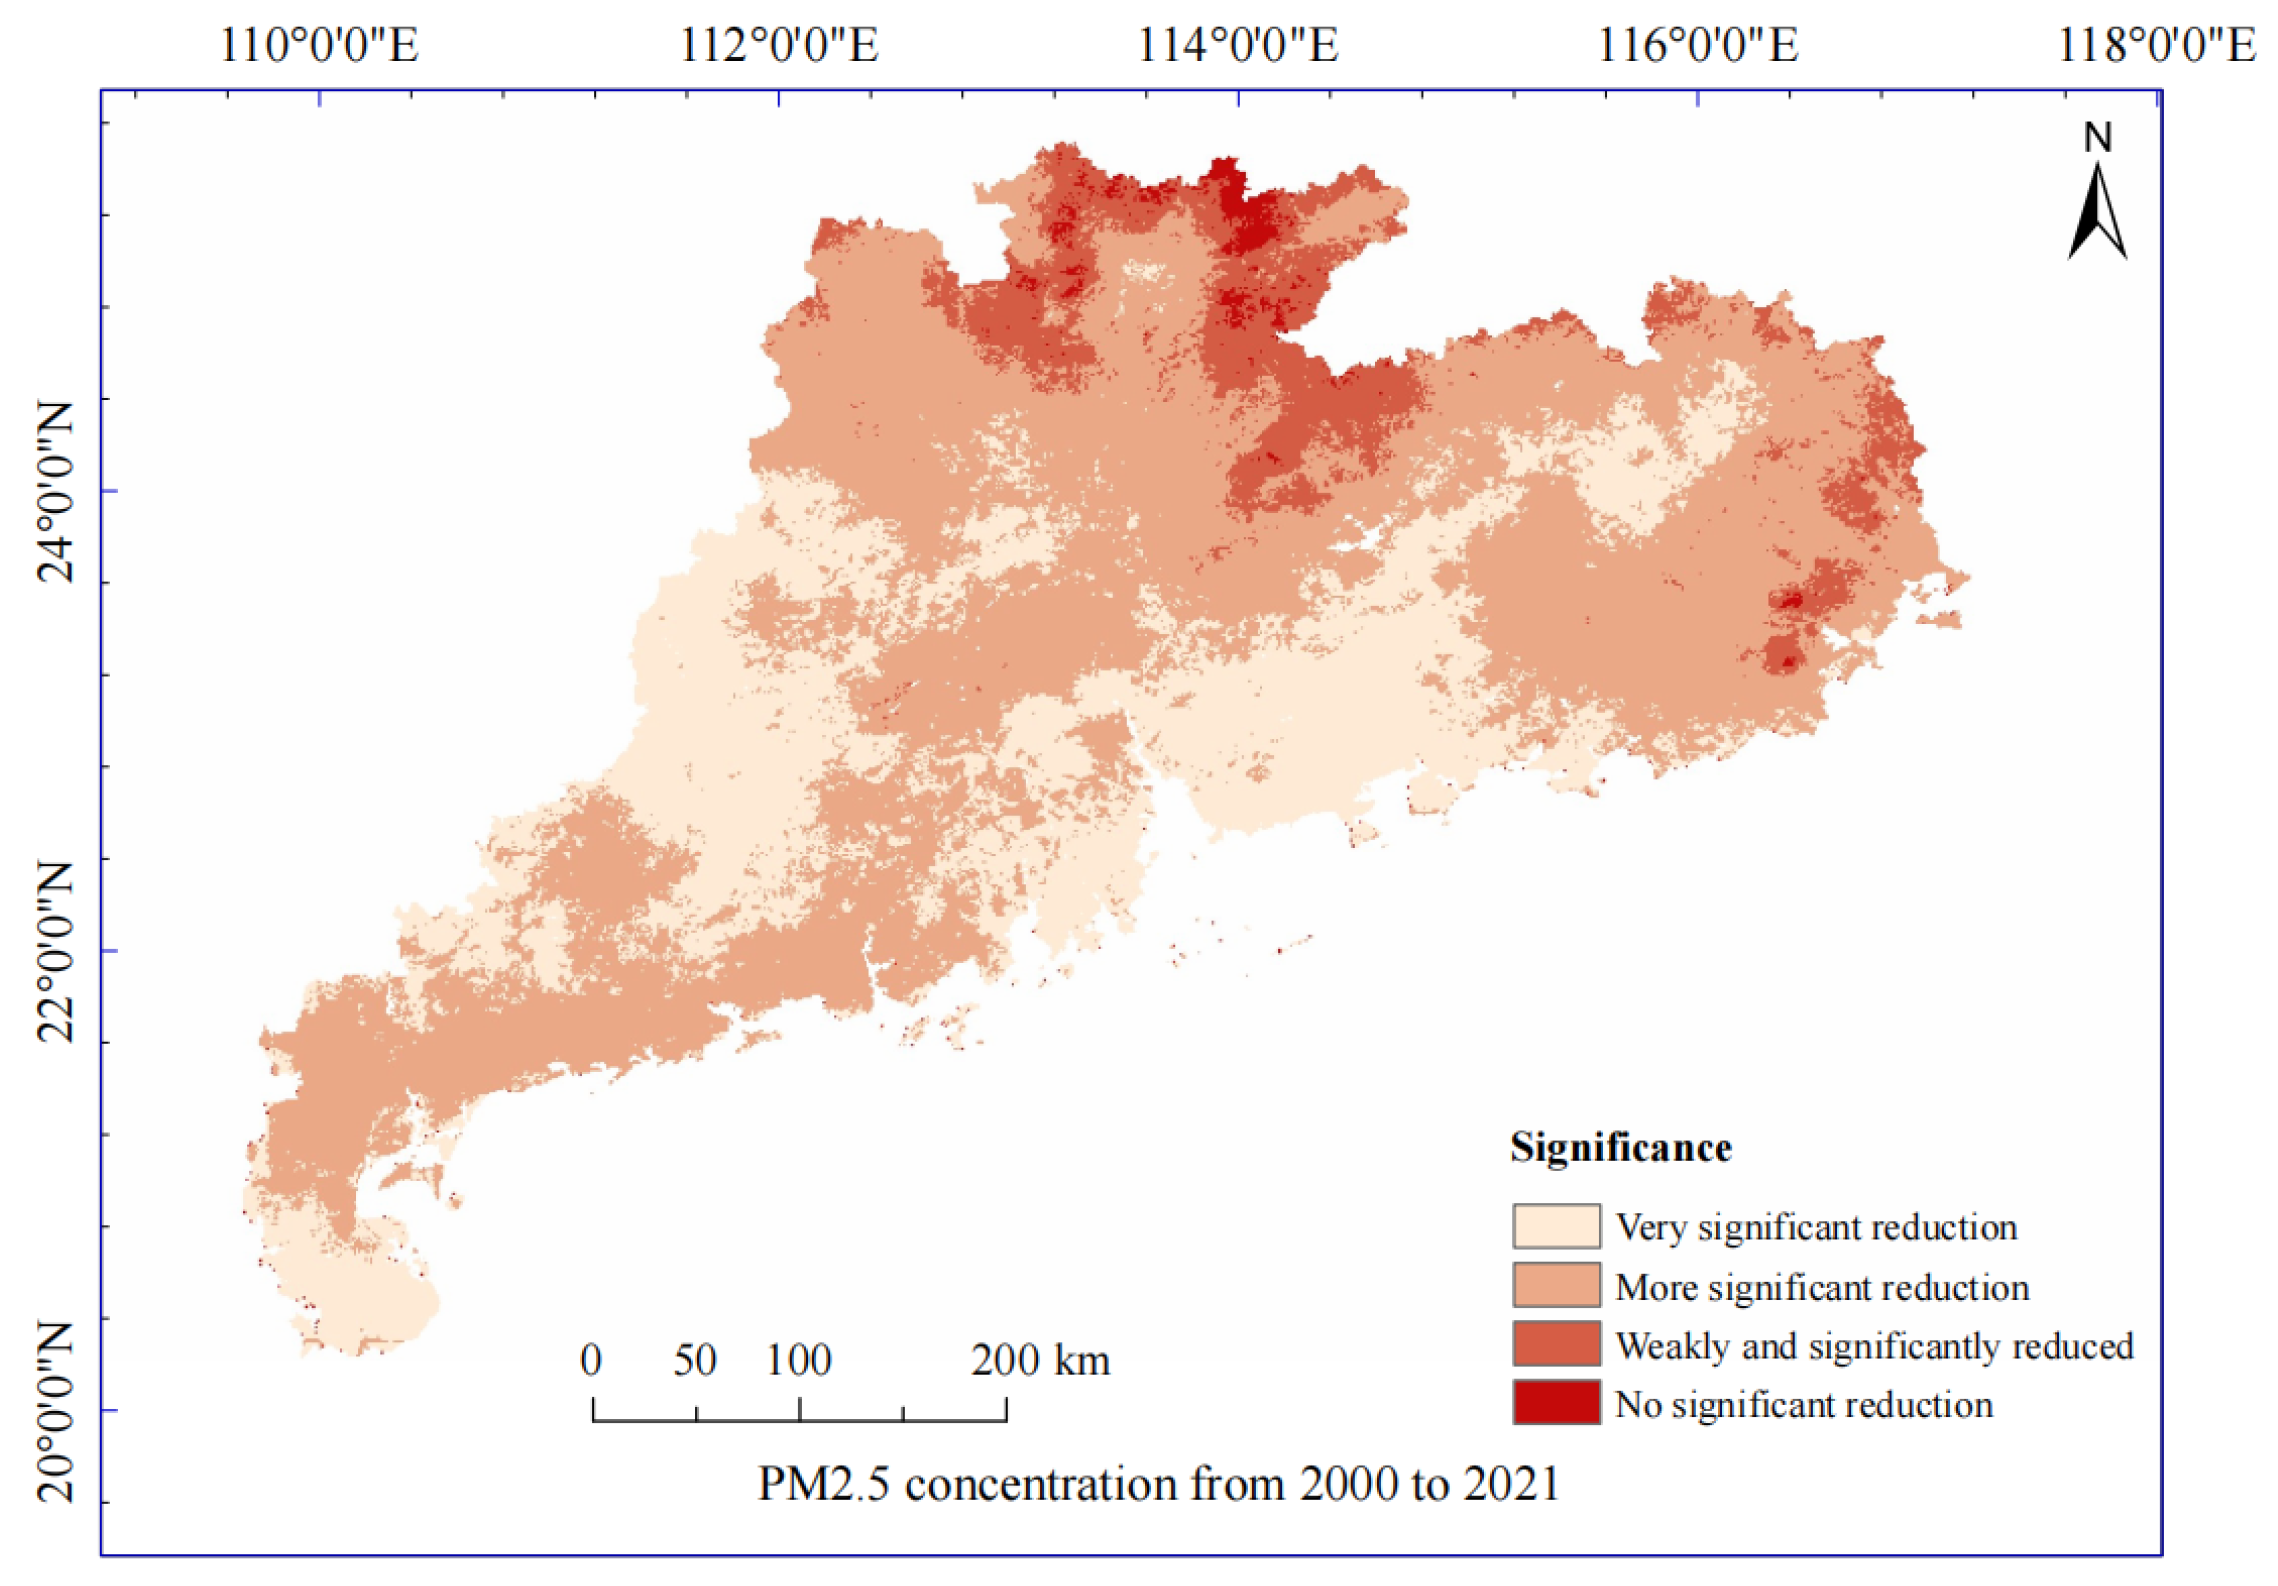
3.1. Detection of PM2.5 Concentration Change in Guangdong Province

Figure 4 reveals distinct temporal patterns in PM2.5 concentrations from 2000 to 2021. The initial period (2000–2004) showed an upward trend, peaking at 42.86 μg/m3 in 2004, which is also the highest recorded level during the 22-year study period. 2004–2014 exhibited significant fluctuations, reaching the lowest value of 37.15 μg/m3 in 2010, while even this minimum value exceeded the class I air quality standard threshold (35 μg/m3) under Ambient Air Quality Standards (GB 3095-2012) [66]. A marked improvement occurred post-2014, with concentrations decreasing substantially to reach a record low of 21.71 μg/m3 in 2021. The 49.3% reduction from the 2004 peak level indicates the substantial effectiveness of air pollution control measures implemented in Guangdong Province during this period regarding PM2.5.
Figure 4 shows the trend analysis of PM2.5 concentrations in Guangdong Province from 2000 to 2021, which was conducted using Sen’s slope estimator. The Sen slope values ranged between −1.153 and −0.212, indicating a decreasing trend across the entire province without areas showing increasing concentrations. Mann–Kendall method is used to conduct significance testing on the trend of PM2.5 concentration, and its results, categorized by the standard normal deviate (Z), revealed spatially varied significance levels of these decreasing trends. Weakly significant (1.65 < |Z| ≤ 1.96) and nonsignificant (0 < |Z| ≤ 1.65) decreases accounted for 10.17% of the total area, primarily distributed in northeastern border regions. Moderately significant decreases (1.96 < |Z| ≤ 2.56) covered 56.86% of the province and showed widespread distribution. The most pronounced reductions, classified as extremely significant (|Z| > 2.56), occupied 32.97% of the area and were predominantly concentrated in the northwestern and southeastern regions. These findings demonstrate that nearly 90% of Guangdong Province experienced statistically significant improvements in air quality during the study period, with the most substantial decreases occurring in industrialized northwest and coastal southeast areas.
The combined results from the Sen slope analysis and the Mann–Kendall significance tests demonstrate the remarkable effectiveness of PM2.5 pollution control measures by Guangdong Province. A notable transition occurred post-2012, when several key national policies were implemented: In September 2012, the State Council approved the 12th Five-Year Plan for Air Pollution Prevention and Control in Key Regions, followed by the landmark Air Pollution Prevention and Control Action Plan (commonly known as the Ten Measures for Air) [8,9] enacted on 10 September 2013. These comprehensive policy frameworks provided crucial institutional support for the observed PM2.5 reductions, particularly in urban agglomerations, establishing a solid foundation for the sustained air quality improvement trends identified in our analysis.
The division results are shown in Figure 5. The total area of weakly significantly reduced and no significantly reduced areas accounts for only 10.17%, distributed in the northeastern edge areas of Guangdong Province. The corresponding reduction in PM2.5 pollution in weakly significantly reduced and no significantly reduced areas is basically slightly reduced. PM2.5 pollution in these areas is already relatively weak, so the change is not significant, but some results have been achieved. The main type of test result is the significantly reduced area, which accounts for 56.86% of the total area and is widely distributed in 21 prefecture-level cities in Guangdong Province. The significantly reduced regional area accounts for 32.97% of the total area of Guangdong Province, concentrated in the northwest and southeast regions.
Global spatial autocorrelation analysis using Moran’s I index revealed significant spatial clustering of PM2.5 concentrations across Guangdong Province (Table 3). Positive Moran’s I values (I > 0) indicate spatial aggregation of similar pollution levels, while negative values (I < 0) suggest dispersion. The strength of these patterns increases with the absolute value of the index, demonstrating clear spatial dependence in air pollution distribution.
The analysis revealed statistically significant spatial clustering of PM2.5 concentrations (Z > 2.58, P < 0.01), with consistently high Moran’s I values exceeding 0.7, indicating strong positive spatial autocorrelation across the study area. These results demonstrate that PM2.5 pollution exhibits pronounced spatial aggregation patterns in Guangdong Province, where regions with similar pollution levels tend to be geographically concentrated.

3.2. Relationship Between PM2.5 and Urbanization Characteristics

3.2.1. Trend Mutation Detection

The analysis of urbanization patterns in Guangdong Province revealed distinct temporal variations. Based on Pettitt’s change-point detection test applied to nighttime light (NTL) data (total and mean intensity) for the province and 21 prefecture-level cities, 2010 emerged as the most significant transition year (Figure 6). The results showed that 10 cities experienced abrupt changes in total NTL intensity, while nine cities showed changes in mean NTL intensity in 2010. Given this consistent pattern across multiple cities and indicators, 2010 was selected as the demarcation point to divide the study period into two phases (2000–2010 and 2010–2021) for examining the impacts of urbanization on PM2.5 concentrations.

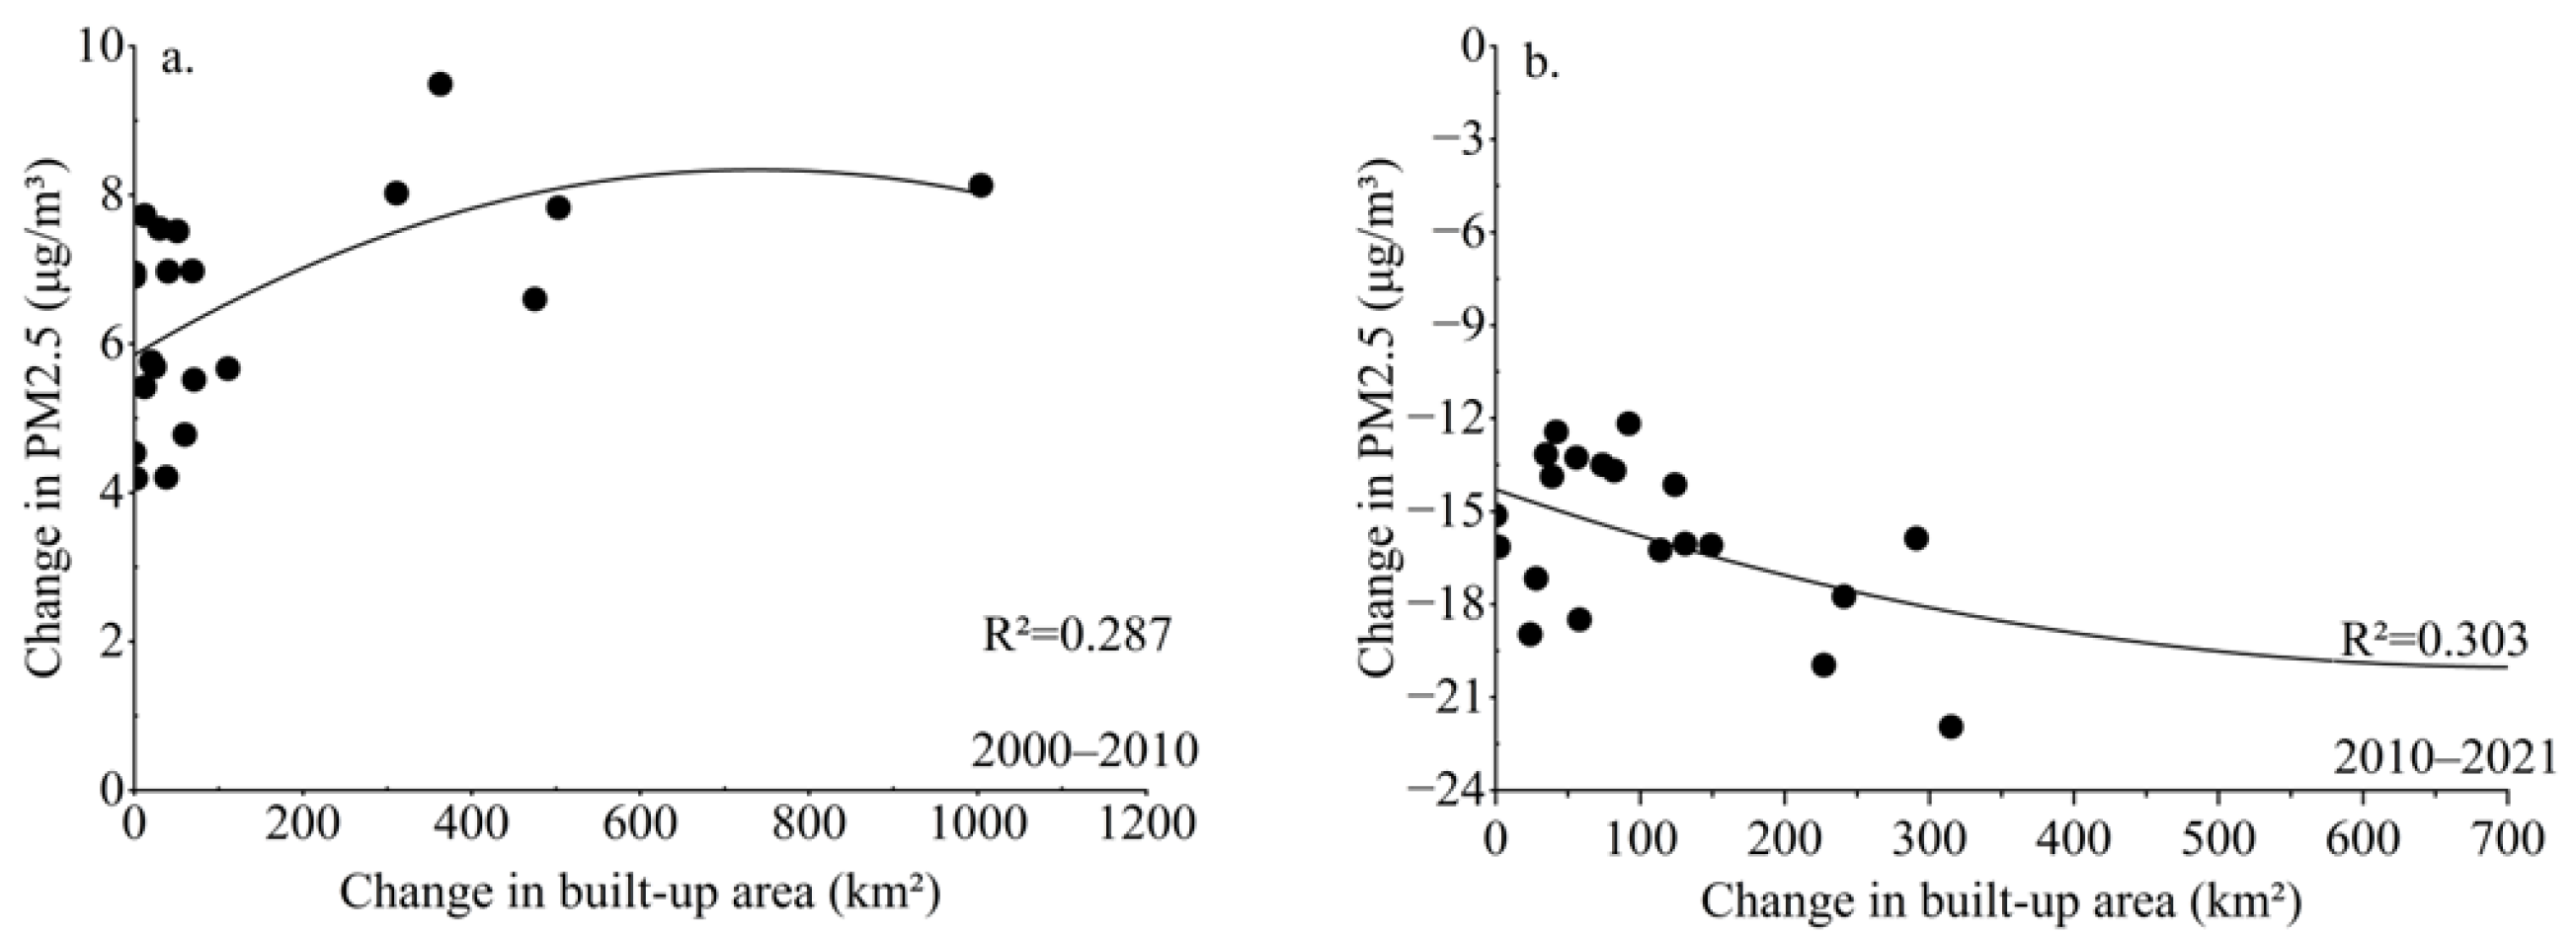
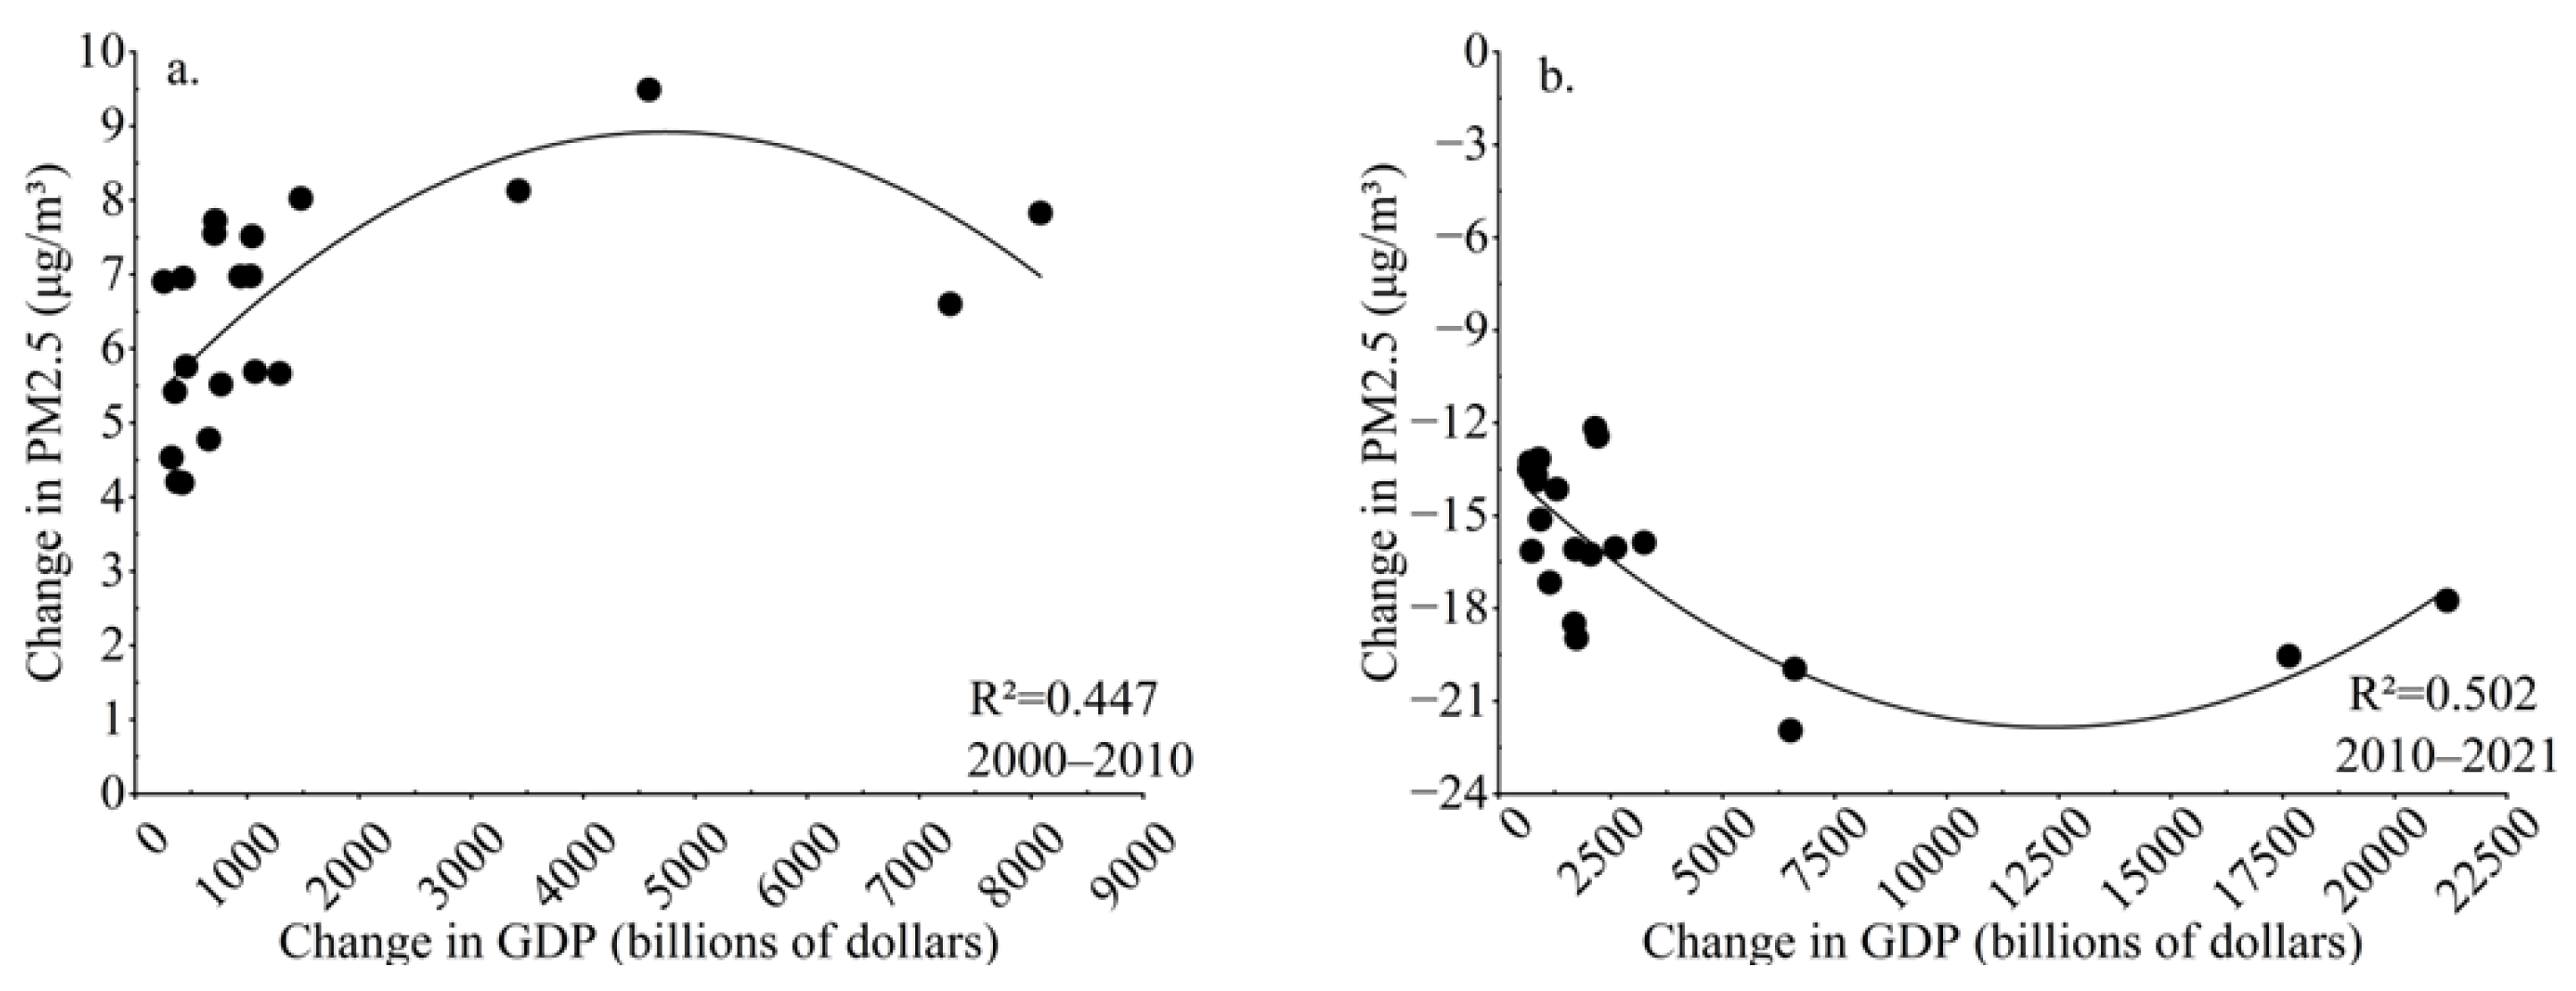
3.2.2. Relationship Between Key Urbanization Factors and PM2.5 Concentrations

As shown in Figure 7, the relationship between urban built-up area expansion and PM2.5 concentration changes exhibited distinct patterns during the two study periods, R2 was 0.287 for 2000–2010 and 0.303 for 2011–2021, indicating moderate explanatory power of built-up area changes for PM2.5 variations. Notably, the correlation shifted from positive in the earlier period to negative in the later period. This transition suggests that urban expansion initially contributed to PM2.5 increases through dust generation from construction activities and elevated vehicular emissions from expanded transportation flow [67]. However, the subsequent negative correlation implies that improved urban planning and pollution control measures may have mitigated these effects in more recent years, despite continued built-up area growth. For example, Guangdong Province has explicitly stated in the “Strengthening Measures and Division of Labor Plan for Air Pollution Prevention and Control” (2017) that it will vigorously develop prefabricated buildings, requiring that by 2020, the proportion of prefabricated buildings in the Pearl River Delta urban agglomeration and the central urban areas of eastern, northwestern Guangdong should reach more than 15% of the newly built building area, and more than 10% in other regions. This move reduces on-site construction dust, paint spraying and other pollution links through the factory production of building components, directly lowering PM2.5 emissions during urbanization construction.
Figure 8 demonstrates an evolving relationship between population dynamics and PM2.5 concentrations across the two study periods. The statistical analysis revealed R2 of 0.230 (2000–2010) and 0.335 (2010–2021), indicating a strengthened association in the latter period. Notably, the correlation transitioned from positive to negative, with the larger R2 value in 2010–2021 suggesting more pronounced demographic impacts on air quality during this phase. This pattern implies that while population growth initially exacerbated PM2.5 pollution, subsequent urbanization stages witnessed an effective decoupling through improved environmental management and sustainable urban development practices, For example, in the ecological restoration case of the Maoming open-pit mine, after the closure of the oil shale mining area, the innovative “landform reshaping + water system connection + soil regeneration” model became a national level “urban dual restoration” pilot in 2020, receiving an average of over one million tourists annually and being awarded the Guangdong Province National Land Space Ecological Restoration Model.
Figure 9 reveals distinct phases in the relationship between economic growth and PM2.5 concentrations. The analysis yielded R2 of 0.447 (2000–2010) and 0.502 (2010–2021), also demonstrating a strengthened statistical association in the latter period. Correlation transitioned from positive to negative between these phases. Initially, GDP growth correlated positively with PM2.5 increases, reflecting conventional industrialization patterns where economic expansion typically elevates energy consumption and associated emissions. However, the negative correlation indicates a noticeable shift in the development paradigm of Guangdong Province, which may result from synergistic effects of stringent environmental regulations implementation, industrial structure optimization toward cleaner production, and widespread adoption of energy-efficient technologies, such as, the implementation of the “Strengthening Measures for Air Pollution Prevention and Control in Guangdong Province” in 2017 required that the proportion of prefabricated buildings in the Pearl River Delta exceed 15% by 2020. Factory production reduces cutting and mixing dust on construction sites, reducing construction dust by 40% and directly suppressing PM2.5 generation. The stronger R2 in the later period indicates green transition measures, such as, in 2017, Shenzhen was the world’s first to achieve 100% pure electrification of public transportation; In 2020, the proportion of new energy taxis in the Pearl River Delta exceeded 70%, with 56,000 electric buses in the province and a 20–30% decrease in the proportion of mobile PM2.5, have become increasingly effective at decoupling economic growth from air pollution.

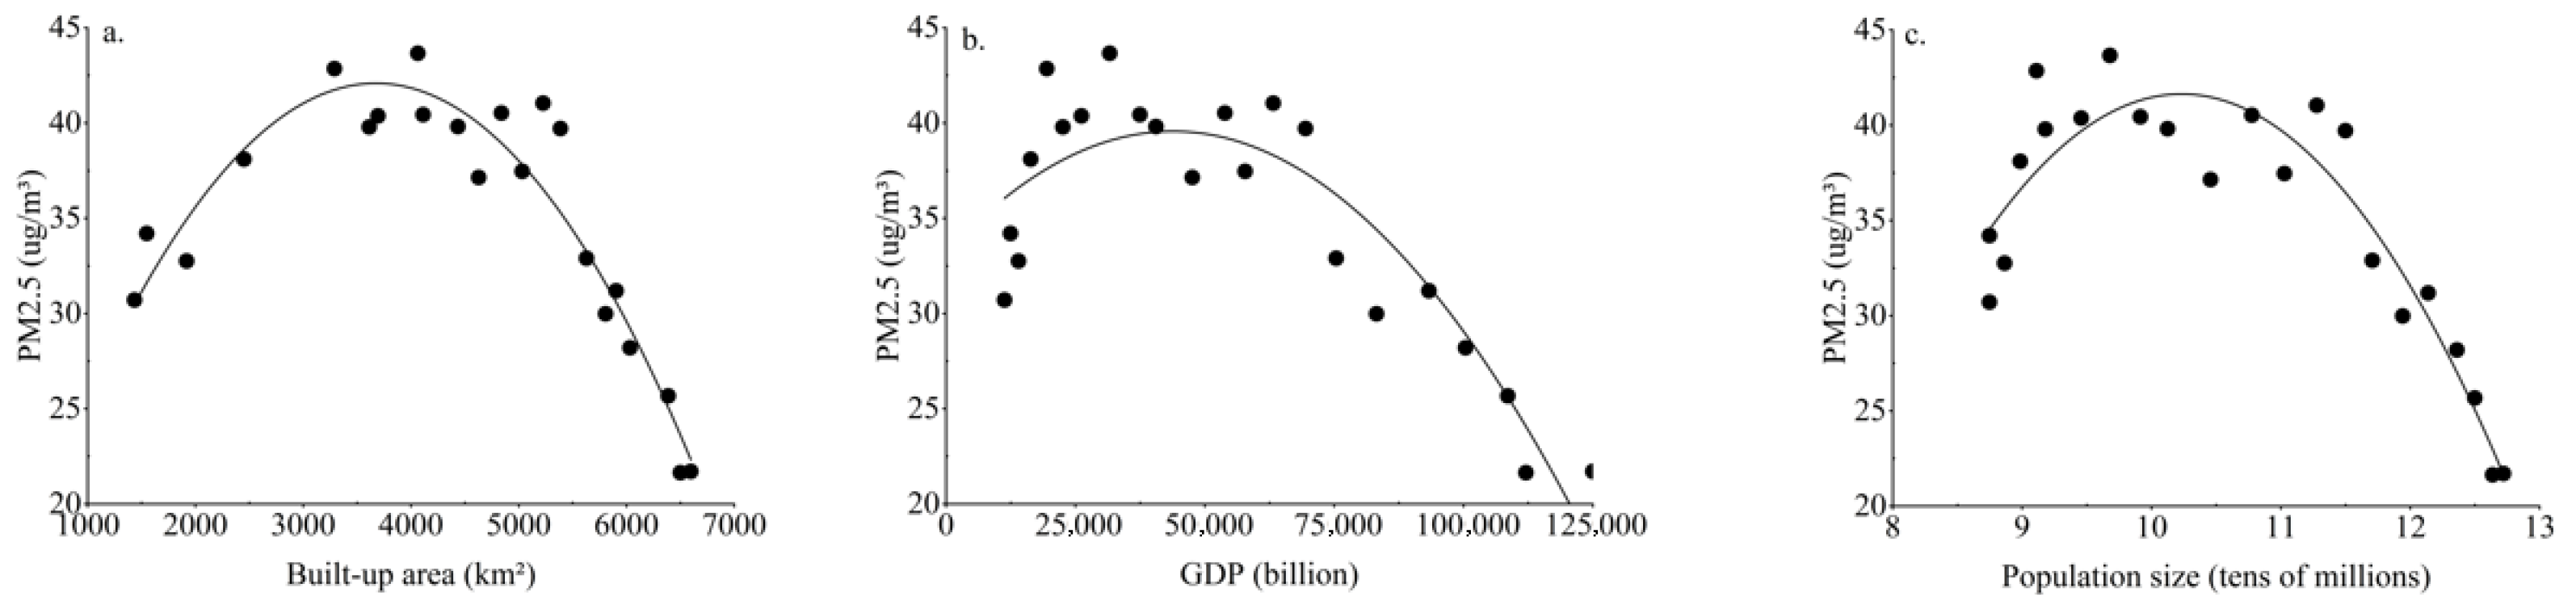
3.2.3. EKC Relationship Validation

The above results demonstrate a consistent pattern where built-up area expansion, population growth, and economic development all transitioned from positive to negative correlations with PM2.5 concentration changes between the two study periods. This systematic shift aligns fundamentally with the EKC hypothesis, which postulates an inverted U-shaped relationship between economic development and environmental degradation. In the early stages of economic development, as the economy continues to grow, environmental pollution problems often worsen. However, in the advanced stages of economic development, economic growth can improve environmental pollution problems. To quantitatively validate this pattern, we fitted PM2.5 concentrations with three factors of built-up area, population size, and GDP, with results presented in Table 4, and an EKC model was established with reference to these indicators.
The fitted curves for three urbanization factors exhibit distinct inverted U-shaped relationships with PM2.5 concentrations, as clearly demonstrated in Figure 10. The consistent patterns offer robust empirical support for the EKC hypothesis within developmental context in Guangdong Province. Each curve reveals: (I) an initial upward trajectory where urban expansion correlated with worsening air quality, (II) a defined inflection point marking the transition to improved environmental performance, and (III) a subsequent downward trend where continued urbanization is associated with PM2.5 reduction.
EKC analysis revealed an inflection point between PM2.5 concentration and built-up area at 3668 km2, urban expansion post-2005 ceased to exhibit a positive correlation with PM2.5 pollution, which can be attributed to improved urban planning. It heightened environmental awareness, where subsequent land development incorporated more green spaces and environmental protection infrastructure, such as, the air quality monitoring network facility for the Guangdong Hong Kong Macao Pearl River Delta region, which was launched in 2014, reduced the annual average PM2.5 concentration in the Pearl River Delta from 47 μg/m3 to 32 μg/m3 from 2013 to 2018. Accurate traceability helps optimize emission reduction strategies, ultimately contributing to PM2.5 reduction. Regarding population dynamics, the EKC inflection point occurred at 102.25 million inhabitants. Population growth paradoxically correlated with decreasing PM2.5 levels after 2009, which may reflect demographic transitions toward more environmentally conscious behaviors and the adoption of sustainable lifestyles among educated populations, For example, the promotion of liquefied petroleum gas (LPG) and biogas as alternatives to traditional firewood in rural areas of eastern and western Guangdong resulted in a 66% decrease in PM 2.5 emissions from rural residents energy consumption from 2006 to 2017. The GDP-related EKC inflection point emerged at CNY 43,500 (2009 constant prices), marking 2009 as the peak year for negative environmental impact from economic growth. Subsequent economic expansion coincided with PM2.5 improvement, suggesting that industrial restructuring, environmental technology advancements, and policy interventions effectively decoupled economic growth from pollution. These findings robustly support the EKC theory across all three examined dimensions (urban expansion, demographic changes, and economic development), providing valuable insights for formulating green development strategies. Specifically, they demonstrate that targeted urban planning, population education, and sustainable economic policies can effectively mitigate PM2.5 pollution.

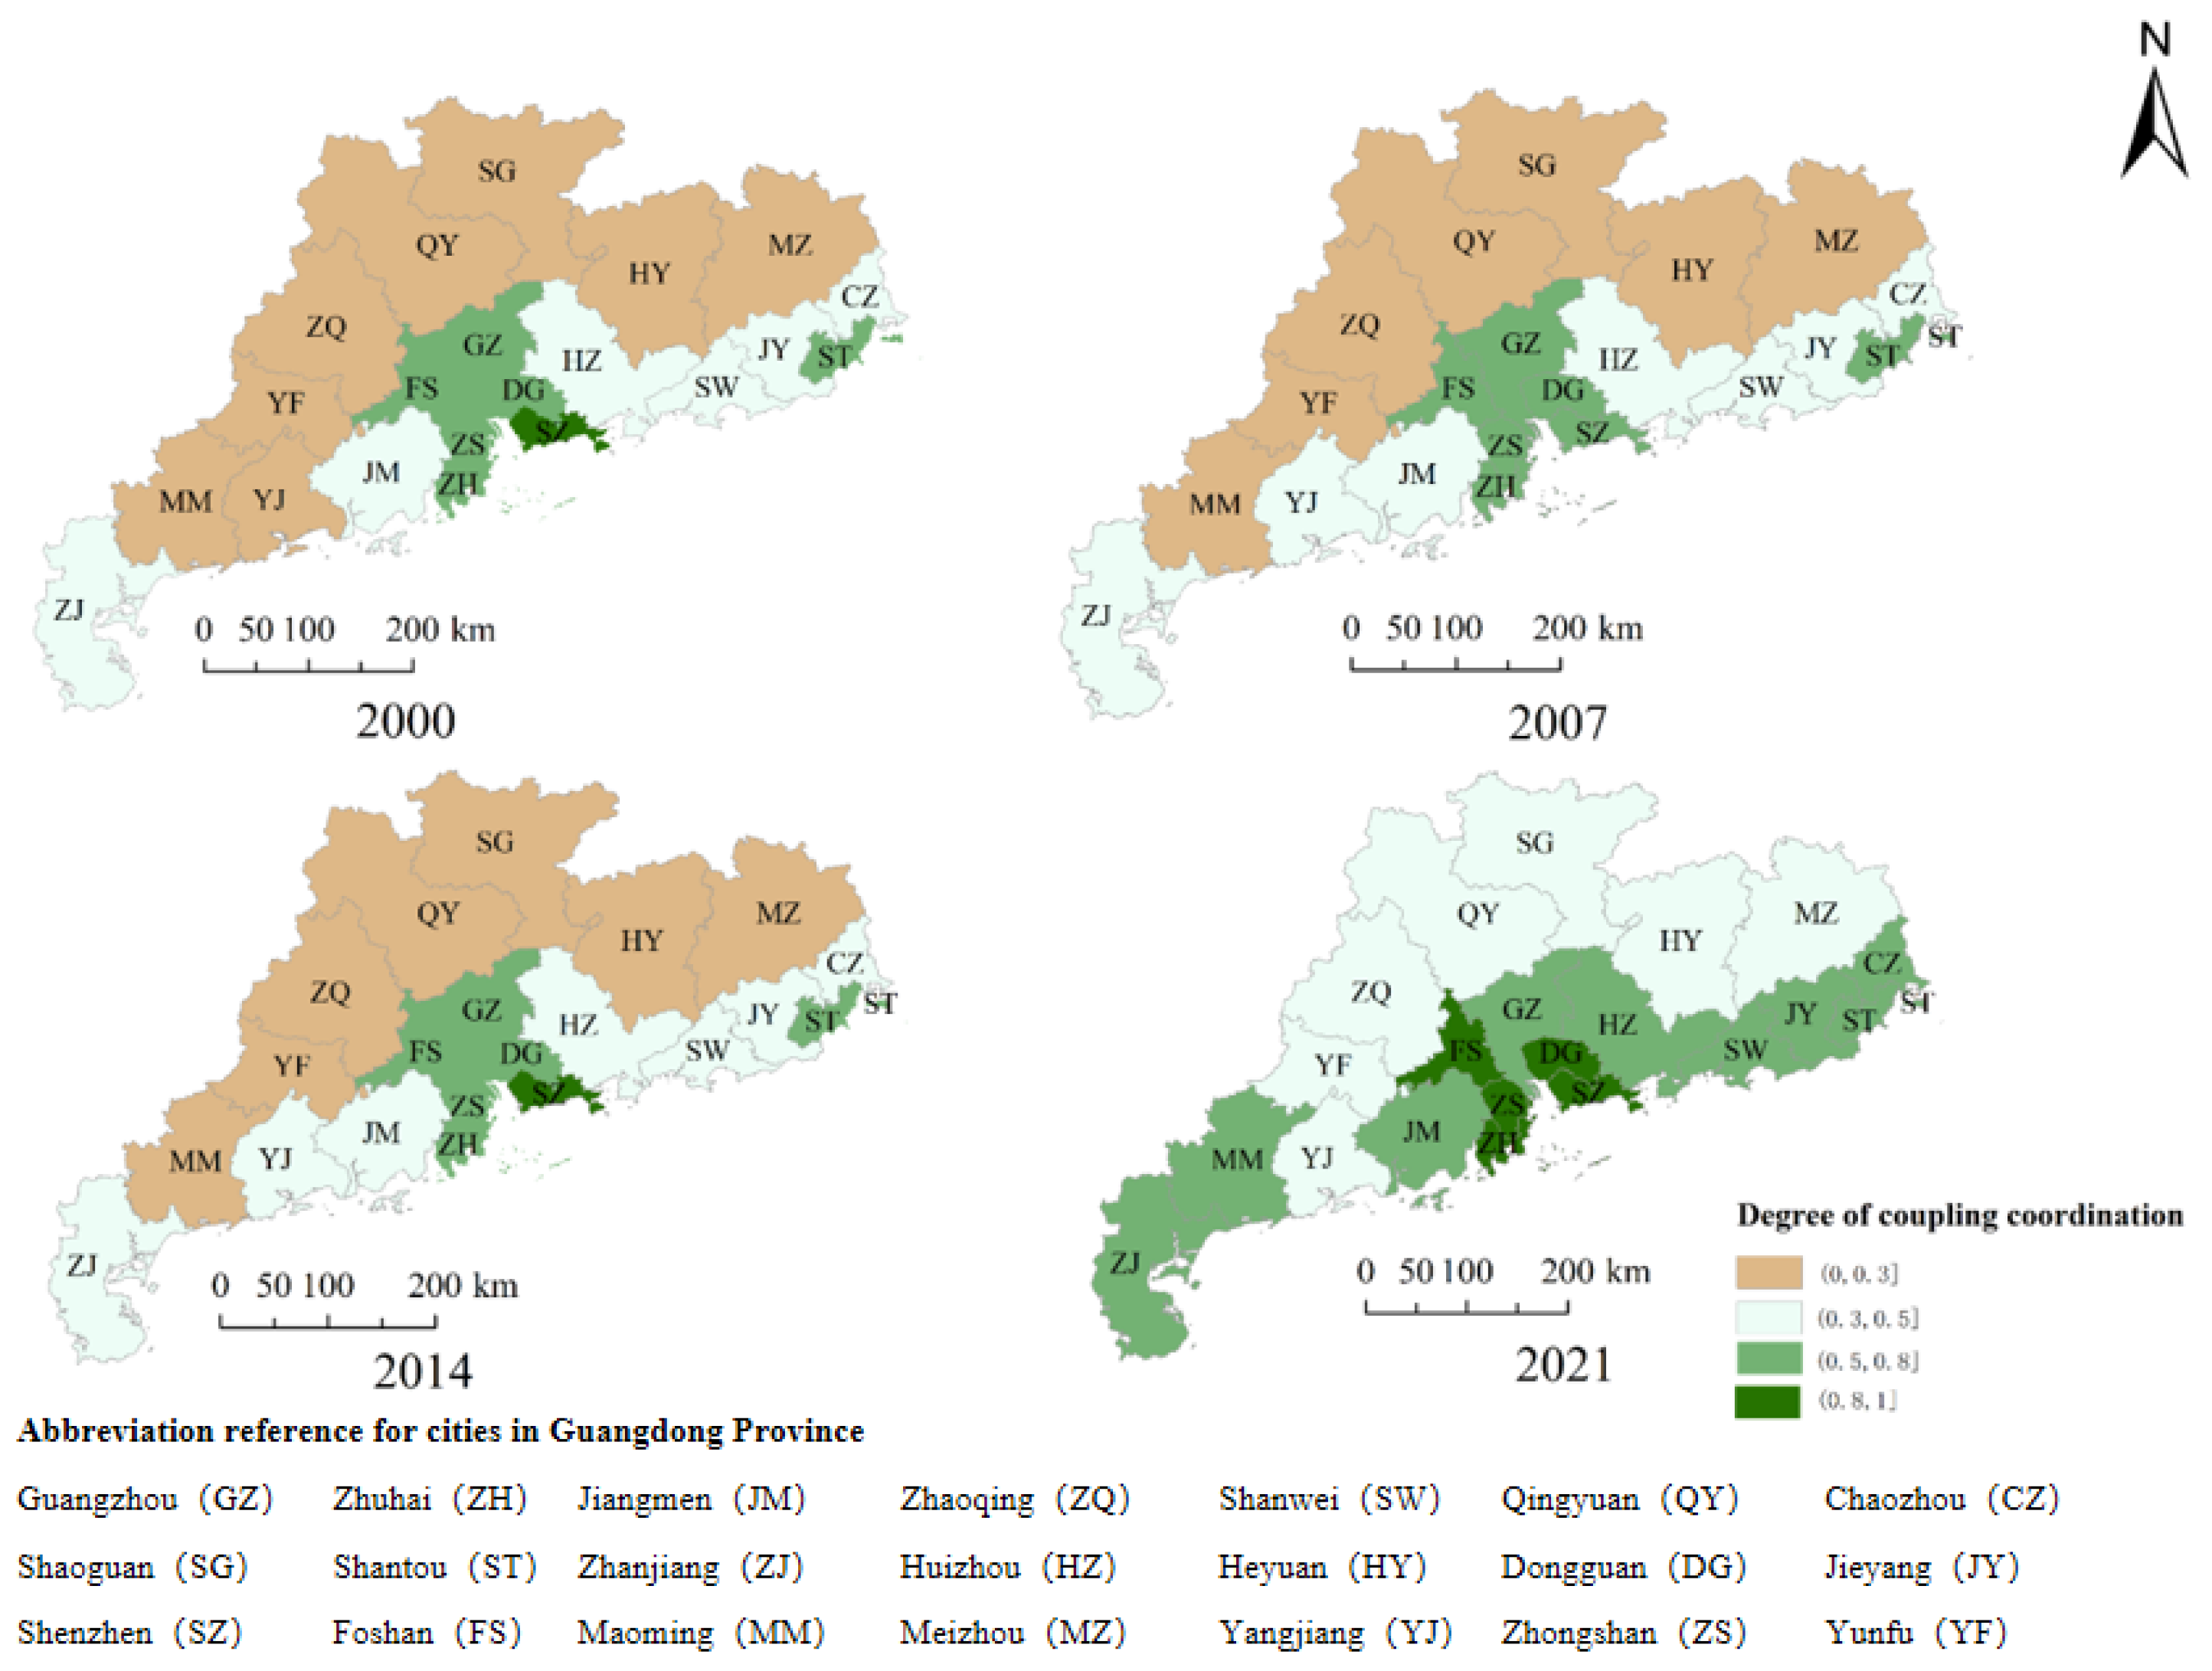
3.3. Evaluation of the Coupling Coordination Degree Between PM2.5 and Urbanization Level

The Environmental Kuznets Curve (EKC) describes an inverted U-shaped relationship between environmental pollution and per capita income: pollution initially rises with economic growth, peaks at a certain income level, and then declines as income continues to increase.
The increasingly complex interplay between urbanization and ecological conditions necessitates a comprehensive, multifactor coupling coordination model to assess the relationship between urban development and PM2.5 concentrations. Traditional urbanization index systems, which rely on statistical data, are often inadequate for long-term coupling coordination analysis due to limitations in data continuity. This study confirms a strong correlation between the composite nighttime light index (CNLI) and conventional urbanization indices, demonstrating that CNLI can serve as a reliable proxy for urbanization monitoring. Based on this finding, we construct a coupling coordination degree (CCD) model using eq1 to quantify the interaction between urbanization and PM2.5 levels. The resulting coordination states are then classified according to the criteria outlined in Table 5, providing a systematic framework for evaluating sustainable urban development.
(I) Discordance Period: The overall level of urbanization remains relatively low, with sluggish developmental progress. The coupling and coordination among various elements of the urban system are significantly insufficient. The rapid growth of industrial economies at this stage often comes at the cost of high energy consumption and excessive pollutant emissions, leading to severe environmental degradation and a pronounced imbalance in system coordination.
(II) Transitional Phase: The rapid urbanization process has significantly increased pressure on the urban atmospheric environment, leading to progressively deteriorating air quality. In response, governments and enterprises have continuously intensified pollution control efforts, resulting in gradual improvements in atmospheric environmental quality.
(III) Advanced Coordination Phase: With the progressive refinement and implementation of atmospheric pollution emission control measures, air quality has demonstrated sustained improvement, leading to the mitigation of associated environmental conflicts and marked enhancement in environmental conditions.
As demonstrated in Figure 11, the coupling coordination between urbanization and PM2.5 pollution has exhibited significant improvement alongside urban development, with multiple cities successfully changing from discordance to transitional and advanced coordination phases. Spatial analysis reveals that high coupling coordination degree (CCD) clusters were initially concentrated in core Pearl River Delta (PRD) cities (Foshan, Dongguan, Shenzhen, Zhuhai, Zhongshan, and Guangzhou) and the atypical case of Shantou prior to 2014. By 2021, the spatial distribution of high-CCD zones expanded substantially, mainly distributed in the Pearl River Delta region and coastal cities, with emerging enhanced regional air quality management integration. Notable improvements are evidenced by empirical data: Guangzhou experienced an 89.13% reduction in annual haze days (a haze pollution day occurs when the average concentration of PM2.5 is above 75 micrograms per cubic meter and visibility is less than 5 km for more than six consecutive hours due to an increasing concentration of fine particulate matter in the air [68], from 36.8 days in 2014 to 4 days in 2021), while Foshan achieved a 45.08% decline in annual mean PM2.5 concentrations (from 45.58 μg/m3 to 23 μg/m3) over the same period.
As shown in Table 5, three key findings can be observed: (I) The coupling coordination relationship between urbanization levels and PM2.5 pollution in various cities has evolved from a discordance period to a transitional phase and then toward a coordinated stage, indicating the gradual mitigation of conflicts between urbanization and PM2.5 pollution in Guangdong Province. (II) The year 2011 marked an inflection point when cities in the discordance stage began to improve and slowly walked into the transitional phase, while by 2014, cities in the transitional phase started advancing toward coordination. (III) In terms of type, cities in the discordance period were almost exclusively characterized by constrained urbanization progress. During the transitional phase, air quality-lagging and basic coordination types began to emerge, though constrained urbanization remained dominant. After 2014, some cities progressed to the coordination stage, where the constrained urbanization type disappeared and was replaced mainly by air quality-constrained types. Cities at this stage exhibited relatively high urbanization levels, but slightly lagging air quality improvements.
Table 6 reveals significant spatial heterogeneity in the coupling coordination between urbanization and PM2.5 pollution across Guangdong Province, with coastal cities generally exhibiting higher coordination than inland regions. Economically underdeveloped areas (e.g., Jiangmen, Zhanjiang, and Zhaoqing) show low urbanization pressure and gradual coordination improvement, classified as urbanization-lagging types. Conversely, economically advanced cities (Guangzhou, Shenzhen, Foshan, etc.) have achieved basic-to-high coordination levels, though with divergent patterns: Zhuhai and Foshan attained high equilibrium, while Shenzhen, Dongguan, and Zhongshan remain unbalanced despite high coordination, necessitating enhanced PM2.5 control. Guangzhou and Shantou persist at basic coordination, requiring accelerated urbanization and pollution mitigation, respectively. These outcomes are underpinned by provincial PM2.5 reductions (e.g., Pearl River Delta: 47 to 27 μg/m3, 2013–2019) driven by rigid policy-innovation coupling; notably, the PM2.5 “one-vote veto” mechanism expanding accountability to 15 cities, dual-track industrial upgrades (eliminating 4132 coal-fired boilers, reducing coal use by 21.12% since 2012), and localized innovations like Foshan’s industrial digitalization (VOC emissions decline >40%) and Shenzhen’s 100% electrified public transport (mobile PM2.5 decline 20–30%). Regional synergy through the Guangdong-Hong Kong-Macao joint prevention network further bolstered coordination. Nevertheless, lagging manufacturing upgrades in eastern Guangdong (high-tech manufacturing: 11.8% vs. Zhuhai 31.6%) underscore persistent industry–environment coordination gaps, demanding integrated efforts for sustainable urbanization.

4. Conclusions

To assess the coupling and coordination between urbanization and PM2.5 pollution in Guangdong Province from 2000 to 2021, we constructed a composite urbanization index based on 19 urbanization factors. The Sen slope estimator and Mann–Kendall test confirmed a declining trend in PM2.5 concentrations, while spatial autocorrelation analysis revealed significant clustering patterns. The Pettitt test revealed that 2010 marked a significant turning point in the urbanization process of Guangdong Province. Our findings indicate that the interactions between land use, population, economic growth, and PM2.5 align with EKC hypothesis. We further identified inflection points where urbanization factors shift from positive to negative influences on PM2.5 levels. Using bivariate correlation and entropy weighting methods, we developed a comprehensive urbanization index system, which demonstrated a strong correlation with nighttime light data. By integrating these metrics, we established a coupled coordination degree model to evaluate the long-term dynamics of urbanization and PM2.5. Spatial analysis highlights pronounced heterogeneity in urbanization levels across Guangdong. The complex urbanization–PM2.5 relationship is evidenced by only Zhuhai and Foshan achieving high coordination by 2021, contrasting with other cities constrained by lagging urbanization or environmental pressures.

Supplementary Materials

The following supporting information can be downloaded at: https://www.mdpi.com/article/10.3390/su17156751/s1, Table S1: Preliminary selection results of the urbanization evaluation indicator system; Table S2: Pearson correlation coefficients among population urbanization indicators, Table S3: Correlation Matrix of Economic Urbanization Indicators, Table S4: Correlation Matrix of Land Urbanization Indicators, Table S5: Correlation Matrix of Social Urbanization Indicators, Table S6: Finalized Urbanization Evaluation Indicator System, Table S7: Weight Allocation of Urbanization Evaluation Indicators, Table S8: Comparison of City Counts Across Coupling Coordination Stages in Guangdong Province.

Author Contributions

Conceptualization, D.W. and Y.Y.; methodology, J.S. and Z.Z.; validation, J.S. and H.X.; formal analysis, Y.W.; investigation, Y.M. and Z.L.; resources, X.Y. and J.W.; data curation, J.S.; writing—original draft preparation, J.S., D.W. and Y.Y.; writing—review and editing, X.Y. and J.W.; visualization, J.S. and H.X.; supervision, J.W.; project administration, D.W.; funding acquisition, D.W., Y.Y. and J.W. All authors have read and agreed to the published version of the manuscript.

Funding

This work is funded by the National Natural Science Foundation of China (Grant No. 42401435), National Natural Science Foundation of China (42201413), Guangdong Provincial Science and Technology Program (2024B1212080004), and the Guangzhou Basic and Applied Basic Research Program (SL2024A04J01468).

Institutional Review Board Statement

Not applicable.

Informed Consent Statement

Not applicable.

Data Availability Statement

The data presented in this study are available on request from the corresponding author.

Conflicts of Interest

The authors declare no conflicts of interest.

References

  1. National Bureau of Statistics of China. Communiqué of the Seventh National Population Census (No. 5); National Bureau of Statistics of China: Beijing, China, 2021. [Google Scholar]
  2. National Bureau of Statistics of China. Wang Pingping: The Decline in the Total Population Has Narrowed, and the Quality of the Population Continues to Improve; National Bureau of Statistics of China: Beijing, China, 2025. [Google Scholar]
  3. Khor, N.J.K. World Cities Report 2022: Envisaging the Future of Cities; United Nations Human Settlements Programme (UN-Habitat): Nairobi, Kenya, 2022. [Google Scholar]
  4. Yan, G.; Zhang, P.; Yang, J.; Zhang, J.; Zhu, G.; Cao, Z.; Fan, J.; Liu, Z.; Wang, Y. Chemical characteristics and source apportionment of PM2.5 in a petrochemical city: Implications for primary and secondary carbonaceous component. J. Environ. Sci. 2021, 103, 322–335. [Google Scholar] [CrossRef] [PubMed]
  5. Pei, L.; Yan, Z.; Chen, D.; Miao, S. Climate variability or anthropogenic emissions: Which caused Beijing Haze? Environ. Res. Lett. 2020, 15, 034004. [Google Scholar] [CrossRef]
  6. Zhang, J.; Huang, X.; Li, J.; Chen, L.; Zhao, R.; Wang, R.; Sun, W.; Chen, C.; Su, Y.; Wang, F. Chemical composition, sources and evolution of PM2.5 during wintertime in the city cluster of southern Sichuan, China. Atmos. Pollut. Res. 2023, 14, 101635. [Google Scholar] [CrossRef]
  7. Yue, H.B.; He, C.Y.; Huang, Q.X.; Yin, D.; Bryan, B.A. Stronger policy required to substantially reduce deaths from PM pollution in China. Nat. Commun. 2020, 11, 1462. [Google Scholar] [CrossRef] [PubMed]
  8. Meng, J.C.; Han, W.C.; Yuan, C.; Yuan, L.L.; Li, W.Z. The capacity of human interventions to regulate PM2.5 concentration has substantially improved in China. Environ. Int. 2025, 195, 109251. [Google Scholar] [CrossRef] [PubMed]
  9. Ministry of Ecology and Environment of People’s Republic of China. The Ministry of Ecology and Environment Held a Regular Press Conference in February; Ministry of Ecology and Environment of People’s Republic of China: Beijing, China, 2021. [Google Scholar]
  10. State Council of the People’s Republic of China. Notice of the State Council on Issuing the Action Plan for Continuous Improvement of Air Quality; State Council of the People’s Republic of China: Beijing, China, 2023. [Google Scholar]
  11. Lv, T.; Wang, L.; Zhang, X.; Xie, H.; Lu, H.; Li, H.; Liu, W.; Zhang, Y. Coupling coordinated development and exploring its influencing factors in Nanchang, China: From the perspectives of land urbanization and population urbanization. Land 2019, 8, 178. [Google Scholar] [CrossRef]
  12. Chen, L.; Li, K.; Chen, S.; Wang, X.; Tang, L. Industrial activity, energy structure, and environmental pollution in China. Energy Econ. 2021, 104, 105633. [Google Scholar] [CrossRef]
  13. Wang, X.; Dong, F.; Pan, Y.; Liu, Y. Transport infrastructure, high-quality development and industrial pollution: Fresh evidence from China. Int. J. Environ. Res. Public Health 2022, 19, 9494. [Google Scholar] [CrossRef] [PubMed]
  14. Zhang, X.; Han, L.; Wei, H.; Tan, X.; Zhou, W.; Li, W.; Qian, Y. Linking urbanization and air quality together: A review and a perspective on the future sustainable urban development. J. Clean. Prod. 2022, 346, 130988. [Google Scholar] [CrossRef]
  15. Chen, X.; Gu, X.; Liu, P.; Wang, D.; Mumtaz, F.; Shi, S.; Liu, Q.; Zhan, Y. Impacts of inter-annual cropland changes on land surface temperature based on multi-temporal thermal infrared images. Infrared Phys. Technol. 2022, 122, 104081. [Google Scholar] [CrossRef]
  16. Ahmed, Z.; Asghar, M.M.; Malik, M.N.; Nawaz, K. Moving towards a sustainable environment: The dynamic linkage between natural resources, human capital, urbanization, economic growth, and ecological footprint in China. Resour. Policy 2020, 67, 101677. [Google Scholar] [CrossRef]
  17. Yi, Z.; Cao, X.; Qin, L. Evaluation of Socially and Culturally Coordinated Development in Cities of Yangtze River Economic Belt and Its Spatial Correlation. Land 2025, 14, 1226. [Google Scholar] [CrossRef]
  18. Cha, J.P.; Li, F.F.; Zheng, S.F.; Deng, Y.S. Assessment of county level urbanization with the consideration of coupling coordination among population-economy-space-society-green in the Lower Yellow River basin of China. Environ. Dev. Sustain. 2024. [Google Scholar] [CrossRef]
  19. Yang, C.; Zeng, W.; Yang, X. Coupling coordination evaluation and sustainable development pattern of geo-ecological environment and urbanization in Chongqing municipality, China. Sustain. Cities Soc. 2020, 61, 102271. [Google Scholar] [CrossRef]
  20. Feng, H.; Fu, J.; Li, H.; Liang, Y. Urbanization or “Townization”? Measuring the evolution of Urban Systems in modern China. China Econ. Rev. 2025, 90, 102368. [Google Scholar] [CrossRef]
  21. Shan, L.; Jiang, Y.H.; Liu, C.C.; Wang, Y.F.; Zhang, G.H.; Cui, X.F.; Li, F. Exploring the multi-dimensional coordination relationship between population urbanization and land urbanization based on the MDCE model: A case study of the Yangtze River Economic Belt, China. PLoS ONE 2021, 16, e0253898. [Google Scholar] [CrossRef] [PubMed]
  22. Zheng, Y.M.; Zhou, Q.; He, Y.R.; Wang, C.P.; Wang, X.R.; Wang, H.W. An Optimized Approach for Extracting Urban Land Based on Log-Transformed DMSP-OLS Nighttime Light, NDVI, and NDWI. Remote Sens. 2021, 13, 766. [Google Scholar] [CrossRef]
  23. Huang, S.; Yu, L.; Cai, D.; Zhu, J.; Liu, Z.; Zhang, Z.; Nie, Y.; Fraedrich, K. Driving mechanisms of urbanization: Evidence from geographical, climatic, social-economic and nighttime light data. Ecol. Indic. 2023, 148, 110046. [Google Scholar] [CrossRef]
  24. Chen, Z.; Yu, S.; You, X.; Yang, C.; Wang, C.; Lin, J.; Wu, W.; Yu, B. New nighttime light landscape metrics for analyzing urban-rural differentiation in economic development at township: A case study of Fujian province, China. Appl. Geogr. 2023, 150, 102841. [Google Scholar] [CrossRef]
  25. Li, F.; Liu, X.Y.; Liao, S.B.; Jia, P. The Modified Normalized Urban Area Composite Index: A Satelliate-Derived High-Resolution Index for Extracting Urban Areas. Remote Sens. 2021, 13, 2350. [Google Scholar] [CrossRef]
  26. Wang, Y.; Liu, Z.; He, C.; Xia, P.; Liu, Z.; Liu, H. Quantifying urbanization levels on the Tibetan Plateau with high-resolution nighttime light data. Geogr. Sustain. 2020, 1, 233–244. [Google Scholar] [CrossRef]
  27. Wang, J.; Liu, H.; Liu, H.; Huang, H. Spatiotemporal evolution of multiscale urbanization level in the Beijing-Tianjin-Hebei Region using the integration of DMSP/OLS and NPP/VIIRS night light datasets. Sustainability 2021, 13, 2000. [Google Scholar] [CrossRef]
  28. Arshad, K.; Hussain, N.; Ashraf, M.H.; Saleem, M.Z. Air pollution and climate change as grand challenges to sustainability. Sci. Total Environ. 2024, 928, 172370. [Google Scholar]
  29. Kosovac, A.; Pejic, D. Cities and the SDGs: A spotlight on urban settlements. In The Environment in Global Sustainability Governance; Bristol University Press: Bristol, UK, 2023; pp. 269–294. [Google Scholar]
  30. Sahoo, M.; Sethi, N. The dynamic impact of urbanization, structural transformation, and technological innovation on ecological footprint and PM2.5: Evidence from newly industrialized countries. Environ. Dev. Sustain. 2022, 24, 4244–4277. [Google Scholar] [CrossRef]
  31. Cui, L.; Weng, S.; Nadeem, A.M.; Rafique, M.Z.; Shahzad, U. Exploring the role of renewable energy, urbanization and structural change for environmental sustainability: Comparative analysis for practical implications. Renew. Energy 2022, 184, 215–224. [Google Scholar] [CrossRef]
  32. Hao, Y.; Zheng, S.; Zhao, M.; Wu, H.; Guo, Y.; Li, Y. Reexamining the relationships among urbanization, industrial structure, and environmental pollution in China—New evidence using the dynamic threshold panel model. Energy Rep. 2020, 6, 28–39. [Google Scholar] [CrossRef]
  33. Munsif, R.; Zubair, M.; Aziz, A.; Zafar, M.N. Industrial air emission pollution: Potential sources and sustainable mitigation. In Environmental Emissions; IntechOpen: London, UK, 2021. [Google Scholar]
  34. Saxena, V. Water Quality, Air Pollution, and Climate Change: Investigating the Environmental Impacts of Industrialization and Urbanization. Water Air Soil Pollut. 2025, 236, 73. [Google Scholar] [CrossRef]
  35. Padhiary, M.; Kumar, R. Assessing the environmental impacts of agriculture, industrial operations, and mining on agro-ecosystems. In Smart Internet of Things for Environment and Healthcare; Springer: Berlin/Heidelberg, Germany, 2024; pp. 107–126. [Google Scholar]
  36. Shi, K.; Wu, Y.; Li, L. Quantifying and evaluating the effect of urban expansion on the fine particulate matter (PM2.5) emissions from fossil fuel combustion in China. Ecol. Indic. 2021, 125, 107541. [Google Scholar] [CrossRef]
  37. Ul-Haq, Z.; Mehmood, U.; Tariq, S.; Mariam, A. Defining the role of renewable energy, economic growth, globalization, energy consumption, and population growth on PM2.5 concentration: Evidence from South Asian countries. Environ. Sci. Pollut. Res. 2023, 30, 40008–40017. [Google Scholar] [CrossRef] [PubMed]
  38. Huang, C.; Liu, K.; Zhou, L. Spatio-temporal trends and influencing factors of PM2.5 concentrations in urban agglomerations in China between 2000 and 2016. Environ. Sci. Pollut. Res. 2021, 28, 10988–11000. [Google Scholar] [CrossRef] [PubMed]
  39. Fu, Z.; Li, R. The contributions of socioeconomic indicators to global PM2.5 based on the hybrid method of spatial econometric model and geographical and temporal weighted regression. Sci. Total Environ. 2020, 703, 135481. [Google Scholar] [CrossRef] [PubMed]
  40. Deng, Y.; Yang, R. Influence mechanism of production-living-ecological space changes in the urbanization process of Guangdong Province, China. Land 2021, 10, 1357. [Google Scholar] [CrossRef]
  41. Zeng, F.; Ren, C.; Wang, W.; Zhou, L.; Dai, X.; Ma, W. Exploring PM2.5 and O3 disparities and synergies management through integrated natural and sociology-environmental drivers in the YRD. Air Qual. Atmos. Health 2025, 1–20. [Google Scholar] [CrossRef]
  42. Wei, J.; Li, Z.Q.; Lyapustin, A.; Sun, L.; Peng, Y.R.; Xue, W.H.; Su, T.N.; Cribb, M. Reconstructing 1-km-resolution high-quality PM data records from 2000 to 2018 in China: Spatiotemporal variations and policy implications. Remote Sens. Environ. 2021, 252, 112136. [Google Scholar] [CrossRef]
  43. Li, X.; Song, Y.; Liu, H.; Hou, X. Extraction of Urban Built-Up Areas Using Nighttime Light (NTL) and Multi-Source Data: A Case Study in Dalian City, China. Land 2023, 12, 495. [Google Scholar] [CrossRef]
  44. Huang, X.; Yang, J. The 30 m annual land cover datasets and its dynamics in China from 1985 to 2022. Earth Syst. Sci. Data 2023, 13, 3907–3925. [Google Scholar]
  45. Ran, H.F.; Zhang, F.; Chan, N.W.; Tan, M.L.; Kung, H.T.; Shi, J.C. New Composite Nighttime Light Index (NCNTL): A New Index for Urbanization Evaluation Research. IEEE J. Sel. Top. Appl. Earth Obs. Remote Sens. 2023, 16, 3418–3434. [Google Scholar] [CrossRef]
  46. Tang, P.; Huang, J.; Zhou, H.; Wang, H.; Huang, W.; Huang, X.; Yuan, Y. The spatiotemporal evolution of urbanization of the countries along the Belt and Road Initiative using the compounded night light index. Arab. J. Geosci. 2021, 14, 1677. [Google Scholar] [CrossRef]
  47. Zheng, Y.; Tang, L.; Wang, H. An improved approach for monitoring urban built-up areas by combining NPP-VIIRS nighttime light, NDVI, NDWI, and NDBI. J. Clean. Prod. 2021, 328, 129488. [Google Scholar] [CrossRef]
  48. Andries, A.; Morse, S.; Murphy, R.J.; Sadhukhan, J.; Martinez-Hernandez, E.; Amezcua-Allieri, M.A.; Aburto, J. Potential of using night-time light to proxy social indicators for sustainable development. Remote Sens. 2023, 15, 1209. [Google Scholar] [CrossRef]
  49. Qiao, Z.; Xu, X.; Wang, X.; Zhang, Y. Comprehensive Evaluation of Urban Renewal Based on Entropy and TOPSIS Method: A Case of Shandong Province. J. Contemp. Urban Aff. 2025, 9, 1–15. [Google Scholar] [CrossRef]
  50. Aswad, F.K.; Yousif, A.A.; Ibrahim, S.A. Trend analysis using Mann-Kendall and Sen’s slope estimator test for annual and monthly rainfall for Sinjar district, Iraq. J. Duhok Univ. 2020, 23, 501–508. [Google Scholar] [CrossRef]
  51. Agarwal, S.; Suchithra, A.; Singh, S.P. Analysis and interpretation of rainfall trend using Mann-Kendall’s and Sen’s slope method. Indian J. Ecol. 2021, 48, 453–457. [Google Scholar]
  52. Garba, H.; Udokpoh, U.U. Analysis of trend in meteorological and hydrological time-series using Mann-Kendall and Sen’s slope estimator statistical test in Akwa Ibom state, Nigeria. Int. J. Environ. Clim. Change 2023, 13, 1017–1035. [Google Scholar] [CrossRef]
  53. Liu, X. Effects of Urban Density and City Size on Haze Pollution in China: Spatial Regression Analysis Based on 253 Prefecture-Level Cities PM2.5 Data. Discret. Dyn. Nat. Soc. 2019, 2019, 6754704. [Google Scholar] [CrossRef]
  54. Chen, Y. Spatial autocorrelation equation based on Moran’s index. Sci. Rep. 2023, 13, 19296. [Google Scholar] [CrossRef] [PubMed]
  55. Wang, Y.; Lv, W.; Wang, M.; Chen, X.; Li, Y. Application of improved Moran’s I in the evaluation of urban spatial development. Spat. Stat. 2023, 54, 100736. [Google Scholar] [CrossRef]
  56. Chen, Y. An analytical process of spatial autocorrelation functions based on Moran’s index. PLoS ONE 2021, 16, e0249589. [Google Scholar] [CrossRef] [PubMed]
  57. Conte, L.C.; Bayer, D.M.; Bayer, F.M. Bootstrap Pettitt test for detecting change points in hydroclimatological data: Case study of Itaipu Hydroelectric Plant, Brazil. Hydrol. Sci. J. 2019, 64, 1312–1326. [Google Scholar] [CrossRef]
  58. Hu, Y.; Yang, C.; Liang, Z.; Luo, X.; Huang, Y.; Tang, C. A Non-Parametric Approach for Change-Point Detection of Multi-Parameters in Time-Series Data. J. Environ. Inform. 2023, 42, 65–74. [Google Scholar] [CrossRef]
  59. Militino, A.F.; Moradi, M.; Ugarte, M.D. On the performances of trend and change-point detection methods for remote sensing data. Remote Sens. 2020, 12, 1008. [Google Scholar] [CrossRef]
  60. Magazzino, C.; Gallegati, M.; Giri, F. The Environmental Kuznets Curve in a long-term perspective: Parametric vs semi-parametric models. Environ. Impact Assess. Rev. 2023, 98, 106973. [Google Scholar] [CrossRef]
  61. Şentürk, H.; Omay, T.; Yildirim, J.; Köse, N. Environmental Kuznets curve: Non-linear panel regression analysis. Environ. Model. Assess. 2020, 25, 633–651. [Google Scholar] [CrossRef]
  62. Isik, C.; Ongan, S.; Ozdemir, D.; Ahmad, M.; Irfan, M.; Alvarado, R.; Ongan, A. The increases and decreases of the environment Kuznets curve (EKC) for 8 OECD countries. Environ. Sci. Pollut. Res. 2021, 28, 28535–28543. [Google Scholar] [CrossRef] [PubMed]
  63. Cheikh, N.B.; Zaied, Y.B.; Chevallier, J. On the nonlinear relationship between energy use and CO2 emissions within an EKC framework: Evidence from panel smooth transition regression in the MENA region. Res. Int. Bus. Financ. 2021, 55, 101331. [Google Scholar] [CrossRef]
  64. Mahmood, H.; Furqan, M.; Hassan, M.S.; Rej, S. The environmental Kuznets Curve (EKC) hypothesis in China: A review. Sustainability 2023, 15, 6110. [Google Scholar] [CrossRef]
  65. Li, X.; Lu, Z.; Hou, Y.; Zhao, G.; Zhang, L. The coupling coordination degree between urbanization and air environment in the Beijing (Jing)-Tianjin (Jin)-Hebei (Ji) urban agglomeration. Ecol. Indic. 2022, 137, 108787. [Google Scholar] [CrossRef]
  66. GB 3095-2012; Ambient Air Quality Standards. Ministry of Ecology and Environment of the People’s Republic of China: Beijing, China, 2016.
  67. Liu, Z.; Fang, C.; Sun, B.; Liao, X. Governance matters: Urban expansion, environmental regulation, and PM2.5 pollution. Sci. Total Environ. 2023, 876, 162788. [Google Scholar] [CrossRef] [PubMed]
  68. Website, C.d. The Ministry of Environmental Protection Defines “Haze Pollution Day”. 2014. Available online: https://np.china-embassy.gov.cn/eng/News/201405/t20140515_1584207.htm (accessed on 25 March 2025).
Figure 1. Corrected nonzero image element DN values (a) and the total number of nonzero image elements (b).
Sustainability 17 06751 g001
Figure 2. Workflow of the methodology.
Sustainability 17 06751 g002
Figure 3. Results of the correlation analysis between the comprehensive urbanization level and the composite nighttime light index, including 2007 (a), 2014 (b) and 2021 (c).
Sustainability 17 06751 g003
Figure 4. Evolution of annual PM2.5 concentration in Guangdong Province from 2000 to 2021.
Sustainability 17 06751 g004
Figure 5. Significance of PM2.5 concentration spatial variation in Guangdong Province from 2000 to 2021.
Sustainability 17 06751 g005
Figure 6. Frequency Statistics of Sudden Changes in Total Nighttime Light Value (TNLI) and Average Nighttime Light Index (ANLI) in Years.
Sustainability 17 06751 g006
Figure 7. Relationship between changes in built-up area and PM2.5 concentration in Guangdong province, (a) periods from 2000 to 2010; (b) periods from 2010 to 2021.
Sustainability 17 06751 g007
Figure 8. Changes in population size in Guangdong Province in relation to PM2.5 concentration, (a) periods from 2000 to 2010; (b) periods from 2010 to 2021.
Sustainability 17 06751 g008
Figure 9. Relationship between changes in GDP and PM2.5 concentration in Guangdong Province, (a) periods from 2000 to 2010; (b) periods from 2010 to 2021.
Sustainability 17 06751 g009
Figure 10. PM2.5 concentration and fitting curves of (a) built-up area, (b) GDP and (c) population size from 2000 to 2021.
Sustainability 17 06751 g010
Figure 11. Spatial distribution of coupling coordination in Guangdong Province from 2000 to 2021.
Sustainability 17 06751 g011
Table 1. Built-up area extraction accuracy validation.
YearStatistical Value/km2Extracted Value/km2Inaccuracies
2000176415989.41%
2010461847983.90%
2021658370877.66%
Table 2. Summary of methods used in this study.
MethodUse
Composite nighttime light intensity index [45,46,47,48]Extracting urban built-up areas to reveal differences in urbanization levels
Entropy (physics) [49]Quantifying the multifactor contribution to the urbanization level score
Sen slope estimation and Mann–Kendall nonparametric test uses [50,51,52]Detecting PM2.5 trends
Moran’s I Index [53,54,55,56]Reflecting spatial correlations and differences in PM2.5 status
Pettitt change point detection [57,58,59]Detecting sudden changes in light intensity at night
EKC panel regression model [60,61,62,63]Describing the relevance of the economy to the environment and its patterns of change
Table 3. Results of global spatial autocorrelation analysis.
Year2000200720142021
Moran’s I0.70.770.80.703
ZAll greater than 2.58
P0.01 level, significant correlation
Table 4. Parameters of the equation for fitting PM2.5 concentrations to the elemental indicators.
Key Constituent β 1 β 2 ε i t R 2
Built-up area1.7 × 10−2−2.3 × 10−610.7210.902
Size of population6.63 × 10−6−3.244 × 10⁻¹⁴−297.5030.862
GDP2.87 × 10−4−3.2969 × 10−933.3010.799
Table 5. Urbanization and PM2.5 Concentration Coupling Coordination Typing.
TypeDSubcategorySubtypeState
Discordance period(0,0.3]Severe discordanceg(E) − f(U) > 0.1Severe developmental imbalance, urbanization process obstruction
f(U) − g(E) > 0.1Severe developmental imbalance, atmospheric environment deterioration
0 ≤ |f(U) − g(E)| ≤ 0.1Severe imbalance between urbanization and atmospheric environment development
(0.3,0.5]Elementary discordanceg(E) − f(U) > 0.1Slightly imbalanced development with constrained urbanization progress
f(U) − g(E) > 0.1Mild developmental imbalance with deteriorated air environment
0 ≤ |f(U) − g(E)| ≤ 0.1Slight imbalance between urbanization and air environment development
Transitional phase(0.5,0.8]Primary coordinationg(E) − f(U) > 0.1Marginally balanced development with lagging urbanization
f(U) − g(E) > 0.1Marginally balanced development with lagging air environment
0 ≤ |f(U) − g(E)| ≤ 0.1Marginally balanced development between urbanization and air environment
Primary coordination(0.8,1]Advanced coordinationg(E) − f(U) > 0.1Highly balanced development with lagging urbanization
f(U) − g(E) > 0.1Hyper-balanced development with lagging air environment
0 ≤ |f(U) − g(E)| ≤ 0.1Exceptional balanced development between urbanization and air environment
f(U)—Urbanization Subsystem, g(E)—PM2.5 Concentration Subsystem.
Table 6. Comparison of coupled coordination models between PM2.5 concentrations and urbanization across cities.
Year2000200720142021
City
GuangzhouPrimary Coordination—Urbanization LagPrimary Balanced CoordinationPrimary Coordination—Urbanization Lag
ShaoguanSevere Discordance—Urbanization LagElementary Discordance—Urbanization Lag
ShenzhenPrimary Coordination—Air Quality LagAdvanced Coordination—Air Quality Lag
ZhuhaiPrimary Coordination—Urbanization LagPrimary Balanced CoordinationAdvanced Balanced Coordination
ShantouPrimary Balanced CoordinationPrimary Coordination—Air Quality Lag
FoshanPrimary Coordination—Urbanization LagPrimary Coordination—Air Quality LagAdvanced Balanced Coordination
JiangmenElementary Discordance—Urbanization LagPrimary Coordination—Urbanization Lag
Zhanjiang
MaomingSevere Discordance—Urbanization Lag
ZhaoqingElementary Discordance—Urbanization Lag
Meizhou
HuizhouElementary Discordance—Urbanization LagPrimary Coordination—Urbanization Lag
Shanwei
HeyuanSevere Discordance—Urbanization LagElementary Discordance—Urbanization Lag
YangjiangSevere Discordance—Urbanization LagElementary Discordance—Urbanization Lag
QingyuanSevere Discordance—Urbanization Lag
DongguanPrimary Coordination—Air Quality LagPrimary Coordination—Air Quality LagAdvanced Coordination—Air Quality Lag
ZhongshanPrimary Coordination—Urbanization Lag
ChaozhouElementary Discordance—Urbanization LagPrimary Coordination—Urbanization Lag
Jieyang
YunfuSevere Discordance—Urbanization LagElementary Discordance—Urbanization Lag
Legend for Table Colors
Severe DiscordanceSevere Discordance—Urbanization Lag
Elementary DiscordanceElementary Discordance—Urbanization Lag
Primary CoordinationPrimary Balanced Coordination
Primary Coordination—Urbanization Lag
Primary Coordination—Air Quality Lag
Advanced CoordinationAdvanced Balanced Coordination
Advanced Coordination—Air Quality Lag
Disclaimer/Publisher’s Note: The statements, opinions and data contained in all publications are solely those of the individual author(s) and contributor(s) and not of MDPI and/or the editor(s). MDPI and/or the editor(s) disclaim responsibility for any injury to people or property resulting from any ideas, methods, instructions or products referred to in the content.

