Article

Quantifying the Geopark Contribution to the Village Development Index Using Machine Learning—A Deep Learning Approach: A Case Study in Gunung Sewu UNESCO Global Geopark, Indonesia

1
Study Program of Regional and Rural Development Planning, Graduate School, IPB University, 1, Bogor 16680, Indonesia
2
Department of Resources and Environmental Economics, Faculty of Economics and Management, IPB University, 2, Bogor 16680, Indonesia
3
Division of Regional Development Planning, Department of Soil Science and Land Resources, Faculty of Agriculture, IPB University, 3, Bogor 16680, Indonesia
4
Department of Forest Resource Conservation and Ecotourism, Faculty of Forestry and Environment, IPB University, 4, Bogor 16680, Indonesia
*
Author to whom correspondence should be addressed.
Sustainability 2025, 17(15), 6707; https://doi.org/10.3390/su17156707
Submission received: 8 June 2025 / Revised: 14 July 2025 / Accepted: 16 July 2025 / Published: 23 July 2025
(This article belongs to the Special Issue GeoHeritage and Geodiversity in the Natural Heritage: Geoparks)

Abstract

The Gunung Sewu UNESCO Global Geopark (GSUGGp) is one of Indonesia’s 12 UNESCO-designated geoparks. Its presence is expected to enhance rural development by boosting the local economy through tourism. However, there is a lack of statistical evidence quantifying the economic benefits of geopark development, mainly due to the complex, non-linear nature of these impacts and limited village-level economic data available in Indonesia. To address this gap, this study aims to measure how socio-economic and environmental factors contribute to the Village Development Index (VDI) within the GSUGGp area, which includes the districts of Gunung Kidul, Wonogiri, and Pacitan. A machine learning–deep learning approach was employed, utilizing four algorithms grouped into eight models, with hyperparameter tuning and cross-validation, tested on a sample of 92 villages. The analysis revealed insights into how 17 independent variables influence the VDI. The Artificial Neural Network (ANN) algorithm outperformed others, achieving an R-squared of 0.76 and an RMSE of 0.040, surpassing random forest, CART, SVM, and linear models. Economically related factors—considered the foundation of rural development—had the strongest impact on village progress within GSUGGp. Additionally, features related to tourism, especially beach tourism linked to geological landscapes, contributed significantly. These findings are valuable for guiding geopark management and policy decisions, emphasizing the importance of integrated strategies and strong cooperation among local governments at the regency and provincial levels.

1. Introduction

Sustainable development has evolved from a mere concept to a strategic goal as required by international agreements to ensure the future well-being of humanity and the planet [1]. Geoparks play a vital role in advancing sustainable development across various dimensions. Environmentally, they focus on preserving geological, biological, and cultural heritage. Socially, they aid in reducing poverty, enhancing education, and promoting gender equality. Economically, they stimulate job creation, economic growth, and sustainable partnerships [2,3,4]. The UNESCO Global Geoparks (United Nations Educational, Scientific and Cultural Organization) designates karst areas for protection as geoparks through comprehensive assessment procedures [5].
In Indonesia, geoparks are spread throughout the archipelago and are managed under Presidential Regulation No. 9 of 2019 [6] and Ministerial Regulation of the Ministry of Energy and Mineral Resources No. 31 of 2021 [7]. These regulations define a geopark as a geographical area featuring geologically significant sites (geosites) and valuable landscapes linked to geoheritage, geodiversity, biodiversity, and cultural diversity. Geoparks are administered with the goals of conservation, education, and fostering sustainable local economies, prioritizing the involvement of local communities and regional governments. Indonesia has successfully established at least 12 geoparks recognized as UNESCO Global Geoparks.
The geopark concept emerged to address the increasing need for biodiversity protection, aiming to preserve Earth’s heritage while improving the social and economic conditions of local communities. This is accomplished by integrating these preservation efforts into sustainable regional development strategies through the renewable use of natural resources and ecosystem services, especially via geotourism and ecotourism initiatives [8,9,10,11].
Geologically, the Gunung Sewu UNESCO Global Geopark (GSUGGp) features a distinctive karst landscape that acts as a natural hydrological regulator and possesses significant scientific value. It is therefore classified as part of a geological protected area [12]. The functions and roles of karst landscapes can be categorized into six interconnected dimensions [13]:
  • Conservation Function: Emphasizes the protection of karst landscapes due to their ecological fragility and susceptibility to environmental degradation;
  • Geotourism and Educational Function: Highlights their geological uniqueness and aesthetic appeal, offering opportunities for sustainable tourism and environmental education;
  • Hydrogeological Function: Karst systems act as natural reservoirs for groundwater storage and release, crucial for regional water regulation;
  • Biodiversity Support Function: Hosts unique microbiological communities and cave ecosystems, enhancing ecological diversity;
  • Cultural and Archaeological Function: Many karst caves contain prehistoric artifacts, providing insights into early human civilization;
  • Disaster and Climate Mitigation Function: Karst areas serve as natural carbon sinks, contributing to climate regulation and risk reduction.
Studies indicate that water is a significant factor in designating geopark areas, with water-related features present in about 53% of geoparks worldwide [14]. Because karst areas primarily regulate hydrology, they are often preserved as conservation zones, deterring residential and other developments to prevent environmental degradation and protect their ecological and geological functions [15].
In Indonesia, the use of geopark areas is primarily focused on geotourism, leveraging natural geological features such as caves, rivers, and unique landforms. This strategy aims to deliver economic benefits to local communities and rural regions. The tourism sector has become a cornerstone of socio-economic progress, facilitating economic growth, maintaining exchange rate stability, and enhancing international trade. Additionally, it acts as a strategic catalyst for sustainable development, aligning with both national development goals and international sustainability frameworks [16,17].
While economic growth is vital for improving societal living standards, empirical evidence reveals that it can also exacerbate climate change, degrade natural resources, and reduce biodiversity [18]. Therefore, the geopark framework in Indonesia is designed to integrate economic growth with social development and environmental stewardship, adhering to the principles of the green economy [19].
The Gunung Sewu UNESCO Global Geopark (GSUGGp) is one of Indonesia’s successful geoparks, delivering measurable benefits in economic, social, and environmental realms. Its ongoing UNESCO Global Geopark “green card” status attests to its sustained adherence to global standards and its positive influence on communities within the Gunung Kidul, Wonogiri, and Pacitan regencies. According to the 2023 Village Development Index by the Ministry of Villages, Development of Disadvantaged Regions, and Transmigration of Indonesia, the districts containing geosites in the GSUGGp area show varied development levels. Subdistricts in Gunung Kidul Regency, Yogyakarta, range from “Developed” to “Independent”, whereas those in Wonogiri Regency (Central Java) and Pacitan Regency (East Java) are mainly classified as “Developed”. This variation indicates an uneven path toward regional self-reliance within the GSUGGp area. Hence, a more thorough assessment is necessary to evaluate the geopark’s contribution to regional development, especially at the village level.
To date, machine learning (ML) and deep learning (DL) approaches have proven to be highly effective tools for quantifying socio-economic benefits at both global and regional levels [20,21,22,23]. ML and DL algorithms are non-linear models that often outperform traditional linear methods, demonstrating higher accuracy and predictive performance [24,25,26,27]. In fact, DL models frequently achieve accuracy rates exceeding 80%, significantly surpassing other analytical techniques [28]. ML, as a branch of artificial intelligence (AI), enables algorithms to recognize and predict specific patterns within large datasets across various fields [29,30,31]. Meanwhile, DL, a subset of ML, processes data through multi-layer neural networks to learn and extract highly complex, large-scale patterns [32,33]. In the economic context, ML and DL are crucial for analyzing how regional complexities influence economic value [23,34]. However, their application in economics remains relatively limited, predominantly focusing on environmental quality assessments. For example, in geopark studies, ML-DL techniques have been employed to analyze satellite data for mapping land-use quality within geopark landscapes [35,36,37,38].
This study addresses the limited understanding of how UNESCO’s global geopark designation impacts the Village Development Index (VDI) within the Gunung Sewu karst landscape, which spans three regencies across three provinces. The potential of ML and DL techniques to evaluate regional policy impacts offers promising avenues for robust analysis of complex socio-economic data [39,40,41]. Particularly, regional development initiatives led by both regency and provincial governments play a vital role in advancing the GSUGGp. To understand the long-term effects of geopark designation, a comprehensive assessment of the economic contributions at the village level is necessary, taking into account the socio-economic characteristics of rural communities. Such insights are essential for guiding spatial planning and regional development strategies, especially those aligned with the GSUGGp’s objectives. Given the significance for the three local governments involved, this research aims to quantify how the GSUGGp influences the VDI of villages within the geopark using a combination of Geographic Information System (GIS) approaches and ML-DL-based quantification methods.

2. Literature Review of Geopark Indicator

According to UNESCO, a geopark is a defined geographic area with clear boundaries that is recognized for its scientific importance. It features unique natural characteristics, outstanding aesthetic value, and geological heritage that are intricately connected to the surrounding ecological and cultural environments [42]. The management of geoparks relies on three core functions: preserving natural heritage, promoting education, and supporting economic development—each aligned with the principles of sustainable development [43]. Geopark initiatives aim to protect geological and ecological resources, raise public awareness of geosciences, develop national scientific expertise, encourage sustainable tourism, and contribute to balanced social and economic growth [44]. Research indicates that to fulfill their role in sustainable development, geoparks need strategic actions involving geotourism and geoeducation [45]. These actions include conserving geological areas, which enhances the region’s appeal for sustainable tourism development [46].
The concept of geoparks, as a tool for promoting sustainable development in various countries—including Indonesia—continues to be mainly linked with tourism activities. Public perception often views geoparks simply as tourist attractions, despite their primary goal being the protection of geologically significant sites that offer crucial environmental functions and benefits. Although the success of geoparks in fostering economic growth is typically assessed at the regional or provincial level—reflecting broader administrative conditions—this approach may overlook the realities faced in rural areas. Most geosites in Indonesia are situated within village territories, making them integral to rural governance and requiring the involvement of multiple stakeholders in the processes of area exploration, evaluation, and designation as national or international geoparks.
To evaluate how geoparks contribute to regional development, especially at the village level, appropriate assessment indicators are necessary. In Indonesia, one such tool designed for measuring sustainable rural development is the Village Development Index (VDI). The VDI functions as a metric to assess the degree of village self-reliance and is officially governed by the Ministry of Villages, Development of Disadvantaged Regions, and Transmigration through Ministerial Regulation No. 2 of 2016 [47]. Known as the VDI, it was created to support national development goals and serves as a strategic instrument in government efforts to reduce underdevelopment in villages and foster their transition toward self-sufficiency. The VDI categorizes villages into five groups based on VDI threshold values: Very Underdeveloped Villages (Pratama) with VDI ≤ 0.4907; Underdeveloped Villages (Pra-Madya) with 0.4907 < VDI ≤ 0.5989; Developing Villages (Madya) with 0.5989 < VDI ≤ 0.7072; Advanced Villages (Pra-Sembada) with 0.7072 < VDI ≤ 0.8155; and Independent Villages (Sembada) with VDI ≥ 0.8155. This classification system enables targeted policy actions and resource distribution to promote inclusive and sustainable rural development.
The VDI is a composite measure derived from three key components: the social resilience index, the economic resilience index, and the environmental resilience index. Importantly, none of the variables within these components directly pertain to geopark aspects. The GSUGGp covers three regencies and three provinces: the Gunung Kidul Regency (Special Region of Yogyakarta), Wonogiri Regency (Central Java Province), and Pacitan Regency (East Java Province). According to the 2023 IDM data published by the Ministry of Villages, Development of Disadvantaged Regions, and Transmigration, districts with geosites within the GSUGGp area exhibit varying levels of development. Subdistricts in Gunung Kidul range from “Advanced” to “Independent,” while those in Wonogiri and Pacitan are mainly classified as “Advanced.” This variation indicates that progress toward regional self-sufficiency within the GSUGGp region is uneven. Consequently, a more detailed study is needed to evaluate the role of the geopark in regional development, especially at the village level.
Research on the VDI in Indonesia has generally remained limited to biophysical studies, such as geological characteristics, land use, and land cover change, and socio-economic aspects. To date, studies that integrate statistical methods based on ML to evaluate the impact of geopark designation on socio-economic conditions—particularly in the context of CDI assessment indicators—remain scarce. Previous studies have primarily applied non-parametric statistical algorithms, including ML and DL, for land cover mapping and temporal change detection [48,49,50]. However, assessments of the socio-economic impacts of geoparks continue to rely on descriptive approaches or other non-statistical methods. The use of non-statistical methods, descriptive approaches, and software-based policy evaluations is considered suboptimal for identifying the actual impact of geopark-related policy implementation on local areas. Therefore, it is essential to conduct studies that apply robust statistical methods to assess the influence of geoparks, particularly in the Indonesian context. Such assessments are strategically important for formulating policy recommendations aimed at strengthening geopark governance and enhancing socio-economic benefits for surrounding communities.

3. Materials and Methods
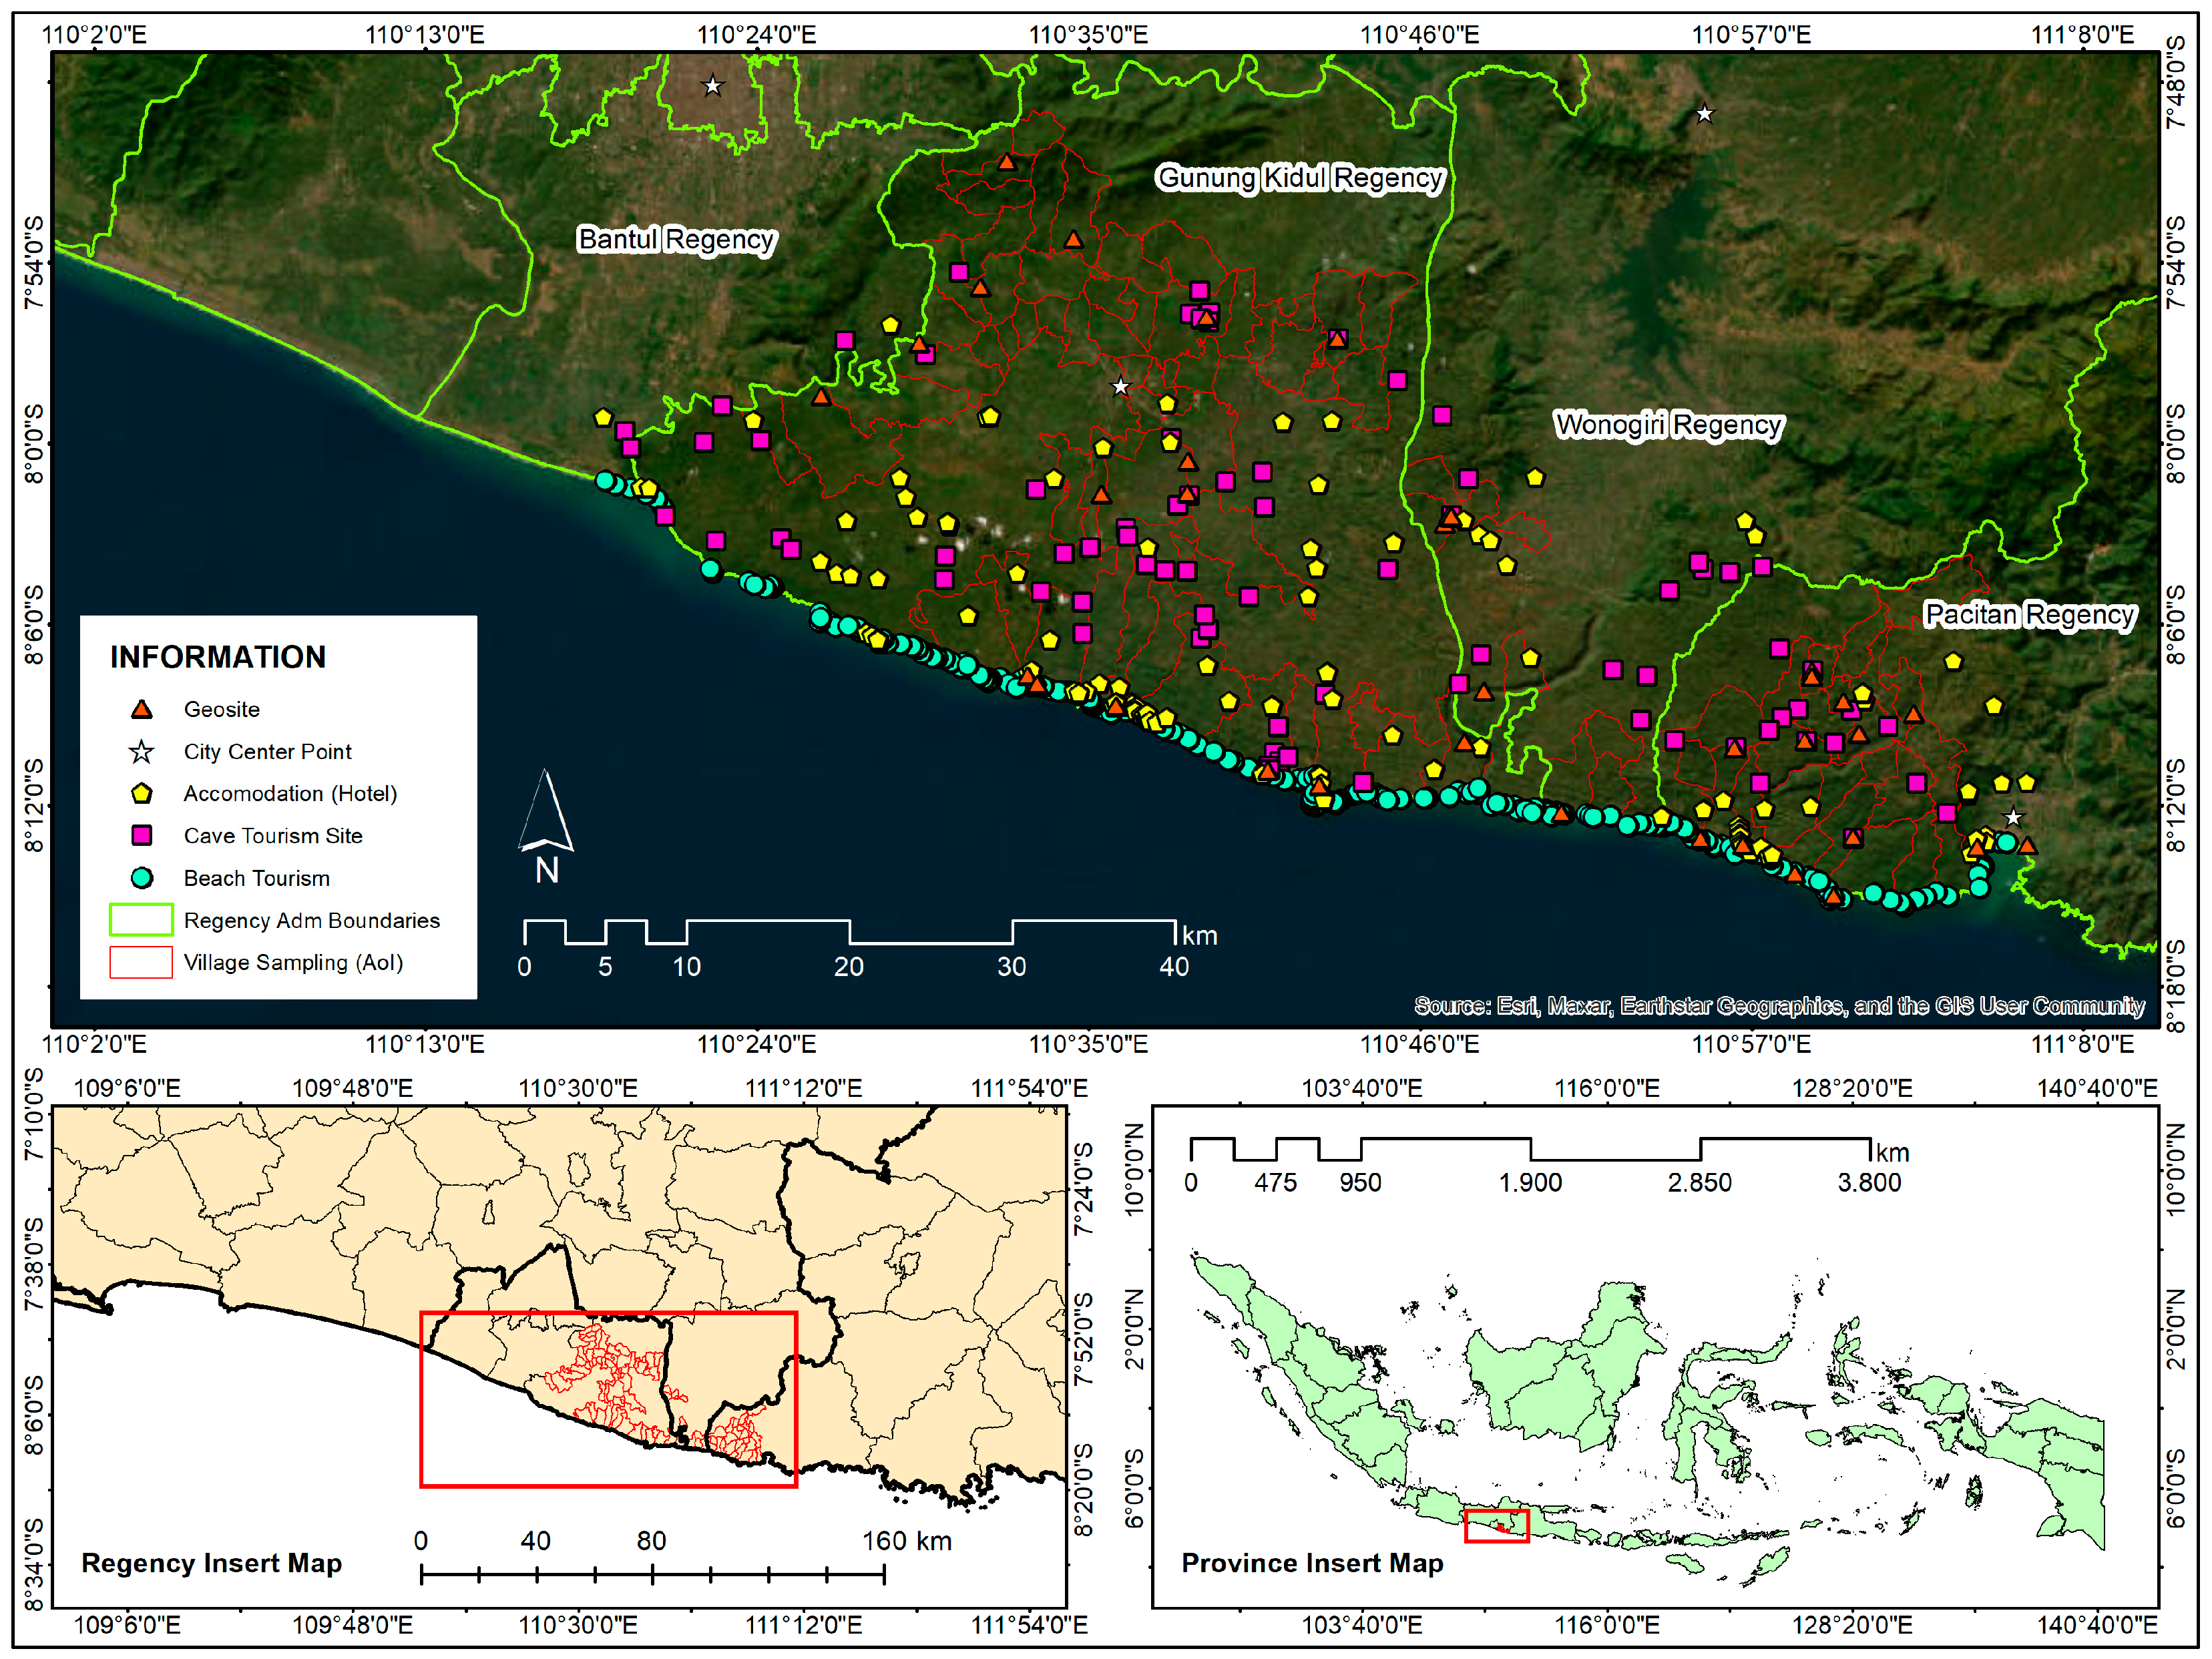
3.1. Study Area

This research was carried out within the GSUGGp region, one of Indonesia’s 12 geoparks designated as a UNESCO Global Geopark (see Figure 1). Administratively, the geopark covers three areas: Gunung Kidul Regency in Yogyakarta Province, Wonogiri Regency in Central Java Province, and Pacitan Regency in East Java Province. The GSUGGp includes around 92 villages, which constitute the Area of Interest (AoI) for this study.

3.2. Data Description

This study utilized various types of data collected from both primary and secondary sources (see Table 1). Primary data focused on public perceptions and were gathered directly from the field, while secondary data were obtained from multiple official sources. The primary data comprised insights on ecological, social, economic, institutional, and technological impacts, collected through interviews with 200 residents of the GSUGGp area. These respondents included both community members and key informants such as village officials and geopark management personnel, with 2–3 respondents from each village (refer to Table 2). Public perceptions were measured using a Likert scale ranging from 1 (very low/poor) to 5 (very high/good). The secondary data included spatial information—such as geopark and village boundaries—and details related to the biophysical environment and rural economy within the geopark area.
The Village Development Index (VDI) data used in this study are sourced from secondary data, specifically the annual datasets collected by the Indonesian Ministry of Villages. These data evaluate rural development levels, categorizing villages into five groups: Independent, Advanced, Developing, Underdeveloped, and Severely Underdeveloped [51,52]. The VDI score reflects multiple aspects of village conditions, including infrastructure and facilities, economic status, education, information technology, socio-cultural factors, and other relevant variables. The overall VDI value is composed of three main components: the social resilience index, the economic resilience index, and the ecological resilience index, together capturing the complex nature of rural development and resilience [52,53]. For this research, the 2024 VDI data from 92 villages across three regencies and provinces were analyzed. The variables contributing to the VDI were examined using machine learning (ML) and deep learning (DL) techniques to identify patterns and assess their impact on rural development levels.

3.3. Processing Data and Preprocessing Data

The data processing and statistical analysis for this study were primarily performed using RStudio (version 2021), an open-source platform, in conjunction with the R programming environment (version 4.5.0). Spatial data preprocessing was conducted using ArcMap 10.8. The workflow encompassed data collection (both primary and secondary), spatial data preprocessing, machine learning and deep learning modeling, and subsequent model and error evaluation (see Figure 2). Initially, village-level data were divided using a 70:30 split ratio, with 70% allocated for training and 30% for validation. This data partitioning was implemented entirely within R using the caTools package, minimizing user bias and ensuring an unbiased split [54].
To develop the model, the VDI was used as the dependent variable (Y), and 17 variables served as independent variables (X). These 17 variables were based on data from 92 villages included in this study. Of these, only 8 variables underwent spatial data preprocessing using Geographic Information System (GIS) techniques. The spatial variables—such as cave tourism sites, accommodation access, beach tourism sites, city center points, geosite access, and street stream networks—were derived through spatial analysis utilizing the Euclidean Distance (ED) feature, which measures the proximity between geographic features and each village centroid [55]. In ArcMap, the spatial variables were processed to calculate the mean ED values for each village.
Meanwhile, the air quality index (AQI) variable was obtained from the spatial distribution of air quality data, specifically carbon monoxide (CO) levels, using Near-Real-Time Information (NRTI) from the TROPOspheric Monitoring Instrument (TROPOMI) on the Sentinel-5 Precursor (S5P) satellite and processing in Google Earth Engine (GEE) platform. After preprocessing the imagery, the descriptive statistics for the 17 variables were as follows: VDI (0.82 ± 0.05); cave tourism site (0.02 ± 0.01); accommodation access (0.03 ± 0.02); beach tourism site (0.12 ± 0.08); city center point (0.12 ± 0.06); geosite access (0.02 ± 0.01); street stream (0.34 ± 0.22); public perception—ecology (1.96 ± 0.63); public perception—governance (2.56 ± 0.92); public perception—social (2.55 ± 0.66); public perception—economy (2.70 ± 0.92); public perception—education (2.27 ± 0.82); village fund (1,125,800.38 ± 338,673.58); AQI (0.02 ± 0.0005); tourism society group (0.47 ± 0.49); village tax revenue (39,452,307.04 ± 48,996,240.40); village retribution revenue (602,543,481.50 ± 467,527,174.70); and the number of geosites per village (0.27 ± 0.44) (Figure 3).

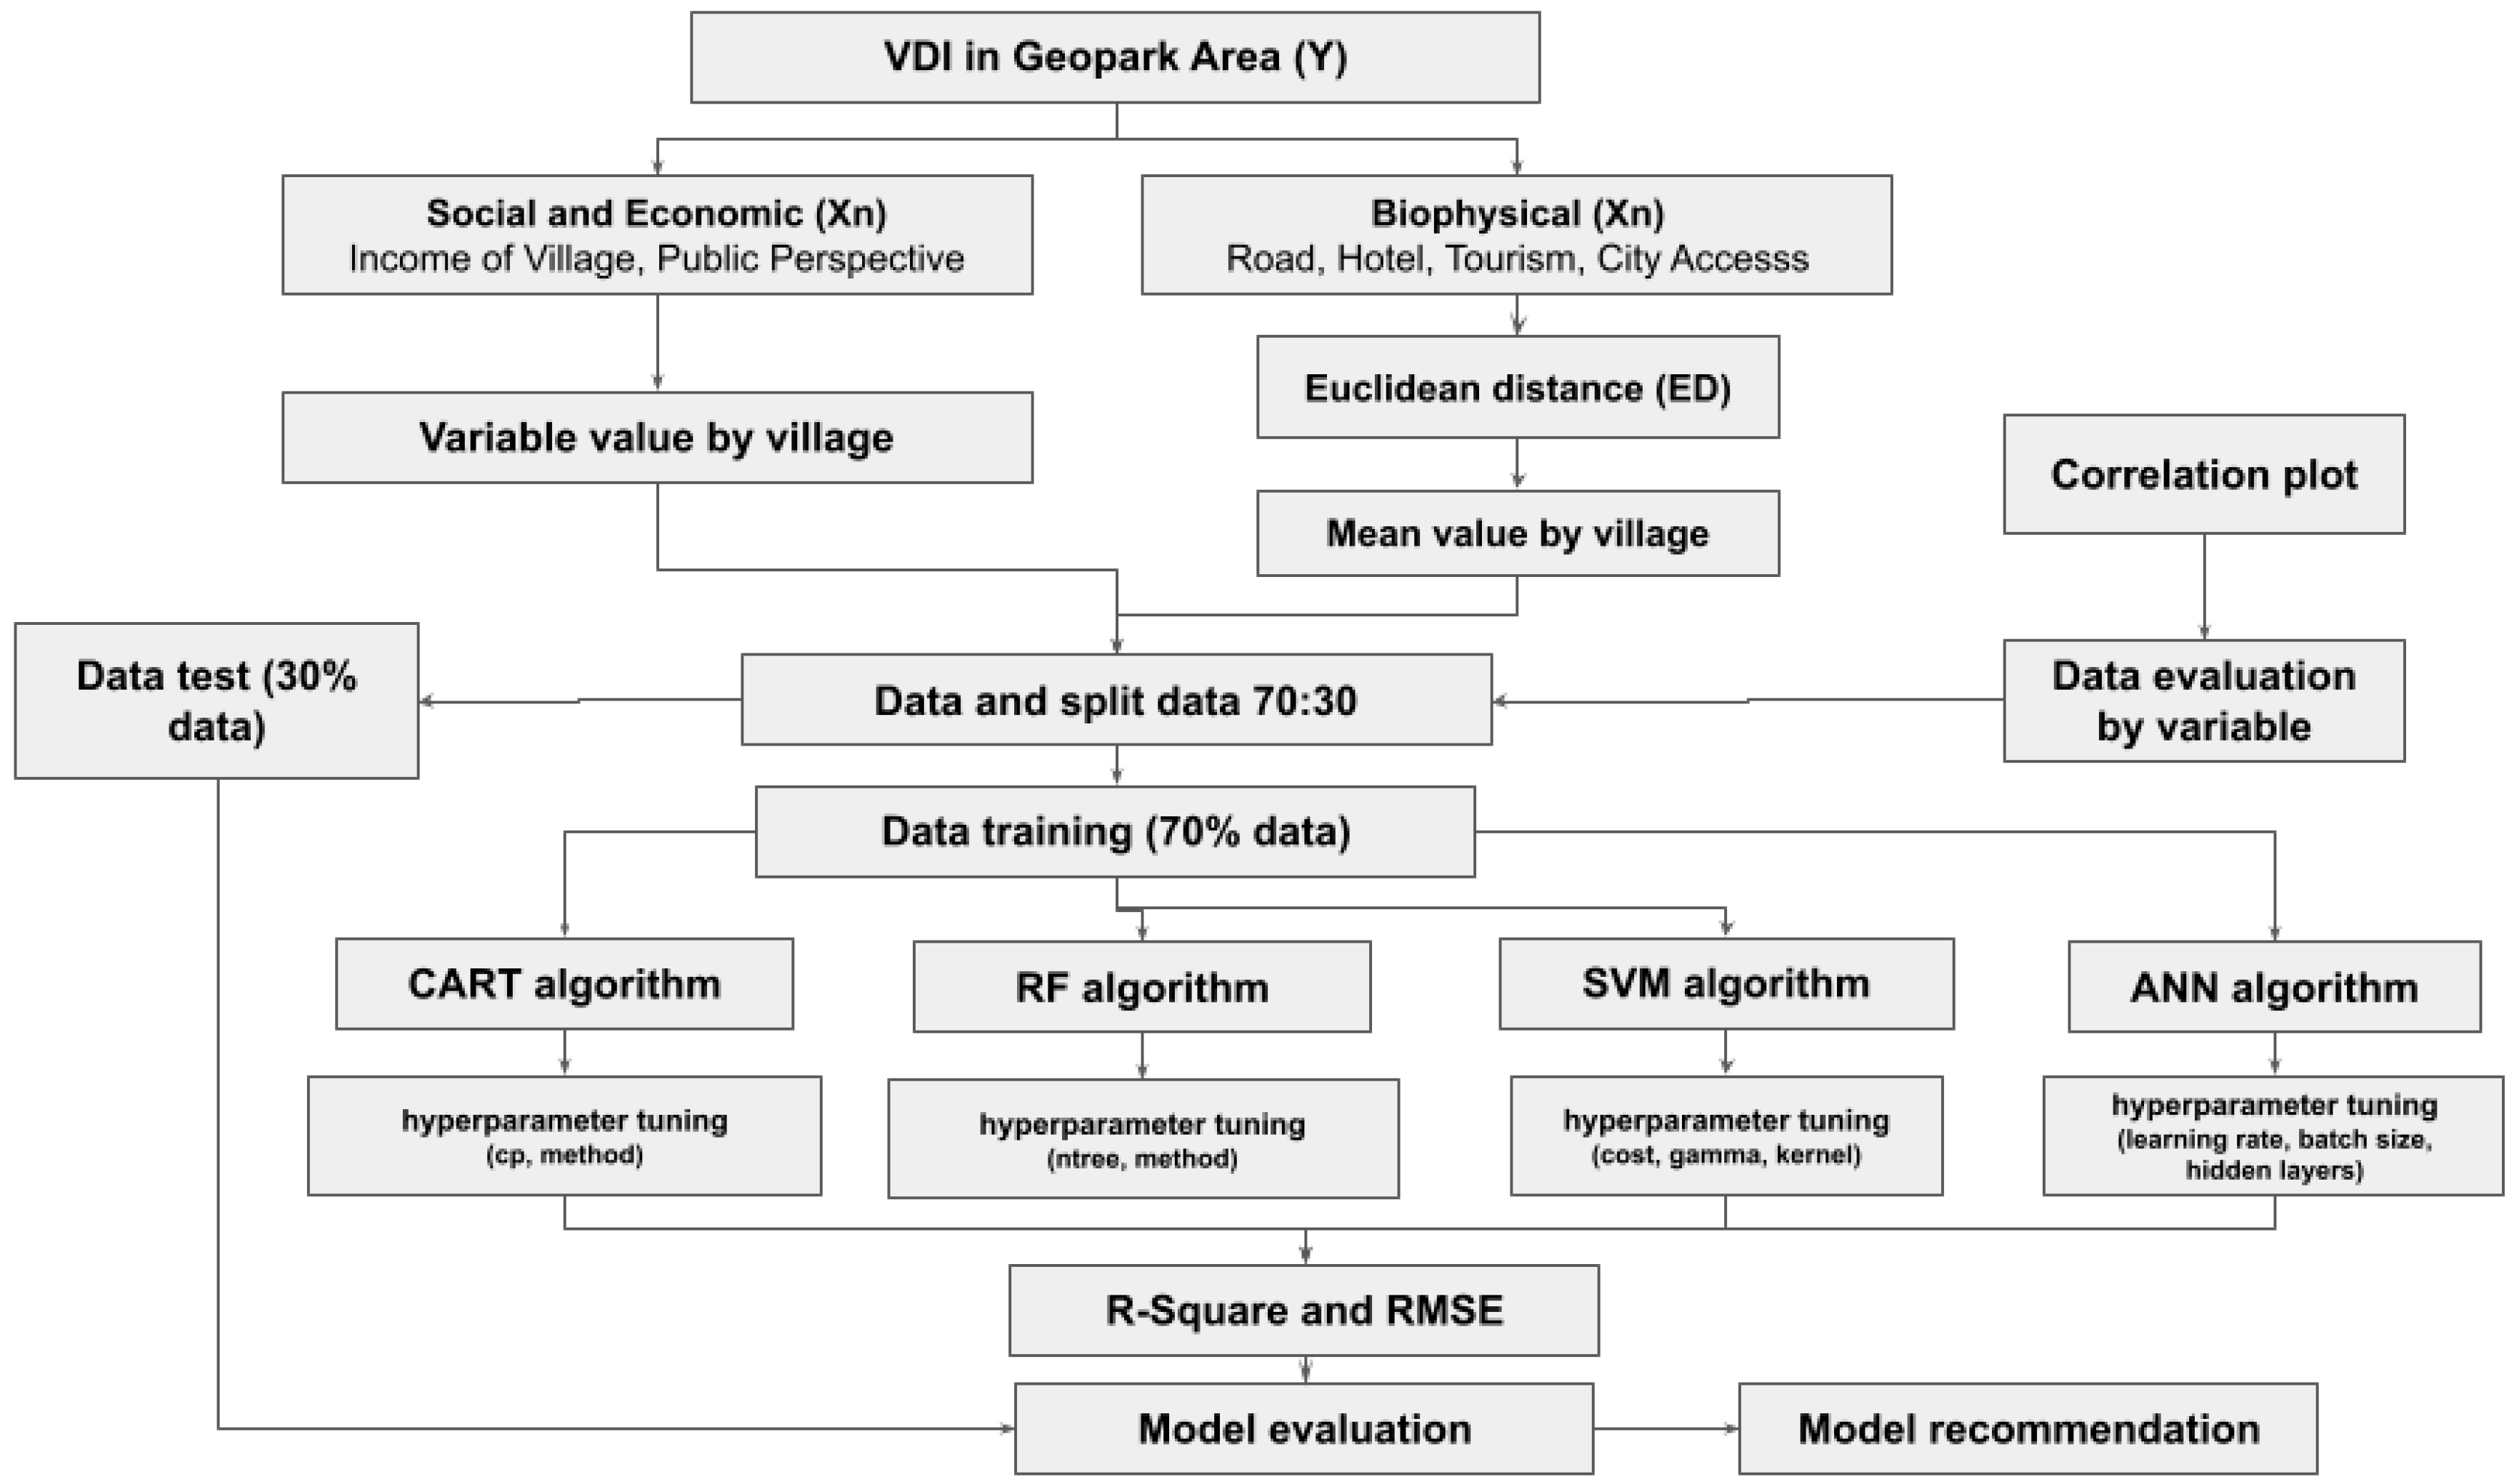
3.4. Machine Learning and Deep Learning Modeling

Data analysis was performed to evaluate the influence of socio-economic and territorial variables on the Village Development Index (VDI), employing both linear and non-linear modeling approaches. The linear model functioned as a baseline for comparison with more sophisticated non-linear models. Non-linear modeling proved particularly effective in capturing the complex, non-linear relationships observed within the dataset (see Figure 4). These models included machine learning (ML) and deep learning (DL) techniques. ML algorithms used were Classification and Regression Tree (CART), Random Forest (RF), and Support Vector Machine (SVM), while the deep learning approach utilized an Artificial Neural Network (ANN). All data processing and modeling were carried out within the RStudio environment, primarily using the caret package [56], which supports a broad array of ML and DL algorithms [57]. Model tuning and evaluation were performed via cross-validation methods available in caret, enhancing model robustness by optimizing hyperparameters according to the dataset’s characteristics [58,59]. This step is vital for understanding the data’s underlying structure and ensuring models are well-calibrated for generalizability [60,61]. In this study, cross-validation was configured with various parameters, including method, number of folds (k), and number of repeats (see Table 3). Hyperparameter tuning for each algorithm used a tuning length of 10, a common setting in non-linear predictive modeling and often set as a default [62,63].
The non-linear regression algorithm, CART, utilized in modeling VDI, is a machine learning method based on decision trees. Originally introduced by Breiman and colleagues in 1984, CART is well-known for its effectiveness in both prediction and classification tasks [68]. In this study, two derivative models of the CART algorithm were employed: the rpart model and the rpart2model. The CART algorithm was further optimized by tuning the complexity parameter (cp) through a grid search via the tuneGrid() function, alongside cross-validation for each model. These steps aimed to enhance model performance by selecting the best hyperparameters suited to the data characteristics [69,70]. The grid search tuning involved testing max depth values of 3, 25, and 1. A simplified representation of the CART model’s structure is shown in Equation (1).
G i n i p = 1 i = 1 N p 2 i
The non-linear Random Forest (RF) algorithm utilized in this study is a machine learning method based on an ensemble of decision trees [71,72]. RF can generate complex predictive outputs, mitigate overfitting in structured datasets, and improve model stability by averaging predictions across individual decision trees [73,74,75]. Originally developed by Breiman in 2001, the RF algorithm has been continuously enhanced through parameter tuning to optimize its performance and adaptability across diverse data types and analytical scenarios [76,77]. In this study, RF parameterization was carried out using the rf, ranger, and rborist packages within the RStudio environment, facilitated by the caret package [56]. Specifically, the number of trees (ntree) was set to 1,000 for all three RF models. Cross-validation was implemented via the trControl() function using the CV method, with a 20-fold cross-validation repeated five times. A simplified representation of the RF model’s structure is shown in Equation (2).
P c f = 1 n P n c f
The Support Vector Machine (SVM) algorithm was introduced by Vapnik in 1992 and has since evolved significantly, becoming a popular choice in predictive modeling due to its effectiveness in managing high-dimensional and non-linear data [78]. SVM is widely used in machine learning for its strong performance and high accuracy, especially when dealing with complex and large datasets [79]. The SVM operates by finding the optimal hyperplane that separates different classes of data points while maximizing the margin between them, based on distance and boundary principles [71,80]. Hyperparameters for the SVM were tuned by adjusting the kernel type, cost value, and gamma parameter. The kernel functions used included svmLinear and svmPoly, both available within the caret package in R [56]. The cost parameter (C) was varied between 0 and 30 using the tuneGrid() function. A simplified formula illustrating the structure of the SVM model is provided in Equation (3).
K x , y = 1 + j = 1 p x i j y i j d
The Artificial Neural Network (ANN) algorithm applied herein reflects an advanced form of deep learning that has experienced considerable evolution across various research disciplines. ANN is widely recognized for its superior predictive capabilities compared to conventional machine learning algorithms, particularly in modeling complex and non-linear relationships in large, high-dimensional datasets [81]. The Artificial Neural Network (ANN) follows an analytical framework structured with an input layer containing 17 explanatory variables, including a set of one or more hidden layers, followed by a final output layer. To optimize ANN performance, hyperparameter tuning is conducted on the hidden layer configuration, particularly by adjusting the number of neurons [82]. For the cross-validation setup in the ANN model, the configuration was implemented using the trControl() function with the method set to cv (cross-validation), specifying 20 folds and 5 repeats. In the R programming environment, the Artificial Neural Network (ANN) was implemented using the nnet package, version 7.3-20, released in 2025 [67]. Interpretation of the results from the ANN model was conducted using the plotnet function available in the corresponding package [83], which was employed to assess the model’s characteristics in predicting the VDI.
The applied Artificial Neural Network (ANN) algorithm represents an advanced form of deep learning that has undergone significant development across various research fields. Recognized for its superior predictive performance over traditional machine learning methods, ANN is especially effective in modeling complex, non-linear relationships within large, high-dimensional datasets [81]. The ANN architecture used in this study consists of an input layer with 17 explanatory variables, one or more hidden layers, and a final output layer. To enhance the model’s performance, hyperparameter tuning focused on optimizing the hidden layer configuration by adjusting the number of neurons [82]. For cross-validation, we employed the trControl() function with method set to cv (cross-validation), using 20 folds and 5 repeats. The ANN was implemented in the R environment using the nnet package, version 7.3-20, released in 2025 [67]. Model interpretation was conducted with the plotnet function from the same package, enabling visualization of the network’s structure and assessment of its predictive ability for the VDI.

3.5. Performance Measures

The performance of the ML-DL models was evaluated using the Variable Importance (VI) method [84,85]. VI scores were derived from the model testing and tuning procedures, which generated data variations specific to each variable. These variations formed the basis for assessing the contribution of each variable to the VDI within the study area. Different VI values emerged from the tuning results across the ML-DL models, allowing for the identification of the most stable and impactful variables in relation to overall model performance. The VI analysis was conducted using the model_parts() function from the DALEX package in R, which helps interpret model behavior and diagnose variable influence by partitioning the predictive contribution of each variable [86,87].

3.6. Error Evaluation

The results from the ML-DL analysis were evaluated through error analysis to determine the accuracy of the VDI projections. Model performance was assessed using two key quantitative metrics: R-squared and RMSE, which are provided by the caret package in R [56]. Both metrics were applied to all four tuned ML-DL models. The evaluation used the previously separated 30% test dataset (see Figure 2), ensuring no data leakage or duplication between training and testing phases.
R M S E = i = 1 N y i ŷ ( i ) 2 N
R 2 = b ^ 1 x y y 2

4. Results

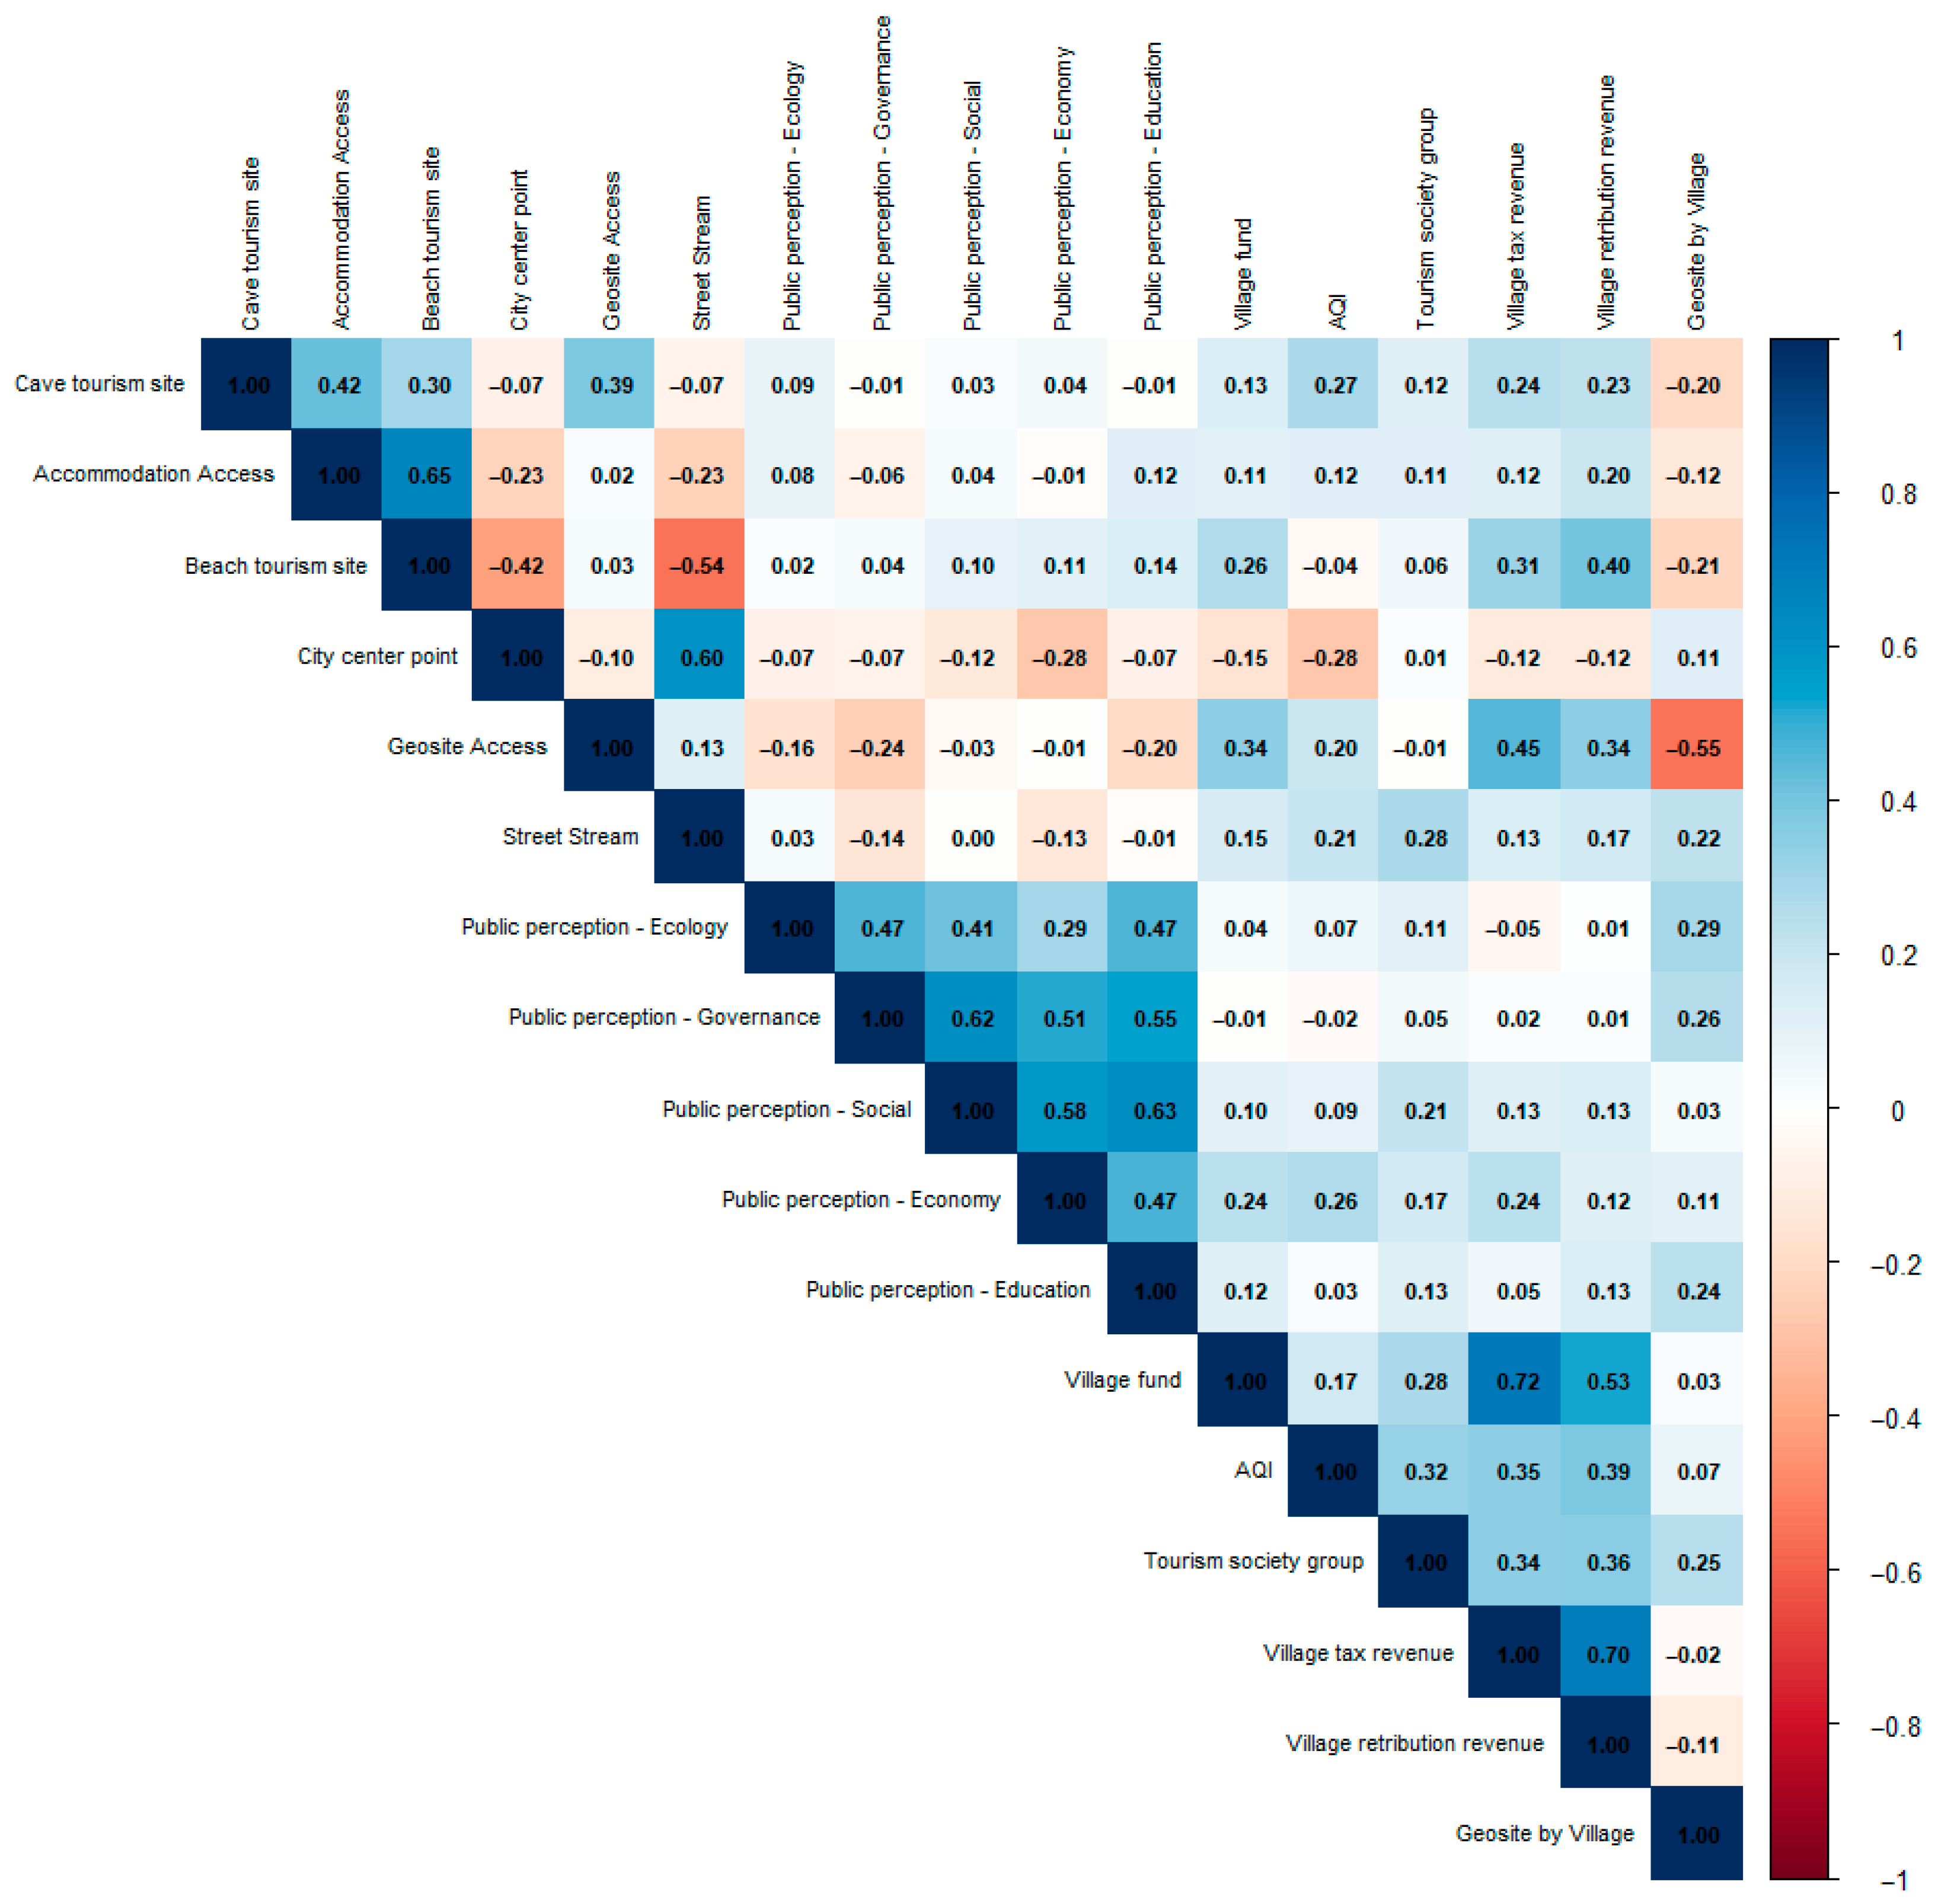
4.1. Constructing the Model

The ML-DL models evaluated in this study displayed diverse performance levels, with the best model achieving the highest coefficient of determination (R-squared) and the lowest RMSE (Figure 5). Out of the eight models tested, only the ANN utilizing the neuralnet algorithm provided a strong predictive performance, with an R-squared of 0.76 and an RMSE of 0.040. Conversely, the linear SVM model demonstrated the poorest results, with an R-squared of 0.54 and an RMSE of 0.06. The average R-squared across all models was 0.62, with only three algorithms surpassing this mean: ANN (neuralnet), CART (rpart), and Random Forest (rf and rborist). The overall mean RMSE was 0.05; models that outperformed this threshold included ANN (neuralnet) with the lowest RMSE, followed by CART-rpart (0.042), RF-rborist (0.043), RF-rf (0.044), and CART-rpart2 (0.045). All other models exhibited RMSE values above 0.05, indicating comparatively lower predictive accuracy.
Based on the distribution of hyperparameter tuning across all models and algorithms, the R-squared values displayed both stable and unstable patterns. Algorithms with consistent VDI prediction performance included CART (rpart2 model), Random Forest (rborist and rf models), and SVM (linear model). The Artificial Neural Network (ANN) demonstrated stable predictions, with R-squared values ranging from 63% to 77% (average: 70% ± 3%) and RMSE values between 0.042 and 0.052 (average: 0.045 ± 0.002). The top-performing ANN was achieved by tuning three layers using tuneGrid() within the range of 0 to 15. Conversely, some models showed less consistent R-squared distributions after hyperparameter tuning. Notably, CART-rpart (44–68%, mean: 66% ± 4%) and SVM-poly (46–59%, mean: 53% ± 3%) exhibited greater variability. Nonetheless, certain models maintained relatively stable R-squared metrics post-tuning, including CART-rpart2 (57–58%, mean: 58% ± 0.2%), RF-rborist (64–66%, mean: 65% ± 0.4%), RF-rf (63–65%, mean: 64% ± 0.4%), and SVM-linear (53–54%, mean: 54% ± 0.2%). Among these, CART-rpart showed the greatest variability, with R-squared values spanning from 44% to 68%, indicating moderate inconsistency in predictive performance.
The tuning process applied to the ANN algorithm produced a network structure with two hidden layers (see Figure 6). The model visualization, generated using the plotnet function, showed no apparent bias. The first hidden layer consisted of 10 neurons, and the second layer had 15 neurons. Variations in line color and thickness revealed differences in weight values between the input layer and the first hidden layer, highlighting the varying weights assigned to each independent variable.

4.2. Evaluation of Model

The optimal model was chosen by performing hyperparameter tuning on each ML-DL model. Using 70% of the 92 village-level data points for training, approximately 64 data points were used to generate VDI projections based on 17 independent variables. The tuned models exhibited a range of R-squared and RMSE values. As shown in Figure 7, the ANN model displayed a concentrated distribution of high R-squared and low RMSE values, indicating its superior and more consistent predictive performance relative to the other models.
Model evaluation was performed by analyzing the trends of RMSE and R-squared resulting from hyperparameter optimization in the ML-DL models. This involved increasing parameters such as cost in SVM, number of hidden layers in ANN, and ntree in RF, among others. Figure 8 presents the dynamic changes of RMSE and R-squared across different models after tuning. The results show that no single model consistently exhibited a decreasing RMSE coupled with a significant increase in R-squared. For instance, the CART-rpart model did not show notable improvements in R-squared or reductions in RMSE after optimization, indicating limited responsiveness to parameter adjustments. Conversely, the ANN model—identified as the top performer—displayed an increasing RMSE trend (R-squared < 0.01; p-value = 0.86) alongside an increasing R-squared trend (R-squared = 0.16; p-value = 0.10), suggesting moderate stability during tuning. Other models, such as all RF variants, SVM-linear, and CART-rpart2, showed deteriorating trends, with rising RMSE and declining R-squared, reflecting reduced performance with further parameter increases.

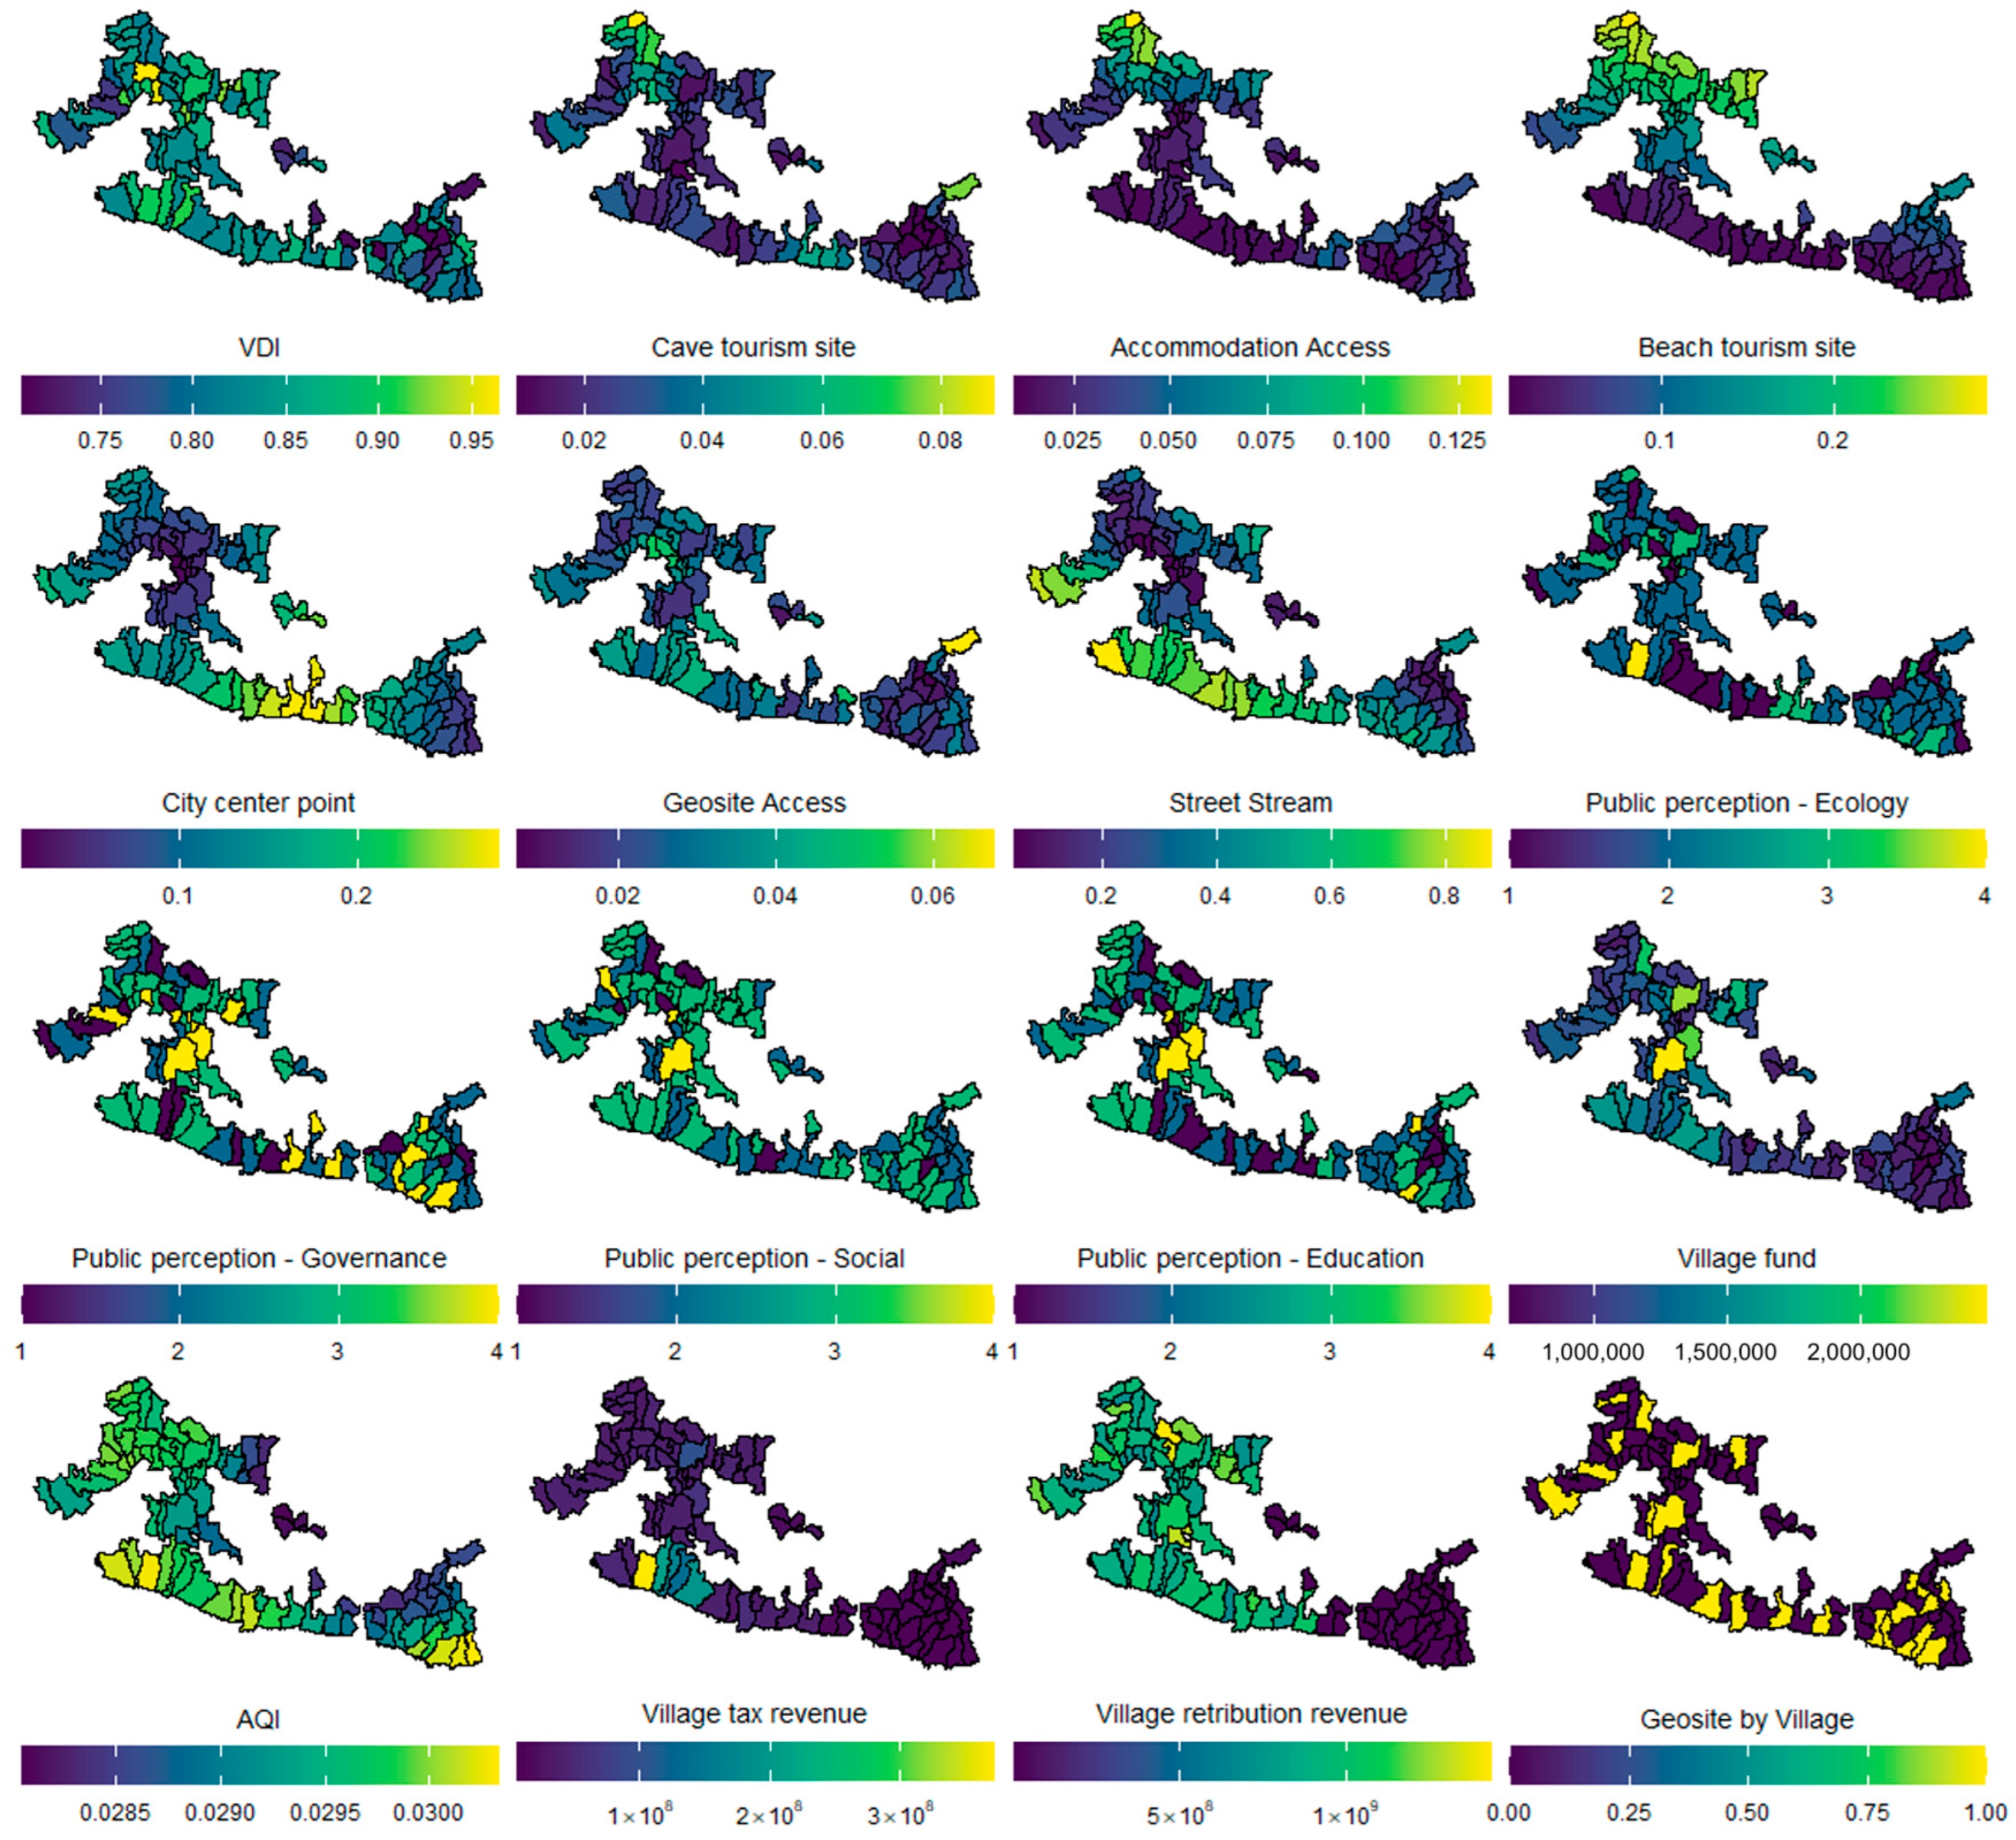
4.3. VDI Contribution in Geopark

The analysis of each independent variable’s contribution to predicting the Village Development Index (VDI) across various ML-DL models demonstrated both consistent and significant influences. As illustrated in Figure 9, the contribution magnitude differed among models. For example, the Artificial Neural Network (ANN) model exhibited an average variable contribution of 0.05 ± 0.005, while the Random Forest (RF) variants showed contributions of 0.024 ± 0.003 (RF-rf) and 0.022 ± 0.003 (RF-rborist). The RF-ranger model contributed approximately 0.024 ± 0.003, whereas the CART models (rpart and rpart2) both had contributions around 0.039 ± 0.004. Support Vector Machine (SVM) models recorded contributions of 0.049 ± 0.001 for the polynomial kernel and 0.048 ± 0.006 for the linear kernel. Among regional variables, economic indicators—such as village fund, village tax revenue, and village retribution revenue—consistently demonstrated the highest contributions, surpassing the average across all models. The street stream variable, particularly in the RF-rf model, was identified as a significant factor influencing VDI predictions, and it showed importance in RF, CART, and SVM models. Similarly, the presence of beach tourism sites was flagged as a critical variable in both the RF-rborist and SVM-linear models, underscoring its role as a vital geotourism feature within GSUGGp’s geological landscape.

5. Discussion

5.1. ML-DL Modeling and Performance

Machine learning (ML) and deep learning (DL) techniques have proven highly effective in predicting the influence of regional variables on the Village Development Index (VDI) within the GSUGGp. Despite working with a relatively small dataset of only 92 observations and 17 predictor variables, ML-DL models effectively captured the complex socio-economic and environmental factors impacting VDI. This success is largely due to advances in non-linear statistical modeling, which now accommodate small datasets across macro- and microeconomic applications [88]. The significance of the variables is demonstrated by the high R-squared value achieved with ML-DL models—up to 76% (Figure 5)—substantially exceeding the 54% explained by traditional linear models. Among the models evaluated, the Artificial Neural Network (ANN) achieved the highest R-squared and the lowest Root Mean Square Error (RMSE). Comparisons across other algorithms, such as Random Forest (RF), Classification and Regression Trees (CART), and Support Vector Machine (SVM), showed lower R-squared values than the DL-based ANN model. In contemporary predictive modeling, ANN consistently surpasses other machine learning algorithms in predictive accuracy. Prior research supports this, noting that ANN often outperforms SVM and RF, except in cases where extensive hyperparameter tuning is applied—such as in modeling Non-Performing Assets (NPAs) in banking [89]. This study confirms that the DL approach based on ANN offers superior predictive performance compared to RF, SVM, and CART, particularly within the microeconomic context of Indonesia.
Although the CART algorithm delivered moderate results compared to ANN—the highest-performing model—and other machine learning techniques, it nonetheless achieved notable outcomes, with an R-squared of 69% and an RMSE of 0.04 (Figure 5). Given that CART was introduced in 1984 and has played a foundational role in the development of artificial intelligence, machine learning, non-parametric statistics, and data mining applications [68], its performance remains significant. Notably, the R-squared of the CART-rpart model surpassed those of the RF and SVM models, except for the CART-rpart2 model. This highlights that newer algorithms do not always outperform older ones in terms of R-squared; the effectiveness of a model is heavily influenced by the specific context and dataset characteristics. A comparable observation was reported by Chang et al. (2021) [90], where the CART algorithm outperformed SVM, achieving an R-squared of 77% ± 15.7% and an RMSE of 0.091 ± 0.035 versus SVM’s R-squared of 66% ± 9% and an RMSE of 0.116 ± 0.016, based on 10-fold cross-validation.
The Random Forest (RF) algorithm showed notably strong performance in this study, with R-squared values generally exceeding the average, indicating its suitability for future research. Specifically, the RF-rborist model achieved an R-squared of 66%, while the RF-rf model reached 64%, both above the overall mean R-squared across all models. Conversely, the RF-ranger model produced a lower R-squared of 54%, below the average. In a study by Sadorsky (2021) [91], the RF algorithm demonstrated reliable predictive ability, with accuracy rates ranging from 5% to 90% in predicting the directional movement of US clean energy ETF stock prices. Additionally, research by Adewale et al. (2024) [92] showed that RF outperformed other algorithms, with an R-squared of 96% (and an RMSE of 27.05), surpassing the performance of both XGBoost Regressor and linear regression, which each achieved 94%.
The RMSE reported in the previous study remained relatively high, indicating suboptimal predictive performance, as it did not approach the ideal value of zero despite an R-squared exceeding 90%. In contrast, the current study achieved significantly lower RMSE values (less than 0.1), even though the R-squared values were more moderate, averaging around 60%. To improve model accuracy, the Random Forest (RF) algorithm was employed, with hyperparameter tuning setting ntree to 1000, resulting in a stable distribution of R-squared values, most of which surpassed the overall average across all models. It is important to note that RF model configurations are dataset-specific and should be tailored accordingly, highlighting the importance of context-sensitive parameter adjustment for optimal performance. For example, Nkurunziza et al. (2025) [73] found that setting ntree to 100 yielded an R-squared of up to 83%, while L. Yang et al. (2020) [93] observed a predictive accuracy of 78% with ntree increased to 500.
For the Support Vector Machine (SVM) algorithm, the R-squared values obtained were below the overall average R-squared (mean R-squared = 62%) across all models (Figure 5). Specifically, the SVM-linear model achieved an R-squared of 54%, while the SVM-polynomial recorded an R-squared of 53%. These results contrast sharply with findings by Nanda et al. (2018) [94], where the SVM-linear model yielded an R-squared of 89%, and the SVM-polynomial surpassed it with an R-squared of 91% in pine wood identification based on acoustic signals. Despite utilizing hyperparameter tuning and cross-validation in the current study, the SVM models still demonstrated relatively limited predictive performance for the Village Development Index (VDI) compared to Random Forest (RF) and CART models. Similar observations were reported by Chang et al. (2021) [90], who found that SVM underperformed relative to CART. Additionally, Lei et al. (2019) [95] reported that in ensemble testing, the PCA-SVM model achieved 84% accuracy, which was lower than the PCA-RF model, also at 84%, but with more consistent performance. Furthermore, even at a hyperparameter setting of C = 30, the SVM-polynomial model showed a more variable R-squared distribution (ranging from 46% to 59%, with a standard deviation of 3%) compared to the SVM-linear model, which maintained more stable R-squared values between 53% and 54%, with a standard deviation of only 0.2%.
Models subjected to hyperparameter tuning exhibited more complex and refined predictive outputs compared to those without tuning. This process generated a larger dataset, capturing a broader range of R-squared and RMSE values for each model (Figure 5A). The top-performing model was identified based on the highest R-squared and the lowest RMSE after tuning (Figure 5B,C). For instance, the optimized ANN model achieved an R-squared of 0.76 (range: 0.63–0.77; mean: 0.70 ± 0.03) and an RMSE of 0.040 (range: 0.042–0.052; mean: 0.045 ± 0.002). This configuration was refined by adjusting the layer parameters within the tuneGrid setting, a key step in enhancing ML-DL algorithm performance [96,97,98]. Additionally, hyperparameter tuning optimized the hidden layer architecture, resulting in a two-layer structure with 10 neurons in the first layer and 15 in the second, both without bias neurons (Figure 6). Ogunbo et al. (2020) [82] reported that increasing the number of hidden layers to 3–4 can boost ANN accuracy up to 97%. For the SVM model, two main parameters were tuned: scale and cost. As shown in Figure 10, SVM performance resulted in low R-squared values, primarily clustered at smaller cost and scale parameters near zero. Similar findings by Amaya-Tejera et al. (2024) [99] indicated that increasing the SVM cost parameter beyond certain values did not significantly improve accuracy, which plateaued around 90%. Notably, maximum accuracy emerged at approximate cost (C) values of 20 and 80, reflecting a dynamic relationship between the parameters and model performance.

5.2. VDI Contribution Evaluation

The contribution to the VDI was assessed using Variable Importance (VI) scores derived from ML-DL models. In this study, VI values effectively reflected how socio-economic and environmental dimensions influence VDI across 92 sampled villages within the GSUGGp. Overall, the designation of the GSUGGp has positively impacted the economy, largely due to the presence of geotourism site hotspots (see Figure 11). An examination of the 17 independent variables (see Figure 9) showed that, in nearly all models, economic factors were the strongest predictors of VDI. These primarily included financial transfers from national and regional governments, which serve as essential components for rural development. After economic variables, other significant factors included supporting infrastructure, tourism activities, and local public perceptions, all of which play a role in shaping development outcomes at the village level.
Although the karst region of the GSUGGp forms a single geological unit, its management is divided among three administrative regencies: Gunung Kidul (D.I. Yogyakarta), Wonogiri (Central Java), and Pacitan (East Java). This decentralized arrangement is formalized through joint regulations issued by the respective regents (Regent Regulations No. 27, 25, and 24 of 2017). In practice, tourism offices at the regency level—working alongside other agencies such as the Regional Development Planning Agency—are responsible for the supervision and implementation of geopark programs. To coordinate across these administrative boundaries, an inter-regional coordinating body known as PAWONSARI has been established, consisting of representatives from relevant local government agencies. At the village level, the Tourism Office collaborates with village heads, who in turn engage local institutions such as Tourism Awareness Groups (POKDARWIS) and youth organizations (Karang Taruna) to foster community-based tourism initiatives.
Economic activities at geosite locations are predominantly centered on tourism and its supporting sectors. These activities are developed by local communities, often drawing from traditional knowledge, and are increasingly supported by training and knowledge-sharing programs facilitated by tourism offices, universities, and private sector partners. The infrastructure for tourism—including homestays, restaurants, MSMEs, travel agencies, and related services—has expanded, particularly in high-traffic geosites, integrating these destinations into broader tourism packages. The economic benefits generated, such as entrance ticket revenues, directly contribute to local government revenues and are subsequently redistributed to villages within the GSUGGp area. However, despite these gains, not all villages with geosites have achieved high VDI scores or attained the status of independent villages, indicating that the economic impacts of tourism development remain uneven.
Economic variables are essential for improving the quality of rural areas, as reflected in the increased VDI (see Figure 9). This category includes three main indicators: village funds from the national government [100,101], as well as village tax and retribution revenues collected from the budgets of the relevant regional governments [102]. As demonstrated by the linear relationships in Figure 12, the VDI shows a positive and statistically significant correlation with each of these economic variables. These results indicate that financial inputs—particularly transfers from higher levels of government and locally generated revenues—are crucial drivers in raising VDI scores. Such financial support promotes economic activity within rural communities, leading to improvements in infrastructure, services, and overall village development [103,104,105].
This reflects a process of economic decentralization in which fiscal and developmental responsibilities are progressively transferred from the central government to local village levels. The primary aims are to reduce development gaps and alleviate rural poverty [102,106,107]. In contrast, internationally recognized geoparks offer a sustainable economic opportunity, providing tangible benefits to rural communities. These include the creation of jobs in sectors such as hospitality (hotels, restaurants), increased tax revenues, and improvements in basic infrastructure. This impact is especially pronounced in villages that host geosites and their surrounding satellite villages, which often have supporting road networks and small-scale accommodations like hotels and homestays to serve tourists. Overall, these developments demonstrate how geoparks can foster local economic growth while contributing to broader regional development objectives.
A critical aspect of the GSUGGp’s governance is the legal protection of its karst landscape, which has been officially designated as a protected area by the Ministry of Energy and Mineral Resources. This status imposes strict limitations—and, in many cases, outright prohibitions—on the industrial exploitation of karst areas, despite growing interest among stakeholders in their economic potential for industry. This presents a governance dilemma: local governments must balance the need to stimulate regional economic growth with the imperative to conserve the unique geological and hydrological characteristics of the karst system.
Entrepreneurial activities are generally permitted within the geopark, provided that all business operations comply with existing regulations. Enterprises that generate hazardous (B3) or liquid waste are required to implement measures that prevent contamination of the karst system’s sensitive subterranean water resources. All forms of investment—whether initiated by local communities or external parties, and regardless of their direct association with geopark tourism—must adhere to established licensing procedures through the respective district’s investment office. Approval from the village head is also required as part of the business permitting process, ensuring local oversight and alignment with community interests. In summary, the governance and economic utilization of the GSUGGp karst region are characterized by a complex interplay between decentralized administrative management, legal conservation mandates, and efforts to foster sustainable local economic development through tourism. These dynamics necessitate continuous coordination among stakeholders to ensure that economic benefits are realized without compromising the long-term ecological and geological integrity of the geopark.
Geotourism activities within geopark areas play a crucial role in strengthening the rural economy by boosting household incomes [108,109]. Additionally, geotourism has been identified for its potential economic benefits, with research highlighting its capacity to promote local income generation [110]. In the study area, it is evident that tourism-related variables have a lesser influence on the VDI compared to economic variables. Four tourism-related factors were identified: beach tourism, cave tourism, geosite tourism, and geosite status by village. Among these, only beach tourism consistently exerted a dominant effect across all models (Figure 9). This trend is particularly visible in Figure 11, Section 2, Section 3, and Section 5, which showcase some of the most popular tourist destinations—sites that facilitate more rapid economic circulation in rural communities. These findings imply that geological tourism within the GSUGGp has yet to realize its full potential in enhancing VDI, partly due to the slow recovery of the tourism sector following the COVID-19 pandemic [111,112]. Some caves in the GSUGGP area have been officially recognized as international geosites, while others have not. However, most cave geosites in the GSUGGp region serve dual functions: in addition to being conservation objects, they are also part of the tourism epicenter. Even so, cave tourism—both in geosites and non-geosite caves—still contributes less to the VDI than coastal geotourism. Thus, promoting sustainable coastal geotourism with an emphasis on aesthetics, conservation, and geological diversity has a great chance of boosting the socio-economic advantages of the area. By combining cultural heritage, education, and geological distinctiveness, cave tourism (geosites and/or non-geosites) may improve attractions and visitor experiences while making sure management puts visitor safety, security, and health first.
Numerous studies indicate that the development of transportation, accommodation, consumption, and tourism-supporting services can significantly enhance tourism activity within destination areas [113]. Among these, accommodation constitutes the largest expenditure category for tourists, exceeding spending on transportation, retail, food, and souvenirs [114]. In terms of consumption, tourism destinations often see an increase in the variety of businesses offering goods—such as restaurants, souvenir shops, and local product outlets—and services, including translation, travel agencies, and equipment rental for activities [115,116]. The advancement of supporting services through digitalization, especially information and communication technologies, has become crucial for tourists, including those in rural regions. These digital services are vital for activities like remote work, ticket reservations, and accessing various tourism-related offerings, all efficiently supported by reliable internet connectivity [117].
The development of transportation, accommodation, and food service infrastructure has significantly contributed to improving community welfare by creating employment opportunities for local populations. The presence of geosites encourages communities to actively utilize natural and cultural resources as tourism attractions, thereby strengthening local community groups, increasing economic income, and promoting village independence. Nonetheless, the quality of human resources remains a key challenge. Some villages within the GSUGGp area, however, have successfully overcome these limitations. A notable example is the community-driven transformation of the Maron River tourism site (Figure 11(6)), located between the Klayar Beach and Watukarung Beach geosites. Initially used as a waste disposal and sanitation area, the Maron River was revitalized into a leading tourist destination through youth and community initiatives focused on reforestation, river cleanup, and environmental maintenance. Today, it attracts over 100,000 visitors annually and stands as a symbol of socio-ecological transformation and the community’s capacity to manage natural resources.
This success underscores the importance of a shared vision, solidarity, community ownership, and synergy between local residents and village governments. However, such achievements are not yet evenly distributed across the entire GSUGGp area. To replicate and scale up these successes, cross-sectoral collaboration and multi-stakeholder policy innovation are required through the following strategies:
  • Strengthen village and regional governments by developing and implementing programs to enhance community capacity and social capital, providing technical assistance, and increasing transparent and well-targeted budget allocations to support tourism governance and local entrepreneurship;
  • Position the GSUGGp Management Body as a strategic coordinator to ensure the integration of local initiatives with overarching geopark management policies. Its composition should reflect a multi-sectoral collaborative model, involving not only government entities but also educational institutions, community or traditional organizations, and private sector stakeholders (e.g., business associations, hospitality, and tourism operators). This structure promotes cross-sector knowledge exchange and enables the formulation of adaptive and sustainable strategies;
  • Encourage provincial and national governments to provide adequate infrastructure, develop knowledge management systems, and implement regulatory frameworks that support inclusive, feasible, and locally applicable economic ecosystems;
  • Empower academic institutions and the private sector to deliver field-oriented research, generate practical and applicable solutions, and offer skill development training and market access for local communities. Effective partnerships between academia and industry can expand economic opportunities and enhance community capacity in managing geotourism sustainably.
In addition to economic benefits, the official designation of geosites and the establishment of geopark museums also deliver significant educational value. These initiatives raise public awareness of geodiversity, geological heritage, geomorphology, geotourism, cultural diversity, and biodiversity, thereby reinforcing the role of geoparks as platforms for public education [118,119].

5.3. Limitation and Future Study

The development of ML-DL models faces notable challenges in accurately quantifying the influence of economic factors on regional and village-level development. A key limitation identified in this study is the relatively small dataset, which includes only 92 data points. This is a significant concern, as both machine learning and deep learning models typically require large datasets to achieve optimal accuracy and reliability [120,121]. In particular, deep learning algorithms demand even larger data volumes than traditional ML techniques to effectively model complex patterns and relationships [122]. The lower R-squared values observed in the RF, SVM, and CART models in this research, compared to those reported in other studies, highlight the need for further model refinement, especially regarding data quality, preprocessing methods, and hyperparameter optimization. Improving the preprocessing process by incorporating advancements in socio-economic statistical methodologies is essential for better capturing the contributions of various variables to the Village Development Index (VDI). Additionally, proper model parameterization is vital for enhancing model efficiency, identifying the best-performing models, increasing R-squared values, and minimizing prediction errors [123,124,125,126,127].
Although the ANN algorithm has shown strong performance in numerous previous studies, in this scenario, it achieved an R-squared value of only 70%, indicating limited predictive effectiveness for variables affecting the VDI. This gap—reflected by an R-squared below 80%—suggests that the current deep learning approach may not be sufficiently robust for enhancing predictive accuracy in this context. Consequently, integrating the ANN with other methods is highly recommended for future research. For example, Ayed and Bougatef (2024) [128] evaluated the adaptive neuro-fuzzy inference system (ANFIS), a hybrid model combining neural networks with fuzzy inference systems, which achieved up to 90% accuracy. Additionally, further optimization of ANN-based models is a promising avenue, with approaches like applying phase space reconstructions (PSRs) in economic modeling showing potential [129].
The development of optimized models in previous studies has provided various insights into the performance of different algorithms; however, no single model has proven to be superior in all cases. In this study, the application of ANN, CART, RF, and SVM revealed performance patterns that differ from those documented earlier. This highlights the importance of conducting comprehensive evaluations of these models within the specific context of microeconomic analysis at the village level. Further research should explore socio-economic assessment frameworks related to geoparks, which could lead to a wider range of implementation strategies and evidence-based recommendations. For instance, algorithms with strong predictive capabilities in economic contexts, such as the Gradient Boosting Model—which has outperformed Random Forest [130]—and deep learning architectures like CNN, RNN, and LSTM—achieving R-squared values between 82% and 91% [131]—demonstrate considerable potential for modeling complex economic data. Additionally, future studies should prioritize algorithm hybridization and ensemble methods, which combine multiple algorithms to leverage their complementary strengths. These approaches can enhance model robustness and predictive accuracy, ultimately improving economic forecasting.

6. Conclusions

The GSUGGp, recognized internationally as part of the UNESCO Global Geoparks network, plays a vital role in promoting economic growth across 92 villages within its boundaries. Using advanced non-linear modeling techniques through machine learning and deep learning methods, this study uncovers key insights, showing that three out of seventeen socio-economic-environmental variables significantly influence Village Development Index (VDI) improvements in these villages. In addition to economic factors, geological variables related to natural tourism—particularly beach tourism—also contribute notably to enhancing VDI quality at the village level. However, core geological features of the geopark—such as geosites and non-geosite caves—still contribute less to the VDI than coastal geotourism. This emphasizes the importance of multi-stakeholder cooperation in creating geopark development policies and programs that give priority to building an inclusive local economic ecosystem, improving supporting infrastructure, boosting social capital, raising community awareness and capacity, and creating strategic branding initiatives to boost tourism. The study finds that the Non-linear Deep Learning (DL) approach, using the Artificial Neural Network (ANN) algorithm, outperforms other models (CART, RF, SVM) with an R-squared of 0.76 and an RMSE of 0.040, indicating superior predictive accuracy. Despite these advances, the ML-DL methods used have limitations, including the need for improved hyperparameter tuning, cross-validation setups, optimization techniques, and hybrid models combining DL and ML. These results are valuable for assessing socio-economic-environmental models and guiding non-linear statistical strategies to boost village development. Additionally, the quantified findings and their variability provide important recommendations for regency- and provincial-level stakeholders aimed at optimizing management and accelerating the economic benefits of the GSUGGp.

Author Contributions

Conceptualization, R.P.N. and A.F.; methodology, R.P.N., A.F., E.R. and S.B.; software, R.P.N. and A.F.; validation, R.P.N., A.F., E.R. and S.B.; formal analysis, R.P.N. and A.F.; resources, R.P.N.; data curation, R.P.N.; writing—original draft preparation, R.P.N. and A.F.; writing—review and editing, R.P.N. and A.F.; visualization, R.P.N.; supervision, A.F., E.R. and S.B. All authors have read and agreed to the published version of the manuscript.

Funding

This research received no external funding.

Institutional Review Board Statement

The research conforms with Institutional Regulation No. 33/SA-IPB/P2019, and no violation has been found.

Informed Consent Statement

Informed consent was obtained from all subjects involved in the study.

Data Availability Statement

Data available on request due to restrictions (privacy and legal).

Acknowledgments

We would like to express our sincere appreciation to all participants for their invaluable assistance and cooperation throughout this study.

Conflicts of Interest

The authors declare no conflicts of interest.

References

  1. UN. Transforming Our World: The 2030 Agenda For Sustainable Development. 2015. Available online: https://sustainabledevelopment.un.org/content/documents/21252030%20Agenda%20for%20Sustainable%20Development%20web.pdf (accessed on 23 May 2025).
  2. Ferreira, D.R.; Valdati, J. Geoparks and Sustainable Development: Systematic Review. Geoheritage 2022, 15, 6. [Google Scholar] [CrossRef]
  3. Imelda, J.D.; Sanjatmiko, P.; Anugrahini, T.; Machdum, S.V.; Afifah, A. Buku Pedoman Pengelolaan Geopark Site Berkelanjutan Secara Sosial, Budaya, Ekonomi, dan Ekologi; Lembaga Penelitian dan Pengembangan Sosial Politik: Fakultas Ilmu Sosial dan Ilmu Politik, Universitas Indonesia: Jakarta, Indonesia, 2024; Available online: https://puskakesos.fisip.ui.ac.id/wp-content/uploads/2024/07/Buku-Pedoman-Pengelolaan-Geopark-Site-Berkelanjutan-Secara-Sosial-Budaya-Ekonomi-dan-Ekologi.pdf (accessed on 23 May 2025).
  4. UNESCO Global Geoparks. UNESCO Global Geoparks Contributing to the Sustainable Development Goals: Celebrating Earth Heritage, Sustaining Local Communities; UNESCO Global Geoparks: Paris, France, 2017; Available online: https://unesdoc.unesco.org/ark:/48223/pf0000247741 (accessed on 23 May 2025).
  5. Gunn, J. Karst groundwater in UNESCO protected areas: A global overview. Hydrogeol. J. 2021, 29, 297–314. [Google Scholar] [CrossRef]
  6. Pemerintah Pusat Indonesia. Peraturan Presiden (Perpres) Nomor 9 Tahun 2019 Tentang Pengembangan Taman Bumi (Geopark); LN.2019/NO.22, LL SETKAB: 23 HLM; Pemerintah Pusat Indonesia: Jakarta, Indonesia, 2019; Available online: https://peraturan.bpk.go.id/Details/101626/perpres-no-9-tahun-2019 (accessed on 23 May 2025).
  7. Kementerian Energi dan Sumber Daya Mineral Indonesia. Peraturan Menteri Energi dan Sumber Daya Mineral Nomor 31 Tahun 2021 tentang Penetapan Taman Bumi (Geopark) Nasional; Kementerian Energi dan Sumber Daya Mineral Indonesia: Jakarta, Indonesia, 2021; Available online: https://peraturan.bpk.go.id/Details/215424/permen-esdm-no-31-tahun-2021 (accessed on 23 May 2025).
  8. Adom, D. The place and voice of local people, culture, and traditions: A catalyst for ecotourism development in rural communities in Ghana. Sci. Afr. 2019, 6, e00184. [Google Scholar] [CrossRef]
  9. Cheryl, J. History of Geoparks. Geol. Soc. Lond. Spec. Publ. 2008, 300, 273–277. [Google Scholar] [CrossRef]
  10. Ferraro, F.X.; Schilling, M.E.; Baeza, S.; Oms, O.; Sá, A.A. Bottom-up strategy for the use of geological heritage by local communities: Approach in the “Litoral del Biobío” Mining Geopark project (Chile). Proc. Geol. Assoc. 2020, 131, 500–510. [Google Scholar] [CrossRef]
  11. Ríos, C.A.; Amorocho, R.; Villarreal, C.A.; Mantilla, W.; Velandia, F.A.; Castellanos, O.M.; Muñoz, S.; Atuesta, D.; Jerez, J.; Acevedo, O.; et al. Chicamocha Canyon Geopark project: A novel strategy for the socio-economic development of Santander (Colombia) through geoeducation, geotourism and geoconservation. Int. J. Geoheritage Parks 2020, 8, 96–122. [Google Scholar] [CrossRef]
  12. Kementerian Energi dan Sumber Daya Mineral Indonesia. Keputusan Menteri ESDM; No. 3045 K/40/MEM/2014 Tentang Penetapan Kawasan Bentang Alam Karst Gunung Sewu; LL KESDM 2014: 8 HLM; Kementerian Energi dan Sumber Daya Mineral Indonesia: Jakarta, Indonesia, 2014; Available online: https://jdih.esdm.go.id/dokumen/view?id=1176 (accessed on 23 May 2025).
  13. Martínez-Martín, J.E.; Rosado-González, E.M.; Martínez-Martín, B.; Sá, A.A. UNESCO Global Geoparks vs. Generative AI: Challenges for Best Practices in Sustainability and Education. Geosciences 2024, 14, 275. [Google Scholar] [CrossRef]
  14. Ruban, D.A. Water in descriptions of global geoparks: Not less important than geology? Water 2019, 11, 1866. [Google Scholar] [CrossRef]
  15. Telbisz, T.; Mari, L. The significance of karst areas in European national parks and geoparks. Open Geosci. 2020, 12, 117–132. [Google Scholar] [CrossRef]
  16. Narayan, S.; Narayan, P.K.; Tobing, L. Has tourism influenced Indonesia’s current account? Econ. Anal. Policy 2021, 69, 225–237. [Google Scholar] [CrossRef]
  17. Travers, R.; Cleverton, R.; Cochrane, J.; Hussein, A.; Noushad, P.M.; Papagiannopoulos, L.; Jiang, Y.; Kostopoulou, S.; de Lima, A.R.; Travers, A.; et al. The 21st Century Maritime Silk Road—Tourism Opportunities and Impacts; World Tourism Organization (UNWTO): Madrid, Spain, 2019; Available online: https://www.e-unwto.org/doi/epdf/10.18111/9789284418749 (accessed on 23 May 2025).
  18. UN. World Economic and Social Survey 2013: Sustainable Development Challenges; United Nations: New York, NY, USA, 2013; Available online: https://www.un.org/en/development/desa/policy/wess/wess_current/wess2013/WESS2013.pdf (accessed on 23 May 2025).
  19. UNEP. Towards a Green Economy: Pathways to Sustainable Development and Poverty Eradication—A Synthesis for Policy Makers. 2011. Available online: www.unep.org/greeneconomy (accessed on 23 May 2025).
  20. Alexakis, C.; Dowling, M.; Eleftheriou, K.; Polemis, M. Textual Machine Learning: An Application to Computational Economics Research. Comput. Econ. 2021, 57, 369–385. [Google Scholar] [CrossRef]
  21. Gao, H.; Kou, G.; Liang, H.; Zhang, H.; Chao, X.; Li, C.C.; Dong, Y. Machine learning in business and finance: A literature review and research opportunities. Financ. Innov. 2024, 10, 86. [Google Scholar] [CrossRef]
  22. Gupta, A.; Kumar, K.; Asha, V.; Kumar, S.N. Machine Learning in Economic Forecasting: A Comprehensive Review. In Proceedings of the 2024 7th International Conference on Contemporary Computing and Informatics (IC3I), Greater Noida, India, 18–20 September 2024; pp. 882–886. [Google Scholar]
  23. Rezaei, A.; Abdellatif, I.; Umar, A. Towards Economic Sustainability: A Comprehensive Review of Artificial Intelligence and Machine Learning Techniques in Improving the Accuracy of Stock Market Movements. Int. J. Financial Stud. 2025, 13, 28. [Google Scholar] [CrossRef]
  24. Giudici, P.; Raffinetti, E.; Riani, M. Robust machine learning models: Linear and nonlinear. Int. J. Data Sci. Anal. 2024. [Google Scholar] [CrossRef]
  25. Jordan, M.I.; Mitchell, T.M. Machine learning: Trends, perspectives, and prospects. Science 2015, 349, 255–260. [Google Scholar] [CrossRef] [PubMed]
  26. Liang, D.; Frederick, D.A.; Lledo, E.E.; Rosenfield, N.; Berardi, V.; Linstead, E.; Rosenfield, N.; Berardi, V.; Linstead, E.; Maoz, U. Examining the utility of nonlinear machine learning approaches versus linear regression for predicting body image outcomes: The U.S. Body Project I. Body Image 2022, 41, 32–45. [Google Scholar] [CrossRef] [PubMed]
  27. Ryo, M.; Rillig, M.C. Statistically reinforced machine learning for nonlinear patterns and variable interactions. Ecosphere 2017, 8, e01976. [Google Scholar] [CrossRef]
  28. Yang, Y.; Ye, Z.; Su, Y.; Zhao, Q.; Li, X.; Ouyang, D. Deep learning for in vitro prediction of pharmaceutical formulations. Acta Pharm. Sin. B 2019, 9, 177–185. [Google Scholar] [CrossRef] [PubMed]
  29. Ahmad, A.S.; Hassan, M.Y.; Abdullah, M.P.; Rahman, H.A.; Hussin, F.; Abdullah, H.; Saidur, R. A review on applications of ANN and SVM for building electrical energy consumption forecasting. Renew. Sustain. Energy Rev. 2014, 33, 102–109. [Google Scholar] [CrossRef]
  30. Luo, Y.; He, J.; Mou, Y.; Wang, J.; Liu, T. Exploring China’s 5A global geoparks through online tourism reviews: A mining model based on machine learning approach. Tour. Manag. Perspect. 2021, 37, 100769. [Google Scholar] [CrossRef]
  31. Manca, G.; Cervone, G. The case of arsenic contamination in the Sardinian Geopark, Italy, analyzed using symbolic machine learning. Environmetrics 2013, 24, 400–406. [Google Scholar] [CrossRef]
  32. Hughes, A.C.; Kirksey, E.; Palmer, B.; Tivasauradej, A.; Changwong, A.A.; Chornelia, A. Reconstructing cave past to manage and conserve cave present and future. Ecol. Indic. 2023, 155, 111051. [Google Scholar] [CrossRef]
  33. Wan, J.Z.; Wang, C.J.; Zhang, Z.X. Environmental predictors of vascular plant richness at large spatial scales based on protected area data of China. Glob. Ecol. Conserv. 2020, 21, e00846. [Google Scholar] [CrossRef]
  34. Martinho, V.J.P.D. (Ed.) Machine and Deep Learning: Their Roles in the Context of the Economic Growth Processes and Sustainability Assessment [Internet]. In Economic Growth: Advances in Analysis Methodologies and Technologies; Springer Nature: Cham, Switzerland, 2023; pp. 119–131. [Google Scholar] [CrossRef]
  35. Al’Afif, M.; Sartohadi, J.; Samodra, G. Impact of landslide on geoheritage: Opportunities through integration, geomorphological classification and machine learning. Int. J. Geoheritage Parks 2024, 12, 333–351. [Google Scholar] [CrossRef]
  36. Huang, Q.; Zhou, C.; Li, M.; Ma, Y.; Hua, S. An Approach for Mapping Ecotourism Suitability Using Machine Learning: A Case Study of Zhangjiajie, China. Land 2024, 13, 1188. [Google Scholar] [CrossRef]
  37. Pham, T.T.; Dang, K.B.; Giang, T.L.; Hoang, T.H.N.; Le, V.H.; Ha, H.N. Deep learning models for monitoring landscape changes in a UNESCO Global Geopark. J. Environ. Manag. 2024, 354, 120497. [Google Scholar] [CrossRef] [PubMed]
  38. Xia, Y.; Fu, B. Spatio-temporal variations of the LUCC of the Djoudj National Bird Sanctuary in the past 40 years and its sustainable development. Int. J. Geoheritage Parks 2024, 12, 636–648. [Google Scholar] [CrossRef]
  39. Rahman, A.; Debnath, T.; Kundu, D.; Khan, M.S.I.; Aishi, A.A.; Sazzad, S.; Sayduzzaman, M.; Band, S.S. Machine learning and deep learning-based approach in smart healthcare: Recent advances, applications, challenges and opportunities. AIMS Public Health 2024, 11, 58–109. [Google Scholar] [CrossRef] [PubMed]
  40. UNFCCC. Artificial Intelligence for Climate Action in Developing Countries: Opportunities, Challenges and Risks; UNFCCC: Bonn, France, 2024; Available online: https://unfccc.int/ttclear/tec/AI4climate.html#infonote (accessed on 23 May 2025).
  41. Zuiderwijk, A.; Chen, Y.C.; Salem, F. Implications of the use of artificial intelligence in public governance: A systematic literature review and a research agenda. Gov. Inf. Q. 2021, 38, 101577. [Google Scholar] [CrossRef]
  42. Skibiński, J.; Kultys, K.; Baran-Zgłobicka, B.; Zgłobicki, W. Geoparks in SE Poland as areas of tourism development: Current state and future prospects. Resources 2021, 10, 113. [Google Scholar] [CrossRef]
  43. Reinhart, H.; Rafida, M.R.; Sofie, T.; Putra, R.D.; Matoka, M.C.R.; Maulita, N.S.; Baiquni, M. Assessment of Geological Diversity, Geosites, and Geotourism Potencies at Menoreh Mountain for Designation of Geopark Area. Int. J. Geoheritage Parks 2023, 11, 385–406. [Google Scholar] [CrossRef]
  44. Chen, A.; Ng, Y.; Zhang, E. Dictionary of Geotourism; Springer: Singapore, 2020. [Google Scholar]
  45. El Hamidy, M.; Errami, E. The geosites of Safi province (Marrakech-Safi region, Morocco): Inventory and assessment for geoconservation, geotourism, geoeducation, geoparks, and local sustainable development. Int. J. Geoheritage Parks 2025, 13, 68–91. [Google Scholar] [CrossRef]
  46. Fauzi, N.S.M.; Misni, A. Geoheritage Conservation: Indicators Affecting the Condition and Sustainability of Geopark—A Conceptual Review. Procedia Soc. Behav. Sci. 2016, 222, 676–684. [Google Scholar] [CrossRef]
  47. Kementerian Desa dan Pembangunan Daerah Tertinggal. Peraturan Menteri Desa, Pembangunan Daerah Tertinggal, dan Transmigrasi Nomor 2 Tahun 2016 Tentang Indeks Desa Membangun. 2016. Available online: https://peraturan.bpk.go.id/Details/150585/permendes-pdtt-no-2-tahun-2016 (accessed on 23 May 2025).
  48. Putri, R.A.; Supriatna, S. Land cover change modeling to identify critical land in the Ciletuh Geopark tourism area, Palabuhanratu, Sukabumi Regency. IOP Conf. Ser. Earth Environ. Sci. 2021, 623, 012081. [Google Scholar] [CrossRef]
  49. Kurnianto, F.A.; Nurdin, A.; Pangastuti, E.I.; Bella, S. Monitoring Mining Impact for Geosites Using Time Series NDVI and Runoff in the Eastern Part of Southern Java Mountains, Indonesia. Forum Geogr. 2024, 38, 291–301. [Google Scholar] [CrossRef]
  50. Ansari, F.; Narendra, B.H.; Putri, I.A.S.L.P.; Tata, H.L.; Susi Dharmawan, I.W.; Rachmat, H.H.; Suharti, S.; Windyoningrum, A.; Khotimah, H.; Sayektiningsih, T. Forest cover change and its carbon dynamic of the karst area in Bulusaraung, South Sulawesi, Indonesia. Forest. Sci. Technol. 2024, 20, 179–193. [Google Scholar] [CrossRef]
  51. Lobwaer, A.K.R.; Nursini Anwar, A.I.; Suhab, S. Village Development Index Behavior: A Review of Regional Attractiveness. In Proceedings of the 8th International Conference on Accounting, Management, and Economics (ICAME 2023), Makassar, Indonesia, 22–23 November 2023; pp. 356–366. [Google Scholar]
  52. Rahmawati, F.; Mafida Amalia, A. Policy Formulation Based on Village Development Index (IDM) in East Java Province. KnE Soc. Sci. 2024, 156–169. [Google Scholar] [CrossRef]
  53. Alkadafi, M.; Susanti Wasistiono, S.; Broto, M.F. Does Village Funds Impact Village Development Index and Achievement of Sustainable Development Goals in Rural Areas, Indonesia: A Case Study in Kampar District. J. Lifestyle SDGs Rev. 2025, 5, e04903. [Google Scholar] [CrossRef]
  54. Tuszynski, J.; Dietze, M. caTools: Tools: Moving Window Statistics, GIF, Base64, ROC AUC, etc. CRAN. 2024. Available online: https://cran.r-project.org/web/packages/caTools/caTools.pdf (accessed on 23 May 2025).
  55. Chardon, J.P.; Adriaensen, F.; Matthysen, E. Incorporating landscape elements into a connectivity measure: A case study for the Speckled wood butterfly (Pararge aegeria L.). Landsc. Ecol. 2003, 18, 561–573. [Google Scholar] [CrossRef]
  56. Kuhn, M.; Wing, J.; Weston, S.; Williams, A.; Keefer, C.; Engelhardt, A.; Cooper, T.; Mayer, Z.; Kenkel, B.; Team, R.; et al. Package “Caret” Title Classification and Regression Training. CRAN. 2024. Available online: https://cran.r-project.org/web/packages/caret/caret.pdf (accessed on 23 May 2025).
  57. Schaks, M.; Staudinger, I.; Homeister, L.; Di Biase, B.; Steinkraus, B.R.; Spiess, A.N. Local microbial yield-associating signatures largely extend to global differences in plant growth. Sci. Total Environ. 2025, 958, 177946. [Google Scholar] [CrossRef] [PubMed]
  58. Andersson, B.; Langen, B.; Liu, P.; Dávila López, M. Development of a machine learning framework for radiation biomarker discovery and absorbed dose prediction. Front. Oncol. 2023, 13, 1156009. [Google Scholar] [CrossRef] [PubMed]
  59. Lazzari, A.; Giovinazzo, S.; Cabassi, G.; Brambilla, M.; Bisaglia, C.; Romano, E. Evaluating Urban Sewage Sludge Distribution on Agricultural Land Using Interpolation and Machine Learning Techniques. Agriculture 2025, 15, 202. [Google Scholar] [CrossRef]
  60. Boehmke, B.; Greenwell, B. Hands-On Machine Learning with R, 1st ed.; Taylor & Francis Group: Oxfordshire, UK, 2020. [Google Scholar]
  61. Horváth, T.; Mantovani, R.G.; de Carvalho, A.C.P.L.F. Effects of Random Sampling on SVM Hyper-parameter Tuning. In Intelligent Systems Design and Applications; Madureira, A.M., Abraham, A., Gamboa, D., Novais, P., Eds.; Springer International Publishing: Cham, Switzerland, 2017; pp. 268–278. [Google Scholar]
  62. Maxwell, A.E.; Warner, T.A.; Fang, F. Implementation of machine-learning classification in remote sensing: An applied review. Int. J. Remote Sens. 2018, 39, 2784–2817. [Google Scholar] [CrossRef]
  63. He, R.; Zhang, K.; Li, H.; Gu, M. Development and validation of inpatient mortality prediction models for patients with hyperglycemic crisis using machine learning approaches. BMC. Endocr. Disord. 2025, 25, 86. [Google Scholar] [CrossRef] [PubMed]
  64. Therneau, T.; Atkinson, B.; Ripley, B. rpart: Recursive Partitioning and Regression Trees. CRAN. 2025. Available online: https://cran.r-project.org/package=rpart (accessed on 24 May 2025).
  65. Breiman, L.; Cutler, A.; Liaw, A.; Wiener, M. Random Forests. CRAN. 2022. Available online: https://www.stat.berkeley.edu/~breiman/RandomForests/ (accessed on 24 May 2025).
  66. Karatzoglou, A.; Smola, A.; Hornik, K.; Zeileis, A. kernlab—An S4 Package for Kernel Methods in R. J. Stat. Softw. 2004, 11, 1–20. [Google Scholar] [CrossRef]
  67. Ripley, B.; Venables, W. nnet: Feed-Forward Neural Networks and Multinominal Log-Linear Models. CRAN. 2025. Available online: http://www.stats.ox.ac.uk/pub/MASS4/ (accessed on 24 May 2025).
  68. Steinberg, D. CART: Classification and Regression Trees. In The Top Ten Algorithms in Data Mining; Wu, X., Kumar, V., Eds.; Taylor & Francis Group: Oxfordshire, UK, 2009; pp. 179–201. [Google Scholar]
  69. Balboa, A.; Cuesta, A.; González-Villa, J.; Ortiz, G.; Alvear, D. Logistic regression vs machine learning to predict evacuation decisions in fire alarm situations. Saf. Sci. 2024, 174, 106485. [Google Scholar] [CrossRef]
  70. Ma, J.; Cheng, J.C.P.; Jiang, F.; Chen, W.; Zhang, J. Analyzing driving factors of land values in urban scale based on big data and non-linear machine learning techniques. Land Use Policy 2020, 94, 104537. [Google Scholar] [CrossRef]
  71. Abedin, M.Z.; Moon, M.H.; Hassan, M.K.; Hajek, P. Deep learning-based exchange rate prediction during the COVID-19 pandemic. Ann. Oper. Res. 2021, 345, 1335–1386. [Google Scholar] [CrossRef] [PubMed]
  72. Dimitriadou, A.; Gogas, P.; Papadimitriou, T. Tourism and uncertainty: A machine learning approach. Curr. Issues Tour. 2024, 28, 2278–2298. [Google Scholar] [CrossRef]
  73. Nkurunziza, F.; Kabanda, R.; McSharry, P. Enhancing poverty classification in developing countries through machine learning: A case study of household consumption prediction in Rwanda. Cogent Econ. Financ. 2025, 13, 2444374. [Google Scholar] [CrossRef]
  74. Osman, B.M.; Muse, A.M.S. Predictive analysis of Somalia’s economic indicators using advanced machine learning models. Cogent Econ. Financ. 2024, 12, 2426535. [Google Scholar] [CrossRef]
  75. Sun, Z.; Wang, G.; Li, P.; Wang, H.; Zhang, M.; Liang, X. An improved random forest based on the classification accuracy and correlation measurement of decision trees. Expert Syst. Appl. 2024, 237, 121549. [Google Scholar] [CrossRef]
  76. Bernard, S.; Heutte, L.; Adam, S. Influence of Hyperparameters on Random Forest Accuracy. In Multiple Classifier Systems; Benediktsson, J.A., Kittler, J., Roli, F., Eds.; Springer: Berlin/Heidelberg, Germany, 2009; pp. 171–180. [Google Scholar]
  77. Mohapatra, N.; Shreya, K.; Chinmay, A. Optimization of the Random Forest Algorithm. In Advances in Data Science and Management; Borah, S., Emilia Balas, V., Polkowski, Z., Eds.; Springer: Singapore, 2020; pp. 201–208. [Google Scholar]
  78. Cristianini, N.; Ricci, E. Support Vector Machines. In Encyclopedia of Algorithms; Kao, M.Y., Ed.; Springer: Boston, MA, USA, 2008; pp. 928–932. [Google Scholar] [CrossRef]
  79. Byun, H.; Lee, S.W. A Survey on Pattern Recognition Applications of Support Vector Machines. Int. J. Pattern Recognit. Artif. Intell. 2003, 17, 459–486. [Google Scholar] [CrossRef]
  80. Xia, S.Y.; Xiong, Z.Y.; Luo, Y.G.; Dong, L.M. A method to improve support vector machine based on distance to hyperplane. Optik 2015, 126, 2405–2410. [Google Scholar] [CrossRef]
  81. Zou, J.; Han, Y.; So, S.S. Overview of Artificial Neural Networks. In Artificial Neural Networks: Methods and Applications; Livingstone, D.J., Ed.; Humana Press: Totowa, NJ, USA, 2009; pp. 14–22. [Google Scholar] [CrossRef]
  82. Ogunbo, J.N.; Alagbe, O.A.; Oladapo, M.I.; Shin, C. N-hidden layer artificial neural network architecture computer code: Geophysical application example. Heliyon 2020, 6, e04108. [Google Scholar] [CrossRef] [PubMed]
  83. Beck, M.W. NeuralNetTools: Visualization and analysis tools for neural networks. J. Stat. Softw. 2018, 85, 1–20. [Google Scholar] [CrossRef] [PubMed]
  84. Alqadhi, S.; Mallick, J.; Alkahtani, M. Integrated deep learning with explainable artificial intelligence for enhanced landslide management. Nat. Hazards 2024, 120, 1343–1365. [Google Scholar] [CrossRef]
  85. Feng, S.; Wang, S.; Liu, C.; Wu, S.; Zhang, B.; Lu, C.; Huang, C.; Chen, T.; Zhou, C.; Zhu, J.; et al. Prediction model for spinal cord injury in spinal tuberculosis patients using multiple machine learning algorithms: A multicentric study. Sci. Rep. 2024, 14, 7691. [Google Scholar] [CrossRef] [PubMed]
  86. Biecek, P.; Maksymiuk, S.; Baniecki, H. DALEX: Model Agnostic Language for Exploration and Explanation. CRAN. 2023. Available online: https://dalex.drwhy.ai/ (accessed on 24 May 2025).
  87. Guan, C.; Ma, F.; Chang, S.; Zhang, J. Interpretable machine learning models for predicting venous thromboembolism in the intensive care unit: An analysis based on data from 207 centers. Crit. Care 2023, 27, 406. [Google Scholar] [CrossRef] [PubMed]
  88. Gogas, P.; Papadimitriou, T. Machine Learning in Economics and Finance. Comput. Econ. 2021, 57, 1–4. [Google Scholar] [CrossRef]
  89. Mallik, R.; Puri, S.; Bhansali, A.; Manikandan, R.; Rahunathan, L. Defaulter detection based on Spearman correlation with hyper tuned SVM classification for preventing non-performing assets occurring in bank. Multimed Tools Appl. 2024. [Google Scholar] [CrossRef]
  90. Chang, W.; Ji, X.; Wang, L.; Liu, H.; Zhang, Y.; Chen, B.; Zhou, S. A machine-learning method of predicting vital capacity plateau value for ventilatory pump failure based on data mining. Healthcare 2021, 9, 1306. [Google Scholar] [CrossRef] [PubMed]
  91. Sadorsky, P. A Random Forests Approach to Predicting Clean Energy Stock Prices. J. Risk Financ. Manag. 2021, 14, 48. [Google Scholar] [CrossRef]
  92. Adewale, M.D.; Ebem, D.U.; Awodele, O.; Sambo-Magaji, A.; Aggrey, E.M.; Okechalu, E.A.; Donatus, R.; Olayanju, K.; Owolabi, A.; Oju, J.; et al. Predicting gross domestic product using the ensemble machine learning method. Syst. Soft Comput. 2024, 6, 200132. [Google Scholar] [CrossRef]
  93. Yang, L.; Wu, H.; Jin, X.; Zheng, P.; Hu, S.; Xu, X.; Yu, W.; Yan, J. Study of cardiovascular disease prediction model based on random forest in eastern China. Sci. Rep. 2020, 10, 5245. [Google Scholar] [CrossRef] [PubMed]
  94. Nanda, M.A.; Seminar, K.B.; Nandika, D.; Maddu, A. A comparison study of kernel functions in the support vector machine and its application for termite detection. Information 2018, 9, 5. [Google Scholar] [CrossRef]
  95. Lei, C.; Deng, J.; Cao, K.; Xiao, Y.; Ma, L.; Wang, W.; Ma, T.; Shu, C. A comparison of random forest and support vector machine approaches to predict coal spontaneous combustion in gob. Fuel 2019, 239, 297–311. [Google Scholar] [CrossRef]
  96. Akinci, H.A.; Akincl, H. Machine learning based forest fire susceptibility assessment of Manavgat district (Antalya), Turkey. Earth Sci. Inform. 2023, 16, 397–414. [Google Scholar] [CrossRef]
  97. Jiang, X.; Xu, C. Deep Learning and Machine Learning with Grid Search to Predict Later Occurrence of Breast Cancer Metastasis Using Clinical Data. J. Clin. Med. 2022, 11, 5772. [Google Scholar] [CrossRef] [PubMed]
  98. Mehra, L.K.; Cowger, C.; Gross, K.; Ojiambo, P.S. Predicting pre-planting risk of Stagonospora nodorum blotch in winter wheat using machine learning models. Front. Plant Sci. 2016, 7, 390. [Google Scholar] [CrossRef] [PubMed]
  99. Amaya-Tejera, N.; Gamarra, M.; Vélez, J.I.; Zurek, E. A distance-based kernel for classification via Support Vector Machines. Front. Artif. Intell. 2024, 7, 1287875. [Google Scholar] [CrossRef] [PubMed]
  100. Arifin, B.; Wicaksono, E.; Tenrini, R.H.; Wardhana, I.W.; Setiawan, H.; Damayanty, S.A.; Solikin, A.; Suhendra, M.; Saputra, A.H.; Ariutama, G.A.; et al. Village fund, village-owned-enterprises, and employment: Evidence from Indonesia. J. Rural. Stud. 2020, 79, 382–394. [Google Scholar] [CrossRef]
  101. Ernawati, E.; Tajuddin, T.; Nur, S. Does government expenditure affect regional inclusive growth? An experience of implementing village fund policy in Indonesia. Economies 2021, 9, 164. [Google Scholar] [CrossRef]
  102. Lewis, B.D. Decentralising to Villages in Indonesia: Money (and Other) Mistakes. Public Adm. Dev. 2015, 35, 347–359. [Google Scholar] [CrossRef]
  103. Hilmawan, R.; Aprianti, Y.; Vo, D.T.H.; Yudaruddin, R.; Bintoro, R.F.A.; Fitrianto, Y.; Wahyuningsih, N. Rural Development from Village Funds, Village-Owned Enterprises, and Village Original Income. J. Open Innov. Technol. Mark. Complex. 2023, 9, 100159. [Google Scholar] [CrossRef]
  104. Husna, C.H.; Bursa, B.; Anik, S.; Arifah, D.A. Accountability Disclosure for Village Fund Management in Villages with Very Disadvantaged Status in North Aceh Regency. In The AI Revolution: Driving Business Innovation and Research: Volume 1; Awwad, B., Ed.; Springer Nature: Cham, Switzerland, 2024; pp. 641–652. [Google Scholar] [CrossRef]
  105. Udjianto, D.; Hakim, A.; Domai, T.; Suryadi, S.; Hayat, H. Community Development and Economic Welfare through the Village Fund Policy. J. Asian Financ. Econ. Bus. 2021, 8, 563–572. [Google Scholar]
  106. Anam, C.; Plaček, M.; Valentinov, V.; Del Campo, C. Village funds and poverty reduction in Indonesia: New policy insight. Discov. Glob. Soc. 2023, 1, 14. [Google Scholar] [CrossRef]
  107. Antlöv, H. Village Government and Rural Development in Indonesia: The New Democratic Framework. Bull. Indones. Econ. Stud. 2003, 39, 193–214. [Google Scholar] [CrossRef]
  108. Lal, V.C.; Sharma, V.R. Geotourism in Kachchh, Gujarat: Unveiling Benefits and Empowering Local Communities. In Sustainable Strategies for Managing Geoheritage in a Dynamic World; Kanga, S., Kumar, S., Singh, S.K., Eds.; Springer Nature: Singapore, 2025; pp. 311–322. [Google Scholar] [CrossRef]
  109. Lee, Y.J.; Jayakumar, R. Economic impact of UNESCO Global Geoparks on local communities: Comparative analysis of three UNESCO Global Geoparks in Asia. Int. J. Geoheritage Parks 2021, 9, 189–198. [Google Scholar] [CrossRef]
  110. Farsani, N.T.; Coelho, C.; Costa, C. Geotourism and geoparks as novel strategies for socio-economic development in rural areas. Int. J. Tour. Res. 2011, 13, 68–81. [Google Scholar] [CrossRef]
  111. Cahyadi, H.S.; Newsome, D. The post COVID-19 tourism dilemma for geoparks in Indonesia. Int. J. Geoheritage Parks 2021, 9, 199–211. [Google Scholar] [CrossRef]
  112. Liang, T.K.; Lian, J.C.K. The Impact of the COVID-19 Pandemic on the Life Cycle of Tourist Destinations from Tour Operators and Hoteliers’ Perspectives. Glob. Bus. Financ. Rev. 2024, 29, 179–190. [Google Scholar] [CrossRef]
  113. Gemar, G.; Soler, I.P.; Moniche, L. Exploring the impacts of local development initiatives on tourism: A case study analysis. Heliyon 2023, 9, e19924. [Google Scholar] [CrossRef] [PubMed]
  114. Lin, Y.; Liu, Y.; Ouyang, Z.; Meng, C.; Xiao, Y. Mechanisms and influencing factors of cultural ecosystem services value realization. Environ. Sustain. Indic. 2025, 26, 100584. [Google Scholar] [CrossRef]
  115. Rasoolimanesh, S.M.; Seyfi, S.; Hall, C.M.; Hatamifar, P. Understanding memorable tourism experiences and behavioural intentions of heritage tourists. J. Destin. Mark. Manag. 2021, 21, 100621. [Google Scholar] [CrossRef]
  116. Sorin, F.; Einarsson, S. Circular Economy in Travel and Tourism. 2020. Available online: https://circulareconomy.europa.eu/platform/sites/default/files/circular-economy-in-travel-and-tourism.pdf (accessed on 23 May 2025).
  117. Alamineh, G.A.; Hussein, J.W.; Endaweke, Y.; Taddesse, B. The local communities’ perceptions on the social impact of tourism and its implication for sustainable development in Amhara regional state. Heliyon 2023, 9, e17088. [Google Scholar] [CrossRef] [PubMed]
  118. Nugroho, P.S.; Purwani, O.; Winarto, Y.; Triratma, B.; Setyaningsih, W. Connectivity and integration analysis of karst tourism objects in Wonogiri with Space Syntax Method. IOP Conf. Ser. Earth Environ. Sci. 2023, 1180, 012036. [Google Scholar] [CrossRef]
  119. Sulistiyowati, E.; Setiadi Haryono, E. Karst and Conservation Research in Indonesia and Its Implication to Education. J. Phys. Conf. Ser. IOP Conf. Ser. Earth Environ. Sci. 2021, 1796, 012071. [Google Scholar] [CrossRef]
  120. Alzubaidi, L.; Zhang, J.; Humaidi, A.J.; Al-Dujaili, A.; Duan, Y.; Al-Shamma, O.; Santamaría, J.; Fadhel, M.A.; Al-Amidie, M.; Farhan, L. Review of deep learning: Concepts, CNN architectures, challenges, applications, future directions. J. Big Data 2021, 8, 53. [Google Scholar] [CrossRef] [PubMed]
  121. Davila Delgado, J.M.; Oyedele, L. Deep learning with small datasets: Using autoencoders to address limited datasets in construction management. Appl. Soft Comput. 2021, 112, 107836. [Google Scholar] [CrossRef]
  122. John, M.M.; Olsson, H.H.; Bosch, J. Developing ML/DL Models: A Design Framework. In Proceedings of the International Conference on Software and System Processes, Seoul, Republic of Korea, 26–28 June 2020; Association for Computing Machinery: New York, NY, USA, 2020; pp. 1–10. [Google Scholar] [CrossRef]
  123. Chowdhury, A.A.; Das, A.; Hoque, K.K.S.; Karmaker, D. A Comparative Study of Hyperparameter Optimization Techniques for Deep Learning. In Proceedings of International Joint Conference on Advances in Computational Intelligence; Uddin, M.S., Jamwal, P.K., Bansal, J.C., Eds.; Springer Nature: Singapore, 2022; pp. 509–521. [Google Scholar]
  124. Decastro-García, N.; Muñoz Castañeda, Á.L.; Escudero García, D.; Carriegos, M.V. Effect of the Sampling of a Dataset in the Hyperparameter Optimization Phase over the Efficiency of a Machine Learning Algorithm. Complexity 2019, 2019, 6278908. [Google Scholar] [CrossRef]
  125. Liao, L.; Li, H.; Shang, W.; Ma, L. An Empirical Study of the Impact of Hyperparameter Tuning and Model Optimization on the Performance Properties of Deep Neural Networks. ACM Trans. Softw. Eng. Methodol. 2022, 31, 53. [Google Scholar] [CrossRef]
  126. Prabhu, H.; Ravishankar, C.M.; Ganesan, A.; Pandya, M.; Bhosale, H.; Dhadwal, R.; Parlikkad, N.R.; Siarry, P.; Valadi, J.K. Enhancing random forest model prediction of gas holdup in internal draft airlift loop contactors with genetic algorithms tuning and interpretability. Sci. Rep. 2025, 15, 9325. [Google Scholar] [CrossRef] [PubMed]
  127. Tuba, E.; Bačanin, N.; Strumberger, I.; Tuba, M. Convolutional Neural Networks Hyperparameters Tuning. In Artificial Intelligence: Theory and Applications; Pap, E., Ed.; Springer International Publishing: Cham, Switzerland, 2021; pp. 65–84. [Google Scholar] [CrossRef]
  128. Ayed, N.; Bougatef, K. Performance Assessment of Logistic Regression (LR), Artificial Neural Network (ANN), Fuzzy Inference System (FIS) and Adaptive Neuro-Fuzzy System (ANFIS) in Predicting Default Probability: The Case of a Tunisian Islamic Bank. Comput. Econ. 2024, 64, 1803–1835. [Google Scholar] [CrossRef]
  129. Khan, H.A.; Ghorbani, S.; Shabani, E.; Band, S.S. Enhancement of Neural Networks Model’s Predictions of Currencies Exchange Rates by Phase Space Reconstruction and Harris Hawks’ Optimization. Comput. Econ. 2024, 63, 835–860. [Google Scholar] [CrossRef]
  130. Yoon, J. Forecasting of Real GDP Growth Using Machine Learning Models: Gradient Boosting and Random Forest Approach. Comput. Econ. 2021, 57, 247–265. [Google Scholar] [CrossRef]
  131. Jallow, H.; Mwangi, R.W.; Gibba, A.; Imboga, H. Transfer learning for predicting of gross domestic product growth based on remittance inflows using RNN-LSTM hybrid model: A case study of The Gambia. Front. Artif. Intell. 2025, 8, 1510341. [Google Scholar] [CrossRef] [PubMed]
Figure 1. Study area.
Sustainability 17 06707 g001
Figure 2. Flowchart of data processing.
Sustainability 17 06707 g002
Figure 3. Spatial distribution of dependent and independent variables by village for ML-DL model development.
Sustainability 17 06707 g003
Figure 4. Correlation heatmap (top) and regression (below) of all variables for ML-DL model development.
Sustainability 17 06707 g004aSustainability 17 06707 g004b
Figure 5. R-squared and RMSE of several ML-DL models: (A) Rsquared value from hyperparameter tuning, (B) Best Value of R-squared, (C) Best Value of RMSE.
Sustainability 17 06707 g005
Figure 6. Result plot of neural network model.
Sustainability 17 06707 g006
Figure 7. Patterns of R-squared vs. RMSE in several models.
Sustainability 17 06707 g007
Figure 8. R-squared and RMSE from hyperparameter tuning in several models.
Sustainability 17 06707 g008
Figure 9. Variable importance for the independent variable in the model development.
Sustainability 17 06707 g009aSustainability 17 06707 g009b
Figure 10. Three-dimensional result of hyperparameter tuning performance for SVM-polynomial.
Sustainability 17 06707 g010
Figure 11. Tourism hotspots: (1) Indonesia Karst Museum, (2) Sembukan Beach Geosite, (3) Klothok Beach Tourism, (4) Tabuhan Cave Geosite, (5) Watukarung Geosite, and (6) Maron River.
Sustainability 17 06707 g011
Figure 12. Economic variable class for VDI.
Sustainability 17 06707 g012
Table 1. Main data sources.
DataUnitSourcesLink
Gunung Sewu UNESCO Global Geopark boundaries ShapefileUNESCO Global Geoparkhttps://www.unesco.org/geoparks (accessed on 23 May 2025),
geoparkgunungsewu.com (accessed on 23 May 2025)
Village Development IndexScoringMinistry of Villageshttps://kemendesa.go.id (accessed on 23 May 2025)
Street stream meterIndonesia Geospatial Agency (BIG)https://tanahair.indonesia.go.id (accessed on 23 May 2025)
HotelmeterGoogle Earth Pro (GE)https://earth.google.com (accessed on 23 May 2025)
Cave tourism sitemeterGoogle Earth Pro (GE)https://earth.google.com (accessed on 23 May 2025)
GeositemeterGunung Sewu UNESCO Global Geopark Agencygeoparkgunungsewu.com (accessed on 23 May 2025)
Beach tourism sitemeterGoogle Earth Pro (GE)https://earth.google.com (accessed on 23 May 2025)
City center pointmeterGoogle Earth Pro (GE)https://earth.google.com (accessed on 23 May 2025)
Air quality index (AQI)ppmSentinel-5P NRTI https://dataspace.copernicus.eu (accessed on 23 May 2025)
Tourism society group (POKDARWIS)Number by villageTourism Agency of Regency Governments (Gunung Kidul, Wonogiri, and Pacitan)-
Public perceptionscorringSocial sampling data in field-
Village tax revenue IDR (Rp)Regency governmentRegulation of the Regent of Gunung Kidul No. 32 of 2023, and No. 4, 13, 17, and 18 of 2024; Regulation of the Regent of Wonogiri No. 91 of 2023; Decree of the Regent of Pacitan No. 100.3.3.2/ 911/ KPTS/ 408.12/ 2024, and Decree of the Regent of Pacitan No. 100.3.3.2/ 673/ KPTS/ 408.12/ 2024.
Village retribution revenueIDR (Rp)Regency government
Village fundIDR (Rp)Ministry of Financehttps://kemenkeu.go.id
Table 2. Key question for public perception collection.
Public Perception VariableProxyScore by
Village
Score by
Respondents
Ecology Landscape, environmental condition, land use change, biodiversity, geological site, mining in geological area, and tourism 1.96 ± 0.632.07 ± 1.35
GovernanceGeopark governance effectiveness, geopark management, stakeholder coordination, and international partnership2.56 ± 0.922.65 ± 1.00
SocialSocial response and awareness, education activity for geopark, cultural impact, and social conflict.2.55 ± 0.662.21 ± 1.14
EconomyEconomic response and increase, social livelihood, and tourism activity potential2.70 ± 0.922.62 ± 1.12
EducationInformation technology, research activity, local culture, social facility, education, and research facility2.27 ± 0.822.04 ± 1.11
Table 3. Characteristics of linear and ML-DL models used.
AlgorithmModel functionHyperparametersCross-ValidationReference
Linear“lm”--
CART“rpart”
“rpart2”
Method
Complexity parameter (cp)
Methods = cv
number= 20
repeats= 5
Therneau et al., 2025 [64]
RF“rf”
“ranger”
“Rborist”
MethodBreiman et al., 2022 [65]
ntree
SVM“svmLinear”
“svmPoly”
Cost
Gamma
Kernel
Karatzoglou et al., 2004 [66]
ANN“neuralnet”Learning rate
Hidden units (size)
Weight decay (decay)
Batch size
Ripley & Venables, 2025 [67]
Disclaimer/Publisher’s Note: The statements, opinions and data contained in all publications are solely those of the individual author(s) and contributor(s) and not of MDPI and/or the editor(s). MDPI and/or the editor(s) disclaim responsibility for any injury to people or property resulting from any ideas, methods, instructions or products referred to in the content.

